iinndduussttrriiaall rreellaattiioonnss aanndd ... · iinndduussttrriiaall rreellaattiioonnss...
TRANSCRIPT

IIInnnddduuussstttrrriiiaaalll RRReeelllaaatttiiiooonnnsss AAAnnnddd PPPrrroooddduuuccctttiiivvviiitttyyy IIInnn AAAuuussstttrrraaallliiiaaa
KKKeeeiiittthhh HHHaaannncccoooccckkk TTTrrraaacccyyy BBBaaaiii JJJoooaaannnnnneee FFFlllaaavvveeelll AAAnnnnnnaaa LLLaaannneee 222999 JJJuuunnneee 222000000777

CONTENTS
1. A SURVEY OF AUSTRALIAN PRODUCTIVITY ...................................................................................... 1
1.1 THE CONCEPT OF PRODUCTIVITY ................................................................................................................... 1 1.2 THE AUSTRALIAN PRODUCTIVITY RECORD ................................................................................................... 1 1.3 LONG-TERM TREND......................................................................................................................................... 2 1.4 QUALITY-ADJUSTED HOURS ........................................................................................................................... 3 1.5 FLUCTUATIONS AROUND TREND..................................................................................................................... 4 1.6 EMPLOYMENT AND PRODUCTIVITY ................................................................................................................ 5 1.7 THE PRODUCTIVITY ‘SURGE’ OF THE 1990S .................................................................................................. 8
2. THE INDUSTRIAL RELATIONS CONTRIBUTION TO PRODUCTIVITY ........................................ 9
2.1 HOW MIGHT INDUSTRIAL RELATIONS AFFECT PRODUCTIVITY? .................................................................. 9 2.2 THE POWER OF TRADE UNIONS .................................................................................................................... 11 2.3 CHANGES IN INDUSTRIAL RELATIONS ARRANGEMENTS ............................................................................ 12 2.4 PRODUCTIVITY MOVEMENTS AND INDUSTRIAL RELATIONS EVENTS......................................................... 14 2.5 INTERPRETING THE ‘SURGE’ ......................................................................................................................... 14 2.6 PRODUCTIVITY SINCE THE LATE NINETIES................................................................................................... 18 2.7 AUSTRALIAN WORKPLACE AGREEMENTS.................................................................................................... 22
3. STATE PRODUCTIVITY ............................................................................................................................... 25
4. INTERNATIONAL COMPARISONS........................................................................................................... 28
4.1 EXPLAINING THE DIFFERENCES IN COUNTRY PERFORMANCE..................................................................... 28 4.2 THE ‘LESSON’ FROM NEW ZEALAND ........................................................................................................... 30
5. CONCLUSIONS................................................................................................................................................ 33
REFERENCES........................................................................................................................................................... 35
FIGURES Figure 1: Market Sector Productivity ...........................................................................................2 Figure 2: Productivity Levels Relative to Trend, 1964-65 to 2000-06
.............................................................................................................................................4 Figure 2A: Productivity Levels Relative to Trend 1964-65 to 2005-06 (3-year moving
averages) ...........................................................................................................................5 Figure 3: Labour Productivity and Hours Worked 1964-65 to 2005-06 (% deviations
from trend)........................................................................................................................7 Figure 4: Labour Productivity (% deviations from trend) and % Changes in Hours
Worked 1964-65 to 2005-06............................................................................................7 Figure 5: Trade Union Membership, Proportion of Employees 1915-2005........................11 Figure 6: Industry Contributions to Accelerated Productivity Growth (1988-89 to 1993-
94 compared with 1993-94 to 1999-2000)..................................................................17 Figure 7: New Zealand Productivity Relative to Australian Productivity 1991-2005 .....32

In this report to the Chifley Research Centre, we seek to identify and to discuss major issues that arise in establishing the relation between Australia’s industrial relations practices and policies, on the one hand, and its productivity performance, on the other. This is a matter of controversy. Much of the report is an exploration of what can and cannot be said about the linkage. It is necessary, for this purpose, to describe the major facts about productivity growth and to take note of other possible causes of them. We draw heavily on the existing literature.
Productivity is, of course, just one aspect of economic performance. It has an important bearing on community well-being, but there are other factors to be taken into account, including the terms of trade with the rest of the world, employment and unemployment, conditions of work, the distribution of income and the depletion of natural resources. These are outside the scope of this report, except where they have an arguable bearing on productivity. We do not attempt to deal with labour market policy at large. For example, we do not discuss government measures to encourage training and labour mobility.
1
1. A Survey of Australian Productivity
1.1 The Concept of Productivity Productivity is the ratio of production to inputs. Production is measured by value, corrected for differences in price by use of appropriate price indices. There are alternative measures of inputs. For labour productivity, the input is simply hours of work. For multifactor productivity, an estimate is made of capital used, and labour and capital inputs are then combined. Each of the two measures has its use. Increases in the product associated with an hour’s labour are clearly an important determinant – though not the only one - of a society’s capacity to provide a rising standard of living. On the other hand, to measure the effectiveness of the society’s use of its resources, resources other than labour must be taken into account. Multifactor productivity does this inasmuch as it recognises the changing quantities of capital with which labour works.
Productivity rises over time. One reason why labour productivity increases is growth in the stock of capital. Multifactor productivity neutralises this effect. But there are other reasons why both labour and multifactor productivity tend to increase. Foremost among them is technical progress – the application of new and improved techniques derived from the advance of knowledge. Other possible causes include: improved management; increases in the skills of the workforce; changes in the composition of production, with resources being shifted from lower-productivity to higher-productivity uses; the achievement of scale economies as production expands; and more productive industrial relations. This list is not exhaustive.1
The measurement issues in multifactor productivity are more serious than those of labour productivity. They relate to both the measurement of capital inputs and the combination of labour and capital. In this report, however, we do not discuss these problems, but assume the reliability of the official statistics.
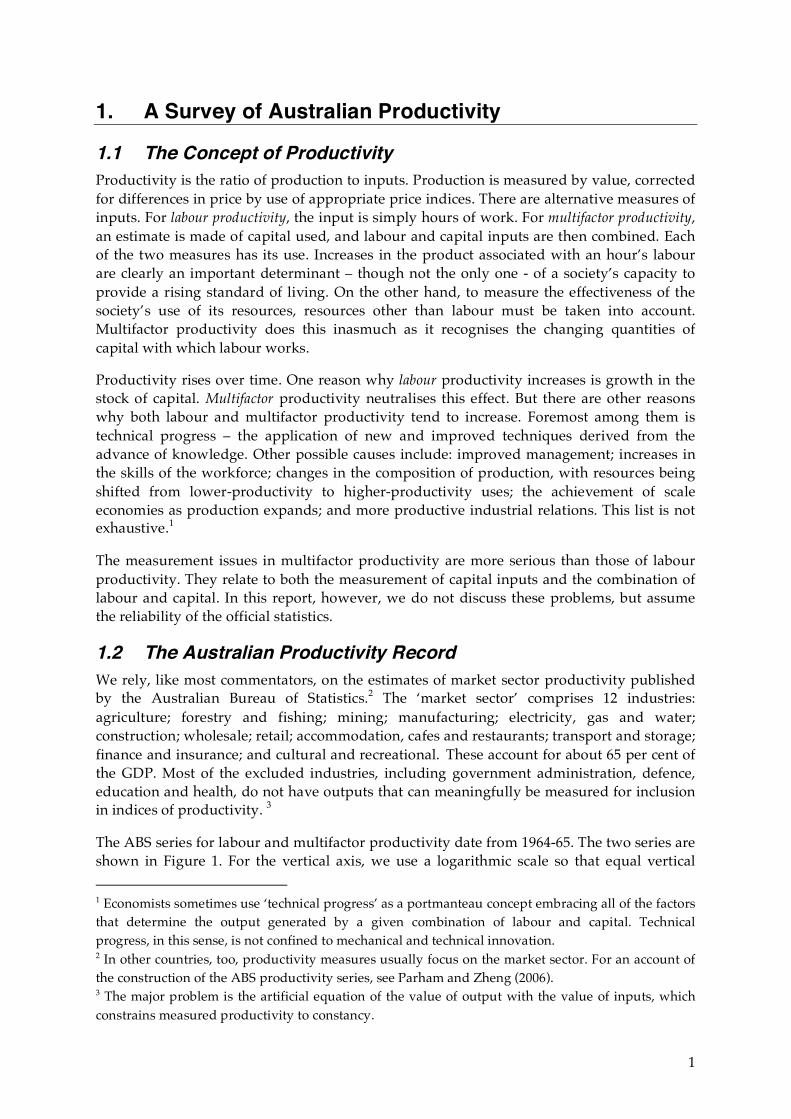
1.2 The Australian Productivity Record We rely, like most commentators, on the estimates of market sector productivity published by the Australian Bureau of Statistics.2 The ‘market sector’ comprises 12 industries: agriculture; forestry and fishing; mining; manufacturing; electricity, gas and water; construction; wholesale; retail; accommodation, cafes and restaurants; transport and storage; finance and insurance; and cultural and recreational. These account for about 65 per cent of the GDP. Most of the excluded industries, including government administration, defence, education and health, do not have outputs that can meaningfully be measured for inclusion in indices of productivity. 3
The ABS series for labour and multifactor productivity date from 1964-65. The two series are shown in Figure 1. For the vertical axis, we use a logarithmic scale so that equal vertical 1 Economists sometimes use ‘technical progress’ as a portmanteau concept embracing all of the factors that determine the output generated by a given combination of labour and capital. Technical progress, in this sense, is not confined to mechanical and technical innovation. 2 In other countries, too, productivity measures usually focus on the market sector. For an account of the construction of the ABS productivity series, see Parham and Zheng (2006). 3 The major problem is the artificial equation of the value of output with the value of inputs, which constrains measured productivity to constancy.

2
distances correspond to equal proportional changes. For example, a 10 per cent increase occupies the same vertical distance whatever the starting level.
Figure 1: Market Sector Productivity
40
50
60
70
80
90
100
Pro
ducti
vit
y index (
20
04
-05
= 1
00
)
1965 1970 1975 1980 1985 1990 1995 2000 2005Year ended 30 June
Labour productivity Multifactor productivity
Labour productivity trend Multifactor productivity trend
Source: ABS 2006, Australian System of National Accounts, 2005-06, Cat. No. 5204.0, Table 22
1.3 Long-term Trend Associated with each series in Figure 1 is a trend line representing the long-term growth rate: 2.25 per cent per year for labour productivity and 1.25 per cent for multifactor productivity. The trends obviously dominate the series. If we were simply to replace the ‘raw’ series with the trend lines, we should be 97 per cent correct for multifactor productivity and 99 per cent right for labour productivity.4
Trend, a statistical artefact, requires interpretation. It implies that there are long-term forces, such as increasing capital intensity of production and technical progress, on which short-term influences, whatever they may be, are superimposed. The difference between the trend growth rates of labour and multi-factor productivity – about one percentage point - reflects one such influence: the growth in the amount of capital per worker. Indeed, it measures the contribution of increased capital to the growth in labour productivity. Clearly, this is a trend factor. It is plain, too, that technical progress exerts a continuous productivity-enhancing effect. Such long-term influences as the growth in the capital stock and technical progress may not be captured exactly by the measured trends. Nevertheless, the separation of trend and other movements is a convenient approach to the understanding of productivity change.
4 The percentages represent the squared correlation coefficients.
3
The trends shown in Figure 1 are log-linear. That is, they entail constant proportional growth rates. This is an arbitrary constraint. Should we have computed some different trend series? There are various ways of smoothing the original data to produce curves whose slopes vary over time. The pitfall in this strategy, useful though it may be for some purposes, is the risk that the ‘trend’ merely smooths the series. This is true, for example, of simple moving averages. There are other non-linear trends that might be fitted, all equally arbitrary. We have, in fact fitted several non-linear curves, but we prefer not to select one of these and to treat the deviations from the linear trends as facts to be explained.5 Substitution of one of the non-linear variants would not much affect the time-pattern of the deviations from trend.
1.4 Quality-adjusted Hours In the basic productivity series, the input of labour is measured by the number of hours worked. This measure implicitly treats hours of labour as homogeneous. Highly skilled labour, for example, is equated to unskilled labour. The quality of labour has risen over time, as the proportion of the work force holding qualifications has grown. (For a fuller discussion, see Jim Hancock and Wing Hsieh 2006) The ABS has recently begun the publication of experimental productivity series, based on ‘quality-adjusted hours of work’. The assumption is made that relative wages are an index of the qualities of different kinds of labour and hence may be used to weight the labour inputs. If the quality composition of hours worked changes, this affects the proportional rise or fall in the measured input of labour.
Because the quality of labour has been rising, quality adjusted hours have risen faster than unadjusted hours. The converse of this is that productivity per quality adjusted hour has risen less than productivity per unadjusted hour. The trend annual rates of increase for the period from 1983-84 (when the quality-adjusted series begin) to 2005-06 are:
Labour Productivity Multifactor Productivity
Unadjusted hours 2.30% 1.38%
Adjusted hours 1.92% 1.16%
The implication of these numbers is that the rising quality of labour has contributed annually about 0.4 percentage points to (unadjusted) labour productivity and about 0.2 points to (unadjusted) multifactor productivity.
Because the quality adjusted series are experimental and are available only for years since 1983-84, and because other commentators have used the basic series, we propose to rely on the latter. Whether the quality adjusted series should, in principle, be the preferred measure is debatable, but it is unnecessary to pursue the question here.
5 The alternative trends were calculated by polynomial equations to the second, third and fourth powers.

4
1.5 Fluctuations around Trend We rely on the deviations from trend in discussing short and medium term influences on productivity. Figure 2, which is based on the same data as Figure 1, shows the annual productivity levels as percentage deviations (plus and minus) from the trend. Their annual volatility, reflecting temporary (such as seasonal) influences, may be disconcerting. Accordingly, in Figure 2A, we convert the annual data to three-year moving averages, noting that these forfeit a degree of precision in identifying the timing of change.
The time patterns of the labour and multifactor series are similar. The low values at the left side of the graphs and the rapid increase in productivity in the late sixties are related to drought and recovery.6 Productivity increased, relative to trend, from about 1972 until about 1978. There followed a long decline in the series, lasting until about 1991, with an interruption in the mid-eighties. In the early 1990s, until about 1994-95, productivity was on a below-trend plateau. A sharp increase over the next four years or thereabouts gave way to an above-trend plateau, also continuing for about four years. From 2003-04 to 2005-06, productivity fell relative to trend. (The most recent data for labour productivity, not incorporated in the chart, suggest that there will be some recovery in 2006-07.)
Figure 2: Productivity Levels Relative to Trend, 1964-65 to 2000-06
Source: Derived from ABS 2006, Australian System of National Accounts, 2005-06, Cat. No. 5204.0, Table 22
6 We thank Paul Roberts, of the ABS, for explaining this to us.

5
Figure 2A: Productivity Levels Relative to Trend 1964-65 to 2005-06 (3-year moving averages)
Source: Derived from ABS 2006, Australian System of National Accounts, 2005-06, Cat. No. 5204.0, Table 22
Discussions of the productivity effects of industrial relations have tended to focus on the upturn in productivity that occurred in the mid 1990s, continuing for about four years, and the relative stagnation that has followed. We deal with these episodes in sub-sections 2.5 and 2.6 below. A fuller perspective, however, would include both the productivity surge of the early 1970s and the subsequent deterioration. To our knowledge, no one has proposed industrial relations-related explanations for these earlier phases, except for a suggestion (discussed below) that the Accord depressed productivity.7 The Accord apart, the institutions and processes of industrial relations were essentially the same in the years before and those after 1978; and the Accord did not take effect until 1983. That the fluctuations of these earlier years were so much greater than those of the years since 1995 is a cautionary reminder of the danger of attributing too much to industrial relations.
1.6 Employment and Productivity In the previous sub-section we noted the theory that an industrial relations factor, namely the Accord, was a cause of the fall in productivity (relative to trend) that characterised the later 1980s. The suggested connection was the rise in employment attributed to wage restraint.
It has been argued more generally that when interpreting the productivity series, employment behaviour should be taken into account. (See, for example, Parham and Roberts 2004 and Perry 2006.) There are two reasons why there might be an inverse short-term relation between the levels of productivity and employment. One is that an increase in 7 Peetz (2006) has commented on the fact that in some periods of ‘traditional’ industrial relations, productivity growth has been as good as or superior to that under less ‘regulated’ arrangements. See sub-section 2.7 below.

6
employment decreases the ratio of capital to labour. This will tend to reduce labour (but not necessarily multifactor) productivity. The other reason is a likelihood that the average quality of the employed labour force varies with the level of employment: high employment, with more abundant job opportunities, causes employers to hire and retain less-preferred workers, who are also the people who lose their jobs if the demand for labour falls.
In a recent report, the OECD (2007) has related productivity growth in various countries to the rates of increase of employment in those countries, and has found a negative correlation. That is, more rapid employment growth is associated with lesser productivity growth. It can be seen that the relation tested by the OECD is a variant of the above argument, which implies that a movement from one level of employment to another will be associated (all else equal) with an opposite movement in the level of productivity. Hence more rapid employment growth tends to depress the rate of increase of productivity. In the OECD’s words, ‘a policy reform that increased employment would have a less-than-proportionate impact on GDP per capita because of its dampening effect on average measured labour productivity…’ (p. 60). The OECD’s explanations for the negative correlation include the two mentioned above. It also suggests that a growth in the labour supply will be associated with a relative expansion of labour-intensive, low productivity industries.
It is also argued that there is an inverse relation between the rate of change of employment and the level of productivity. The reasoning here is that employers have some reluctance to increase or to reduce their workforces because of costs of hiring and firing. If there is a downturn in business activity, they may ‘hoard’ labour in anticipation of recovery; and in an upturn, they tend to delay the engagement of extra workers until they are satisfied of the ongoing need for it. Hence productivity will be higher than otherwise while employment is growing and lower when it is falling. This effect should be more pronounced with respect to the number of people employed than for hours worked, but probably not to the exclusion of the latter.
These seem reasonable hypotheses. But are they borne out by the data? In Figure 3, we plot the annual levels of labour productivity against the number of hours worked in the market sector (both variables measured as deviations from trend). 8 Figure 3 indicates no significant correlation, inverse or otherwise.9 Thus the negative relation found by the OECD’s cross-country analysis is not apparent in the time-related data for Australia alone. Figure 4 is relevant to the hypothesis that productivity is inversely related to changes in employment because of employer reluctance to hire and fire. Once again, the data lend the idea little support.10 We acknowledge that this is a simple analysis of the employment-productivity relation. There is scope for the formulation and testing of more complex models.
8 We should point out that hours worked are a component of the calculation of productivity. Hence any error in the measurement of hours will also affect the measurement of productivity, and this can lead to a spurious correlation. In this case, the error effect would entail an apparent but spurious inverse correlation between productivity and hours. If an inverse correlation were suggested by the data, this caution would have to be borne in mind. 9 The squared correlation coefficient is 0.038. 10 The squared correlation coefficient is 0.088.

7
Figure 3: Labour Productivity and Hours Worked 1964-65 to 2005-06 (% deviations from trend)
Source: Derived from ABS 2006, Australian System of National Accounts, 2005-06, Cat. No. 5204.0, Table 22
Figure 4: Labour Productivity (% deviations from trend) and % Changes in Hours Worked 1964-65 to 2005-06
Source: Derived from ABS 2006, Australian System of National Accounts, 2005-06, Cat. No. 5204.0, Table 22

8
Was there something special about the employment-productivity relation in the period of the Accord? In the seven years from 1983-84 to 1989-90, taken as a whole, the average deviations from trend for both hours worked and labour productivity were zero. On that evidence, the suggestion that the Accord ‘traded off’ higher employment for lower productivity is not supported. Nor does the evidence lend much support to the change-in-employment effect. Employment grew rapidly over the six years, but productivity (on average) did not rise above trend.
There have been suggestions that the productivity slow-down of recent years (discussed more fully in sub-section 2.6) is attributable to a high rate of growth in employment. The following is a comparison of the periods 1993-94 to 1999-2000 and 1999-2000 to 2005-06:
Annual growth rates of
Labour productivity Hours worked
1993-94 to 1999-2000 2.73% 1.68%
1999-2000 to 2005-06 1.43% 0.75%
Thus the growth in employment (measured in hours worked) was actually slower in the period of the productivity slow-down than in the previous period. The claim that the productivity slow-down was due to rapid employment growth is untenable.
1.7 The Productivity ‘Surge’ of the 1990s Figures 2 and 2A show an increase in productivity, relative to trend, between 1994-95 and 1998-99. The moving average data of Figure 2A suggest a ‘jump’ of about four percentage points.
It is of some importance whether this is seen as a one-off ‘step up’ to higher productivity levels (rising thereafter at the trend rate of growth) or the beginning of a permanently higher rate of productivity growth. Inspection of Figures 2 and 2A strongly suggests the former. That is, the surge was an event of the later 1990s and is now behind us. Even if another jump were to occur in the near future – and there is little sign of it - it would be too distant from the surge of the nineties to be regarded as a continuation of it.
We return to this subject in sub-section 2.6

9
2. The Industrial Relations Contribution to Productivity
2.1 How Might Industrial Relations Affect Productivity? The idea that industrial relations affect productivity derives from a supposition that they influence the behaviour of owners, managers and workers. They may do so because they affect the ability of management to manage; because they affect the levels of antagonism and cooperation in the workplace; and because the terms on which labour is employed influence the investment and innovation decisions of business. Some of the main assertions are these:
• Traditional industrial relations arrangements, relying heavily on awards, militated against experimentation and adaptation in the deployment of labour within enterprises. They also encouraged an ‘us and them’ mentality, discouraging workers from working to their capacity and from cooperating with management in its efforts to improve the enterprise’s performance.
• Trade unions adversely affect productivity by entrenching restrictive labour practices and intensifying ‘them and us’ attitudes. They may force firms to adopt inefficient personnel hiring and firing practices, and curb the pace of work, the hours of work and skill formation (Doucouliagos and Laroche 2003, citing McKersie and Klein 1983; Magnani and Prentice 2006).
• On the contrary, unions have a favourable effect. They assist the resolution of workplace issues that might otherwise cause productivity-diminishing behaviour. Freeman (1976) and Freeman and Medoff (1984) argued that unions can raise productivity by providing workers with a means of expressing discontent as an alternative to ‘exiting’, by opening up communication channels between workers and management, and by inducing managers to alter methods of production and to adopt more efficient policies.
• Productivity growth requires the cooperation and participation of the workers. These will only be forthcoming where employment relationships are characterised by trust and where workers feel that they have ‘a secure stake in the long-run success of their employer’ (Buchele and Christiansen 1999, p. 326). Cooperation is fostered by the existence of robust worker rights, secured by strong labour market institutions, such as highly coordinated sectoral bargaining and wage settlements that automatically extend to the non-union sector.
• Collective agreements, especially if negotiated at the enterprise or workplace level, give workers a greater sense of commitment to the wellbeing of the enterprise and permit the exchange of extra benefits to workers for productivity-enhancing changes in work practices.
• Productivity is enhanced if management is allowed to manage, with a minimum of external interference. To this end, management must be allowed to deal with workers on an individual basis, free from the interference of ‘unwanted third parties’ (unions and arbitrators). If managers deal directly with workers, they will get the best out of them.
• On the contrary, externally imposed employment standards serve as a spur, inducing employers to raise productivity and profits by technical innovation,
10
establishing better relations with their employees, training their staff and in other ways improving managerial practice. The ‘high road’ of good wages and conditions is a more likely route to high and rising productivity than the ‘low road’ of directive management and cost-cutting.
These are ‘arm-chair’ assertions, which are difficult to verify or refute. Because they conflict, we are left without unambiguous predictions as to the effects of industrial relations situations and arrangements. 11 Moreover, the various cause-and-effect relationships that are suggested may operate simultaneously and, to an unknown degree, cancel each other. Hence it may prove to be as difficult to identify empirically the impacts of industrial relations as it is to specify them theoretically.
Webster and Loundes (2002) studied empirically the factors affecting employer-union and employer-employee cooperation in larger Australian businesses, noting that more cooperative relations were often considered to be conducive to higher productivity. Their statistical results included a finding that lower union densities – fewer union members relative to total staff - were associated with more cooperative relations between employers and employees. They noted, however, a possible reverse causality – that employees in firms where relations with management were good might be less likely to belong to unions. Further, their analysis threw no direct light on the relation between workplace cooperation and productivity.
The question whether external interference with businesses’ management of labour adversely affected performance was long debated in Australia. Arbitration was, at its inception and for some decades thereafter, opposed by business interests as a diminution of management’s capacity to manage. Supporters of the system, on the other hand, contended that taking wages and conditions ‘out of competition’ caused businesses to be more zealous in pursuing other means of improving their competitiveness. It is fair to say that this was an unresolved debate.
From the 1960s onward, a different debate occurred, namely, whether better results (which might include higher productivity) would come from collective bargaining. By the late 1980s, there was significant support for collective bargaining at the enterprise level. This gained momentum from both a desire of unions to be freed from some of the restraints of the Accord and an endeavour by employer interests (especially the Business Council of Australia) to reduce the role of arbitration (Hancock 1999). Employer groups, workplace managers), the union movement and governments (federal and state) of both political persuasions all endorsed the enterprise concept (Wooden, 2000). They claimed that enterprise bargaining would stimulate greater levels of productivity, facilitating increased real wages and causing, eventually, increased employment (Wooden 2001). Enterprise-level collective bargaining received legislative support in the early 1990s.
This was a temporary consensus. By the mid-1990s, significant support existed for an alternative model, wherein the ‘collective’ component of enterprise bargaining would be much diminished. (See sub-section 2.3 below)
11 With respect to the effect of unions, the theoretical ambiguity is stressed by Tzannatos and Aidt (2006).

11
2.2 The Power of Trade Unions An underlying feature of the industrial relations system in recent decades has been a fall in trade union membership relative to the number of workers (commonly termed ‘union density’). This is evident from Figure 5, derived from the Commonwealth Year Book. Union density peaked in the early 1960s, but was only slightly lower a decade later. Since the early 1980s, however, the decline has been drastic and near-continuous.12 Union membership has also fallen in numerous other countries. Various explanations, not necessarily exclusive, have been proposed. They include a growth in employer resistance to unionism, illustrated by the disappearance of closed and union shops; changes in the composition of jobs, with employment in traditional ‘union’ industries and occupations decreasing as a share of the total; a growth in casual and part-time employment, which are less conducive to unionism than standard full-time work; changes in the law that have made the task of unions in recruiting and retaining members more difficult; and increasingly individualist attitudes among workers. (Peetz 1998)
Figure 5: Trade Union Membership, Proportion of Employees 1915-2005
Source: ABS 2007, Year Book, Australia, Catalogue No. 1301.0, Graph 6.60
It is likely that the fall in membership is linked with a reduction of trade union power, though the correlation is imperfect. Can any effects of the long-term decline in the strength of unions be discerned in the productivity data? We noted earlier ‘arm-chair’ speculations pointing in opposite directions. The long-term trends of labour and multifactor productivity do not appear to have altered much in the period of union decline. It is also difficult to link changes in union power and the deviations of productivity from trend, as shown in Figures 2 and 2A. This, of course, does not mean that there has been no effect: it may simply have been obscured by other influences.
12 The 2006 figures, not included in Figure 5, show a further decline.
12
2.3 Changes in Industrial Relations Arrangements 13 In the 1960s and the 1970s, the Australian industrial relations system was characterised by strong unionism and arbitral tribunals (federal and state) which prescribed minimum wages and conditions. The principal tribunal was the Australian Conciliation and Arbitration Commission, whose major decisions were broadly followed by the state tribunals. Unions frequently bargained with employers for wages and conditions superior to those prescribed by the tribunals. This bargaining led, from time to time, to inflationary rates of increase of wages. The Commission was then forced to balance the need for wage restraint against the necessity for it to make decisions that were industrially realistic.
The events of 1978-83, involving wage break-outs, the abandonment of wage indexation in 1981 and the Fraser Government’s attempt in 1982 to re-establish wage restraint, leave no room for doubt about the power then exercised by trade unions. The Hawke Government came to office in March 1983, facing a severe problem of ‘stagflation’ – simultaneous unacceptable levels of inflation and unemployment. Fundamental to its strategy for dealing with this problem was the Accord, which was an attempt to reconcile trade union power with economic policies, especially wage policy, conducive to lower unemployment and lesser inflation. (Edwards 2006) The Commission had a major role in this strategy.14
The initial Accord-related wage policy developments were essentially a return to wage indexation, reinforced by no-extra-claims commitments by trade unions. Such commitments were required as a condition of award wage increases. Macro-economic developments, especially a deterioration in the balance of payments and the terms of trade, led in the later 1980s to changes in wage policy (broadly consistent with modifications to the Accord) to encourage cost reduction at the industry and enterprise levels. The National Wage Case decision of March 1987 introduced the ‘Restructuring and Efficiency’ principle, whereby a component of the available award wage increase was made contingent upon agreements by employers and unions to cost-reducing measures approved by the Commission. In 1988, the Commission introduced a ‘Structural Efficiency’ principle and in 1989 this was given more concrete form in terms of relating wage increases to efficiency enhancement.
In the 1990-91 National Wage Case, most of the parties advocated the adoption of an enterprise bargaining principle. Their specific proposals varied, but in essence the Australian Industrial Relations Commission (AIRC) 15 was asked to approve union-led collective bargaining at the enterprise level, where wage increases would be negotiated in return for higher productivity.16 The AIRC, in April 1991, refused these requests; but in the 13 There are numerous accounts of the changes in industrial relations arrangements over the past two decades. A summary is given in ABS 2007, Labour Statistics: Concepts, Sources and Methods, Cat. No. 6102.0.55.001, Chapter 13.
14 A Committee of Review of Industrial Relations Law and Systems was appointed in 1983 to assess the need, if any, for changes in the structure of the institutional framework of industrial relations. The Committee reported in 1985. It recommended continuation of the basic framework of conciliation and arbitration, but with various changes. Many, but not all, of the Committee’s recommendations were adopted in the Industrial Relations Act 1988.
15 Under the Industrial Relations Act 1988, the AIRC replaced the Australian Conciliation and Arbitration Commission. 16 The ACTU proposed that wage increases could also be justified by increased profits.

13
following October it relented. The Government, however, did not leave this matter to the Commission’s discretion. An amending Act passed in 1992 removed the Commission’s capacity and obligation to apply a public interest test to enterprise level collective agreements. The Industrial Relations Reform Act of 1993 (coming into force in March 1994) went further. It established a framework for the conduct of bargaining, including the transformation of award wages and conditions into a ‘safety net’. Safety net awards would protect workers not covered by collective agreements, but would also ‘underpin’ the bargaining process. Collective bargaining at the enterprise level became the preferred institutional mechanism for fixing pay and conditions, with arbitration in a supplementary role. The 1993 Act, possibly in response to declining union membership, created a mechanism for enterprise-level collective bargaining in which unions need not be involved.
The change of Government in March 1996 led to further alterations in federal law. (In some of the States, earlier legislation reflected the directions in which the ideas of the non-Labor parties had been moving.) The terms of the Workplace Relations Act 1996 reflected compromises necessitated by the Government’s lack of a majority in the Senate. Nevertheless, the Act made significant changes. The directions of change most relevant to this report were:
• Various provisions restricted the bargaining activities of unions and their capacity to represent their members.
• The Act, for the first time in federal law, provided for statutory individual employment contracts, known as Australian Workplace Agreements (AWAs). These portended an enhancement of employer power. Subject to a no-disadvantage test, employers could make take-it-or-leave-it offers of employment to new employees on terms of their own devising and, in doing so, could depart from award conditions. Although the potential shift in the balance of power at the workplace was large, the uptake of AWAs was slow. (We discuss this further in sub-section 2.7 below.)
• The powers of the AIRC, which had been curtailed by the 1992 and 1993 legislation, were further reduced, principally by confining its awards to ‘allowable matters’. These changes, however, did not greatly reduce the Commission’s capacity to prescribe ‘safety net’ wages and conditions. Some of the non-allowable matters related to award provisions affecting unions, such as preference in employment.
The underlying philosophy of the Act was a preference for determining pay and conditions at the workplace level, without union involvement.
It would be a mistake, however, to expect the effects of the 1996 law on the overall state of industrial relations to be immediately and dramatically apparent. First, the Act was rendered less drastic by the concessions required to secure its passage. Secondly, as with AWAs, it took employers time to make use of the added power conferred on them. Thirdly, the impact on trade unions was superimposed on the longer-term decline in their representational capacity and bargaining strength, and it is difficult to identify the additional effect of the changes in the law.
Insufficient time has elapsed since the 2006 WorkChoices law was passed for any effects on productivity to be discernible. The law confers more discretionary power on management and leaves less scope for collective representation and arbitration than earlier legislation. It

14
shifts the balance of industrial power significantly in favour of the employer. It may, therefore, be a test of the efficacy of the ‘low road’ to productivity growth.
2.4 Productivity Movements and Industrial Relations Events Referring back to the earlier discussion of the productivity data, we now make the following comments:
• The rising trends of productivity shown in Figure 1 probably have little or no basis in industrial relations. Convincing explanations for the trends are bound to focus on the increasing physical capital stock, technical progress and the enhancement of human capital by education.
• We know of no industrial relations stories that would explain the pre-1980s deviations from trend evident in Figures 2 and 2A. Ideally, we should like to identify other stories that could explain them. We have already mentioned one – the impact of the drought in the late 1960s. Otherwise, however, we would need to undertake research that is not practicable for this report.
• In section 1.6 we discussed the contention that the Accord-related policies ‘traded’ lower productivity for higher employment. We found little evidence to support it.
Peetz (2005; 2006) discusses how labour productivity has grown over various productivity ‘cycles’ since 1964-65, relating them to the institutional arrangements that applied at the respective times, as well as to the level of union density. He concludes that ‘current rates of productivity growth under the Workplace Relations Act are, if anything, inferior to the rates that were achieved under the traditional award system in the 1960s and 1970’ (Peetz 2005, p.7). From an inspection of Figures 2 and 2A, we can see how such an impression could arise. We should hesitate, however, to draw any firm conclusion about the effects of different policy regimes without an analysis of the causes of productivity movements in the different periods; and a convincing analysis may, for various reasons (including data problems), be elusive.
The next substantial movement in productivity that arguably fits an industrial relations story is the ‘surge’ between 1994-95 and 1998-99.
2.5 Interpreting the ‘Surge’ In the 1990s, proponents of enterprise bargaining certainly argued that it would enhance productivity (Hancock 1999, Wooden 2001). The premise was that it would accentuate, to mutual advantage, the commonality of interest between enterprises and their employees, facilitating the acceptance of productivity-enhancing change. The rise in productivity, relative to trend, between 1994-95 and 1998-99 is consistent with the prediction. Wooden (2001) analysed the available data on the coverage of workers by collective agreements, showing that it increased from a very small number in 1991 to close to half of employees by 1999. The timing of the surge fits quite well with this growth in collective agreement-making. But a credible explanation for the surge must be consistent with its relatively short life. It may be that wage-fixing principles and enterprise bargaining removed restrictive work practices, which could only be removed once, and that productivity growth then reverted to trend. We return to the short time span of the surge in the next sub-section.
15
There is a broader reason why attributing the surge to enterprise bargaining is problematic. Mere coincidence of timing is weak evidence of causation. Other possible sources of higher productivity include trade liberalisation, competition policy, research and development, education and training, computerisation and improved infrastructure (Parham 2004). Unless the contribution of industrial relations change can be separated from influences such as these, assertions as to its importance have to be viewed with some scepticism. It would be very difficult, if not impossible, to devise a testable model to determine, at the aggregate level, the specific effects of the parallel influences.
We refer now to some of the studies that discuss the possible impact of industrial relations ‘reform’ on productivity. Most recognise the difference between a one-off shift in productivity and an enduring increase in the rate of growth. None, however, reflects a full recognition of the possible implications of the end of the surge for an understanding of its causes. To some extent, of course, this can be regarded as a matter of timing – the short life of the surge may not have been fully apparent when the studies were undertaken.
Tseng and Wooden (2001) attempted to measure the effects on productivity of different workplace arrangements by analysing data derived from the ABS Business Longitudinal Survey. These data referred to a four-year period beginning in 1994-95. Businesses were asked to provide information about themselves, covering a range of subjects. In an econometric analysis, the dependent variable is the enterprise’s value of production. Among the independent variables are the number of employees and estimates of the amounts of capital deployed, with dummy variables representing the kinds of working arrangements in the enterprises. The implicit question (so far as enterprise bargaining is concerned) is: are firms that are subject to enterprise bargaining agreements more productive than firms which do not participate in enterprise bargaining but are alike in other respects? The answer is ‘yes’. Tseng and Wooden find, for example, that ‘businesses where all employees are covered by registered agreements are 8.8 per cent more productive, all other things equal, than businesses where no such agreements are in operation’ (p. 28).
This is consistent with enterprise bargaining causing higher productivity; but, as Tseng and Wooden themselves emphasise, it does not establish the causal connection. The data do not allow a before-and-after comparison. Hence it is possible that the high-productivity enterprises had high productivity before signing up to enterprise agreements. Moreover, it is possible that any causal relation ran in the reverse direction. For example, ‘progressive’ management – such as would achieve high productivity – may also have been disposed to enter into enterprise agreements. There may also be some problems in the use of value of production in the measurement of productivity at the firm level. 17 For these reasons, Tseng and Wooden’s study leaves the impact of enterprise bargaining in doubt.
Wooden (2000 and 2002) discussed some of the ‘rival’ causes of productivity growth. He pointed, for example, to observations by Gruen and Stevens (2000) that the greatest accelerations in productivity growth had not occurred in industries most affected by competition policy; rather, they had been greatest in the highly labour intensive industries – wholesale and retail trade, and construction. But the difficulty of separating the different
17 Firms that have any control over their prices can raise their value of production by raising prices as well as by increasing output. And firms having product market power may be more likely than others to accommodate union demands for enterprise agreements. Tseng and Wooden are well aware of the issue of market power; but the only ‘control’ that they are able to include is one allowing for foreign competition.
16
influences on productivity stood in the way of a firm conclusion about the effect of enterprise bargaining:
… there are good reasons to be cautious about defending the bold claims often made about the impact that enterprise bargaining and industrial relations reform is having on productivity. In large part, however, this is a result of the difficulty of disentangling the impact of industrial relations reforms from other possible influences on productivity. There is certainly no strong evidence that strongly refutes the existence of a connection between reform and improvement in productive performance. (Wooden 2002, p. 2)
Loundes, Tseng and Wooden (2003) focus specifically on the question ‘Enterprise Bargaining and Productivity in Australia: What Do We Know?’. Referring to the upturn in productivity growth from 1994-95 on, they find the timing ‘suggestive of an association between enterprise bargaining and productivity’, but ‘far from conclusive’ (p.249).
The strongest advocates for the contention that the surge was the product of policy – specifically ‘microeconomic reform’ – have been economists working in the Productivity Commission. It is not too strong, indeed, to refer to a Productivity Commission view (without implying that the Commission has formally adopted it). The two main elements of this view are (1) the reality of the surge and (2) the attribution of it to microeconomic reform. Labour market reform is a component of microeconomic reform, but its specific effects are not identified.
Parham (2004) exemplifies the Productivity Commission view. While recognising the complexity of the causation issue, Parham argued that policy factors were central18 to the understanding of the accelerated productivity growth. He explored a range of factors that seemed likely to have raised the productivity growth rate, including greater openness to the rest of the world, competitive pressures generally, a stable macroeconomic environment, R&D expenditures and a more efficient capital market. As to industrial relations, he wrote:
Labour markets have become more flexible, particularly with greater focus on enterprise bargaining. … There is a range of evidence that flexibility in labour markets has allowed work and organisational arrangements to be restructured and labour to be reallocated, and has facilitated the productive use of technology. (p. 252)
Parham did not, however, quantify the contributions of labour market flexibility and enterprise bargaining to accelerated productivity growth.
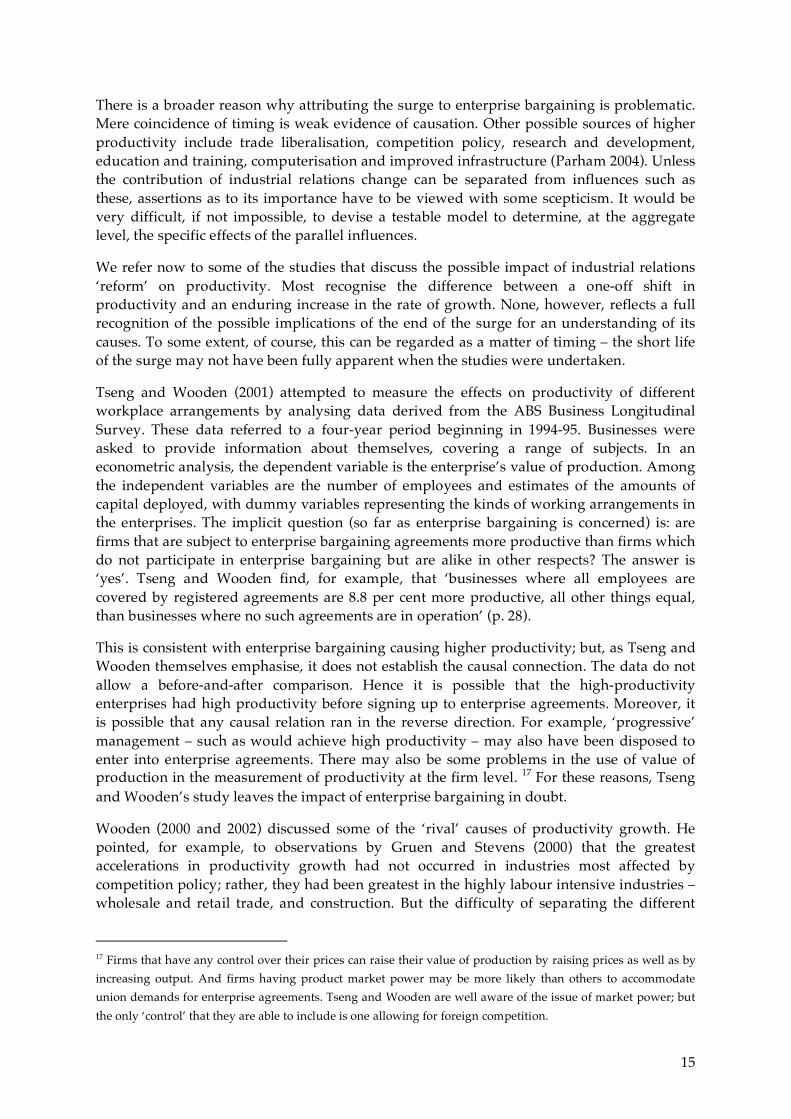
Researchers in the Productivity Commission constructed industry-level productivity indices. Using these, they compared the years from 1988-89 to 1993-94 with those from 1993-94 to 1999-2000 to find the contributions of different industries to the acceleration of multifactor productivity growth. Gary Banks, the Chairman of the Productivity Commission, described the findings (Banks 2002). Figure 6 reproduces a chart from his paper. This compares the rate of growth of productivity in 1988-89 to 1993-94 (represented by the bar at the left end) with the growth rate in 1993-94 to 1999-2000 (right end). Moving from left to right, we have first the industries which added to the growth rates, and then those that subtracted from it;
18 In this, he agreed with The Sources of Economic Growth in OECD Countries (OECD 2003), which sought to explain why some OECD countries had performed better than others in the 1990s.
17
the length of the bars measures the contributions of the respective industries to the overall increase.
Figure 6: Industry Contributions to Accelerated Productivity Growth (1988-89 to 1993-94 compared with 1993-94 to 1999-2000)
Source: Banks (2002), Figure 5. Reproduced by kind permission of the Acting Chairman of the Productivity
Commission.
The increase in wholesale trade accounts for nearly all of the total increase in the growth rate. In four industry sectors (manufacturing; electricity, gas and water; cultural and recreational services; and agriculture), productivity growth rates fell. These negative contributions were roughly matched by increases in: construction; finance and insurance; transport and storage; accommodation, cafes and restaurants; and retail trade. A question suggested by this analysis is whether general explanations of productivity performance, such as ‘microeconomic reform’, are as relevant as explanations that go to the circumstances of the various industries. The two are not necessarily mutually exclusive; but an account that treats microeconomic reform as the ‘driver’ needs to show why the surge was concentrated so heavily in wholesale trade - a concentration which seems to be at odds with an emphasis on industrial relations or microeconomic reform more generally – and why in four industries productivity growth fell below the rates achieved in the previous period. 19 Investigation of what happened in wholesale trade would be a separate research project, but a starting point for the inquiry might well be the displacement of labour-intensive methods of work by greater use of information and communications technology.
19 Banks, however, was convinced of the key role of labour reform.

18
We return to the Productivity Commission view in the next sub-section. The dissection of the surge made by Commission staff seems, however, to sit uneasily with their emphasis on microeconomic reform.
Farmakis-Gamboni and Prentice (2006) try to identify specifically the productivity effects of the Workplace Relations Act 1996. Their argument turns on a presumption that the Act weakened trade unions. Comparison of ‘union’ and ‘non-union’ firms might therefore show that the new law had differential effects on the two sets of firms. For example, if the activities of unions have a negative effect on productivity, then a reduction in their power might cause an acceleration of productivity growth in unionised, relative to non-unionised, firms. This hypothesis has a similar implication to the argument that enterprise bargaining caused the surge: both imply that productivity would have risen faster in unionised firms. The reasons, however, are different. In the one model, unionised firms advance because unionism is conducive to enterprise bargaining; in the other, because unions are weakened by the new legislation. Farmakis-Gamboni and Prentice report:
While we find unionised firms tend to have higher total factor productivity, we find relatively rapid growth in unionised firm productivity growth following the introduction of the WRA – consistent with trade union power having previously reduced productivity. This increase though is not statistically significantly different from zero. (Quotation from the abstract)
It is difficult to see any effect of the 1996 law in the aggregate productivity data. Perhaps there were effects that are difficult to detect. A comparison of firms, such as that undertaken by Farmakis-Gamboni and Prentice, is one way in which to ‘look behind’ the aggregate data. There are, however, problems that are difficult to surmount. The differentiation between ‘unionised’ and ‘non-unionised’ firms is a crude measure of union power. And the Act was likely to affect industrial relations gradually, making it difficult to define a date for a before-and-after comparison. For these reasons, and because of the lack of statistical significance reported by Farmakis-Gamboni and Prentice, we think that the productivity effects of the 1996 Act, if any, remain obscure.
2.6 Productivity since the Late Nineties The surge that began around 1994-95 can now be seen to have finished near the end of the decade. This is significant for three reasons. First, it has a bearing on expectations of future performance. Whatever factor or factors caused the surge, they do not now seem to have raised the long-term rates of productivity growth. Secondly, inasmuch as industrial relations changes contributed to the surge, their effect seems to have been one-off, consistent with the speculation that enterprise bargaining enabled enterprises to rid themselves of restrictive labour practices but did not fundamentally alter their cultures. Thirdly, the reversion (at best) to trend is important for the evaluation of the ‘reforms’ introduced by the Workplace Relations Act 1996. If there were a positive effect on the rate of productivity growth, it might have been expected to emerge after two or three years and to extend for some time thereafter. On the face of the numbers, this does not seem to have happened.
When the fall in the productivity growth rate became evident, early in the present decade, one reaction was to suggest that there had been shocks whose effects would pass, and that rates of growth akin to those of the late 1990s would resume. Thus Banks said:
19
The 1990s surge peaked in 1999-00. There was a downturn in 2000-01, as the economy (output growth) slowed and hours worked declined slightly, but the measured capital input continued to rise at its earlier pace. This downturn in productivity is more likely to be short-lived than indicative of a marked slowing in underlying trend … (Banks 2002, p. 3)
Banks’s optimism was founded on a conviction that the sources of high productivity growth in the 1990s remained potent, and a hope that industries that had ‘stagnated’ in the 1990s might well achieve greater rates of productivity growth.
Parham (2005) wrote:
There are grounds to conclude that productivity growth has slipped off its record highs of the 1990s. But there are also grounds to conclude that productivity growth over the 1998-99 to 2003-04 period would still have been above the long-term historical average, had it not been for some atypical, short-term shocks. The very weak results in 1999-2000 and 2000-01 did not have a compensating ‘spike’ that usually follows a MFP downturn. Estimates for more recent years show tentative signs of a return to stronger productivity growth (and would have been firmer had it not been for drought). Furthermore, there is no obvious evidence of a reversal in factors that were considered to underlie the productivity surge in the 1990s; or of an exhaustion of catch-up and ICT-based innovation opportunities. (p. 265)
Parham pointed to shocks that might have stalled productivity growth in 2000-01: concern before 2000 about the Y2K bug; the introduction of the GST; and the Sydney Olympics. In 2002-03, drought had taken 0.9 percentage points off multifactor productivity growth. Parham examined the performances of various industries. The fall in the productivity growth rate in mining was ‘part of a pattern of long-term ebb and flow as the industry goes through phases of investment in exploration and development, on the one hand, and tapping known reserves, on the other’. (p. 263)
Both Banks’s and Parham’s expectations of a return to higher growth rates were founded, in part, on the perception that the causes of the surge were still at work. These causes included microeconomic reform, including labour market reforms. This reasoning seems to assume what has to be proved: that the microeconomic reforms were the drivers of the surge. From a logical standpoint, the fall in the productivity growth rate might seem to call into question either the assumption that they were the drivers or the assumption that they remained effective.
Dolman, Lu and Rahman (2005), of the Commonwealth Treasury, were more inclined to see the reduced rates of productivity growth as a return to normality, arguing that ‘the recent rends at least partly reflect an easing of growth rates towards their historical averages after the unusual productivity surge of the late 1990s’. They wrote:
Some factors that might have affected recent productivity trends include: fluctuations in step with the business cycle; international technological changes; changes in investment in physical and human capital; the movement of labour across industries; and a set of supply-side shocks affecting a large proportion of the economy. Each of these factors are analysed in separate sections. It appears that none of these factors by themselves can explain the observed trend. Rather, productivity growth eased by different rates in different industries for different reasons. (p. 35)

20
These authors pointed out that in the late 1990s the movement of labour from high-productivity to low productivity industries tended to depress productivity. For example, mining and the utilities (high productivity industries) shed labour, while construction and hospitality (low productivity) gained it. In the more recent period, there was strong growth in hours in mining and the utilities. Thus the downturn in the productivity growth rate had occurred despite a favourable shift in labour mobility.
Dolman, Lu and Rahman found that of the 12 market sector ‘industries’, eight had recorded a slow-down in productivity growth and four an increase. The largest negative effect came from wholesale trade (subtracting 0.37 percentage points from the overall growth rate) and the largest positive contribution from manufacturing (adding 0.37 points). Productivity slowed by different rates in different industries for different reasons. After examining specifically the changed productivity growth in wholesale trade, construction and utilities, Dolman, Lu and Rahman suggested that the surge may have been a process whose duration was inherently limited:
There are always some industries affected over the medium term by supply shocks. It could be the case that in the late 1990s a number of industries were subject to some positive shocks — such as microeconomic reforms or the introduction of ICT-related innovations — and that the subsequent productivity slowdown reflects the unwinding effects of those shocks on productivity growth rates. (p. 50)
We referred in the previous sub-section to the Productivity Commission research, reported by Banks (2002), which showed that the surge of the 1990s was unevenly spread across industries. We raised the question whether the disparate performances of the different industries told against explanations for the surge which might have been expected to have general effects. Dolman, Lu and Rahman’s finding likewise calls into question the applicability of generalised explanations for the rates of productivity growth within particular time periods. It may be that deviations from long-term trend in productivity growth usually owe much to the special circumstances of particular industries.
In November 2005, Quiggin and Parham engaged in a (written) debate about the interpretation of the productivity statistics.20 This referred to both the surge (whose reality Quiggin questioned) and the subsequent slow-down. Quiggin noted that the ABS had identified the period from 1998-99 to 2003-04 as a productivity ‘cycle’. Multifactor productivity in those years grew at an average rate of 1.0 per cent – below the average of 1.2 per cent for the entire period since 1964-65. He added:
For the entire period since 1993-94, when the productivity surge supposedly began, the average rate of productivity growth has been 1.2 per cent, the same as the entire period since 1965. The ‘productivity surge’ of the mid-1990s was, at best, a temporary blip.
Quiggin also disputed the claim that the productivity growth of the past decade was due to microeconomic reform, arguing that microeconomic reform was ‘well under way’ in the period from 1984-85 to 1993-94, when productivity growth was low.
20 An article by Quiggin was published in the Australian Financial Review on 10 November. Parham replied in a letter to the editor. Quiggin on 14 November commented on his ‘blog’ site. Parham wrote an article that was published in The Australian on 17 November.
21
Parham wrote:
The ABS estimates reveal that, during the productivity cycle between 1993-94 and 1988-89, Australia’s annual rate of productivity growth was about half a percentage point above any other rate recorded and was nearly one percentage point above the long-term average. Clearly that was a dramatic rise.
A second issue is whether the higher productivity growth has disappeared. The ABS estimates put the average rate of growth between the productivity peaks in 1998-99 and 2003-04 at just below the average for the past four decades. This indeed indicates that growth is down from the 1990s highs.
But some further digging into the data provides grounds to believe that the momentum in productivity growth did not disappear entirely. The key point is that there were some once-only factors at work – the Olympics, the GST, concerns about the Y2K bug – that dragged down the average for the cycle. While not a never-to-be-repeated factor, drought also reduced the average.
Australia’s underlying productivity growth in the 2000s has come off the exceptional highs of the 1990s. However, if the effects of the one-off factors (if not drought) are discounted, average productivity growth during the latest cycle would still have been above the long-term average. 21
Parham reaffirmed the role of microeconomic reform in productivity growth. He asked: ‘Does [Quiggin] really believe that a more open, competitive, flexible and innovative micro-economy has not encouraged and enabled businesses to be more productive and has not assisted macro policy settings in ensuring a more stable macro-economy? And where is the empirical testing that micro-economic reform is not a primary source of productivity growth?’ Quiggin responded to the latter question: ‘It’s always hard to prove a negative, but it’s particularly hard when there is no extra productivity growth to explain.’ There does seem to be an implication in Parham’s question that those who dispute the primacy of microeconomic reform bear an onus to prove their case. Such an implication is embedded in the Productivity Commission view. To those who approach the subject without preconceptions, the notion of onus is misconceived.
In our judgment, the Quiggin-Parham debate does not disturb six contentions that have been themes of this report:
• There was an above-trend gain in productivity, totalling about four percentage points, between about 1994-95 and 1998-99.
• This came to an end by the turn of the decade.
• The timing of the surge is consistent with a one-off reduction in the wasteful use of labour brought about by enterprise bargaining.
• There are, however, many possible explanations for the surge.
21 Quiggin disputed the concept of ‘productivity cycles’. We agree with him. The concept, in our view, has no theoretical or empirical basis.
22
• The industrial disparities of changes in productivity growth cause doubt about the impact of general policy measures.
• It is impossible to specify the effects of changed arrangements in industrial relations.
2.7 Australian Workplace Agreements The Workplace Relations Act 1996 provided for statutory individual employment contracts as an alternative to the regulation of employment by collective agreements and awards. Did the advent of AWAs contribute to higher productivity? There have been strong claims (summarised by Peetz (2006)) that they did. Yet, the evidence of timing is not encouraging. Allowing for the time required for such an innovation to have significant impact, we should not expect the effects to become apparent for several years. It would appear, then, that the era of the AWA has been the post-surge period. To infer that AWAs caused the end of the surge would be far too simple. But if they had positive effects on productivity and productivity growth, the post-surge deterioration of productivity performance is all the more remarkable.
Peetz (2006) has made the most comprehensive study of the issue. His main conclusion is that AWAs have not contributed to productivity, though they may have contributed to profits. One part of his argument relates to timing, and involves the relation of productivity growth rates in different periods to the respective industrial relations regimes. On that basis, he finds that AWAs have not yielded productivity results superior to those of union collective bargaining or awards. We have discussed timing issues at length in this report and do not dwell on the matter here. Another part of Peetz’s argument entails a consideration of New Zealand’s experience under the Employment Contracts 1991. The New Zealand ‘lessons’ for Australia are discussed in the next section.
Peetz reviews the findings of several studies funded by the Business Council of Australia that were relevant to the issue of whether alternative enterprise-level industrial relations arrangements affect the firms’ productivity. In the late 1980s the BCA had established a study commission on industrial relations. This commissioned research, to which Peetz refers. We do not dwell on this, because it preceded by some years the introduction of AWAs. In another BCA study, Fry, Jarvis and Loundes (2002) surveyed 282 large companies, and found that collective bargaining coverage was associated with higher productivity as claimed by the firms themselves. Hull and Read (2001), in a study of ‘excellent’ workplaces, found that working arrangements (collective or individual) were not among the ‘key drivers’ for excellence. Peetz comments that the BCA in its Workplace Relations Action Plan, released in 2005, disregarded the evidence from studies that it had commissioned and instead represented the mining industry as a ‘case study’ in support of the benefits of individual agreements. (Many of the individual agreements in the mining industry had originally been made under state law in Western Australia, which has since been repealed.)
The BCA contended that high productivity growth in mining between 1994 and 2002 was evidence of the benefits of individual agreements. Peetz rejects this argument, on several grounds. One is that the productivity growth in coal mining, where unionism is strong and collective agreements prevail, equalled that of the rest of the industry. Secondly, the high productivity growth in the period considered by the BCA related to labour productivity, rather than multi-factor productivity. The stronger growth in labour productivity, says Peetz, reflected the replacement of workers by machines. Thirdly, Peetz accuses the BCA of selectivity in its choice of time period for describing mining productivity. In particular, it
23
ignored the most recent data. In the eight years to 2003-04, mining had the slowest productivity growth of all industries.
Peetz also criticises a report prepared by Access Economics (2005) as consultant to the BCA. In an analysis of productivity growth by industry covering the period 1994-2002, Access found a correlation between productivity growth and ‘flexibility’. But the measure of ‘flexibility’ was the proportion of workers covered by federal union agreements, federal non-union collective agreements and AWAs combined. Since the largest group was those covered by union collective agreements, this was no evidence of the efficacy of AWAs. Peetz finds no correlation between registered individual agreements and productivity growth over the eight years to 2003-04.
He concludes that none of the research produced by or on behalf of the BCA supports its contention that individual contracting leads to higher productivity.
The explanatory memorandum to the Workplace Relations Amendment (WorkChoices) Bill 2005 suggested that coverage by awards alone (to the exclusion of formal agreements) was negatively correlated with productivity growth. Peetz notes that award coverage was measured as at 2004, with productivity growth occurring between 1990 and 2004; and he comments that this implies causation running backwards. This criticism may be too strong: it is not unlikely that relative award coverage in 2004 was indicative of relative (though not absolute) coverage at earlier times. But Peetz points out that award coverage in 2000 was positively correlated with productivity growth between 1999-2000 and 2003-04; and that the change in award coverage and productivity growth were also positively correlated. The lesson would seem to be that this kind of analysis is sensitive to the choice of time periods. We have already seen that relative productivity growth in industries varies significantly between periods. This being so, and having regard to the uncertain lags that exist between causes and effects, we should view any conclusions with extreme caution.
Peetz argues that AWAs are part of a ‘low road’ approach to industrial relations, whereby employers are assisted to reduce labour costs. Such an approach is less conducive to productivity growth than a ‘high road’ approach, whereby employment terms that are more favourable to the workers serve as an inducement to innovation, training and skills development. According to Peetz, 86 per cent of workers under certified (collective) agreements are covered by agreements that provide for training, whereas only 34 per cent of AWAs have content related to training. This, however, may not be a telling comparison. Collective agreements need to provide for the variety of workers whom they cover, sometimes including apprentices: it is likely that the proportion of award-covered workers actually affected by the training provisions of the awards is much less than 86 per cent.
It has not been practicable to undertake for this report any independent research into the productivity effects of AWAs. Lack of data about their contents would be an impediment to such research. Peetz has exposed the tendentious character of the research that purports to establish a positive effect. There is little basis for asserting a negative one. Until recently, AWAs were too few and limited in industrial coverage to justify any expectation that their effects might be apparent in the aggregate productivity data. 22 Mining might seem to offer
22 In May 2006 3.1 per cent of employees were on registered individual agreements. (ABS cat. 6306) Apparently the uptake of AWAs accelerated with the inception of Workchoices. Evidence given by the Office of the Employment Advocate to the Senate Estimates Committee on 28 May 2007 was that about 8 per cent of the work force were then on AWAs.

24
scope for a case study.23 To be of relevance, such a study would need to be in much greater depth than any known to us. It may be possible for researchers, given time and resources, to analyse the relative performances of firms that make different levels of use of AWAs.
23 In May 2006, 16 per cent of the mining work force were covered by AWAs.
25
3. State Productivity The Australian states differ from each other in various ways, including population size and composition, natural resources, industrial structure and human capital. There have also been differences in their industrial relations, including the relative coverage of federal and state laws and the provisions of state law. There has, however, been little research into productivity differences at the state level. There are a set of six papers published in 2003 by the Queensland Treasury (Williams, Draca and Smith 2003) and a paper by (Jim) Hancock and Hsieh (2006), published by the South Australian Centre for Economic Studies. These studies use Gross State Product, rather than market sector production, as the measure of output. Although they explore the convergence and divergence of productivity as between states, none of them treats industrial relations factors as a likely explanation for divergent performance.
Louca (2003) found that between 1984-85 and 2000-01, when the national average growth rate of multifactor productivity was 1.2 per cent per year, Queensland recorded the highest rate (1.6 per cent per year), followed by Western Australia (1.3 per cent), New South Wales (1.2 per cent), South Australia (1.1 per cent), Victoria (1.0 per cent) and Tasmania (0.3 per cent). An econometric analysis of the differences suggested that growth in business R & D expenditures accounted for up to 75 per cent of MFP growth.
Nguyen, Smith and Meyer-Boehm (2003) found that between 1984-85 and 1998-99 the states generally had similar growth rates of labour productivity. Western Australia was an exception, recording a substantially higher growth rate of labour productivity. Nguyen et al. attributed Western Australia’s high labour productivity growth to the fact that the mining industry accounted for a relatively high share of the state’s employment. During the period in question, mining had a higher growth rate of labour productivity than other industries. If mining were excluded, Western Australia’s labour productivity growth rate (1.5 per cent per year) would have been slightly below the national average (1.6 per cent). The reason for the basic similarity of the states’ performances in labour productivity, according to Nguyen et al., was essentially a cancelling-out of differences: ‘… while a given state may enjoy an advantage from having an industrial structure more conducive to high growth, it may at the same time be disadvantaged by lower productivity growth rates compared with other states in a range of industries.’ (p. 64)
The literature contains some discussion of the role of human capital in explaining interstate productivity differences. Human capital is typically equated to educational attainment. We should note an obvious problem of separating cause and effect. A highly educated and skilled population may be conducive to high productivity and income; but a state with high productivity and income may attract highly qualified workers and have a population attuned to the benefits of education and acquisition of skill. Draca, Foster and Green (2003) found that New South Wales and Victoria had higher degree completion rates than other states, and that New South Wales and Western Australia had the highest year-12 completion rates. They judged that New South Wales had the highest human capital stock, with Victoria close behind and Western Australia ahead of the other states. Human capital, according to Draca, Foster and Green, explained most of the interstate differences in GSP per capita between New South Wales and Victoria and between New South Wales and Queensland.

26
The cause and effect problem must cause some uncertainty about this finding. Moreover, GSP per capita is not productivity, though the two are usually related.
Hancock and Hsieh (2006) were primarily concerned with the relative productivity performance of South Australia. Discussing human capital factors in that context, they attempted to incorporate labour quality into their quantitative analysis, in the manner of the ABS’s experiment with quality-adjusted hours (see subsection 1.4). They calculated that an increase in the average qualification level in South Australia between 1994-95 and 2003-04 raised labour quality by 2.4 per cent, but that this was partially offset by a negative effect of 1.2 per cent from changes in the age composition of the work force. Comparing South Australia and the rest of Australia, Hancock and Hsieh wrote:
While South Australian producers did shift to a more skilled labour input mix, the shift was less pronounced than was seen nationally. The explanation for this lies both in the qualifications and experience dimensions of the skill mix. The uptake of degree-qualified people in the South Australian employment mix has been growing more slowly than for the rest of Australia. Furthermore, there has been a relatively weak trend in the proportion of people of prime working age in the employment mix (p. 15).
We see again a problem as to the direction of causation. Is relatively low productivity in South Australia an effect of its having a less qualified and skilled labour force? Or does the industrial structure of South Australia inhibit the employment of qualified and skilled labour? Hancock and Hsieh tend to the latter view:
The likely explanation lies in economic opportunity: young people leave because there are better job opportunities interstate. It is important to recognize that this dynamic is probably productivity-enhancing. Those who leave South Australia will tend to be those who feel that their skills are underutilised, and also under-rewarded in South Australia. Retaining people in jobs where their skills are underutilised will tend to depress average productivity levels. Interstate migration, on the other hand, diminishes the extent of this and will tend to boost average productivity levels (p. 15).
The above discussion indicates, in a summary way, the kinds of issues that have arisen in interstate comparisons of productivity. There are, we think, no lessons to be learnt from the existing research about the consequences of industrial relations arrangements. This may be because the researchers have not pursued the question whether state productivity has responded to industrial relation factors. Such differences between state-level industrial relations as do exist might seem to constitute a ‘natural experiment’, but such an experiment is likely to be inconclusive, because the interstate differences in industrial relations arrangements are not large, and because there are other causes of difference in productivity that make it difficult or impossible to detect the specific role of industrial relations.
It may be suggested that the impact of mining on Western Australian productivity justifies an inference that deunionisation and individualised employment contracts are conducive to higher productivity. We have discussed this issue in sub-section 2.7. As we saw there, the productivity performance of mining is sensitive to the time period under consideration. Louca, in discussing the period from 1984-85 to 2000-01, notes a likely effect of high capital expenditure in mining. Not only does such expenditure raise labour productivity by providing more equipment for the average worker. It is also a means by which new

27
technology is introduced to the industry, raising its multifactor productivity. The likely role of capital formation in the productivity of mining compounds the difficulty of reading any industrial relations implication into the Western Australian experience.

28
4. International Comparisons Can any insight into the determinants of productivity, and especially the role of industrial relations, be derived from the experiences of different countries? Can comparisons with other countries help to resolve the uncertainties of Australia’s experience? In this section, we deal with these questions in two ways. One is to consider whether the comparison of countries points to general tendencies that may be suggestive for Australia. The other is to discuss the more specific comparison with New Zealand, which relies upon the differences in the policy regimes that have existed in the two countries since the early 1990s.
4.1 Explaining the Differences in Country Performance There is a large literature commenting on the differences between countries’ levels and rates of growth of productivity. Typically, the countries included in the comparisons are OECD countries – a fact that is explained by both the availability of data and the judgment that meaningful comparisons require the countries concerned to be similar in their levels of development. The European Commission has funded a project that analyses the productivity performances of EU countries (the EU KLEMS project, available at www.euklems.net/index.html).24 The motivation for this project appears to be a concern about the slow-down of productivity growth in Europe. In the 15 oldest member countries, labour productivity grew at an average rate of 2.4 per cent per year between 1970 and 1995, but between 1995 and 2004 the growth rate was 1.3 per cent. This was the reverse of the experience of the United States, where labour productivity growth accelerated from 1.3 per cent a year between 1970 and 1995 to 2.4 per cent between 1995 and 2004. 25 The higher rate in each case, 2.4 per cent, is close to Australia’s long-term average. In press commentary, there have been suggestions that Europe’s recent performance is due to its ‘inflexible’ or ‘ossified’ labour market, especially in comparison with the United States. To be convincing, these commentaries would need to show (as they do not) that there were relevant changes in the European or the United Sates labour market (or both); otherwise they do not reconcile Europe’s recent ‘inferiority’ with its earlier ‘superiority’.
Very little of the international literature (save for that relating to the comparison between Australia and new Zealand) throws any clear light on the determinants of Australia’s productivity performance, let alone the specific role of industrial relations. Recently, however, Christopher Kent and John Simon of the Reserve Bank of Australia (Kent and Simon 2007) have published a paper showing the results of a cross-country study that inquires into the productivity effects of labour market regulation and deregulation. 26 Kent and Simon provide the following comparison of performances:
During the late 1990s some countries experienced a productivity surge that many suggested was driven by information technology. Despite the attention it received, this productivity revolution was relatively limited in geographical scope. A small group of OECD countries (including Australia, Canada, Sweden and the US) experienced a sizeable step-up in their productivity growth in the 1990s. For these countries, average total factor productivity growth within the business sector rose by between 0.4 and 1.2 percentage points compared with the previous decade. However, at the same time, TFP growth rates declined across much of Europe. (p. 1)
24 The Economist of 19 May 2007, p. 79, contains an article commenting on the project’s findings. 25 In 2006, Europe’s output per hour grew faster than the United States’. 26 The paper includes a brief literature review.
29
Kent and Simon note that explanations of inter-country differences in productivity growth have often given much weight to the production and use of ICT. They nevertheless hypothesise that differences in the degree of regulation of the product and labour markets also have an important bearing on relative productivity performance. Part of the effect may be indirect: ‘those countries that did not invest heavily in ICT were hamstrung by rigid regulation of their labour and product markets’ (p. 3). But, in addition, ‘market flexibility (or efficiency) might accelerate TFP growth regardless of whether a country has invested heavily in ICT or not.’ Kent and Simon refer to papers whose authors argue that flexible labour and product markets aid the reorganisation of productive resources. Moreover, they suggest that there may be an interaction of product and labour market flexibility, so that the whole exceeds the sum of the parts.
Kent and Simon define a flexible labour market as ‘one in which there are relatively few obstacles to efficiently matching jobs with employees’. They define an efficient product market as ‘one in which price signals encourage movement of resources into profitable opportunities and out of unprofitable ones’. The definition of labour market flexibility would be a crude discriminator, at best, between industrial relations regimes. For example, ‘flexibility’ as defined bears little or no relation to the adoption of enterprise bargaining – the main industrial relations ‘candidate’ for explaining the surge of the 1990s; for it is difficult to see how this change in industrial relations arrangements would have removed ‘obstacles to efficiently matching jobs with employees’. We return to this issue in the context of Kent and Simon’s method of measuring labour market ‘flexibility’.
The authors test their hypotheses econometrically. Their initial data related to 18 OECD countries, including Australia. Two of the countries – the Netherlands and Japan – were found to be ‘outliers’ and were excluded from the reported estimations.27 (The outliers were adverse to the hypothesis that lesser regulation goes with higher productivity.) The estimates therefore apply to 16 countries. They also apply to three ten-year periods, ended in 1983, 1993 and 2003. Thus with 16 countries and 3 time periods, there are 48 observations. We do not report how all of the variables in the analysis were measured; but the preferred measure of labour market regulation was days lost in industrial disputes. That is, a country with more time lost (relative to the labour force) is more ‘regulated’ than one where less time is lost. Product market regulation is measured on a six-point scale that combines indicators of regulatory intervention.
The estimates do suggest that lesser ‘regulation’, in both product and labour markets, is conducive to greater productivity growth; and they do support the hypothesis of interaction between the two forms or regulation – the whole is greater than the sum of the parts.
This means that less time lost through industrial disputes is associated with better productivity performance. But what does this imply? Kent and Simon say that ‘the rationale for using working days lost per 1,000 employees as a measure of labour market regulation is that there is likely to be an indirect, though perhaps imprecise, link between this variable and labour market flexibility’ (p. 23). A defensible response is: ‘Why?’. The amount of time lost may simply be an index of the level of discontent, and it might not be surprising if this were inversely correlated with productivity. Again, it may be related to the composition of
27 The authors suggest that in the Netherlands wage restraint led to a large rise in employment, with adverse effects on productivity. This thesis matches the Accord story discussed in subsection 1.6.
30
the work force – industrial, occupational and skill – which might also affect productivity. The presumption that it measures ‘regulation’, in any normal sense of the word, is heroic.
Kent and Simon experiment with two other measures of labour market regulation. One is an OECD indicator of the strength of employment protection legislation. Such legislation undoubtedly is a form of ‘regulation’, but, as Kent and Simon remark, it is only one form and may run counter to others. In Australia, the surge of the 1990s occurred at a time when employment protection under federal and state law was at its peak. Thus Australia’s experience conflicts with the hypothesis. The other measure is union density. This seems to suffer from the same fault as time lost – it is not a measure of regulation. When Kent and Simon re-estimate their model, substituting the two alternative labour market measures in place of days lost, neither is statistically significant. ‘The results’, they say, ‘suggest that conclusions about the effects of product and labour market regulation on TFP growth are somewhat sensitive to the measure of labour market regulation included in the regression analysis’ (p. 25).
The results of one study are an insufficient basis for a firm conclusion about the ‘lessons’ of international comparison. Kent and Simon’s study, which we do not mean to denigrate, is nevertheless indicative of some of the hazards of this form of inquiry. We have commented mainly on the difficulty of finding adequate measures of labour market regulation; and the same problem arises with any attempt to construct measures of ‘industrial relations’. Another difficulty is the likelihood that the explanatory variables used are correlated with omitted variables. For example, both time lost and union densities have exhibited strong time trends. This gives rise to a concern that they may be ‘representing’ other variables that are also correlated with time. 28
4.2 The ‘Lesson’ from New Zealand New Zealand’s industrial relations system, for most of the 20th century, had strong similarities with Australia’s. Both countries had centralised industrial arbitration which regulated employment by orders and awards, and unions played major roles in both. In 1991, however, the New Zealand Parliament passed the Employment Contracts Act, which fundamentally altered the legal basis of industrial relations in that country. Perry (2006) summarises the changes:
In essence the ECA stripped unions of their right to exclusively represent employees in negotiations over wages and conditions. Anyone could represent an employee: a friend, a relative, solicitor or a union official. The earlier system of centrally determined award wages for innumerable categories of employment was completely jettisoned, as was the associated system of conciliation and arbitration. Pre-eminence was given to individual contracts between employers and employees. Multi-employer agreements and collective bargaining were severely curtailed. It became unlawful for unions to take collective action in an attempt to establish industry-wide or occupation-wide multi-employer agreements on wages and conditions. In short,
28 Kent and Simon would have avoided this problem if they had used only one observation for each country, rather than three time-related observations. But this would probably have left them with too few observations for their econometrics.

31
the entire system of workplace relations in New Zealand was overturned. (pp. 359-360)
The Employment Relations Act 2000 partially reversed the 1991 measure, principally by encouraging collective agreements. (It did not reintroduce conciliation and arbitration.)
New Zealand’s experiment with the Employment Contracts Act, not surprisingly, has generated inquiry into the differences between New Zealand and Australian experience that may be attributable to the different industrial relations regimes. In respect of productivity, some commentators argued that New Zealand fell behind Australia after the passage of the Employment Contracts Act and that this called into question the benefits of the individualised system that New Zealand had adopted. Dalziel (2002), for example, wrote:
….since 1992 labour productivity growth in New Zealand has been considerably below that of Australia, after similar rates for the previous 14 years. This observation raises profound questions for New Zealand policy markers about the effectiveness of labour market reforms intended to raise labour productivity. The Employment Contracts Act of 1991 radically decentralised employer-employee negotiations, and led to significantly lower unionisation rates among the New Zealand workforce. Nevertheless, the introduction of the Act appears to have marked the end of a long period of strong comparability between New Zealand and Australian labour productivity growth to New Zealand’s great disadvantage. (p. 42)
According to Peetz (2005),
a simple way of testing the impact of individual contracting on productivity is to examine the New Zealand experience in the 1990s. After all, this was the country that experienced the sharpest shift of any from collective arrangements to individual employment contracts, with the passage of the Employment Contracts Act 1991. From 1991 to 1996 New Zealand had a national government favouring individualism in employment relations, while Australia had one that favoured collectivism and promoted collective bargaining. Brian Easton examined national level data on New Zealand productivity growth from 1978 to 1996 and reported that he was ‘astonished by the ECA’s failure to have a perceptible impact on productivity since it was implemented’. Similarly, Rasmussen and Deeks, after reviewing several studies commented that ‘although there are some variations in the estimates, the expected increase in productivity argued by the proponents of the Act remains to be seen. Indeed, for the period when Australia had a collectivist national government and new Zealand an individualistic one, productivity growth was substantially higher in Australia - and, as shown [by Dalziel], this was after the two countries had had similar rates of productivity for the previous 14 years. (pp. 3-4)
In Peetz’s view, ‘the New Zealand experience suggests that further moves to reduce the safely net under individual contracts are likely to lead to reductions in the rate of growth or productivity’ (p. 7).
Before 2006, there were no official New Zealand data of productivity. Commentaries such as those noted above relied on data that combined official GDP estimates and the researchers’ estimates of labour inputs. Perry (2006) joins issue with both the data and the interpretations of them. In 2006, however, Statistics New Zealand began publication of productivity estimates for the measured sector, which is similar to Australia’s market sector. These are

32
retrospective to 1991. Perry provides a chart, covering the years 1991-2005, which relates New Zealand’s productivity levels to Australia’s. We reproduce this as Figure 7. This figure does not show New Zealand productivity as a percentage of Australian productivity at any time. The data would not support such a comparison. Instead, the ratio of New Zealand’s productivity to Australia’s is arbitrarily set at 100 in 1991. The levels for later years show how New Zealand’s relative productivity compares with that of 1991. Inspection of the figure suggests that there was little or no trend, upward or downward, in relative labour productivity, but a slightly rising trend in relative multifactor productivity. This difference reflects a relative fall in the relative capital : labour ratio, which is also shown in the figure. In comparison with New Zealand, Australia has boosted its labour productivity by a more rapid increase in its capital stock.
Figure 7: New Zealand Productivity Relative to Australian Productivity 1991-2005
Source: Perry (2006), Figure 5. Reproduced by kind permission of the author, the editor of the Australian Economic Review and Blackwells Publishers.
The attempt to draw inferences about the effects of the New Zealand legislation from a trans-Tasman comparison always was an exercise of dubious merit. In both countries, many factors are likely to have affected productivity performance and the priority ascribed to industrial relations was no more than assumption. In the event, the advent of the official New Zealand productivity statistics has left the trans-Tasman comparison devoid of what little cogency might have been claimed for it. It may be possible to decompose the series depicted in Figure 6 to accord with preconceptions as to the effects of changes in arrangements in both countries, but such exercises are of doubtful value. Explaining productivity differences between Australia and New Zealand is a complex task, requiring much more sophisticated methods than have been deployed to date.

33
5. Conclusions The principal message of this report is the elusiveness of links between industrial relations and productivity. They may be elusive because they are non-existent or weak; or they may be buried under the effects of other influences. The reasons for questioning whether industrial relations factors have played a significant role in shaping Australia’s productivity performance include:
• the strong time trend of productivity over the years since 1964-65, without obvious evidence of any ‘kinks’ that might be related to changes in industrial relations;
• the seeming absence of explanations in industrial relations for the deviations from trend in the 1960s and 1970s;
• the difficulty of reconciling the claim that the Accord depressed productivity, because of its favourable effects on employment, with the available evidence about the connection between employment and productivity; and
• the problems that exist in applying industrial relations explanations to the behaviour of Australian productivity in the more recent decades.
At first sight, an industrial relations explanation for the surge of the late 1990s has some appeal, in that it occurred at a time when any beneficial effects of enterprise bargaining might have been expected to become apparent. There are, however, problems with this perception of events, over and above the doubts that always attach to post hoc ergo propter hoc reasoning. First, there were other factors that might have contributed to the surge. Even if we were to accept that the surge was due to ‘microeconomic reform’ - the Productivity Commission view - we would still face the task of separating the effects of industrial relations change from those of greater exposure to foreign trade and enhanced domestic competition. And there are factors outside microeconomic reform – notably the increasing use of computers and related technology - that may have had a strong effect on productivity. Secondly, if the surge was due to enterprise bargaining, its short life is something of a puzzle, although it may have been the result of enterprise bargaining’s effects being of a one-off character. Thirdly, the uneven dispersion of productivity growth across industries is difficult to reconcile with an explanation that accords much weight to more general influences such as the growth in enterprise bargaining.
Just as there is not an entirely convincing explanation for the surge, the low rate of productivity growth that has prevailed since the beginning of the decade is also something of a mystery. We are aware that there have been comments on policy failure in education and training. These comments may well be justified, but the effects of education and training are of a long-term character. This is obvious when we reflect on the fact that only a small proportion of the work force at any time has emerged from education and training within the past few years. The effects of good and bad policy will accumulate and may become apparent over a longer period, but are unlikely to be manifest in short-term change in the level or rate of growth of productivity. There can be no certainty about the interpretation of the post-1999 productivity record; but it may be that the long-term growth rate of productivity has simply reasserted itself, subject to short-term deviations due to factors such as drought.

34
Productivity, in our view, should be regarded as a long-term rather than a short-term policy issue. From that perspective, industrial relations, if relevant, are likely to be so for two main reasons. One is that resistances to change in the areas of production, numbers of workers, technology and work practices are likely to act as a brake on productivity growth. This is generally understood. Disagreements arise with respect to the means of releasing the brake. The presumption of current policy is that the most effective means is to empower employers by disempowering employees. Disempowerment takes the form of reducing the role of third parties – unions and arbitrators – in industrial relations and minimising legal prescription of the terms of employment. An alternative is to recognise that employee powerlessness is not necessarily the best route to cooperative workplaces – that workers who have a sense of fair treatment, security and involvement are more likely to facilitate ongoing change. Industrial relations research has not yet proved that either of these two approaches, or which combination of them, is the more conducive to the avoidance of employee behaviour that is hostile to higher productivity.
The second reason is that an upward pressure on real wages per hour worked is a likely inducement to employers to invest in capital-intensive methods of production and to innovate. Reducing wages, or avoiding increases, may conduce to higher profits in the short term, but is likely to go with a preservation of existing methods of production. It is beyond dispute that in the long term higher productivity and higher real wages go together. What is less adequately appreciated is that the causal relation is likely to be a two-way one. While higher productivity affords the means to higher wages, a continuous rise in real wages is itself a spur to productivity improvement. This is not to say that higher wages are always better than lower wages. Obviously, wages can be ‘too high’ in the sense of destroying firms and employment. The implication is that a pro-productivity industrial relations system is one that balances a pressure for rising real wages against the need for firms to earn enough to justify their investments. No industrial relations system is likely always to deliver the right balance; but it is quite unlikely that maximising employer power will do so.
35
References Access Economics (2005), Workplace Relations – The Way Forward, Report commissioned by
the Business Council of Australia, BCA, Melbourne, February.
Australian Bureau of Statistics (ABS), Australian System of National Accounts, 2005-06, cat. 5204.0.
Australian Bureau of Statistics (ABS), 2007 Labour Statistics: Concepts, Sources and Methods, Cat. No. 6102.0.55.001.
Banks, G. (2002), ‘The Drivers of Australia’s Productivity Surge’, Speech to Outlook 2002.
Buchele, R. and Christiansen, J. (1999), ‘Employment and Productivity Growth in Europe and North America: The Impact of Labour Market Institutions’, International Review of Applied Economics, vol 13, 313-332.
Business Council of Australia (2005), Workplace Relations Action Plan: For Future Prosperity, BCA, Melbourne.
Dalziel, P. (2002), ‘New Zealand’s Economic Reforms: An Assessment’, Review of Political Economy, vol. 14, pp. 31-46.
Dolman, B., Lu, L. and Rahman, J. (2005), ‘Understanding Productivity Trends’, Economic Roundup, Summer 2006, pp. 35-52.
Doucouliagos, C. and Laroche, P. (2003), ‘What Do Unions Do to Productivity? A Meta-Analysis.’ Industrial Relations, vol. 42, 650-691.
Draca, M. Foster, J. and Green, C. (2003), ‘Human Capital Investment and Economic Growth in the Australian Economy’, in Williams, C., Draca, M. and Smith, C. (eds.) Productivity and Regional Economic Performance in Australia, Office of Economic and Statistical Research, Queensland Treasury.
Edwards, J. (2006), Quiet Boom: How the Long Economic Upswing is Changing Australia and its Place in the World, Lowy Institute paper 14.
Farmakis-Gamboni, S. and Prentice, D. (2006), Does Reducing Union Bargaining Power Increase Productivity?, La Trobe University.
Freeman, R. (1976),’Individual Mobility and Union Voice in the Labor Market’. American Economic Review, vol. 66, pp. 361–8.
Freeman, R. and Medoff, J. (1984), What do Unions do? New York, Basic Books.
Fry, T.L., Jarvis, K., & Loundes, J. (2003), Industrial Relations Reform: Who are the Pro-reformers, Melbourne Institute Working Paper No. 11/03.
Gruen, D. and Stevens, G. (2000), ‘Australian Macroeconomic Performance and Policies in the 1990s’. In: D. Gruen and S. Shretha (eds.) The Australian Economy in the 1990s. Proceedings of a Conference Held at the H.C. Coombs Centre for Financial Studies, Kirribilli on 24-25 July 2000, Reserve Bank of Australia, Sydney.
36
Hancock, J. and Hsieh, W. (2006), South Australia’s Recent Productivity Performance, Economic Issues No. 18, South Australian Centre for Economic Studies.
Hancock, K. (1999), ‘Labour Market Deregulation in Australia’, in Richardson, S. (ed.). Reshaping the Labour Market: Regulation, Efficiency and Equality in Australia. Cambridge University Press: New York.
Hull, D., and Reid, V. (2003), Simply the Best: Workplaces in Australia, Working Paper 88, ACIRRT, University of Sydney, December.
Kent, C. and Simon, J. (2007), Productivity Growth: The Effect of Market Regulations, Research Discussion Paper 2007-04, Economic Group, Reserve Bank of Australia.
Louca, J. (2003), ‘Multifactor Productivity and Innovation in Australia and its States’ in Williams, C., Draca, M. and Smith, C. (eds.) Productivity and Regional Economic Performance in Australia, Office of Economic and Statistical Research, Queensland Treasury.
Loundes, J., Tseng, Y-P., and Wooden, M. (2003), ‘Enterprise Bargaining and Productivity in Australia: What Do We Know?. Economic Record, vol. 79, pp. 245-258.
Magnani, E., and Prentice, D. (2006), ‘Unionization and Input Flexibility Evidence from US Manufacturing 1973-1996’, Industrial and Labor Relations Review, vol. 59, pp. 386-407.
Nguyen, D. Smith, C. and Meyer-Boehm, G. (2003), ‘Variations in Economic and Labour Productivity Growth among the States of Australia: 1984-85 to 1998-99’ in Williams, C., Draca, M. and Smith, C. (eds.) Productivity and Regional Economic Performance in Australia, Office of Economic and Statistical Research, Queensland Treasury.
OECD (2007), ‘More Jobs but Less Productive? The Impact of Labour Market Policies on Productivity’, in OECD, Employment Outlook 2007, pp. 55-103.
Parham, D. (2004), ‘Sources of Australia’s Productivity Revival’, Economic Record, vol. 80, pp. 239-257.
Parham, D. (2005), ‘Is Australia’s Productivity Surge Over?’ Agenda, vol. 12, pp. 253-266
Parham, D. and Roberts, P. (2004), ‘Productivity Growth and its Sources: How do NZ and Australia Compare?’ Workshop Convened by the Treasury, Reserve Bank of New Zealand, Ministry of Economic Development, Wellington, New Zealand, 28-29 July.
Parham, D. and Zheng, S. (2006), ‘Aggregate and Industry Productivity Estimates for Australia’, Australian Economic Review, vol. 39, 216-226.
Peetz, D. (2005), ‘Is Individual Contracting More Productive’, included as part of ‘The Federal Government’s Industrial Relations Policy: Report Card on the Proposed Changes’, published at http://www.econ.usyd.edu.au/14896.html
Peetz, D. (2006), ‘Hollow Shells: The Alleged Link Between Individual Contracting and Productivity Growth’, Journal of Australian Political Economy, Vol. 56, pp. 32-55.
Peetz, D. (1998), Unions in a Contrary World, Cambridge University Press, Cambridge.
37
Perry, L.J. (2006), ‘Do Workplace Contracts Harm Labour Productivity Growth? A Reconsideration of the Macroeconomic Evidence from New Zealand’, The Australian Economic Review, vol. 69, pp. 359-75.
Quiggin, J. (2001), ‘The Australian Productivity Miracle: A Sceptical View’, Agenda, vol. 8, pp. 333-348
John Quiggin: Commentary on Australian and World Events from a Social-democratic Perspective 2005, viewed 5 June, 2007, http://johnquiggin.com/index.php/archives/2005/11/14/parham-vs-quiggin-on-productivity/>.
Tzannatos, Z. and Aidt, T. S. (2006), ‘Unions and Microeconomic Performance: A Look at What Matters for Economists (and Employers)’, International Labour Review, vol. 145, pp. 257-278.
Tseng, Y-P. and Wooden, M (2001), Enterprise Bargaining and Productivity: Evidence from the Business Longitudinal Survey, Melbourne Institute Working Paper No 8/01, Melbourne Institute of Applied Economic and Social Research, University of Melbourne, Melbourne, July.
Webster, E. and Loundes, J. (2002), Factors Affecting the Industrial Relations Climate in Australian Enterprises, Melbourne Institute Working Paper No. 7/02.
Wooden, M. (2000), The Transformation of Australian Industrial Relations, Federation Press, Sydney.
Wooden, M. (2001), ‘Industrial Relations Reform in Australia: Causes, Consequences and Prospects’, Australian Economic Review, vol. 34, 243-62.
Wooden, M. (2002), Industrial Relations Reform and the Consequences for Working Time, Job Security, Productivity and Jobs, Melbourne Institute of Applied Economic and Social Research, University of Melbourne.