impacts of the csr strategies of technology companies on
TRANSCRIPT
Tourism & Management Studies, 13(4), 2017, 73-81, DOI: 10.18089/tms.2017.13408
73
Impacts of the CSR strategies of technology companies on performance and competitiveness
Impacto de la estrategia de RSC en el desempeño y la competitividad de empresas tecnológicas
Juan Andrés Bernal-Conesa
Centro Universitario de la Defensa de San Javier (CUD), Santiago de la Ribera (Murcia), Spain [email protected]
Antonio Juan Briones-Peñalver
Universidad Politécnica de Cartagena (UPCT), Facultad de Ciencias de la Empresa, Calle Real, Cartagena, Spain [email protected]
Carmen de Nieves-Nieto
Universidad Politécnica de Cartagena (UPCT), Facultad de Ciencias de la Empresa, Cartagena, Spain [email protected]
ABSTRACT
This study used structural equation modelling to analyse and investigate
the adoption of corporate social responsibility (CSR) strategies by the
Spanish technology industry and the impacts of these strategies on
technology companies’ performance and competitiveness. The research
was conducted using a survey of companies located in Spanish science
and technology parks. The analyses’ results reveal positive, direct and
statistically significant relationships between companies’ CSR strategies
and competitiveness and between their competitiveness and
performance. In addition, the results show that competitiveness is a
mediating variable in the relationship between CSR strategies and
technology companies’ performance.
Keywords: Corporate social responsibility, technological company,
competitiveness, performance.
RESUMEN
En este artículo se propone un modelo de ecuaciones estructurales para
estudiar la adopción de una estrategia empresarial basada en la
Responsabilidad Social Corporativa (RSC) en la industria tecnológica
española y cómo dicha estrategia puede influir sobre la competitividad y
el desempeño económico (performance). El estudio se llevó a cabo en
empresas ubicadas en Parques Científicos y Tecnológicos españoles
mediante una encuesta. Los resultados del modelo revelan que existe
una relación positiva, directa y estadísticamente significativa entre la
estrategia de RSC y la competitividad y entre ésta última y el
performance. Además, se establece que la competitividad es una
variable mediadora en la relación entre la estrategia de RSC y el
Performance de la empresa tecnológica.
Palabras clave: Responsabilidad Social Corporativa, empresas
tecnológicas, competitividad, performance.
1. Introduction
Business environments in recent years have been characterised
by an acute economic crisis, which can be attributed not just to
a change in economic cycles but also to the absence of values
and ethical principles in the functioning of organisations (Melé,
Argandoña, & Sanchez-Runde, 2011). Therefore, one way to end
the crisis could be through social innovation (Goldsmith, 2010)
and corporate social responsibility (CSR). The latter is considered
an innovation in company management that can help firms
achieve maximum strategic value in all their functions. Some
organisations even believe that CSR has protected them against
the negative effects of the current economic crisis (Janssen, Sen,
& Bhattacharya, 2015). As a result, the traditional scope of CSR
research has expanded to include frameworks for effective
economic crisis management (Pérez & Bosque, 2012).Effective
CSR management can help organisations minimise the negative
impacts of the crisis (Pérez-Ruiz & Rodríguez-del-Bosque, 2012)
and generate positive changes in business management in the
search for success, improved reputations and competitive
advantages (Gallardo-Vázquez & Sánchez-Hernández, 2013).
The concept of CSR is not new as it was first used in the last
century, originating in the United States (Gjølberg, 2009). Ever
since then, companies have been facing a growing demand for
social commitment from different stakeholders.The relationship
between CSR and corporate performance has been widely
studied, with researchers reporting contrasting results (Marín,
Rubio, & de Maya, 2012). Some studies show a positive
relationship, whereas others show a negative relationship, with
results also dependent on the time involved (Muñoz, Pablo, &
Peña, 2015).
Organisations now need to adapt constantly to economic
changes in order to have a greater chance of survival in the
market. Key factors in this process are innovation and
competitiveness. In the last two decades, the debate about the
strategic potential of CSR and the possible relationship between
CSR and competitiveness has thus become increasingly relevant
(Battaglia, Testa, Bianchi, Iraldo, & Frey, 2014; Porter & Kramer,
2006). Much has already been written about how a strategic
adoption of CSR could lead to long-term financial rewards (Lee,
2008).
Competitiveness is a multidimensional concept that refers to the
capacity to create sustainable competitive advantages that can
be used both at the national and company levels (Vilanova,
Lozano, & Arenas, 2009). CSR has clearly become an important
factor for the competitiveness of companies (Turyakira, Venter,
& Smith, 2014) since numerous studies have confirmed the

Bernal-Conesa, Briones-Peñalver & Nieves-Nieto, Tourism & Management Studies, 13(4), 2017, 73-81
74
positive relationship between social and economic performance
(Lee, 2008). Thus, the effect of CSR on competitive success can
include obtaining positive results for companies in terms of
market positioning that extend beyond the financial sphere
(Gallardo-Vázquez & Sánchez-Hernández, 2013). This impact is
stronger in sectors that are highly competitive (e.g. the
technology sector) and that follow a proactive versus reactive
strategy (Marín et al., 2012) versus CSR’s effect in uncompetitive
sectors, in which traditional advantages are brand, price, quality
and distribution (Rives & Bañón, 2008).
Currently, a growing number of Spanish companies believe that
they must contribute to sustainable development by planning
operations that foster economic growth and increase
productivity and competitiveness while ensuring environmental
protection. These firms also seek to promote social responsibility
(Prado-Lorenzo, Gallego-Álvarez, García-Sánchez, & Rodríguez-
Domínguez, 2008) since investment in CSR initiatives can be a
source of competitive advantages (Apospori, Zografos, &
Magrizos, 2012). These strategies are a way to improve the
economic performance of companies (Hur, Kim, & Woo, 2014).
Given this context, the aims of this study were to analyse (1) the
influence of CSR strategies on economic performance, (2) the
impacts of CSR strategieson the competitiveness of technology
companies and (3) the direct influence of CSR on
competitiveness and economic performance.
2. Literature review
In academic settings, CSR is often used as a comprehensive
concept that describes a variety of issues relating to the
responsibilities of businesses (Hillenbrand, Money, &
Ghobadian, 2013). CSR has no universally accepted definition
(Dahlsrud, 2008) although CSR can be said to include not only
strict compliance with existing legal obligations but also
voluntary implementation of governance and management
strategies, policies and procedures, as well as social, labour and
environmental concerns and respect for human rights. CSR
arises from organisations’ relationships and transparent
dialogues with stakeholders, in which organisations take
responsibility for the consequences and impacts of their actions
(Mendoza, de Nieves, & Briones, 2010).
Some studies have shown that the implementation of CSR in
organisationshas a positive relationship with financial benefits
(Lo, 2010; Hammann, Habisch, & Pechlaner, 2009) and, more
specifically, that technological industries can increase their
economic performance through CSR (Chang, 2009). Although no
clear consensus has been reached in the debate on the impact
of CSR measures on economic performance (Ramos,
Manzanares, & Gómez, 2014), most researchers suggest that a
positive relationship should exist between the two variables
(Gallardo-Vázquez & Sanchez-Hernandez, 2014; Garcia-Castro,
Ariño, & Canela, 2009). However, some studies also claim the
relationship is negative (Muñoz et al., 2015). As of yet, very few
studies have examined the relationship between the CSR of
technology companies and their performance (Wang, Chen, Yu
& Hsiao, 2015). Therefore, the following hypothesis was
proposed in the present research:
H1: CSR strategies have a positive impact on the performance
of technology companies.
Given the above findings, companies need to adopt formalised
CSR practices and, thus,implement CSR procedures and tools
that are aligned with their corporate strategies (Bocquet, Le Bas,
Mothe, & Poussing, 2013). Some studies suggest that CSR makes
a significant positive contribution to national competitiveness
and even levels of quality of life (Boulouta & Pitelis, 2014). In
other words, CSR is expected to translate into greater
competitive success (Herrera, Larrán, & Martínez-Martínez,
2013). As Vilanova et al. (2009) suggest, when CSR is integrated
into business processes, it generates innovative practices and,
therefore, improved competitiveness.
A large part of the CSR literature has, therefore, focused on the
impact of CSR on firms’ level of competitiveness (Boulouta &
Pitelis, 2014), including large and small companies and different
sectors (Battaglia et al., 2014; Vidales & Ortiz, 2014). More
extensive research is needed on CSR’s impact on Spanish
technological companies to confirm in this specific context what
previous research has shown, namely, that organisations that
maintain a strategic orientation towards innovation and bet on
improving their internal organisational capacities are more
competitive in a globalised environment (Suñe, Bravo, Mundet,
& Herrera, 2012). To foster product and process innovations,
companies must adopt formalised CSR practices as these make a
positive contribution to competitiveness (Boulouta & Pitelis,
2014). The second research hypothesis in the present study was
proposed in the following terms:
H2: CSR strategies have a positive impact on the
competitiveness of technology companies.
The relationship between performance and competitiveness has
been observed in diverse studies of business strategies. Ranging
from (Porter & Kramer, 2006) work to the theory of resources
and capabilities (Spanos & Lioukas, 2001), a variety of research
has related performance to competitiveness (Gallardo-Vázquez
& Sánchez-Hernández, 2014). Therefore, to complete the
research hypotheses of the present study and develop the
conceptual model, the third and last hypothesis was formulated
as follows:
H3: A clear link exists between the competitiveness and
performance of technological companies.
The hypotheses are summarised in the conceptual research
model in Figure 1.

Bernal-Conesa, Briones-Peñalver & Nieves-Nieto, Tourism & Management Studies, 13(4), 2017, 73-81
75
Figure 1 - Conceptual research model
Source: Authors.
3. Methodology
This study focused on the technological sector since, according
to Ketchen et al. (1997), the above conceptual model could
contribute to a better understanding and explanation of
organisational results if the research concentrated on a sample
from a single industry or sector. For this reason, technological
companies located in Spanish science and technology parks were
selected as the sample. These parks have in common that they
attract either newly created technological companies or already
consolidated companies that foster regional development
through a technological approach, as well as creating jobs and
well-being (Jimenez-Zarco, Cerdan-Chiscano, & Torrent-Sellens,
2013). Currently, there are 6,452 companies in the Asociación de
Parques Científicos y Tecnológicos de España, which have
created 151,562 jobs and, in 2014, generated a total turnover of
22,327,000 euros.
To prepare for this study’s analysis of the relationships between
the constructs shown in Figure 1, a specific questionnaire was
designed using a Likert-typefive-point scale (i.e. 1 = ‘totally
disagree’ and 5 =‘strongly agree’). This approach was selected
because many questions referred to issues that cannot be
quantified with a specific value (e.g. ‘The organisation’s
management is involved in the implementation of CSR
strategies.’). In general, the questionnaire included items related
to CSR strategies, competitiveness and performance in line with
surveys in other studies (Venter, Turyakira, & Smith, 2014;
Gallardo-Vázquez & Sánchez-Hernández, 2013; Prajogo, Tang, &
Lai, 2012).
To ensure the results were empirically sound, an online survey
was conducted. The final sampling method consisted of a non-
probability convenience sampling procedure. In other words, the
sample consisted of units that facilitated measurement and that
were accessible or favourable to participation (Miquel, Bigné,
Cuenca, Miquel, & Lévy, 1997). However, of the 489 companies
consulted by telephone that initially were in favour of
responding to the questionnaire, only 98 completed
questionnaires during 2014, of which 56 were considered valid
for this study, since only these 56 companies had implemented
CSR measures – or intended to do so – as a business strategy.
The study population was the 489 companies contacted, so the
final sample represented a valid response rate of 11.45% (error
12.35%; p=q=0.5; confidence level 95%; z=1.96).
Following Henseler et al.’s (2014) advice, we used partial least
squares (PLS) as this is a remarkably effective statistical tool in
research on the management of organisations. Several previous
studies have indicated that the required sample size is between
30 and 100 cases if the conceptual model has at least 3 or 4
indicators per construct (Roldán & Sánchez-Franco, 2012).
Moreover, a Monte Carlo simulation by Chin and Newsted
(1999) showed that PLS can collect significant information from
samples as small as 20 (Reinartz, Haenlein, & Henseler, 2009).
Therefore, our sample was considered sufficiently large enough
to carry out a statistical analysis using structural
equationmodelling (SEM) based on PLS.
4. Results
SEM was used to perform the analysis as SEM is a statistical
procedure used to test the validity of functional, predictive and
causal hypotheses. This multivariate statistical technique must
be masteredin order to understand many fields of research and
to conduct basic or applied research in behavioural, managerial,
health and social sciences (Bagozzi & Yi, 2011).
The technique chosen within SEM was PLS using SmartPLS 2.0
M3software. Since SmartPLS is an model estimation and SEM
analysis programme, the estimation process used two steps to
evaluate the outer and inner models (Hair, Sarstedt, Hopkins &
Kuppelwieser, 2014). First, the measurement model of the
relationships between the indicators and constructs was
determined (Roldán & Sánchez-Franco, 2012). Second, the
estimation of the structural model of the relationships was
evaluated for different constructs. The following criteria
facilitated this assessment: path coefficients and their
significance levels (Student’s t distribution), coefficient of
determination (R2) and cross-validated redundancy (Q2) (Hair et
al., 2014). These steps ensured that we had adequate indicators
of constructs before we attempted to reach conclusions
H3
H2
H1
CSR Strategy
Performance
Competitiveness
Bernal-Conesa, Briones-Peñalver & Nieves-Nieto, Tourism & Management Studies, 13(4), 2017, 73-81
76
concerning the relationships included in the inner model (Roldán
& Sánchez-Franco, 2012).
4.1 Measurement model assessment
The PLS assessment of the measurement model for reflective
indicators was based on individual item reliability, construct
reliability, convergent validity (Tenenhaus, Vinzi, Chatelin, &
Lauro, 2005) and discriminant validity (Hair, Sarstedt, Ringle &
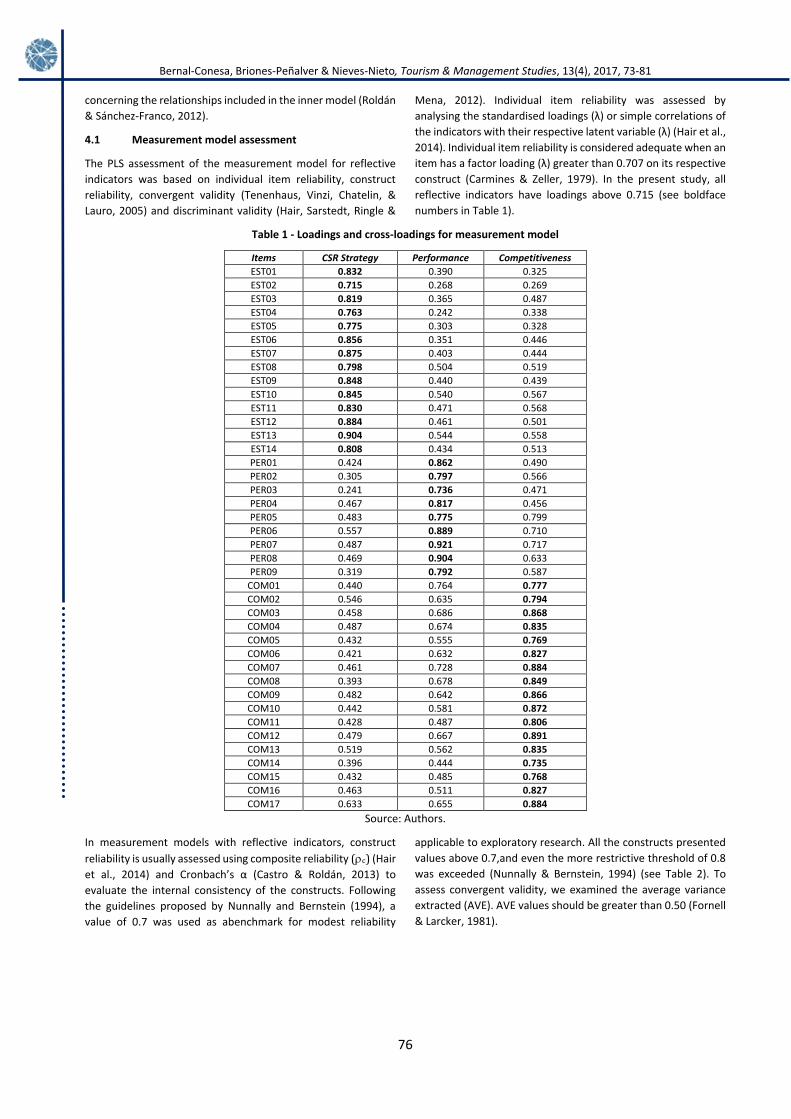
Mena, 2012). Individual item reliability was assessed by
analysing the standardised loadings (λ) or simple correlations of
the indicators with their respective latent variable (λ) (Hair et al.,
2014). Individual item reliability is considered adequate when an
item has a factor loading (λ) greater than 0.707 on its respective
construct (Carmines & Zeller, 1979). In the present study, all
reflective indicators have loadings above 0.715 (see boldface
numbers in Table 1).
Table 1 - Loadings and cross-loadings for measurement model
Items CSR Strategy Performance Competitiveness
EST01 0.832 0.390 0.325
EST02 0.715 0.268 0.269
EST03 0.819 0.365 0.487
EST04 0.763 0.242 0.338
EST05 0.775 0.303 0.328
EST06 0.856 0.351 0.446
EST07 0.875 0.403 0.444
EST08 0.798 0.504 0.519
EST09 0.848 0.440 0.439
EST10 0.845 0.540 0.567
EST11 0.830 0.471 0.568
EST12 0.884 0.461 0.501
EST13 0.904 0.544 0.558
EST14 0.808 0.434 0.513
PER01 0.424 0.862 0.490
PER02 0.305 0.797 0.566
PER03 0.241 0.736 0.471
PER04 0.467 0.817 0.456
PER05 0.483 0.775 0.799
PER06 0.557 0.889 0.710
PER07 0.487 0.921 0.717
PER08 0.469 0.904 0.633
PER09 0.319 0.792 0.587
COM01 0.440 0.764 0.777
COM02 0.546 0.635 0.794
COM03 0.458 0.686 0.868
COM04 0.487 0.674 0.835
COM05 0.432 0.555 0.769
COM06 0.421 0.632 0.827
COM07 0.461 0.728 0.884
COM08 0.393 0.678 0.849
COM09 0.482 0.642 0.866
COM10 0.442 0.581 0.872
COM11 0.428 0.487 0.806
COM12 0.479 0.667 0.891
COM13 0.519 0.562 0.835
COM14 0.396 0.444 0.735
COM15 0.432 0.485 0.768
COM16 0.463 0.511 0.827
COM17 0.633 0.655 0.884
Source: Authors.
In measurement models with reflective indicators, construct
reliability is usually assessed using composite reliability (c) (Hair
et al., 2014) and Cronbach’s α (Castro & Roldán, 2013) to
evaluate the internal consistency of the constructs. Following
the guidelines proposed by Nunnally and Bernstein (1994), a
value of 0.7 was used as abenchmark for modest reliability
applicable to exploratory research. All the constructs presented
values above 0.7,and even the more restrictive threshold of 0.8
was exceeded (Nunnally & Bernstein, 1994) (see Table 2). To
assess convergent validity, we examined the average variance
extracted (AVE). AVE values should be greater than 0.50 (Fornell
& Larcker, 1981).

Bernal-Conesa, Briones-Peñalver & Nieves-Nieto, Tourism & Management Studies, 13(4), 2017, 73-81
77
Table 2: Composite reliability (c) and convergent and discriminant validity coefficients
c Cronbach’s α AVE Competitiveness CSR Strategy Performance
Competitiveness 0.974 0.972 0.689 0.830 0 0
CSR Strategy 0.968 0.964 0.683 0.564 0.827 0
Performance 0.954 0.945 0.697 0.746 0.513 0.835
Notes: Diagonal elements in bold are the square root of the variance shared between the constructs and their measures (i.e. AVE); off-diagonal elements are the correlations among constructs; for discriminant validity, diagonal elements should be larger than off-
diagonal elements. Source: Authors.
Discriminant validity indicates the extent to which a given
construct differs from other constructs. There are two
approaches to assessing discriminant validity (Gefen & Straub,
2005). Fornell and Larcker (1981) suggest the use of the average
variance shared between a construct and its measures (i.e. AVE).
This measure should be higher than the shared variance
between the construct and other constructs in the model. To put
this idea into operation, the square root of AVE of each construct
should be greater than its correlations with any other construct
in the model assessed. In the present study, this condition is
satisfied by all constructs in relation to other variables (see Table
2 above).
The second approach suggests that each item should load more
highly on its assigned construct than it does on other constructs
(Henseler, Ringle & Sinkovics, 2009). This cross-loading analysis
can be performed by calculating the correlations between the
construct scores and the standardised data of the indicators. As
can be observed in Table 1 above, this condition was satisfied.
4.2 Structural model assessment
Once the reliability and validity of the outer model was
established, several steps needed to be taken to evaluate the
hypothesised relationships within the structural model (Hair et
al., 2014). The structural model was assessed basicallyby
examining the meaningfulness and significance of the
relationships hypothesised between the constructs. The model’s
quality depended on its ability to predict endogenous constructs.
The following criteria was used to facilitate this assessment (Hair
et al., 2014): path coefficients () and their significance levels
(Student’s t distribution), coefficient of determination (R2) and
cross-validated redundancy(Q2).
First, we tested the significance of all the paths of the structural
model. Standardised path coefficients were used to analyse the
degree of support for the research hypotheses. Chin, (1998)
proposed that this analysis should produce standardised path
coefficients with values greater than 0.2 or, more ideally, 0.3.
When the is less than 0.2, there is no causality, and the
hypothesis is rejected. Bootstrapping (i.e. 5,000 resamples) was
used to generate standard errors and t-statistics. This enabled us
to assess the statistical significance of the path coefficients
(Castro & Roldán, 2013). At the same time, the bootstrapping
confidence intervals of standardised regression coefficients
were used to accept or reject the hypotheses (see Table 3).
Table 3 - Hypothesis testing
Hypothesis Relationship Standard Error t- Statistics
H1 CSR Strategy -> Performance 0.135n.s. 0.101 1.339
H2 CSR Strategy -> Competitiveness 0.564*** 0.090 6.291
H3 Competitiveness -> Performance 0.669*** 0.097 6.934
Notes: t(0.05, 4999) = 1.645158499; t(0.01, 4999) = 2.327094067; t(0.001, 4999) = 3.091863446; * p < 0.05; ** p < 0.01; *** p < 0.001; n.s. = not significant (based on t(4999), one-tailed test)
Source: Authors.
Second, the goodness of the proposed model was determined
by the strength of each structural path. This analysis was done
using the R2 values (i.e. explained variance) for dependent latent
variables. For each path between constructs, the desirable
values needed to be at least equal to or higher than 0.1 (Falk &
Miller, 1992). The R2 is a measure of the model’s predictive
accuracy (Hair et al., 2014), and, therefore, R2 values measure
the construct variance explained by the model. Values of 0.75,
0.50 and 0.25 describe substantial, moderate or weak levels,
respectively, of predictive accuracy (Hair, Ringle, & Sarstedt,
2011). As shown in Figure 2, the model has a high predictive
power.
Bernal-Conesa, Briones-Peñalver & Nieves-Nieto, Tourism & Management Studies, 13(4), 2017, 73-81
78
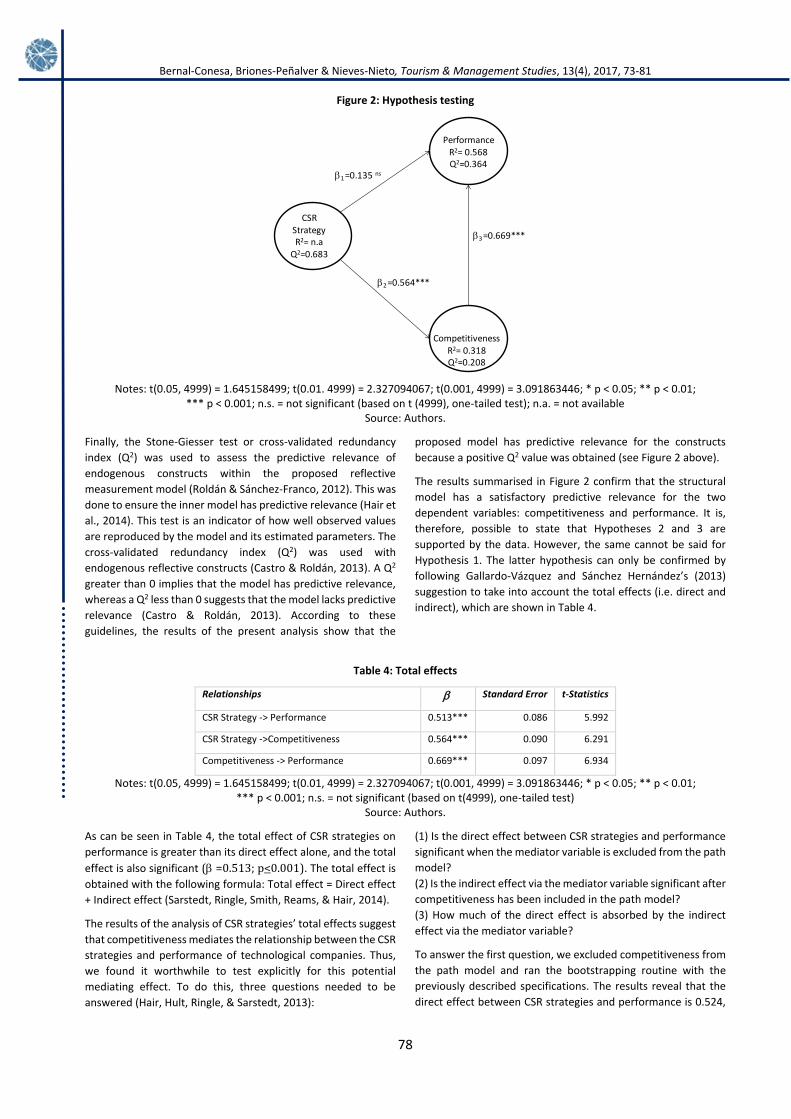
Figure 2: Hypothesis testing
Notes: t(0.05, 4999) = 1.645158499; t(0.01. 4999) = 2.327094067; t(0.001, 4999) = 3.091863446; * p < 0.05; ** p < 0.01; *** p < 0.001; n.s. = not significant (based on t (4999), one-tailed test); n.a. = not available
Source: Authors.
Finally, the Stone-Giesser test or cross-validated redundancy
index (Q2) was used to assess the predictive relevance of
endogenous constructs within the proposed reflective
measurement model (Roldán & Sánchez-Franco, 2012). This was
done to ensure the inner model has predictive relevance (Hair et
al., 2014). This test is an indicator of how well observed values
are reproduced by the model and its estimated parameters. The
cross-validated redundancy index (Q2) was used with
endogenous reflective constructs (Castro & Roldán, 2013). A Q2
greater than 0 implies that the model has predictive relevance,
whereas a Q2 less than 0 suggests that the model lacks predictive
relevance (Castro & Roldán, 2013). According to these
guidelines, the results of the present analysis show that the
proposed model has predictive relevance for the constructs
because a positive Q2 value was obtained (see Figure 2 above).
The results summarised in Figure 2 confirm that the structural
model has a satisfactory predictive relevance for the two
dependent variables: competitiveness and performance. It is,
therefore, possible to state that Hypotheses 2 and 3 are
supported by the data. However, the same cannot be said for
Hypothesis 1. The latter hypothesis can only be confirmed by
following Gallardo-Vázquez and Sánchez Hernández’s (2013)
suggestion to take into account the total effects (i.e. direct and
indirect), which are shown in Table 4.
Table 4: Total effects
Relationships Standard Error t-Statistics
CSR Strategy -> Performance 0.513*** 0.086 5.992
CSR Strategy ->Competitiveness 0.564*** 0.090 6.291
Competitiveness -> Performance 0.669*** 0.097 6.934
Notes: t(0.05, 4999) = 1.645158499; t(0.01, 4999) = 2.327094067; t(0.001, 4999) = 3.091863446; * p < 0.05; ** p < 0.01; *** p < 0.001; n.s. = not significant (based on t(4999), one-tailed test)
Source: Authors.
As can be seen in Table 4, the total effect of CSR strategies on
performance is greater than its direct effect alone, and the total
effect is also significant (=0.513; p<0.001). The total effect is
obtained with the following formula: Total effect = Direct effect
+ Indirect effect (Sarstedt, Ringle, Smith, Reams, & Hair, 2014).
The results of the analysis of CSR strategies’ total effects suggest
that competitiveness mediates the relationship between the CSR
strategies and performance of technological companies. Thus,
we found it worthwhile to test explicitly for this potential
mediating effect. To do this, three questions needed to be
answered (Hair, Hult, Ringle, & Sarstedt, 2013):
(1) Is the direct effect between CSR strategies and performance
significant when the mediator variable is excluded from the path
model?
(2) Is the indirect effect via the mediator variable significant after
competitiveness has been included in the path model?
(3) How much of the direct effect is absorbed by the indirect
effect via the mediator variable?
To answer the first question, we excluded competitiveness from
the path model and ran the bootstrapping routine with the
previously described specifications. The results reveal that the
direct effect between CSR strategies and performance is 0.524,
1 =0.135 ns
CSR StrategyR2= n.a
Q2=0.683
PerformanceR2= 0.568Q2=0.364
CompetitivenessR2= 0.318Q2=0.208
2 =0.564***
3 =0.669***

Bernal-Conesa, Briones-Peñalver & Nieves-Nieto, Tourism & Management Studies, 13(4), 2017, 73-81
79
at a significance level of 0.001. Answering the second question
required re-estimating the full model (i.e. with the mediator
included) and testing the indirect effect’s significance. The
corresponding bootstrapping results indicate that the indirect
effect of 0.377 has a significance level of 0.001 (Vinzi, Chin,
Henseler, & Wang, 2010). Finally, we computed the variance
accounted for (VAF) by the model (Vinzi et al., 2010). This final
analysis produced a VAF value of 0.735, which, according to (Hair
et al., 2013), suggests that competitiveness partially mediates
the relationship between CSR strategies and performance.
5. Conclusions
The objective of the above data analyses was to determine the
impact of CSR strategies on the competitiveness and
performance of Spanish technological firms.The results show
that these strategies have a significant effect on
competitiveness, but the impact of CSR strategies on
performanceis not as clear, which is in line with other studies’
findings (Muñoz et al., 2015). If the mediating role of
competitiveness is considered, CSR has a positive influence on
performance. These results, therefore, highlight the need to
recognise that CSR strategies area driver of performance
through competitiveness and that CSR has an important role in
technology companies.
Our study provides empirical proof that CSR strategies positively
influence the competitiveness of technology companies.
Competitiveness has a direct positive effect on performance and
ensures CSR strategies have an influence through
competitiveness on performance, so adopting CSR strategies can
be said to have positive impacts for technology companies in
relation to both performance and competitiveness. The
implementation of socially responsible strategies not only
translates into an ethical or moral positioning by organisations
but also into the generation of intangibles of high strategic value,
such as competitiveness and performance.
This validation of the proposed model may help technological
entrepreneurs and managers to understand why they need to
pay attention to CSR issues and what they should expect
fromany effort they make to developtheir organisations’
environmental and social strategies – beyond purely economic
benefits. From a practical point of view, technology companies
can use the results of this study as empirical support for the
benefits of enhancing the integration of CSR into corporate
strategies and of taking advantage of management synergies
created between performance and competitiveness. CSR
strategies’ implementation in technological companies, as
demonstrated by the present research, has a direct relationship
with competitiveness, which mediatesCSR strategies’ positive
influence on performance –a finding that is in line with other
studies (Chang, 2009).
As in all empirical studies, the present study’s limitations must
be identified and considered when seeking to interpretits results
and draw conclusions. First, the sample was restricted to
companies in Spain, which could be seen as a restriction on the
generalisability of the results. However, our findings are
consistent with the literature and the results of previous studies
from non-Spanish samples (Hur et al., 2014; Turyakira et al.,
2014), which clearly supports the validity of the present results
for companies outside Spain. Second, the technique used to
validate the proposed model – structural equation modelling –is
a limitation because it assumes the linearity of the relationships
between the latent variables (Castro & Roldán, 2013). Last,
technology companies are dynamic organisations that change
over time. Consequently, future research needs to assess the
proposed constructs repeatedly over time, taking into account
changing dynamics to reconfigure the different dimensions of
CSR.
Despite these limitations, the present research can be seen as
making a unique contribution to the literature because this study
represents a starting point for investigations into the impact of
CSR on technology companies and, therefore, covers an
identified gap in this field. Moreover, this study’s findings
supplement previous studies that have examined CSR and its
integration into companies’ strategies, since the present
research analysed this relationship in terms of not only its direct
effectbut also its indirect influence through competitiveness.
References
Apospori, E., Zografos, K. G., & Magrizos, S. (2012). SME corporate social
responsibility and competitiveness: a literature review.
International Journal of Technology Management, 58(1/2), 10-31.
https://doi.org/10.1504/IJTM.2012.045786
Bagozzi, R. P., & Yi, Y. (2011). Specification, evaluation, and
interpretation of structural equation models. Journal of the
Academy of Marketing Science, 40(1), 8-34.
https://doi.org/10.1007/s11747-011-0278-x
Battaglia, M., Testa, F., Bianchi, L., Iraldo, F., & Frey, M. (2014). Corporate
Social Responsibility and Competitiveness within SMEs of the
Fashion Industry: Evidence from Italy and France. Sustainability,
6(2), 872-893. https://doi.org/10.3390/su6020872
Bocquet, R., Le Bas, C., Mothe, C., & Poussing, N. (2013). Are firms with
different CSR profiles equally innovative? Empirical analysis with
survey data. European Management Journal, 31(6), 642-654.
https://doi.org/10.1016/j.emj.2012.07.001
Boulouta, I., & Pitelis, C. N. (2014). Who Needs CSR? The Impact of
Corporate Social Responsibility on National Competitiveness.
Journal of Business Ethics, 119(3), 349-364.
https://doi.org/10.1007/s10551-013-1633-2
Carmines, E. G., & Zeller, R. A. (1979). Reliability and Validity Assessment.
SAGE Publications.
Castro, I., & Roldán, J. L. (2013). A mediation model between dimensions
of social capital. International Business Review, 22(6), 1034-1050.
https://doi.org/10.1016/j.ibusrev.2013.02.004
Chang, C.-P. (2009). The relationships among corporate social
responsibility, corporate image and economic performance of high-
tech industries in Taiwan. Quality and Quantity, 43(3), 417-429.
https://doi.org/10.1007/s11135-007-9117-z
Chin, W. W. (1998). Commentary: Issues and opinion on structural
equation modeling. JSTOR. Recuperado a partir de
http://www.jstor.org/stable/249674
Dahlsrud, A. (2008). How corporate social responsibility is defined: an
analysis of 37 definitions. Corporate Social Responsibility and
Environmental Management, 15(1), 1-13.
https://doi.org/10.1002/csr.132
Falk, R. F., & Miller, N. B. (1992). A Primer for Soft Modeling (1st edition).
Akron, Ohio: Univ of Akron Pr.
Bernal-Conesa, Briones-Peñalver & Nieves-Nieto, Tourism & Management Studies, 13(4), 2017, 73-81
80
Fornell, C., & Larcker, D. (1981). Evaluating Structural Equation Models
with Unobservable Variables and Measurement Error. Journal of
Marketing Research, 18(1), 39-50. https://doi.org/10.2307/3151312
Gallardo-Vázquez, D., & Sánchez-Hernández, M. I. (2013). Análisis de la
incidencia de la responsabilidad social empresarial en el éxito
competitivo de las microempresas y el papel de la innovación.
Universia Business Review, (38), 14–31.
Gallardo-Vázquez, D., & Sánchez-Hernández, M. I. (2014). Measuring
Corporate Social Responsibility for competitive success at a regional
level. Journal of Cleaner Production, 72, 14-22.
https://doi.org/10.1016/j.jclepro.2014.02.051
Garcia-Castro, R., Ariño, M. A., & Canela, M. A. (2009). Does Social
Performance Really Lead to Financial Performance? Accounting for
Endogeneity. Journal of Business Ethics, 92(1), 107-126.
https://doi.org/10.1007/s10551-009-0143-8
Gefen, D., & Straub, D. (2005). A practical guide to factorial validity using
PLS-Graph: Tutorial and annotated example. Communications of the
Association for Information systems, 16(1), 5.
Gjølberg, M. (2009). Measuring the immeasurable?: Constructing an
index of CSR practices and CSR performance in 20 countries.
Scandinavian Journal of Management, 25(1), 10-22.
https://doi.org/10.1016/j.scaman.2008.10.003
Goldsmith, S. (2010). The Power of Social Innovation: How Civic
Entrepreneurs Ignite Community Networks for Good. John Wiley &
Sons.
Hair, J. F., Ringle, C. M., & Sarstedt, M. (2011). PLS-SEM: Indeed a Silver
Bullet. Journal of Marketing Theory and Practice, 19(2), 139-152.
https://doi.org/10.2753/MTP1069-6679190202
Hair, J. F., Sarstedt, M., Ringle, C. M., & Mena, J. A. (2012). An assessment
of the use of partial least squares structural equation modeling in
marketing research. Journal of the Academy of Marketing Science,
40(3), 414-433. https://doi.org/10.1007/s11747-011-0261-6
Hair Jr, J. F., Hult, G. T. M., Ringle, C., & Sarstedt, M. (2013). A Primer on
Partial Least Squares Structural Equation Modeling (PLS-SEM). SAGE
Publications.
Hair Jr, J. F., Sarstedt, M., Hopkins, L., & Kuppelwieser, V. G. (2014).
Partial least squares structural equation modeling (PLS-SEM): An
emerging tool in business research. European Business Review,
26(2), 106-121. https://doi.org/10.1108/EBR-10-2013-0128
Hammann, E.-M., Habisch, A., & Pechlaner, H. (2009). Values that create
value: socially responsible business practices in SMEs – empirical
evidence from German companies. Business Ethics: A European
Review, 18(1), 37–51. https://doi.org/10.1111/j.1467-
8608.2009.01547.x
Henseler, J., Ringle, C. M., & Sinkovics, R. R. (2009). The use of partial
least squares path modeling in international marketing. En New
Challenges to International Marketing (Vol. 20, pp. 277-319).
Emerald Group Publishing Limited. Recuperado a partir de
http://www.emeraldinsight.com/doi/abs/10.1108/S1474-
7979(2009)0000020014
Herrera, J., Larrán, M., & Martínez-Martínez, D. (2013). Relación entre
responsabilidad social y performance en las pequeñas y medianas
empresas: Revisión bibliográfica. Cuadernos de Gestión, 13(2), 39-
65. https://doi.org/10.5295/cdg.120360jh
Hillenbrand, C., Money, K., & Ghobadian, A. (2013). Unpacking the
Mechanism by which Corporate Responsibility Impacts Stakeholder
Relationships. British Journal of Management, 24(1), 127-146.
https://doi.org/10.1111/j.1467-8551.2011.00794.x
Hur, W.-M., Kim, H., & Woo, J. (2014). How CSR Leads to Corporate Brand
Equity: Mediating Mechanisms of Corporate Brand Credibility and
Reputation. Journal of Business Ethics, 125(1), 75-86.
https://doi.org/10.1007/s10551-013-1910-0
Janssen, C., Sen, S., & Bhattacharya, C. (2015). Corporate crises in the age
of corporate social responsibility. Business Horizons, 58(2), 183-192.
https://doi.org/10.1016/j.bushor.2014.11.002
Jimenez-Zarco, A. I., Cerdan-Chiscano, M., & Torrent-Sellens, J. (2013).
Challenges and Opportunities in the Management of Science Parks:
design of a tool based on the analysis of resident companies. Review
of Business Management.
https://doi.org/10.7819/rbgn.v15i48.1503
Ketchen, D. J., Combs, J. G., Russell, C. J., Shook, C., Dean, M. A., Runge,
J., … Lamoureux, S. (1997). Organizational Configurations And
Performance: A Meta-Analysis. Academy of Management Journal,
40(1), 223-240. https://doi.org/10.2307/257028
Lee, M.-D. P. (2008). A review of the theories of corporate social
responsibility: Its evolutionary path and the road ahead.
International Journal of Management Reviews, 10(1), 53-73.
https://doi.org/10.1111/j.1468-2370.2007.00226.x
Lo, S.-F. (2010). Performance evaluation for sustainable business: a
profitability and marketability framework. Corporate Social
Responsibility and Environmental Management, 17(6), 311–319.
https://doi.org/10.1002/csr.214
Marín, L., Rubio, A., & de Maya, S. R. (2012). Competitiveness as a
Strategic Outcome of Corporate Social Responsibility:
Competitiveness and CSR. Corporate Social Responsibility and
Environmental Management, 19(6), 364-376.
https://doi.org/10.1002/csr.1288
Melé, D., Argandoña, A., & Sanchez-Runde, C. (2011). Facing the Crisis:
Toward a New Humanistic Synthesis for Business. Journal of Business
Ethics, 99(1), 1-4. https://doi.org/10.1007/s10551-011-0743-y
Mendoza, S., de Nieves, C., & Briones, A. J. (2010). Capacidades
Empresariales en Responsabilidad Social y Cooperación en los
Agronegocios de la Región de Murcia.
Miquel, S., Bigné, E., Cuenca, A. C., Miquel, M. J., & Lévy, J. . (1997).
Investigación de mercados. Madrid: McGraw-Hill.
Muñoz, R. M., Pablo, J. D. S. de, & Peña, I. (2015). Linking corporate social
responsibility and financial performance in Spanish firms. European
Journal of International Management, 9(3), 368-383.
https://doi.org/10.1504/EJIM.2015.069133
Nunnally, J. C., & Bernstein, I. H. (1994). Psychometric Theory (3rd
edition). New York: McGraw-Hill.
Pérez, A., & Bosque, I. R. del. (2012). Measuring CSR Image: Three Studies
to Develop and to Validate a Reliable Measurement Tool. Journal of
Business Ethics, 118(2), 265-286. https://doi.org/10.1007/s10551-
012-1588-8
Pérez-Ruiz, A., & Rodríguez-del-Bosque, I. (2012). La imagen de
Responsabilidad Social Corporativa en un contexto de crisis
económica: El caso del sector financiero en España. Universia
Business Review, (33), 14–29.
Porter, M. E., & Kramer, M. R. (2006). Strategy and Society: The Link
between Competitive Advantage and Corporate Social
Responsibility. Recuperado a partir de
http://www.hbs.edu/faculty/Pages/item.aspx?num=23102
Prado-Lorenzo, J. M., Gallego-Álvarez, I., García-Sánchez, I.-M., &
Rodríguez-Domínguez, L. (2008). Social responsibility in Spain:
Practices and motivations in firms. Management Decision, 46(8),
1247-1271. https://doi.org/10.1108/00251740810901417
Prajogo, D., Tang, A. K. Y., & Lai, K. (2012). Do firms get what they want
from ISO 14001 adoption?: an Australian perspective. Journal of
Cleaner Production, 33, 117-126.
https://doi.org/10.1016/j.jclepro.2012.04.019
Ramos, M. I. G., Manzanares, M. J. D., & Gómez, F. G. (2014). El efecto
del papel mediador de la reputación corporativa en la relación entre

Bernal-Conesa, Briones-Peñalver & Nieves-Nieto, Tourism & Management Studies, 13(4), 2017, 73-81
81
la rsc y los resultados económicos. Revista de Estudios
Empresariales. Segunda Época, (1). Recuperado a partir de
http://revistaselectronicas.ujaen.es/index.php/REE/article/view/13
78
Reinartz, W., Haenlein, M., & Henseler, J. (2009). An empirical
comparison of the efficacy of covariance-based and variance-based
SEM. International Journal of Research in Marketing, 26(4), 332-344.
https://doi.org/10.1016/j.ijresmar.2009.08.001
Rives, L. M., & Bañón, A. R. (2008). La responsabilidad social corporativa
como determinante del éxito competitivo: un análisis empírico.
Revista europea de dirección y economía de la empresa, 17(3), 27-
42.
Roldán, J. L., & Sánchez-Franco, M. J. (2012). Variance-Based Structural
Equation Modeling: Guidelines for Using Partial Least Squares.
Research methodologies, innovations and philosophies in software
systems engineering and information systems, 193.
Sarstedt, M., Ringle, C. M., Smith, D., Reams, R., & Hair, J. F. (2014).
Partial least squares structural equation modeling (PLS-SEM): A
useful tool for family business researchers. Journal of Family
Business Strategy, 5(1), 105-115.
https://doi.org/10.1016/j.jfbs.2014.01.002
Spanos, Y. E., & Lioukas, S. (2001). An examination into the causal logic
of rent generation: contrasting Porter’s competitive strategy
framework and the resource-based perspective. Strategic
Management Journal, 22(10), 907-934.
https://doi.org/10.1002/smj.174
Suñe, A., Bravo, E., Mundet, J., & Herrera, L. (2012). Buenas prácticas de
innovación: un estudio exploratorio de empresas tecnológicas en el
sector audiovisual español. Investigaciones Europeas de Dirección y
Economía de la Empresa, 18(2), 139–147.
Tenenhaus, M., Vinzi, V. E., Chatelin, Y. M., & Lauro, C. (2005). PLS path
modeling. Computational Statistics & Data Analysis, 48(1), 159-205.
https://doi.org/10.1016/j.csda.2004.03.005
Turyakira, P., Venter, E., & Smith, E. (2014). The impact of corporate
social responsibility factors on the competitiveness of small and
medium-sized enterprises. South African Journal of Economic and
Management Sciences, 17(2), 157–172.
Venter, E., Turyakira, P., & Smith, E. E. (2014). The influence of potential
outcomes of corporate social responsibility engagement factors on
SME competitiveness. South African Journal of Business
Management, 45(4), 33-43.
Vidales, K. B. V., & Ortiz, D. A. A. (2014). Responsabilidad social de las
empresas agrícolas y agroindustriales aguacateras de Uruapan,
Michoacán, y sus implicaciones en la competitividad. Contaduría y
Administración, 59(4), 223–251.
Vilanova, M., Lozano, J. M., & Arenas, D. (2009). Exploring the Nature of
the Relationship Between CSR and Competitiveness. Journal of
Business Ethics, 87(S1), 57-69. https://doi.org/10.1007/s10551-008-
9812-2
Vinzi, V. E., Chin, W. W., Henseler, J., & Wang, H. (2010). Handbook of
Partial Least Squares: Concepts, Methods and Applications. Springer
Science & Business Media.
Wang, D. H.-M., Chen, P.-H., Yu, T. H.-K., & Hsiao, C.-Y. (2015). The effects
of corporate social responsibility on brand equity and firm
performance. Journal of Business Research, 68(11), 2232-2236.
https://doi.org/10.1016/j.jbusres.2015.06.003
Received: 15 February 2017
Revisions required: 10 April 2017
Accepted: 23 July 2017