implementation of school-wide positive behavior support · pdf file ·...
TRANSCRIPT

Implementation of School-Wide Positive Behavior Support Policy in Los Angeles:
Strategies, Techniques and Tools
Presented by:Laura Zeff, BCBA
&Nancy Franklin, BCBA
Los Angeles Unified School District

The total area of the LAUSD is 710 square miles.
LAUSD is divided into 8 Local Districts

LAUSD Number of Schools
• Elementary 534
• Middle 129
• Senior High 129
• SPAN Schools (not magnets) 19
• Charter Schools (Independent) 153
• Continuation Senior Highs 40
• Special Education 19
• Community Day Schools 11
TOTAL number of K-12 schools – 1,034

LAUSD Student Information
• American Indian/Alaskan Native – 0.4%
• Asian – 6.1%
• Black – 9.2%
• Filipino – 0.1%
• Hispanic – 74.9%
• Pacific Islander – 0.4%
• White – 8.9%
Total K-12 enrollment - 678,441
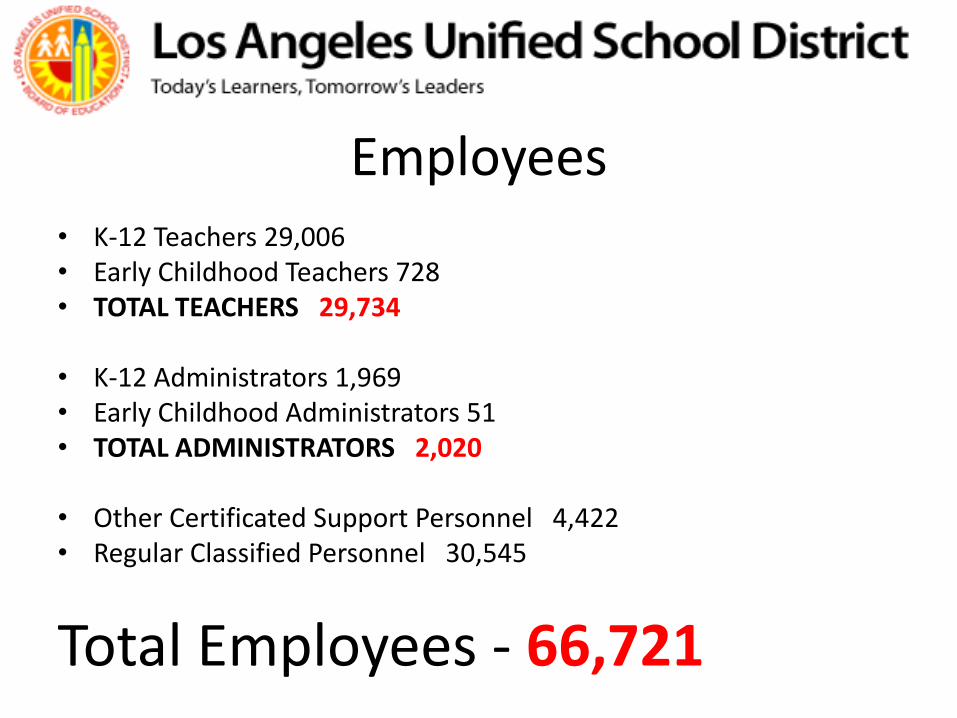
Employees• K-12 Teachers 29,006• Early Childhood Teachers 728• TOTAL TEACHERS 29,734
• K-12 Administrators 1,969• Early Childhood Administrators 51• TOTAL ADMINISTRATORS 2,020
• Other Certificated Support Personnel 4,422• Regular Classified Personnel 30,545
Total Employees - 66,721
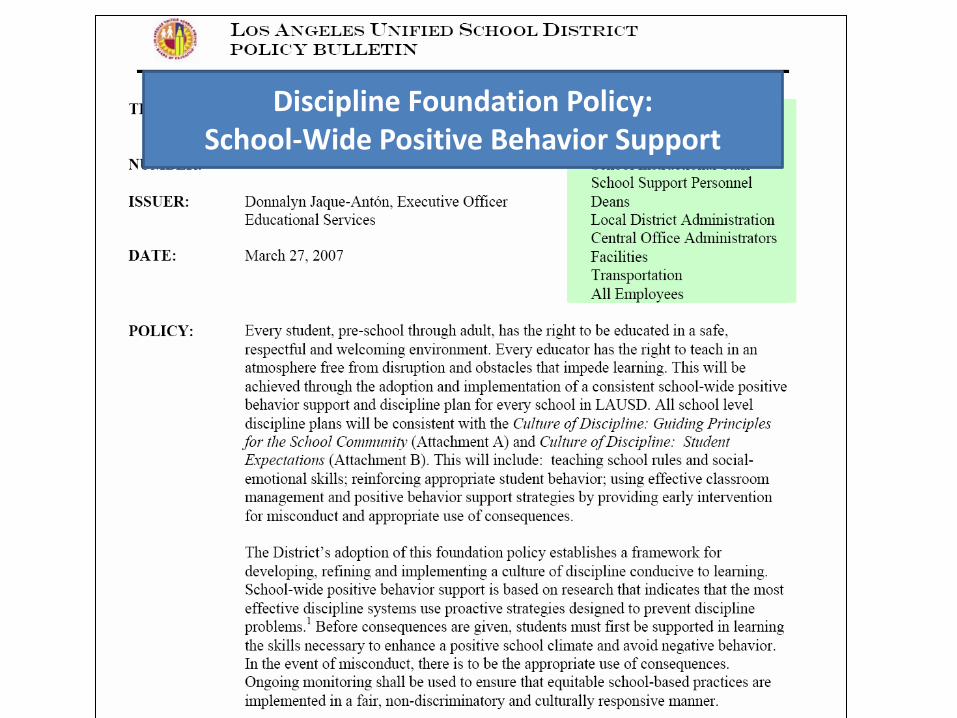
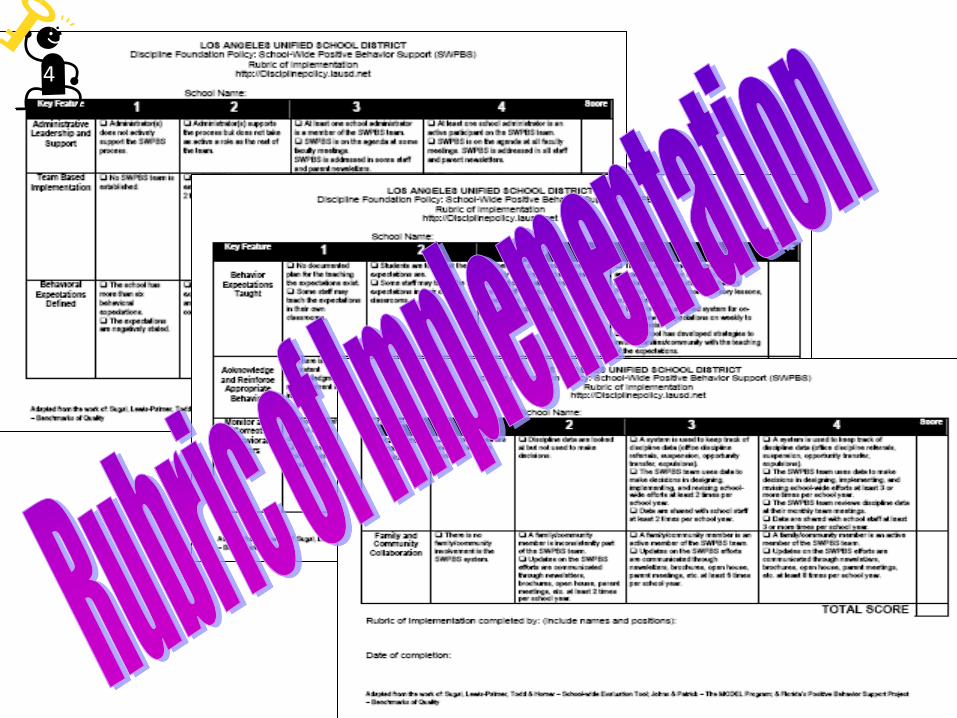
Discipline Foundation Policy: School-Wide Positive Behavior Support

You can lead a horse to water,
but you can’t make him drink.
But, you can salt the oats!!!
the Discipline Policy
them implement.
school team
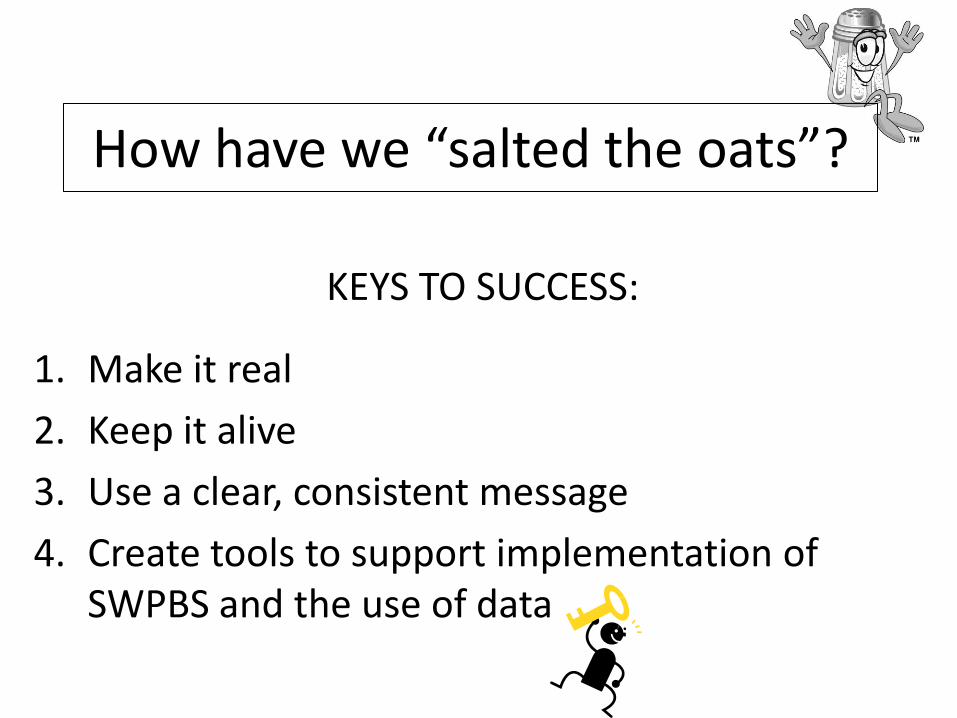
KEYS TO SUCCESS:
1. Make it real
2. Keep it alive
3. Use a clear, consistent message
4. Create tools to support implementation of SWPBS and the use of data
How have we “salted the oats”?

Make it real.

Targeted/Intensive
(High-risk students)Individual Interventions
(3-5%)
Selected(At-risk Students)
Classroom & Small Group Strategies
(10-20% of students)
Universal(All Students)
School-wide, Culturally Relevant
Systems of Support(75-85% of students)
• Intensive social skills training• Individual behavior management plans• Parent training and collaboration• Multi-agency collaboration (wrap-around) services• Alternatives to suspension and expulsion• Community and service learning
• Intensive social skills training• Self-management programs• Parent training and collaboration• School based adult mentors• Increased academic support and practice• Alternatives to out-of-school suspension• Community and service learning
• Effective academic support• Social skills training• Positive, proactive discipline• Teaching school behavior expectations• Active supervision and monitoring• Positive reinforcement systems• Firm, fair, and corrective discipline• Effective classroom management• Community and service learning
Adapted from: Sprague & Walker, 2004
1

Positive Interactions
Negative or Corrective
Interactions
1
Keep it alive.

Implementation Logic Used
• Central Leadership Team - (Meets weekly)
• Working Groups - (Meets every other month)
–Local District Lead
–Local District Staff
–Safe and Healthy School Facilitator
–Behavior Specialist
• Task Force - (Meets three times per year)
–All stakeholders
2
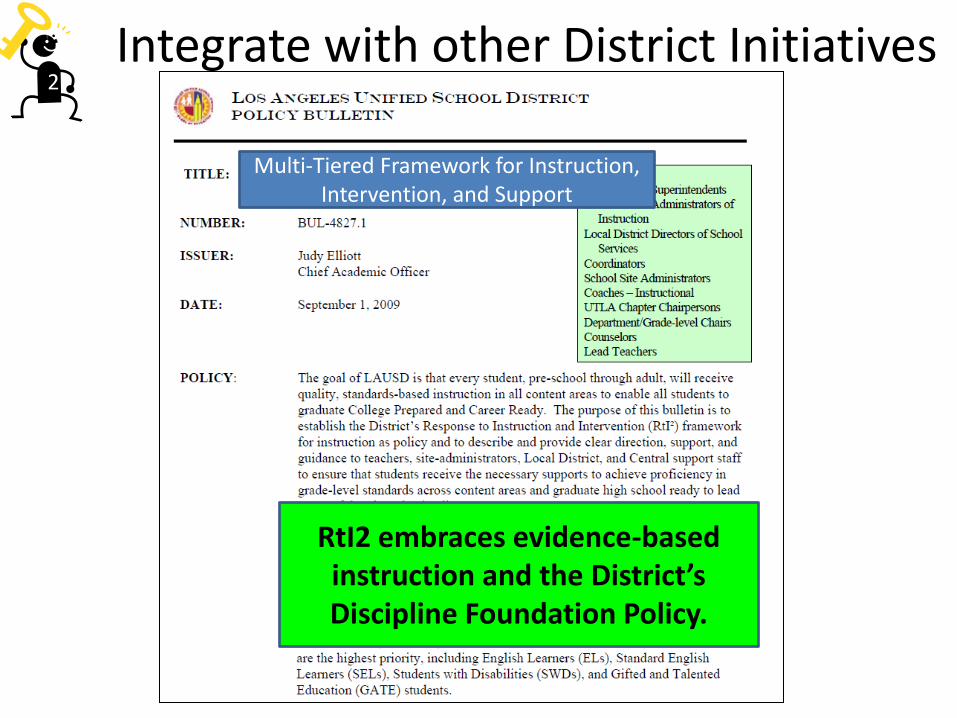
Integrate with other District Initiatives
RtI2 embraces evidence-based instruction and the District’s Discipline Foundation Policy.
Multi-Tiered Framework for Instruction, Intervention, and Support
2

This Reference Guide aligns to the policies described in BUL-3638: Discipline Foundation Policy: School-Wide Positive Behavior Support
Guidelines For Determining Appropriate Behavior Instruction and Intervention
2
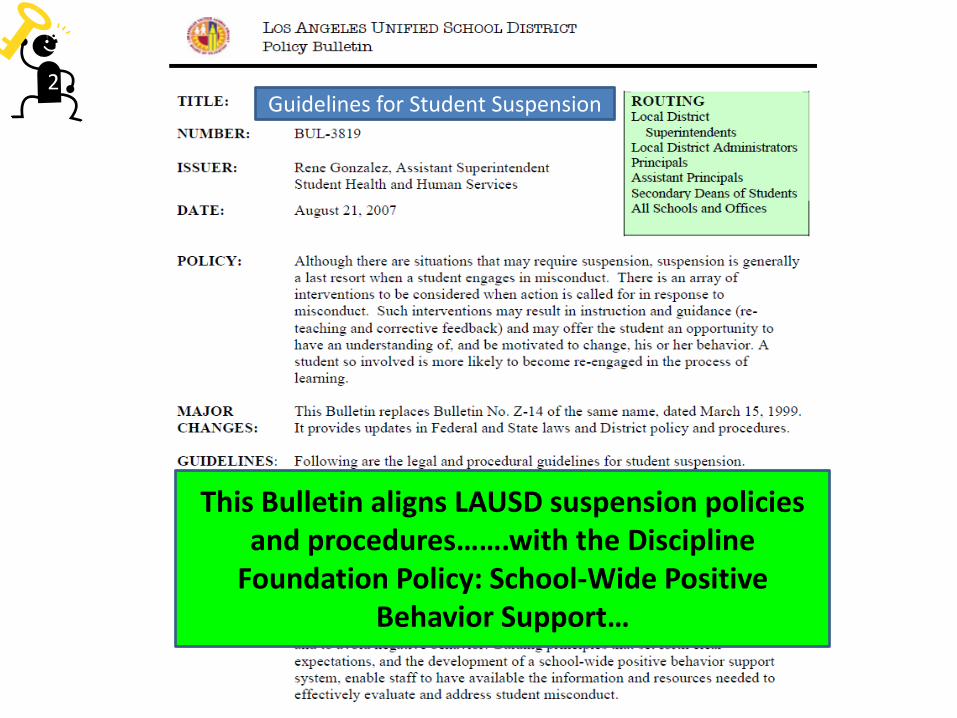
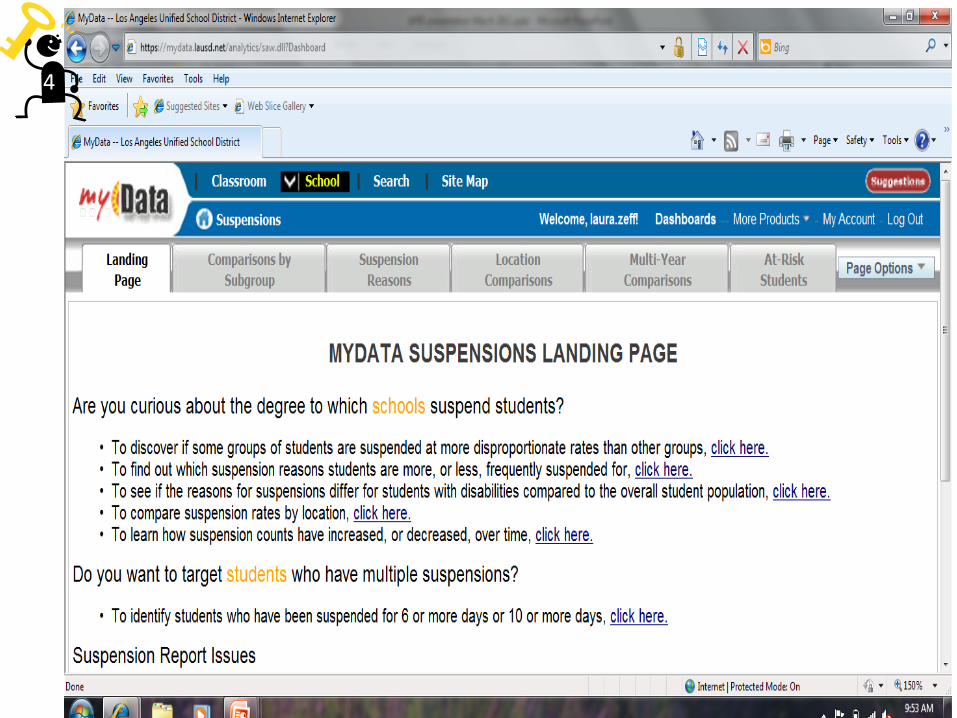
This Bulletin aligns LAUSD suspension policies and procedures…….with the Discipline
Foundation Policy: School-Wide Positive Behavior Support…
Guidelines for Student Suspension2
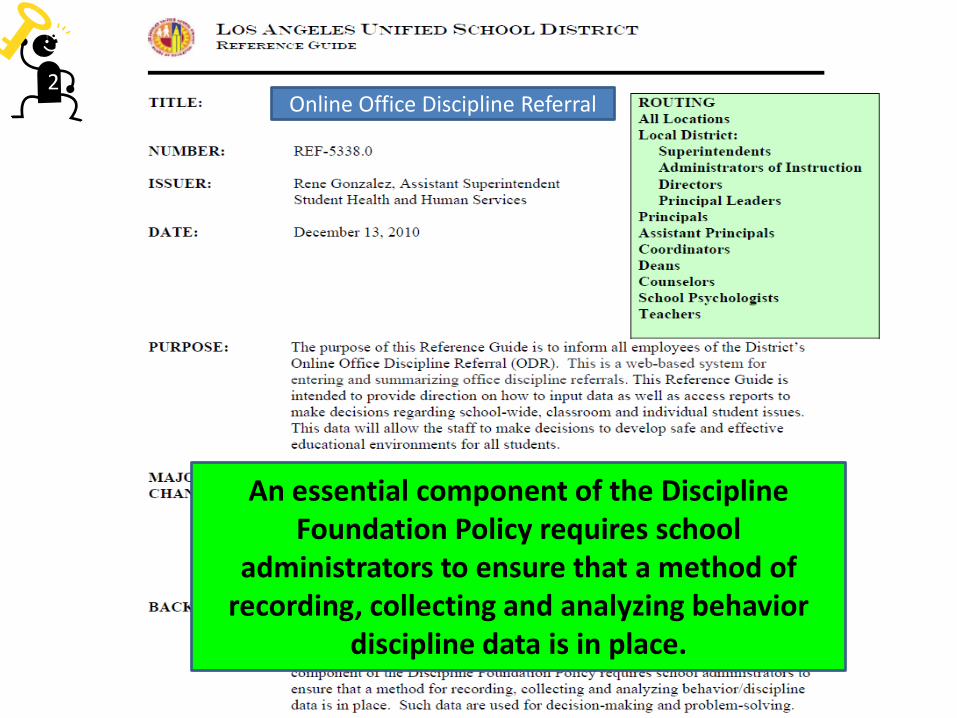
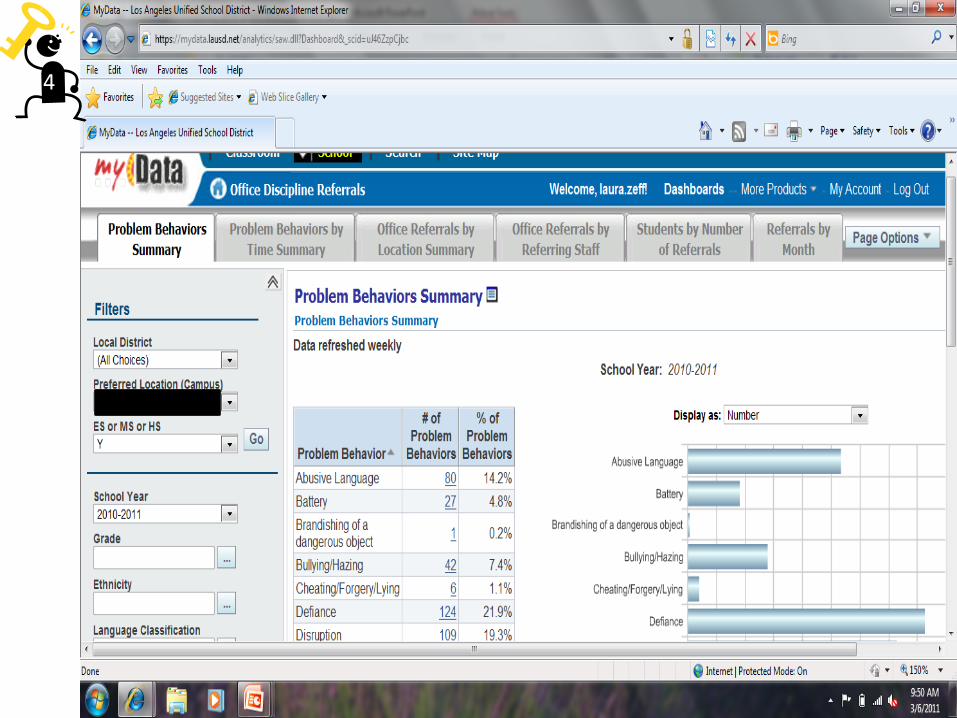
An essential component of the Discipline Foundation Policy requires school
administrators to ensure that a method of recording, collecting and analyzing behavior
discipline data is in place.
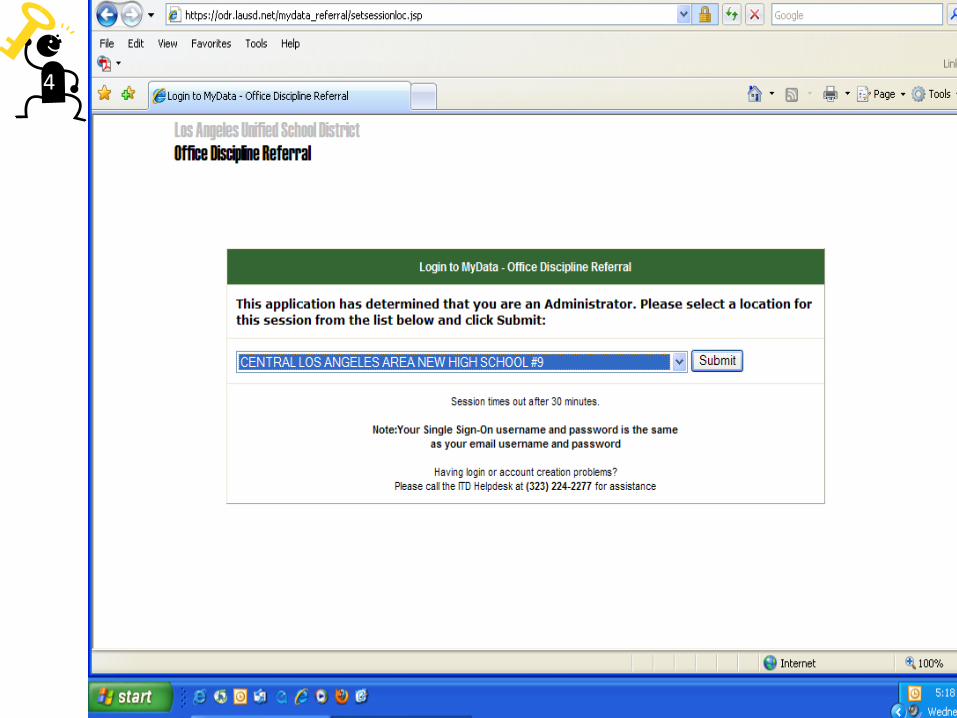
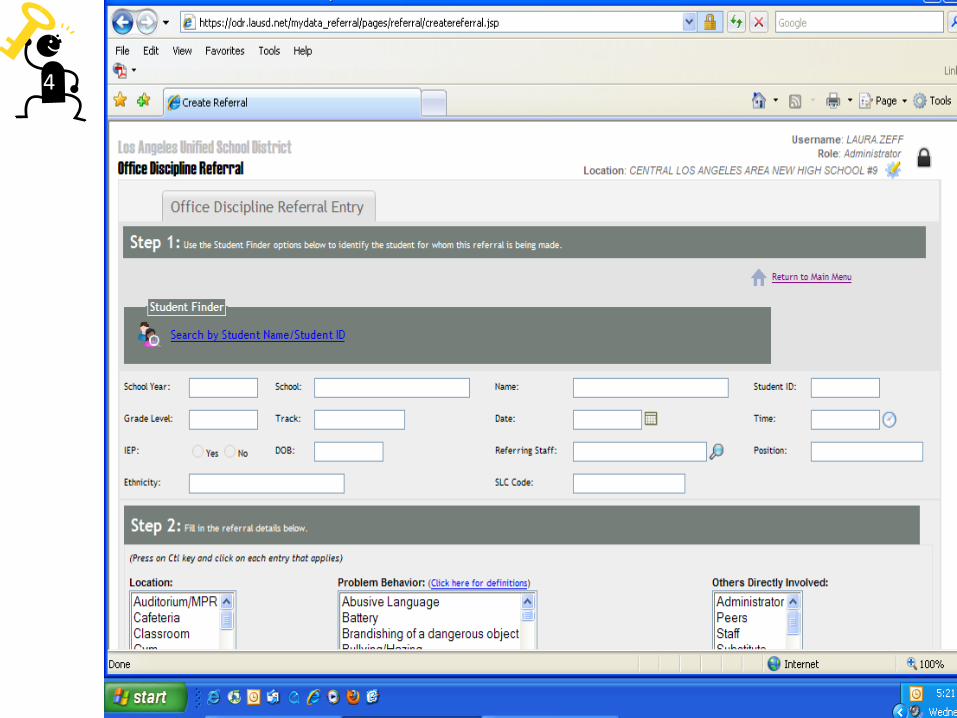
Online Office Discipline Referral2

Public Service Announcements
Use a clear, consistent message.

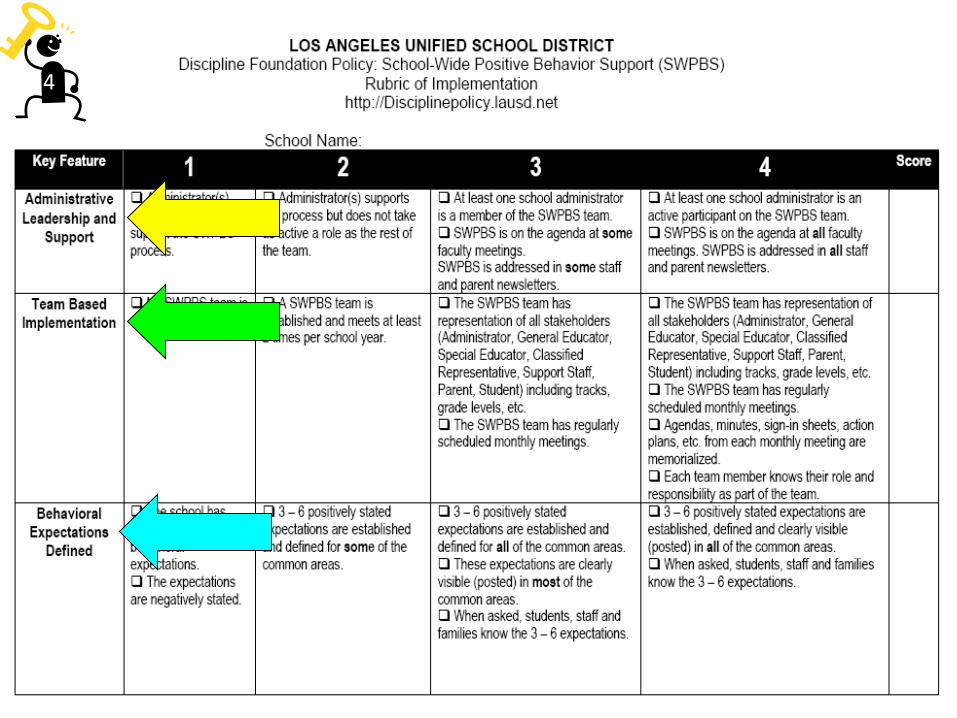
Administrative Leadership and Support
School leaders actively support the adoption, implementation and maintenance of School-Wide Positive Behavior
Support.
Team-based Implementation
The School-Wide Positive Behavior Support team is composed of members from all stakeholder groups
(administrator, general educator, special educator, classified staff, support staff, parents, and students).
Behavioral Expectations Defined
A small number (3–6) of positively stated expectations are in place for all students and staff. Behavior
expectations need to be concrete, positive behaviors so that every student, staff, and family can remember and
follow them.
Behavior Expectations Taught
Behavioral expectations are taught to all students through explanation, modeling, practicing, and processing on a
regular and ongoing basis.
Acknowledge and Reinforce Appropriate Behavior
Appropriate behaviors are modeled by all students, staff, and families and are acknowledged and reinforced on a
regular and ongoing basis.
Monitor and Correct Behavioral Errors
Consequences are consistent and are developed for a continuum of behavioral errors.
Data-based Decision Making
Data is analyzed and used to guide decisions.
Family and Community Collaboration
Partnerships are built between the school, home, and community.
Eight Key Features of
School-Wide Positive Behavior Support3
Create tools to support implementation of
SWPBS and the use of data.
4
4
4
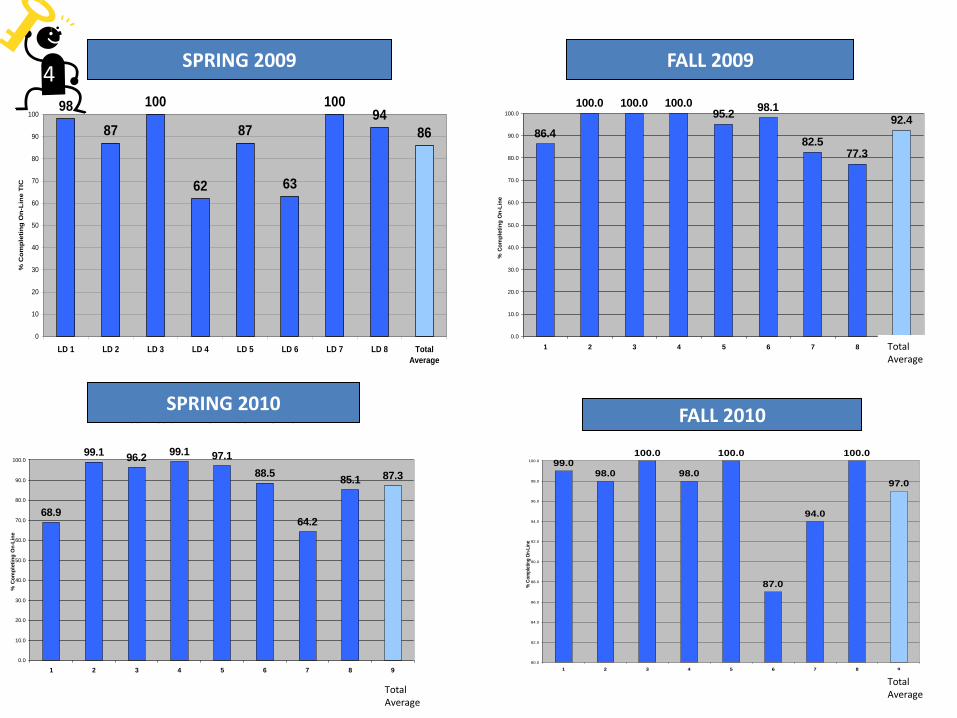
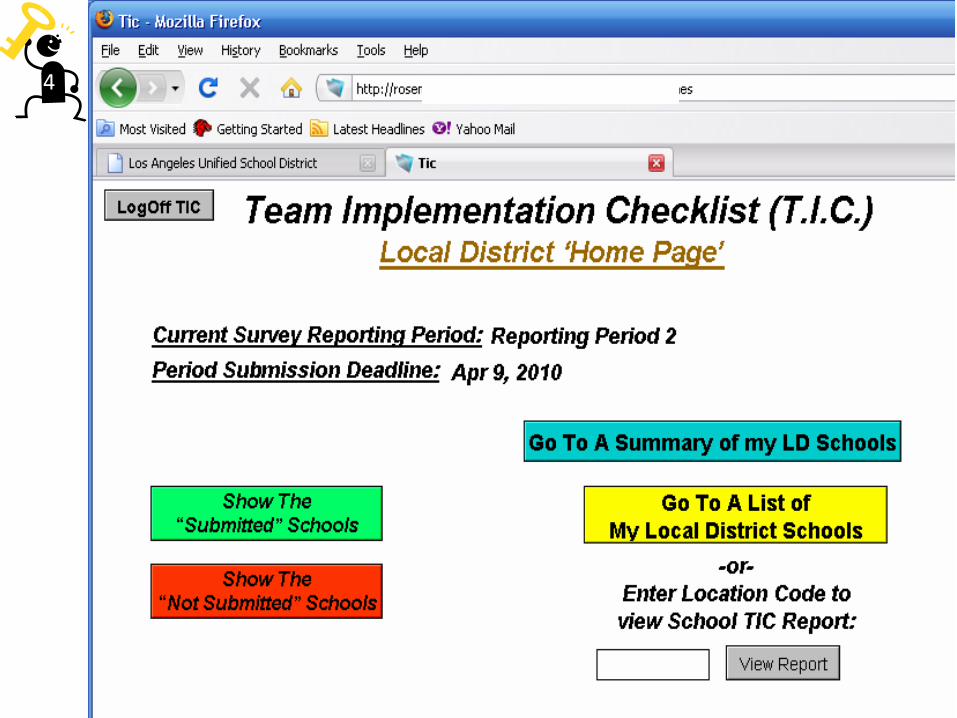
"ON-LINE" TEAM IMPLEMENTATION CHECKLIST (TIC)
SUBMISSION RATES BY LOCAL DISTRICT
98
87
100
62
87
63
10094
86
0
10
20
30
40
50
60
70
80
90
100
LD 1 LD 2 LD 3 LD 4 LD 5 LD 6 LD 7 LD 8 Total
Average
% C
om
ple
tin
g O
n-L
ine T
IC
"ON-LINE" TEAM IMPLEMENTATION CHECKLIST (TIC)
SUBMISSION RATES BY LOCAL DISTRICT
86.4
100.0 100.0 100.095.2
98.1
82.577.3
92.4
0.0
10.0
20.0
30.0
40.0
50.0
60.0
70.0
80.0
90.0
100.0
1 2 3 4 5 6 7 8 9
% C
om
ple
tin
g O
n-L
ine T
IC
"ON-LINE" TEAM IMPLEMENTATION CHECKLIST (TIC)
SUBMISSION RATES BY LOCAL DISTRICT
68.9
99.196.2
99.1 97.1
88.5
64.2
85.1 87.3
0.0
10.0
20.0
30.0
40.0
50.0
60.0
70.0
80.0
90.0
100.0
1 2 3 4 5 6 7 8 9
% C
om
ple
tin
g O
n-L
ine T
IC
"ON-LINE" TEAM IMPLEMENTATION CHECKLIST (TIC)
SUBMISSION RATES BY LOCAL DISTRICT
99.098.0
100.0
98.0
100.0
87.0
94.0
100.0
97.0
80.0
82.0
84.0
86.0
88.0
90.0
92.0
94.0
96.0
98.0
100.0
1 2 3 4 5 6 7 8 9
% C
om
ple
tin
g O
n-L
ine
TIC
SPRING 2009
Total Average
Total Average
Total Average
FALL 2009
FALL 2010SPRING 2010
4
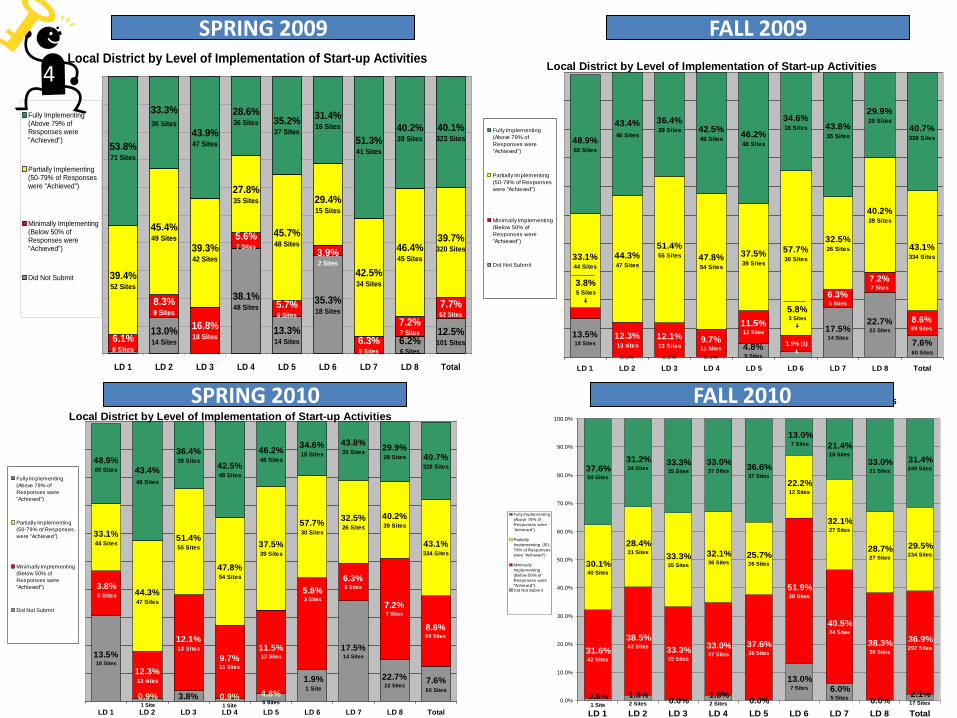
Local District by Level of Implementation of Start-up Activities
12.5%101 Sites6.2%
6 Sites
35.3%18 Sites
13.3%14 Sites
38.1%48 Sites
13.0%14 Sites6.1%
8 Sites
8.3%9 Sites
16.8%18 Sites
5.6%7 Sites
5.7%6 Sites
.
3.9%2 Sites
6.3%5 Sites
7.2%7 Sites
7.7%62 Sites
39.4%52 Sites
45.4%49 Sites
39.3%42 Sites
27.8%35 Sites
45.7%48 Sites
29.4%15 Sites
42.5%34 Sites
46.4%45 Sites
39.7%320 Sites
40.1%323 Sites
40.2%39 Sites
31.4%16 Sites
35.2%37 Sites
28.6%36 Sites
43.9%47 Sites53.8%
71 Sites
33.3%
36 Sites
51.3%41 Sites
LD 1 LD 2 LD 3 LD 4 LD 5 LD 6 LD 7 LD 8 Total
Fully Implementing(Above 79% ofResponses were"Achieved")
Partially Implementing (50-79% of Responseswere "Achieved")
Minimally Implementing (Below 50% ofResponses were"Achieved")
Did Not Submit
Local District by Level of Implementation of Start-up Activities
13.5%18 Sites
0.0% 0.0% 0.0%
4.8%5 Sites
1.9% (1)
i
17.5%14 Sites
22.7%22 Sites
7.6%60 Sites
3.8%5 Sites
i
12.3%13 sites
12.1%13 Sites
9.7%11 Sites
11.5%12 Sites
5.8%3 Sites
i
6.3%5 Sites
7.2%7 Sites
8.6%69 Sites
33.1%44 Sites
44.3%47 Sites
51.4%55 Sites 47.8%
54 Sites
37.5%39 Sites
57.7%30 Sites
32.5%26 Sites
40.2%39 Sites
43.1%334 Sites
48.9%65 Sites
43.4%
46 Sites
36.4%39 Sites 42.5%
48 Sites46.2%48 Sites
34.6%18 Sites 43.8%
35 Sites
29.9%29 Sites
40.7%328 Sites
LD 1 LD 2 LD 3 LD 4 LD 5 LD 6 LD 7 LD 8 Total
Fully Implementing
(Above 79% of
Responses were
"Achieved")
Partially Implementing
(50-79% of Responses
were "Achieved")
Minimally Implementing
(Below 50% of
Responses were
"Achieved")
Did Not Submit
Local District by Level of Implementation of Start-up Activities
7.6%60 Sites
22.7%22 Sites
17.5%14 Sites
1.9% 1 Site
4.8%5 Sites
0.9%1 Site
3.8%0.9%1 Site
13.5%18 Sites
8.6%69 Sites
7.2%7 Sites
6.3%5 Sites
5.8%3 Sites
11.5%12 Sites9.7%
11 Sites
12.1%13 Sites
12.3%13 sites
3.8%5 Sites
43.1%334 Sites
40.2%39 Sites
32.5%26 Sites
57.7%30 Sites
37.5%39 Sites
47.8%54 Sites
51.4%55 Sites
44.3%47 Sites
33.1%44 Sites
40.7%328 Sites
29.9%29 Sites
43.8%35 Sites
34.6%18 Sites
46.2%48 Sites
42.5%48 Sites
36.4%39 Sites
43.4%
46 Sites
48.9%65 Sites
LD 1 LD 2 LD 3 LD 4 LD 5 LD 6 LD 7 LD 8 Total
Fully Implementing
(Above 79% of
Responses were
"Achieved")
Partially Implementing
(50-79% of Responses
were "Achieved")
Minimally Implementing
(Below 50% of
Responses were
"Achieved")
Did Not Submit
Local District by Level of Implementation of Start Up Activities
0.0% 0.0% 0.0%2.1%17 Sites
6.0%5 Sites
13.0%7 Sites
1.8%2 Sites
1.8%2 Sites
0.8%1 Site
36.9%292 Sites
38.3%36 Sites
40.5%34 Sites
51.9%28 Sites
37.6%38 Sites
33.0%37 Sites
33.3%35 Sites
38.5%42 Sites
31.6%42 Sites
29.5%234 Sites
28.7%27 Sites
32.1%27 Sites
22.2%12 Sites
25.7%26 Sites
32.1%36 Sites
33.3%35 Sites
28.4%31 Sites
30.1%40 Sites
31.4%249 Sites
33.0%31 Sites
21.4%18 Sites
36.6%37 Sites
33.0%37 Sites
33.3%35 Sites
31.2%34 Sites
13.0%7 Sites
37.6%50 Sites
0.0%
10.0%
20.0%
30.0%
40.0%
50.0%
60.0%
70.0%
80.0%
90.0%
100.0%
LD 1 LD 2 LD 3 LD 4 LD 5 LD 6 LD 7 LD 8 Total
Fully Implementing
(Above 79% of
Responses were
"Achieved")
Partially
Implementing (50-
79% of Responses
were "Achieved")
Minimally
Implementing
(Below 50% of
Responses were
"Achieved") Did Not Submit
FALL 2010
FALL 2009SPRING 2009
SPRING 2010
4
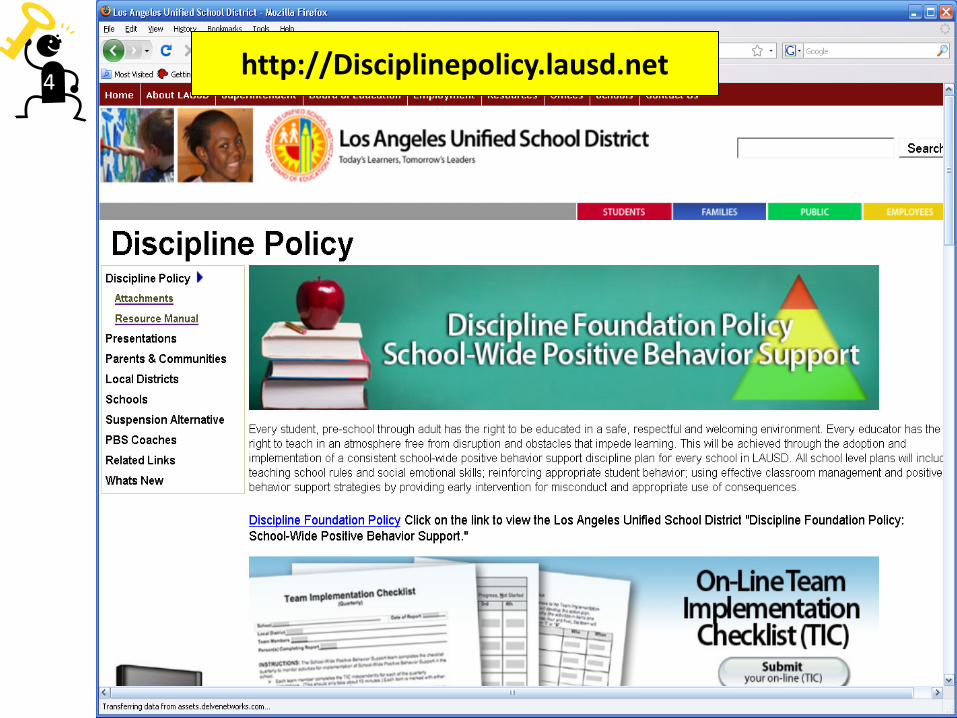
http://Disciplinepolicy.lausd.net4
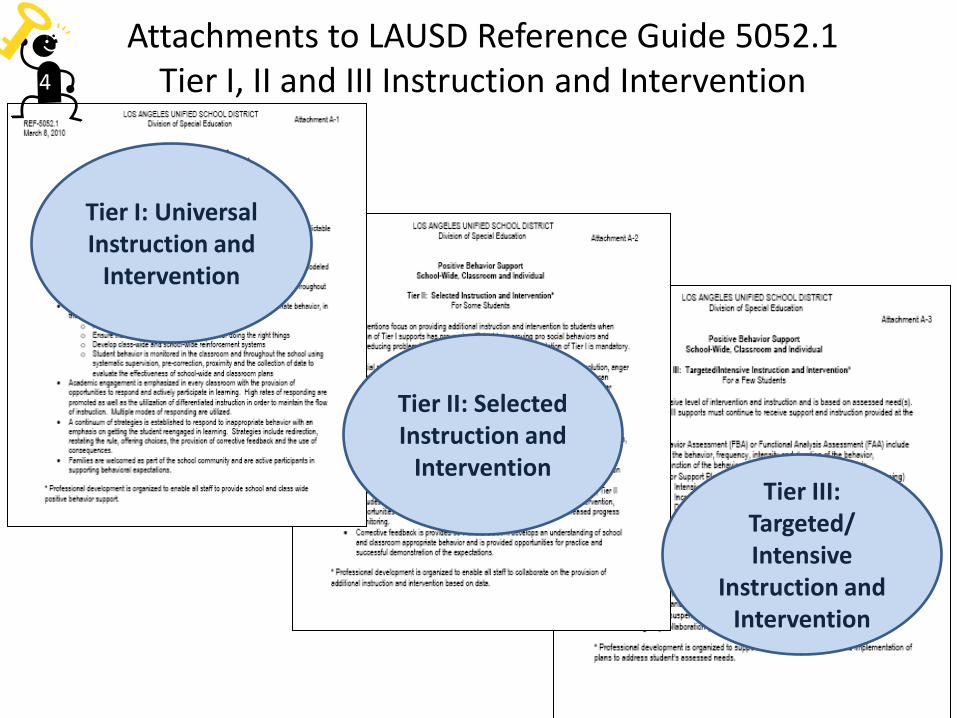
Attachments to LAUSD Reference Guide 5052.1Tier I, II and III Instruction and Intervention
Tier I: Universal Instruction and
Intervention
Tier II: Selected Instruction and
InterventionTier III:
Targeted/Intensive
Instruction and Intervention
4
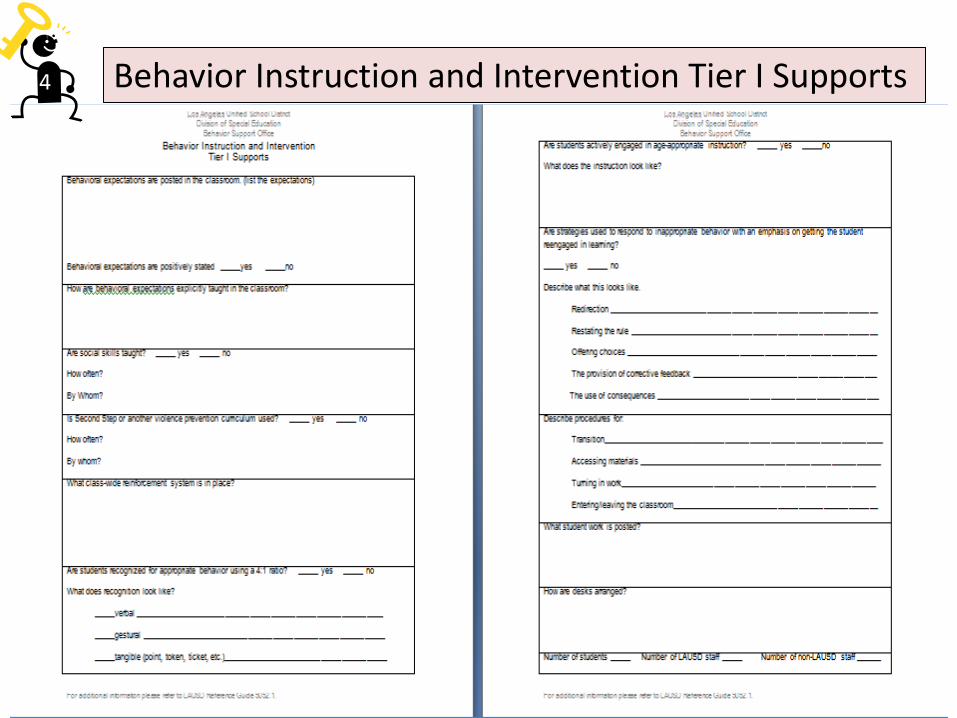
Behavior Instruction and Intervention Tier I Supports4

ICEL by RIOT Matrix4

4

4

4

4

4
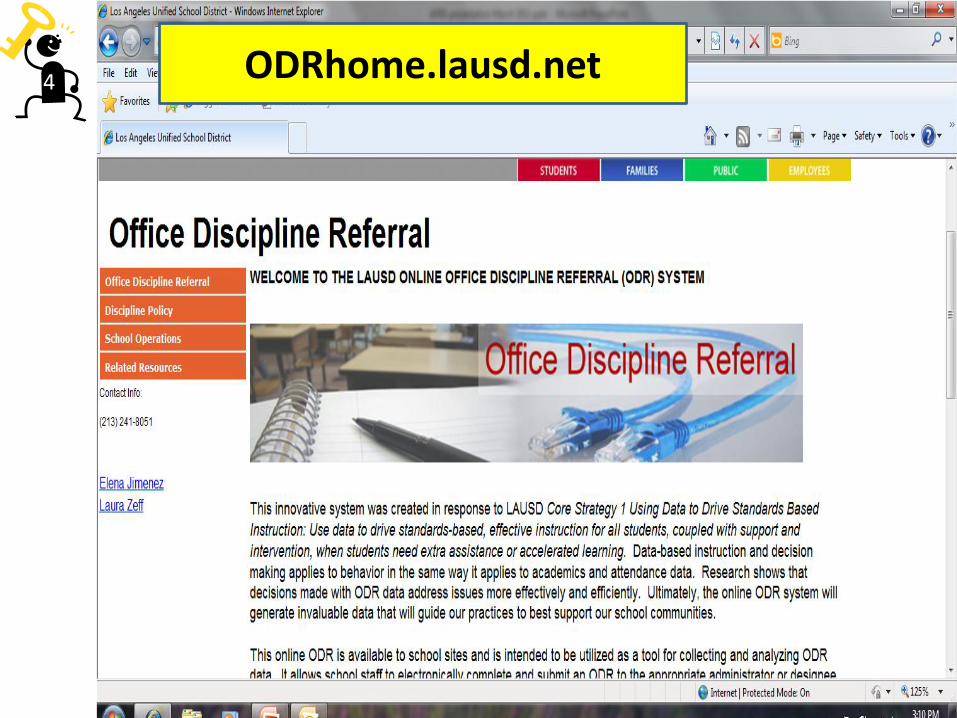
4 ODRhome.lausd.net
4
4
4
4
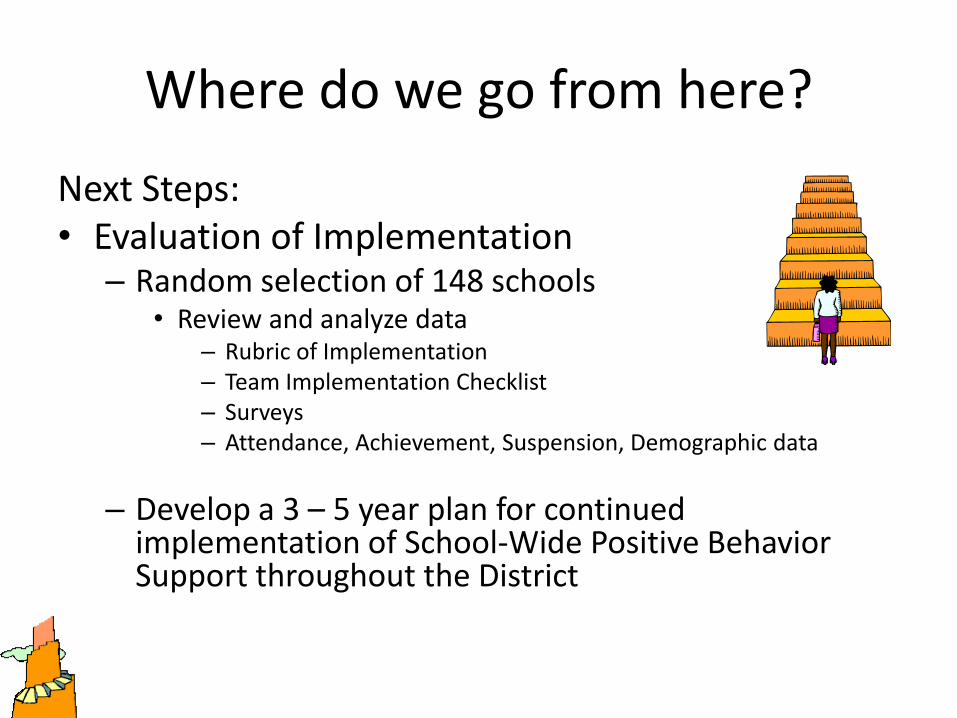
Where do we go from here?
Next Steps:• Evaluation of Implementation
– Random selection of 148 schools• Review and analyze data
– Rubric of Implementation– Team Implementation Checklist– Surveys– Attendance, Achievement, Suspension, Demographic data
– Develop a 3 – 5 year plan for continued implementation of School-Wide Positive Behavior Support throughout the District
Action is the foundational key to all success.
Pablo Picasso
Thank you for your time!!
For information, please contact:
Laura Zeff, [email protected]
818-425-1692
Nancy Franklin, [email protected]
661-313-6075