improved techniques for ce-maldi- ms off-line coupling and
TRANSCRIPT

Improved techniques for CE-MALDI-MS off-line coupling and MALDI-MS analysis of primarily hydrophobic
proteins and peptides
Johan Jacksén
Licentiate Thesis
School of Chemical Science and Engineering Department of Chemistry
Division of Analytical Chemistry
Royal Institute of Technology
Stockholm 2008
Akademisk avhandling som med tillstånd av Kungliga Tekniska Högskolan i Stockholm framlägges till offentlig granskning för avläggande av teknologie licentiatexamen den 24 januari 2008, kl. 13:00, sal E3, Osquarsbacke 14, Stockholm. Avhandlingen försvaras på svenska.
ii
Improved techniques for CE-MALDI-MS off-line coupling and MALDI-MS analysis of primarily hydrophobic proteins and peptides Licentiate Thesis ©Johan Jacksén, 2008 ISBN 978-91-7178-836-8 TRITA-CHE-Report 2007-85 ISSN 1654-1081 Royal Institute of Technology School of Chemical Science and Engineering Department of Chemistry Division of Analytical Chemistry SE-100 44 Stockholm Sweden Printed by Universitetsservice US AB, Stockholm, 2008

iii
Abstract Due to the hydrophobic nature of integral membrane proteins (IMP) they give rise to several difficulties concerning handling and analysis, which is not the case for the most water soluble proteins. New analysis methods are needed, where the insolubility problems of the hydrophobic proteins due to aggregation and adhesion are tackled. Those problems also affect digestion performance and equipment compatibility for the analysis. Protocols for analysis and separation specified for IMP are presented in Paper I and III. The instrumentation used in this work was capillary electrophoresis (CE) and matrix-assisted laser desorption/ionization mass spectrometry (MALDI-MS). Both instruments are suitable for peptide/proteins analysis. In Paper I, protocols for a CE separation of bacteriorhodopsin (BR) peptides as model IMP peptides are established. Also, a partially automated manufacturing procedure of a concentration MALDI-target is presented, suitable for fractions from CE. The MS analysis detected 9 out of 10 cyanogen bromide (CNBr) digested BR peptides. A novel technique for the off-line integration of CE to MALDI-MS using a closed-open-closed system is presented in Paper II, where the open part is a microcanal functioning as a MALDI target window. Investigation of the microcanal electro-osmotic flow (EOF) properties and band broadening characteristics was performed. A protein separation was obtained and detected with MALDI-MS analysis in the microcanal. Different protein digestion methods were evaluated using BR in Paper III through MALDI-MS. Several digestion methods as well as MS media were investigated alongside different MALDI matrices. For example, matrices as the hydrophobic 2,6-dihydroxyacetophenone (DHAP) and 2-Hydroxy-3-methoxybenzoic acid (2H3MBA) or 2-Hydroxy-5-methoxybenzoic acid (2H5MBA) mixed with DHB, appeared to be promising matrices for analysis of BR. Key words: Capillary electrophoresis, Hydrophobic peptides, Matrix-Assisted Laser Desorption Ionization Mass Spectrometry, Prestructured target, Off-line interface, Silicon microcanal, Matrix, Protein cleavage/digestion.

iv
Sammanfattning Med anledning av integrala membranproteiners (IMP) hydrofoba egenskaper uppstår flera svårigheter vid hantering och analys av IMP, vilket inte är fallet för vattenlösliga proteiner. Nya analysmetoder krävs, som löser löslighetsproblemen för de hydrofoba proteinerna som tex flockning och adsorbtion. Dessa problem påverkar även klyvningsgrad och kompatibilitet med analysutrustningen.
I Artikel I och Artikel III presenteras protokoll för analys och separation specifikt för IMP. Instrumenteringen som har använts i detta arbete är kapillärelektrofores (CE) och matris-assisterad laserdesorptions-joniserings-masspektrometri (MALDI-MS). Båda instrumenten är lämpade för peptid/protein analyser. I Artikel I, presenteras protokoll för en CE separation av peptider från bacteriorhodopsin (BR), som användes som modellpeptider för IMP. En delvis automatiserat tillverkningsprocedur för en koncentrerande MALDI-platta, som är anpassad för CE fraktionerna beskrivs också. MS-analysen detekterade 9 av 10 BR-peptider från cyanobromid-klyvning (CNBr). En ny teknik för off line-integrering av CE till MALDI-MS genom ett slutet-öppet-slutet system presenteras i Artikel II, där den öppna delen är en mikrokanal som fungerar som detektionsfönster i MALDI. Undersökning av mikrokanalens egenskaper som tex det elektroosmotiska flödet (EOF) och bandbreddningen utvärderades. En proteinseparation genomfördes och detekterades med MALDI–MS i mikrokanalen. Olika proteinklyvningsmetoder för BR undersöktes i Artikel III med MALDI-MS. Flera proteinklyvningsmetoder samt MS-medier utvärderades tillsammans med olika MALDI-matriser. Den hydrofoba matrisen 2,6-dihydroxyacetophenone (DHAP) och 2-Hydroxy-3-methoxybenzoic acid (2H3MBA) eller 2-Hydroxy-5-methoxybenzoic acid (2H5MBA) blandade med DHB, visade sig exempelvis vara lovande matriser för BR-analyser. Nyckelord: Kapillärelektrofores, Hydrofoba peptider, Matris-assisterad laserdesorptions-joniserings-masspektrometri, Strukturbelagd provplatta, Off-line interface, Mikrokanal i kisel, Matris, Proteinklyvning/-spjälkning.
v
List of publications This thesis is based on the following papers: I Capillary electrophoretic separation and fractionation of hydrophobic
peptides onto a pre-structured matrix assisted laser desorption/ionization target for mass spectrometric analysis
Jacksén J, Redeby T, Emmer Å JOURNAL OF SEPARATION SCIENCE 2006, 29 (2): 288-295 II Off-line integration of CE and MALDI-MS using a closed-open-closed
microchannel system Jacksén J, Frisk T, Redeby T, Parmar V, van der Wijngaart W, Stemme G, Emmer Å ELECTROPHORESIS 2007, 28 (14): 2458-2465
III Evaluation of MALDI matrices and digestion methods aiming at MS
analysis of hydrophobic proteins and peptides Hellborg K, Jacksén J, Skedung L, Redeby T, Emmer Å
Preliminary manuscript Reprints are published with kind permission of the journals. The contributions of the author of this thesis to these papers are:
I All the experiments, evaluation of data and parts of the writing
II Major part of the experiments, evaluation of data and parts of the writing
III The cyanogen bromide digest experiments, evaluation of data and parts of the
writing

vi
Contents
1 INTRODUCTION 1
2 BACKGROUND 3
2.1 Integral membrane proteins 3 2.1.1 Bacteriorhodopsin 3
2.2 Electrophoresis 5 2.2.1 General 5 2.2.2 Capillary Electrophoresis: 6 2.2.3 Surfactants 8 2.2.4 The CE instrument 8 2.2.5 Capillary Zone Electrophoresis 9
2.3 Mass spectrometry (MS) 10 2.3.1 Matrix-assisted laser desorption/ionization (MALDI) 11
2.3.1.1 Delayed extraction 12 2.3.2 Time of Flight (TOF) 12
2.3.2.1 Reflector 13
2.4 CE - MALDI coupling 14
2.5 Concentration effect on the MALDI target 15
2.6 Protein digestion 15
3 FABRICATION PROCEDURES FOR CE/MALDI OFF-LINE INTERFACE 16
3.1 Hydrophobic prestructured MALDI-plate 16
3.2 Microcanal Chip 17
4 PROTEIN CLEAVAGE OF BACTERIORHODOPSIN 18
4.1 Cyanogen bromide digestion 18
4.2 Trypsin digestion 19
4.3 TFA hydrolysis procedure 19
vii
5 CE SEPARATION/MALDI-MS ANALYSIS OF CNBR-DIGESTED BR 20
5.1 CE separation of CNBr-digested BR 20
5.2 Fractionation 22
5.3 MALDI-TOF analysis of the fractions 22
5.4 Evaluation of the performance of the prestructured MALDI-plate 24
6 INTEGRATED OFF-LINE CE/MALDI-MS METHOD 25
6.1 Estimation of electroosmotic flow (EOF) in the canals 25
6.2 CE separation with integrated chip 26
6.3 MALDI-MS analysis in the canal 27
7 MATRIX AND DIGESTION EVALUATION FOR HYDROPHOBIC PEPTIDES/PROTEINS 29
7.1 Tryptic digestion 30
7.2 TFA-hydrolysis procedure 30
7.3 CNBr-digestion 31
8 POTENTIAL MATRICES FOR FULL-LENGTH PROTEINS 32
9 CONCLUSIONS AND FUTURE OUTLOOKS 33
10 ABBREVIATIONS 35
11 SYMBOLS 37
12 ACKNOWLEDGEMENT 38
13 REFERENCES 39

viii

1
1 Introduction
The fundamental building blocks for all life on earth are the complex protein molecules, which are vital for the existence of all living matter. All proteins are composed of amino acids in different combinations, corresponding to the specific code that the DNA defines. The production of a protein starts with DNA translation into mRNA, followed by a transcription step of the mRNA where amino acids are linked together in a specific sequence to form a native protein. The native protein is further modified by folding of the amino acid chain and post-translational modifications before it reaches its bioactive state.
To further increase the variation of the proteome the specific folding of the same amino acid sequence depend on environmental factors, rendering a vast set of proteins. Even the code itself, the DNA, can be read in different ways through splicing, thereby further increasing the number of unique proteins [1].
When the whole human genome was mapped in 2001 [2, 3], the central question that had to be further investigated was to identify which gene (DNA code/sequence) that corresponds to a certain protein, structure and amino acid sequence in the protein and also determination of each protein (the proteome). Understanding the function of a protein and its structure can help the development of e.g. new drugs and understanding the origin/function of diseases.
One protein family that is not fully investigated is the integral membrane proteins (IMP). The IMP function as cellular gatekeepers and connect the inside of the cell to the surrounding [4]. Due to their location in the cell membrane they are highly hydrophobic, which give rise to several difficulties concerning handling and analysis which is not the case for the most water soluble proteins. New analysis methods are needed, where the insolubility problems of the proteins due to aggregation and adhesion are tackled [5]. Those problems also affect digestion performance and equipment compatibility for the analysis. The roles of IMPs are vital for the cell functions and life as pumps, receptors and ion channels [4]. Because of these functions IMP are of interest for the pharmacological and biological sciences. It have been estimated that up to 70% of all known pharmaceutical drug targets are membrane proteins [6]. In proteomic studies a general method to analyze an isolated protein is to digest the protein into peptides with some “cleavage agent” and the peptides that are formed are unique for each protein. The digested sample is separated with a separation method e.g. capillary electrophoresis (CE) and the separated peptides are analyzed with mass spectrometry (MS) to identify the protein (mass finger printing). In this thesis an investigation of the analysis steps for IMP is performed, from digestion to detection of the protein. Development of new couplings between the CE separation and Matrix-assisted laser desorption/ionization Time-of-flight MS (MALDI-TOF-MS) detection was also performed.
Essential is that no cleavage site discrimination occurs for the “cleavage agent”. A parameter that affects the cleavage performance is the solubility of the protein in the digestion medium. The solubility of the IMP can be improved by e.g. detergents or organic solvents [7]. Other factors that can increase the exposure of the protein to the “cleavage agent” are microwave and ultrasonic irradiation [8, 9] or increased temperature [10]. Another critical demand is that the medium should be compatible with further analysis steps. In the digestion protocols that have been investigated for IMP analysis,

2
BR is acting as a model IMP, while trypsin, CNBr and TFA have been used as “cleavage agents”.
An advantage to use a separation method before the MS analysis is that the risk of ion suppression decreases and therefore a better MS sensitivity is gained, thereby is a separation stage promoted before the MS analysis. The work included a CE separation coupled to off-line MALDI through fractionation of IMP peptides on a fabricated concentration MALDI target plate. Also, a novel CE-MALDI hyphenation with an incorporated microcanal in the CE system was applied, that retains the CE separation efficiency in the MALDI analysis. The microcanal was applied as a MALDI detection window.
The MALDI-TOF has become one of the most widely used techniques in proteomics studies, due to its good mass accuracy, high resolution, excellent sensitivity and large throughput capability [11, 12]. But one parameter that has been rather neglected for hydrophobic proteins is the matrix influence on the signal, due to e.g. co-crystallization and homogeneity of the sample spot. The common matrices are usually used for the hydrophobic samples, thus specialized matrices for hydrophobic proteins and peptides is one area that is far from completely mapped.
3
2 Background
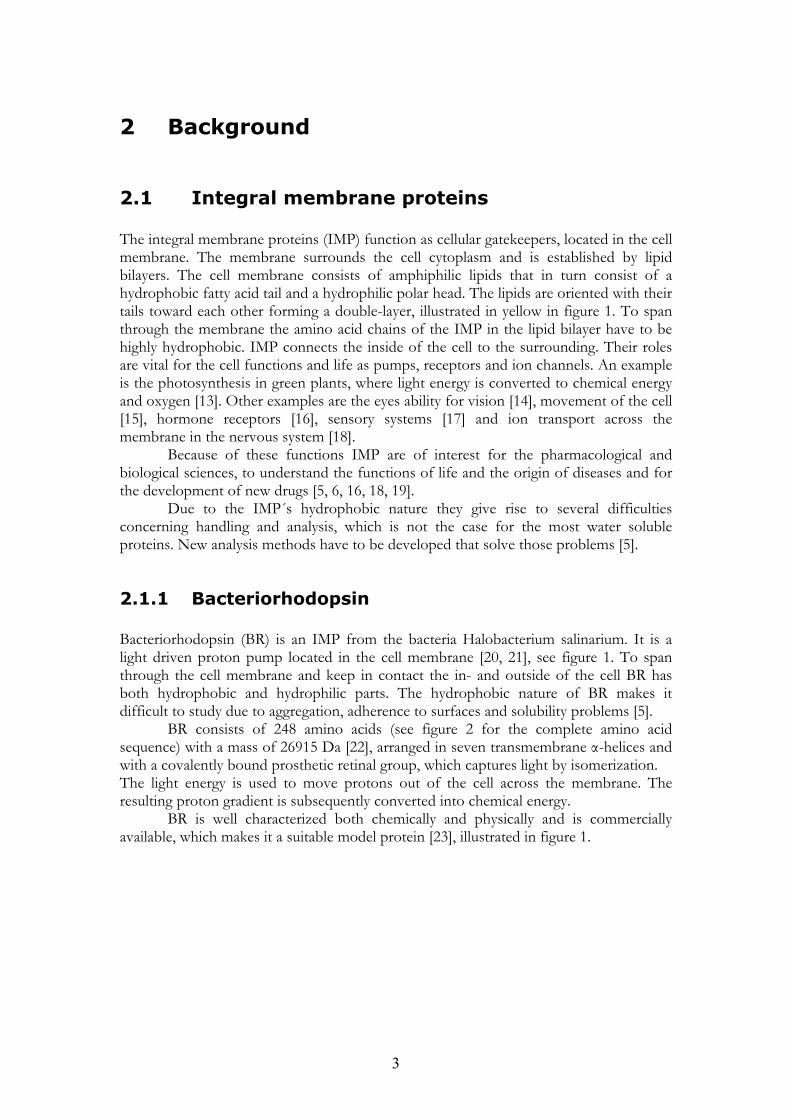
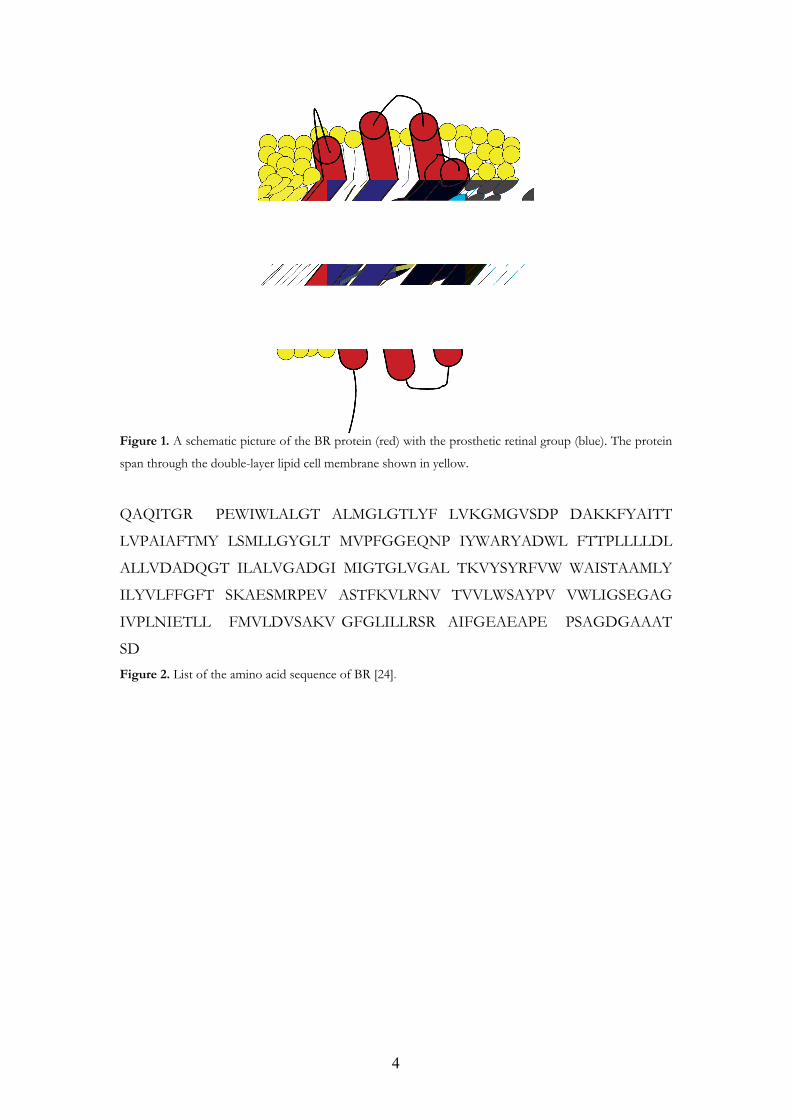
2.1 Integral membrane proteins The integral membrane proteins (IMP) function as cellular gatekeepers, located in the cell membrane. The membrane surrounds the cell cytoplasm and is established by lipid bilayers. The cell membrane consists of amphiphilic lipids that in turn consist of a hydrophobic fatty acid tail and a hydrophilic polar head. The lipids are oriented with their tails toward each other forming a double-layer, illustrated in yellow in figure 1. To span through the membrane the amino acid chains of the IMP in the lipid bilayer have to be highly hydrophobic. IMP connects the inside of the cell to the surrounding. Their roles are vital for the cell functions and life as pumps, receptors and ion channels. An example is the photosynthesis in green plants, where light energy is converted to chemical energy and oxygen [13]. Other examples are the eyes ability for vision [14], movement of the cell [15], hormone receptors [16], sensory systems [17] and ion transport across the membrane in the nervous system [18].
Because of these functions IMP are of interest for the pharmacological and biological sciences, to understand the functions of life and the origin of diseases and for the development of new drugs [5, 6, 16, 18, 19].
Due to the IMP´s hydrophobic nature they give rise to several difficulties concerning handling and analysis, which is not the case for the most water soluble proteins. New analysis methods have to be developed that solve those problems [5].
2.1.1 Bacteriorhodopsin Bacteriorhodopsin (BR) is an IMP from the bacteria Halobacterium salinarium. It is a light driven proton pump located in the cell membrane [20, 21], see figure 1. To span through the cell membrane and keep in contact the in- and outside of the cell BR has both hydrophobic and hydrophilic parts. The hydrophobic nature of BR makes it difficult to study due to aggregation, adherence to surfaces and solubility problems [5].
BR consists of 248 amino acids (see figure 2 for the complete amino acid sequence) with a mass of 26915 Da [22], arranged in seven transmembrane α-helices and with a covalently bound prosthetic retinal group, which captures light by isomerization. The light energy is used to move protons out of the cell across the membrane. The resulting proton gradient is subsequently converted into chemical energy.
BR is well characterized both chemically and physically and is commercially available, which makes it a suitable model protein [23], illustrated in figure 1.
4
Figure 1. A schematic picture of the BR protein (red) with the prosthetic retinal group (blue). The protein
span through the double-layer lipid cell membrane shown in yellow.
QAQITGR PEWIWLALGT ALMGLGTLYF LVKGMGVSDP DAKKFYAITT
LVPAIAFTMY LSMLLGYGLT MVPFGGEQNP IYWARYADWL FTTPLLLLDL
ALLVDADQGT ILALVGADGI MIGTGLVGAL TKVYSYRFVW WAISTAAMLY
ILYVLFFGFT SKAESMRPEV ASTFKVLRNV TVVLWSAYPV VWLIGSEGAG
IVPLNIETLL FMVLDVSAKV GFGLILLRSR AIFGEAEAPE PSAGDGAAAT
SD Figure 2. List of the amino acid sequence of BR [24].
5
2.2 Electrophoresis Electrophoresis in open tubes as a separation technique was introduced by Tiselius in 1937 and 1948 he was awarded the Nobel Prize for that work [25].
Gel electrophoresis was one of the first electrophoretic techniques used that have a high throughput of analytes in parallel analysis. The drawbacks are that it is time-consuming, laborious and there are difficulties performing quantification in the gel.
It was not until the late 20th century that the technique developed into the version applying narrow capillaries and that the accompanying theory was clarified by Jorgenson and Lukacs [26].
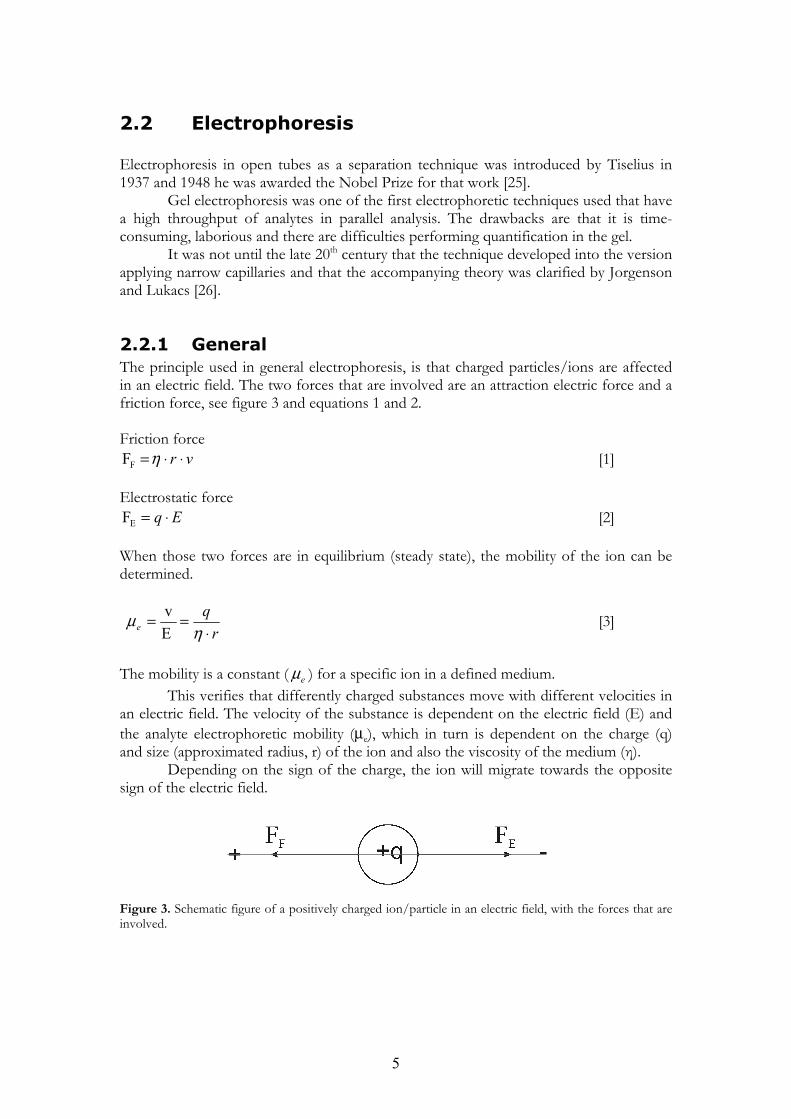
2.2.1 General The principle used in general electrophoresis, is that charged particles/ions are affected in an electric field. The two forces that are involved are an attraction electric force and a friction force, see figure 3 and equations 1 and 2. Friction force
⋅ ⋅= vrη FF [1] Electrostatic force
⋅= Eq FE [2] When those two forces are in equilibrium (steady state), the mobility of the ion can be determined.
⋅
==rq
e ημ
Ev [3]
The mobility is a constant ( eμ ) for a specific ion in a defined medium.
This verifies that differently charged substances move with different velocities in an electric field. The velocity of the substance is dependent on the electric field (E) and the analyte electrophoretic mobility (μe), which in turn is dependent on the charge (q) and size (approximated radius, r) of the ion and also the viscosity of the medium (η).
Depending on the sign of the charge, the ion will migrate towards the opposite sign of the electric field.
Figure 3. Schematic figure of a positively charged ion/particle in an electric field, with the forces that are involved.
6
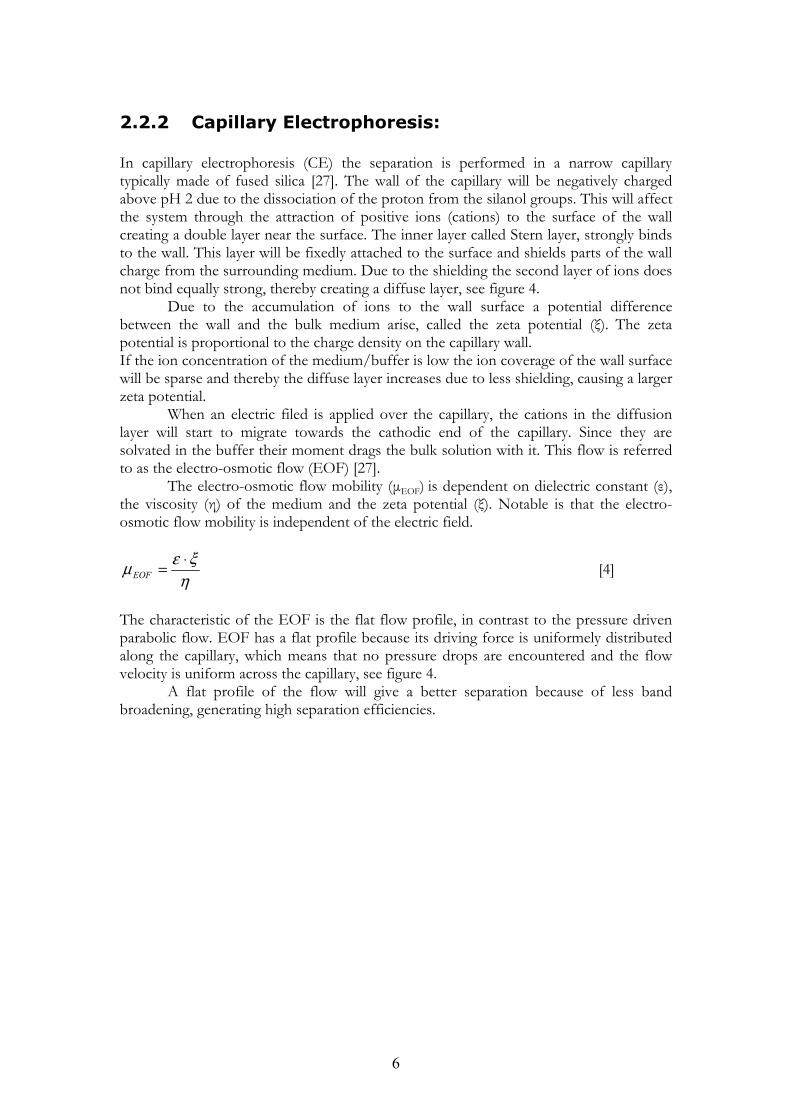
2.2.2 Capillary Electrophoresis: In capillary electrophoresis (CE) the separation is performed in a narrow capillary typically made of fused silica [27]. The wall of the capillary will be negatively charged above pH 2 due to the dissociation of the proton from the silanol groups. This will affect the system through the attraction of positive ions (cations) to the surface of the wall creating a double layer near the surface. The inner layer called Stern layer, strongly binds to the wall. This layer will be fixedly attached to the surface and shields parts of the wall charge from the surrounding medium. Due to the shielding the second layer of ions does not bind equally strong, thereby creating a diffuse layer, see figure 4.
Due to the accumulation of ions to the wall surface a potential difference between the wall and the bulk medium arise, called the zeta potential (ξ). The zeta potential is proportional to the charge density on the capillary wall. If the ion concentration of the medium/buffer is low the ion coverage of the wall surface will be sparse and thereby the diffuse layer increases due to less shielding, causing a larger zeta potential.
When an electric filed is applied over the capillary, the cations in the diffusion layer will start to migrate towards the cathodic end of the capillary. Since they are solvated in the buffer their moment drags the bulk solution with it. This flow is referred to as the electro-osmotic flow (EOF) [27].
The electro-osmotic flow mobility (μEOF) is dependent on dielectric constant (ε), the viscosity (η) of the medium and the zeta potential (ξ). Notable is that the electro-osmotic flow mobility is independent of the electric field.
ηξεμ ⋅=EOF [4]
The characteristic of the EOF is the flat flow profile, in contrast to the pressure driven parabolic flow. EOF has a flat profile because its driving force is uniformely distributed along the capillary, which means that no pressure drops are encountered and the flow velocity is uniform across the capillary, see figure 4.
A flat profile of the flow will give a better separation because of less band broadening, generating high separation efficiencies.

7
Figure 4. Enlarged section of the capillary wall, showing the electro-osmotic flow (EOF) that is created due to that the buffer ions are hydrated and will drag the bulk along, when the diffuse layer are attracted to the cathode. It is also illustrated that the zeta potential is a function of the wall distance. The EOF mobility can be affected by several parameters; one of those is modification of the capillary wall. This can be done by coating the wall, either by a permanent coating bound chemically to the wall or a dynamic coating that interacts with the wall e.g. by the use of surfactants in the buffer. Both methods will modify the charge on the capillary wall. Modification of the wall can also decrease the absorption of analytes to the wall, see below.
The EOF also affects the mobility for analytes and as a consequence the total mobility (μ) of the analytes is the sum of the ion mobility and EOF mobility.
EOFe μμμ += [5] When the mobility is calculated from experimental data equation 6 is used, taking into account the dependence of the effective length of the capillary (l), the total capillary length (L), voltage applied (V) and the migration time (t) for the analyte.
VtLl
⋅⋅=μ [6]
Due to the total mobility separation of oppositely charged ions can be achieved and also enables migration of neutral molecules. Neutral molecules which lack any electrophoretic mobility migrate only with the EOF flow, see figure 5. To determine EOF mobility a neutral substance is used, e.g. mesityloxide.
Figure 5. Schematic figure of the mobility.

8
2.2.3 Surfactants Surfactants are common additives in the CE buffer. Numerous types of surfactants such as anionic, cationic, zwitterionic or non-ionic can be used in CE [28].
At a concentration below the critical micelle concentration (cmc) surfactants can act as solubilization agents for hydrophobic analytes or as a wall modifier. Interactions of the monomer surfactant with the solute can occur via two mechanisms, ionic interactions with the charged head group and hydrophobic interactions with the tails of the surfactants.
In addition to interactions with the solute, many surfactants adsorb to the capillary wall, modifying the wall while limiting potential analyte adsorption. Depending on surfactant charge, EOF can be increased, reduced or reversed.
The EOF can be reversed by using a cationic surfactant that adsorbs to the wall surface by ionic interactions. The positive heads orient towards the wall and the tails towards the bulk medium. By hydrophobic interactions a second surfactant layer is bound with heads pointing outwards, thereby reversing the apparent charge of the wall and the direction of the EOF.
In this thesis the cationic surfactants Didodecyldimethylammonium bromide (DDAB) (Paper II) and fluorosurfactant 134 (FC 134) (Paper I) have been used to reduce the adsorption to the capillary wall and reverse the EOF flow in the CE.’
2.2.4 The CE instrument The typical CE instrumentation includes a capillary, two buffer reservoirs, a sample reservoir, a high voltage supply, pressure system for rinsing of the capillary and a UV-detector, see figure 6.
Figure 6. Schematic figure of a capillary electrophoresis instrument. The dotted arrow indicates injection procedure and D is for detector. The capillary is filled with buffer and an injection is initialized by moving the capillary from the buffer reservoir of the inlet side to the sample reservoir. Four injection techniques can be used, based on the following principles; pressure, vacuum, siphoning or electromigration. The three first are not discriminating due to ion mobility but have the drawback to have parabolic flow profiles, with the risk of creating broad injection

9
bands. For electrokinetic injection the opposite is true; a flat flow profile is accomplished but discrimination due to charge occurs.
After injection, the capillary is moved back to the buffer reservoir and the voltage is applied and the separation takes place according to the principle described earlier and the result is detected.
2.2.5 Capillary Zone Electrophoresis In this thesis the simplest CE mode has been used, that is Capillary Zone Electrophoresis (CZE). In CZE the analytes move through the capillary in distinct zones and the analytes separates due to charge and size [27]. The theory as mention above is strictly followed for this CE mode.

10
2.3 Mass spectrometry (MS) Mass spectrometry (MS) is a powerful tool when an unknown sample is to be investigated and/or identified. It can also be used as a detector for different separation techniques, e.g. capillary electrophoresis as have been done in this thesis.
MS is therefore an invaluable tool in analytical chemistry, especially in biological, clinical chemistry and proteomic studies, in which protein identification is a major task [11, 12, 29]. The mass spectrometer separates ions due to the mass to charge ratio (m/z) and depending of the resolution a more accurate value of the mass can be determined.
It was in the late 19th century that the discoveries were made that lead to the first mass spectrometer constructed by J.J Thomson in 1912 [11, 12]. He obtained mass spectra of O2, N2, CO, CO2 and COCl2 on photo paper, which was the earliest MS detector.
Further developments were made during the later 20th century to improve all parts of the MS; this resulted in several Nobel Prizes e.g. [30], and is still in progress today.
All mass spectrometers consist of a combination of an ion source, a mass analyzer and an ion detector. The ion source’s task is to ionize the sample; there is a high multitude of ion sources that give either high or low fragmentation of the analytes. Two examples of soft ionization techniques are Electrospray Ionization (ESI) and Matrix-Assisted Laser Desorption/Ionization (MALDI) which are both suitable for bioanalytes such as protein and peptides. An advantage of the MALDI technique is that compared with other ionization techniques it is relatively insensitive to contaminations as e.g. salts, buffers and detergents [11].
The choice of mass analyzer should be based upon the actual application and desired performance. Each mass analyzer has specific characteristics and applications and its own benefits and limitations. One mass analyzer often used together with MALDI is time-of-flight (TOF) due to that both techniques are pulse based. In this thesis MALDI –TOF setup has been used for the peptide and protein analysis. A complete MS instrument consists of five fundamental parts (see figure 7).
1. The sample inlet system. 2. The ion source, where the analytes are ionized and brought to gas phase. 3. The mass analyzer, where the analytes are separated according to their m/z. 4. The detector. 5. The software program for data treatment.
The four first parts most often are placed in vacuum.
Figure 7. Schematic setup of a MS instrument.
11
2.3.1 Matrix-assisted laser desorption/ionization (MALDI)
Matrix-assisted laser desorption/ionization (MALDI) is a soft ionization technique utilized for solid phase samples, which can be large analytes such as proteins and peptides. It generates a low degree of fragmentation and mostly produce singly charged ions, which can be an advantage when identifiying unknown samples [11].
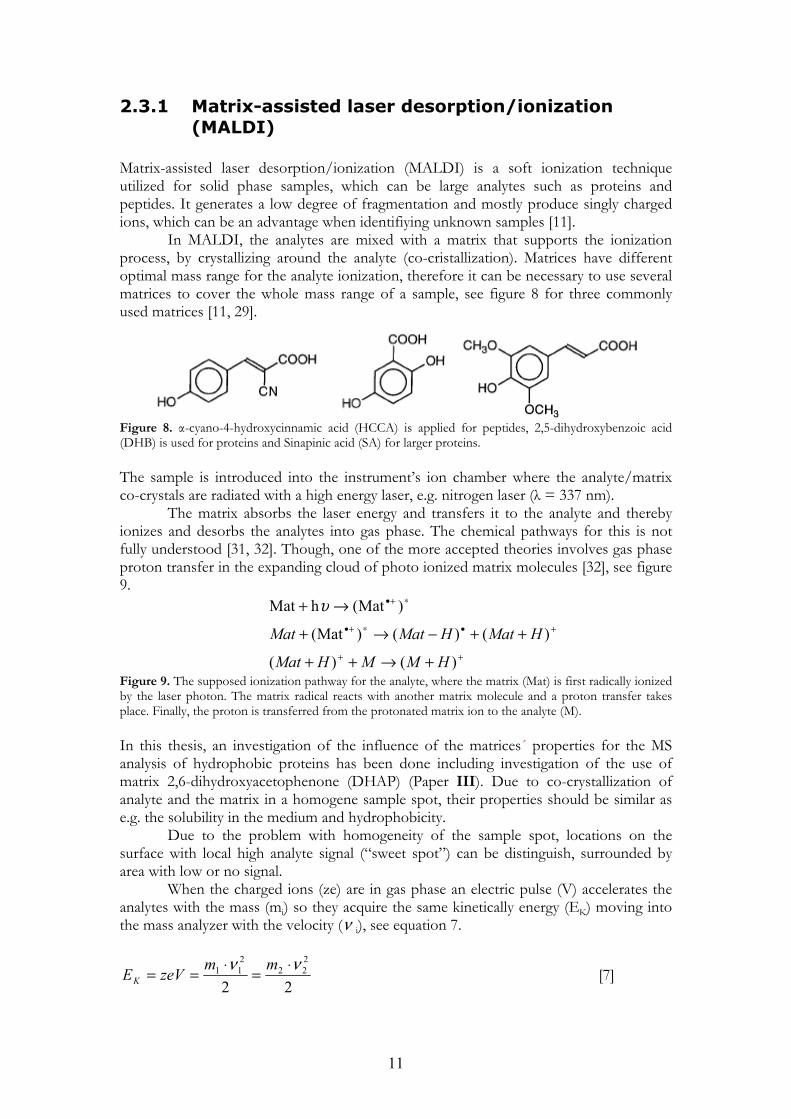
In MALDI, the analytes are mixed with a matrix that supports the ionization process, by crystallizing around the analyte (co-cristallization). Matrices have different optimal mass range for the analyte ionization, therefore it can be necessary to use several matrices to cover the whole mass range of a sample, see figure 8 for three commonly used matrices [11, 29].
Figure 8. α-cyano-4-hydroxycinnamic acid (HCCA) is applied for peptides, 2,5-dihydroxybenzoic acid (DHB) is used for proteins and Sinapinic acid (SA) for larger proteins. The sample is introduced into the instrument’s ion chamber where the analyte/matrix co-crystals are radiated with a high energy laser, e.g. nitrogen laser (λ = 337 nm).
The matrix absorbs the laser energy and transfers it to the analyte and thereby ionizes and desorbs the analytes into gas phase. The chemical pathways for this is not fully understood [31, 32]. Though, one of the more accepted theories involves gas phase proton transfer in the expanding cloud of photo ionized matrix molecules [32], see figure 9.
++
+•∗+•
∗+•
+→++
++−→+
→+
)()(
)()()Mat(
)Mat(hMat
HMMHMat
HMatHMatMat
υ
Figure 9. The supposed ionization pathway for the analyte, where the matrix (Mat) is first radically ionized by the laser photon. The matrix radical reacts with another matrix molecule and a proton transfer takes place. Finally, the proton is transferred from the protonated matrix ion to the analyte (M). In this thesis, an investigation of the influence of the matrices´ properties for the MS analysis of hydrophobic proteins has been done including investigation of the use of matrix 2,6-dihydroxyacetophenone (DHAP) (Paper III). Due to co-crystallization of analyte and the matrix in a homogene sample spot, their properties should be similar as e.g. the solubility in the medium and hydrophobicity.
Due to the problem with homogeneity of the sample spot, locations on the surface with local high analyte signal (“sweet spot”) can be distinguish, surrounded by area with low or no signal.
When the charged ions (ze) are in gas phase an electric pulse (V) accelerates the analytes with the mass (mi) so they acquire the same kinetically energy (EK) moving into the mass analyzer with the velocity (ν i), see equation 7.
22
222
211 νν ⋅
=⋅
==mmzeVEK [7]

12
2.3.1.1 Delayed extraction When analytes with the same m/z ratio are ionized their momentum will not be identical. If the acceleration potential would be continuously turned on, such that the ions are accelerated instantaneously upon being formed, the ions with the same m/z ratio but with different kinetic energy reach the detector at slightly different times, resulting in a peak broadening.
Delayed extraction refers to a delay in the onset of the acceleration potential by a short time after the ionization has occurred. The delay time acts as a focusing element, which will lead to simultaneously detection of the ions, due to more or less acceleration in the ionization chamber [30, 33]. Delayed extraction is often used in MALDI ion sources, due to the focusing effect.
2.3.2 Time of Flight (TOF) The TOF mass analyzer has the advantage that it has no upper limit of the m/z that can be detected; this makes it very suitable for peptide and protein identification [11, 29]. It is also a fast mass analyzer, due to the fact that no electric or magnetic scanning is performed over the mass range that is analyzed. It can be used in a linear or reflector mode (see below). The analyte ions fly in a field-free vacuum in a TOF tube with a defined length (l), and the time (ti) to the detector at the end of the flight tube is recorded for every ion.
ii t
l=ν [8]
Equation 7 demonstrates that for ions with equal charge, light ions will acquire a higher velocity than heavy ions and will thus reach the detector earlier. The m/z can then be determined by rearrangement of equation 7 and insertion of equation 8 to obtain:
2
2
2 22lteVeV
zm i
i
i ⋅==ν
[9]
The full procedure is illustrated in figure 10.

13
Figure 10. The sequence of the MALDI-TOF analysis 1. Ionization with a laser irradiation pulse 2. Acceleration with the potential voltage (V) 3. Separation in the TOF in linear (length of the flight tube, l) or in reflector mode (x denotes the penetration depth in the reflector) 4. Detection of the analyte.
2.3.2.1 Reflector A method to improve the mass resolution in the analyzer is to use an ion mirror, called a reflector. The purpose is to focus the ions of same mass to charge ratio that has a spread in kinetic energy originating from the ionization chamber. The principle is based on that a retarding field is introduced, which sends the ions back through the flight tube. Ions with higher energy will penetrate the reflector more, and thereby spend longer time there than an ion with lower energy of the same mass to charge ratio. As a result, increased resolution is obtained due to the fact that the ions will reach the detector at the same time [30]. The drawback is the loss in sensitivity and limitation in mass range.

14
2.4 CE - MALDI coupling To combine CE with MALDI offers an opportunity to separate and identify analytes with potential for automation and high throughput, by using the benefits from both techniques [34]. Capillary electrophoresis provides low sample volume requirement, fast separation and high resolving power while the soft ionization with MALDI can handle large peptides/proteins with good mass accuracy, good resolution, excellent sensitivity and high throughput capability for straightforward identification.
An advantage in using a separation method before the MS analysis is decreased risk of ion suppression resulting in better MS sensitivity.
When coupling CE and MALDI instruments it can be either in an on-line or off-line mode [35, 36]. For on-line interface methods, where the sample liquid and matrix is directly injected from the CE capillary into the ion chamber of the mass spectrometer, no sample handling is needed. Examples of techniques are aerosol spray liquid introduction [37], continuous flow probe [38] and different version of moving targets in vacuum like a tape [39], rotating boll [40, 41], or quarts well [42]. The drawback is the necessary major rebuilding of the MS instrument.
The off-line technique simplifies the coupling and is built on the principle of gathering the sample directly on a MALDI target plate before introduction into the mass spectrometer [34, 35]. Thereby is the use of an unaltered MS instrument allowed and more flexibility for optimization of each instrument is provided.
It is necessary to close the circuit for the CE during the separation. To do that when combining it with MALDI an electric coupling is needed between the CE capillary and the MALDI target. Several ways of achieving electric couplings for the CE capillary outlet have been presented in the literature for the off–line techniques. Examples are collection of the fractions in prepositioned droplets with matrix on the MALDI target [43] or an electrically connected membrane target [44] and sheath flow coupling to prestructured crystallized targets preceding the fractionation [45]. Other solutions involve simultaneous electrical coupling and matrix deposition through a liquid junction to a second deposition capillary in vacuum with the matrix included in the CE running buffer [46] and sheath flow for fraction collection onto a regular MALDI target plate with the matrix incorporated in the sheath flow liquid [47].
One problem with the fractionation procedure is that the separated peptides are recollected in the fractions and thereby decrease the CE resolution prior to the MALDI analysis. One other way to connect CE to MALDI is through an open microcanal, where the CE is performed in the microcanal, function as MALDI target [48]. Due to the short length of the canal, the CE separation was not optimal though. In section 7, a novel CE-MALDI hyphenation is presented that use the separation efficiency of the capillary combined with the microcanal as a MALDI detection window. Due to the incorporation of the microcanal, the electric coupling is not needed in this setup (Paper II).
In this thesis both fractionation and microcanal techniques have been used. In section 4 the two fabrication procedures for off-line MALDI targets are described.

15
2.5 Concentration effect on the MALDI target If no concentration method would be used at deposition of the sample on the MALDI target, the sample spot would be spread and the concentration per unit area would be low. Thereby more time would be needed for “sweet spot” searching, thus increasing the risk that the signal of the analyte would be below the limit of detection (LOD) [49].
Such problems are reduced or prevented by using a concentrating plate [50]. Several methods have been proposed where the sample spots are concentrated and focused on a specified position, causing decreased surface heterogeneity.
The concentration methods can be divided into three different groups, hydrophilic spots surrounded by a hydrophobic coating e.g. a Bruker Teflon© coated plate [49-53], complete coating of the MALDI target leading to increased contact angel between the sample droplet and target surface [54-56] and deposition of nL to pL sample volumes into nanovials [57, 58].
In section 4.1 a semiautomatic fabrication procedure of a hydrophobic prestructured MALDI target plate is introduced for increased MALDI signal sensitivity.
2.6 Protein digestion One common method for analysis and determination of an unknown protein in proteomics studies is peptide mass finger printing with MS [59]. The general procedure is to cleave the protein into peptides at a specified amino acid with a “cleavage agent”. Due to the specified cleavage, unique patterns of peptides are generated for each protein (mass finger print).
The “cleavage agent” can be a chemical, an enzyme or an acid, resulting in chemical cleavage, enzymatic digestion or acid hydrolysis.
When the protein to be cleaved belongs to the integral membrane protein (IMP) family, it is essential for the “cleavage agent” to reach both the hydrophilic and hydrophobic parts of the protein for the cleavage [60]. This is to avoid discrimination of the cleavage, generating strictly soluble cleaved domains and intact hydrophobic integral regions with low solubility [6]. One other important aspect in the digestion of hydrophobic proteins is to enhance the solubility of the protein with the medium that is used e.g. detergents as octyl-β-D-glucopyranoside OG [61] (Paper III) or organic solvent as HFIP (Paper I) [62].
To improve the digestion, microwave and ultrasonic irradiation [8, 9], and increased temperature can have an accelerating effect on the cleavage of proteins. It may also prevent the proteins from aggregating and can unfold the proteins in order to increase exposure for the “cleavage agent” (Paper III).
To evaluate a cleavage protocol the factors of significance are efficiency, sequence coverage and the time needed for the digestion.
In this work cyanogen bromide digestion (in Paper I and III), trypsin digestion and TFA hydrolysis was used (in Paper III) to cleave BR as a model IMP.

16
3 Fabrication procedures for CE/MALDI off-line interface
3.1 Hydrophobic prestructured MALDI-plate The fabrication of a hydrophobic prestructured plate from a stainless steel MALDI plate is an improvement of the procedure presented by Redeby [49]. The difference in the fabrication procedure here compared to the one by Redeby is the way to apply the glycerol droplets and matrix on the MALDI target plate in order to reduce the sample spot size and to partly automate the manufacturing (Paper I).
To be able to partly automate the system, a manually controlled z-axis was used for the deposition capillary for the glycerol and matrix droplets. The MALDI target plate was positioned on an x-y control table that was programmed to move the plate step by step to the next position for the capillary.
First, the plate was covered with glycerol droplets in several straight lines. Thereafter a hydrophobic layer of silicone PS 255 dissolved in hexane was airbrushed over the glycerol droplet prepared area. The glycerol droplets were removed by rinsing with pure water, revealing bare steel spots surrounded by a hydrophobic silicone film.
The last step was to apply matrix to the sample spots. The whole process is illustrated in figure 11.
When the coating of the plate has been finished it is important to keep the plate in a confined area to avoid dust contamination, which easily sticks to the silicone surface. The cleaning of the MALDI sample plate after use is straightforward.
Figure 11. The conversion of a stainless steel MALDI plate to a hydrophobic prestructured plate. 1. Application of glycerol droplets with a capillary to a regular MALDI target plate 2. Silicone airbrushed over the area 3. After water rinsing, bare steel spots surrounded by a hydrophobic silicon film are revealed 4. Application of Matrix with a capillary on the bare steel spots 5. After use, the plate is washed and a new coating can be performed.

17
3.2 Microcanal Chip The fabrication of the canals was performed with a single photolithography, deep reactive ion etching (DRIE) and oxidation. (Paper II).
The prepared 4-inch, 525-µm thick silicon wafers were cut into chips containing five microcanals in parallel. The design of the manufactured microcanals was: canal width of 50 µm and depth of 43 or 50 µm (before oxidation), the lengths of the canals was 10 or 30 mm with drop-shaped wells at both ends of the microcanals (See figure 12). These wells had diameters of 150 µm and a length of approximately 650 µm.
Before use the chips were cleaned in methanol-water solutions (100:0 to 50:50) in an ultrasonic bath. This was necessary to remove residues of the glue from the saw-tape covering the chip during dicing. The same procedure was used to clean the chip and the canals after use.
Figure 12. Photograph of the chip, with its five microcanals and wells at the ends of each canal.

18
4 Protein cleavage of bacteriorhodopsin
4.1 Cyanogen bromide digestion Cyanogen bromide (CNBr) was used to digest BR, with the method used by Dong [21], with the exception that in one of the digestions the formic acid was substituted to TFA to see if any improvement was achieved due to that (see paper I and III).
CNBr cleaves after the amino acid methionine [63] and BR contains nine of those amino acids. Therefore, after the CNBr cleaving the sample should contain ten peptides, see table 1 [24]. The amino acid sequences in table 1 that are colored are the parts that belong to the 7 transmembrane α-helices, therefore the peptides will be more or less hydrophobic depending on the amino acid sequence. The two larger peptides 6 and 9 have one and a half transmembrane α-helix each contributing to their hydrophobic nature.
The smallest peptide is 4, which only consists of hydrophobic amino acids with a 100 % membrane spanning region. Due to that, these three peptides should be poorly soluble and a challenge to analyze.
Peptides 2 and 7 have a high membrane spanning per cent, but they are rather small compared to 6 and 9.
Peptide Amino acids sequence [M+H]+ pI %Membrane spanning
#1 QAQITGRPEWIWLALGTALM 2207.1971 6.00 50
#2 GLGTLYFLV1KGM 1250.7143 8.59 75
#3 GVSDPDAKKFYAITTLVPAIAFTM 2508.3384 5.96 54
#4 YLSM 465.2344 5.52 100
#5 LL2GYGLTM 819.4611 5.52 25
#6 VPFGGEQNPIYWARYADWLFTTPLLLLD3LALLVDADQGTILALVGADGIM 5397.8448 3.61 60
#7 IGTGLVGAL4TKVYSYRFVWWAISTAAM 2913.5661 9.70 74
#8 LYILYVLFF5GFTSKAESM 2081.0993 6.00 54
#9 RPEVASTFKVLRNVTVVLWSAYPVVWLI6 GSEGAGIVPLNI ETLLFM 5036.8015 6.23 36
#10 VLDVSAKVGFGLIL7LRSRAI FGEAEA PEPSAGDGAAATSD 3958.0555 4.43 35
Table 1. Peptides from BR after CNBr digestion, numbered after chronological order in the protein. Peptide amino acid sequences, mass, pI and % Membrane spanning are listed. The α-helices are colored and the lofty number indicates the α-helix and where it ends.

19
4.2 Trypsin digestion In Paper III the performance of the trypsin action in two different digestion media and the influence of the external environment was studied.
Trypsin cleaves proteins at the carboxyl side of the amino acids lysine and arginine, except when either is followed by proline. The trypsin digestion of BR will thereby theoretically generate thirteen peptides [64, 65].
To evaluate the performance of the trypsin digestion two different media were used, water or OG. The digestion samples were mixtures of BR solution with OG solution or in deionized water. The digestion samples were boiled in a water bath to denature the protein, thereafter trypsin was added. The digestion times used were 30 minutes, two hours and over night in room temperature.
Trypsin digestion was also performed in ultrasonic bath (one and two hours), microwave oven (13, 20 and 30 minutes) and in 50 ˚C water bath (30 and 60 minutes).
4.3 TFA hydrolysis procedure In Paper III the acid hydrolysis of BR with TFA was performed both in a microwave oven (970 W) and in 95˚C water or oil bath.
TFA hydrolysis is a two step process, first TFA cleaves on both sides of the amino acid glycine [66], generating 96 theoretical peptides for BR. After glycine-cleavage the formed peptides can be further digested step by step one amino acid from both C- and N- terminal of the peptide, which generates an increased number of peptides to search for during the MS analysis.
The concentrations of TFA used were 25% and 50% (v/v), for the microwave treatment. The hydrolysis time was 10 minutes at medium or full effect. The acid hydrolysis of BR with TFA was also performed for one and two hours in the 95˚C oil bath with recycling of the solvent.

20
5 CE separation/MALDI-MS analysis of CNBr-digested BR
5.1 CE separation of CNBr-digested BR In Paper I, a capillary electrophoresis separation before MALDI MS detection of hydrophobic peptides is presented, with the CNBr digested hydrophobic protein BR as model sample.
The running buffer used for the CE separation had a pH around 2.5, both to produce positive BR peptides and to improve solubilization. To avoid adsorption and hydrophobic protein interaction with the wall, a floursurfactant (FC) was added to the running buffer creating a dynamic coating [67]. Due to the coating the EOF was reversed and a negative potential had to be applied from the injection side of the capillary.
Three different sample solvents for the BR digest were tested; acetic acid (HAc), Hexafluoroisopropanol (HFIP) and the CE running buffer, to investigate their solubility performance of the BR peptides and their compability with the CE system.
The benefit of the CE running buffer is its compatibility with the CE system, but the complete sample including both peptides and digest salt was dissolved. Because of this the electropherograms of the buffer solublized sample only showed a large peak originating from the salt and therefore no peptide peaks could be detected. This was not the case when using HAc or HFIP for the peptide solubilization, where the digestion salt was insoluble and removed by centrifugation of the samples.
With HAc the resolution of the separation was not optimal due to the severe overlapping of the peaks, but still about seven peaks could be observed. The last broad peak in the electropherogram is assumed to contain the peptides 6 and 9, as confirmed from MS data (see figure 13 A). The best resolution was obtained with HFIP, with 8 visible peaks (see figure 13 B), making this solvent the primary choice for the CE separation. The improved result could be due to stacking affect for HFIP, due to lower conductivity for HFIP than the running buffer [68].
To evaluate the separation resolution obtained for the digested BR sample during the fractionation two fused silica capillary lengths were used. The first capillary length was used for fractionation and, a second longer capillary with an effective length approximately the same as the total length of the first capillary was used to examine the separation obtained at the time of fraction collection for the first capillary, See figure 13 C.

21
Figure 13. CNBr digested BR solved in A) HAc; B) HFIP both separated with the shorter capillary C) HAc, separated with the longer capillary. Two separate BR digests were used for the A, B and C analysis. (See Paper I)
See Paper I, figure 3

22
5.2 Fractionation The equipment that was used during the fraction collection was the same as when the prestructured MALDI-plate was fabricated; see section 4.1 MALDI-plate.
The time when the fraction collection should begin on the MALDI-plate was calculated by velocity measurements from the electropherogram.
With the prestructured MALDI-plate the fractionation was started simply by turning off the voltage and then moving the CE capillary to the start spot. The voltage was switched on simultaneously as the positioning program was started and the whole BR-digest sample was deposited by this fractionation process. To avoid formation of electro spray or air bubbles from the outlet of the capillary, the capillary needs to be positioned as close to the MALDI-plate as possible without touching it.
When HFIP was used as sample solvent for the CE fractionation these problems could not be avoided, a possible explanation could be that HFIP has low electrical conductivity leading to local overheating. That eliminated the use of HFIP for fractionation and MS analysis. Fortunately these problems were not present with HAc as sample solvent. Even more, it has been proven that acid can enhance the MS performance, however the opposite occurs if the acid concentration is too high and degrading of the MS signal [62] can then take place. However, due to the fact that HAc elutes before the peptides in the utilized CE method, the acid degradation of the peptides is no issue when applying fractionation and HAc was therefore chosen as the sample solvent.
5.3 MALDI-TOF analysis of the fractions For MS analysis of the CE fractions containing the BR peptides a MALDI-TOF-MS instrument was used with α-cyano-4-hydroxycinnamic acid (HCCA) as matrix, predeposited as described in section 4.1 (CE-MALDI coupling).
On every CE fraction spot, a number of locations were irradiated by a series of 20 laser pulses. Only the series with peptide signal were added to the spectrum, generating a sum of 100-240 laser shots from each fraction. When all spots were examined, the signal to noise (S/N) for the peptides was evaluated for each fraction.
Out of the 10 theoretical peptides from BR, 9 could be detected by the MALDI-TOF analysis of the CE fractions. The only peptide that could not be detected was peptide 4 that is the smallest and most hydrophobic peptide.
Three peptides were only observed in a modified state. Peptide 10 is without amino acid Aspartic acid (Asp or D) at an m/z to 3845, peptide 8 was detected as sodium adducts at m/z 2104 and peptide 7 was detected at m/z 2950 as doubly oxidized. Those modifications of the peptides are commonly detected with higher intensity than the nonmodified peptides, when analyzing the nonseparated sample. This can be a result of the CNBr digestion procedure and is not unique for the CE-fractionation system [62].
In the CE separation, no systematic succession could be seen according to size, pI; charge or hydrophobicity among the fractions of the nine peptides. One other factor that can affect the selectivity of the peptides is the FC in the CE separation buffer. The use of FC detergent in the CE buffer can affect the MS signal [69], but the degradation of the MALDI-signal of the hydrophobic peptides could not be notably observed.

23
Some of the peptides are detected in several fractions. The S/N acquired from one peptide in sequential fractions, can be rather irregular. This can be a consequence of signal suppression effects, unfavorable crystallization and also the formation of “sweet spots”, which are inherent to MALDI [70-72].
The m/z values corresponding to peptides number 1+O, 1+Na and peptide 10-D, where detected with a gap in the middle of the fraction sequence. The S/N was of the relative same height before and after the gap; thereby contradicting that the analyte would be moved with the capillary from spot to spot i.e. memory effect explanation.
This may indicate that the peptide modification can have occurred prior to and/or during the separation. In addition, similar results were acquired by repeating the analysis.
The compilation of the MALDI spectra of the 48 fractions collected from the CE is illustrated in figure 14 and 15, only the unmodified peptides m/z are illustrated if possible.
Figure 14. Signal to noise values for the peptides 1 to 6, except for peptide 4, for each fraction. The symbols on the curves are the detected value for the fraction.
Figure 15. Signal to noise values for the peptides 7 to 10, for each fraction. Peptide modifications detected were, double oxidation (2ox), sodium adduct formation (+Na) and without aspartic acid (-D), only peptide 9 was unmodified. The symbols on the curves are the detected value for the fraction.
The two larger peptides, peptides 6 and 9 that both contain one and a half hydrophobic alpha helices could be detected. Earlier there have been difficulties to establish stable observation of these in the peptide mixture [62], however peptides 6 and 9 may benefit from a separation due to ion suppression, low solubility and crystallization performance.
24
5.4 Evaluation of the performance of the prestructured MALDI-plate
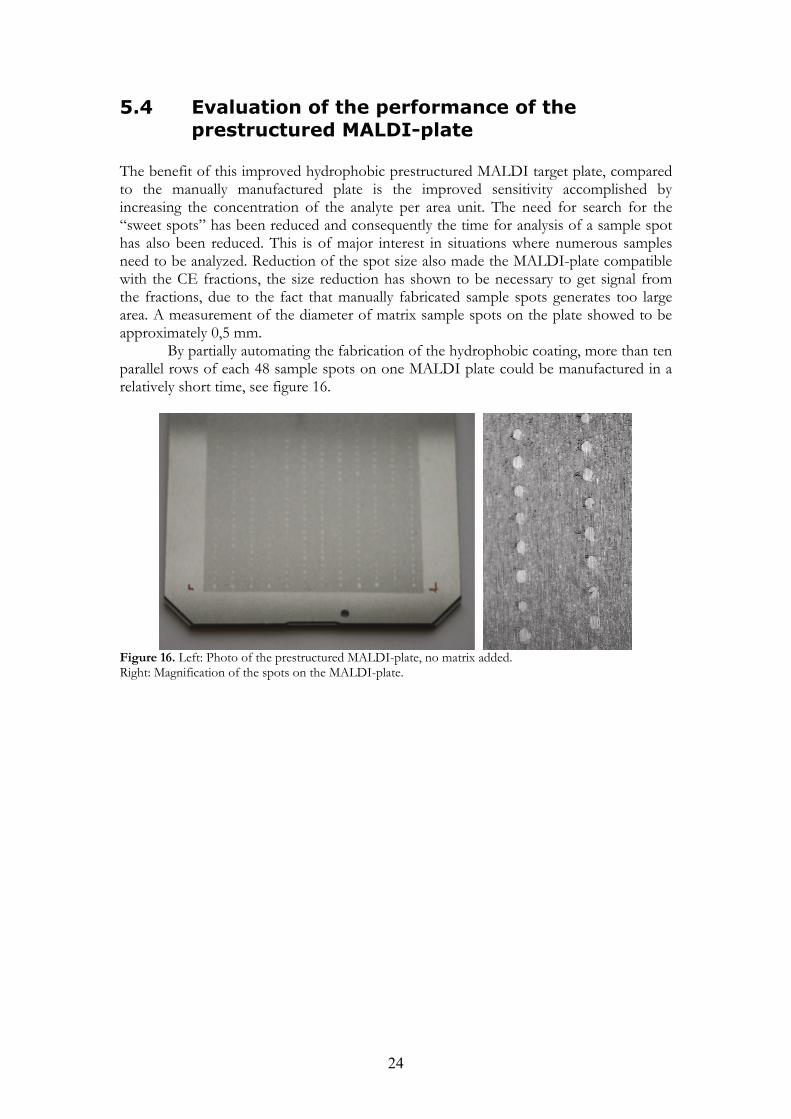
The benefit of this improved hydrophobic prestructured MALDI target plate, compared to the manually manufactured plate is the improved sensitivity accomplished by increasing the concentration of the analyte per area unit. The need for search for the “sweet spots” has been reduced and consequently the time for analysis of a sample spot has also been reduced. This is of major interest in situations where numerous samples need to be analyzed. Reduction of the spot size also made the MALDI-plate compatible with the CE fractions, the size reduction has shown to be necessary to get signal from the fractions, due to the fact that manually fabricated sample spots generates too large area. A measurement of the diameter of matrix sample spots on the plate showed to be approximately 0,5 mm.
By partially automating the fabrication of the hydrophobic coating, more than ten parallel rows of each 48 sample spots on one MALDI plate could be manufactured in a relatively short time, see figure 16.
Figure 16. Left: Photo of the prestructured MALDI-plate, no matrix added. Right: Magnification of the spots on the MALDI-plate.

25
6 Integrated off-line CE/MALDI-MS method
As discussed in section 3.4, a novel off-line CE-MALDI-MS hyphenation, by combining the potentially excellent CE properties of standard fused-silica capillaries with the interfacing possibilities offered by open canal microfluidics, was introduced. In this new method the open CE microcanal serves as a MALDI detection window that is integrated in the CE system.
6.1 Estimation of electroosmotic flow (EOF) in the canals
To maintain a steady EOF is of high importance, in order to determine correctly the time at which the sample reaches the microcanal. An investigation of the EOF created in the canals was therefore performed.
In the first EOF measurements the setup for the CE-chip (50 µm deep microcanal) system was a series coupling of two closed fused silicon capillaries with the microcanal on a silicon chip in the middle, se figure 17. UV-detection was used on the two capillaries. The inlet buffer vial was held at high voltage, while the ground was either connected to the first capillary outlet/microcanal inlet, to the microcanal outlet/second capillary inlet or to the second capillary outlet. Depending on where the ground was set the three systems were termed: closed, closed-open or closed-open-closed system, referring to the CE capillary as closed and the canal as open.
Figure 17. Schematic instrumental setup, consisting of buffer vials, capillaries and the microcanal at the silicon chip. Two UV detectors (Di) could be used in the system. The different high voltage (HV) circuit that was used in the microchannel capillary electrophoresis system were closed (U1-2), closed-open (U1-3) or closed-open-closed (U1-4). The peptide Leucine-enkephalin, neutral in the CE running buffer at pH 5.5, was used as EOF marker, due to the non volatility of this peptide.
To evaluate the characteristics of the EOF in the microcanal the migration time in the closed and closed-open system was compared. The expected relation is
⎟⎟⎠
⎞⎜⎜⎝
⎛⋅⋅
+⋅=1
21LaLa
ttO
CCCO [10]
The symbols a and L, represent the cross-sectional area and the length of capillary (1) and microcanal (2). The prefix C stands for closed system, CO for closed-open system and O for the microcanal. The equation takes into account the difference in cross sectional area, which affects the resistance and thus the voltage division according to ohms law; U=RI.
26
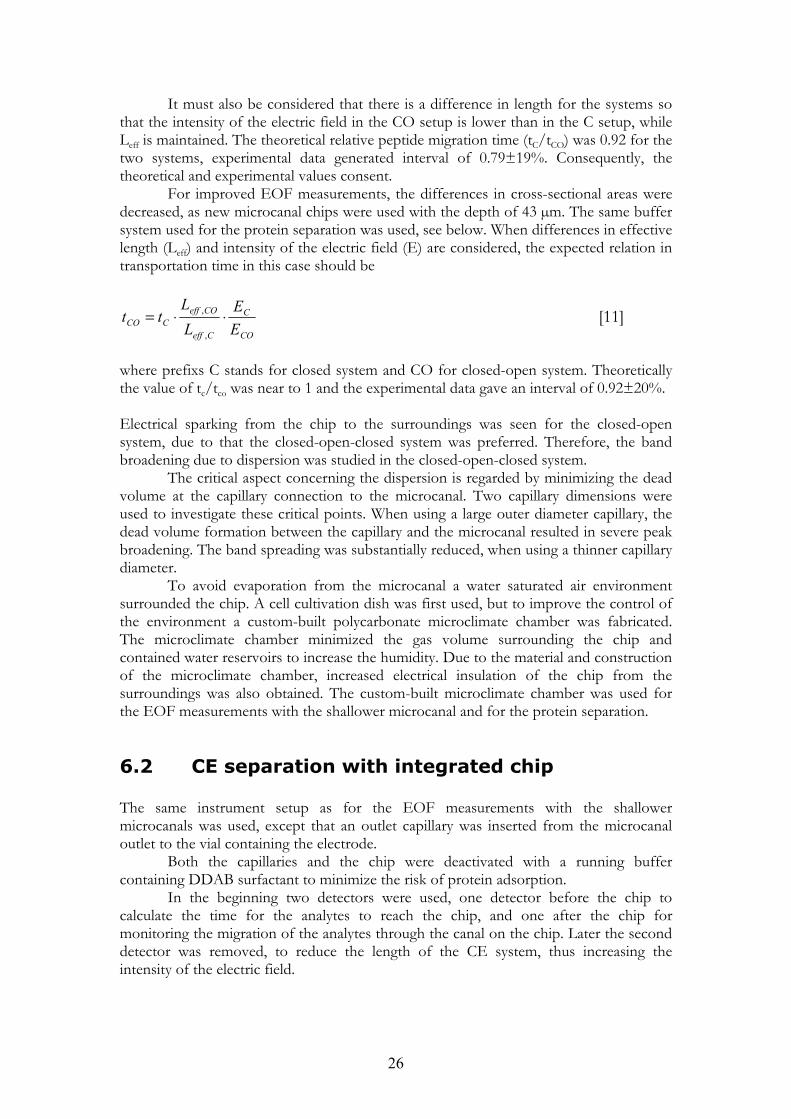
It must also be considered that there is a difference in length for the systems so that the intensity of the electric field in the CO setup is lower than in the C setup, while Leff is maintained. The theoretical relative peptide migration time (tC/tCO) was 0.92 for the two systems, experimental data generated interval of 0.79±19%. Consequently, the theoretical and experimental values consent.
For improved EOF measurements, the differences in cross-sectional areas were decreased, as new microcanal chips were used with the depth of 43 µm. The same buffer system used for the protein separation was used, see below. When differences in effective length (Leff) and intensity of the electric field (E) are considered, the expected relation in transportation time in this case should be
CO
C
Ceff
COeffCCO E
ELL
tt ⋅⋅=,
, [11]
where prefixs C stands for closed system and CO for closed-open system. Theoretically the value of tc/tco was near to 1 and the experimental data gave an interval of 0.92±20%. Electrical sparking from the chip to the surroundings was seen for the closed-open system, due to that the closed-open-closed system was preferred. Therefore, the band broadening due to dispersion was studied in the closed-open-closed system.
The critical aspect concerning the dispersion is regarded by minimizing the dead volume at the capillary connection to the microcanal. Two capillary dimensions were used to investigate these critical points. When using a large outer diameter capillary, the dead volume formation between the capillary and the microcanal resulted in severe peak broadening. The band spreading was substantially reduced, when using a thinner capillary diameter.
To avoid evaporation from the microcanal a water saturated air environment surrounded the chip. A cell cultivation dish was first used, but to improve the control of the environment a custom-built polycarbonate microclimate chamber was fabricated. The microclimate chamber minimized the gas volume surrounding the chip and contained water reservoirs to increase the humidity. Due to the material and construction of the microclimate chamber, increased electrical insulation of the chip from the surroundings was also obtained. The custom-built microclimate chamber was used for the EOF measurements with the shallower microcanal and for the protein separation.
6.2 CE separation with integrated chip The same instrument setup as for the EOF measurements with the shallower microcanals was used, except that an outlet capillary was inserted from the microcanal outlet to the vial containing the electrode.
Both the capillaries and the chip were deactivated with a running buffer containing DDAB surfactant to minimize the risk of protein adsorption.
In the beginning two detectors were used, one detector before the chip to calculate the time for the analytes to reach the chip, and one after the chip for monitoring the migration of the analytes through the canal on the chip. Later the second detector was removed, to reduce the length of the CE system, thus increasing the intensity of the electric field.
27
The separation of Cytochrome c (Cyt C) and Lysozyme (L) is shown in figure 18. The voltage was turned off when the proteins were estimated to be in the canal and the buffer was evaporated, leaving the proteins dried in the canal.
Figure 18. Electropherogram obtained for lysozyme (L) and cytochrome c (Cyt C), detection performed approximately halfway through the capillary.
6.3 MALDI-MS analysis in the canal The DHB matrix was applied after the CE separation, at a concentration of 90 mg/mL to get sufficient cover of matrix crystallisation layer in the entire microcanal.
To minimize dispersion of the proteins due to the “re-solubilization” time for the analyte during the addition of matrix, ethanol was chosen as matrix solvent due to its fast evaporation and spreading in the microcanal. The deposition of the matrix was performed by drawing the matrix liquid solution perpendicularly across the channels [50].
Results from the MALDI-MS analysis are presented in Figure 19 and 20.
Figure 19. Signal distribution in the microcanal for lysozyme (L, solid line, ) and cytochrome c (Cyt C, dashed line, ). The 0th step is at the inlet of the canal.
See Paper II, figure 6
See Paper II, figure 7

28
The signal distribution for lysozyme and cytochrome c over the length of the canal is presented in Figure 19, shots were added up for each millimeter of the 30 mm microcanal, following an electrophoretic separation.
Lysozyme was detected at the end of the canal (eluted first) and Cytochrom c was detected at the inlet of the microcanal (eluted last). Figure 20 display the acquired MS spectra from the microcanal.
Figure 20. Mass spectra from the microcanal of lysozyme (L) and cytochrome c (Cyt C). I. Inlet. II. Further into the microcanal. III. The end of the microcanal. No significant decrease in resolution could be seen between the CE and MALDI results, which are in agreement with the band broadening results obtained for the thinner capillaries.
See Paper II, figure 8

29
7 Matrix and digestion evaluation for hydrophobic peptides/proteins
The BR digestion samples that were used in this part (paper III) were prepared as described in section 5 and the hydrophobically coated prestructured plate described in section 4.1 was used in these analyses.
To evaluate the performance of the trypsin digestion and TFA hydrolysis protocols and the matrix influence on the MS signals, four matrices were used; DHB, HCCA and DHAP (saturated and diluted). Investigation of DHAP matrix properties Investigation of DHAP as a matrix in MALDI for e.g. noncovalent complexes analysis have been performed [73-75].
The DHAP matrix is more hydrophobic than most commercially available matrices, therefore was DHAP investigated for analysis of hydrophobic proteins to see if beneficial effects were generated e.g. as co-crystallization.
The comparison between DHAP and DHB showed a better efficiency for DHAP when detecting BR, see figure 21. However DHB was undoubtedly the better matrix for the hydrophilic proteins. The increase in the signal for BR in DHAP may be due to the higher hydrophobicity of DHAP than DHB, therefore promoting co-cristallization, as described in section 3.3.1
Figure 21. Mass spectra of full-length BR dissolved in HFIP. The upper spectrum belong to DHAP matrix and the lower to DHB matrix.

30
7.1 Tryptic digestion For the tryptic digested samples 10% and 100% acetic acid (HAc), 100% Hexafluoroisopropanol (HFIP) and 0,1% Trifluoroacetic acid (TFA) were used as solvents for the MALDI investigations, in addition to water and OG used as digestion mediums.
The best medium for the trypsin digestion performed in room temperature was the OG solution, when it was used both during the digestion and in the MS analysis. OGs ability to improve solubility of BR is supposed to be the reason.
Studies of the digestion time showed that 2 hours generated the best digestion of BR, while 30 minutes digestion was too short and digestion over night did not increase the performance, rather it decreased the sequence coverage. The decrease in sequence coverage was probably due to protein degradation. The highest sequence coverage (sc) was 80% and accomplished with DHB as matrix. DHAP matrix did not give any successful results together with the OG solutions, though. The explanation for that is unknown.
For improved compatibility with the MS analysis the OG medium was exchanged, but no improvement could be seen for the DHB matrix. Yet, when using the diluted DHAP matrix, a sc of 45% could be seen when the sample was redissolved in 10% HAC.
When using water as medium both in digestion and for MS analysis the DHAP matrix generating a sc of 16%. If the trypsin digestion performed in water was redissolved in HFIP the sc was increased to 56% when analyzed with diluted DHAP.
Higher sc for all matrices were generated when using HFIP as solvent for BR peptides, probably due to that HFIP has better solubility properties for hydrophobic proteins and peptides than water [62]. This also confirms that DHAP shows much better potential when OG addition is avoided.
Digestion in ultrasonic bath, microwave oven and water bath using OG as medium did not give any satisfying results irrespective of the digestion time, probably due to that trypsin activity is not adapted to those environments for cleavage of BR.
7.2 TFA-hydrolysis procedure The best TFA hydrolysis protocol was performed with 50% TFA solution with full effect on the microwave oven generating a sc of 16% of BR. This result was improved when the cleaved peptide sample was redissolved in HFIP or 0.1% TFA, generating sc of 22% and 44% respectively as the best result. Exchange of solvent before MS had the benefit of removing the high acid concentration that probably degraded the signal in the MALDI-MS analysis for the hydrolysis samples.
The hydrolysis performance of BR in 95˚ C did not give any better results than the microwave treatment, even when the solvent was exchanged. The best sc was 21% in 25% TFA solution. Longer hydrolysis times and more concentrated acid decreased the sc, probably due to protein degradation.

31
7.3 CNBr-digestion To evaluate if DHAP offers improved performance as matrix for large hydrophobic peptides as have been suggested by some prior results, the CNBr digestion of BR was used. CNBr generates ten peptides, of which two are large and hydrophobic peptides, see section 5.1, which will serve as indicator peptides for the efficiency of DHAP for highly hydrophobic peptides. As reference matrix DHB was used.
No remarkable difference in digestion was seen when the formic acid in the CNBr digestion was substituted by TFA.
The concentration that generated the best signal for the DHAP matrix was the diluted one (18.75 mg/ml) and therefore all CNBr data were obtained at that concentration. Solubilization methods for the matrix-evaluation investigations of BR peptides in Paper III were done with the solutions; HFIP, 10% HAc and 0.1% TFA.
The best signal of the CNBr peptides was obtained when HFIP was used as solvent, generating a sc of 98% with DHAP as matrix. Only the most hydrophobic and smallest peptide could not be detected (number 4), but of higher interest was that the largest hydrophobic peptides were detected (number 6 and 9). When the sample solvent was exchanged to 0.1% TFA or 10% HAc the sc was decreased to around 60%, and even more important the signal of the peptide 6 and 9 disappeared.
The opposite was observed for DHB, when increased presence of acid promoted the MS signal for the peptides 6 and 9 and also the overall sc. With 10%HAc all peptides except number 4 were detected, although the signal intensity was lower than with DHAP. Acidic matrix media have proven to generate a positive effect for the signal intensity when the conventional matrices DHB [62] and HCCA [76] are used.
The increase in the signal for the large and highly hydrophobic peptides dissolved in HFIP analyzed with DHAP may be due to the higher hydrophobicity of DHAP compared to DHB, therefore promoting co-crystallization and reduced discrimination for larger and hydrophobic peptides.

32
8 Potential matrices for full-length proteins
Nine potential new MALDI matrices were explored for full-length proteins. A “preselected spot” method was used for the full-length protein analysis, to avoid influence of crystallization effects such as “sweet spots” (Paper III).
Only two of the nine new substances tested for MALDI matrix properties for intact proteins showed to have any capacity as matrix; 2-hydroxy-3-methoxybenzoic acid (2H3MBA) and 2-hydroxy-5-methoxybenzoic acid (2H5MBA). An explanation for the performance of these matrices could be that both substances are ortho-hydroxy isomers like DHB [77].
When using those substances as matrices alone their performance was far below the one of DHBs for standard proteins including BR. 2H3MBA showed a better potential than 2H5MBA, although 2H5MBA have been used as earlier additive to DHB (super DHB) [78] to improve the sensitivity [78, 79]. Due to that, 2H3MBA was tested as an additive to DHB and compared with super DHB and pure DHB.
The performance was sample dependent for the different matrices. The matrix mixture 2H3MBA/DHB generated signal in all positions for BSA, generating the highest signal, and highest average S/N. For the hydrophobic BR protein the mixture of 2H5MBA/DHB produced the highest average S/N value and for the pure DHB, this resulted in the best S/N average for Cyt C.

33
9 Conclusions and future outlooks
In this thesis, improved techniques for protein and peptide analysis have been presented using CE and MALDI. Primarily, focus has been on hydrophobic proteins and peptides. A protein family of interest is the IMP proteins due to their many functions in the cell. However they are difficult to study due to aggregation, adherence to surfaces and solubility problems. In this work, BR was used as a model IMP protein.
Investigations of different cleavage protocols for BR have been evaluated, where tryptic digestion was improved by the use of OG as solubilization agent during the digestion. The exchange of media to HFIP before MALDI-MS could be a benefit in some cases. However, no improvement was seen for the trypsin digestion when using ultrasonic bath, microwave oven or increased temperature treatment. The TFA hydrolysis can be used as a fast and simple cleaving procedure although a relatively low sc is generated. Optimal results were achieved with high micro wave oven effect, concentrated TFA solution and exchange to HFIP for the MS analysis.
To get a high-quality CE-MS analysis method, several different stages have to be optimized, from the separation, sample transfer, ionization and at last detection in the MS. In this thesis the off-line MS mode has been used in the form of fractionation or by incorporating the MALDI target in the CE separation system.
An improved protocol for partially automated manufacturing of a concentration MALDI-target was established. The design of the target was suitable for the fractions from the CE, and was used to separate the IMP BR peptides.
The fractions were analyzed by MS and 9 of 10 CNBr digested BR peptides were detected (sc of 98%) when solubilized with HAc. The FC used in the CE as dynamic coating to avoid analyte wall interaction did not observably interfere with the MALDI signal. A future development of the fabrication is under investigation to further decrease the sample spots and “size distribution” with a totally automated system, thereby probably promoting a general increase in S/N and a more even signal over the spot surface and between the fractions. One other way for deposition of sample, to avoid the resolution drawback of the recollection during the fractionation process, is to continuously deposit the sample in a narrow straight line on a precoated matrix target [44].
A novel technique for the off-line integration of CE and MALDI was presented with a closed-open-closed system, where the open part was a microcanal functioning as a MALDI target window. By incorporating the MALDI target in the CE system the electrocoupling and sample handling are avoided and the separation resolution is in principle maintained in the microcanal compared to when collecting fractions.
Control of the evaporation from the open microcanal proved to be critical for the function of the system. Therefore a custom-built polycarbonate microclimate chamber was fabricated which also had the property to insulate the chip.
Investigation of the EOF and band broadening properties of the microcanal was performed, showing that a properly designed coupling between the capillary and chip is essential for minimizing the band broadening. Further was MALDI-MS detection performed in the microcanal after CE separation of two proteins.
To further decrease the band spreading and consequently improve the resolution a new design of the chip is needed, where the size of the wells are reduced. One idea is to connect the CE capillaries to suitable wells to the backside of the chip, which is connected to the canal above the chip. One other idea is connecting the capillaries at the ends of the canal, along the canal axis.

34
Some improvement could also be necessary for the matrix deposition through use of different solvents in some cases.
DHAP showed to have promising matrix properties for hydrophobic proteins and peptides. The overall better matrix was DHB for the trypsin digested samples, but its performance for the larger and hydrophobic peptides was not optimal. Consequently, DHAP can be used as a complement for improved analysis of this type of peptides.
Two new substances tested for MALDI matrix properties, showed to have capacity as matrix; 2H3MBA and 2H5MBA. These were used as additives to DHB and their performance was evaluated by comparing to pure DHB. Their performance was sample dependent, due to e.g. the size of the protein investigated.

35
10 Abbreviations
Asp Aspartic acid
BSA Bovine serum albumin
BR Bacteriorhodopsin
C Closed system
CE Capillary electrophoresis
cmc Critical micelle concentration
CNBr Cyanogen bromide
CO Closed-open system.
C-O-C Closed-open-closed system
CytC Cytochrom C
CZE Capillary Zone Electrophoresis
D Aspartic acid
Da Daltons
DHAP 2,6-dihydroxyacetophenone
DDAB Didodecyldimethylammonium bromide
DHB 2,5-dihydroxybenzoic acid
DNA Deoxyribonucleic acid
DRIE Deep reactive ion etching
EOF Electro-osmotic flow
ESI Electrospray Ionization
FC Floursurfactant
HAc Acetic acid
HCCA α-cyano-4-hydroxycinnamic acid
HFIP Hexafluoroisopropanol
id Inner diameter
IMP Integral membrane protein
L Lysozyme
LOD Limit of detection
MALDI Matrix-assisted laser desorption/ionization
mRNA Messenger Ribonucleic Acid
MS Mass spectrometry
m/z Mass to charge ratio

36
O Open system (The microcanal)
od Outer diameter
OG Octyl-β-D-glucopyranoside
pI Isoelectric point
SA Sinapinic acid
sc Sequence coverage
S/N Signal to noise
TFA Trifluoroacetic acid
TOF Time-of-flight
2H3MBA 2-Hydroxy-3-methoxybenzoic acid
2H5MBA 2-Hydroxy-5-methoxybenzoic acid

37
11 Symbols
a Cross-sectional area
ε Dielectric constant
e Electron charge
E Electric field
EK Kinetic energy
l Effective capillary length
l Length of the flight tube
L Total capillary length
L1 Length of capillary (Section 6.1)
L2 length of microcanal (Section 6.1)
mi Ion mass
q Ion charge
r Ion radius
t Migration time
tC Migration time for the closed system
tCO Migration time for the closed-open system
ti Time of flight in the tube
v Velocity
ν i Ion velocity
V Voltage
z Number of ion charge
η Solution viscosity
μ Total mobility
μe Electrophoretic mobility
μEOF EOF mobility
ζ Zeta potentials

38
12 Acknowledgement I would like to express my gratitude to my supervisors Åsa Emmer and Therese Redeby for all support and guidance from the beginning to the end of this work. I would like to thank my family and friends. Thanks for the help, support and good times from all collages former and current, at the division of analytical chemistry. I want also thank the co-authors of the publications, Karin Hellborg, Lisa Skedung, Thomas Frisk, Varun Parmar, Wouter van der Wijngaart, Göran Stemme. Thanks to Swedish Research Council and the Nanochemistry program, founded by the Swedish Foundation for Strategic Research are acknowledged for financial support to have made this thesis possible.

39
13 References
1. Strayer Lubert, B.j.M., Tymoczko J.L, Biochemistry. Vol. 5th Edition. 2002. p: 781-810 and p: 813-843.
2. Blonder, J., et al., Enrichment of integral membrane proteins for proteomic analysis using liquid chromatography-tandem mass spectrometry. Journal of Proteome Research, 2002. 1(4): p. 351-360.
3. Lander, E.S., et al., Initial sequencing and analysis of the human genome. Nature, 2001. 409(6822): p. 860-921.
4. Speers, A.E. and C.C. Wu, Proteomics of integral membrane proteins-theory and application. Chemical Reviews, 2007. 107(8): p. 3687-3714.
5. Santoni, V., M. Molloy, and T. Rabilloud, Membrane proteins and proteomics: Un amour impossible? Electrophoresis, 2000. 21(6): p. 1054-1070.
6. Wu, C.C. and J.R. Yates, The application of mass spectrometry to membrane proteomics. Nature Biotechnology, 2003. 21(3): p. 262-267.
7. Russell, W.K., Z.Y. Park, and D.H. Russell, Proteolysis in mixed organic-aqueous solvent systems: Applications for peptide mass mapping using mass spectrometry. Analytical Chemistry, 2001. 73(11): p. 2682-2685.
8. Lopez-Ferrer, D., J.L. Capelo, and J. Vazquez, Ultra fast trypsin digestion of proteins by high intensity focused ultrasound. Journal of Proteome Research, 2005. 4(5): p. 1569-1574.
9. Lin, S.S., et al., Microwalve-assisted enzyme-catalyzed reactions in various solvent systems. Journal of the American Society for Mass Spectrometry, 2005. 16(4): p. 581-588.
10. Park, Z.Y. and D.H. Russell, Thermal denaturation: A useful technique in peptide mass mapping. Analytical Chemistry, 2000. 72(11): p. 2667-2670.
11. Mano, N. and J. Goto, Biomedical and biological mass spectrometry. Analytical Sciences, 2003. 19(1): p. 3-14.
12. Finehout, E.J. and K.H. Lee, An introduction to mass spectrometry applications in biological research. Biochemistry and Molecular Biology Education, 2004. 32(2): p. 93-100.
13. Wollman, F.A., L. Minai, and R. Nechushtai, The biogenesis and assembly of photosynthetic proteins in thylakoid membranes. Biochimica Et Biophysica Acta-Bioenergetics, 1999. 1411(1): p. 21-85.
14. Gether, U., Uncovering molecular mechanisms involved in activation of G protein-coupled receptors. Endocrine Reviews, 2000. 21(1): p. 90-113.
15. Armitage, J.P., Bacterial Motility and Chemotaxis. 1992. p. 451-477. 16. BeckSickinger, A.G., Structural characterization and binding sites of G-protein-coupled
receptors. Drug Discovery Today, 1996. 1(12): p. 502-513. 17. Gillespie, P.G. and R.G. Walker, Molecular basis of mechanosensory transduction.
Nature, 2001. 413(6852): p. 194-202. 18. Denac, H., M. Mevissen, and G. Scholtysik, Structure, function and pharmacology of
voltage-gated sodium channels. Naunyn-Schmiedebergs Archives of Pharmacology, 2000. 362(6): p. 453-479.
19. Ratnala, V.R.P., New tools for G-protein coupled receptor (GPCR) drug discovery: combination of baculoviral expression system and solid state NMR. Biotechnology Letters, 2006. 28(11): p. 767-778.
20. Lanyi, J.K., Mechanism of ion transport across membranes - Bacteriorhodopsin as a prototype for proton pumps. Journal of Biological Chemistry, 1997. 272(50): p. 31209-31212.
40
21. Dong, M.Q., et al., Hydrophobic peptide mapping of clinically relevant heptahelical membrane proteins by capillary electrophoresis. Electrophoresis, 1997. 18(10): p. 1767-1774.
22. ExPasy, Prosite. 2005. 20050218: p. http://www.expasy.org/prosite/. 23. Lanyi, J.K., Bacteriorhodopsin. Biochimica Et Biophysica Acta-Bioenergetics, 2000.
1460(1): p. 1-3. 24. ExPasy, Peptide Mass. 2005. 20050218: p. http://www.expasy.org/tools/peptide-
mass.html. 25. nobelprize.org, "for his research on electrophoresis and adsorption analysis, especially for his
discoveries concerning the complex nature of the serum proteins". 1948: p. http://nobelprize.org/nobel_prizes/chemistry/laureates/1948/index.html.
26. Jorgenson, J.W. and K.D. Lukacs, Zone Electrophoresis in Open-Tubular Glass-Capillaries. Analytical Chemistry, 1981. 53(8): p. 1298-1302.
27. Kok, W.T., Capillary electrophoresis: Instrumentation and operation. Chromatographia, 2000. 51: p. S5-S89.
28. Doherty, E.A.S., et al., Microchannel wall coatings for protein separations by capillary and chip electrophoresis. Electrophoresis, 2003. 24(1-2): p. 34-54.
29. Marvin, L.F., M.A. Roberts, and L.B. Fay, Matrix-assisted laser desorption/ionization time-of-flight mass spectrometry in clinical chemistry. Clinica Chimica Acta, 2003. 337(1-2): p. 11-21.
30. Tanaka, K., The origin of macromolecule ionization by laser irradiation (Nobel lecture). Angewandte Chemie-International Edition, 2003. 42(33): p. 3860-3870.
31. Karas, M. and R. Kruger, Ion formation in MALDI: The cluster ionization mechanism. Chemical Reviews, 2003. 103(2): p. 427-439.
32. Zenobi, R. and R. Knochenmuss, Ion formation in MALDI mass spectrometry. Mass Spectrometry Reviews, 1998. 17(5): p. 337-366.
33. Vestal, M.L., P. Juhasz, and S.A. Martin, Delayed Extraction Matrix-Assisted Laser-Desorption Time-of-Flight Mass-Spectrometry. Rapid Communications in Mass Spectrometry, 1995. 9(11): p. 1044-1050.
34. Stutz, H., Advances in the analysis of proteins and peptides by capillary electrophoresis with matrix-assisted laser desorption/ionization and electrospray-mass spectrometry detection. Electrophoresis, 2005. 26(7-8): p. 1254-1290.
35. Monton, M.R.N. and S. Terabe, Recent developments in capillary electrophoresis-mass spectrometry of proteins and peptides. Analytical Sciences, 2005. 21(1): p. 5-13.
36. Gusev, A.I., Interfacing matrix-assisted laser desorption/ionization mass spectrometry with column and planar separations. Fresenius Journal of Analytical Chemistry, 2000. 366(6-7): p. 691-700.
37. Murray, K.K. and D.H. Russell, Liquid Sample Introduction for Matrix-Assisted Laser-Desorption Ionization. Analytical Chemistry, 1993. 65(18): p. 2534-2537.
38. Li, L., A.P.L. Wang, and L.D. Coulson, Continuous-Flow Matrix-Assisted Laser Desorption Ionization Mass-Spectrometry. Analytical Chemistry, 1993. 65(4): p. 493-495.
39. Preisler, J., et al., Capillary array electrophoresis-MALDI mass spectrometry using a vacuum deposition interface. Analytical Chemistry, 2002. 74(1): p. 17-25.
40. Musyimi, H.K., et al., Online CE-MALDI-TOF MS using a rotating ball interface. Analytical Chemistry, 2004. 76(19): p. 5968-5973.
41. Orsnes, H., et al., Rotating ball inlet for continuous mass spectrometric monitoring of aqueous solutions. Rapid Communications in Mass Spectrometry, 1998. 12(1): p. 11-14.
42. Preisler, J., F. Foret, and B.L. Karger, On-line MALDI-TOF MS using a continuous vacuum deposition interface. Analytical Chemistry, 1998. 70(24): p. 5278-5287.

41
43. Lin, C.Y., et al., Capillary gel electrophoresis: separation of major erythrocyte membrane proteins. Journal of Chromatography B, 2000. 742(2): p. 411-419.
44. Zhang, H.Y. and R.M. Caprioli, Capillary electrophoresis combined with matrix-assisted laser desorption/ionization mass spectrometry; Continuous sample deposition on a matrix-precoated membrane target. Journal of Mass Spectrometry, 1996. 31(9): p. 1039-1046.
45. Johnson, T., et al., A CE-MALDI interface based on the use of prestructured sample supports. Analytical Chemistry, 2001. 73(8): p. 1670-1675.
46. Rejtar, T., et al., Off-line coupling of high-resolution capillary electrophoresis to MALDI-TOF and TOF/TOF MS. Journal of Proteome Research, 2002. 1(2): p. 171-179.
47. Vanveelen, P.A., et al., Off-Line Coupling of Capillary Electrophoresis with Matrix-Assisted Laser-Desorption Mass-Spectrometry. Journal of Chromatography, 1993. 647(2): p. 367-374.
48. Liu, J., et al., Electrophoresis separation in open microchannels. A method for coupling electrophoresis with MALDI-MS. Analytical Chemistry, 2001. 73(9): p. 2147-2151.
49. Redeby, T., J. Roeraade, and A. Emmer, Simple fabrication of a structured matrix-assisted laser desorption/ionization target coating for increased sensitivity in mass spectrometric analysis of membrane proteins. Rapid Communications in Mass Spectrometry, 2004. 18(10): p. 1161-1166.
50. Nordhoff, E., et al., Sample preparation protocols for MALDI-MS of peptides and oligonucleotides using prestructured sample supports. International Journal of Mass Spectrometry, 2003. 226(1): p. 163-180.
51. Schuerenbeg, M., et al., Prestructured MALDI-MS sample supports. Analytical Chemistry, 2000. 72(15): p. 3436-3442.
52. Xu, Y.D., M.L. Bruening, and J.T. Watson, Non-specific, on-probe cleanup methods for MALDI-MS samples. Mass Spectrometry Reviews, 2003. 22(6): p. 429-440.
53. Xu, Y.D., J.T. Watson, and M.L. Bruening, Patterned monolayer/polymer films for analysis of dilute or salt-contaminated protein samples by MALDI-MS. Analytical Chemistry, 2003. 75(2): p. 185-190.
54. Owen, S.J., et al., Increasing sensitivity and decreasing spot size using an inexpensive, removable hydrophobic coating for matrix-assisted laser desorption/ionisation plates. Rapid Communications in Mass Spectrometry, 2003. 17(21): p. 2439-2449.
55. Yuan, X.L. and D.M. Desiderio, Protein identification with Teflon as matrix-assisted laser desorption/ionization sample support. Journal of Mass Spectrometry, 2002. 37(5): p. 512-524.
56. Konig, S. and J. Grote, Hydrophobic targets for MALDI mass spectrometry. Biotechniques, 2002. 32(4): p. 912-+.
57. Ekstrom, S., et al., Signal amplification using "spot on-a-chip" technology for the identification of proteins via MALDI-TOF MS. Analytical Chemistry, 2001. 73(2): p. 214-219.
58. Marko-Varga, G., et al., Disposable polymeric high-density nanovial arrays for matrix assisted laser desorption/ionization-time of flight-mass spectrometry: I. Microstructure development and manufacturing. Electrophoresis, 2001. 22(18): p. 3978-3983.
59. Whitelegge, J.P., Thylakoid membrane proteomics. Photosynthesis Research, 2003. 78(3): p. 265-277.
60. Barnidge, D.R., et al., Identification of transmembrane tryptic peptides of rhodopsin using matrix-assisted laser desorption/ionization time-of-flight mass spectrometry. Protein Science, 1997. 6(4): p. 816-824.
61. Quach, T.T.T., et al., Development and applications of in-gel CNBr/tryptic digestion combined with mass spectrometry for the analysis of membrane proteins. Journal of Proteome Research, 2003. 2(5): p. 543-552.

42
62. Redeby, T. and Å. Emmer, Membrane protein and peptide sample handling for MS analysis using a structured MALDI target. Analytical and Bioanalytical Chemistry, 2005. 381(1): p. 225-235.
63. Kraft, P., J. Mills, and E. Dratz, Mass spectrometric analysis of cyanogen bromide fragments of integral membrane proteins at the picomole level: Application to rhodopsin. Analytical Biochemistry, 2001. 292(1): p. 76-86.
64. Blonder, J., et al., A detergent- and cyanogen bromide-free method for integral membrane proteomics: Application to Halobacterium purple membranes and the human epidermal membrane proteome. Proteomics, 2004. 4(1): p. 31-45.
65. Han, J. and K.L. Schey, Proteolysis and mass spectrometric analysis of an integral membrane: Aquaporin 0. Journal of Proteome Research, 2004. 3(4): p. 807-812.
66. Zhong, H.Y., S.L. Marcus, and L. Li, Microwave-assisted acid hydrolysis of proteins combined with liquid chromatography MALDI MS/MS for protein identification. Journal of the American Society for Mass Spectrometry, 2005. 16(4): p. 471-481.
67. Emmer, A., M. Jansson, and J. Roeraade, Improved Capillary Zone Electrophoretic Separation of Basic-Proteins, Using a Fluorosurfactant Buffer Additive. Journal of Chromatography, 1991. 547(1-2): p. 544-550.
68. Shihabi, Z.K., Stacking in capillary zone electrophoresis. Journal of Chromatography A, 2000. 902(1): p. 107-117.
69. Rosinke, B., et al., Matrix-Assisted Laser Desorption/Ionization Mass-Spectrometry (Maldi-Ms) of Membrane-Proteins and Noncovalent Complexes. Journal of Mass Spectrometry, 1995. 30(10): p. 1462-1468.
70. Wang, M.Z. and M.C. Fitzgerald, A solid sample preparation method that reduces signal suppression effects in the MALDI analysis of peptides. Analytical Chemistry, 2001. 73(3): p. 625-631.
71. Bucknall, M., K.Y.C. Fung, and M.W. Duncan, Practical quantitative biomedical applications of MALDI-TOF mass spectrometry. Journal of the American Society for Mass Spectrometry, 2002. 13(9): p. 1015-1027.
72. Baumgart, S., et al., The contributions of specific amino acid side chains to signal intensities of peptides in matrix-assisted laser desorption/ionization mass spectrometry. Rapid Communications in Mass Spectrometry, 2004. 18(8): p. 863-868.
73. Moniatte, M., et al., Matrix-assisted laser desorption-ionization time-of-flight mass spectrometry in the subunit stoichiometry study of high-mass non-covalent complexes. International Journal of Mass Spectrometry, 1997. 169: p. 179-199.
74. Zehl, M. and G. Allmaier, Instrumental parameters in the MALDI-TOF mass spectrometric analysis of quaternary protein structures. Analytical Chemistry, 2005. 77(1): p. 103-110.
75. Zehl, M. and G. Allmaier, Ultraviolet matrix-assisted laser desorption/ionization time-of-flight mass spectrometry of intact hemoglobin complex from whole human blood. Rapid Communications in Mass Spectrometry, 2004. 18(17): p. 1932-1938.
76. Cohen, S.L. and B.T. Chait, Influence of matrix solution conditions on the MALDI-MS analysis of peptides and proteins. Analytical Chemistry, 1996. 68(1): p. 31-37.
77. Krause, J., M. Stoeckli, and U.P. Schlunegger, Studies on the selection of new matrices for ultraviolet matrix-assisted laser desorption/ionization time-of-flight mass spectrometry. Rapid Communications in Mass Spectrometry, 1996. 10(15): p. 1927-1933.
78. Karas, M., et al., Matrix-Assisted Laser-Desorption Ionization Mass-Spectrometry with Additives to 2,5-Dihydroxybenzoic Acid. Organic Mass Spectrometry, 1993. 28(12): p. 1476-1481.
79. Bashir, S., et al., Parameterising matrix-assisted laser desorption/ionisation (MALDI): strategy for matrix-analyte selection and effect of radical co-additives on analyte peak intensities. Analytica Chimica Acta, 2004. 519(2): p. 181-187.