in vivo monitoring of plant small gtpase activation … universiti, bandar barat, 31900 kampar,...
TRANSCRIPT

1
In vivo monitoring of plant small GTPase activation using a Förster resonance
energy transfer biosensor
Short title: In vivo monitoring of plant small GTPase by FRET
Hann Ling Wong1, 2, $, Akira Akamatsu1, 3, $, Qiong Wang4, $, Masayuki Higuchi1,
Tomonori Matsuda1, Jun Okuda1, Ken-ichi Kosami4, Noriko Inada5, 6, Tsutomu
Kawasaki1, 7, Shingo Nagawa8, Li Tan 8, Yoji Kawano1, 4, 9, *, and Ko Shimamoto1, $
1 Laboratory of Plant Molecular Genetics, Graduate School of Biological Sciences, Nara
Institute of Science and Technology, 8916-5 Takayama, Ikoma, Nara 630-0192, Japan 2 Present address: Department of Biological Science, University Tunku Abdul Rahman,
Jalan Universiti, Bandar Barat, 31900 Kampar, Perak, Malaysia 3 Present address: Cell and Developmental Biology, John Innes Centre, Norwich NR4
7UH, United Kingdom 4 Present address: Shanghai Center for Plant Stress Biology, Chinese Academy of
Sciences, No. 3888 Chenhua Road, Shanghai 201602, China 5 Plant Global Education Project, Nara Institute of Science and Technology, 8916-5
Takayama, Ikoma, Nara 630-0192, Japan 6 Present address: Laboratory of Plant Growth Regulation, Graduate School of
Biological Sciences, Nara Institute of Science and Technology, 8916-5 Takayama,
Ikoma, Nara 630-0192, Japan
7 Present address: Department of Advanced Bioscience, Kinki University, 3327-204
Nakamachi, Nara 631-8505, Japan 8 Core Facility of Cell biology, Shanghai Center for Plant Stress Biology, Shanghai, No.
3888 Chenhua Road, Shanghai 201602, China
.CC-BY-ND 4.0 International licenseIt is made available under a (which was not peer-reviewed) is the author/funder, who has granted bioRxiv a license to display the preprint in perpetuity.
The copyright holder for this preprint. http://dx.doi.org/10.1101/249938doi: bioRxiv preprint first posted online Jan. 18, 2018;
2
9 Kihara Institute for Biological Research, Yokohama City University, 641-12 Maioka,
Totsuka, Yokohama, Kanagawa 244-0813, Japan
$ These authors equally contributed to this work.
*Correspondence: Yoji Kawano
Shanghai Center for Plant Stress Biology
Chinese Academy of Sciences
No. 3888 Chenhua Road, Shanghai 201602, China
Tel: (+86) 21-5707-8279
E-mail: [email protected]
.CC-BY-ND 4.0 International licenseIt is made available under a (which was not peer-reviewed) is the author/funder, who has granted bioRxiv a license to display the preprint in perpetuity.
The copyright holder for this preprint. http://dx.doi.org/10.1101/249938doi: bioRxiv preprint first posted online Jan. 18, 2018;

3
ABSTRACT
Small GTPases act as molecular switches that regulate various plant responses such as
disease resistance, pollen tube growth, root hair development, cell wall patterning and
hormone responses. Thus, to monitor their activation status within plant cells is believed
to be the key step in understanding their roles. We have established a plant version of a
Förster resonance energy transfer (FRET) probe called Ras and interacting protein
chimeric unit (Raichu) that can successfully monitor activation of the rice small GTPase
OsRac1 during various defence responses in rice cells. Here, we describe the protocol for
visualizing spatiotemporal activity of plant Rac/ROP GTPase in living plant cells,
transfection of rice protoplasts with Raichu-OsRac1 and acquisition of FRET images.
Our protocol should be widely adaptable for monitoring activation for other plant small
GTPases and for other FRET sensors in various plant cells.
.CC-BY-ND 4.0 International licenseIt is made available under a (which was not peer-reviewed) is the author/funder, who has granted bioRxiv a license to display the preprint in perpetuity.
The copyright holder for this preprint. http://dx.doi.org/10.1101/249938doi: bioRxiv preprint first posted online Jan. 18, 2018;

4
INTRODUCION
Background
Scientists have wanted for many years to observe events in living cells at the molecular
level, and fluorescent proteins offer powerful tools for doing so. Förster Resonance
Energy Transfer (FRET) is a physical phenomenon that can be sensitive to changes in
molecular conformation and association typically in the 1-10 nm range (1, 2). In FRET
applications, a pair of donor and acceptor fluorescent proteins is used to monitor a
variety of biological events including protein-protein interactions, protein kinase
activities, post-translational modifications and the dynamics of second messengers (3-6).
When the emission spectrum of a donor fluorescent protein overlaps with the absorption
spectrum of an acceptor fluorescent protein, and the distance between the two proteins
is less than 10 nm, non-radiative transfer of energy occurs from the donor to the
acceptor. Currently, cyan-emitting fluorescent protein (CFP) and yellow-emitting
fluorescent protein (YFP) are widely used as the donor and acceptor pair for FRET
analyses.
Small GTPases exhibit both GDP/GTP-binding activity and GTPase activity,
and work as molecular switches by cycling between GDP-bound inactive and
GTP-bound active forms. The Ras superfamily GTPases contain five highly conserved
G-boxes (G1-G5) (7, 8). G1, G3, G4 and G5 play vital roles in binding to GTP/GDP
and in GTPase activity, while the G2 box is an effector domain that is important for
binding to downstream effector proteins. The C-terminal polybasic region and
post-translational modification sites contribute to subcellular localization and function.
.CC-BY-ND 4.0 International licenseIt is made available under a (which was not peer-reviewed) is the author/funder, who has granted bioRxiv a license to display the preprint in perpetuity.
The copyright holder for this preprint. http://dx.doi.org/10.1101/249938doi: bioRxiv preprint first posted online Jan. 18, 2018;

5
The Ras superfamily is classified structurally and functionally into at least five families:
Ras, Rho, Rab, Sar1/Arf and Ran (8). The Rho family in animals is further split into
three subfamilies, namely Rho, Rac and Cdc42. In plants, the Rho family converges into
a single subfamily that is distinct from the Rho, Rac and Cdc42 subfamilies in animals
(9), although, functionally, the plant Rho subfamily is most closely related to the animal
Rac subfamily. Thus, these plant Rho subfamily GTPases are called Rac or ROP (Rho
of plant or Rho-related GTPases from plants) proteins (10, 11). The ratio of active
GTP-bound to inactive GDP-bound forms of a Rac/ROP GTPase is controlled by the
activity of three factors (12): GTPase-activating proteins (GAPs) act as negative
regulators by accelerating the intrinsic GTPase activities of Rac/ROP and converting it
to an inactive GDP-bound Rac/ROP; guanine nucleotide dissociation inhibitors (GDIs)
suppress the exchange of GDP for GTP; guanine nucleotide exchange factors (GEFs)
promote the release of GDP from Rac/ROP and, since the intracellular concentration of
GTP is much higher than that of GDP, thereby facilitate the binding of GTP to Rac/ROP.
GTP-bound Rac/ROP associates with downstream effector proteins to trigger a variety
of cellular responses.
Comparison with other methods
Rac/ROP family small GTPases are master regulators, controlling various
signalling systems in plants such as those governing pollen tube growth, root hair
development, auxin signaling, and disease resistance (13-16). Therefore, monitoring the
activation state of a Rac/ROP GTPase within living cells is critical to further
understanding its functions. Until the 1990s, activation states of small GTPases were
.CC-BY-ND 4.0 International licenseIt is made available under a (which was not peer-reviewed) is the author/funder, who has granted bioRxiv a license to display the preprint in perpetuity.
The copyright holder for this preprint. http://dx.doi.org/10.1101/249938doi: bioRxiv preprint first posted online Jan. 18, 2018;
6
measured in vivo by labelling cells with inorganic [32P] phosphate, followed by
immunoprecipitation of small GTPases and thin-layer chromatography to obtain
quantitative data for their associated GDP and GTP levels. However, this method
required not only large amounts of radioisotope but also a time-consuming procedure.
Currently, two alternative non-radioactive techniques are available for monitoring the in
vivo activation of Rac/ROP: a PAK CRIB pull-down assay, and FRET sensors (5,
17-19). These methods exploit the selective interaction between the Cdc42/Rac
interactive binding (CRIB) domain of the Rac-effector PAK1 (PAK CRIB) and plant
and animal Rac GTPases. PAK CRIB shows a high affinity only for the active
GTP-bound form of Rac, and not for the inactive GDP-bound form (17, 19). PAK
CRIB binding suppresses the intrinsic GTPase activity of Rac, and this function
provides a useful tool for isolating active GTP-bound forms of Rac/ROP from crude cell
lysates and for monitoring the activation state of Rac/ROP in living cells. Currently, kits
using GST-tagged PAK CRIB for a PAK CRIB pull-down assay are available from
several manufacturers (e.g., Cytoskeleton). The subsequent immunoblotting assay can
quantify Rac/ROP activation in cells by determining the amount of activated
Rac/ROP. This is a widely used method for the semi-quantitative measurement of
Rac/ROP activity from plants to animals (17, 18, 20). However, the PAK CRIB
pull-down assay only provides a snapshot, and cannot detect the spatial and temporal
dynamics of intracellular signaling in living cells. To solve this problem, FRET
biosensors for small GTPases have been developed.
Development of the protocol
.CC-BY-ND 4.0 International licenseIt is made available under a (which was not peer-reviewed) is the author/funder, who has granted bioRxiv a license to display the preprint in perpetuity.
The copyright holder for this preprint. http://dx.doi.org/10.1101/249938doi: bioRxiv preprint first posted online Jan. 18, 2018;

7
FRET biosensors that have been developed to visualize small GTPase activity in
living cells can be classified into two types: intramolecular (or unimolecular) and
intermolecular (or bimolecular) biosensors. Both types exploit the ability of two
different proteins to interact with each other when one of them is activated.
Intramolecular biosensors have both donor and acceptor fluorescent proteins in one
molecule, whereas a donor and an acceptor fluorescent protein are expressed separately
in intermolecular biosensors. The first report on in vivo monitoring of a small GTPase
involved intermolecular biosensors, namely the combination of animal cultured cells
expressing green fluorescent protein (GFP)-Rac as the donor and microinjection of PAK
CRIB labeled with Alexa 546 dye as the acceptor, which binds selectively to the
GTP-active form of Rac (21). The authors were able to show clearly the spatial control
of growth factor-induced Rac activation in a membrane ruffling area, as well as a
gradient of activation, at the leading edge of motile cells. In plants, an intermolecular
FRET biosensor was built to analyze ROP2 activity. With this sensor, which used a
downstream effector protein of the small GTPase ROP2, CFP-RIC4 (donor), and
YFP-ROP2 (acceptor), it was shown that ROP2 is preferentially activated in
lobe-forming regions of the cell cortex (22).
However, there are several disadvantages in systems involving intermolecular
biosensors. For example, to obtain reliable data from FRET analyses, we have to control
the expression levels of donors and acceptors (23). The expression level of the acceptor
should be higher than that of the donor; moreover, a high proportion of activated donors
.CC-BY-ND 4.0 International licenseIt is made available under a (which was not peer-reviewed) is the author/funder, who has granted bioRxiv a license to display the preprint in perpetuity.
The copyright holder for this preprint. http://dx.doi.org/10.1101/249938doi: bioRxiv preprint first posted online Jan. 18, 2018;

8
must associate with acceptors to obtain sufficiently high signal/noise ratios to prevent
FRET signals from being buried under noise. In plants, particle bombardment of
plasmids into leaf epidermal pavement cells of Arabidopsis is often carried out for
FRET analyses, but it is technically difficult to obtain appropriate levels of expression
of donors and acceptors in Arabidopsis using intermolecular biosensors. Moreover,
excessive expression of acceptors can cause abnormal activation or inhibition of
downstream molecules.
To overcome these disadvantages, Matsuda and his colleagues developed
excellent intramolecular FRET biosensors for small GTPases in animal cells,
collectively naming them Raichu (Ras superfamily and interacting protein chimeric
unit). Raichu was initially developed to study activation of the small GTPases Ras and
Rap1 following growth factor stimulation in animal cells (5, 24). The original Raichu
contains a donor (cyan-emitting fluorescent protein; CFP), an acceptor (yellow-emitting
fluorescent protein; YFP), and the Ras-binding domain of Raf (RBD), which is a
downstream effector and binds specifically to active Ras. Therefore, the molar ratio of
the individual component proteins is the same irrespective of expression level (Fig. 1a).
Accordingly, this intramolecular FRET biosensor eliminates the problem of variability
in the expression levels of donor and acceptor fluorescent proteins and is an ideal sensor
for monitoring the activation states of small GTPases.
Subsequently, Raichu and its variants have become well-established tools for
visualizing the activation of various small GTPases, including Rac1, Cdc42, RhoA, Ral,
.CC-BY-ND 4.0 International licenseIt is made available under a (which was not peer-reviewed) is the author/funder, who has granted bioRxiv a license to display the preprint in perpetuity.
The copyright holder for this preprint. http://dx.doi.org/10.1101/249938doi: bioRxiv preprint first posted online Jan. 18, 2018;

9
TC10 and Rab5 in animals (15, 25). Raichu-Rac1, one of the variants of Raichu, is
composed of the yellow-emitting fluorescent protein Venus, the small GTPase human
Rac1, a linker, the CRIB domain of PAK, CFP, and the C-terminal polybasic region and
post-translational modification site of KiRas at the C terminus (Fig. 1 a). In the
GDP-bound inactive form of Raichu-Rac1, PAK CRIB does not bind to Rac1 and the
donor CFP remains remote from the acceptor Venus, resulting in a low FRET efficiency
(Fig. 1 b). Upon activation of endogenous GEF by extracellular signals, GEF facilitates
the release of GDP from Rac1, thereby converting Rac1 into a nucleotide-free form.
Owing to the high intracellular concentration of GTP, Rac1 is then converted to the
active form after autonomously binding to GTP. Intramolecular binding of active
GTP-Rac1 to PAK CRIB brings CFP closer to Venus, thus enabling FRET from CFP to
Venus to occur. The resulting Venus fluorescence provides an estimate of the activation
state of Rac1 in vivo, with low and high ratios of Venus/CFP fluorescence corresponding
to low and high levels of Rac1 activation, respectively.
We have previously revealed that the small GTPase OsRac1 is an important
regulator controlling rice immunity (15, 16, 26), and monitoring its activation within
living cells is therefore the next key step in further elucidating how plants trigger
immunity. To monitor activation states of OsRac1, we have developed a plant version of
the Raichu-Rac1system by combining the modification of human Raichu-Rac1 and a
rice protoplast transfection system. Protoplasts do not possess a cell wall, and this
enables direct live imaging of events both within the cell and at the cell surface,
.CC-BY-ND 4.0 International licenseIt is made available under a (which was not peer-reviewed) is the author/funder, who has granted bioRxiv a license to display the preprint in perpetuity.
The copyright holder for this preprint. http://dx.doi.org/10.1101/249938doi: bioRxiv preprint first posted online Jan. 18, 2018;

10
simultaneously and with no time delay in the response. Rice protoplasts also display a
high growth rate and a high transfection rate, and we can control the expression levels
of FRET sensors in plant cells without difficulty. Our work has pioneered the
monitoring of spatiotemporal activities of plant small GTPases in living cells, which
had been impossible by conventional biochemical methods (19). We have observed the
resistance (R) protein Pit, an immune receptor that activates OsRac1 at the plasma
membrane (19) (27), and reported that OsRac1 is activated within 3 min after treatment
with a fungal cell wall component, chitin (28), which is a microbe-associated molecular
pattern (MAMP) that triggers plant immunity. Moreover, by replacing the PAK CRIB
domain in Raichu-OsRac1 with the N-terminal region of OsRbohB, an effector protein
of OsRac1, we monitored the interaction between OsRac1 and OsRbohB and proposed
that cytosolic Ca2+ concentration regulates the Rac-Rboh interaction in a dynamic
manner (29). Since the principle of the intramolecular FRET biosensor appears to have
universal applications for all of the small GTPases, we believe this Raichu system will
become widely used in diverse research areas for understanding the spatiotemporal
regulation of plant small GTPases ant this protocol can be widely adapted for for other
FRET sensors in various plants.
MATERIALS
• 2,4-dichlorophenoxyacetic acid (2,4-D) (C8H6Cl2O) (Sigma, cat. no. D7299)
• Agarose, low gelling temperature (Sigma, cat. no. A9414)
.CC-BY-ND 4.0 International licenseIt is made available under a (which was not peer-reviewed) is the author/funder, who has granted bioRxiv a license to display the preprint in perpetuity.
The copyright holder for this preprint. http://dx.doi.org/10.1101/249938doi: bioRxiv preprint first posted online Jan. 18, 2018;

11
• Ammonium sulphate ((NH4)2SO4) (Sigma, cat. no. A3920)
• Boric acid (H3BO3) (Sigma, cat. no. B6768)
• Calcium chloride dihydrate (CaCl2•2H2O) (Sigma, cat. no. C5080)
• Cellulase RS (Yakult, cat. no. C8260)
• Chitin (N,N',N'',N''',N'''',N'''''-hexaacetylchitohexaose) (Carbosynth., cat. no. OH07433)
• Copper (II) sulphate pentahydrate (CuSO4•5H2O) (Sigma, cat. no. C8027)
• D-mannitol (C6H14O) (Sigma, cat. no. M1902)
• Deionized, distilled water (ddH2O)
• Ethylenediaminetetraacetic acid disodium salt dihydrate (Na2EDTA) (Sigma, cat. no.
E5134)
• Glycine (C2H5NO) (Sigma, cat. no. G7126) • Iron (II) sulphate heptahydrate (FeSO4•7H2O) (Sigma, cat. no. F8633)
• Macerozyme R10 (Yakult, cat. no. C1003)
• Magnesium chloride (MgCl2) (Sigma, cat. no. M8266)
• Magnesium sulphate heptahydrate (MgSO4•7H2O) (Sigma, cat. no. 63138)
• Manganese (II) sulphate tetrahydrate (MnSO4•4H2O) (Alfa Aesar, cat. no. B22081) !
CAUTION It is toxic and dangerous for the environment. Handle it with care, and wear
gloves and eye protection.
• MES monohydrate (C6H13NO4S•H2O) (Fluka, cat. no. 69889)
• Murashige and Skoog (MS) Vitamin (Sigma, cat. no. M3900)
• Myo-inositol (C6H12O6) (Sigma, cat. no. I7508)
• Nicotinic acid (C6H5NO2) (Sigma, cat. no. N0761)
.CC-BY-ND 4.0 International licenseIt is made available under a (which was not peer-reviewed) is the author/funder, who has granted bioRxiv a license to display the preprint in perpetuity.
The copyright holder for this preprint. http://dx.doi.org/10.1101/249938doi: bioRxiv preprint first posted online Jan. 18, 2018;

12
• Polyethylene glycol (PEG 4000) (Sigma, cat. no. 81240)
• Potassium chloride (KCl) (Sigma, cat. no. P9541)
• Potassium nitrate (KNO3) (Sigma, cat. no. P6083)
• Pyridoxine hydrochloride (C8H12ClNO3) (Sigma, cat. no. 47862)
• Plasmid Maxi Kit (Qiagen, cat. no. 12165)
• Sodium chloride (NaCl) (Sigma, cat. no. S5886)
• Sodium hydroxide (NaOH) (Sigma, cat. no. S8045) ! CAUTION NaOH is corrosive.
Handle it with care, and wear gloves and eye protection.
• Sodium molybdate dihydrate (Na2MoO4•2H2O) (Sigma, cat. no. M1003)
• Sodium phosphate monobasic dihydrate (NaH2PO4•2H2O) (Sigma, cat. no. 71505)
• Sucrose (C12H22O11) (Sigma, cat. no. S0389)
• Thiamine hydrochloride (C12H18Cl2N4OS) (Sigma, cat. no. T1270)
• Zinc sulphate heptahydrate (ZnSO4•7H2O) (Sigma, cat. no. Z0251)
EQUIPMENTS
• 0.2-µm filter 250 ml (CORNING 431096)
• 440-nm diode laser (iFLEX 2000, Point Source)
• 60× oil-immersion objective lens (UPlanSApo 60×/1.42, Olympus)
• Centrifuge with a swinging bucket rotor (Eppendorf: 5804R and S-4-72)
• Confocal scanner (Yokogawa CSU22)
• Cooled charge-coupled device camera (Hamamatsu Photonics, EM-CCD C9100-02).
.CC-BY-ND 4.0 International licenseIt is made available under a (which was not peer-reviewed) is the author/funder, who has granted bioRxiv a license to display the preprint in perpetuity.
The copyright holder for this preprint. http://dx.doi.org/10.1101/249938doi: bioRxiv preprint first posted online Jan. 18, 2018;

13
• Cover glass (Matsunami Glass, Small: 24 ´ 32 mm, 0.13-0.17 mm, C024321, Large:
24 ´ 60 mm, 0.13-0.17 mm, C024601)
• Dual-View image splitter (DualView: Optical Insights)
• FRET filter for dual-emission imaging (Omega Optical, CFP: 480 ± 15 nm and Venus:
535 ± 20 nm)
• Inverted fluorescence microscope (Olympus IX-81)
• MetaMorph software (Universal Imaging)
• Microscope slide printed with highly water-repellent mark (Matsunami Glass, cat. no.
TF0215)
• Nylon mesh (40 µm, Kyoshin Rikoh, cat. no. PP-40n)
RECIPES
2,4-D, 20 mg/ml Dissolve 0.2 g of 2,4-D in 10 ml of 70% (v/v) Ethanol. Store the
solution at 4 °C in dark for up to 6 months.
CaCl2, 1M Dissolve 14.7 g of CaCl2•2H2O in 100 ml of ddH2O and autoclave. Store it at
RT for up to 12 months.
Cellulase solution Add 140 mg of CaCl2•2H2O, 0.3 g of MES•H2O, 12.0 g of cellulase
RS and 3.0 g of Macerozyme R10 to 200 ml of ddH2O and stir gently for 10-30 min.
Next, add 18.2 g of D-mannitol and adjust the final volume to 300 ml with ddH2O. Filter
the solution through three layers of filter paper. Adjust the pH to 5.6 and sterilize the
solution with a 0.2-µm filter. Finally, divide into 20-ml aliquots in 50-ml tubes and store
at -20 °C.
.CC-BY-ND 4.0 International licenseIt is made available under a (which was not peer-reviewed) is the author/funder, who has granted bioRxiv a license to display the preprint in perpetuity.
The copyright holder for this preprint. http://dx.doi.org/10.1101/249938doi: bioRxiv preprint first posted online Jan. 18, 2018;

14
FeEDTA, 1M Dissolve 375 mg of Na2EDTA and 275 mg of FeSO4•7H2O in 80 ml of
ddH2O. Adjust the final volume to 100 ml. Store at 4 °C.
KNO3, 40 mM Dissolve 0.4 g of KNO3 in 100 ml of ddH2O. Store at RT for up to 6
months.
Mannitol, 0.8 M Dissolve 14.6 g of D-mannitol in 100 ml of ddH2O and autoclave.
Store at RT for up to 6 months.
MgSO4, 1 mM Dissolve 25 mg of MgSO4•7H2O in 100 ml of ddH2O and autoclave.
Store at RT for up to 6 months.
MMG solution Dissolve 14.6 g of D-mannitol, 0.6 g of MgCl2 and 170 mg of MES
•H2O in 160 ml of ddH2O. Adjust the pH to 5.7 with 5N NaOH and dilute to 200 ml with
ddH2O. Autoclave and divide into 15-ml Falcon tubes. Store at RT for up to 1 month.
NaH2PO4, 2 mM Dissolve 31 mg of NaH2PO4•2H2O in 100 ml of ddH2O. Store at RT
for up to 6 months.
(NH4)2SO4, 2.5 mM Dissolve 33 mg of MgSO4•7H2O in 100 ml of ddH2O. Store at RT
for up to 6 months.
PEG solution Prepare just before use. Dissolve 4.0 g of PEG4000 in 3 ml of ddH2O.
Add 2.5 ml of 0.8 M D-mannitol and 1 ml of 1 M CaCl2. Adjust volume to 10 ml with
ddH2O. Dissolve and sterilize with a 0.2-µm filter.
R2 Macro 20x solution Dissolve 80.0 g of KNO3, 6.7 g of (NH4)2SO4, 5.0 g of
MgSO4•7H2O, 3.0 g of CaCl2•2H2O and 5.5 g of NaH2PO4•2H2O in 800 ml of ddH2O.
Adjust the volume to 1 l with ddH2O. Store at 4 °C.
R2 Micro 1000x solution Dissolve 160 mg of MnSO4•4H2O, 220 mg of ZnSO4•7H2O,
.CC-BY-ND 4.0 International licenseIt is made available under a (which was not peer-reviewed) is the author/funder, who has granted bioRxiv a license to display the preprint in perpetuity.
The copyright holder for this preprint. http://dx.doi.org/10.1101/249938doi: bioRxiv preprint first posted online Jan. 18, 2018;

15
13 mg of CuSO4•5H2O, 0.6 g of H3BO3 and 13 mg of Na2MoO4•2H2O in 800 ml of
ddH2O. Adjust the volume to 1 l with ddH2O and store at 4 °C.
R2S Dissolve 30.0 g of sucrose in 800 ml of ddH2O. Add 50 ml of 20x R2 Macro, 2 ml
of FeEDTA, 1 ml of 1000x R2 Micro, 1 ml of MS Vitamin and 0.1 ml of 2,4-D. Adjust
the pH of the solution to 5.7 with NaOH, and the volume to 1 l with ddH2O. Autoclave
and store this medium at 4 °C for up to 1 month.
W5 solution Dissolve 1.8 g of NaCl, 2.8 g of CaCl2•2H2O, 70 mg of KCl and 90 mg of
MES•H2O in 160 ml of ddH2O. Adjust the pH of the solution to 5.7 with 5N NaOH, and
the volume to 200 ml with ddH2O. Autoclave and store at RT for up to 1 month.
INSTRUCTION
This protocol describes a practical method for monitoring the activity of small GTPases
in rice protoplasts using the intramolecular FRET biosensor. One of the most important
factors for obtaining successful results is to develop a wide dynamic range of FRET
biosensors. Since there are no standard protocols for making reliable Raichu constructs,
we refrain from describing a detailed protocol on the development of FRET sensors in
this protocol. Establishing reliable Raichu constructs requires a process of trial and error
with many factors such as the choice of fluorescent proteins, the length of linkers and
the combination of small GTPase and small GTPase-binding domain. For more
information about sensor development, we refer readers to several excellent reviews of
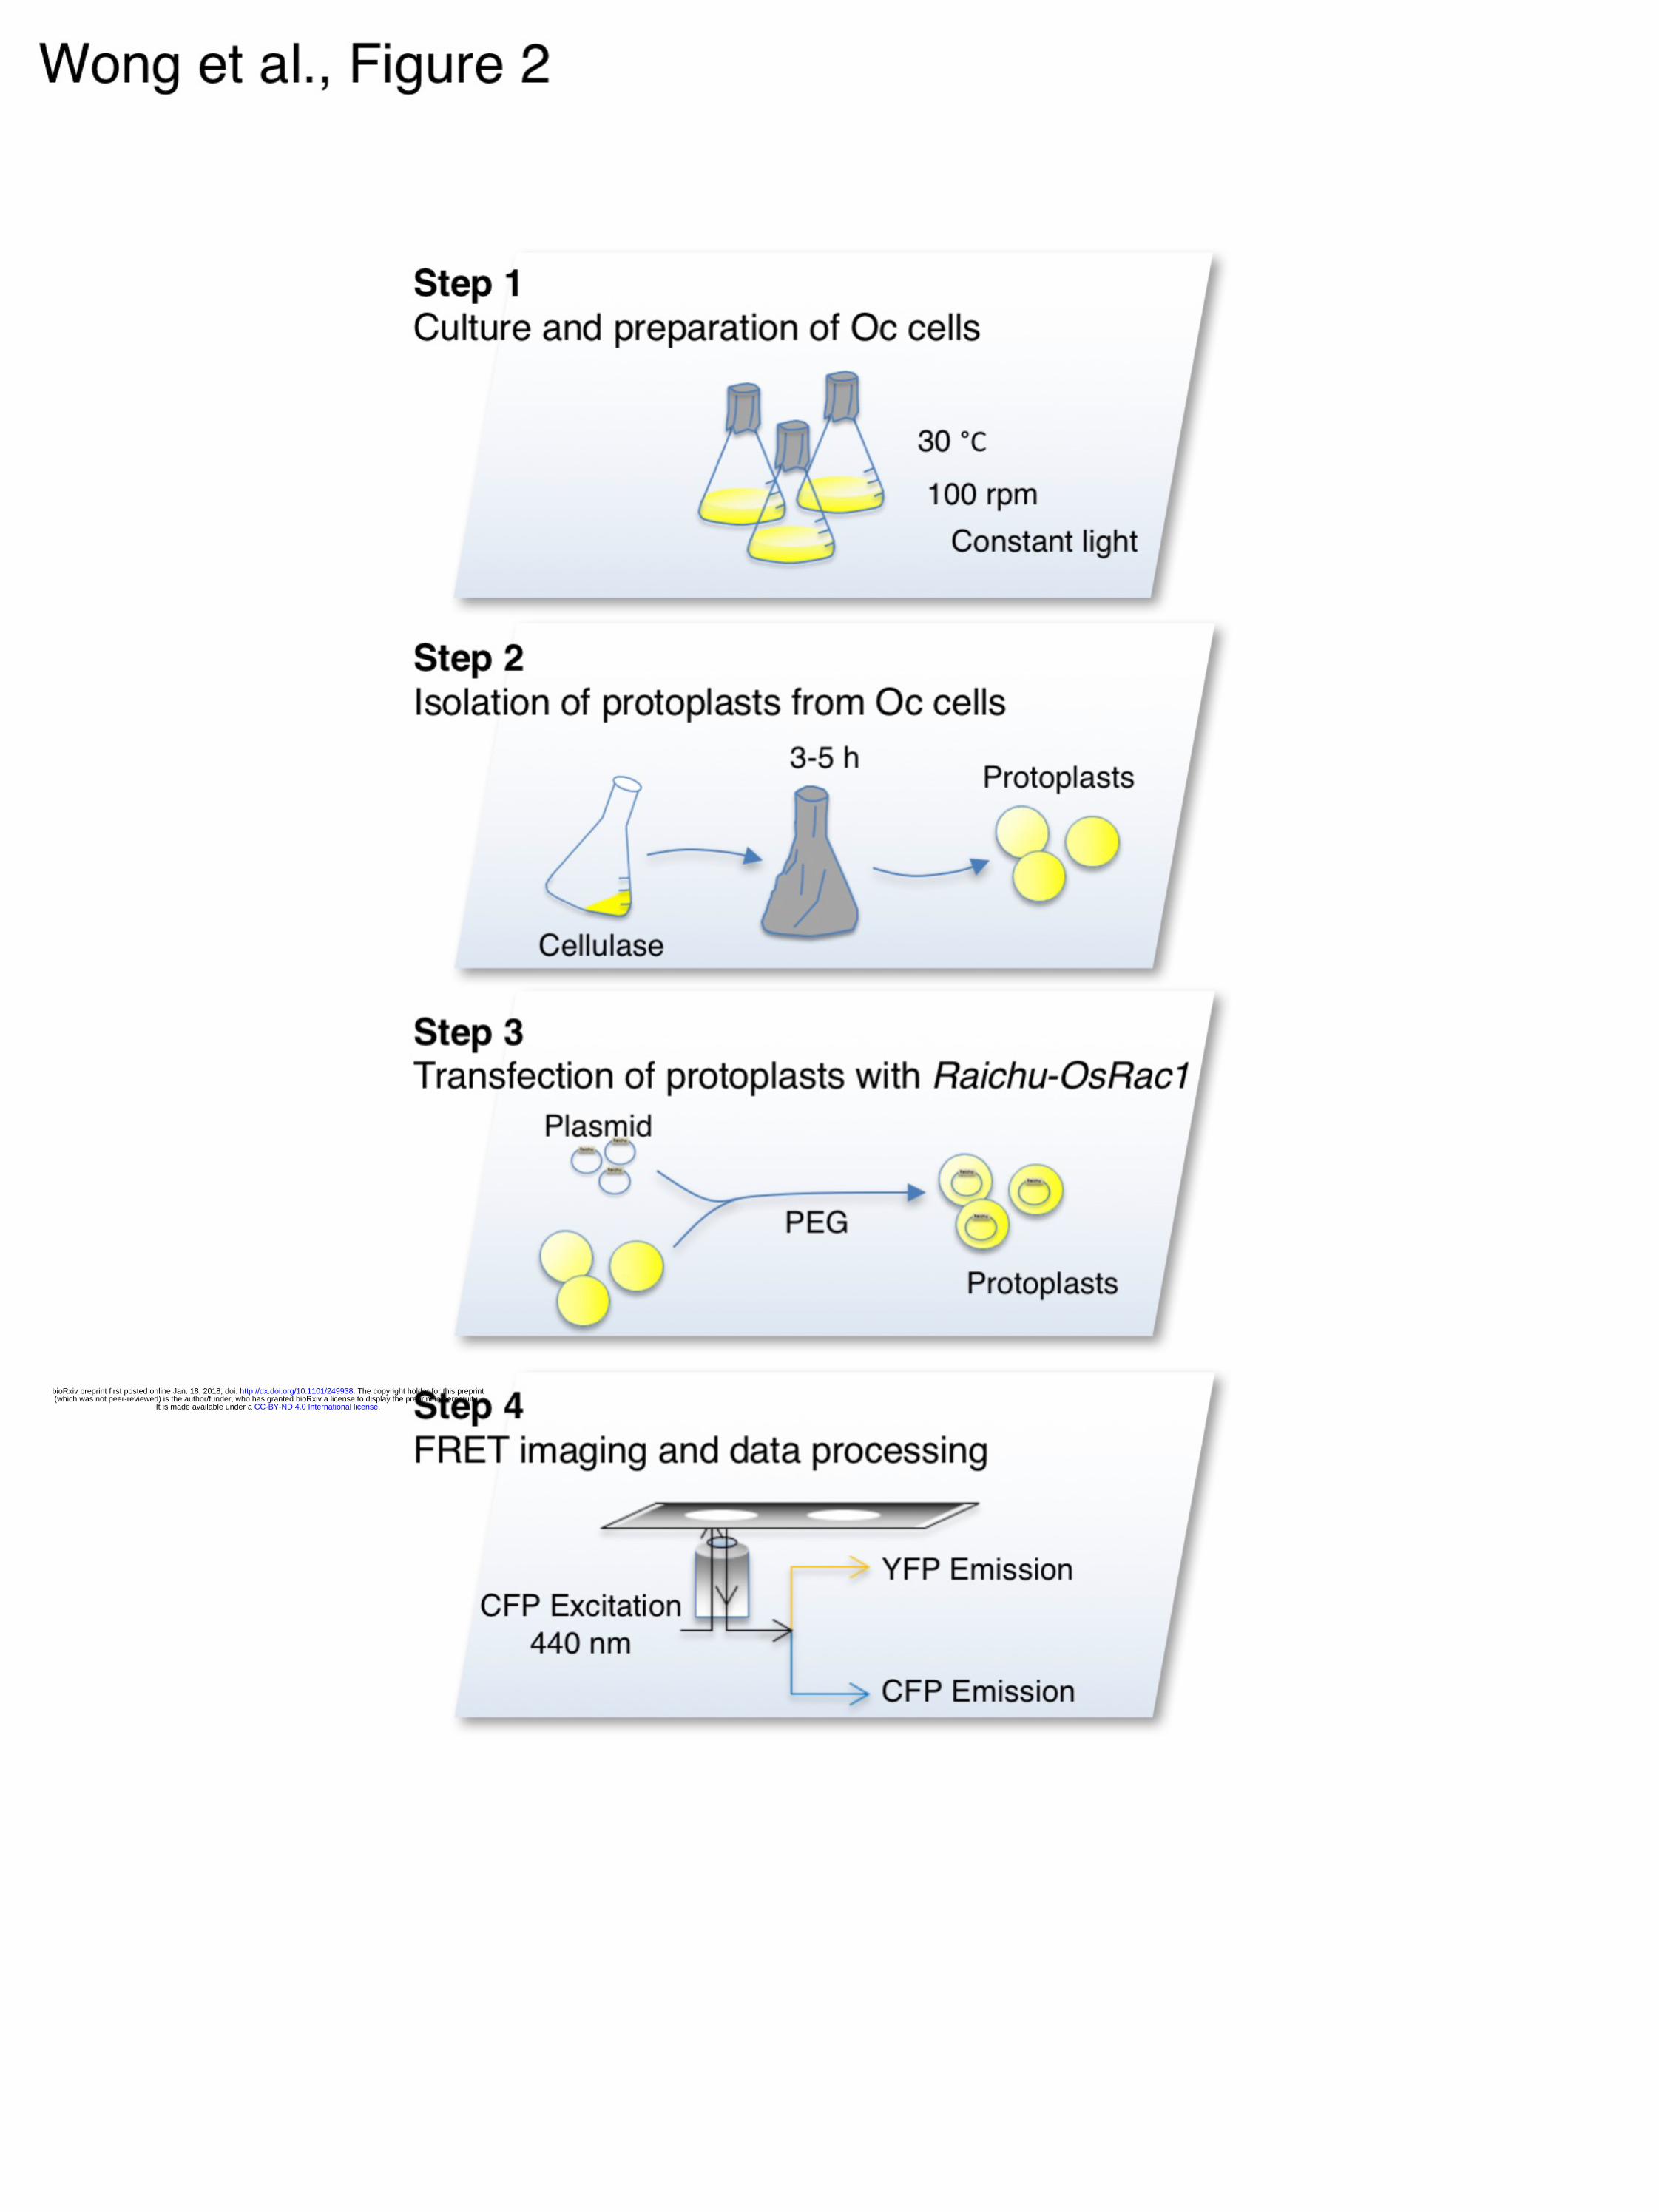
animal systems (23, 25, 30, 31). The protocol that follows consists of four steps: 1) cell
.CC-BY-ND 4.0 International licenseIt is made available under a (which was not peer-reviewed) is the author/funder, who has granted bioRxiv a license to display the preprint in perpetuity.
The copyright holder for this preprint. http://dx.doi.org/10.1101/249938doi: bioRxiv preprint first posted online Jan. 18, 2018;

16
culture and preparation of Oc cells; 2) isolation of protoplasts; 3) transfection of
protoplasts with Raichu-OsRac1 plasmids; and 4) FRET imaging and data processing
(Fig. 2).
Construction of Raichu-OsRac1
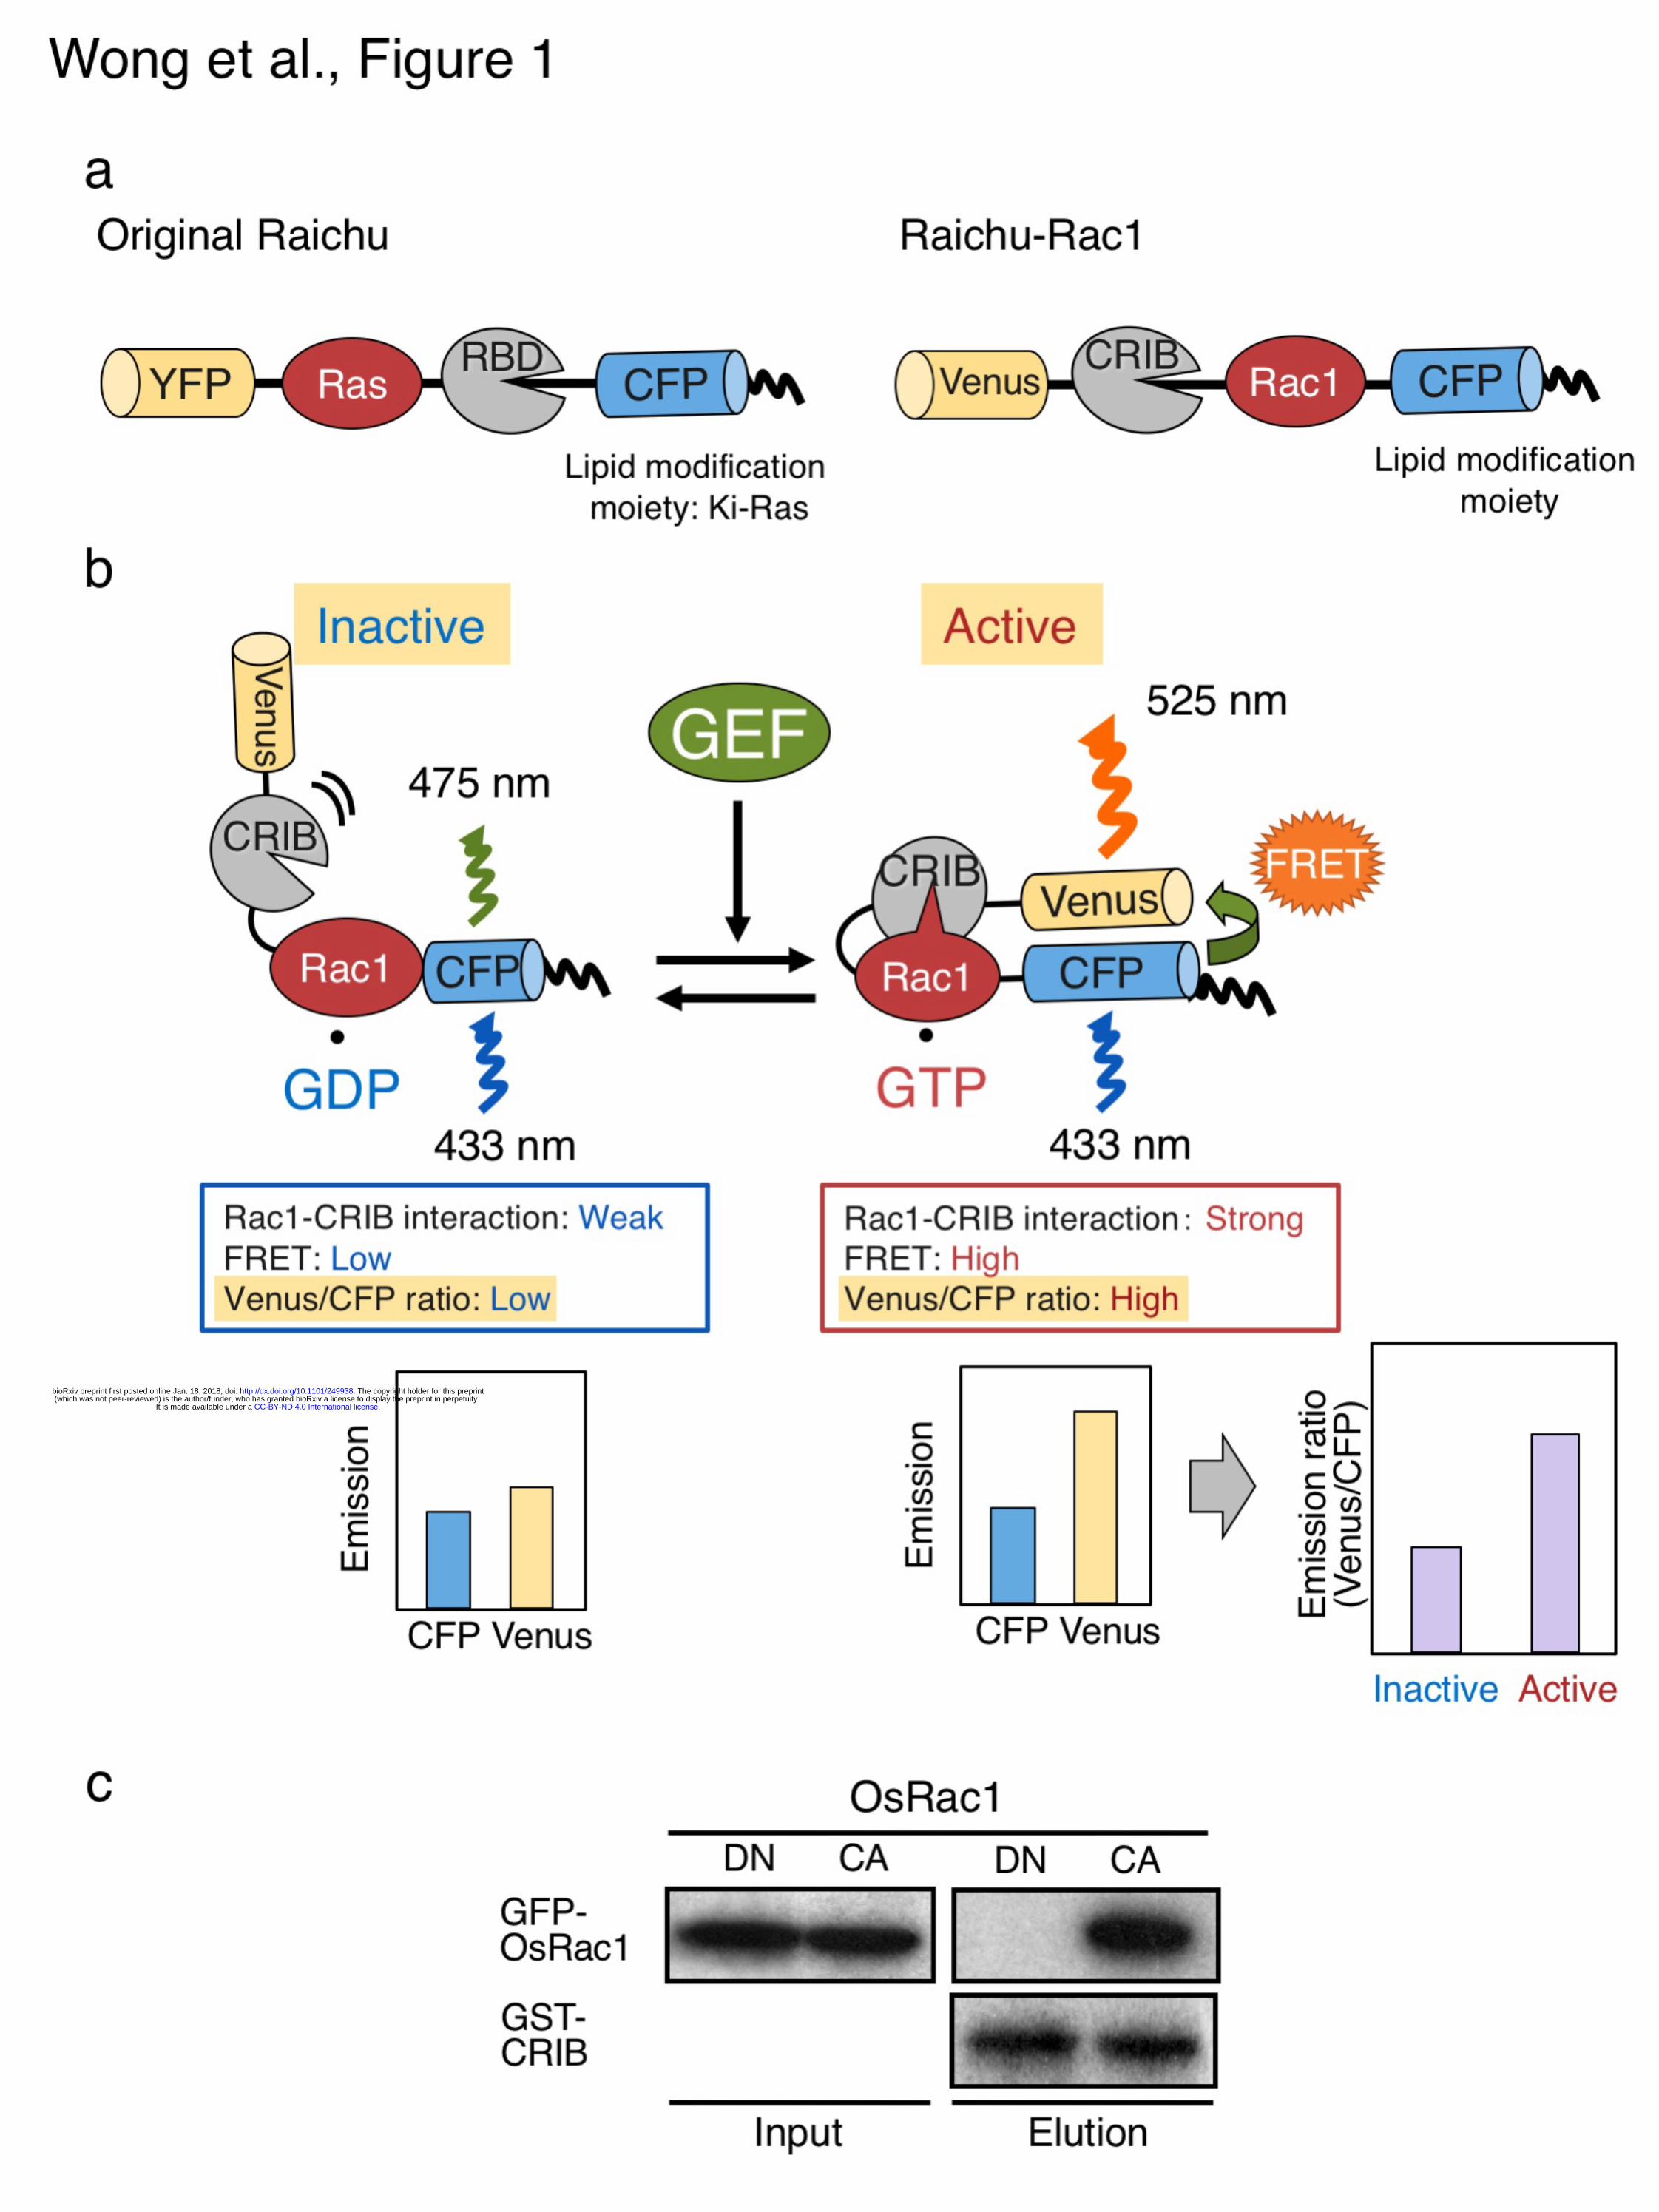
We first tested the binding specificity of the CRIB domain of PAK for OsRac1 using a
pull-down assay. PAK CRIB specifically bound to the constitutively active (G19V)
form of OsRac1 (OsRac1 CA) and not to the dominant negative (T24N) form (OsRac1
DN), indicating that the interaction between PAK CRIB and OsRac1 occurs only when
OsRac1 is activated (Fig. 1 b and c). The backbone of our Raichu-OsRac1 is essentially
identical to that made by Itoh et al. (24), except that human Rac1 and the C-terminal
polybasic region and CAAX box of human Ki-Ras are replaced by rice OsRac1 and the
corresponding elements of OsRac1, respectively (19). The choice of C-terminal
polybasic region and post-translational modification site is also important, because
subcellular localization of small GTPases is strongly influenced by these functions (29).
To determine whether the activation of OsRac1 increases FRET efficiency in vivo, we
also prepared CA and DN forms of Raichu-OsRac1.
[1] Cell culture and preparation of Oc cells - Time: 3 days
.CC-BY-ND 4.0 International licenseIt is made available under a (which was not peer-reviewed) is the author/funder, who has granted bioRxiv a license to display the preprint in perpetuity.
The copyright holder for this preprint. http://dx.doi.org/10.1101/249938doi: bioRxiv preprint first posted online Jan. 18, 2018;

17
We used Oryza sativa L. C5924 (Oc) cells to generate rice protoplasts for transfection
assays of Raichu-OsRac1, because their transfection efficiency is much higher than that
of protoplasts derived from other rice cultivars (32).
*All procedures should be done on a clean bench to avoid contamination
From a fully saturated 20-ml suspension of Oc cells, we discard all medium as well as
about half of the cells, and then add 20 ml of fresh R2S medium in a 100-ml flask every
week to maintain the cells. Cells are cultured at 30°C with rotation at 100 rpm under
constant light. We change the flasks every month because debris accumulates on their
inner surface.
1| Use fully saturated suspension cells cultured in fresh R2S medium for 3 days.
For transfection experiments, the medium of a fully saturated cell suspension is replaced
with 20 ml of fresh R2S medium and the cells are cultured for 3 days.
[2] Isolation of protoplasts from Oc cells - Time: 6 h
We developed a rice protoplast isolation and transfection method, according to Yoo et
al., with minor modifications (33). Cell walls of Oc cells are removed using cellulase
and the protoplasts transfected with Raichu-OsRac1 vectors by a PEG method.
*All procedures should be done on a clean bench to avoid contamination (Fig. 3 b).
1| Prepare a conical flask with a funnel and nylon mesh filter, and autoclave (Fig. 3
c)
.CC-BY-ND 4.0 International licenseIt is made available under a (which was not peer-reviewed) is the author/funder, who has granted bioRxiv a license to display the preprint in perpetuity.
The copyright holder for this preprint. http://dx.doi.org/10.1101/249938doi: bioRxiv preprint first posted online Jan. 18, 2018;

18
2| Irradiate a clean bench with ultraviolet light for 10-20 min
3| Pre-warm cellulase solution at 30 °C to thaw
4| Completely remove R2S medium from a flask containing a 3-day culture (Fig. 3
a); add 20 ml of cellulase solution and cover the flask with aluminium foil
5| Incubate the cells at 30 °C with shaking at 50 rpm for 3-5 h (Fig. 3 d)
6| Add 20 ml of W5 solution and filter the cells through a sheet of 40-µm nylon
mesh (Fig. 3 e)
* All procedures should be conducted on ice.
To prevent the filters from clogging, we pipette the cells gently in 5-ml aliquots into the
filter.
7| Transfer the filtered cells to a 50-ml Falcon tube
8| Centrifuge the tube at 120 g for 4 min using a swinging bucket rotor
Check whether sufficient cells are pelleted in the bottom of the tube (Fig. 3 f).
9| Decant and discard the supernatant
10| Add 20 ml of W5 solution to the protoplast pellet and suspend it by gentle
swirling
11| Centrifuge at 120 g for 4 min using a swinging bucket rotor
12| Discard the supernatant and add 2 ml of W5 solution
To avoid cell damage, resuspend the cells gently.
13| Keep the suspension on ice for 30 min
14| Dilute 10 µl of the protoplast suspension with 90 µl of W5 solution to measure
the density of protoplasts using a haemocytometer, and estimate the total number
.CC-BY-ND 4.0 International licenseIt is made available under a (which was not peer-reviewed) is the author/funder, who has granted bioRxiv a license to display the preprint in perpetuity.
The copyright holder for this preprint. http://dx.doi.org/10.1101/249938doi: bioRxiv preprint first posted online Jan. 18, 2018;
19
of protoplasts
We count only intact, round cells. In general, we can obtain 2-8×10⁶ cells from one flask.
If your yield is very low, start again from the beginning.
15| Centrifuge at 120 g for 4 min using a swinging bucket rotor and discard the
supernatant
16| Resuspend the protoplasts at 2×10⁶ cells/ml with MMG
* CRITICAL STEP For general experiments such as localization studies and analyses of
gene expression, protoplasts can be kept at 4 °C for up to 24 h, but freshly prepared
protoplasts are essential for Raichu-OsRac1 experiments.
[3] Transfection of protoplasts with Raichu-OsRac1 plasmids
In general, we are able to observe a 30-40% transfection efficiency with control green
fluorescent protein (GFP), and it is very important to keep this efficiency high to obtain
reproducible and reliable results. Since it is easy to generate CA and DN mutants of
small GTPases, we strongly recommend adding Raichu-OsRac1 CA and DN vectors as
positive and negative controls to ensure a wide dynamic range of the Venus/CFP ratio in
each experiment.
* All steps are carried out at 25°C (room temperature).
* Prepare plasmid DNA for transfection and fresh PEG solution.
The concentration of all of plasmids is adjusted to 2 µg/µl to minimize the volume of
.CC-BY-ND 4.0 International licenseIt is made available under a (which was not peer-reviewed) is the author/funder, who has granted bioRxiv a license to display the preprint in perpetuity.
The copyright holder for this preprint. http://dx.doi.org/10.1101/249938doi: bioRxiv preprint first posted online Jan. 18, 2018;

20
plasmid used in the transfection.
1| Add the required plasmids to a 1.5-ml tube
* CRITICAL STEP It is essential to optimize the amount and ratio of plasmids to suit
your experimental design. The total amount of plasmid in each sample should not
exceed 10 µl or 10 µg, and should be the same for both test and control vectors.
2| Add 100 µl of protoplast suspension (2×10⁵ cells)
3| Add 110 µl of PEG solution and mix gently by inverting the tube five times
4| Incubate the transfection mixture for 20 min at room temperature
5| Add 1 ml of W5 solution to the tube and mix gently by inverting five times
6| Centrifuge at 120 g for 10 min and discard the supernatant
7| Add 100 µl of W5 solution
8| Suspend the protoplasts gently and place the tube in a light-resistant box on a
slant
We put the tube on a slant to prevent the fragile protoplasts from settling in the bottom
of the tube, and we use a light-resistant box to prevent bleaching of the fluorescent
proteins.
9| Incubate in the dark at 30 °C for 10-16 h
[4] FRET imaging and data processing
Raichu-OsRac1 proteins begin to be expressed 8 h after transfection, and it usually takes
until about 10 h after transfection to achieve sufficient expression of the biosensors. The
.CC-BY-ND 4.0 International licenseIt is made available under a (which was not peer-reviewed) is the author/funder, who has granted bioRxiv a license to display the preprint in perpetuity.
The copyright holder for this preprint. http://dx.doi.org/10.1101/249938doi: bioRxiv preprint first posted online Jan. 18, 2018;

21
optimal observation time is 10-16 h after transfection. FRET efficiencies may vary
depending on the timing of observation, due to differences in the time required for
maturation of donor and acceptor fluorescent proteins, and it is better to avoid observing
cells beyond 16 h after transfection in our condition. The expression levels of
Raichu-OsRac1 are different in individual cells and it is important to select cells
displaying appropriate localization (34) and comparable levels of Raichu-OsRac1 (19).
To obtain images of Raichu-OsRac1, we use an inverted microscope equipped
with a Confocal Scanner Unit, a Dual-View image splitter and a CCD camera, which
can simultaneously take CFP and Venus images. The donor protein CFP is excited by a
440-nm diode laser. Average values for the fluorescence intensity of CFP and Venus in
the region of interest are calculated after subtracting background fluorescence. The
normalized FRET efficiency is then calculated according to Sorkin et al. (35).
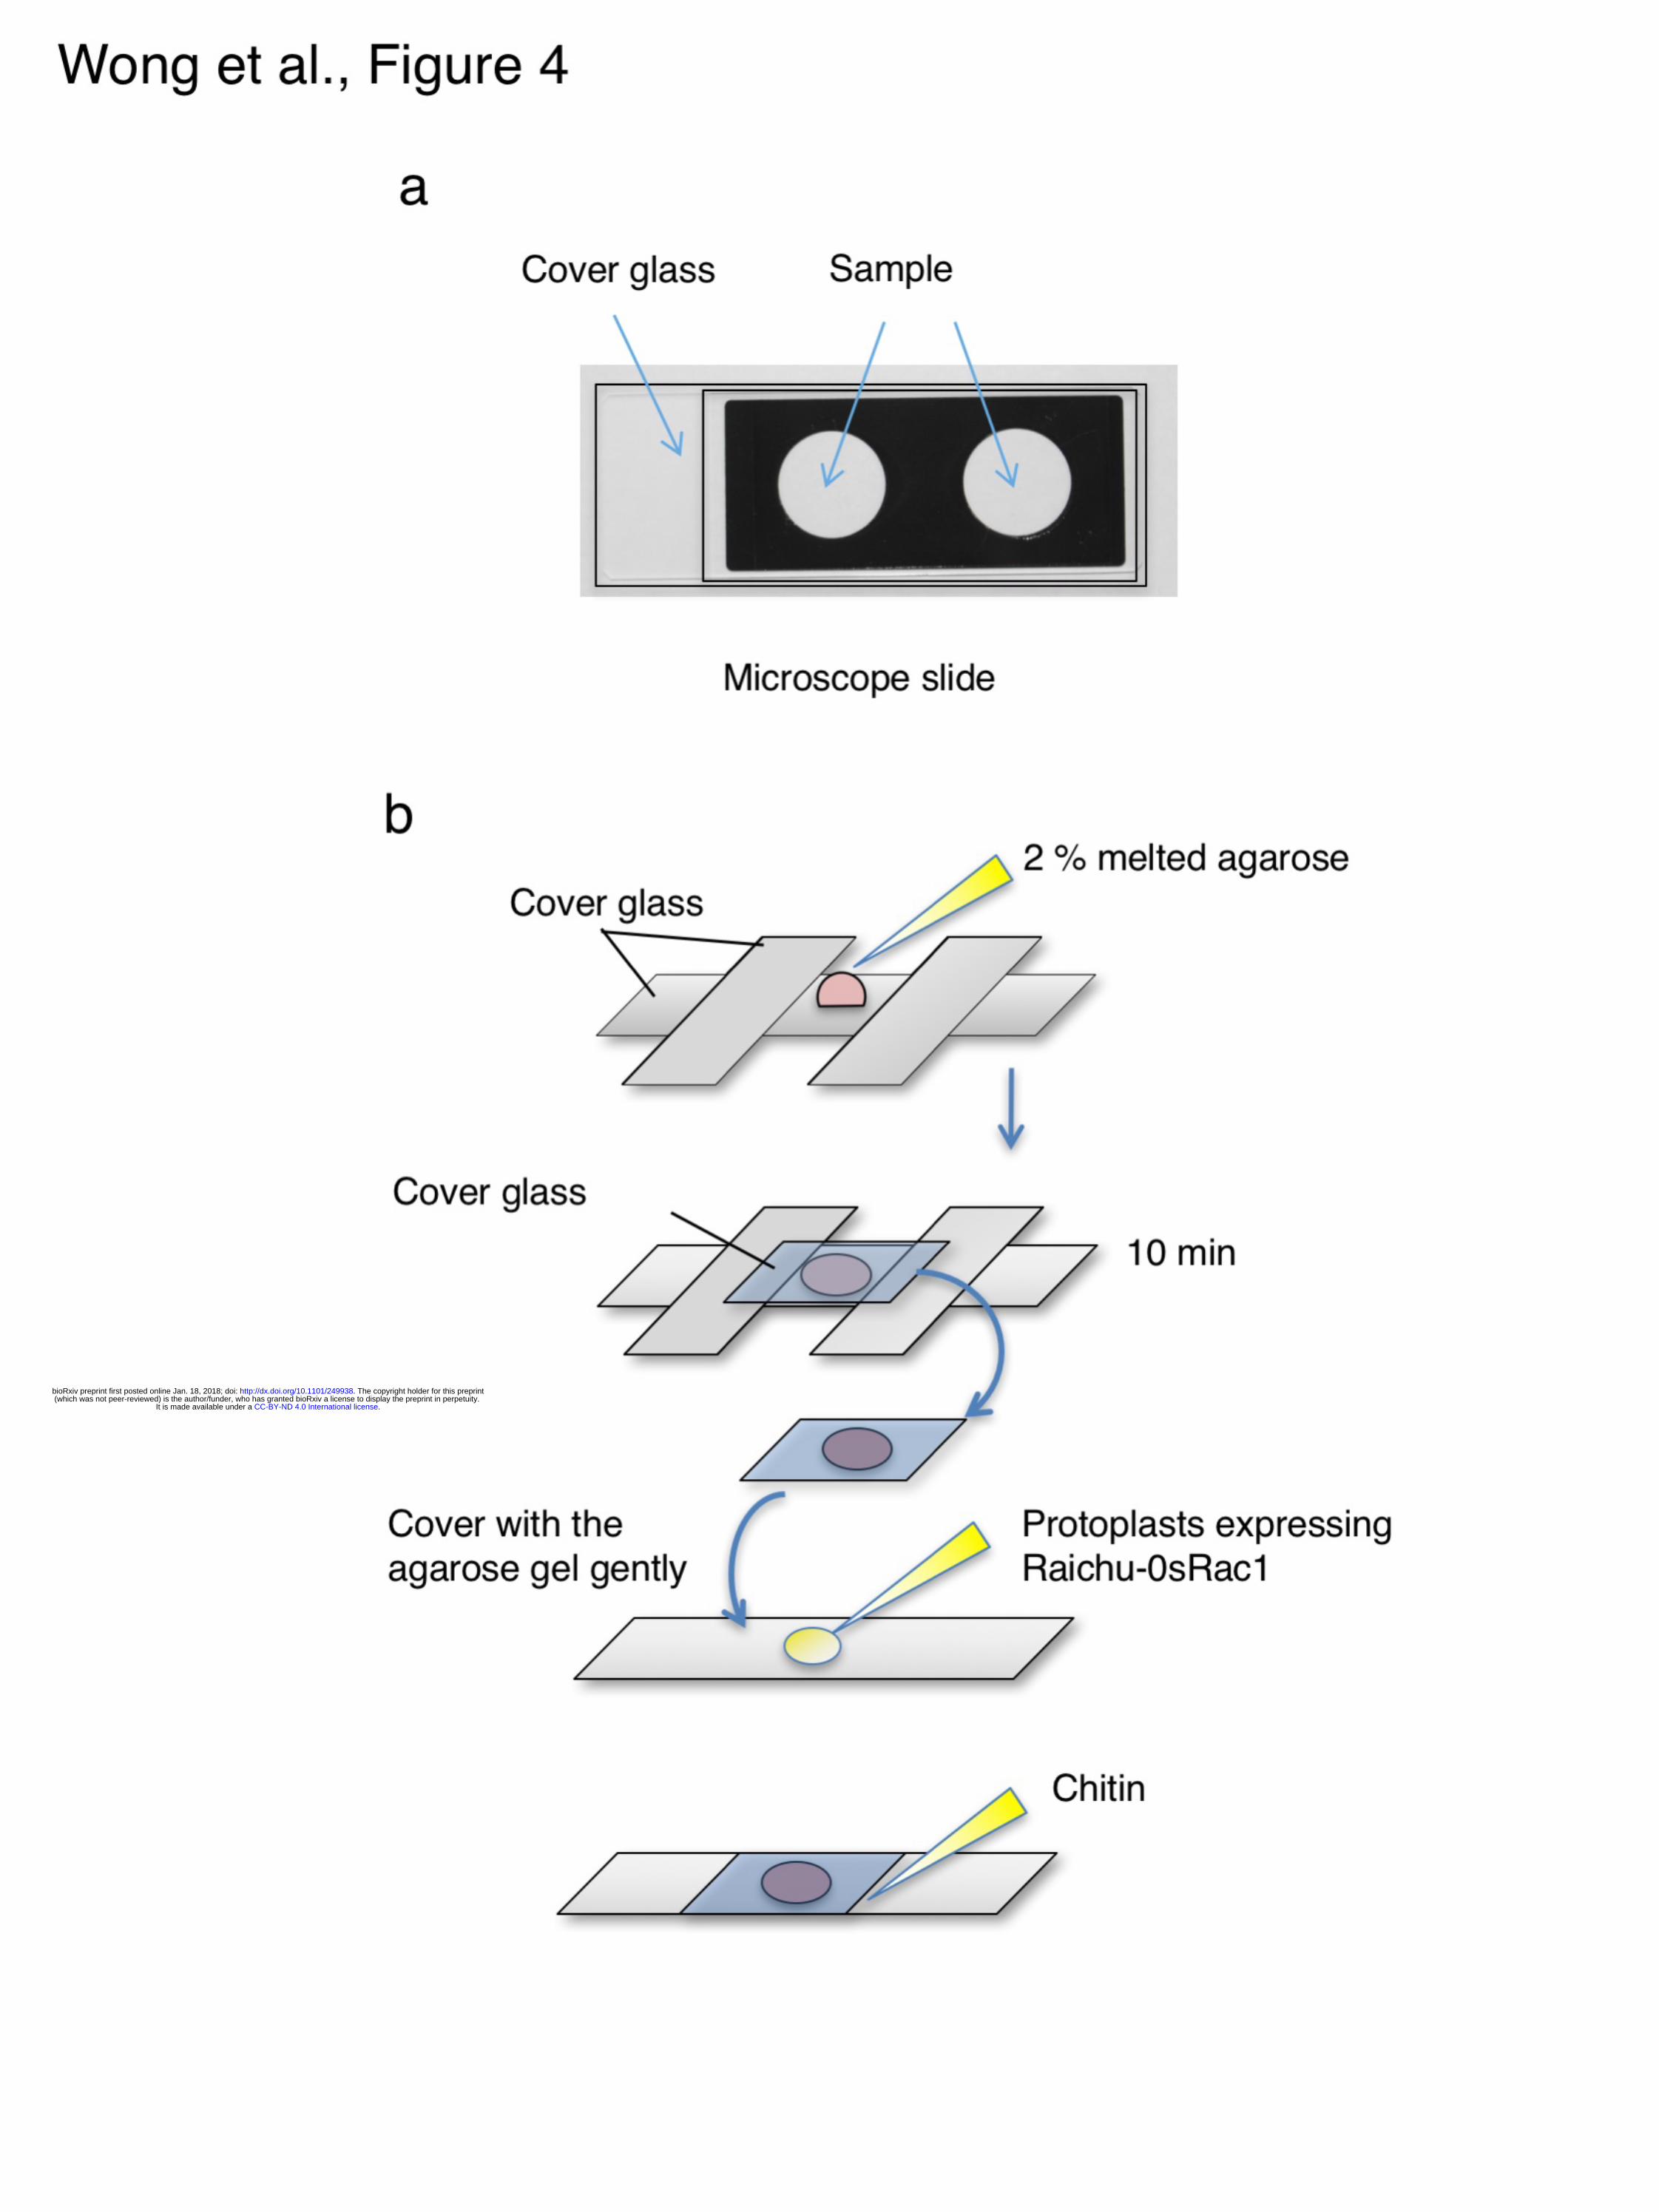
1| Mount 10 µl of the transfected rice protoplasts on a microscope slide
We keep the 1.5-ml tube upright for 30 min to collect the transfected cells at the bottom
of the tube, and then transfer 10 µl of the cells to the recess of a microscope slide glass
printed with a highly water-repellent mark and cover it with a cover glass using a nail
varnish (Fig. 4 a).
In time-lapse experiments using chitin, we prepare a smaller cover glass (24 x 32
mm, thickness 0.12-0.17 mm) coated on its underside with 2% low-melting-temperature
agarose, according to Fig. 4 b. We sandwich the melted agarose between the smaller and
a larger (24 x 60 mm, thickness 0.12-0.17 mm) cover glass, using two large cover
.CC-BY-ND 4.0 International licenseIt is made available under a (which was not peer-reviewed) is the author/funder, who has granted bioRxiv a license to display the preprint in perpetuity.
The copyright holder for this preprint. http://dx.doi.org/10.1101/249938doi: bioRxiv preprint first posted online Jan. 18, 2018;

22
glasses as spacers, and allow it to set for 10 min. We put 10 µl of the transfected cells
onto a new larger cover glass. To situate the cells, they are sandwiched between this
larger cover glass and the smaller cover glass coated with low-melting-temperature
agarose. Chitin is added via a small opening between the two cover glasses.
2| Open MetaMorph software and obtain images of Raichu-OsRac1
We use an inverted microscope (IX81: Olympus) equipped with a Confocal Scanner
Unit (CSU22: Yokokawa), a Dual-View image splitter (DualView: Optical Insights),
and a CCD camera (EM-CCD C9100-02: Hamamatsu). MetaMorph is used for
capturing and analysing images. Using Multi Dimensional Acquisition Mode, donor
protein CFP is excited by a 440-nm diode laser, and we then take images for CFP (480
± 15 nm) and Venus (535 ± 20 nm) at the same time. Our typical imaging conditions are
sensitivity 50-150, and exposure time 1000-1500 msec. It is important to obtain images
from healthy transfected cells that show appropriate localization of Raichu-OsRac1 in
the plasma membrane (34), and also to carefully adjust sensitivity and exposure time to
avoid saturation of the fluorescence images. Finally, we take photos of the protoplasts
expressing Raichu-OsRac1.
3| Subtract background and make ratio images
The emission spectra of CFP and Venus fluorescence are obtained simultaneously using
a Dual-View image splitter. This slightly misaligns the position of CFP and Venus
images, and the misalignment is corrected using the Align function of MetaMorph
software. To precisely measure the fluorescence intensities of CFP and Venus,
background fluorescence is subtracted from the images. The Region of Interest (ROI) is
.CC-BY-ND 4.0 International licenseIt is made available under a (which was not peer-reviewed) is the author/funder, who has granted bioRxiv a license to display the preprint in perpetuity.
The copyright holder for this preprint. http://dx.doi.org/10.1101/249938doi: bioRxiv preprint first posted online Jan. 18, 2018;

23
selected within appropriate areas that are devoid of fluorescent objects, and this
background fluorescent intensity is subtracted from whole images.
4| Merge processed CFP and Venus images into a single image and measure the
Venus/CFP ratio
Using the background-subtracted CFP and Venus images, Venus images are divided by
CFP images, thereby creating Venus/CFP ratio images. To quantitatively measure the
Venus/CFP ratio images, we set ROIs over the cells of interest to measure the average
intensity of Venus and CFP images using the Region Measurement function of
MetaMorph software, and the obtained value is exported to a Microsoft Excel file. To
visualize the activation level of OsRac1, the Venus/CFP ratio images are
pesudo-coloured with the intensity-modulated display (IMD) mode, which divides the
mean signal intensity of the Venus/CFP ratio into eight colours from red to blue (Fig. 5).
In general, we can obtain sufficient dynamic ranges when we set the upper and lower
limits of the IMD mode at about 0.5 higher and lower than the average ratio of
Venus/CFP for Raichu-CA-OsRac1 and -DN-OsRac1, respectively.
5| Process data
For statistical analyses, corrected FRET (cFRET) followed by normalized FRET
(nFRET) are calculated, according to Sorkin et al., (35) with minor modifications.
Fluorescence in the Venus channel consists of FRET and non-FRET fluorescence
derived from the cross-over of Venus and CFP fluorescence through the FRET filters.
Cross-over between Venus and CFP fluorescence divides into two factors: CFP
emission detected in the Venus channel (xCFP) and Venus emission induced by CFP
.CC-BY-ND 4.0 International licenseIt is made available under a (which was not peer-reviewed) is the author/funder, who has granted bioRxiv a license to display the preprint in perpetuity.
The copyright holder for this preprint. http://dx.doi.org/10.1101/249938doi: bioRxiv preprint first posted online Jan. 18, 2018;

24
excitation (yVenus). cFRET is calculated as follows: cFRET = total Venus – xCFP –
yVenus. The extent of cross-over (x and y) is a characteristic value in each optical
system and must be obtained in advance using cells expressing either Venus or CFP and
the following formulae:
Cells expressing CFP
x = Fluorescence in Venus channel when CFP is activated by CFP excitation / CFP
emission induced by CFP excitation
Cells expressing Venus
y = Fluorescence in Venus channel when Venus is activated by CFP excitation / Venus
emission induced by Venus excitation
In our optical system, x and y are about 0.77 and 0.02, respectively, which are
conservative values that we can continue to use until we change the optical system. The
y value is much smaller than the x value, and we do not take the y value into
consideration. As shown in the formula above, the cFRET value is affected by the
expression level of CFP and Venus; thus, cFRET is divided by CFP as follows: nFRET
= cFRET/CFP emission induced by CFP excitation.
To examine whether the activation of OsRac1 increased FRET efficiency in living cells,
we transfected rice protoplasts with Raichu-OsRac1 WT, DN and CA. OsRac1 has been
shown previously to localize to the plasma membrane (34). Consistent with this,
Raichu-OsRac1 was localized mainly at the plasma membrane. The ratio of Venus/CFP
fluorescence in protoplasts expressing Raichu-CA-OsRac1 was higher than those in
.CC-BY-ND 4.0 International licenseIt is made available under a (which was not peer-reviewed) is the author/funder, who has granted bioRxiv a license to display the preprint in perpetuity.
The copyright holder for this preprint. http://dx.doi.org/10.1101/249938doi: bioRxiv preprint first posted online Jan. 18, 2018;

25
protoplasts expressing either Raichu-WT-OsRac1 or Raichu-DN-OsRac1 (Fig. 5 a),
indicating that the interaction between CRIB and OsRac1 occurs only when OsRac1 is
activated. These results demonstrate that the ratios of Venus/CFP fluorescence for
Raichu-OsRac1 reflect the activation state of OsRac1 in rice protoplasts.
We have previously found that a PRONE-type GEF, OsRacGEF1, displays GEF
activity towards OsRac1 in vitro and plays an important role in the activation of OsRac1
in chitin-induced immune responses (28). To extend that observation, we next tried to
monitor the activation of OsRac1 by OsRacGEF1 in living cells. In control
GUS-transfected cells, the ratio of Venus/CFP fluorescence of Raichu-OsRac1 was low,
but when we expressed the PRONE domain of OsRac1GEF1 (OsRacGEF1 PRONE),
the ratio increased (Fig. 5 b), showing that OsRacGEF1 PRONE indeed activates
OsRac1 in rice protoplasts.
To elucidate the spatiotemporal regulation of OsRac1 activation in
MAMP-triggered immunity, we treated the rice protoplasts with chitin, which is a
component of pathogenic and non-pathogenic fungi and is one of the best-studied
MAMPs. Chitin markedly and rapidly induced OsRac1 activation in the rice
protoplasts; in contrast, the OsRac1 activation level was negligible in cells treated with
buffer (Fig. 5 c). Together, these results show that OsRac1 is rapidly activated at the
plasma membrane of rice protoplasts after chitin elicitor treatment.
TROUBLESSHOOTING (Also see Table 1)
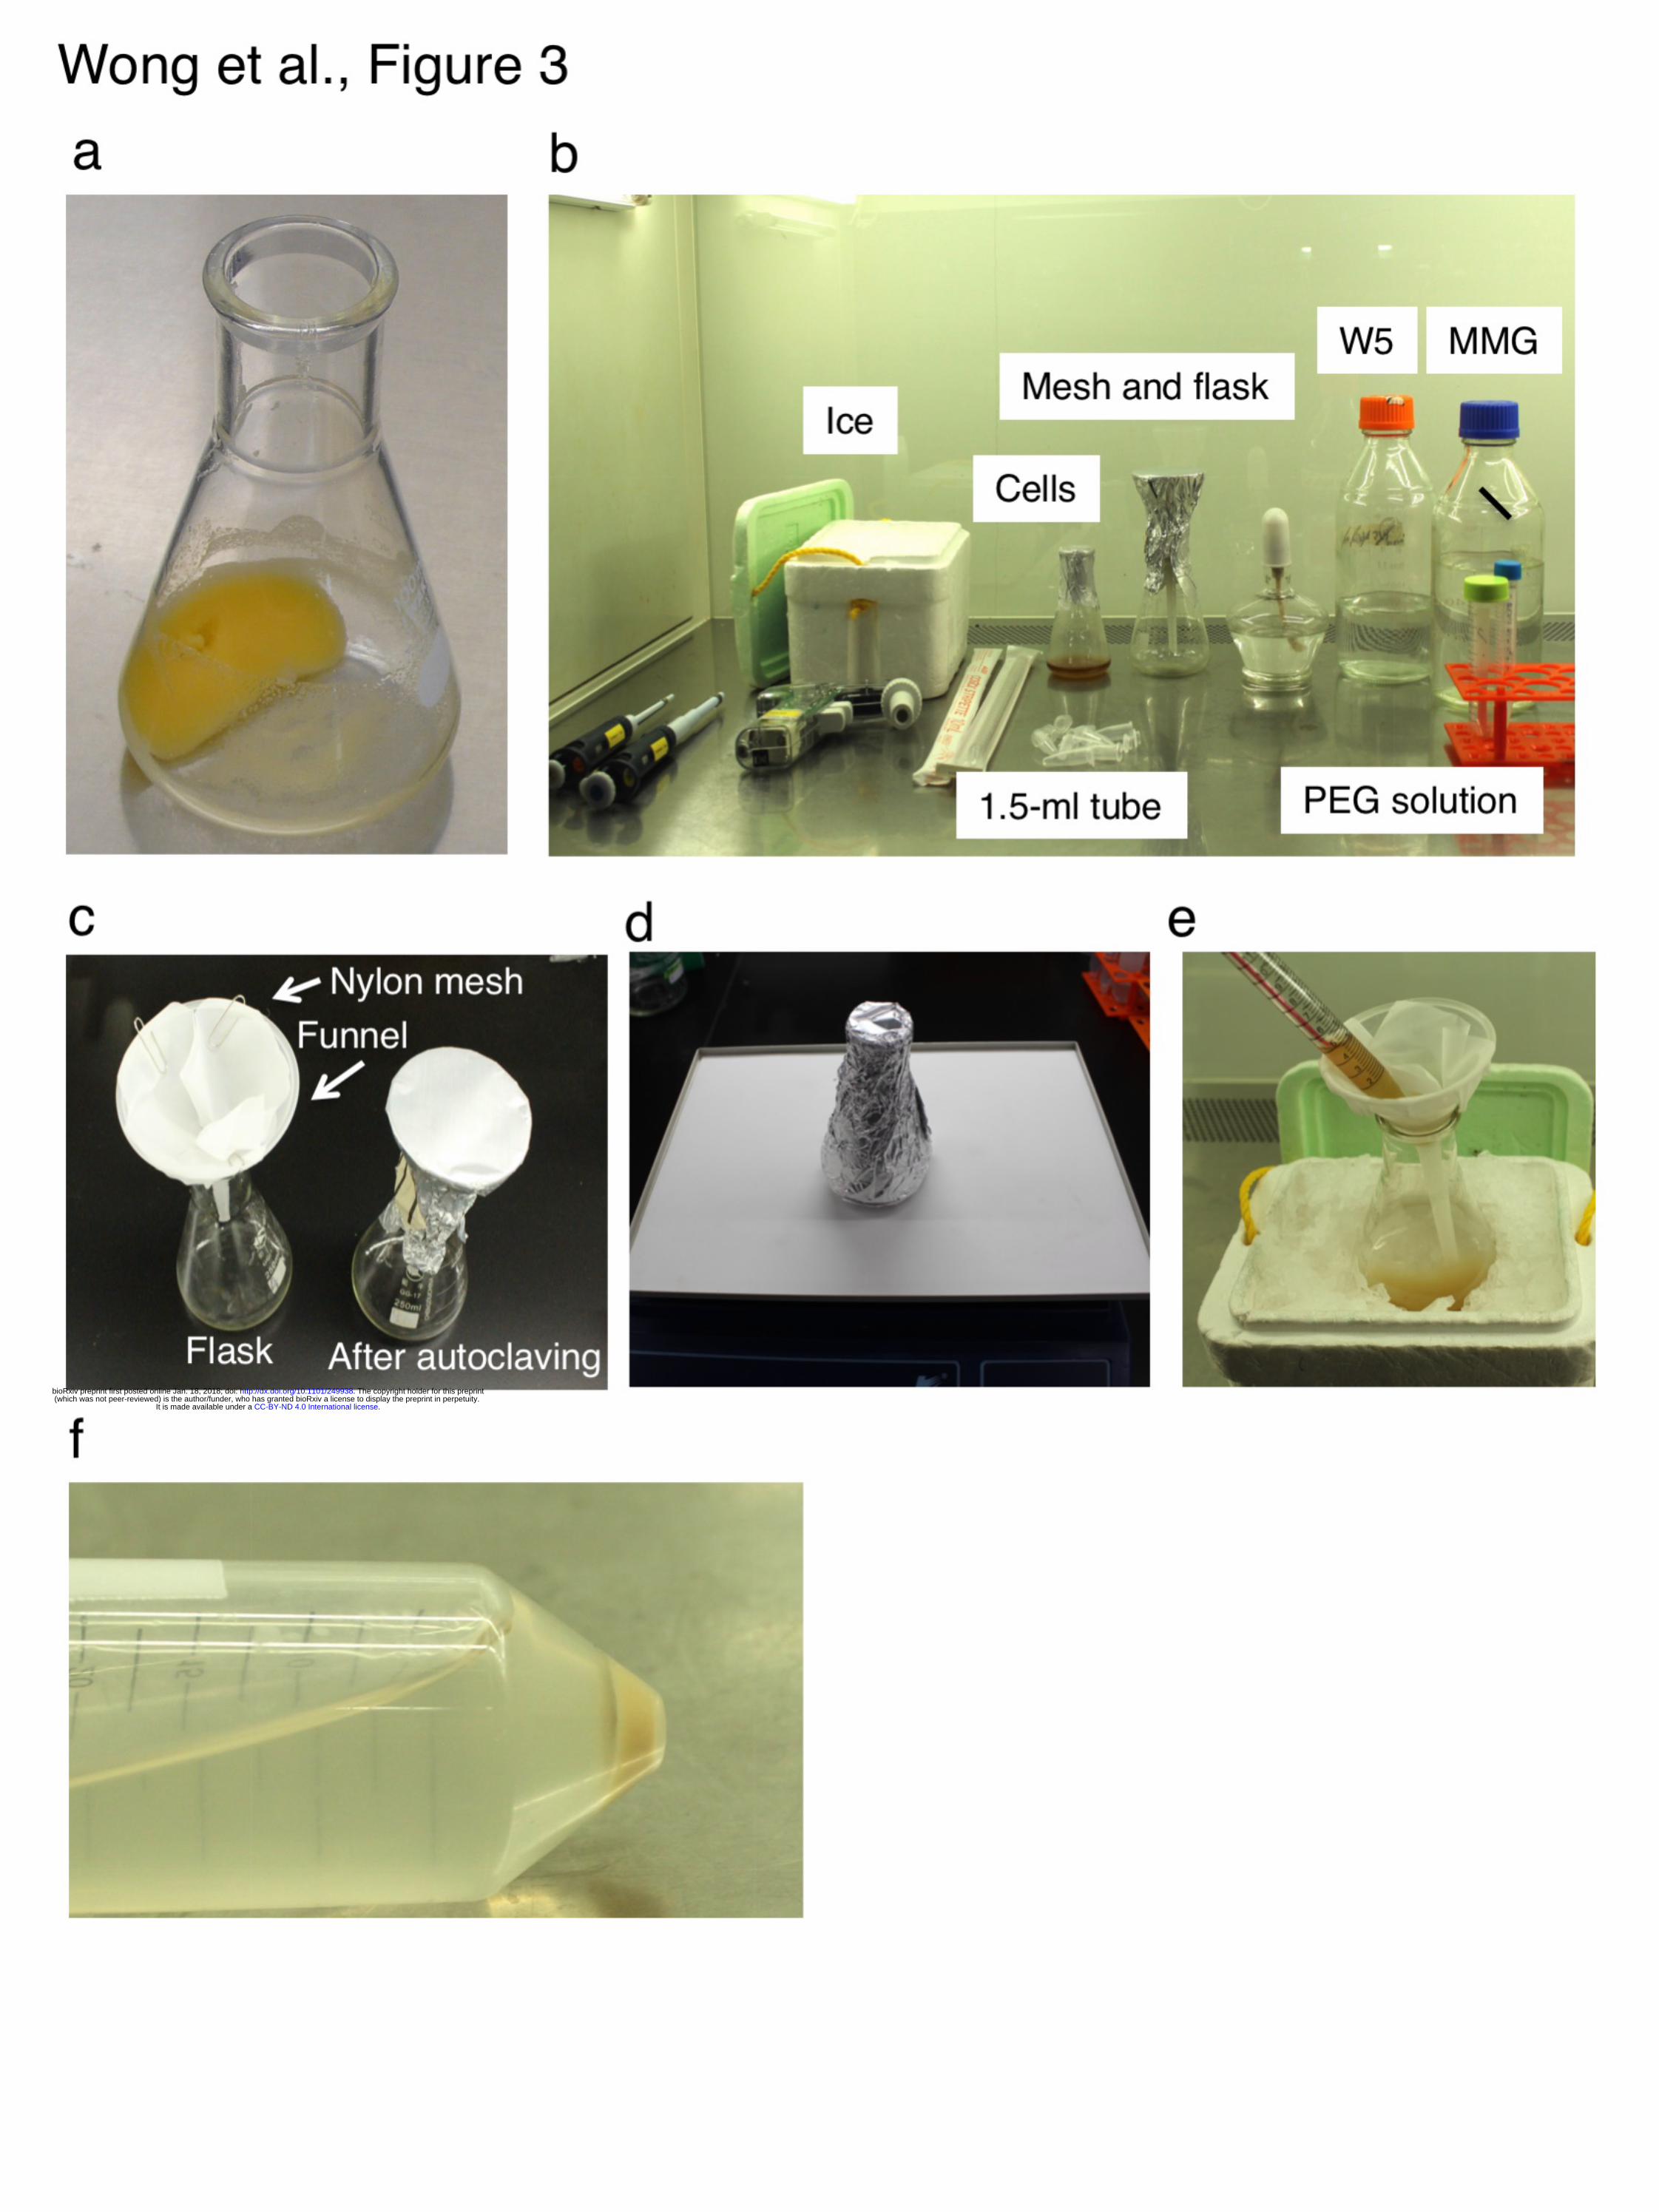
The condition of the Oc cells is the most important factor to obtain successful results,
.CC-BY-ND 4.0 International licenseIt is made available under a (which was not peer-reviewed) is the author/funder, who has granted bioRxiv a license to display the preprint in perpetuity.
The copyright holder for this preprint. http://dx.doi.org/10.1101/249938doi: bioRxiv preprint first posted online Jan. 18, 2018;

26
and the cells have to be treated carefully. Cells that are in good condition are bright
yellow, and a white colour indicates that they are not in good condition (Fig. 3 a). The
incubation time strongly affects transfection efficiency and yield of cells. In Oc cells, a
3-h treatment is sufficient to obtain protoplasts, but if you cannot obtain sufficient
protoplasts, you can extend the incubation time to 5 h. If you are using different rice
cultivars, it may be desirable to optimize the incubation time for your experimental
conditions in advance.
Plasmid purity affects the transfection efficiency and we highly recommend the
use of animal transfection grade plasmid purification kits or CsCl gradient purification.
NOTES and REMARKS
It was important for us to address the issue of whether OsRac1 is activated following
pathogen recognition in planta. We therefore tried to make transgenic rice plants
expressing Raichu-OsRac1. Unfortunately, we have not yet been able to observe
Raichu-OsRac1 fluorescence in planta. This may be due to homology-dependent
silencing of YFP and CFP expression, a problem that has been encountered by other
researchers endeavouring to develop stably expressed FRET biosensors in planta (36).
Further work is necessary to resolve this issue.
ACKNOELEDGEMENTS
We thank Dr. Michiyuki Matsuda for providing the Raichu-Rac1 vector. We appreciate
Ms. Tomoko Aoi and Ms. Xiaoyun Fang for excellent technical assistance. We also
.CC-BY-ND 4.0 International licenseIt is made available under a (which was not peer-reviewed) is the author/funder, who has granted bioRxiv a license to display the preprint in perpetuity.
The copyright holder for this preprint. http://dx.doi.org/10.1101/249938doi: bioRxiv preprint first posted online Jan. 18, 2018;

27
thank the members of the Laboratory of Plant Molecular Genetics at NAIST and the
Laboratory of Signal Transduction and Immunity at PSC for invaluable support and
discussions. A.A. was supported by a fellowship from JSPS. Y.K. was supported by
JSPS KAKENHI, the Takeda Science Foundation, Chinese Academy of Sciences,
Shanghai Institutes for Biological Sciences, Shanghai Center for Plant Stress Biology,
National Natural Science Foundation in China, and Chinese Academy of Sciences
Hundred Talents Program.
H. L. W., A. A, Y. K., and K. S. designed the study; H. L. W., A. A., M. H., T.
M., J. O., K. K., Q. W. and Y. K. performed experiments and analyzed data; Y. K.
wrote the manuscript; M. H., N. I., T. K., and K. S. gave technical support and
conceptual advice.
.CC-BY-ND 4.0 International licenseIt is made available under a (which was not peer-reviewed) is the author/funder, who has granted bioRxiv a license to display the preprint in perpetuity.
The copyright holder for this preprint. http://dx.doi.org/10.1101/249938doi: bioRxiv preprint first posted online Jan. 18, 2018;

28
REFERENCES
1. R. Y. Tsien, A. Miyawaki, Seeing the machinery of live cells. Science 280,
1954-1955 (1998).
2. E. A. Jares-Erijman, T. M. Jovin, FRET imaging. Nat Biotechnol 21, 1387-1395
(2003).
3. K. Aoki, M. Matsuda, Visualization of small GTPase activity with fluorescence
resonance energy transfer-based biosensors. Nature protocols 4, 1623-1631
(2009).
4. A. Miyawaki, J. Llopis, R. Heim, J. M. McCaffery, J. A. Adams, M. Ikura, R. Y.
Tsien, Fluorescent indicators for Ca2+ based on green fluorescent proteins and
calmodulin. Nature 388, 882-887 (1997).
5. N. Mochizuki, S. Yamashita, K. Kurokawa, Y. Ohba, T. Nagai, A. Miyawaki, M.
Matsuda, Spatio-temporal images of growth-factor-induced activation of Ras
and Rap1. Nature 411, 1065-1068 (2001).
6. F. Sipieter, P. Vandame, C. Spriet, A. Leray, P. Vincent, D. Trinel, J. F. Bodart, F.
B. Riquet, L. Heliot, From FRET imaging to practical methodology for kinase
activity sensing in living cells. Prog Mol Biol Transl Sci 113, 145-216 (2013).
7. M. Paduch, F. Jelen, J. Otlewski, Structure of small G proteins and their
regulators. Acta Biochim Pol 48, 829-850 (2001).
8. K. Wennerberg, K. L. Rossman, C. J. Der, The Ras superfamily at a glance. J
Cell Sci 118, 843-846 (2005).
9. H. Li, G. Wu, D. Ware, K. R. Davis, Z. Yang, Arabidopsis Rho-related GTPases:
differential gene expression in pollen and polar localization in fission yeast.
Plant Physiol 118, 407-417 (1998).
10. T. Kawasaki, K. Henmi, E. Ono, S. Hatakeyama, M. Iwano, H. Satoh, K.
Shimamoto, The small GTP-binding protein Rac is a regulator of cell death in
plants. Proc Natl Acad Sci U S A 96, 10922-10926 (1999).
11. P. Winge, T. Brembu, R. Kristensen, A. M. Bones, Genetic structure and
evolution of RAC-GTPases in Arabidopsis thaliana. Genetics 156, 1959-1971
(2000).
12. J. Cherfils, M. Zeghouf, Regulation of small GTPases by GEFs, GAPs, and
.CC-BY-ND 4.0 International licenseIt is made available under a (which was not peer-reviewed) is the author/funder, who has granted bioRxiv a license to display the preprint in perpetuity.
The copyright holder for this preprint. http://dx.doi.org/10.1101/249938doi: bioRxiv preprint first posted online Jan. 18, 2018;

29
GDIs. Physiol Rev 93, 269-309 (2013).
13. C. Craddock, I. Lavagi, Z. Yang, New insights into Rho signaling from plant
ROP/Rac GTPases. Trends Cell Biol 22, 492-501 (2012).
14. S. Yalovsky, Protein lipid modifications and the regulation of ROP GTPase
function. J Exp Bot 66, 1617-1624 (2015).
15. Y. Kawano, T. Kaneko-Kawano, K. Shimamoto, Rho family GTPase-dependent
immunity in plants and animals. Frontiers in plant science 5, 522 (2014).
16. Y. Kawano, K. Shimamoto, Early signaling network in rice PRR- and
R-mediated immunity. Curr Opin Plant Biol. 16, 496–504 (2013).
17. E. E. Sander, S. van Delft, J. P. ten Klooster, T. Reid, R. A. van der Kammen, F.
Michiels, J. G. Collard, Matrix-dependent Tiam1/Rac signaling in epithelial cells
promotes either cell-cell adhesion or cell migration and is regulated by
phosphatidylinositol 3-kinase. J Cell Biol 143, 1385-1398 (1998).
18. L. Z. Tao, A. Y. Cheung, H. M. Wu, Plant Rac-like GTPases are activated by
auxin and mediate auxin-responsive gene expression. Plant Cell 14, 2745-2760
(2002).
19. Y. Kawano, A. Akamatsu, K. Hayashi, Y. Housen, J. Okuda, A. Yao, A.
Nakashima, H. Takahashi, H. Yoshida, H. L. Wong, T. Kawasaki, K. Shimamoto,
Activation of a Rac GTPase by the NLR family disease resistance protein Pit
plays a critical role in rice innate immunity. Cell Host Microbe 7, 362-375
(2010).
20. T. Xu, M. Wen, S. Nagawa, Y. Fu, J. G. Chen, M. J. Wu, C. Perrot-Rechenmann,
J. Friml, A. M. Jones, Z. Yang, Cell surface- and rho GTPase-based auxin
signaling controls cellular interdigitation in Arabidopsis. Cell 143, 99-110
(2010).
21. V. S. Kraynov, C. Chamberlain, G. M. Bokoch, M. A. Schwartz, S. Slabaugh, K.
M. Hahn, Localized Rac activation dynamics visualized in living cells. Science
290, 333-337 (2000).
22. Y. Fu, Y. Gu, Z. Zheng, G. Wasteneys, Z. Yang, Arabidopsis interdigitating cell
growth requires two antagonistic pathways with opposing action on cell
morphogenesis. Cell 120, 687-700 (2005).
23. A. Miyawaki, Visualization of the spatial and temporal dynamics of intracellular
.CC-BY-ND 4.0 International licenseIt is made available under a (which was not peer-reviewed) is the author/funder, who has granted bioRxiv a license to display the preprint in perpetuity.
The copyright holder for this preprint. http://dx.doi.org/10.1101/249938doi: bioRxiv preprint first posted online Jan. 18, 2018;

30
signaling. Dev Cell 4, 295-305 (2003).
24. R. E. Itoh, K. Kurokawa, Y. Ohba, H. Yoshizaki, N. Mochizuki, M. Matsuda,
Activation of rac and cdc42 video imaged by fluorescent resonance energy
transfer-based single-molecule probes in the membrane of living cells. Mol Cell
Biol 22, 6582-6591 (2002).
25. E. Kiyokawa, K. Aoki, T. Nakamura, M. Matsuda, Spatiotemporal regulation of
small GTPases as revealed by probes based on the principle of Forster
Resonance Energy Transfer (FRET): Implications for signaling and
pharmacology. Annual review of pharmacology and toxicology 51, 337-358
(2011).
26. Y. Kawano, L. Chen, K. Shimamoto, The function of Rac small GTPase and
associated proteins in rice innate immunity. Rice 3, 112-121 (2010).
27. Y. Kawano, T. Fujiwara, A. Yao, Y. Housen, K. Hayashi, K. Shimamoto,
Palmitoylation-dependent membrane localization of the rice resistance protein
pit is critical for the activation of the small GTPase OsRac1. J Biol Chem 289,
19079-19088 (2014).
28. A. Akamatsu, H. Wong, M. Fujiwara, J. Okuda, K. Nishide, K. Uno, K. Imai, K.
Umemura, T. Kawasaki, Y. Kawano, K. Shimamoto, An
OsCEBiP/OsCERK1-OsRacGEF1-OsRac1 module is an essential component of
chitin-induced rice immunity. Cell Host Microbe 13, 465-476 (2013).
29. H. L. Wong, R. Pinontoan, K. Hayashi, R. Tabata, T. Yaeno, K. Hasegawa, C.
Kojima, H. Yoshioka, K. Iba, T. Kawasaki, K. Shimamoto, Regulation of rice
NADPH oxidase by binding of Rac GTPase to its N-terminal extension. Plant
Cell 19, 4022-4034 (2007).
30. T. Nakamura, K. Aoki, M. Matsuda, Monitoring spatio-temporal regulation of
Ras and Rho GTPase with GFP-based FRET probes. Methods 37, 146-153
(2005).
31. N. Komatsu, K. Aoki, M. Yamada, H. Yukinaga, Y. Fujita, Y. Kamioka, M.
Matsuda, Development of an optimized backbone of FRET biosensors for
kinases and GTPases. Mol Biol Cell 22, 4647-4656 (2011).
32. A. Baba, S. Hasezawa, Syono、K, Cultivation of Rice Protoplasts and Their
Transformation Mediated by Agrobacterium Spheroplasts. Plant Cell Physiol 27,
.CC-BY-ND 4.0 International licenseIt is made available under a (which was not peer-reviewed) is the author/funder, who has granted bioRxiv a license to display the preprint in perpetuity.
The copyright holder for this preprint. http://dx.doi.org/10.1101/249938doi: bioRxiv preprint first posted online Jan. 18, 2018;

31
463-471 (1986).
33. S. D. Yoo, Y. H. Cho, J. Sheen, Arabidopsis mesophyll protoplasts: a versatile
cell system for transient gene expression analysis. Nature protocols 2,
1565-1572 (2007).
34. E. Ono, H. L. Wong, T. Kawasaki, M. Hasegawa, O. Kodama, K. Shimamoto,
Essential role of the small GTPase Rac in disease resistance of rice. Proc Natl
Acad Sci U S A 98, 759-764 (2001).
35. A. Sorkin, M. McClure, F. Huang, R. Carter, Interaction of EGF receptor and
grb2 in living cells visualized by fluorescence resonance energy transfer (FRET)
microscopy. Curr Biol 10, 1395-1398 (2000).
36. K. Deuschle, B. Chaudhuri, S. Okumoto, I. Lager, S. Lalonde, W. B. Frommer,
Rapid metabolism of glucose detected with FRET glucose nanosensors in
epidermal cells and intact roots of Arabidopsis RNA-silencing mutants. Plant
Cell 18, 2314-2325 (2006).
.CC-BY-ND 4.0 International licenseIt is made available under a (which was not peer-reviewed) is the author/funder, who has granted bioRxiv a license to display the preprint in perpetuity.
The copyright holder for this preprint. http://dx.doi.org/10.1101/249938doi: bioRxiv preprint first posted online Jan. 18, 2018;

32
FIGURE LEGENDS
Figure 1. Mechanism of Raichu-OsRac1 FRET sensor
a, Schematic representation of original Raichu and Raichu-Rac1 intramolecular FRET
biosensors. b, Raichu-Rac1 consists of the fluorescent protein Venus (yellow), the
CRIB domain of PAK (grey), the small GTPase Rac1 (red) and the fluorescent protein
CFP (cyan). When OsRac1 is bound to GDP, the intramolecular association between the
CRIB domain of PAK is weak, and fluorescence of 475 nm thus emanates from CFP
upon excitation at 433 nm. When OsRac1 is bound to GTP, intramolecular interaction
between the PAK CRIB domain and OsRac1 brings CFP and Venus into close
proximity, causing FRET and fluorescence of Venus at 525 nm. c, Binding specificity
of the PAK CRIB domain for OsRac1 in an in vitro binding assay.
Sepharose-immobilized GST-CRIB was incubated with extracts from HEK293 cells
expressing GFP-CA-OsRac1 or GFP-DN-OsRac1. After washing, bound proteins were
eluted by the addition of SDS-PAGE sample buffer. The eluted fractions were
immunoblotted with anti-GFP (Roche) (upper panels) and anti-GST (Santa Cruz) (lower
panel) antibodies.
Figure 2. Experimental flow
Figure 3. Materials for transfection of rice protoplasts with Raichu-OsRac1
.CC-BY-ND 4.0 International licenseIt is made available under a (which was not peer-reviewed) is the author/funder, who has granted bioRxiv a license to display the preprint in perpetuity.
The copyright holder for this preprint. http://dx.doi.org/10.1101/249938doi: bioRxiv preprint first posted online Jan. 18, 2018;

33
a, Healthy Oc cells. b, Materials required for transfection on a clean bench. c,
Preparation of a funnel with a nylon mesh filter. d, Cellulase treatment on an orbital
shaker. Incubate the cells with shaking at 50 rpm. e, Filtration of cellulase-treated Oc
cells. f, Precipitated cells after centrifugation with a swinging bucket rotor.
Figure 4. Mounting the transfected rice protoplasts on a microscope slide
a, Mounting transfected cells on a microscope slide. b, Preparing a cover glass coated
with low-melting-temperature agarose, and chitin treatment.
Figure 5. Validating the Raichu-OsRac1 FRET sensor and monitoring OsRac1
activation after treatment of rice protoplasts with the MAMP chitin
a and b, Emission ratio images of rice protoplasts expressing Raichu-OsRac1 mutants.
Rice protoplasts were transfected with constructs expressing Raichu-OsRac1 WT,
mutants and the PRONE domain of OsRacGEF1. Double asterisks indicate significant
differences from the data for WT-OsRac1 or control GUS enzyme (P < 0.01). Error bars
indicate SE (n > 30). c, Time-lapse imaging of rice protoplasts expressing
Raichu-OsRac1-WT after chitin treatment. Red line, 0.5 µg/ml chitin treatment; blue
line, W5 buffer treatment. The FRET images are shown in IMD mode, which associates
colour hue with emission ratio values and the intensity of each hue with the brightness
of the source image. Bars: 5 µm.
.CC-BY-ND 4.0 International licenseIt is made available under a (which was not peer-reviewed) is the author/funder, who has granted bioRxiv a license to display the preprint in perpetuity.
The copyright holder for this preprint. http://dx.doi.org/10.1101/249938doi: bioRxiv preprint first posted online Jan. 18, 2018;
34
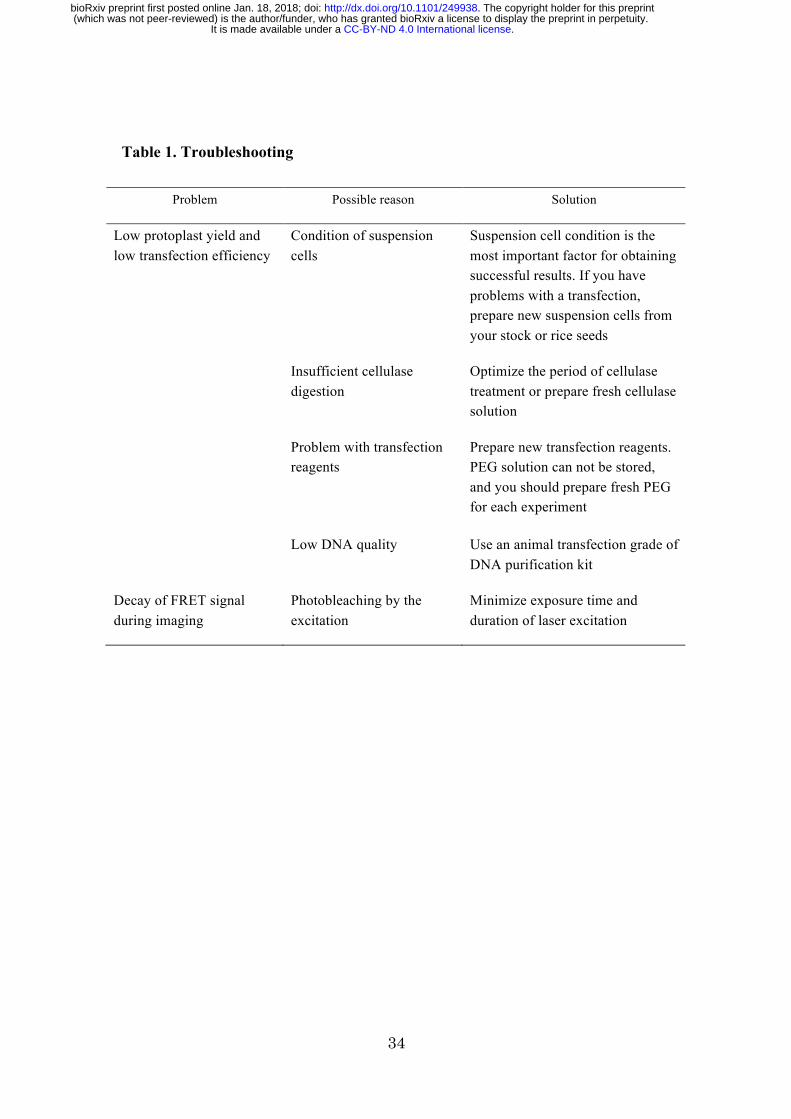
Table 1. Troubleshooting
Problem Possible reason Solution
Low protoplast yield and low transfection efficiency
Condition of suspension cells
Suspension cell condition is the most important factor for obtaining successful results. If you have problems with a transfection, prepare new suspension cells from your stock or rice seeds
Insufficient cellulase digestion
Optimize the period of cellulase treatment or prepare fresh cellulase solution
Problem with transfection reagents
Prepare new transfection reagents. PEG solution can not be stored, and you should prepare fresh PEG for each experiment
Low DNA quality Use an animal transfection grade of DNA purification kit
Decay of FRET signal during imaging
Photobleaching by the excitation
Minimize exposure time and duration of laser excitation
.CC-BY-ND 4.0 International licenseIt is made available under a (which was not peer-reviewed) is the author/funder, who has granted bioRxiv a license to display the preprint in perpetuity.
The copyright holder for this preprint. http://dx.doi.org/10.1101/249938doi: bioRxiv preprint first posted online Jan. 18, 2018;