india strategy_ getting on track!– detailed report
DESCRIPTION
stock and investmentTRANSCRIPT

7/24/2015 India Strategy: Getting on track!– Detailed Report
http://www.motilaloswal.com/site/rreports/HTML/635721163512170886/index.htm 1/85
India Strategy | Get on Juneplease !track 2015
India StrategyFY03‐08:25% CAGR
FY93‐96:45% CAGR
FY96‐03:1% CAGR
FY93‐FY15:14% CAGR
FY08‐15:8% CAGR
FY15‐17E:20% CAGR
Getting on track!Research Team ([email protected])

7/24/2015 India Strategy: Getting on track!– Detailed Report
http://www.motilaloswal.com/site/rreports/HTML/635721163512170886/index.htm 2/85
ContentsIndia Strategy ‐ Getting on track! ................................................................................................. 1‐721QFY16 Highlights & Ready Reckoner ...................................................................................... 73‐85Sectors & Companies ............................................................................................................... 86‐3201. Automobiles
Amara Raja BatteriesAshok LeylandBajaj AutoBharat ForgeEicher MotorsExide IndustriesHero MotoCorpMahindra & MahindraMaruti Suzuki IndiaTata MotorsTVS Motor
2. Capital GoodsABBBHELBharat ElectronicsCrompton GreavesCummins IndiaHavells IndiaLarsen & ToubroSiemensThermaxVoltas
3. CementACCAmbuja CementGrasim IndustriesIndia CementsRamco CementShree CementUltraTech Cement
4. ConsumerAsian PaintsBritannia IndustriesColgate PalmoliveDabur IndiaEmamiGodrej Consumer ProductsGSK ConsumerHindustan UnileverITCJyothy LabsMaricoNestle IndiaPidilite IndustriesRadico KhaitanUnited Spirits
5a. Financials ‐ BanksAxis BankBank of BarodaBank of IndiaDCB BankFederal BankHDFC BankICICI BankIndian BankIndusInd BankKotak Mahindra BankPunjab National BankState Bank of IndiaUnion Bank
87‐101919293949596979899
100101
102‐115106107108109110111112113114115
116‐126120121122123124125126
127‐144130131132133134135136137138139140141142143144
145‐163150151152153154155156157158159160161162
Yes Bank5b. Financials ‐ NBFC
Bajaj FinanceDewan HousingHDFCIDFCIndiabulls HousingLIC Housing FinanceM & M Financial ServicesPower Finance CorporationRepcoRural ElectricficationShriram Transport
6. HealthcareAlembic PharmaAurobindo PharmaBioconCadila HealthcareCiplaDivi’s LaboratoriesDr Reddy’s Labs.Glenmark PharmaGSK PharmaIPCA LaboratoriesLupinSanofi IndiaSun PharmaceuticalsTorrent Pharma
7. MediaD B CorpDish TVHathway CableHT MediaJagran PrakashanPVRSiti CableSun TV NetworkZee Entertainment
8. MetalsHindalcoHindustan ZincJSW SteelNalcoNMDCSesa SterliteSAILTata Steel
9. Oil & GasBPCLCairn IndiaGAILGujarat State PetronetHPCLIOCIndraprastha GasMRPLOil IndiaONGCPetronet LNGReliance Industries
163164‐176
166167168169170171172173174175176
177‐194181182183184185186187188189190191192193194
195‐207199200201202203204205206207
208‐222215216217218219220221222
223‐239228229230231232233234235236237238239
10. Real EstateDLFGodrej PropertiesIndiabulls Real EstateMahindra LifespacesOberoi RealtyPhoenix MillsPrestige Estate ProjectsSobha Developers
11. RetailJubilant FoodShoppers StopTitan Company
240‐252245246247248249250251252
253‐258256257258
259‐274264265266267268269270271272273274
275‐283280281282283
284‐297288289290291292293294295296297
298‐316298299300301302303304305306307308309310311312313314315316
12. TechnologyCognizant TechnologyHCL TechnologiesHexaware TechnologiesInfosysKPIT TechnologiesMindtreeMphasiSPersistent SystemsTCSTech MahindraWipro
13. TelecomBharti AirtelBharti InfratelIdea CellularReliance Communication
14. UtilitiesCESCCoal IndiaJSW EnergyNHPCNTPCPower Grid Corp.PTC IndiaRattanindia PowerReliance InfrastructureTata Power
15. OthersArvindBata IndiaCastrol IndiaConcorCoromandel InternationalDynamatic TechGateway DistriparkGujarat Pipavav PortInfo EdgeInox LeisureJain IrrigationJust DialKaveri SeedsMonsanto IndiaSintex IndustriesTata ElxsiTTK PrestigeUPLV‐Guard Industries
Note: All stock prices and indices for companies as on 30 June 2015, unless otherwise statedInvestors are advised to refer through disclosures made at the end of the Research Report.

7/24/2015 India Strategy: Getting on track!– Detailed Report
http://www.motilaloswal.com/site/rreports/HTML/635721163512170886/index.htm 3/85
India Strategy | Getting on track!
India StrategyBSE Sensex: 27,574 S&P CNX: 8,329
Getting on track!Inflation, INR, Deficits well in control now; Govt spending to drive capexrecovery; Earnings to rebound in FY16/17
1QFY16 PREVIEW: Another quarter of decline! Worst is likely over! |1QFY16 performance of MOSL Universe: Third consecutive quarter of PATde‐growth
Motilal Oswal values yoursupport in the AsiamoneyBrokers Poll 2015 for IndiaResearch, Sales and Tradingteam. We request your ballot.
Our bottom‐up estimates indicate a 1% YoY decline in aggregate PAT for theMOSL Universe (ex‐RMs). Sales would remain flat and EBITDA would growmoderately (4%). The fall in global commodities, delay in revival of theinvestment cycle and muted rural consumption continue to impact growth ofcorporate India.Only seven sectors are expected to witness double‐digit PAT growth—Media(36%), Telecom (23%), Capital Goods (18%), Private Banks (17%), Consumer(14%), Oil (11%) and Retail (11%). Six sectors would likely report PAT de‐growth—Healthcare (‐1%), Auto (‐7%), Real Estate (‐11%), PSU Banks (‐27%),Cement (‐33%) and Metals (‐52%).Nifty PAT (ex‐BPCL) is likely to remain flat YoY—an improvement over 11% de‐growth in 4QFY15. Sales would marginaly decline (‐1%) in 1QFY16 (v/s ‐6% in4QFY15).About one‐fourth of the Nifty constituents would report >15% YoY PAT growth;however, this would be offset by PAT de‐growth in more than one‐third of theconstituents. Cyclicals and domestic‐facing companies would contribute to PATde‐growth (14 out of 17 PAT de‐growth companies are cyclical).Top PAT growth companies would be Maruti (77%), Tata Power (63%), Cipla(+41%), ONGC (+41%), Idea (+36%), Yes Bank (+29%), Indusind Bank (+24%) andBharti Airtel (+21).Top PAT de‐growth companies would be Punjab National Bank (‐58%), CairnIndia (‐57%), Bank of Baroda (‐44%), NMDC (‐42%), Ambuja Cement (‐40%),Grasim (‐38%), Hindalco (‐38%) and Tata Motors (‐31%).
Exhibit 1: PAT de‐growth in 1QFY16; expect rebound in 2H
39
22 25 24 26
10 14 125
1914
7 7 916 13
MOSL UniverseQuarterly PAT Growth
16 YoY (%) LPA: 10%22
30
2 18 6
‐6 ‐8 ‐1
‐14‐9
Source: Company, MOSL
July 2015 1
7/24/2015 India Strategy: Getting on track!– Detailed Report
http://www.motilaloswal.com/site/rreports/HTML/635721163512170886/index.htm 4/85
India Strategy | Getting on track!
FY16‐17 ESTIMATES: Expect recovery in 2HFY16 | Government‐led capexand low inflation to lead recovery
Delay in domestic recovery and global commodity fall continue be theheadwinds for earnings growth. Other factors such as muted rural consumption,continuing asset quality woes in PSU banks and adverse cross currencymovements continue to pull down the aggregate growth of corporate India.However, we believe government‐led capital spending and favorable inflationleading to lower rates will create conducive environment for earnings growthrecovery.Our bottom‐up estimates suggest aggregate PAT of the MOSL Universe (ex‐RMs)to rebound to 17%/23% in FY16/FY17. Sales growth would increase moderatelyto 9% in FY16 before jumping to 13% in FY17.Expect Sensex EPS to grow 15% to 1,561 in FY16 and 22% to 1,907 in FY17. Sincethe last preview, three‐fourths of the Sensex companies would see an EPS cut—led by Tata Steel, Sun Pharma, Hindalco, Tata Motors, Coal India and GAIL. Topupgrade drivers are Maruti, NTPC, ONGC and Bajaj Auto.One‐third of the Sensex companies would contribute more than two‐thirds ofFY16 Sensex EPS expansion. Key contributors to the EPS expansion would beONGC, Tata Motors, ICICI Bank, HDFC Bank, Tata Steel and Reliance Ind, M&M,Axis Bank, HDFC and SBI.
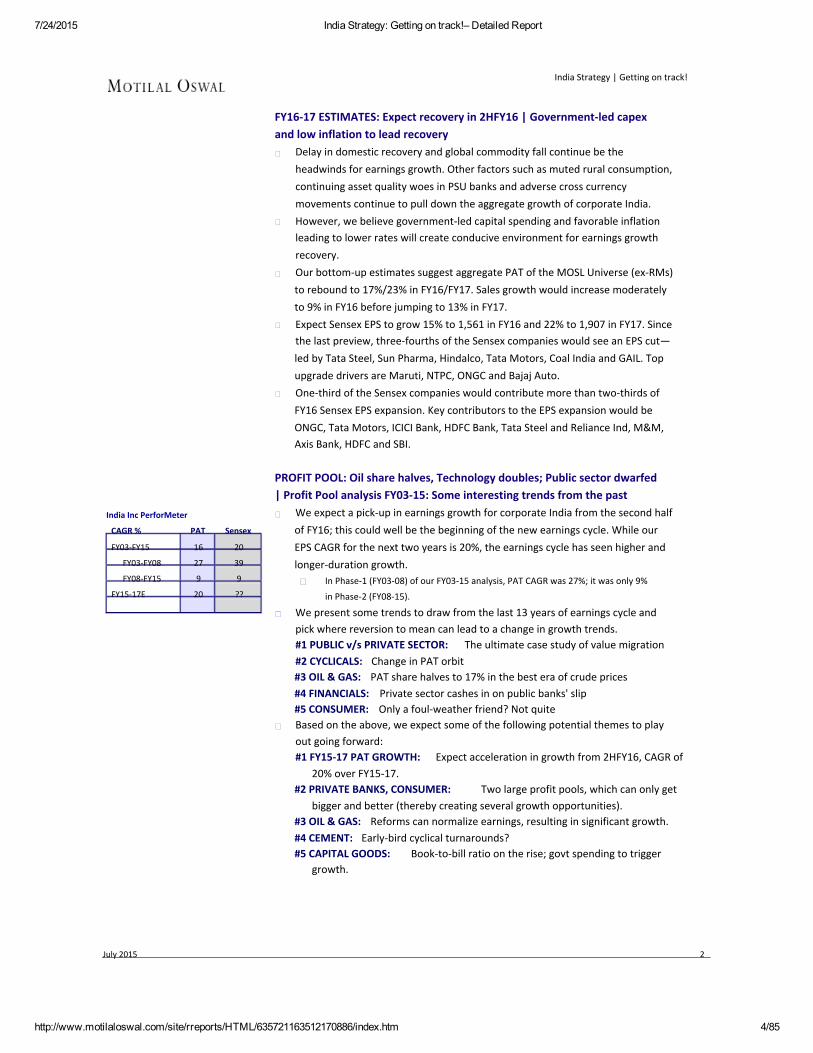
PROFIT POOL: Oil share halves, Technology doubles; Public sector dwarfed| Profit Pool analysis FY03‐15: Some interesting trends from the past
India Inc PerforMeter
CAGR %
FY03‐FY15
FY03‐FY08
FY08‐FY15
FY15‐17E
PAT
16
27
9
20
Sensex
20
39
9
??
We expect a pick‐up in earnings growth for corporate India from the second halfof FY16; this could well be the beginning of the new earnings cycle. While ourEPS CAGR for the next two years is 20%, the earnings cycle has seen higher andlonger‐duration growth.
In Phase‐1 (FY03‐08) of our FY03‐15 analysis, PAT CAGR was 27%; it was only 9%
in Phase‐2 (FY08‐15).
We present some trends to draw from the last 13 years of earnings cycle andpick where reversion to mean can lead to a change in growth trends.#1 PUBLIC v/s PRIVATE SECTOR: The ultimate case study of value migration#2 CYCLICALS: Change in PAT orbit#3 OIL & GAS: PAT share halves to 17% in the best era of crude prices#4 FINANCIALS: Private sector cashes in on public banks' slip#5 CONSUMER: Only a foul‐weather friend? Not quiteBased on the above, we expect some of the following potential themes to playout going forward:#1 FY15‐17 PAT GROWTH: Expect acceleration in growth from 2HFY16, CAGR of
20% over FY15‐17.#2 PRIVATE BANKS, CONSUMER: Two large profit pools, which can only get
bigger and better (thereby creating several growth opportunities).#3 OIL & GAS: Reforms can normalize earnings, resulting in significant growth.#4 CEMENT: Early‐bird cyclical turnarounds?#5 CAPITAL GOODS: Book‐to‐bill ratio on the rise; govt spending to trigger
growth.
July 2015 2

7/24/2015 India Strategy: Getting on track!– Detailed Report
http://www.motilaloswal.com/site/rreports/HTML/635721163512170886/index.htm 5/85
India Strategy | Getting on track!
Exhibit 2: FY03‐15 India Inc PAT performance: Sector‐wise highlightsSector PAT (INR b) PAT CAGR (%) ROE (%)(No of Companies) FY03 FY08 FY15 FY17E FY03‐15 FY03‐08 FY08‐FY15 FY15‐17E FY03 FY08 FY15 FY17EAuto (11) 21 85 292 492 24 32 19 30 19 26 22 23Capital Goods (12) 15 80 99 174 17 40 3 32 12 25 10 14Cement (14) 7 97 60 146 20 69 ‐7 56 8 30 6 12Consumer (15) 48 75 209 304 13 9 16 21 38 35 33 37Financials (31) 141 341 951 1,395 17 19 16 21 30 14 15 16
Banks‐Private (10) 25 90 376 540 26 30 23 20 18 11 15 17Banks‐PSU (10) 87 192 313 491 11 17 7 25 25 18 10 13NBFC (11) 29 58 263 363 20 15 24 18 48 14 18 19
Healthcare (14) 17 51 169 280 21 25 19 29 25 21 20 22Media (11) 3 5 21 46 18 10 24 47 25 7 14 22Metals (9) 27 303 295 283 22 62 0 ‐2 15 26 10 9Oil & Gas (12) 265 529 638 1,004 8 15 3 25 25 19 10 13Real Estate (10) 1 91 26 47 30 142 ‐16 35 13 30 4 7Retail (3) 0 2 10 15 41 61 28 23 7 24 22 23Technology (11) 39 159 548 692 25 32 19 12 36 32 27 25Telecom (4) ‐4 133 110 129 L to P L to P ‐3 8 ‐3 22 8 8Utilities (10) 67 173 346 457 15 21 10 15 12 14 14 17Others (25) 6 23 62 107 21 29 15 31 15 17 15 20MOSL (192) 653 2,146 3,836 5,569 16 27 9 20 20 20 14 16
MOSL Univ. PAT Share (%)FY03 FY08 FY15 FY17E3 4 8 92 4 3 31 5 2 37 3 5 522 16 25 254 4 10 1013 9 8 94 3 7 73 2 4 50 0 1 14 14 8 540 25 17 180 4 1 10 0 0 06 7 14 12‐1 6 3 210 8 9 81 1 2 2
100 100 100 100
Source: Company, MOSL
ECONOMICS: A strong macro at early stage of recovery to create a virtuousinvestment cycle | Revenue buoyancy on growth to accelerate fiscalcorrection
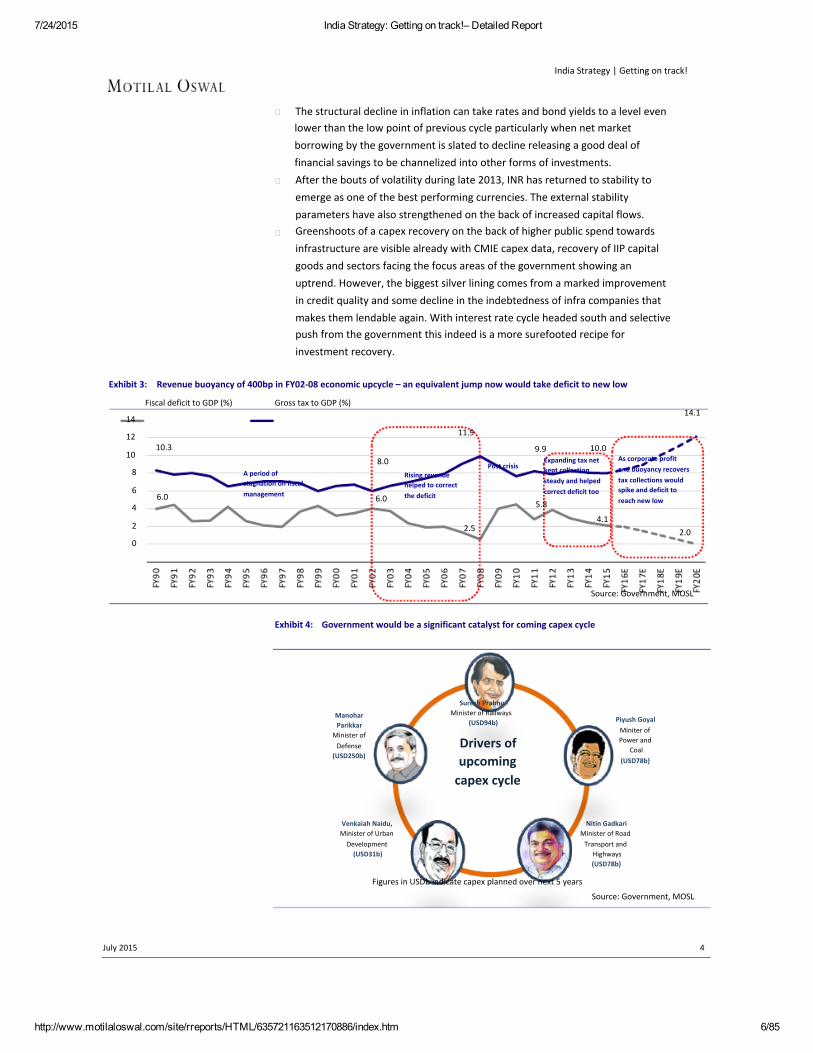
Tax‐GDP ratio increased by around 400bp in the previous upcycle between FY02to FY08. The current phase of fiscal consolidation is being achieved on the backof expenditure compression and increased tax effort. However, a repeat of taxbuoyancy seen in the previous upcycle would allow accelerated reduction infiscal deficit to as low as 2% by FY20.Higher revenue, besides fiscal correction, would allow a jump in governmentexpenditure. Together with an expenditure switch towards capex spend awayfrom subsidy this would act as a big booster to investments in general.While many private infrastructure companies came up in the previous cycleploughing sizable investments in the economy; the winners of the current cycleare likely to be those well positioned to benefit from the direction of theeconomy that the government is seeking to give in the next five years.The fiscal discipline and macro stability should bring in its wake a revision in therating of India several notches higher than the current investment grade,particularly when the criteria laid out by S&P in its Sep‐14 rating outlookupgrade have all been satisfied by a comfortable margin and countries withcomparable macro parameters and credit history enjoy much higher ratings.On the inflation front, government has taken a multitude of measures to ensurethat the backbone of food inflation is broken through a series of interventionaimed at curbing prices, providing subsidy and other forms of support, improvedco‐ordination with the states and smoothing the supply chain to ensure higherfood availability. Other drivers of inflation viz., global commodity and foodprices, rural wage have all eased.
July 2015 3
7/24/2015 India Strategy: Getting on track!– Detailed Report
http://www.motilaloswal.com/site/rreports/HTML/635721163512170886/index.htm 6/85
India Strategy | Getting on track!
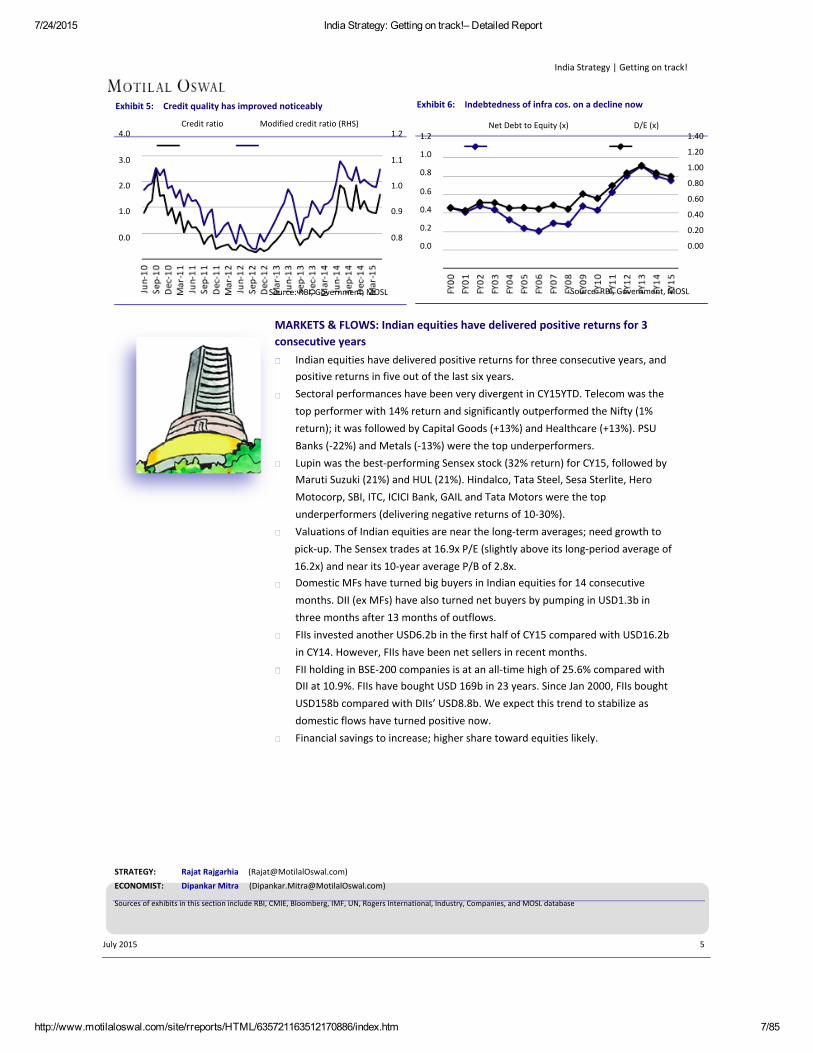
The structural decline in inflation can take rates and bond yields to a level evenlower than the low point of previous cycle particularly when net marketborrowing by the government is slated to decline releasing a good deal offinancial savings to be channelized into other forms of investments.After the bouts of volatility during late 2013, INR has returned to stability toemerge as one of the best performing currencies. The external stabilityparameters have also strengthened on the back of increased capital flows.Greenshoots of a capex recovery on the back of higher public spend towardsinfrastructure are visible already with CMIE capex data, recovery of IIP capitalgoods and sectors facing the focus areas of the government showing anuptrend. However, the biggest silver lining comes from a marked improvementin credit quality and some decline in the indebtedness of infra companies thatmakes them lendable again. With interest rate cycle headed south and selectivepush from the government this indeed is a more surefooted recipe forinvestment recovery.
Exhibit 3: Revenue buoyancy of 400bp in FY02‐08 economic upcycle – an equivalent jump now would take deficit to new low
Fiscal deficit to GDP (%)
14
12
10
8
6
4
2
0
6.0
11.9
10.3
A period ofstagnation on fiscalmanagement
Gross tax to GDP (%)14.1
9.98.0
6.0
Rising revenuehelped to correctthe deficit
Post crisis
10.0Expanding tax netkept collectionsteady and helpedcorrect deficit too
5.8
4.1
As corporate profitand buoyancy recoverstax collections wouldspike and deficit toreach new low
2.5 2.0
Source: Government, MOSL
Exhibit 4: Government would be a significant catalyst for coming capex cycle
ManoharParikkar
Minister ofDefense
(USD250b)
Suresh PrabhuMinister of Railways
(USD94b)
Drivers ofupcomingcapex cycle
Piyush GoyalMiniter ofPower and
Coal(USD78b)
Venkaiah Naidu,Minister of UrbanDevelopment(USD31b)
Nitin GadkariMinister of RoadTransport and
Highways(USD78b)
Figures in USDb indicate capex planned over next 5 years
Source: Government, MOSL
July 2015 4
7/24/2015 India Strategy: Getting on track!– Detailed Report
http://www.motilaloswal.com/site/rreports/HTML/635721163512170886/index.htm 7/85
India Strategy | Getting on track!
Exhibit 5: Credit quality has improved noticeably
4.0
3.0
2.0
1.0
0.0
Credit ratio Modified credit ratio (RHS)1.2
1.1
1.0
0.9
0.8
Exhibit 6: Indebtedness of infra cos. on a decline now
1.2
1.0
0.8
0.6
0.4
0.2
0.0
Net Debt to Equity (x) D/E (x)1.40
1.20
1.00
0.80
0.60
0.40
0.20
0.00
Source: RBI, Government, MOSL Source: RBI, Government, MOSL
MARKETS & FLOWS: Indian equities have delivered positive returns for 3consecutive years
Indian equities have delivered positive returns for three consecutive years, andpositive returns in five out of the last six years.Sectoral performances have been very divergent in CY15YTD. Telecom was thetop performer with 14% return and significantly outperformed the Nifty (1%return); it was followed by Capital Goods (+13%) and Healthcare (+13%). PSUBanks (‐22%) and Metals (‐13%) were the top underperformers.Lupin was the best‐performing Sensex stock (32% return) for CY15, followed byMaruti Suzuki (21%) and HUL (21%). Hindalco, Tata Steel, Sesa Sterlite, HeroMotocorp, SBI, ITC, ICICI Bank, GAIL and Tata Motors were the topunderperformers (delivering negative returns of 10‐30%).Valuations of Indian equities are near the long‐term averages; need growth topick‐up. The Sensex trades at 16.9x P/E (slightly above its long‐period average of16.2x) and near its 10‐year average P/B of 2.8x.Domestic MFs have turned big buyers in Indian equities for 14 consecutivemonths. DII (ex MFs) have also turned net buyers by pumping in USD1.3b inthree months after 13 months of outflows.FIIs invested another USD6.2b in the first half of CY15 compared with USD16.2bin CY14. However, FIIs have been net sellers in recent months.FII holding in BSE‐200 companies is at an all‐time high of 25.6% compared withDII at 10.9%. FIIs have bought USD 169b in 23 years. Since Jan 2000, FIIs boughtUSD158b compared with DIIs’ USD8.8b. We expect this trend to stabilize asdomestic flows have turned positive now.Financial savings to increase; higher share toward equities likely.
STRATEGY:ECONOMIST:
Rajat Rajgarhia ([email protected])Dipankar Mitra ([email protected])
Sources of exhibits in this section include RBI, CMIE, Bloomberg, IMF, UN, Rogers International, Industry, Companies, and MOSL database
July 2015 5

7/24/2015 India Strategy: Getting on track!– Detailed Report
http://www.motilaloswal.com/site/rreports/HTML/635721163512170886/index.htm 8/85
India Strategy | Getting on track!
1QFY16 PREVIEW Another quarter of decline! Worst is likely over!1QFY16 performance of MOSL Universe: Third consecutive quarter of PATde‐growth
Our bottom‐up estimates indicate a 1% YoY decline in aggregate PAT for the MOSL
Universe (ex‐RMs). Sales would remain flat and EBITDA would grow moderately (4%).
The fall in global commodities, delay in revival of the investment cycle and muted
rural consumption continue to impact growth of corporate India.
Only seven sectors are expected to witness double‐digit PAT growth—Media (36%),
Telecom (23%), Capital Goods (18%), Private Banks (17%), Consumer (14%), Oil (11%)
and Retail (11%). Six sectors would likely report PAT de‐growth—Healthcare (‐1%),
Auto (‐7%), Real Estate (‐11%), PSU Banks (‐27%), Cement (‐33%) and Metals (‐52%).
Nifty PAT (ex‐BPCL) is likely to remain flat YoY—an improvement over 11% de‐growth
in 4QFY15. Sales would marginaly decline (‐1%) in 1QFY16 (v/s ‐6% in 4QFY15).
About one‐fourth of the Nifty constituents would report >15% YoY PAT growth;
however, this would be offset by PAT de‐growth in more than one‐third of the
constituents. Cyclicals and domestic‐facing companies would contribute to PAT de‐
growth (14 out of 17 PAT de‐growth companies are cyclical).
Top PAT growth companies are Maruti (77%), Tata Power (63%), Cipla (+41%), ONGC
(+41%), Idea (+36%), Yes Bank (+29%), Indusind Bank (+24%) and Bharti Airtel (+21).
Top PAT de‐growth companies would be Punjab National Bank (‐58%), Cairn India (‐
57%), Bank of Baroda (‐44%), NMDC (‐42%), Ambuja Cement (‐40%), Grasim (‐38%),
Hindalco (‐38%) and Tata Motors (‐31%).
Aggregate PAT to decline 1% YoY; sales to remain flatMOSL Universe’s (ex‐RMs) sales and EBITDA would grow marginally (1% each).Aggregate PAT would decline 1% YoY.
1QFY16 would be the third consecutive quarter of PAT de‐growth. Suchconsecutive PAT de‐growth was last witnessed in Sep‐09.Several domestic cyclicals like Auto, Cement and PSU Banks would de‐grow.Global sectors such as Metals and Healthcare would continue to report PATdecline; Technology would report one of the lowest PAT growth (7% YoY).Large sectors that would report growth include Consumer, Private Banks,NBFCs, Utilities, Oil and Technology.
EBITDA margins (ex‐Financials & RMs) would expand ~70bps YoY to 20%, nearits LPA of 20.2%—despite Cap Goods, Cement, Metals well below the LPA level.This quarter would see continued impact of fall in global commodities and aconsequent negative WPI impact.
MOSL Universe Quarterly PATGrowth YoY (%) LPA: 10%
Exhibit 7: PAT de‐growth in 1QFY16; expect rebound in 2H
39
22 25 24 26
10 14 125
1914
7 7 9
2230
16 13 16
2 18
‐6 ‐8 ‐1
6
‐14 ‐9
Source: Company, MOSL
July 2015 6

7/24/2015 India Strategy: Getting on track!– Detailed Report
http://www.motilaloswal.com/site/rreports/HTML/635721163512170886/index.htm 9/85
India Strategy | Getting on track!
Exhibit 8: Sales to remain muted during 1H
27 26
1722 21
25 2621 23
19
MOSL UniverseQuarterly Sales Growth
YoY (%) LPA: 13%1619
913
1014 14 12 14
6 5 51 0
‐5
4
‐6 ‐4
Source: Company, MOSL
Exhibit 9: 1QFY16 EBITDA margin (ex‐Financials& RMs) would expand 70bps to 20%; shows signs of bottoming out
23.222.3 MOSL Universe EBITDA
Margin LPA: 20.2%20.722.1 22.2 22.022.1 21.8
20.021.419.320.7 20.620.4
19.7 19.919.619.9 19.6 19.419.419.1 19.0 18.819.2 19.319.1 19.0 19.018.8 18.718.6
FY09 FY10 FY11 FY12 FY13 FY14 FY15 FY16
Source: Company, MOSL
Exhibit 10: 1QFY16 PAT margin (ex‐Financials & RMs) to expand 50bps to 10.5%
14.7
13.3 12.3
MOSL Universe PAT MarginLPA: 11.3%
10.9 11.0
13.112.6 12.6 11.012.2 12.211.911.9 10.410.511.8 11.4 10.011.2 11.1 10.810.5 10.310.7 10.210.310.110.610.010.210.5
9.4
FY09 FY10 FY11 FY12 FY13 FY14 FY15 FY16
Source: Company, MOSL
July 2015 7

7/24/2015 India Strategy: Getting on track!– Detailed Report
http://www.motilaloswal.com/site/rreports/HTML/635721163512170886/index.htm 10/85
India Strategy | Getting on track!
Exhibit 11: Sector‐wise 1QFY16 performance of the MOSL Universe
Sector
(No of companies)
High growth sectorsMedia (9)
Telecom (4)Others (18)Capital Goods (10)
Private Banks (8)Med/Low growth sectorsConsumer (15)
Oil Excl. RMs (9)Retail (3)
NBFC (11)Utilities (10)Technology (11)
PAT de‐growth sectorsHealthcare (14)Auto (11)
Real Estate (8)PSU Banks (6)Cement (7)
Metals (9)MOSL Excl. RMs (163)
MOSL Ex Oil & Metals (145)Sensex (30)Sensex Ex Oil & Metal (24)
Nifty Ex BPCL (49)Nifty Ex Oil & Metal (41)
Sales
Mar‐ Var % Var %15 YoY QoQ
1,13154
418171291
1983,371388
1,43342
120658729
2,990306
1,130
48273167
1,0667,492
4,9934,8122,955
5,5643,660
815
7110
18‐18
‐136
167
14
0123
821
‐61
7‐16
‐17
‐138
4‐4
‐39
3126
2310
‐345
‐38‐2
‐6‐20
‐71
‐20‐5
0‐3
EBITDA
Mar‐ Var % Var %15 YoY QoQ
38715
1522925
16684183
2784
111188178
61673
167
1618525
1521,845
1,4161,135809
1,4031,051
1618
15147
181112
68
141910
‐94‐1
‐40
‐14
‐294
957
38
‐921
64
‐60
‐676
217
‐513
03312
8‐17‐18
21
‐21‐6
1‐5
Net Profit PAT DeltaEBITDAMargin
Chg bpYoY
Mar‐ Var % Var %Share % Share %
15 YoY QoQ
1686
301718
9653058
1662
6897
140
2444683
65711
42943
735612455
737556
1936
231818
171014
1111
997
‐25‐1‐7
‐11‐27‐33
‐52‐1
354
01
‐1328
106
‐60
‐364
24‐11
‐2‐10
162140
09
‐25
24
17‐2
70
181
322
10566
180
71015
2659
161
4100
36323
773737
18863096
2233
75105128
‐1,093‐7
‐88
‐10‐284‐76
‐629100
22267
2354550
‐3827885
35416
‐155292‐102
‐220‐177‐64
‐388‐83
‐240
‐45381
4513640
8933
Source: Company, MOSL
Mixed bag in terms of sectoral performance: Share of global commodities inaggregate PAT to increase, led by Oil & Gas; Metals drag
Overall, seven sectors would report double‐digit PAT growth and six sectorswould report PAT de‐growth.Financials would report PAT de‐growth of 1%, a first, primarily driven by poorperformance of PSU banks
PSUs will account for a 37% share in the sector’s profits in 1QFY16 v/s 49%in 1QFY15
Technology would continue to report mid‐single digit growth (7%) for thesecond consecutive quarter; Healthcare would continue to witness negativegrowth (‐3% YoY)Capital Goods would report 18% growth after 11 consecutive quarters of PATdecline, thus giving indication of early signs of revival in investment cycle.Auto, Cement and Metals would continue to report PAT de‐growth.Sectors with record PAT:
Consumer and Telecom would report multi‐quarter high PAT numbersMetals would report its lowest PAT in eight years
Share of commodities in the aggregate PAT would increase in 1QFY16—areversal from the last few quarters, primarily led by Oil. Metals would continueto drag
8July 2015

7/24/2015 India Strategy: Getting on track!– Detailed Report
http://www.motilaloswal.com/site/rreports/HTML/635721163512170886/index.htm 11/85
India Strategy | Getting on track!
Exhibit 13: Contribution of global businesses^ would reduceExhibit 12: MOSL Universe ex‐Global Commodities PAT gr (%) to 48% in 1QFY16 and to 45% by FY16‐end
MOSL Universe Ex Global Commodities PAT growth (%)18
151212 10
63 3
45
‐2
44
Global business PAT Share (%)Others PAT share (%)
5556
5255
48
45
Source: Company, MOSL ^ Global businesses include IT, Healthcare, Metals, Oil (ExRMs), JLR Source: Company, MOSL
Exhibit 14: Sectoral quarterly PAT trend (INR b)FY12 FY13 FY14 FY15 FY16E
Jun Sep Dec Mar Jun Sep Dec Mar Jun Sep Dec Mar Jun Sep Dec Mar Jun Sep Dec MarAuto 50 52 63 80 56 50 47 76 50 71 81 77 89 74 75 59 83 94 99 103Capital Goods 23 28 34 65 26 27 28 60 17 22 26 55 15 20 22 44 18 25 31 57Cement 19 12 16 23 25 19 16 20 19 11 11 18 17 14 9 15 11 10 14 20Consumer 33 36 38 38 40 42 46 44 45 48 52 49 50 54 58 55 58 64 69 66Financials 129 151 163 193 179 180 190 205 202 182 194 213 223 213 209 222 221 239 265 291
Private Banks 42 45 52 57 54 57 67 71 70 72 80 85 82 85 95 100 96 101 113 119PSU Banks 51 65 71 91 80 74 71 73 75 52 52 64 78 63 48 52 57 63 72 87NBFC 36 41 40 45 45 49 51 60 57 58 61 64 62 65 66 69 68 74 79 84
Healthcare 20 22 21 23 22 28 28 31 34 41 45 43 45 52 33 37 44 54 54 61Media 4 4 4 3 4 5 5 4 5 5 6 5 5 5 8 6 7 7 9 8Metals 90 72 63 72 78 57 45 78 62 61 61 76 68 74 63 34 25 34 34 50Oil & Gas 56 38 284 367 ‐251 342 217 403 95 203 137 346 187 153 71 247 207 209 211 222
Oil & Gas Ex RMs 150 178 139 139 154 173 166 133 139 174 175 165 149 149 95 134 166 155 153 171Real Estate 6 6 5 6 5 4 6 4 5 4 4 5 5 4 5 5 5 4 9 6Retail 2 2 2 2 2 2 3 2 2 2 2 3 2 3 2 3 2 3 3 3Technology 66 67 80 82 89 91 95 95 104 119 127 132 130 135 142 140 140 144 152 159Telecom 16 15 15 16 12 11 6 6 13 12 12 18 20 24 24 22 25 24 25 27Utilities 42 41 42 50 50 47 50 48 50 51 52 50 50 51 48 58 56 62 56 62Others 12 10 10 11 12 10 10 11 12 11 13 14 14 12 14 16 17 16 18 20MOSL Univ Excl RMs 661 696 696 802 753 745 741 817 760 814 862 922 885 883 808 848 877 935 990 1,103
Comparable Universe, excludes Coal India, Just Dial, Prestige Estate, Bharti Infratel, Alembic Pharma, Vedanta due to merger, RattanIndiaPower, Hathway and Repco Home Fin. Source: Company, MOSL
Sector
July 2015 9
7/24/2015 India Strategy: Getting on track!– Detailed Report
http://www.motilaloswal.com/site/rreports/HTML/635721163512170886/index.htm 12/85
India Strategy | Getting on track!
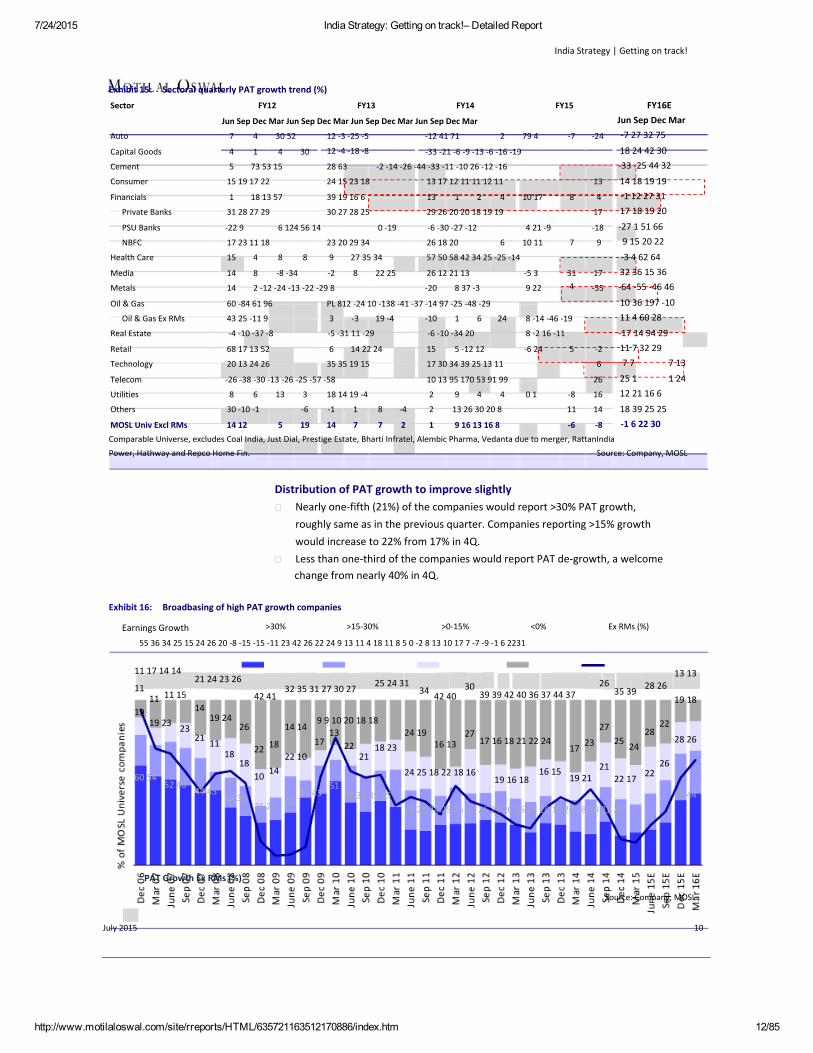
Exhibit 15: Sectoral quarterly PAT growth trend (%)
FY16EFY12 FY13 FY14 FY15
Jun Sep Dec Mar Jun Sep Dec Mar Jun Sep Dec Mar Jun Sep Dec Mar Jun Sep Dec Mar
‐7Auto 7 4 30 52 12 ‐3 ‐25 ‐5 ‐12 41 71 2 79 4 ‐24 ‐7 27 32 75
12 ‐4 ‐18 ‐8Capital Goods 4 1 4 30 ‐33 ‐21 ‐6 ‐9 ‐13 ‐6 ‐16 ‐19 18 24 42 30
Cement 5 73 53 15 28 63 ‐2 ‐14 ‐26 ‐44 ‐33 ‐11 ‐10 26 ‐12 ‐16 ‐33 ‐25 44 32
14 18 19 19Consumer 15 19 17 22 24 15 23 18 13 17 12 11 11 12 11 13
‐1 12 27 31Financials 1 18 13 57 39 19 16 6 13 1 2 4 10 17 8 417 18 19 20Private Banks 31 28 27 29 30 27 28 25 29 26 20 20 18 19 19 17
PSU Banks ‐22 9 6 124 56 14 0 ‐19 ‐6 ‐30 ‐27 ‐12 4 21 ‐9 ‐18 ‐27 1 51 669 15 20 22NBFC 17 23 11 18 23 20 29 34 26 18 20 6 10 11 7 9
Health Care 15 4 8 8 9 27 35 34 57 50 58 42 34 25 ‐25 ‐14 ‐3 4 62 6432 36 15 36Media 14 8 ‐8 ‐34 ‐2 8 22 25 26 12 21 13 ‐5 3 31 17
4Metals 14 2 ‐12 ‐24 ‐13 ‐22 ‐29 8 ‐20 8 37 ‐3 9 22 ‐55 ‐64 ‐55 ‐46 46
Oil & Gas 60 ‐84 61 96 PL 812 ‐24 10 ‐138 ‐41 ‐37 ‐14 97 ‐25 ‐48 ‐29 10 36 197 ‐10
Oil & Gas Ex RMs 43 25 ‐11 9 3 ‐3 19 ‐4 ‐10 1 6 24 8 ‐14 ‐46 ‐19 11 4 60 28
Real Estate ‐4 ‐10 ‐37 ‐8 ‐5 ‐31 11 ‐29 ‐6 ‐10 ‐34 20 8 ‐2 16 ‐11 ‐17 14 94 2911 7 32 29Retail 68 17 13 52 6 14 22 24 15 5 ‐12 12 ‐6 24 5 ‐27 7 7 13Technology 20 13 24 26 35 35 19 15 17 30 34 39 25 13 11 6
25 1 1 24Telecom ‐26 ‐38 ‐30 ‐13 ‐26 ‐25 ‐57 ‐58 10 13 95 170 53 91 99 2612 21 16 6Utilities 8 6 13 3 18 14 19 ‐4 2 9 4 4 0 1 ‐8 16
18 39 25 25Others 30 ‐10 ‐1 ‐6 ‐1 1 8 ‐4 2 13 26 30 20 8 11 14
‐1 6 22 30MOSL Univ Excl RMs 14 12 5 19 14 7 7 2 1 9 16 13 16 8 ‐6 ‐8Comparable Universe, excludes Coal India, Just Dial, Prestige Estate, Bharti Infratel, Alembic Pharma, Vedanta due to merger, RattanIndiaPower, Hathway and Repco Home Fin. Source: Company, MOSL
Sector
Distribution of PAT growth to improve slightlyNearly one‐fifth (21%) of the companies would report >30% PAT growth,roughly same as in the previous quarter. Companies reporting >15% growthwould increase to 22% from 17% in 4Q.Less than one‐third of the companies would report PAT de‐growth, a welcomechange from nearly 40% in 4Q.
Exhibit 16: Broadbasing of high PAT growth companies
Earnings Growth >30% >15‐30% >0‐15% <0% Ex RMs (%)
55 36 34 25 15 24 26 20 ‐8 ‐15 ‐15 ‐11 23 42 26 22 24 9 13 11 4 18 11 8 5 0 ‐2 8 13 10 17 7 ‐7 ‐9 ‐1 6 2231
11 17 14 14 13 1321 24 23 26 25 24 31 26 28 263011 32 35 31 27 30 27 34 35 3939 39 42 40 36 37 44 3711 15 42 41 42 4011 19 181419 19 24 9 9 10 20 18 1819 23 2214 1426 2723 2813 24 19 2721 28 262517 16 18 21 22 2417 2311 18 16 1322 2418 23 172218 2122 10
18 262114 16 1524 25 18 22 18 16 221060 54 19 21 22 1719 16 1852 48 5144 45 41 43 39 4438 32 39 3535 30 3226 27 21 21 24 25 25 27 26 24 20 26 24 20 19 26 18 20 21 26
PAT Growth Ex RMs (%)
Source: Company, MOSL
July 2015 10
7/24/2015 India Strategy: Getting on track!– Detailed Report
http://www.motilaloswal.com/site/rreports/HTML/635721163512170886/index.htm 13/85
India Strategy | Getting on track!
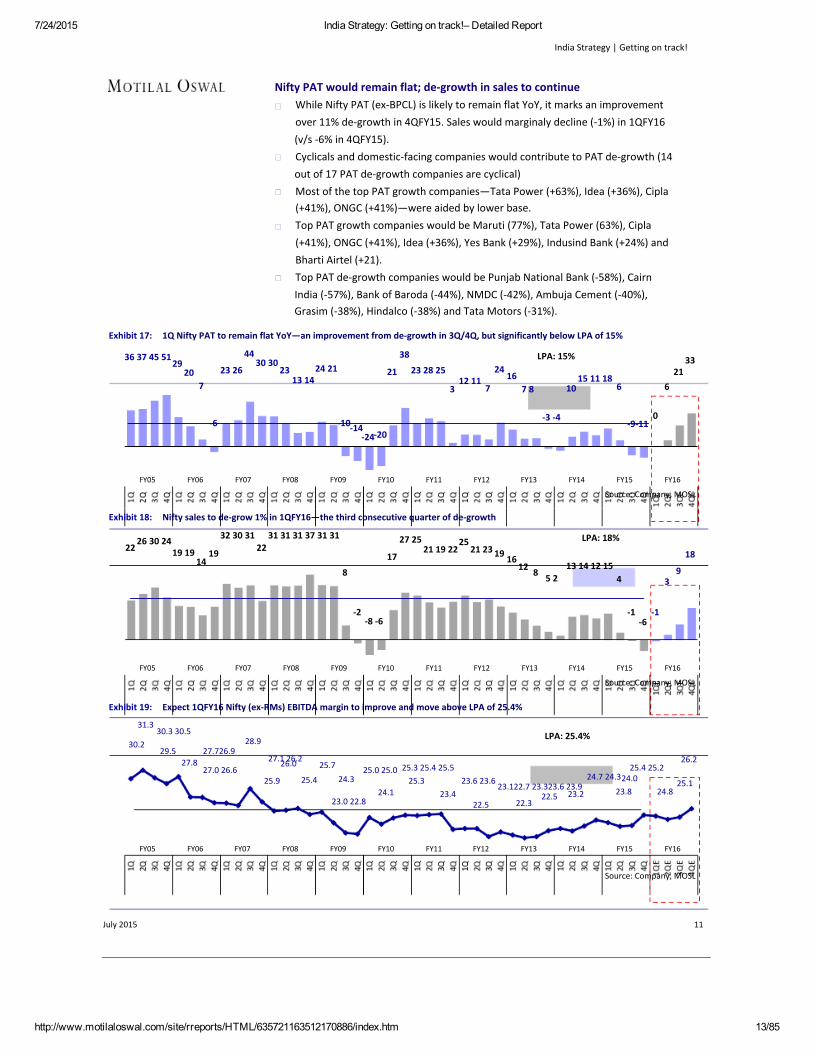
Nifty PAT would remain flat; de‐growth in sales to continueWhile Nifty PAT (ex‐BPCL) is likely to remain flat YoY, it marks an improvementover 11% de‐growth in 4QFY15. Sales would marginaly decline (‐1%) in 1QFY16(v/s ‐6% in 4QFY15).Cyclicals and domestic‐facing companies would contribute to PAT de‐growth (14out of 17 PAT de‐growth companies are cyclical)Most of the top PAT growth companies—Tata Power (+63%), Idea (+36%), Cipla(+41%), ONGC (+41%)—were aided by lower base.Top PAT growth companies would be Maruti (77%), Tata Power (63%), Cipla(+41%), ONGC (+41%), Idea (+36%), Yes Bank (+29%), Indusind Bank (+24%) andBharti Airtel (+21).Top PAT de‐growth companies would be Punjab National Bank (‐58%), CairnIndia (‐57%), Bank of Baroda (‐44%), NMDC (‐42%), Ambuja Cement (‐40%),Grasim (‐38%), Hindalco (‐38%) and Tata Motors (‐31%).
38 LPA: 15%
3
‐10‐14‐20‐24
12 1124
716
7 8
‐3 ‐4
1015 11 18
216
‐9‐110
6
Exhibit 17: 1Q Nifty PAT to remain flat YoY—an improvement from de‐growth in 3Q/4Q, but significantly below LPA of 15%
36 37 45 5129
44
207
‐6
23 2630 30
23 24 21 21 23 28 2533
13 14
FY05 FY06 FY07 FY08 FY09 FY10 FY11 FY12 FY13 FY14 FY15 FY16
Source: Company, MOSL
Exhibit 18: Nifty sales to de‐grow 1% in 1QFY16—the third consecutive quarter of de‐growth
2226 30 24 32 30 31
19 1914
19 2231 31 31 37 31 31
17
8
‐2
27 2521 19 22
2521 23
LPA: 18%
19 1612 8 5 2
13 14 12 154
‐1 ‐1
3
‐6
18
9
‐8 ‐6
FY05 FY06 FY07 FY08 FY09 FY10 FY11 FY12 FY13 FY14 FY15 FY16
Source: Company, MOSL
Exhibit 19: Expect 1QFY16 Nifty (ex‐RMs) EBITDA margin to improve and move above LPA of 25.4%
31.3
30.230.3 30.5
29.527.8
28.9
27.1 26.226.0 25.7
25.9 25.4
LPA: 25.4%
26.225.4 25.225.3 25.4 25.525.0 25.0
24.7 24.324.024.3 25.3 23.6 23.6 25.123.122.7 23.323.6 23.9 24.823.824.1 23.4 23.222.523.0 22.8 22.322.5
27.726.9
27.0 26.6
FY05 FY06 FY07 FY08 FY09 FY10 FY11 FY12 FY13 FY14 FY15 FY16
Source: Company, MOSL
July 2015 11

7/24/2015 India Strategy: Getting on track!– Detailed Report
http://www.motilaloswal.com/site/rreports/HTML/635721163512170886/index.htm 14/85
India Strategy | Getting on track!
Exhibit 20: 1QFY16E performance of Nifty companies (INR b)Sales EBITDA PAT
Jun‐15 Var % YoY Jun‐15 Var % YoY Jun‐15 Var % YoYHigh PAT Growth (12) 1,205 11 458 18 202 31Maruti Suzuki 132 16 22 62 13 77Tata Power 95 9 26 46 4 63Cipla 33 23 7 33 4 41ONGC 235 8 133 6 67 41Idea Cellular 89 17 32 29 10 36Yes Bank 10 40 9 41 6 29IndusInd Bank 10 22 9 16 5 24Bharti Airtel 238 4 85 10 13 21HDFC Bank 63 22 46 20 27 20Axis Bank 39 17 35 20 20 18Bajaj Auto 59 11 11 22 9 17NTPC 202 12 43 31 24 17Med/Low PAT Growth (20) 2,444 ‐3 613 11 400 8Asian Paints 36 8 6 15 4 14Hero MotoCorp 69 ‐1 8 16 6 13TCS 258 17 73 14 57 12Kotak Mahindra Bank 17 15 11 13 6 12GAIL 140 5 12 15 7 12Power Grid Corp. 46 18 40 19 13 12ICICI Bank 51 15 51 13 30 12Hind. Unilever 85 11 15 16 11 12Reliance Inds. 752 ‐22 89 18 62 10Larsen & Toubro 109 5 12 7 8 9Wipro 124 11 28 9 22 7Dr Reddy’ s Labs 38 9 9 12 6 6Coal India 190 7 47 11 43 6ITC 93 0 33 1 23 5Infosys 141 10 38 9 30 4Bosch 26 10 5 7 3 2HDFC 20 16 20 2 14 1HCL Technologies 97 16 23 3 19 1State Bank 138 4 92 5 34 1Zee Entertainment 13 22 3 ‐10 2 0Negative PAT Growth (17) 1,915 ‐4 332 ‐21 134 ‐37Tech Mahindra 62 22 9 1 6 ‐5BHEL 45 ‐12 2 ‐21 2 ‐8Lupin 32 ‐2 8 ‐21 6 ‐10Vedanta 172 1 43 ‐24 17 ‐14Mahindra & Mahindra 93 ‐6 11 ‐20 7 ‐20Ultratech Cement 61 7 10 ‐4 5 ‐27ACC 30 0 3 ‐24 2 ‐27Sun Pharma 67 6 17 ‐8 10 ‐28Tata Motors 636 ‐2 95 ‐14 37 ‐31Hindalco 255 6 22 7 4 ‐38Grasim Industries 14 ‐3 1 ‐17 1 ‐38Ambuja Cements 25 ‐8 4 ‐38 2 ‐40NMDC 19 ‐45 12 ‐50 11 ‐42Bank of Baroda 33 0 24 ‐2 8 ‐44Cairn India 27 ‐39 14 ‐57 12 ‐57Punjab National Bank 40 ‐8 28 ‐10 6 ‐58Tata Steel 304 ‐16 27 ‐36 0 PLNIFTY Ex BPCL (49) 5,564 ‐1 1,403 3 737 0Note: For Financials, Sales represents Net Interest Income, and EBITDA represents Operating Profit
Company PAT Contbn(%)
27211911124313
5411811242813163402350
1810121101510021210
100
EBITDA marginJun‐15 Var (bp)
38 22616 46127 68822 16257 ‐10436 32586 10689 ‐46436 21174 ‐7890 23819 16721 30325 30417 10712 17328 ‐5866 ‐1168 70
86 6899 ‐13818 8612 39711 2323 ‐3224 5025 9736 1627 ‐2218 ‐51
100 ‐1,27423 ‐29867 3221 ‐75017 ‐36815 ‐3114 ‐43
26 ‐61225 ‐82912 ‐20916 ‐18310 ‐31526 ‐41015 ‐2239 98 ‐124
14 ‐70463 ‐65073 ‐13752 ‐2,17470 ‐1369 ‐279
25 89Source: Company, MOSL
July 2015 12

7/24/2015 India Strategy: Getting on track!– Detailed Report
http://www.motilaloswal.com/site/rreports/HTML/635721163512170886/index.htm 15/85
India Strategy | Getting on track!
Some interesting sectoral trends in 1QFY16 earnings
Key PAT growth sectorsAll Capital Goods companies (except BHEL and Voltas) would report PAT growth.Except L&T (9%), all companies would report double‐digit PAT growth.All Consumer and Retail companies (except United Spirits) would report PATgrowthAll Pvt Banks and NBFCs (except DCB Bank) would report PAT growth
Key PAT de‐growth sectorsAll PSU Banks (except SBI and Indian Bank) would report PAT de‐growthAll Metal companies would report PAT de‐growthAll Cement companies (except India Cement and Ramco Cement) would reportPAT de‐growth
Exhibit 22: 1QFY16 sectoral PAT growth (%)
3623 18
14 11 11
Exhibit 21: 1QFY16 sectoral sales growth (%)
15 1412
10 8 8 7 7 63
1 1 09 7
‐1 ‐1 ‐1 ‐7 ‐11
‐33‐52
‐6‐13
Source: Company, MOSL Source: Company, MOSL
Exhibit 23: 1QFY16 sectoral EBITDA margin (%)
36.5 32.528.6 27.9
24.4 23.7
Exhibit 24: 1QFY16 sectoral PAT margin (%)
19.2
21.3 20.0 19.414.9 14.8 14.7
14.8 14.7 14.29.3 8.4
12.0 12.0 11.6 10.57.3 7.3 6.7 6.1
5.4 4.0
Source: Company, MOSL Source: Company, MOSL
July 2015 13

7/24/2015 India Strategy: Getting on track!– Detailed Report
http://www.motilaloswal.com/site/rreports/HTML/635721163512170886/index.htm 16/85
India Strategy | Getting on track!
Other sectorhighlights
AUTOSAfter an initial spurt last year post elections, demand recovery is losingmomentum, with no improvement in the underlying economic environment.M&HCV volumes continued to recover in 1QFY16 (third consecutive quarter ofrecovery, after nine quarters of decline), with ~15% YoY growth; PV volumeswere up by ~7%. However, other segments witnessed muted demand, with 2Wand LCVs volumes flat YoY.Margins for our auto OEM (ex JLR) coverage universe are expected to expand180bp YoY (50bp QoQ) to 11.5%, driven primarily by AL (+460bp) and MSIL(+460bp), partially offset by MM (‐210bp). EBITDA is likely to grow ~31% YoY(~2.2% QoQ) for our coverage universe (ex JLR), translating into ~19% growth inPAT. While AL is expected to report its fourth consecutive quarter of PAT atINR1.4b (v/s ~INR479m loss in 1QFY15), TVS PAT is likely to grow ~46% and EIMPAT 54%. MM’s PAT is estimated to decline by ~20% YoY. We expect margins toimprove over the next two years, driven by demand recovery‐led discountmoderation, soft commodity prices and operating leverage.
Exhibit 25: EBITDA margin (ex JLR) recovery to continue fromtroughs of 4QFY14 Exhibit 26: Auto aggregate PAT growth constrained by JLR
18
15
127
9‐3
6 ‐25‐5 ‐12
430
52
1241
2 4
‐7‐24
‐7
Aggregate (excld JLR) Aggregate (incl JLR) Auto PAT growth YoY (%) Auto Ex JLR PAT growth YoY (%)
112
71 79
Source: Company, MOSL Source: Company, MOSL
Exhibit 27: Market share of BJAUT to improve in FY16, driven by CT‐100 launchEconomy ‐ MS (%)
Lack of self‐start (SS) option in Platina hurt Bajaj Autoas SS grew tp ~50% of Economy segment
CT100 & Platina Self 40Start launch
34
30
25 25 24 2521
27
33
Source: Company, MOSL
CAPITAL GOODSManagements are expected to guide for cautious optimism, as improvedbusiness sentiment is yet to result in increased tenders, leading to slower paceof order finalization. For 1QFY16, we expect 2% revenue growth and EBITDA
14July 2015

7/24/2015 India Strategy: Getting on track!– Detailed Report
http://www.motilaloswal.com/site/rreports/HTML/635721163512170886/index.htm 17/85
India Strategy | Getting on track!
margins improving 80bp to 9%. Order inflows for 1QFY15 would be muted, asordering activity from domestic customers is yet to pick up.Project executing companies are restructuring their balance sheets and infusingcapital to prepare for the next level of growth.ABB continues to invest in localization initiatives, Voltas continues to bidcautiously. For Cummins, exports would remain the key growth driver, whichwould support operating leverage (current capacity utilization ~50‐55%). Thereremains a sense of guarded optimism on the near term outlook.
Exhibit 28: Revenue to witness muted growth led byconstrained execution
Sales (INR b) Growth (%) YoY
Exhibit 29: EBITDA margin to improve by 80bps YoY
EBITDA Margin (%)
Source: Company, MOSL Source: Company, MOSL
Exhibit 30: Capital Goods revenues flat led by constrained execution; BTB stable at 3.1x
Capital Goods Sales growth (%) BTB (X)
2.9 3.0 3.1 3.12.9 2.8
2.62.3 2.3
11 17
2.2 2.22.1
6
‐5 ‐2
2.3 2.3 2.4
0
2.32.6
15 19 16 0
‐4 ‐1 ‐4 ‐4 ‐7‐13 ‐7
Source: Company, MOSL
July 2015 15
India Strategy | Getting on track!

7/24/2015 India Strategy: Getting on track!– Detailed Report
http://www.motilaloswal.com/site/rreports/HTML/635721163512170886/index.htm 18/85
CEMENTDemand momentum slowly improved within 1QFY16 after decline in April, 2‐3%growth in May and a mixed bag trend in June (0‐5%) based on regional intensityof rainfall (lower rainfall in the north led to better volumes than west in June).Overall, north and east are expected to post relatively better volume growth in1QFY16 v/s west and south (south showing weakest volume trend with near‐double digit de‐growth). We estimate ~1.5% YoY growth for the industry, whileMOSL cement universe to grow by ~3.4% YoY (+5.5% QoQ) due to multipleinstance of new capacity commencement viz. Shree Cement, JK Lakshmi andDalmia Bharat. Effective utilizations stood at ~70% (‐3pp YoY, ‐1pp QOQ).Cement prices (ex‐south) are down 4‐8% QoQ in 1QFY16—the west and thenorth were worst affected, with 7‐8% decline QoQ (though select pockets sawINR10‐30/bag uptick during June). East and central regions posted 3‐4%QoQ dipin average prices, while production discipline in south continues to hold pricesQoQ. We are factoring in INR150‐200/ton (~4%) QoQ drop in realizations ofMOSL coverage universe, including largely flattish (0‐1% QoQ dip) for southernplayers. We are factoring in for INR10/INR17 per bag (5%/9%) YoY rise inrealizations in FY16/FY17.Sharp decline in realization would hurt profitability by INR150‐200/ton (4ppQoQ dip in margins). Cost should remain flattish amidst (a) 3‐4% QoQ decline inimported coal and pet coke prices, (b) 2.7% rise in rail freight and ~3% dieselcost , (c) rise in packaging cost as crude revived, and (d) marginal positiveoperating leverage QoQ.We expect MOSL universe EBITDA/ton at INR660 in 1QFY16 (‐INR189 QoQ, ‐INR117 YoY) with southern players likely to post EBITDA/ton of INR900‐1,200(~1pp QoQ dip in margins). We factor in for EBITDA/ton of INR818/1,096 per tonin FY16/FY17 as against ~INR727 in FY15.
Exhibit 32: MOSL universe cement volumes to grow 4.7% YoYin 1QFY16
Aggregate Vol (m ton)
13.810.49.4 8.4
4.0 3.32.7 1.9 1.50.4(2.0)
Volume growth (%)
9.15.3 4.4 4.7
Exhibit 31: Volume growth trend (%) signifies weakness incement demand in 1QFY16 (%)
15
10
5
0
‐5
‐10
MOSL Universe IIP data
6.1
(5.8)
35 34 36 42 38 35 37 41 38 36 37 43 42 38 39 41 44
Source: Company, MOSL Source: Company, MOSL
CONSUMERWe expect our Consumer universe to post 7.5% revenue growth and 13.8% PATgrowth in 1QFY16. Broadly, consumption trends continue to remain sluggishacross categories and geographies (rural growth>urban despite incrementalpressure on rural wage growth, given lower salience in overall revenue
July 2015 16
India Strategy | Getting on track!

7/24/2015 India Strategy: Getting on track!– Detailed Report
http://www.motilaloswal.com/site/rreports/HTML/635721163512170886/index.htm 19/85
contribution). We expect clear trends in rural to emerge only post monsoonsand a possible pick‐up in government spending.1QFY16 should see continued benefit of raw material easing. While competitiveintensity has picked up marginally in certain HPC categories, organized playershave been proactive in pre‐empting and tackling competition. However, webelieve the price cuts/discounts have not yet changed the volume trajectorymateriall. We expect EBITDA to grow at 12% in 1QFY16 for our coverage.
Exhibit 33: EBITDA to grow 12% in 1QFY16 aided primarily byRM softening Exhibit 34: Consumer ex‐ITC PAT growth healthy
Sales Growth (%)
21.1
20.219.8
20.5 20.520.2
EBITDA margins (%)
21.3
20.4 20.5
21.621.3 21.3
26
17
1012
19
10
24Consumer Ex ITC PAT grw YoY (%)
16
9
18
9
58 9
12
1921
21.0 21.2 21.2
19.3 20.3 15.0 16.7 16.4 13.6 10.6 10.3 11.0 11.1 14.6 12.3 7.8 6.6 7.5
Source: Company, MOSL Source: Company, MOSL
FINANCIALSPSU banks: PSU banks’ PPP/PAT is expected to grow 0%/‐27% YoY on account oflower balance sheet growth and continued asset quality troubles. Higher‐than‐expected NPAs (especially relapse from RL) will be a drag on earnings. Over thelast year, Indian banks, mainly PSUs, have sold ~INR600b worth assets to ARCs;we believe write‐downs and resultant MTM provisioning for the same (as perRBI guidelines) would begin over the next one/two quarters. SBIN remains ourtop pick to play revival in Indian economy.Private sector banks: For private banks, healthy core operating performanceand one off income (repatriation of capital) will help to manage earnings. Weexpect PPP and PAT growth of ~18% YoY and ~17% YoY. Our top picks areHDFCB, AXSB, YES and DCBB in private sector.
Exhibit 35: Higher opex and provisions would be a drag onPSU bank’s profitability; healthy growth in profitability forPrivate banks to continue (PAT growth % YoY)
Private Banks
29.3
‐5.9
‐29.7 ‐26.8
25.820.0 19.7
‐12.1
18.0
3.5
PSU Banks
20.6
18.6
18.6
‐8.9
17.1
‐18.3
16.8
Exhibit 36: Share of PSUs in sector profits will be down to37% in 1QFY16 vs 49% in 1QFY15
PVT Banks PAT Share (%) PSU Bank PAT Share (%)
42 40 43 49 42 33 34 3755 59 58 61 60 56 52 51 52
58 60 57 51 58 67 66 6345 41 42 39 40 44 48 49 48‐26.8
Source: Company, MOSL
July 2015
Source: Company, MOSL
17
India Strategy | Getting on track!

7/24/2015 India Strategy: Getting on track!– Detailed Report
http://www.motilaloswal.com/site/rreports/HTML/635721163512170886/index.htm 20/85
NBFCs: We expect the NBFCs under our coverage to deliver 8.8% YoY PATgrowth. For retail NBFCs, the quarter would be marred by seasonal weakness,translating into lower growth and margin contraction. However, timely onset ofmonsoon and sharper focus on recoveries would lead to above trend‐lineperformance on asset quality. Improving macroeconomic environment, stableliquidity, easing wholesale rates and reduction in repo rate by the RBI are thekey positives. While incremental data points indicate bottoming‐out of thecycle, growth and asset quality outlook is expected to improve gradually forNBFCs. Top picks are IDFC and MMFS.
Exhibit 37: PAT growth for NBFCs universe expected at 8.8%
28.8
23.420.3
32.1
24
15.718.8
6.79.4 10.9
5.78.7 8.8
Source: Company, MOSL
HEALTHCAREWe estimate 14.2% growth in sector revenue in 1Q, supported by strongperformance in domestic market. However, weak quarter in US for few large capcompanies is likely to pull down overall EBITDA margins to 23.7% (‐180bp). PATis expected to remain flat, mainly on account of higher deprecation during thequarter. We believe Cipla, Cadila, Torrent Pharma and Alembic Pharma arelikely to deliver strong operational performance in 1Q.Slow pace of approvals in US and increased pricing pressure is expected toimpact larger players like – Sun Pharma, Lupin and Dr Reddy’s. However, Cipla islikely to benefit from gNexium supply to its partner Teva (sole gneric player). Indomestic business, all large cap companies are expected to post double digitgrowth aided by price increase undertaken in April and continued traction inspecialty therapies. According to NPPA, Indian pharma companies are allowedto take 3.6% price hike on NLEM products and 10% price hike on Non NLEMproducts from April 2015.In Mid Caps, apart from IPCA, most of the other companies are expected tobenefit from recent surge in ANDA approvals for their US filings. Alembic andTorrent are expected to deliver strong US numbers on account of gAbilifylaunch. Aurobindo and Glenmark are also likely to benefit from recent druglaunches in US market. Cadila would continue to gain from price hike in HCQ andexpected to report good growth in US.We expect Sun pharma to post muted numbers in 1Q on the back of (1) Ongoingsupply constrains at Halol plant, (2) Lack of approvals in US, (3) Price erosion insome of the Taro products and (4) Difficulties in Ranbaxy merger.
July 2015 18
India Strategy | Getting on track!

7/24/2015 India Strategy: Getting on track!– Detailed Report
http://www.motilaloswal.com/site/rreports/HTML/635721163512170886/index.htm 21/85
The INR depreciated 8% YoY against the USD in 1QFY16 (63.5 v/s 59 in 1QFY15).Hence, 1QFY16 net sales of export‐oriented companies may be higher thanwitnessed in the last 2‐3 quarters.However, emerging market currency crisis will affect companies such as DrReddy’s, Torrent Pharma and Glenmark in our coverage. Similarly, somenegative impact of Euro depreciation would be visible in companies such asAurobindo, Torrent Pharma and Cipla, which have a higher proportion of Eurosales in the overall revenue.
Exhibit 38: Healthcare: EBITDA Margin to contract by 180bp
EBITDA Margin (%)
22.9
20.722.1 22.4
23.0
21.3
23.023.7 24.2 24.0
25.526.4
24.0 23.7
21.6 22.0
19.4
*4QFY15(excluding sun pharma): 21% Source: Company, MOSL
MEDIAWe expect 14% aggregate PAT growth in 1QFY16 but 23% growth ex‐ZEE.Earnings growth is expected to be divergent. Among the print companies, DBcorp is expected to see pressure on its advertising revenue led by continuedweakness in demand from key segments. This coupled with increased launchand start‐up expenses are expected to keep PAT under pressure. Printcompanies (ex‐DB Corp) are also expected to see a flat bottom‐line YoY. Benignnewsprint prices will provide some solace. While ZEE’s earnings would beimpacted by increased &TV and sports losses. Earnings are expected to remainflat for SUNTV led by likely escalation in content costs. Pay TV operators (DISHTVand HATH) are expected to report improved profitability in the form of lowerlosses in the case of Hathway. Dish too is expected to continue its PAT +vestreak after its PAT turnaround in 4Q.We expect our universe ad revenue growth to recover to 9% YoY vs 7% each in4QFY15 and FY15. ZEE would be the only media company to report more than20% ad growth on the back of its new channel launch. Our industry interactionsindicate that growth remained soft for most of 1QFY16, with likely pick‐up in 2H.
July 2015 19
India Strategy | Getting on track!

7/24/2015 India Strategy: Getting on track!– Detailed Report
http://www.motilaloswal.com/site/rreports/HTML/635721163512170886/index.htm 22/85
Exhibit 39: Media: Quarterly PAT (INR b)7.4
4.3 4.75.3 5.8
4.6
5.94.8 4.9
5.6 5.35.8
6.4
Source: Company, MOSL
METALSAlthough steel demand is gradually improving with single digit growth, thecontinuous pressure of imports has been shrinking market for domestic mills.Post a poor 4QFY15, we expect our Metals coverage universe to post anotherweak quarter, with aggregate EBITDA declining 32% YoY (growing 7% QoQ)amidst lower metal prices (ex‐Zinc) and persisting imports.We have cut EBITDA estimates for steel companies by 3‐10% on lowerrealizations.While LME aluminum was largely unchanged QoQ (at USD1,800/ton), spotpremiums came under significant pressure.Zinc prices were supportive in the quarter, up 5% QoQ / 6% YoY to USD2,192.Volumes would be up ~30% YoY, but due to more than tripling of royalty YoY(due to DMF), we expect EBITDA to increase by just 12% YoY for Hindustan Zinc.We cut our LME (aluminum) assumption from USD1,900/ton to USD1,800/tonfor FY16, and from USD1,950/ton to USD1,900/ton for FY17. Thus, our EBITDAestimates for Hindalco and Nalco are cut by 5% for FY16 and by 25% for FY17.Our target prices are cut from INR206 to INR179 for Hindalco, and from INR77 toINR72 for Nalco. For Vedanta, we cut our EBITDA estimates for FY16 and FY17 by1%, and trim our target price from INR209 to INR177 on lower aluminum LMEand spot aluminum/zinc premiums, offset by higher INR/USD assumptions.
Exhibit 41: Steel sales volume to increase
SAIL
9.4
2.4
3.2
2.3
Tata Steel
7.8
2.6
2.6
2.0
8.9
3.1
3.0
2.0
8.9
3.1
3.0
2.1
SAIL
9.7
3.1
3.5
2.4
JSW Steel
8.5
2.9
2.8
2.1
8.8
3.1
2.9
2.1
JSPL
8.7
3.0
2.9
2.1
9.4
3.1
3.2
2.4
9.3
3.0
3.3
2.1
Exhibit 40: India steel – EBITDA/ton (INR)
Average
20,000
15,000
10,000
5,000
0
JSW Steel
Tata Steel
JSPL
Source: Company, MOSL Source: Company, MOSL
July 2015 20
India Strategy | Getting on track!
7/24/2015 India Strategy: Getting on track!– Detailed Report
http://www.motilaloswal.com/site/rreports/HTML/635721163512170886/index.htm 23/85
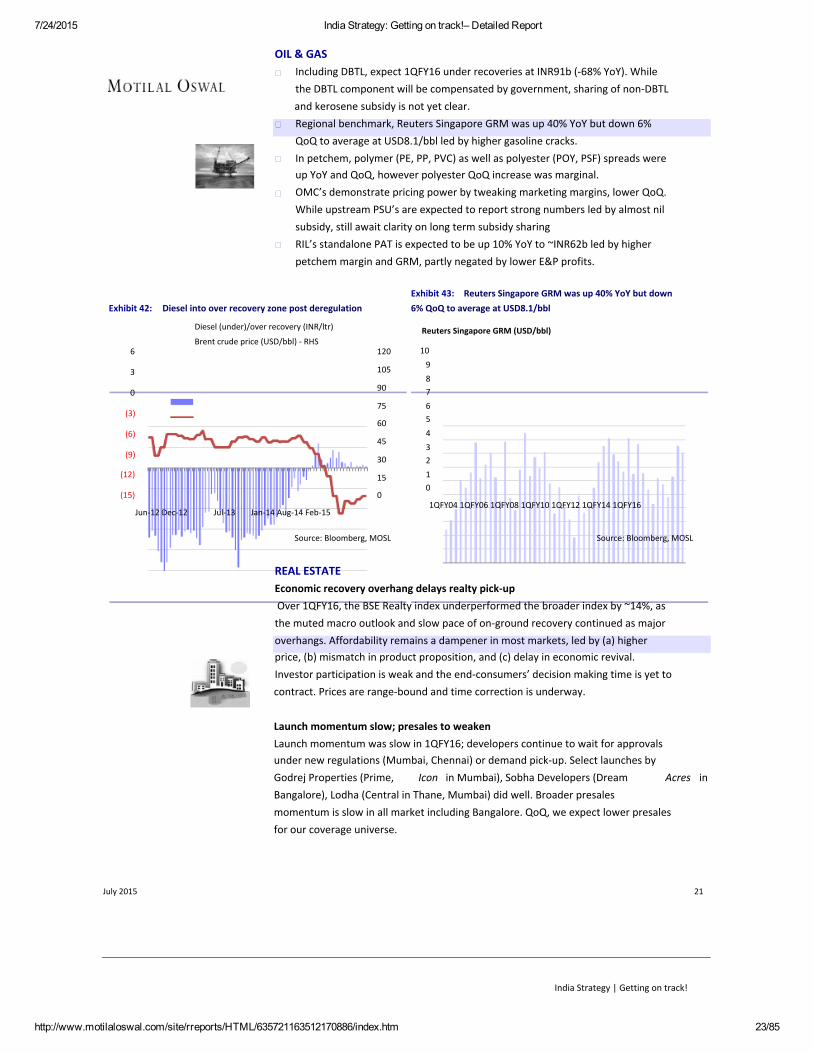
OIL & GASIncluding DBTL, expect 1QFY16 under recoveries at INR91b (‐68% YoY). Whilethe DBTL component will be compensated by government, sharing of non‐DBTLand kerosene subsidy is not yet clear.Regional benchmark, Reuters Singapore GRM was up 40% YoY but down 6%QoQ to average at USD8.1/bbl led by higher gasoline cracks.In petchem, polymer (PE, PP, PVC) as well as polyester (POY, PSF) spreads wereup YoY and QoQ, however polyester QoQ increase was marginal.OMC’s demonstrate pricing power by tweaking marketing margins, lower QoQ.While upstream PSU’s are expected to report strong numbers led by almost nilsubsidy, still await clarity on long term subsidy sharingRIL’s standalone PAT is expected to be up 10% YoY to ~INR62b led by higherpetchem margin and GRM, partly negated by lower E&P profits.
Exhibit 43: Reuters Singapore GRM was up 40% YoY but down6% QoQ to average at USD8.1/bbl
Reuters Singapore GRM (USD/bbl)
120
105
90
75
60
45
30
15
0
109876543210
1QFY04 1QFY06 1QFY08 1QFY10 1QFY12 1QFY14 1QFY16
Exhibit 42: Diesel into over recovery zone post deregulation
Diesel (under)/over recovery (INR/ltr)
Brent crude price (USD/bbl) ‐ RHS6
3
0
(3)
(6)
(9)
(12)
(15)
Jun‐12 Dec‐12 Jul‐13 Jan‐14 Aug‐14 Feb‐15
Source: Bloomberg, MOSL Source: Bloomberg, MOSL
REAL ESTATEEconomic recovery overhang delays realty pick‐upOver 1QFY16, the BSE Realty index underperformed the broader index by ~14%, asthe muted macro outlook and slow pace of on‐ground recovery continued as majoroverhangs. Affordability remains a dampener in most markets, led by (a) higherprice, (b) mismatch in product proposition, and (c) delay in economic revival.Investor participation is weak and the end‐consumers’ decision making time is yet tocontract. Prices are range‐bound and time correction is underway.
Launch momentum slow; presales to weakenLaunch momentum was slow in 1QFY16; developers continue to wait for approvalsunder new regulations (Mumbai, Chennai) or demand pick‐up. Select launches byGodrej Properties (Prime, Icon in Mumbai), Sobha Developers (Dream Acres inBangalore), Lodha (Central in Thane, Mumbai) did well. Broader presalesmomentum is slow in all market including Bangalore. QoQ, we expect lower presalesfor our coverage universe.
July 2015 21
India Strategy | Getting on track!

7/24/2015 India Strategy: Getting on track!– Detailed Report
http://www.motilaloswal.com/site/rreports/HTML/635721163512170886/index.htm 24/85
The NCR market showed marginal improvement on the residential front, withapproval for Dwarka Expressway expected to drive demand. DLF’s Camellia wouldpost stable momentum. Discount schemes and innovative offerings are in full swing.Developers like Tata Housing resorted to online property auctions and sales tooffload inventory. Operating cash flows for most companies would remain sub‐normal, resulting in rise in gearing levels.
PE activities strong; commercial market picking up graduallyThough private equity (PE) players remain upbeat on Indian real estate, the quarterwitnessed the exit of key PE players like ASK group and Milestone in certain projects.The commercial asset class is showing positive signs towards recovery in the NCRand Bangalore markets, with rentals picking up and demand outpacing supply.
Exhibit 44: Quarterly Trend in Presales value (INR b)Presales (INR b)
FY11 FY12 FY13 FY14
NCR Centric developers 102.6 90.9DLF 59.4 52.9Unitech 43.2 38.1Mumbai Centric developers 79.1 39.6IBREL 48.4 19.5HDIL 20.7 10.6ORL 10.1 9.5
Bangalore Centric developers 32.4 46.8Sobha 10.9 17.4PEPL 13.8 20.6Purva 7.6 8.8Brigade
Diversified 16.9 18.9MAHLIFE 7.0 6.0GPL (own stake) 10.0 12.8
66.3
38.228.138.7
30.0‐
8.7
68.222.2
31.114.97.9
18.84.414.4
1Q 2Q
FY15
3Q 4Q
21.5
19.81.721.8
5.54.012.3
21.26.3
10.11.33.5
4.22.51.7
FY15 YoY, %
46.9
38.68.352.1
20.314.117.7
86.621.0
43.714.214.3
17.77.010.7
‐36
‐22‐641
‐4889247
‐23‐39
‐15‐45‐29
‐3316‐47
55.8 6.5 11.1 7.9
40.7 3.1 9.2 6.515.1 3.4 1.9 1.439.7 10.0 8.3 12.0
30.7 5.6 4.0 5.25.6 3.0 3.3 3.83.4 1.4 1.0 3.0
75.7 21.4 23.2 20.923.4 4.8 5.6 4.3
36.3 13.1 12.9 7.616.0 3.5 4.7 4.813.4 2.5 4.1 4.2
16.3 4.1 3.9 5.43.7 0.5 0.9 3.112.6 3.6 3.0 2.3
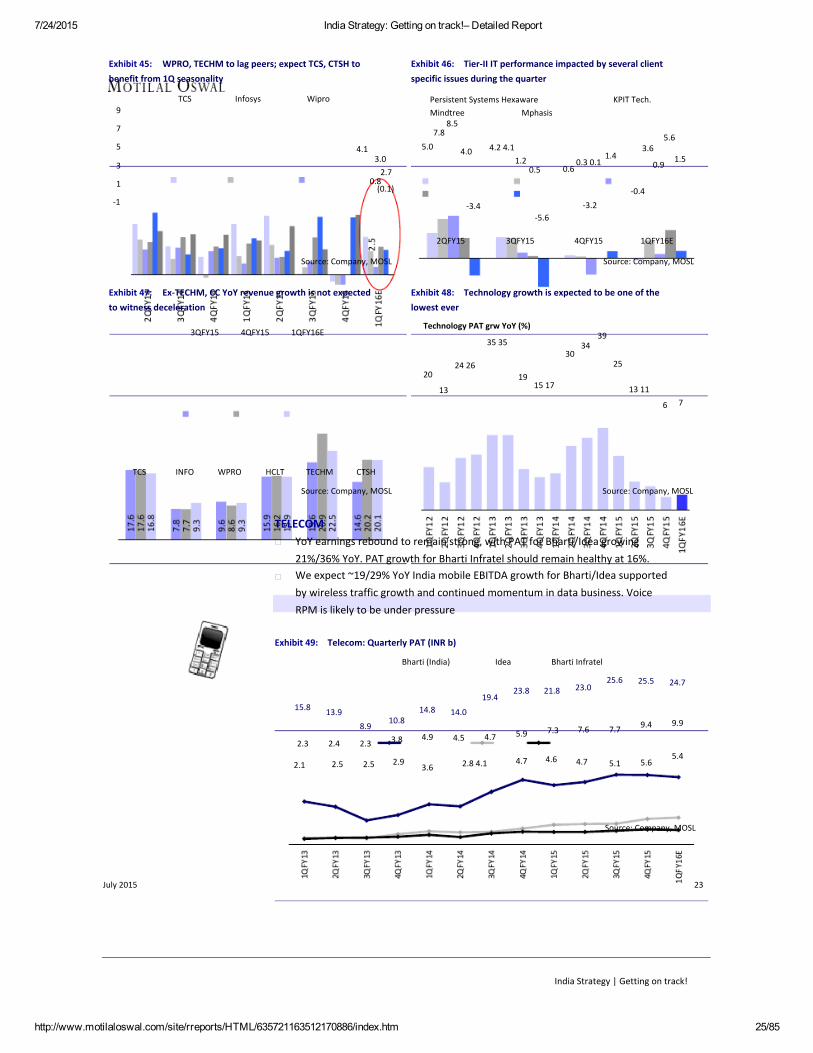
TECHNOLOGYWe expect aggregate reported USD revenue growth of 2.6% QoQ across top tierIT companies in 1QFY16, with TCS leading organic growth at 4.1% QoQ in CCterms. Energy segment at WPRO and Telecom at TECHM will drag theperformance across those two companies. Tier II IT companies are expected tofare in a similarly polarized fashion, with aggregate growth estimated at 2.4%QoQ. PSYS, KPIT, CYL and MPHL all face specific headwinds to their portfolio.While INR appreciation of ~2.%+ QoQ along with relatively stable globalcurrencies is a tailwind to margins, wage hikes at TCS, INFO and WPRO, andgrowth issues in TECHM will offset the impact from the same. Only HCLT in tier‐Ishould see expansion in margins.Across tier I, our aggregate estimate for PAT growth is 7% YoY, led by TCS (12%).TECHM should lag with YoY decline of 5% due to lower margins. Tier II ITuniverse is expected to report a PAT growth of 12% YoY, led by HEXW (+41%YoY) and MTCL (+18% YoY). KPIT is expected to lag (‐17% YoY).
July 2015 22
India Strategy | Getting on track!
7/24/2015 India Strategy: Getting on track!– Detailed Report
http://www.motilaloswal.com/site/rreports/HTML/635721163512170886/index.htm 25/85
Exhibit 45: WPRO, TECHM to lag peers; expect TCS, CTSH tobenefit from 1Q seasonality
9
7
5
3
1
‐1
4.13.02.7
0.8(0.1)
TCS Infosys Wipro
Exhibit 46: Tier‐II IT performance impacted by several clientspecific issues during the quarter
Persistent Systems Hexaware KPIT Tech.Mindtree Mphasis
8.57.8 5.6
5.0 4.2 4.1 3.64.0 1.4 1.51.2 0.3 0.1 0.90.60.5
‐0.4
‐3.4
2QFY15
‐3.2‐5.6
3QFY15 4QFY15 1QFY16E
Source: Company, MOSL Source: Company, MOSL
Exhibit 47: Ex‐TECHM, CC YoY revenue growth is not expected Exhibit 48: Technology growth is expected to be one of theto witness deceleration lowest ever
3QFY15 4QFY15 1QFY16ETechnology PAT grw YoY (%)
35 35
20
13
24 2619
30
15 17
3439
25
13 11
6 7
TCS INFO WPRO HCLT TECHM CTSH
Source: Company, MOSLSource: Company, MOSL
TELECOMYoY earnings rebound to remain strong, with PAT for Bharti/Idea growing21%/36% YoY. PAT growth for Bharti Infratel should remain healthy at 16%.We expect ~19/29% YoY India mobile EBITDA growth for Bharti/Idea supportedby wireless traffic growth and continued momentum in data business. VoiceRPM is likely to be under pressure
Exhibit 49: Telecom: Quarterly PAT (INR b)
Bharti (India) Idea
19.4
13.98.9
2.3
2.1
2.4
2.5
2.3
2.5
10.8
3.8
2.9
14.8
4.9
3.6
14.0
4.5 4.7 5.9
4.7
7.3
4.6
7.6
4.7
7.7
5.1
9.4
23.8
Bharti Infratel
21.8 23.025.6 25.5 24.7
15.8
9.9
5.42.8 4.1 5.6
Source: Company, MOSL
July 2015 23
India Strategy | Getting on track!
7/24/2015 India Strategy: Getting on track!– Detailed Report
http://www.motilaloswal.com/site/rreports/HTML/635721163512170886/index.htm 26/85
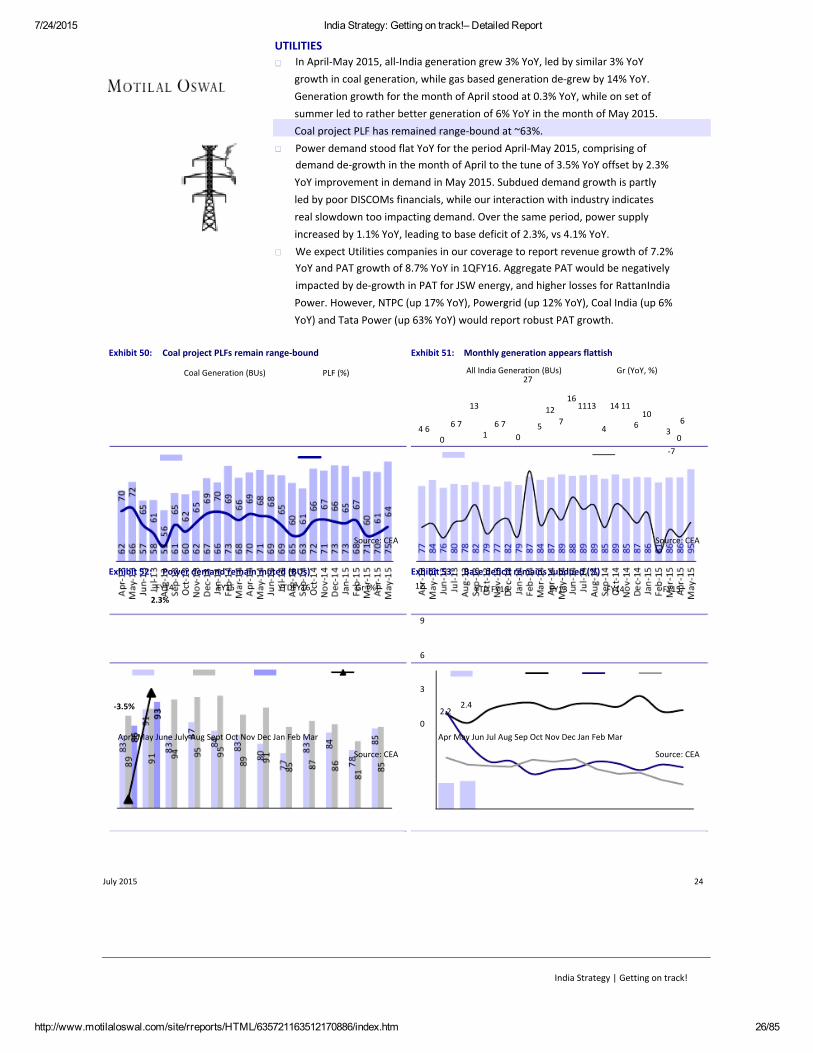
UTILITIESIn April‐May 2015, all‐India generation grew 3% YoY, led by similar 3% YoYgrowth in coal generation, while gas based generation de‐grew by 14% YoY.Generation growth for the month of April stood at 0.3% YoY, while on set ofsummer led to rather better generation of 6% YoY in the month of May 2015.Coal project PLF has remained range‐bound at ~63%.Power demand stood flat YoY for the period April‐May 2015, comprising ofdemand de‐growth in the month of April to the tune of 3.5% YoY offset by 2.3%YoY improvement in demand in May 2015. Subdued demand growth is partlyled by poor DISCOMs financials, while our interaction with industry indicatesreal slowdown too impacting demand. Over the same period, power supplyincreased by 1.1% YoY, leading to base deficit of 2.3%, vs 4.1% YoY.We expect Utilities companies in our coverage to report revenue growth of 7.2%YoY and PAT growth of 8.7% YoY in 1QFY16. Aggregate PAT would be negativelyimpacted by de‐growth in PAT for JSW energy, and higher losses for RattanIndiaPower. However, NTPC (up 17% YoY), Powergrid (up 12% YoY), Coal India (up 6%YoY) and Tata Power (up 63% YoY) would report robust PAT growth.
Exhibit 51: Monthly generation appears flattish
All India Generation (BUs)27
13
4 6 6 7
0 16 7
05
1216
7
1113
4
Gr (YoY, %)
14 11
6
Exhibit 50: Coal project PLFs remain range‐bound
Coal Generation (BUs) PLF (%)
10
3
‐7
6
0
Source: CEA Source: CEA
Exhibit 52: Power demand remain muted (BUs)
FY142.3%
FY15 YTDFY16 Gr (%)
Exhibit 53: Base deficit remains subdued (%)12
9
6
3
YTD FY16 FY13 FY14 FY15
‐3.5%
0April May June July Aug Sept Oct Nov Dec Jan Feb Mar
Source: CEA
2.22.4
Apr May Jun Jul Aug Sep Oct Nov Dec Jan Feb Mar
Source: CEA
July 2015 24
India Strategy | Getting on track!

7/24/2015 India Strategy: Getting on track!– Detailed Report
http://www.motilaloswal.com/site/rreports/HTML/635721163512170886/index.htm 27/85
Exhibit 54: Peak deficit too trends lower (%)
16
13
10
7
4
1
‐2
3.52.3
YTDFY16 FY13 FY14 FY15
Exhibit 55: ST prices cool remain soft (INR/unit)
Apr May Jun Jul Aug Sep Oct Nov Dec Jan Feb Mar
Source: CEA Source: IEX
July 2015 25
India Strategy | Getting on track!

7/24/2015 India Strategy: Getting on track!– Detailed Report
http://www.motilaloswal.com/site/rreports/HTML/635721163512170886/index.htm 28/85
Intra‐sector 1QFY16 earnings divergence (%)Sectors Sector
Growth (%)
+30% Growth 15‐30% growth 0‐15% growth ‐ve earnings
growth (%)
Earnings
momentum
High growth sectors
Media 36
Telecom
Capital Goods
Banks ‐ Private
23
18
17
PVRL: 152%, SUNTV: 40%
DITV: LP
IDEA: 36%
SIEM: 878%, BHE: 117%,
TMX: 54%
JAGP: 27% Z: 0%
BHARTI: 21%,
BHIN: 16%
ABB: 28%, CRG: 14%, HAVL: 11%,
KKC: 19% LT: 9%
YES: 29%, IIB: 24%, FB: 15%, KMB: 12%,
HDFCB: 20%, ICICIBC: 12%
AXSB: 18%
PIDI: 30%,
DABUR: 26%,
SKB: 19%,
CLGT: 16%
DBCL:‐15%,HTML:‐49%, 3 1 1 4HATH:Loss,SCNL:Loss
RCOM: ‐4% 1 2 0 1
VOLT: ‐6%,
BHEL: ‐8%
DCBB: ‐3%
3 2 3 2
0 4 3 1
Medium/Low growth sectors
Consumer 14 JYL: 59%, GCPL: 52%,
BRIT: 48%, UNSP: LP
Retail
NBFC
11
9
SHOP: 335%,
JUBI: 51%
MRCO: 14%, APNT: 14%,
RDCK: 13%, HUVR: 12%,
HMN: 6%, ITC: 5%,
NEST: 1%
TTAN: 3%
4 4 7 0
2 0 1 0
Utilities 9
Oil & Gas
(Ex Rms)
Technology
7
7
MMFS: 27%, RECL: 9%, POWF: 7%,
IHFL: 25%,BAF: 24%, SHTF: 4%, HDFC: 1%,
LICHF: 20%,DEWH: 18%, IDFC: 1%
REPCO: 18%
TPWR: 63% PTCIN: 28%, CESC: 14%, PWGR: 12%, JSW: ‐24%,
NTPC: 17% COAL: 6%,NHPC: 3%, RTPOW: Loss
RELI: 0%
HPCL: 1399%, ONGC: 41%, GUJS: 25%, GAIL: 12%, RIL: 10%, IOCL: ‐9%,BPCL : ‐11%,
MRPL: LP OINL: 18% PLNG: 4% IGL: ‐13%, CAIR: ‐57%
HEXW: 41% TELX: 21%, TCS: 12%, WPRO: 7%, PSYS: ‐3%,
MTCL: 18% MPHL: 6%, INFO: 4%, TECHM: ‐5%,
HCLT: 1% KPIT: ‐17%
ALPM: 126%, CDH: 50%,
CIPLA: 41%, GLXO: 36%
MSIL: 77%, BHFC: 54%,
EIM: 54%, TVSL: 46%,
AL :LP
IBREL: 60%,
OBER: 54%
TRP: 25%,
DIVI: 21%
AMRJ: 19%,
BJAUT: 17%
GPL: 22%,
PEPL: 21%
0 6 5 0
1 2 5 2
3 2 3 4
5 31 2
PAT degrowth sectors
Healthcare ‐1
Autos ‐7
GNP: 10%, DRRD: 6%, SANL:‐3%,LPC:‐10%,4 2
ARBP: 6%, BIOS: 1% SUNP:‐28%,IPCA:‐78%
HMCL: 13%, MM: ‐20%,
EXID: 8% TTMT: ‐31% 5 2
PHNX: 5%
4 4
2 2
Real Estate ‐11
Banks ‐ PSU ‐27
Cement ‐33
Metals ‐52
Earnings momentum:
SOBHA: ‐5%,2 2 1 3DLFU: ‐14%,
MLIFE: ‐81%
INBK: 4%, BOB: ‐44%, 00SBIN: 1% UNBK: ‐48%, 2 4
BOI: ‐49%, PNB: ‐58%
TRCL: 234% UTCEM/ACC: ‐27%,1 0GRASIM: ‐38%, 0
6SRCM:‐79%ACEM:‐40%,
ICEM: Loss
HZ: ‐3%, VEDL: ‐14%,
NACL:‐18%,HNDL:‐38%, 0 0 0 9NMDC:‐42%,JSTL:‐90%,
JSP: PL, SAIL: PL,
TATA: PL
Represents number of companies in each of the growth brackets; PL: Profit to Loss; LP: Loss to Profit
July 2015 27
India Strategy | Getting on track!
7/24/2015 India Strategy: Getting on track!– Detailed Report
http://www.motilaloswal.com/site/rreports/HTML/635721163512170886/index.htm 29/85
FY16‐17 estimates Expect recovery in 2HFY16Government‐led capex and low inflation to lead recovery
Delay in domestic recovery and global commodity fall continue be the headwinds for
earnings growth. Other factors such as muted rural consumption, continuing asset
quality woes in PSU banks and adverse cross currency movements continue to pull
down the aggregate growth of corporate India.
However, we believe government‐led capital spending and favorable inflation leading
to lower rates will create conducive environment for earnings growth recovery.
Our bottom‐up estimates suggest aggregate PAT of the MOSL Universe (ex‐RMs) to
rebound to 17%/23% in FY16/FY17. Sales growth would increase moderately to 9% in
FY16 before jumping to 13% in FY17.
Expect Sensex EPS to grow 15% to 1,561 in FY16 and 22% to 1,907 in FY17. Since the
last preview, three‐fourths of the Sensex companies would see an EPS cut—led by
Tata Steel, Sun Pharma, Hindalco, Tata Motors, Coal India and GAIL. Top upgrade
drivers are Maruti, NTPC, ONGC and Bajaj Auto.
One‐third of the Sensex companies would contribute more than two‐thirds of FY16
Sensex EPS expansion. Key contributors to the EPS expansion would be ONGC, Tata
Motors, ICICI Bank, HDFC Bank, Tata Steel and Reliance Ind, M&M, Axis Bank, HDFC
and SBI.
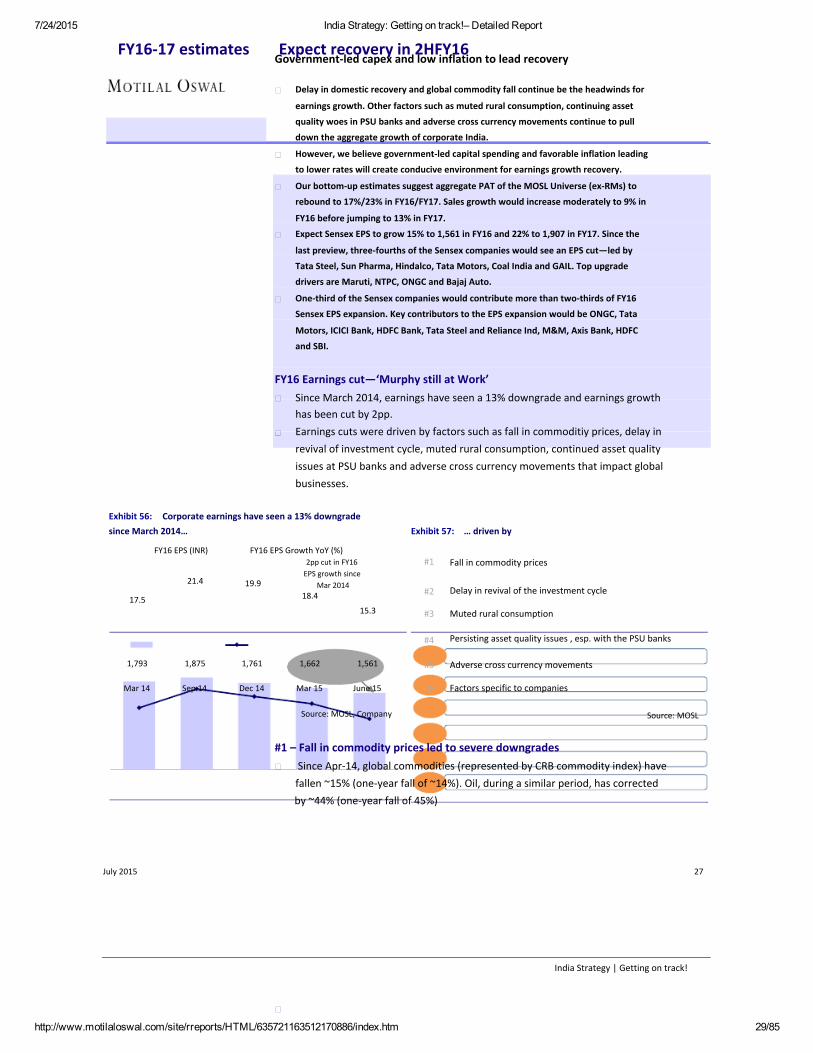
FY16 Earnings cut—‘Murphy still at Work’Since March 2014, earnings have seen a 13% downgrade and earnings growthhas been cut by 2pp.Earnings cuts were driven by factors such as fall in commoditiy prices, delay inrevival of investment cycle, muted rural consumption, continued asset qualityissues at PSU banks and adverse cross currency movements that impact globalbusinesses.
Exhibit 56: Corporate earnings have seen a 13% downgradesince March 2014…
FY16 EPS (INR)
21.4
17.5
FY16 EPS Growth YoY (%)
19.9
2pp cut in FY16EPS growth since
Mar 2014
Exhibit 57: … driven by
#1
#2
#3
#4
Fall in commodity prices
Delay in revival of the investment cycle
Muted rural consumption
Persisting asset quality issues , esp. with the PSU banks
Adverse cross currency movements
Factors specific to companies
Source: MOSL
18.4
15.3
1,793
Mar 14
1,875
Sep 14
1,761
Dec 14
1,662
Mar 15
1,561
June 15
#5
#6
Source: MOSL, Company
#1 – Fall in commodity prices led to severe downgradesSince Apr‐14, global commodities (represented by CRB commodity index) havefallen ~15% (one‐year fall of ~14%). Oil, during a similar period, has correctedby ~44% (one‐year fall of 45%)
July 2015 27
India Strategy | Getting on track!
7/24/2015 India Strategy: Getting on track!– Detailed Report
http://www.motilaloswal.com/site/rreports/HTML/635721163512170886/index.htm 30/85
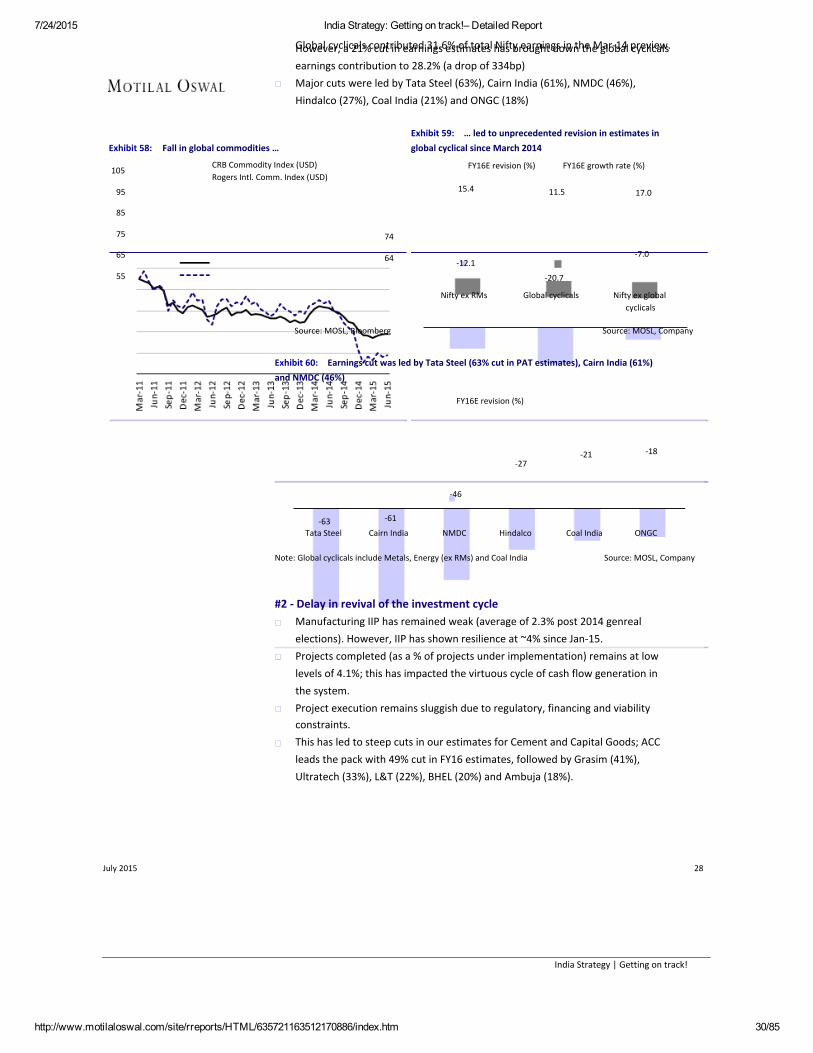
Global cyclicals contributed 31.6% of total Nifty earnings in the Mar‐14 preview.However, a 21% cut in earnings estimates has brought down the global cyclicalsearnings contribution to 28.2% (a drop of 334bp)Major cuts were led by Tata Steel (63%), Cairn India (61%), NMDC (46%),Hindalco (27%), Coal India (21%) and ONGC (18%)
Exhibit 59: … led to unprecedented revision in estimates inglobal cyclical since March 2014
FY16E revision (%)
15.4
FY16E growth rate (%)
11.5 17.0
Exhibit 58: Fall in global commodities …
105
95
85
75
65
55
74
64
CRB Commodity Index (USD)Rogers Intl. Comm. Index (USD)
‐12.1
‐20.7
Nifty ex RMs Global cyclicals
‐7.0
Nifty ex globalcyclicals
Source: MOSL, CompanySource: MOSL, Bloomberg
Exhibit 60: Earnings cut was led by Tata Steel (63% cut in PAT estimates), Cairn India (61%)and NMDC (46%)
FY16E revision (%)
‐27
‐46
‐63Tata Steel
‐61
Cairn India
‐21 ‐18
NMDC Hindalco Coal India ONGC
Note: Global cyclicals include Metals, Energy (ex RMs) and Coal India Source: MOSL, Company
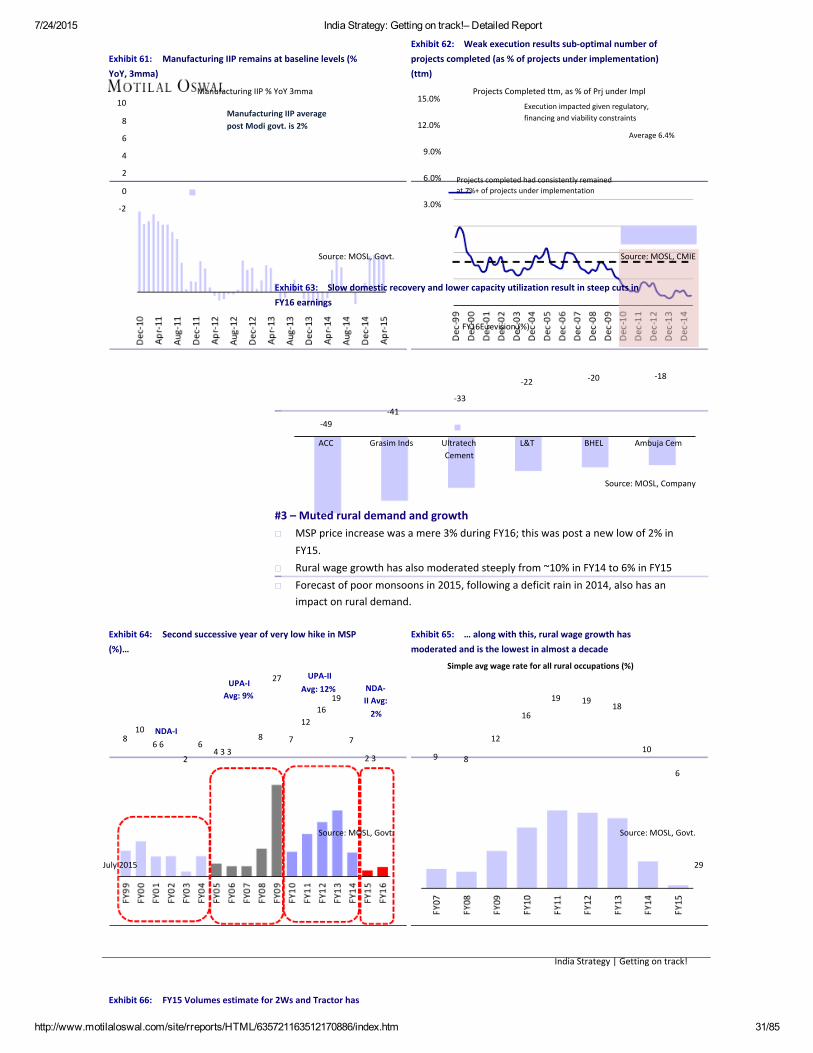
#2 ‐ Delay in revival of the investment cycleManufacturing IIP has remained weak (average of 2.3% post 2014 genrealelections). However, IIP has shown resilience at ~4% since Jan‐15.Projects completed (as a % of projects under implementation) remains at lowlevels of 4.1%; this has impacted the virtuous cycle of cash flow generation inthe system.Project execution remains sluggish due to regulatory, financing and viabilityconstraints.This has led to steep cuts in our estimates for Cement and Capital Goods; ACCleads the pack with 49% cut in FY16 estimates, followed by Grasim (41%),Ultratech (33%), L&T (22%), BHEL (20%) and Ambuja (18%).
July 2015 28
India Strategy | Getting on track!
7/24/2015 India Strategy: Getting on track!– Detailed Report
http://www.motilaloswal.com/site/rreports/HTML/635721163512170886/index.htm 31/85
Exhibit 61: Manufacturing IIP remains at baseline levels (%YoY, 3mma)
Manufacturing IIP % YoY 3mma10
8
6
4
2
0
‐2
Manufacturing IIP averagepost Modi govt. is 2%
Exhibit 62: Weak execution results sub‐optimal number ofprojects completed (as % of projects under implementation)(ttm)
15.0%
12.0%
9.0%
6.0%
3.0%
Projects completed had consistently remainedat 7%+ of projects under implementation
Projects Completed ttm, as % of Prj under Impl
Execution impacted given regulatory,financing and viability constraints
Average 6.4%
Source: MOSL, Govt. Source: MOSL, CMIE
Exhibit 63: Slow domestic recovery and lower capacity utilization result in steep cuts inFY16 earnings
FY16E revision (%)
‐22
‐33‐41
‐49
ACC Grasim Inds UltratechCement
L&T
‐20 ‐18
BHEL Ambuja Cem
Source: MOSL, Company
#3 – Muted rural demand and growthMSP price increase was a mere 3% during FY16; this was post a new low of 2% inFY15.Rural wage growth has also moderated steeply from ~10% in FY14 to 6% in FY15Forecast of poor monsoons in 2015, following a deficit rain in 2014, also has animpact on rural demand.
Exhibit 65: … along with this, rural wage growth hasmoderated and is the lowest in almost a decade
Simple avg wage rate for all rural occupations (%)
NDA‐II Avg:2%
7
2 3 9 8
12
19
16
19
Exhibit 64: Second successive year of very low hike in MSP(%)…
UPA‐IAvg: 9%
10 NDA‐I6 6
2
27 UPA‐IIAvg: 12%
1916
12
7
18
86
8
4 3 3 10
6
Source: MOSL, Govt.
July 2015
Source: MOSL, Govt.
29
India Strategy | Getting on track!
Exhibit 66: FY15 Volumes estimate for 2Ws and Tractor has

7/24/2015 India Strategy: Getting on track!– Detailed Report
http://www.motilaloswal.com/site/rreports/HTML/635721163512170886/index.htm 32/85
seen downgrades…2Ws
2.1%
0.0% ‐4.0% ‐3.3%
TractorExhibit 67: …also reflecting in FY16 earnings revision
FY16E revision (%)
‐6.5%
‐11.0%
Sep‐14 Dec‐14 Mar‐15
Source: MOSL, SIAM, Company
‐28M&M
‐17‐15
Hero Moto Bajaj Auto
Source: MOSL, Company
Exhibit 68: HUVR volume growth has been sub‐5% in the past two years, with 30‐35%volumes from rural India
HUL Volume growth (%)13.0
9.3
6.8
3.34.8
4.04.8
8.0
Source: MOSL, Company
#4 ‐ Asset quality issues: Lower credit growth and asset quality leading tohuge cute in estimates
Credit growth stands at a four‐year low at 10% in FY15 v/s an average creditgrowth of ~15%.Weaker‐than‐expected domestic recovery leading to continued rise in stressloans for PSU banks.Slippages are likely to go up as the banks are likely to grapple with the norestructuring forbearance windowGNPA’s jumped from 2.2% of loan book in FY11 to 4.6% of the loan book inFY15. We expect GNPAs to up further in 1HFY16.
Exhibit 70: ... leading to downgrades in earnings estimatessince Mar‐14
FY16E revision (%)
Exhibit 69: Credit growth remains weak while GNPAs &restructured loans are near highs…
GNPA
21.519.6
Restructured Loans
17.0
6.2
3.0
17.5
7.1
4.9
System credit growth
8.4
10.0
4.5
8.8
9.7
15.9
7.3
3.9
14.0
7.2
3.8
13.9
7.5
4.44.12.2
3.5
3.0
‐21
4.6
‐41
BOI PNB
‐18
BOB
Source: MOSL, Company
30
Source: MOSL; Company
July 2015
India Strategy | Getting on track!
#5 – Tech: Adverse cross currencies and weak global demand restricts PAT

7/24/2015 India Strategy: Getting on track!– Detailed Report
http://www.motilaloswal.com/site/rreports/HTML/635721163512170886/index.htm 33/85
growthMajor global currencies like EUR, GBP, JPY and AUD have all depreciated 8‐18%since 1QFY15; however, INR has depreciated by only ~5% . This impacted USDrevenues of companies cutting revenue estimates by 400‐600bp in FY15/16across top‐tier IT companiesWeakness in specific segments in global markets has led many IT companies toguide for muted growth. This follows a disappointing growth in 4QFY15.Contribution of Technology to overall PAT seems to have peaked at 14.3% inFY15. We estimate PAT growth of only 9% in FY16, lowest ever for the sector.
Exhibit 71: Major global currencies depreciated 10‐18% v/s USD since 1QFY15 (%) …
18.6% 18.3%17.3%
8.1%
5.4%
EUR GDP AUD JPY INR
Source: MOSL, Bloomberg
Exhibit 72: … resulting in PAT growth to come down to 9%
45
28
47 Technology PAT growth (%)
23% CAGR PAT 3227growth
1916 18 17 15
Exhibit 73: Technology contribution may have peaked at14.2% in FY15
Technology PAT as % of MOSL PAT universe
10.4
7.9 7.46.7 7.4
8.3 8.5 8.4 8.4
12.914.3
13.2 12.4
1116
9
Source: MOSL, Company Source: MOSL, Company
#6 – Company‐specific factors resulting in cut in estimatesITC: Cigarettes has seen ~17% excise duty hike every year on an average in thepast four years, creating huge pressure on cigarette volumes. Accordingly,volumes are expected to see a decline in FY16.HDFC: Increase in tax rate from 26% to 31% due to creation of deferred taxliabilities on special reserve (as per NHB guideline) and lower‐than‐expectedgrowth led to cut in estimates by 3% for FY16/17Tata Motors: Volumes have been disappointing for JLR on several issues. Thishas also impacted the margin estimates, leading to severe cut in earningsgrowth.
July 2015 31
India Strategy | Getting on track!
Exhibit 74: FY13‐FY16 has seen steep excise duty hikes in cigarettesFY09 FY10 FY11 FY12 FY13 FY14 FY15 FY16
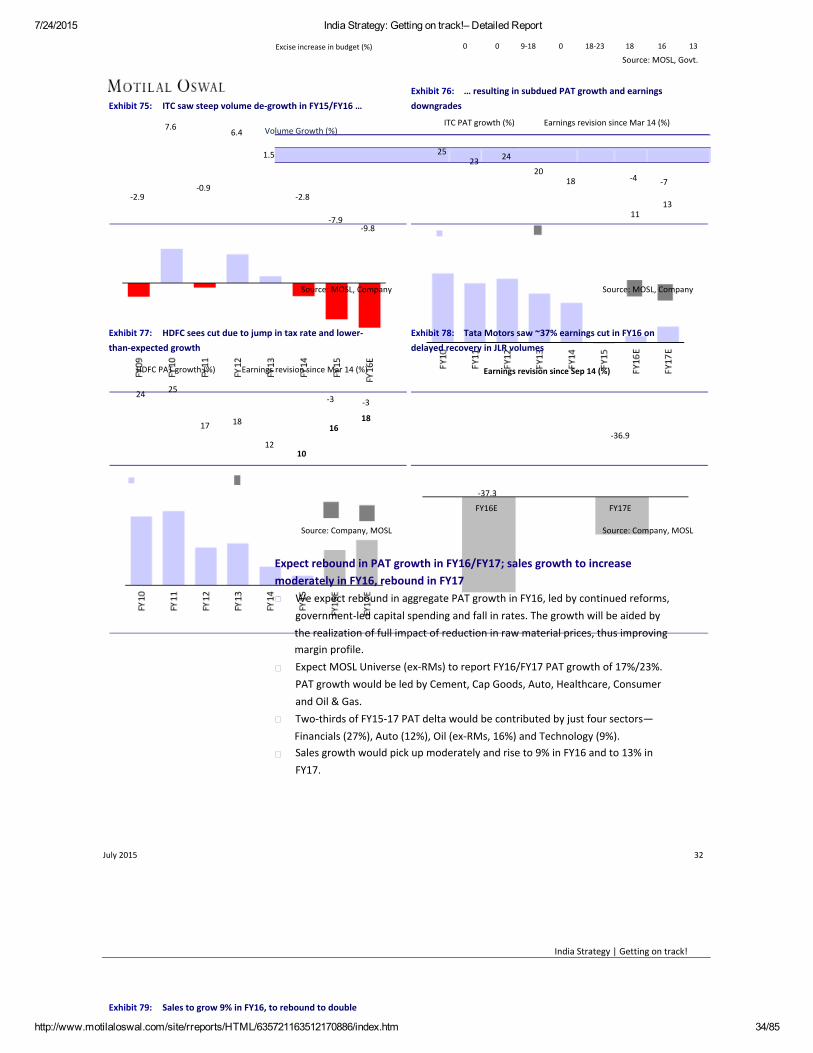
7/24/2015 India Strategy: Getting on track!– Detailed Report
http://www.motilaloswal.com/site/rreports/HTML/635721163512170886/index.htm 34/85
Excise increase in budget (%) 0 0 9‐18 0 18‐23 18 16 13
Source: MOSL, Govt.
Exhibit 75: ITC saw steep volume de‐growth in FY15/FY16 …
7.66.4 Volume Growth (%)
1.5
‐0.9
Exhibit 76: … resulting in subdued PAT growth and earningsdowngrades
ITC PAT growth (%)
25 24
2018 ‐4
11
‐7
13
Earnings revision since Mar 14 (%)
23
‐2.9 ‐2.8
‐7.9‐9.8
Source: MOSL, Company Source: MOSL, Company
Exhibit 77: HDFC sees cut due to jump in tax rate and lower‐than‐expected growth
HDFC PAT growth (%)
24 25
17 18
1210
Earnings revision since Mar 14 (%)
‐3
16
‐3
18
Exhibit 78: Tata Motors saw ~37% earnings cut in FY16 ondelayed recovery in JLR volumes
Earnings revision since Sep 14 (%)
‐36.9
‐37.3
FY16E
Source: Company, MOSL
FY17E
Source: Company, MOSL
Expect rebound in PAT growth in FY16/FY17; sales growth to increasemoderately in FY16, rebound in FY17
We expect rebound in aggregate PAT growth in FY16, led by continued reforms,government‐led capital spending and fall in rates. The growth will be aided bythe realization of full impact of reduction in raw material prices, thus improvingmargin profile.Expect MOSL Universe (ex‐RMs) to report FY16/FY17 PAT growth of 17%/23%.PAT growth would be led by Cement, Cap Goods, Auto, Healthcare, Consumerand Oil & Gas.Two‐thirds of FY15‐17 PAT delta would be contributed by just four sectors—Financials (27%), Auto (12%), Oil (ex‐RMs, 16%) and Technology (9%).Sales growth would pick up moderately and rise to 9% in FY16 and to 13% inFY17.
July 2015 32
India Strategy | Getting on track!
Exhibit 79: Sales to grow 9% in FY16, to rebound to double
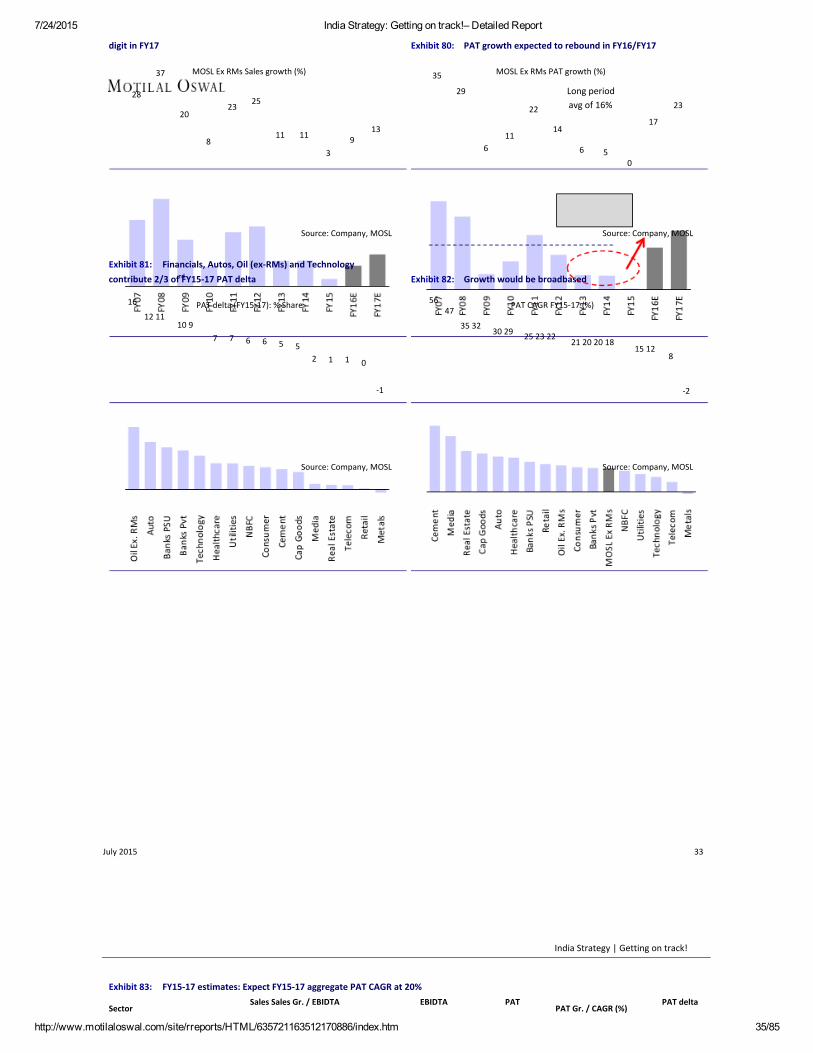
7/24/2015 India Strategy: Getting on track!– Detailed Report
http://www.motilaloswal.com/site/rreports/HTML/635721163512170886/index.htm 35/85
digit in FY17
37
28
20
8
23
MOSL Ex RMs Sales growth (%)
25
11 11
3
13
Exhibit 80: PAT growth expected to rebound in FY16/FY17
35
29
22
MOSL Ex RMs PAT growth (%)
Long periodavg of 16%
14
6 50
17
23
9 116
Source: Company, MOSL Source: Company, MOSL
Exhibit 81: Financials, Autos, Oil (ex‐RMs) and Technologyrdcontribute 2/3 of FY15‐17 PAT delta
16
12 1110 9
PAT delta (FY15‐17): % Share
7 7 6 6
Exhibit 82: Growth would be broadbased
5647
PAT CAGR FY15‐17 (%)
35 3230 29 25 23 22
21 20 20 1815 12
85 5
2 1 1 0
‐1 ‐2
Source: Company, MOSL Source: Company, MOSL
July 2015 33
India Strategy | Getting on track!
Exhibit 83: FY15‐17 estimates: Expect FY15‐17 aggregate PAT CAGR at 20%Sales Sales Gr. / EBIDTA
SectorEBIDTA PAT
PAT Gr. / CAGR (%)PAT delta

7/24/2015 India Strategy: Getting on track!– Detailed Report
http://www.motilaloswal.com/site/rreports/HTML/635721163512170886/index.htm 36/85
(INR b) CAGR (%) CAGR (%)(No of Companies) FY15 (FY15‐17) (FY15‐17)High PAT CAGR* 21,035 12 18Cement (14) 1,209 21 38Media (11) 221 18 27Real Estate (10) 262 16 19Capital Goods (12) 1,566 11 16Others (25) 775 14 21Auto (11) 4,854 16 17Healthcare (14) 1,148 16 23Oil & Gas (12) 15,674 ‐1 21
Excl. RMs (9) 6,703 5 19Retail (3) 169 19 23Financials (31) 2,649 15 16
PSU Banks (10) 1,470 12 13Private Banks (10) 737 19 19NBFC (11) 441 18 17
Consumer (15) 1,479 13 18Medium PAT CAGR # 4,906 13 15Utilities (10) 2,185 12 17Technology (11) 2,721 14 14Low PAT CAGR ^ 6,288 6 7Metals (9) 4,714 4 4Telecom (4) 1,574 10 13MOSL Excl. RMs (189) 32,228 11 16MOSL (192) 41,199 8 16Sensex (30) 10,535 10 15Nifty (50) 12,754 10 15
* (>20%) # (10‐20%) ^ (up to 10%)
Margin (%)FY15 FY16E FY17E24.0 25.4 26.815.2 16.4 19.726.0 28.0 29.934.0 34.4 36.011.0 11.1 11.815.7 17.0 17.814.6 14.7 14.923.7 25.1 26.88.1 11.2 12.015.2 18.0 19.69.0 9.4 9.879.4 79.3 80.470.1 70.1 71.887.4 86.3 86.696.9 96.2 95.921.0 22.1 22.726.4 26.8 27.327.8 29.0 30.325.2 25.0 25.121.5 20.8 22.317.2 15.1 17.034.7 36.2 36.423.9 24.8 26.119.3 21.3 22.522.2 23.1 24.222.5 23.1 24.3
(INR b)FY152,4296021269962292169638530109513133762632098943465484052951103,7283,8361,1661,445
FY16E2536523429333228362720192119162311149‐21‐331417181815
Sh. (%)FY17E (FY15‐17) FY15‐1725 25 8480 56 543 47 235 35 135 32 528 31 328 30 1229 29 716 25 2218 22 1627 23 023 21 2730 25 1121 20 1019 18 618 21 616 13 1616 15 716 12 928 1 044 ‐2 ‐12 8 123 20 10023 20 NA22 20 NA22 18 NA
Source: Company, MOSL
Exhibit 84: Domestic plays to outperform global plays during FY15‐17 in terms of PAT growth
SECTOR FY03 FY08
PAT (INR B) PAT Contribution (%) PAT CAGR (%) P/E (x)
FY14 FY15 FY16E FY17E FY03 FY08 FY14 FY15 FY16E FY17E FY03‐08 FY08‐14 FY15‐17 FY16E 10‐Yr Avg
Domestic PlaysFinancials
Private BanksPSU BanksNBFC
ConsumerAuto Ex Tata MotorsTelecomConsumerNon‐ConsumerUtilitiesCapital GoodsCementReal EstateOthersGlobal PlaysCyclicalOil & Gas ex RMsMetalsTata MotorsNon‐CyclicalTechnologyHealthcareMOSL Universe ex RMs
308 1,084 1,936 2,046141 341 868 95125 90 327 37687 192 303 31329 58 238 26362 271 404 47018 64 141 151‐4 133 70 11048 75 194 209105 472 664 62572 173 372 34615 80 109 997 97 72 601 91 25 269 30 86 93
252 958 1,777 1,682197 748 1,141 965167 423 701 53027 303 298 2953 22 142 14056 210 636 71739 159 492 54817 51 145 169560 2,042 3,714 3,728
2,4931,13144837730659721412625776639512881351271,8541,0406731961708155972174,347
3,1061,395540491363721288129304991457174146471672,2511,2807932832049726922805,358
55254165113‐1819133102453530501073
100
53174931337423845414737211511082
100
52 5523 269 108 86 711 134 42 35 618 1710 93 32 21 12 348 4531 2619 148 84 417 1913 154 5
100 100
57 5826 2610 109 97 714 135 53 26 618 189 93 32 31 13 343 4224 2415 155 54 419 1814 135 5
100 100
28.619.329.617.114.934.328.1LP9.435.119.139.968.8141.326.230.630.620.562.150.730.332.325.029.5
10.216.924.07.926.46.914.1‐10.117.25.913.65.2‐4.9‐19.318.910.97.38.8‐0.336.820.320.719.110.5
23.221.1 2.0 2.119.9 2.9 2.625.3 0.9 1.317.7 2.4 2.423.838.0 21.6 16.08.2 26.3 26.220.7 35.0 30.225.914.8 13.5 12.432.3 32.4 24.756.2 32.7 19.034.7 17.5 15.433.915.715.122.3 11.0 12.2‐2.0 14.6 10.620.4 8.7 10.616.412.3 17.9 21.128.8 28.8 25.019.9 17.6 15.3
Source: Company, MOSL
July 2015 34
India Strategy | Getting on track!
Expect margins to improveFY16 EBITDA margin to expand 80bps to 19.7%

7/24/2015 India Strategy: Getting on track!– Detailed Report
http://www.motilaloswal.com/site/rreports/HTML/635721163512170886/index.htm 37/85
EBITDA margins are expected to improve as companies benefit from theavailability of favorable operating leverage and realize the full benefit of ratecuts and lower raw material prices
Exhibit 86: … led by falling RM prices and favorable operatingleverage
16.0
14.8
13.5
20.812.3
11.019.7 9.8
8.5
14.6
MOSL Universe PAT Margin Ex RMs & Fin (%)
14.6 15.6
14.2
12.310.9
10.2
9.8 9.4
10.9
10.0
Exhibit 85: Margins to improve in FY16/17 …
25.5
24.0
22.5
21.0
19.5
18.0
23.8
MOSL Universe EBIDTA Margin Ex RMs & Fin (%)
25.1
24.0 23.422.0 21.8
20.0
19.1 19.1 18.9
Avg of 12.4% 12.2 12.3
Avg of 21.6%20.3
Source: MOSL, Company Source: MOSL, Company
EBITDA margins across all sectors to expand over FY16‐17
Exhibit 87: FY15 EBITDA margin (%)
35 34 FY15 EBITDA Margin (%)28 26 25
24 2119 17 15 15 15
11 9
Exhibit 88: FY15‐17 EBITDA margin change (bp)
615518
463
245 204 198183 179 163 139
75 25
‐10 ‐60
Source: MOSL, Company Source: MOSL, Company
FY15‐17 estimates: Nifty FY15‐17 PAT CAGR at 19%; sales CAGR at 10%More than half of the delta PAT CAGR during FY15‐17 would be contributed by10 companies—ONGC, SBI, Tata Motors, Reliance, TCS, Tata Steel, HDFC Bank,Sun Pharma and Coal India.Nearly half of the Nifty companies would post >20% PAT CAGR during FY15‐17and about 1/5th of companies would post 15‐20% PAT CAGR.Only three companies are likely to register PAT CAGR de‐growth—Idea (‐18%),NMDC (‐21%) and Cairn India (‐29%).
July 2015 35
India Strategy | Getting on track!
Exhibit 89: Nifty performance: Expect FY15‐17 PAT CAGR at 19%Sales (INR b) Sales EBIDTA Margin EBITDA PAT (INR b) PAT YoY (%) PAT Contb
Company FY15 FY16 FY17 CAGR FY15 FY16 FY17 CAGR FY15 FY16 FY17 FY15 FY16 FY17 CAGR Delta
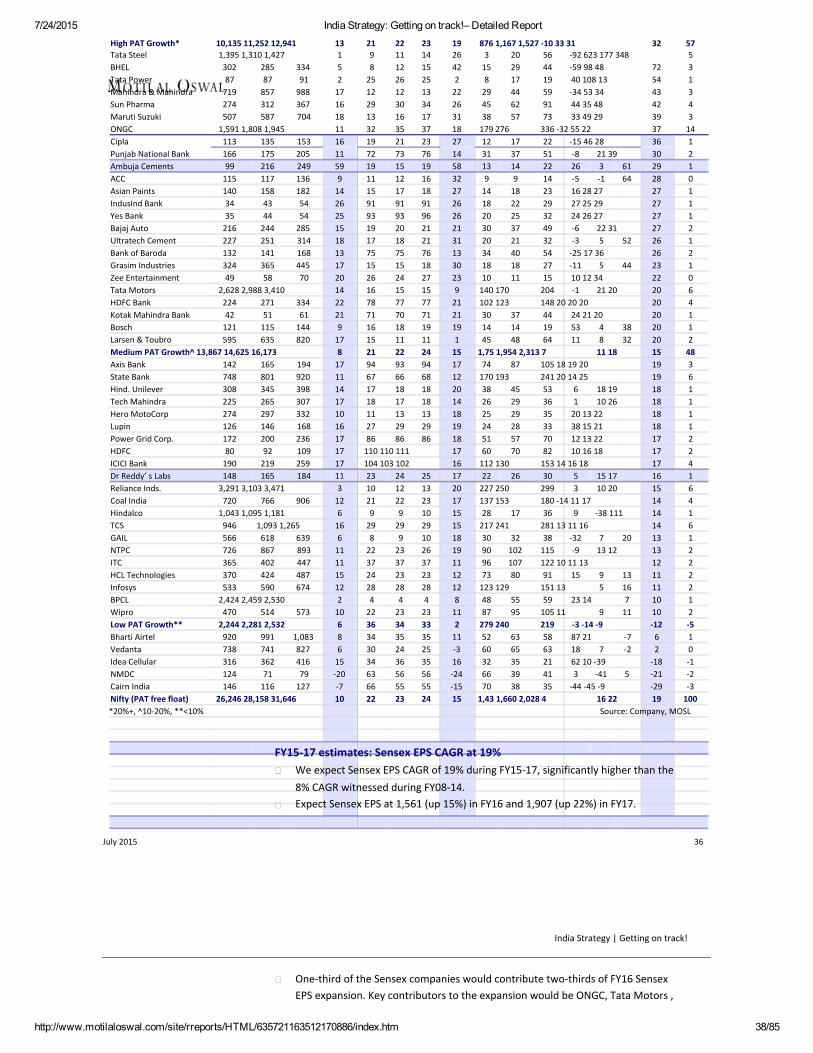
7/24/2015 India Strategy: Getting on track!– Detailed Report
http://www.motilaloswal.com/site/rreports/HTML/635721163512170886/index.htm 38/85
High PAT Growth* 10,135 11,252 12,941 13 21 22 23 19 876 1,167 1,527 ‐10 33 31 32 57Tata Steel 1,395 1,310 1,427 1 9 11 14 26 3 20 56 ‐92 623 177 348 5BHEL 302 285 334 5 8 12 15 42 15 29 44 ‐59 98 48 72 3Tata Power 87 87 91 2 25 26 25 2 8 17 19 40 108 13 54 1Mahindra & Mahindra 719 857 988 17 12 12 13 22 29 44 59 ‐34 53 34 43 3Sun Pharma 274 312 367 16 29 30 34 26 45 62 91 44 35 48 42 4Maruti Suzuki 507 587 704 18 13 16 17 31 38 57 73 33 49 29 39 3ONGC 1,591 1,808 1,945 11 32 35 37 18 179 276 336 ‐32 55 22 37 14Cipla 113 135 153 16 19 21 23 27 12 17 22 ‐15 46 28 36 1Punjab National Bank 166 175 205 11 72 73 76 14 31 37 51 ‐8 21 39 30 2Ambuja Cements 99 216 249 59 19 15 19 58 13 14 22 26 3 61 29 1ACC 115 117 136 9 11 12 16 32 9 9 14 ‐5 ‐1 64 28 0Asian Paints 140 158 182 14 15 17 18 27 14 18 23 16 28 27 27 1IndusInd Bank 34 43 54 26 91 91 91 26 18 22 29 27 25 29 27 1Yes Bank 35 44 54 25 93 93 96 26 20 25 32 24 26 27 27 1Bajaj Auto 216 244 285 15 19 20 21 21 30 37 49 ‐6 22 31 27 2Ultratech Cement 227 251 314 18 17 18 21 31 20 21 32 ‐3 5 52 26 1Bank of Baroda 132 141 168 13 75 75 76 13 34 40 54 ‐25 17 36 26 2Grasim Industries 324 365 445 17 15 15 18 30 18 18 27 ‐11 5 44 23 1Zee Entertainment 49 58 70 20 26 24 27 23 10 11 15 10 12 34 22 0Tata Motors 2,628 2,988 3,410 14 16 15 15 9 140 170 204 ‐1 21 20 20 6HDFC Bank 224 271 334 22 78 77 77 21 102 123 148 20 20 20 20 4Kotak Mahindra Bank 42 51 61 21 71 70 71 21 30 37 44 24 21 20 20 1Bosch 121 115 144 9 16 18 19 19 14 14 19 53 4 38 20 1Larsen & Toubro 595 635 820 17 15 11 11 1 45 48 64 11 8 32 20 2Medium PAT Growth^ 13,867 14,625 16,173 8 21 22 24 15 1,75 1,954 2,313 7 11 18 15 48Axis Bank 142 165 194 17 94 93 94 17 74 87 105 18 19 20 19 3State Bank 748 801 920 11 67 66 68 12 170 193 241 20 14 25 19 6Hind. Unilever 308 345 398 14 17 18 18 20 38 45 53 6 18 19 18 1Tech Mahindra 225 265 307 17 18 17 18 14 26 29 36 1 10 26 18 1Hero MotoCorp 274 297 332 10 11 13 13 18 25 29 35 20 13 22 18 1Lupin 126 146 168 16 27 29 29 19 24 28 33 38 15 21 18 1Power Grid Corp. 172 200 236 17 86 86 86 18 51 57 70 12 13 22 17 2HDFC 80 92 109 17 110 110 111 17 60 70 82 10 16 18 17 2ICICI Bank 190 219 259 17 104 103 102 16 112 130 153 14 16 18 17 4Dr Reddy’ s Labs 148 165 184 11 23 24 25 17 22 26 30 5 15 17 16 1Reliance Inds. 3,291 3,103 3,471 3 10 12 13 20 227 250 299 3 10 20 15 6Coal India 720 766 906 12 21 22 23 17 137 153 180 ‐14 11 17 14 4Hindalco 1,043 1,095 1,181 6 9 9 10 15 28 17 36 9 ‐38 111 14 1TCS 946 1,093 1,265 16 29 29 29 15 217 241 281 13 11 16 14 6GAIL 566 618 639 6 8 9 10 18 30 32 38 ‐32 7 20 13 1NTPC 726 867 893 11 22 23 26 19 90 102 115 ‐9 13 12 13 2ITC 365 402 447 11 37 37 37 11 96 107 122 10 11 13 12 2HCL Technologies 370 424 487 15 24 23 23 12 73 80 91 15 9 13 11 2Infosys 533 590 674 12 28 28 28 12 123 129 151 13 5 16 11 2BPCL 2,424 2,459 2,530 2 4 4 4 8 48 55 59 23 14 7 10 1Wipro 470 514 573 10 22 23 23 11 87 95 105 11 9 11 10 2Low PAT Growth** 2,244 2,281 2,532 6 36 34 33 2 279 240 219 ‐3 ‐14 ‐9 ‐12 ‐5Bharti Airtel 920 991 1,083 8 34 35 35 11 52 63 58 87 21 ‐7 6 1Vedanta 738 741 827 6 30 24 25 ‐3 60 65 63 18 7 ‐2 2 0Idea Cellular 316 362 416 15 34 36 35 16 32 35 21 62 10 ‐39 ‐18 ‐1NMDC 124 71 79 ‐20 63 56 56 ‐24 66 39 41 3 ‐41 5 ‐21 ‐2Cairn India 146 116 127 ‐7 66 55 55 ‐15 70 38 35 ‐44 ‐45 ‐9 ‐29 ‐3Nifty (PAT free float) 26,246 28,158 31,646 10 22 23 24 15 1,43 1,660 2,028 4 16 22 19 100*20%+, ^10‐20%, **<10% Source: Company, MOSL
FY15‐17 estimates: Sensex EPS CAGR at 19%
July 2015
We expect Sensex EPS CAGR of 19% during FY15‐17, significantly higher than the8% CAGR witnessed during FY08‐14.Expect Sensex EPS at 1,561 (up 15%) in FY16 and 1,907 (up 22%) in FY17.
36
India Strategy | Getting on track!
One‐third of the Sensex companies would contribute two‐thirds of FY16 SensexEPS expansion. Key contributors to the expansion would be ONGC, Tata Motors ,

7/24/2015 India Strategy: Getting on track!– Detailed Report
http://www.motilaloswal.com/site/rreports/HTML/635721163512170886/index.htm 39/85
ICICI Bank, HDFC Bank , Tata Steel and Reliance.
Exhibit 90: Sensex EPS: Expect rebound in FY15‐17, with 19% CAGR versus 8% CAGR witnessed during FY08‐15
FY93‐96:45%CAGR
FY96‐03:1% CAGR
FY03‐08:25%CAGR
FY08‐15:8% CAGR
FY15‐17E:19% CAGR
1,907
1,5611,354FY93‐FY15:
14% CAGR
Source: Company, MOSL
FY16 Sensex EPS cut by 3%, driven by global businessesWe cut our Sensex EPS estimate for FY16 by 3% to 1,561 from 1,605 in 4QFY15review and 6% from 1,662 in 4QFY15 preview.
About three‐fourths of the Sensex constituents would see an EPS cut— ledby Tata Steel, Sun Pharma, Hindalco, Tata Motors, Coal India and GAIL.Top upgrade drivers are Maruti, NTPC, ONGC and Bajaj Auto.
One‐third of the Sensex companies would contribute more than two‐thirds ofFY16 Sensex EPS expansion. Key contributors to the EPS expansion would beONGC, Tata Motors, ICICI Bank, HDFC Bank, Tata Steel and Reliance Ind, M&M,Axis Bank, HDFC and SBI.Since Mar‐14, Sensex EPS has been cut by 12.9%—primarily accounting forslower‐than‐expected pace of domestic recovery and delay in the revival ofinvestment cycle. Still, FY16 EPS is likely to grow 15.3%—primarily led by non‐cyclicals and domestic businesses.
Exhibit 92: ... however, FY16 EPS is still likely to post arebound with 15.3% growth
FY16 growth (%)17.5
Cut by220bps
Exhibit 91: FY16 EPS saw 12.9% cut in EPS in one year …
1,793
Cut in FY16 EPS inone year is 12.9%
FY16 EPS (INR)
1,56115.3
4QFY14 1QFY16
Source: Company, MOSL
4QFY14 1QFY16
Source: Company, MOSL
July 2015 37
India Strategy | Getting on track!
Exhibit 93: Non‐cyclicals contribute ~45% to FY16 EPSincrease
FY16 contribution to growth rate (%)
Exhibit 94: Growth to be led by non‐cyclicals and domesticbusinesses
#1 Private Financials
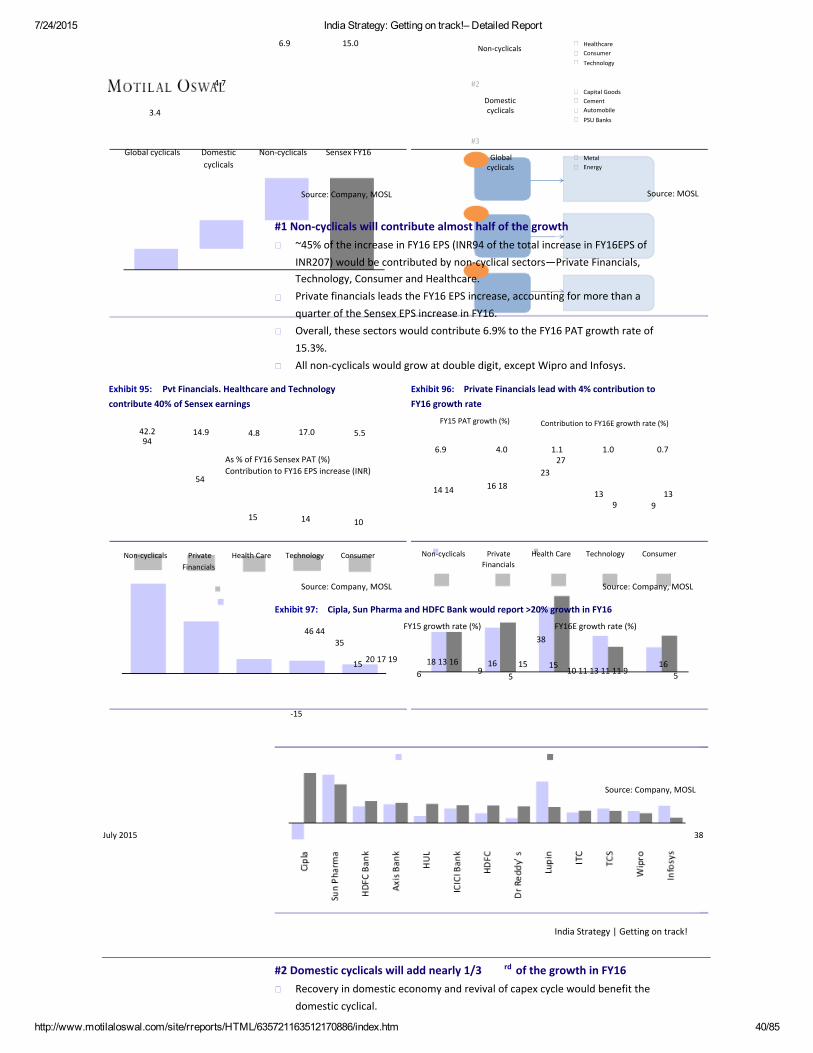
7/24/2015 India Strategy: Getting on track!– Detailed Report
http://www.motilaloswal.com/site/rreports/HTML/635721163512170886/index.htm 40/85
6.9 15.0 Non‐cyclicals HealthcareConsumerTechnology
4.7
3.4
#2
Domesticcyclicals
Capital GoodsCementAutomobilePSU Banks
#3Global cyclicals Domestic
cyclicalsNon‐cyclicals Sensex FY16 Global
cyclicalsMetalEnergy
Source: Company, MOSL Source: MOSL
#1 Non‐cyclicals will contribute almost half of the growth~45% of the increase in FY16 EPS (INR94 of the total increase in FY16EPS ofINR207) would be contributed by non‐cyclical sectors—Private Financials,Technology, Consumer and Healthcare.Private financials leads the FY16 EPS increase, accounting for more than aquarter of the Sensex EPS increase in FY16.Overall, these sectors would contribute 6.9% to the FY16 PAT growth rate of15.3%.All non‐cyclicals would grow at double digit, except Wipro and Infosys.
Exhibit 96: Private Financials lead with 4% contribution toFY16 growth rate
FY15 PAT growth (%) Contribution to FY16E growth rate (%)
Exhibit 95: Pvt Financials. Healthcare and Technologycontribute 40% of Sensex earnings
42.294
14.9 4.8 17.0 5.5
54
As % of FY16 Sensex PAT (%)Contribution to FY16 EPS increase (INR)
6.9 4.0
16 1823
1.127
1.0 0.7
14 14
15 14
Technology
139 9
13
10
Consumer Non‐cyclicals PrivateFinancials
Health Care Technology ConsumerNon‐cyclicals PrivateFinancials
Health Care
Source: Company, MOSL Source: Company, MOSL
Exhibit 97: Cipla, Sun Pharma and HDFC Bank would report >20% growth in FY16
46 44 FY15 growth rate (%)
35
15 20 17 19
618 13 16
916
515
38
1510 11 13 11 11 9
165
FY16E growth rate (%)
‐15
Source: Company, MOSL
July 2015 38
India Strategy | Getting on track!
#2 Domestic cyclicals will add nearly 1/3 rd of the growth in FY16Recovery in domestic economy and revival of capex cycle would benefit thedomestic cyclical.

7/24/2015 India Strategy: Getting on track!– Detailed Report
http://www.motilaloswal.com/site/rreports/HTML/635721163512170886/index.htm 41/85
Auto would be the second d largest contributor to FY16 Sensex EPS increase.Auto, PSU Banks, Capital Goods would contribute ~5% of the FY16 Sensexgrowth rate of 15.3%. Auto would lead with a contribution of 3.3%.All non‐cyclicals would grow at double digit, except L&T.
Exhibit 99: Autos and PSU Banks to drive ~4% of FY16 growthrate
FY15 PAT growth (%) FY16 PAT growth (%)
Contribution to FY16E growth rate (%)
4.7 3.3 0.7 0.63028
23 2014
1
‐2
Domesticcyclicals
Automobiles PSU Banks‐22
Capital Goods
Exhibit 98: Autos is the second largest contributor to FY16Sensex EPS increase
22.2
63
45
12.3 7.0 2.8
As % of FY16 Sensex PAT (%)Contribution to FY16 EPS increase (INR)
10
Domesticcyclicals
Automobiles PSU Banks
9
Capital Goods
Source: Company, MOSL Source: Company, MOSL
Exhibit 100: BHEL, M&M and Maruti are the fastest growing domestic cyclicals in FY1698
5333
FY15 growth rate (%)
49
22 15
‐1
20 14 20 1311 8
FY16E growth rate (%)
‐6
‐34
‐59
BHEL M&M MarutiSuzuki
Bajaj Auto TataMotors
State Bank Hero Motor L&T
Source: Company, MOSL
July 2015 39
India Strategy | Getting on track!
#3 Oil drives contribution of global cyclicals in FY16 growthThe share of global commodities in overall corporate earnings would increase to33% in FY16 from 32% in FY15, primarily led by Oil & Gas.

7/24/2015 India Strategy: Getting on track!– Detailed Report
http://www.motilaloswal.com/site/rreports/HTML/635721163512170886/index.htm 42/85
Oil & Gas would be the third largest contributor to the FY16 earnings growthrate (contributing 2.5%)High growth in Tata Steel and ONGC would be mostly on a lower base of FY15
Exhibit 102: FY16 would see global cyclicals rebounding aftera year of de‐growth in FY15
FY15 PAT growth (%) FY16 PAT growth (%)Contribution to FY16E growth rate (%)
3.0
21
2.528
12
6 7
‐16 ‐17
Oil & Gas Utilties
12
0.5 0.5
Exhibit 101: Oil leads contribution of global cyclicals in FY16Sensex EPS increase; Metals drag
33.3
46
20.3 9.3 3.7
As % of FY16 Sensex PAT (%)Contribution to FY16 EPS increase (INR)
33
‐12
‐18
MetalsGlobal cyclicalsGlobal cyclicals Oil & Gas Utilties Metals
Source: Company, MOSL Source: Company, MOSL
Exhibit 103: Tata Steel and ONGC to post high growth on a low base
623
55
3
‐32
‐92
Tata Steel ONGC RelianceInds.
GAIL Vedanta Hindalco NTPC Coal India
10 7 18
‐15
9
‐9‐38
13
‐14
11
FY15 growth rate (%) FY16E growth rate (%)
‐32
Source: Company, MOSL
July 2015 40
India Strategy | Getting on track!
PROFIT POOL
India Inc PerforMeter
Oil share halves, Technology doubles; Public sector dwarfedProfit Pool analysis FY03‐15: Some interesting trends from the past

7/24/2015 India Strategy: Getting on track!– Detailed Report
http://www.motilaloswal.com/site/rreports/HTML/635721163512170886/index.htm 43/85
CAGR %
FY03‐FY15
FY03‐FY08
FY08‐FY15
FY15‐17E
PAT
16
27
9
20
Sensex
20
39
9
??
We expect a pick‐up in earnings growth for corporate India from the second half of
FY16; this could well be the beginning of the new earnings cycle. While our EPS CAGR
for the next two years is 20%, the earnings cycle has seen higher and longer‐duration
growth.
In Phase‐1 (FY03‐08) of our FY03‐15 analysis, PAT CAGR was 27%; it was only 9%
in Phase‐2 (FY08‐15).
We present some trends to draw from the last 13 years of earnings cycle and pick
where reversion to mean can lead to a change in growth trends.
#1 PUBLIC v/s PRIVATE SECTOR: The ultimate case study of value migration
#2 CYCLICALS: Change in PAT orbit
#3 OIL & GAS: PAT share halves to 17% in the best era of crude prices
#4 FINANCIALS: Private sector cashes in on public banks' slip
#5 CONSUMER: Only a foul‐weather friend? Not quite
Based on the above, we expect some of the following potential themes to play out
going forward:
#1 FY15‐17 PAT GROWTH: Expect acceleration in growth from 2HFY16, CAGR of 20%
over FY15‐17.
#2 PRIVATE BANKS, CONSUMER: Two large profit pools, which can only get bigger and
better (thereby creating several growth opportunities).
#3 OIL & GAS: Reforms can normalize earnings, resulting in significant growth.
#4 CEMENT: Early‐bird cyclical turnarounds?
#5 CAPITAL GOODS: Book‐to‐bill ratio on the rise; govt spending to trigger growth.
Exhibit 104: FY03‐15 India Inc PAT performance: Sector‐wise highlightsSector PAT (INR b) PAT CAGR (%) ROE (%)(No of Companies) FY03 FY08 FY15 FY17E FY03‐15 FY03‐08 FY08‐FY15 FY15‐17E FY03 FY08 FY15 FY17EAuto (11) 21 85 292 492 24 32 19 30 19 26 22 23Capital Goods (12) 15 80 99 174 17 40 3 32 12 25 10 14Cement (14) 7 97 60 146 20 69 ‐7 56 8 30 6 12Consumer (15) 48 75 209 304 13 9 16 21 38 35 33 37Financials (31) 141 341 951 1,395 17 19 16 21 30 14 15 16
Banks‐Private (10) 25 90 376 540 26 30 23 20 18 11 15 17Banks‐PSU (10) 87 192 313 491 11 17 7 25 25 18 10 13NBFC (11) 29 58 263 363 20 15 24 18 48 14 18 19
Healthcare (14) 17 51 169 280 21 25 19 29 25 21 20 22Media (11) 3 5 21 46 18 10 24 47 25 7 14 22Metals (9) 27 303 295 283 22 62 0 ‐2 15 26 10 9Oil & Gas (12) 265 529 638 1,004 8 15 3 25 25 19 10 13Real Estate (10) 1 91 26 47 30 142 ‐16 35 13 30 4 7Retail (3) 0 2 10 15 41 61 28 23 7 24 22 23Technology (11) 39 159 548 692 25 32 19 12 36 32 27 25Telecom (4) ‐4 133 110 129 L to P L to P ‐3 8 ‐3 22 8 8Utilities (10) 67 173 346 457 15 21 10 15 12 14 14 17Others (25) 6 23 62 107 21 29 15 31 15 17 15 20MOSL (192) 653 2,146 3,836 5,569 16 27 9 20 20 20 14 16
MOSL Univ. PAT Share (%)FY03 FY08 FY15 FY17E3 4 8 92 4 3 31 5 2 37 3 5 522 16 25 254 4 10 1013 9 8 94 3 7 73 2 4 50 0 1 14 14 8 540 25 17 180 4 1 10 0 0 06 7 14 12‐1 6 3 210 8 9 81 1 2 2
100 100 100 100Source: Company, MOSL
July 2015 41
India Strategy | Getting on track!
PAT expands 5.9x in 12 years: A tale of two phasesIndia's GDP growth for FY15 may have retraced to FY03 levels, but India Inc'sprofits (significantly represented by the MOSL Universe) expanded 5.9x (at a

7/24/2015 India Strategy: Getting on track!– Detailed Report
http://www.motilaloswal.com/site/rreports/HTML/635721163512170886/index.htm 44/85
CAGR of 16%) over these 12 years. The 12‐year period can be broken down intotwo distinct phases:Phase 1 (FY03‐08): Over these five years, average GDP growth was a robust 7.9%(v/s 5.6% in the preceding five years). As a result, corporate earnings more thantrebled (i.e., a CAGR of 27%).Phase 2 (FY08‐15): Over these seven years, average GDP growth slipped 2ppfrom preceding the five‐year period to 7.1%. Corporate earnings, too, rose only1.8x (i.e., a CAGR of 9%).
Exhibit 106: FY03‐15: Technology share up 8pp, Oil as down20pp
8FY15 over FY03: Change in PAT share (%)
4 4 3 3 2 1 0 0 0 0
‐1 ‐2
‐24
Exhibit 105: FY15 Profit Pool share (%)
25
1714
9 8 85 4 3 3 2 1 1 0
FY15 PAT Shares by Sector (%)
Source: Company, MOSL Source: Company, MOSL
PUBLIC v/s PRIVATE SECTOR The ultimate case study of value migrationYet another key finding of our Profit Pool analysis is the significant value shfit inIndia from the public sector to the private sector. Over FY03‐15, the private sectoremerged larger and superior to the public sector on every key metric:
Absolute PAT levels: Private sector PAT is now 113% higher than the publicsector PAT v/s 40% lower in FY03Profit share: FY15 PAT mix is 68:32 in favor of the private sector, fully reversingthe 62:38 in favor of the public sector in FY03.Dividend payout: In FY10, the private sector convincingly overtook the publicsector in absolute dividends paid out. The gap has only widened since then.Return on Equity: Public sector aggregate RoE is down 11pp over the last 12years v/s only 2pp for the private sector
July 2015 42
India Strategy | Getting on track!
Exhibit 107: Private sector profits—from 40% lower thanpublic the sector in FY03 to 80% higher in FY15
PAT Trend (INR b) Private PSU
Exhibit 108: Profit mix between private and public sector hasexactly reversed in just 12 years
PAT Share (%)
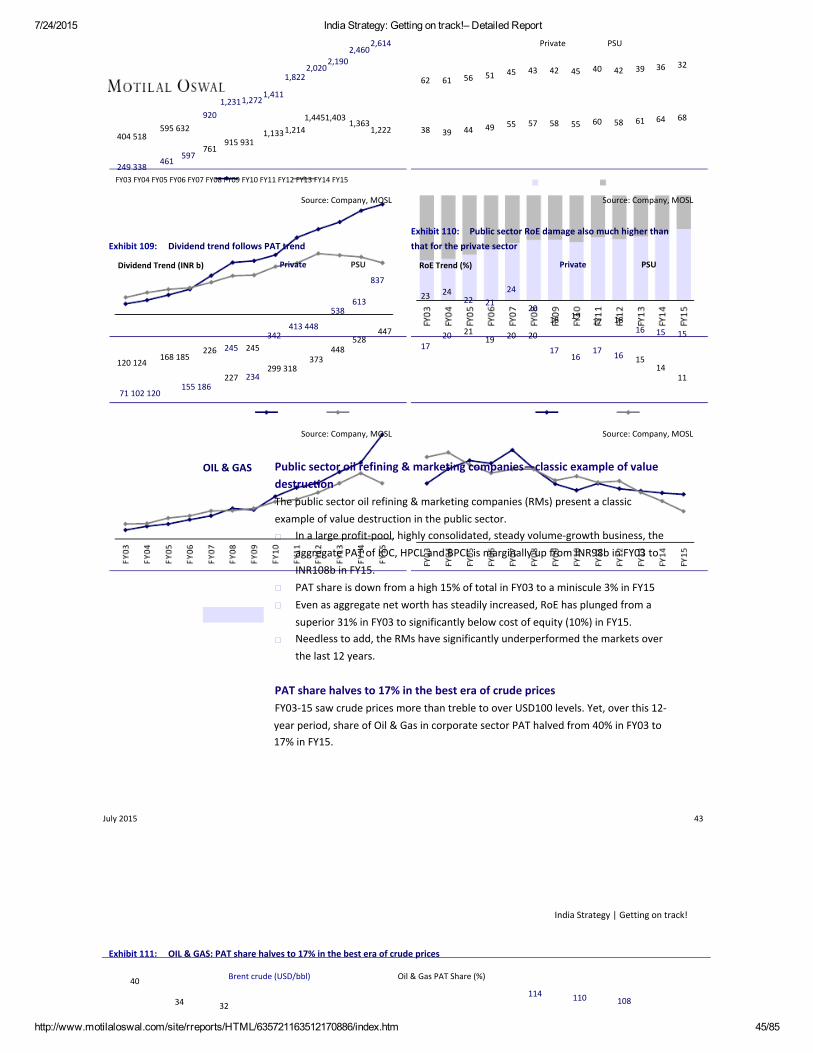
7/24/2015 India Strategy: Getting on track!– Detailed Report
http://www.motilaloswal.com/site/rreports/HTML/635721163512170886/index.htm 45/85
2,6142,460
2,1902,020
1,822
1,4111,2721,231
920595 632
404 518
249 338461
597761
915 931
1,4451,4031,363
1,2221,2141,133
Private
45 43 42 45 40
PSU
42 39 36 32
62 61 56 51
38 39 44 49 55 57 58 55 60 58 61 64 68
FY03 FY04 FY05 FY06 FY07 FY08 FY09 FY10 FY11 FY12 FY13 FY14 FY15
Source: Company, MOSL Source: Company, MOSL
Exhibit 109: Dividend trend follows PAT trend
Dividend Trend (INR b) Private PSU
837
538613
447
Exhibit 110: Public sector RoE damage also much higher thanthat for the private sector
RoE Trend (%)
23 2422
21
2421
19 20
20
20
1716
17 16
18 1917 18
Private PSU
342
120 124226 245 245
168 185
413 448
373448
52817
2016
15
15
14
15
227 234155 186
71 102 120
299 31811
Source: Company, MOSL Source: Company, MOSL
OIL & GAS Public sector oil refining & marketing companies—classic example of valuedestructionThe public sector oil refining & marketing companies (RMs) present a classicexample of value destruction in the public sector.
In a large profit‐pool, highly consolidated, steady volume‐growth business, theaggregate PAT of IOC, HPCL and BPCL is marginally up from INR98b in FY03 toINR108b in FY15.PAT share is down from a high 15% of total in FY03 to a miniscule 3% in FY15Even as aggregate net worth has steadily increased, RoE has plunged from asuperior 31% in FY03 to significantly below cost of equity (10%) in FY15.Needless to add, the RMs have significantly underperformed the markets overthe last 12 years.
PAT share halves to 17% in the best era of crude pricesFY03‐15 saw crude prices more than treble to over USD100 levels. Yet, over this 12‐year period, share of Oil & Gas in corporate sector PAT halved from 40% in FY03 to17% in FY15.
July 2015 43
India Strategy | Getting on track!
Exhibit 111: OIL & GAS: PAT share halves to 17% in the best era of crude prices
40
34
Brent crude (USD/bbl)
32
Oil & Gas PAT Share (%)
114 110 108
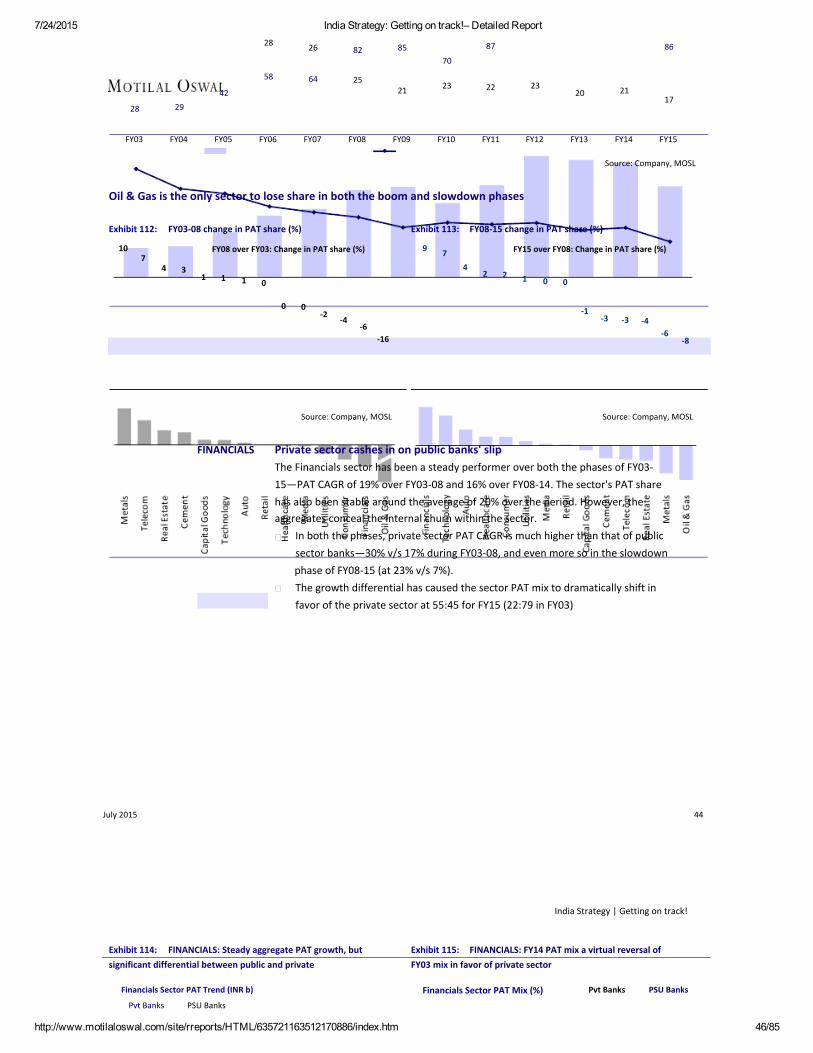
7/24/2015 India Strategy: Getting on track!– Detailed Report
http://www.motilaloswal.com/site/rreports/HTML/635721163512170886/index.htm 46/85
28
58
42
28
FY03
29
FY04 FY05 FY06 FY07 FY08 FY09 FY10 FY11 FY12 FY13 FY14
26
64
82
25
8570
21 23 22 2320 21
87 86
17
FY15
Source: Company, MOSL
Oil & Gas is the only sector to lose share in both the boom and slowdown phases
Exhibit 112: FY03‐08 change in PAT share (%)
107
FY08 over FY03: Change in PAT share (%)
4 31 1 1 0
0 0‐2
‐4
Exhibit 113: FY08‐15 change in PAT share (%)
9 74
2 2
FY15 over FY08: Change in PAT share (%)
1 0 0
‐1
‐6‐16
‐3 ‐3 ‐4‐6
‐8
Source: Company, MOSL Source: Company, MOSL
FINANCIALS Private sector cashes in on public banks' slipThe Financials sector has been a steady performer over both the phases of FY03‐15—PAT CAGR of 19% over FY03‐08 and 16% over FY08‐14. The sector's PAT sharehas also been stable around the average of 20% over the period. However, theaggregates conceal the internal churn within the sector.
In both the phases, private sector PAT CAGR is much higher than that of publicsector banks—30% v/s 17% during FY03‐08, and even more so in the slowdownphase of FY08‐15 (at 23% v/s 7%).The growth differential has caused the sector PAT mix to dramatically shift infavor of the private sector at 55:45 for FY15 (22:79 in FY03)
July 2015 44
India Strategy | Getting on track!
Exhibit 114: FINANCIALS: Steady aggregate PAT growth, butsignificant differential between public and private
Financials Sector PAT Trend (INR b)
Pvt Banks PSU Banks
Exhibit 115: FINANCIALS: FY14 PAT mix a virtual reversal ofFY03 mix in favor of private sector
Financials Sector PAT Mix (%) Pvt Banks PSU Banks

7/24/2015 India Strategy: Getting on track!– Detailed Report
http://www.motilaloswal.com/site/rreports/HTML/635721163512170886/index.htm 47/85
313 75 69 68 68 72 69 64 63 5948 45
87 114 103 112 13634 34 50 63 9025
192 251 376273 327215
99 128 169
278306
371390 303 78 77
22 23 25 31 32 32 28 31 36 37 4152 55
Source: Company, MOSL Source: Company, MOSL
CONSUMER Only a foul‐weather friend? Not quiteConsumer sector has underperformed, with FY03‐15 PAT CAGR of only 13% v/s16% for the MOSL Universe. Further, FY03‐08 PAT CAGR was only 9% v/s 27%for the MOSL Universe. It was only during FY08‐15 that Consumer PAT CAGR(16% was) beat the MOSL Universe (9%).Also, every Consumer company's PAT CAGR during this phase was higher than9%. Prima facie, this seems to suggest that Consumer is primarily a foul‐weatherfriend (i.e., it outperforms only during periods of slowdown).
Exhibit 116: ITC and HUL have underperformed the Universe earnings over the past 12 years
31
21 21 20 19
Consumer: FY03‐15 PAT CAGR (%)
17 17 17 16 15MOSL Universe PAT CAGR: 16%
13Consumer FY03‐15 PAT CAGR: 13%
12 127
Profit toLoss
Source: Company, MOSL
July 2015 45
India Strategy | Getting on track!
Based on the above, we expect some of the following potentialthemes to play out going forward
OIL & GAS Reforms can normalize earnings, resulting in significant growth
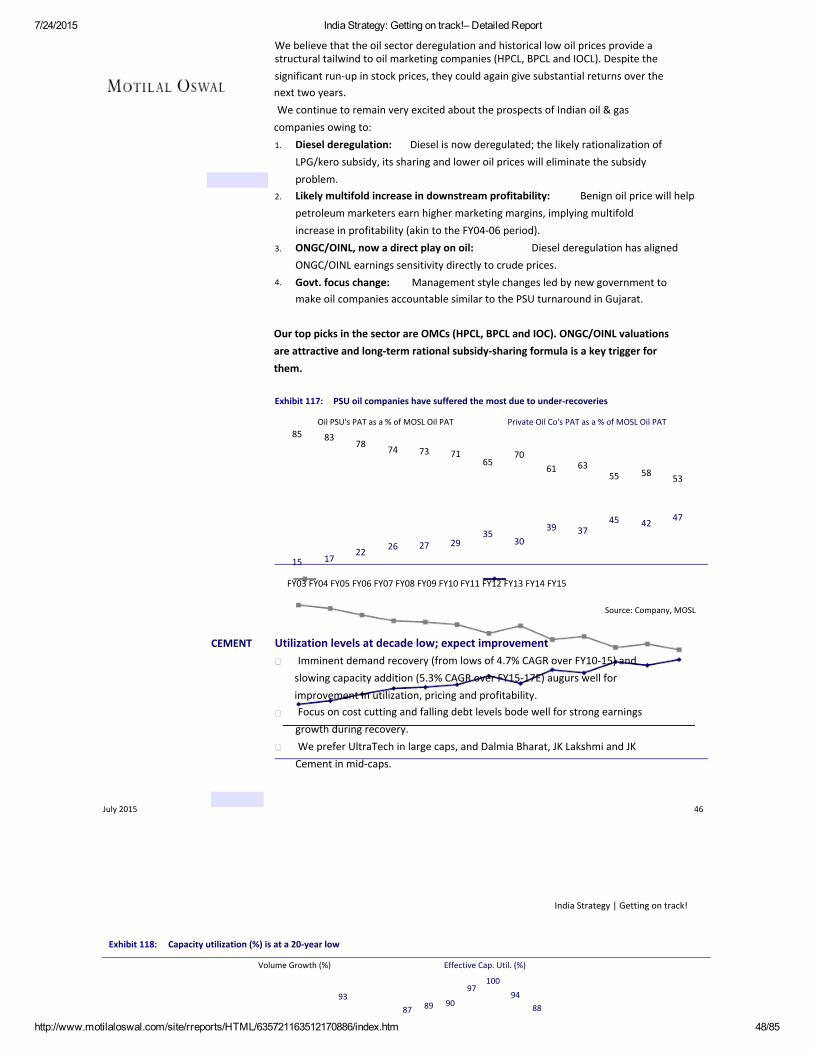
7/24/2015 India Strategy: Getting on track!– Detailed Report
http://www.motilaloswal.com/site/rreports/HTML/635721163512170886/index.htm 48/85
We believe that the oil sector deregulation and historical low oil prices provide astructural tailwind to oil marketing companies (HPCL, BPCL and IOCL). Despite thesignificant run‐up in stock prices, they could again give substantial returns over thenext two years.We continue to remain very excited about the prospects of Indian oil & gascompanies owing to:1. Diesel deregulation: Diesel is now deregulated; the likely rationalization of
LPG/kero subsidy, its sharing and lower oil prices will eliminate the subsidyproblem.
2. Likely multifold increase in downstream profitability: Benign oil price will helppetroleum marketers earn higher marketing margins, implying multifoldincrease in profitability (akin to the FY04‐06 period).
3. ONGC/OINL, now a direct play on oil: Diesel deregulation has alignedONGC/OINL earnings sensitivity directly to crude prices.
4. Govt. focus change: Management style changes led by new government tomake oil companies accountable similar to the PSU turnaround in Gujarat.
Our top picks in the sector are OMCs (HPCL, BPCL and IOC). ONGC/OINL valuationsare attractive and long‐term rational subsidy‐sharing formula is a key trigger forthem.
Exhibit 117: PSU oil companies have suffered the most due to under‐recoveries
85Oil PSU's PAT as a % of MOSL Oil PAT Private Oil Co's PAT as a % of MOSL Oil PAT
8378 74 73 71
6570
61 6355 58 53
47
15 1722 26 27 29
3539
3037
45 42
FY03 FY04 FY05 FY06 FY07 FY08 FY09 FY10 FY11 FY12 FY13 FY14 FY15
Source: Company, MOSL
CEMENT Utilization levels at decade low; expect improvementImminent demand recovery (from lows of 4.7% CAGR over FY10‐15) andslowing capacity addition (5.3% CAGR over FY15‐17E) augurs well forimprovement in utilization, pricing and profitability.Focus on cost cutting and falling debt levels bode well for strong earningsgrowth during recovery.We prefer UltraTech in large caps, and Dalmia Bharat, JK Lakshmi and JKCement in mid‐caps.
July 2015 46
India Strategy | Getting on track!
Exhibit 118: Capacity utilization (%) is at a 20‐year low
Volume Growth (%)
9387
Effective Cap. Util. (%)
97
89 90
10094
88

7/24/2015 India Strategy: Getting on track!– Detailed Report
http://www.motilaloswal.com/site/rreports/HTML/635721163512170886/index.htm 49/85
76 7882 82 85 84 81 80 85 86 86 82 84
75 74 7371 70 6915
7
10 0 7 8 11 8 10 7
‐1
10 8 5 7 13 9 8 8 10 5 7 6 1 5 5
Source: Company, MOSL
CAPITAL GOODS Book‐to‐bill ratio on the rise; government spending to trigger growth?PAT share of Capital Goods sector has declined from the peak of 4.7‐4.8% to2.6%, impacted by a complete collapse in the investment climate post FY11.Economic activity has gathered some pace, and the improvement in businessconfidence has created congenial conditions for restarting the investment cycle.Policy initiatives in land acquisition as well as efforts underway to i) unlockmining, ii) increase FDI limits, iii) expediting approvals and iv) supportivemonetary conditions should create a conducive setting for industrial revival inthe medium term.BTB for the capital goods companies have also increased, largely led by powerBTG and infrastructure segments; industrial capex continues to be impacted. Weexpect robust earnings CAGR till FY17, supported by improved execution andoperating leverage, and thus expect PAT share to increase to ~3.1% in FY17 (butstill meaningfully below the peak of 4.8%).
Exhibit 120: BTB at its peak in FY15, led by L&T's robust orderbook of INR2.1t
BTB Ratio (x)
2.12.3
2.52.8 2.8
2.3 2.2 2.3
2.9
Exhibit 119: PAT share drops to 2.6% in FY15
Capital Goods PAT (INR b)
Capital Goods PAT share (%)
4.5 4.8 4.7 4.6 4.23.6 4.0 3.7 2.9 2.6 2.8 3.12.3 2.6 2.61.4 1.2 1.5
1.2 1.2 1.3 1.41.6
1.9 1.8 1.8
15 22 27 45 67 80 100 122 142 158 150 109 99 128 174
Source: Company, MOSL Source: Company, MOSL
July 2015 47
India Strategy | Getting on track!
Two problem sectors for the government to work onFinancials and Utilities
#1 FINANCIALS: PSU banks stuck in asset quality logjam

7/24/2015 India Strategy: Getting on track!– Detailed Report
http://www.motilaloswal.com/site/rreports/HTML/635721163512170886/index.htm 50/85
Credit growth for the Indian banking system has declined to an 18‐year low of9.5%. Incremental credit‐to‐GDP ratio (4.3%) has almost halved since FY11, ledby (a) continued weakness in economic environment, (b) asset quality stress incapex‐intensive sectors, and (c) capital constraints at state‐owned banks.Sensitive sectors like Infra, Metals and Textiles account for just 23% of theBanking sector’s advances; however, these sectors account for 50%+ of thestress assets and 65%+ of the total capex in the economy. Higher stress in thesecapex‐intensive sectors is leading to a slowdown in aggregate demand.Total stressed assets of the banking system have quadrupled since 2008 (CAGRof 41% in absolute terms), with PSU Banks (~70% of banking system) accountingfor 90%+. Absense of permanent management in MD & CEO positions ishampering decision‐making abilities.Most state‐owned banks are currently in capital conservation mode to meet thesteep Basel III capital requirements. As per our estimates, equity capitalrequirements for the system is ~INR1.3t. The government’s plan to infuseUSD3b/6b in FY16/17, in our view, would be sufficient only to meet theminimum requirements. Additionally, dismal valuations would make it difficultfor these banks to raise capital from markets.
Credit growth near an 18‐year low
Exhibit 121: Incremental credit‐to‐GDP ratio remains a key monitorable ‐ ~50% of the incremental credit in FY15 was towardnon‐corporate sectors
Incr. credit/GDP ratio hasdeclined to a 10 year low
6.3 6.3 5.8 5.7 6.3
Incr. Credit to GDP (%)
8.2
4.5
8.79.5
GDP Growth (3YMA, RHS %)
8.5 8.2 8.1 8.16.8
6.1 6.1
4.2
FY00
3.5
FY01
2.6
FY02
6.2
FY03
4.2
FY04
7.0
FY05
11.2
FY06
9.9
FY07
8.6
FY08
7.3
FY09
7.2
FY10
9.0
FY11
7.4
FY12
6.4
FY13
6.5
FY14
4.3
FY15
Source: Company, MOSL
July 2015 48
India Strategy | Getting on track!
Exhibit 122: Share of the industry in incremental loan growth Exhibit 123: Within the industry, bulk of the growth washas declined to a nine‐year low of 30% (incremental growth driven by Infra segment (15% of loans)—demand frommix %) manufacturing remained tepid (% growth)
Industry Agri Services Retail Industry loans growth

7/24/2015 India Strategy: Getting on track!– Detailed Report
http://www.motilaloswal.com/site/rreports/HTML/635721163512170886/index.htm 51/85
27
32
14
27
Mar‐06
25%CAGR
618
18
18
19
13
20%CAGR
49
28.4
34
15
21
11% CAGR 30
Mar‐15
Source: Company, MOSL
25.7 26.120.9
24.4 23.6
19.515.1
12.3
5.7
58
Mar‐10 Mar‐12
Source: Company, MOSL
Stress in capex‐intensive sectors holding back growth
Exhibit 124:
Infra, Metals and Textiles account for just23% of the Banking sector’s advances (%)
Mining
However, they account for ~50% ofthestressed loans
Mining10
7
49
30
2
Iron & Steel
Textiles
Infrastructure
Aviation
Others
And 65%+ of capex…Stress in thesesectors is slowing down demand for loans
Infra
15 3
15
1
75
Iron & Steel
Textiles
Infrastructure
Aviation
Others
1
35 38Textiles
Iron & Steel(metals)
16 11 Others
Source: Company, MOSL
Exhibit 125: 4x increase in stressed asset book of the banking Exhibit 126: ….With PSU Banks accounting for 90%+ of thesystem stressed assets
Gross NPA (%) Restructured loans (%) Stressed assets
90
6.5
5.0
9.57.4
1.42.4 2.3
2.83.3 77
9 141% CAGR
in absolute terms
11
Deposits
19 4
5.2 0.3 4.63.5 2.6 3.4 3.82.4 2.4 2.5 2.4 2.9
58
PSU Banks
Source: Company, MOSL
Networth
27
Private Banks Others
Source: Company, MOSL
15
July 2015 49
India Strategy | Getting on track!
Nationalized banks losing ground…Very quickly
Exhibit 127: PSU banks have maintained loans MS with focuson corporate loans, while private banks continue to focus on
retail (Loans MS %)
Exhibit 128: Private banks focused on building granularliabilities profile, resulting in almost doubling of saving
account market share over the last decade (SAMS %)

7/24/2015 India Strategy: Getting on track!– Detailed Report
http://www.motilaloswal.com/site/rreports/HTML/635721163512170886/index.htm 52/85
Nationalized BanksPrivate Banks
666 71921 21 21
25 24 24 25
SBI GroupForeign Banks
445519 19 19 20
23 23 23 23
Nationalized BanksPrivate Banks
33 3 414 14 16 16
28 27 28 29
SBI GroupForeign Banks
223317 18 19 19
30 30 30 30
220
30
719
25
518
25
421
23
311
28
317
30
49 48 48 49 51 53 54 54 53 53 51 57 55 55 53 51 50 50 50 49 49 48
2005 2006 2007 2008 2009 2010 2011 2012 2013 2014 2015
Source: Company, MOSL
2005 2006 2007 2008 2009 2010 2011 2012 2013 2014 2015
Source: Company, MOSL
Exhibit 129: Prudent underwriting policies and improvingliabilities profile led to a sharp increase in profit market share(PAT MS %) Exhibit 130: Vacancy in leadership is adding to the woes!
Nationalized BanksPrivate Banks
917
27
12
20
24
43
15
21
21
44
15
22
21
41
14
21
23
43
8
23
22
47
11
25
17
47
SBI GroupForeign Banks
12
28
19
42
13
32
20
36
13
42
17
29
12
46
17
24
WithPermanentMD & CEO
WithtemporaryMD & CEO
47
2005 2006 2007 2008 2009 2010 2011 2012 2013 2014 2015
Source: Company, MOSL Source: Company, MOSL
Capital requirements restricting growthEquity capital requirement of the top 11 PSU banks (accounting for ~75% of PSUbank assets) is about INR900b by FY19; we estimate the equity capital requirementfor the system to be ~INR1.3t.
July 2015 50
India Strategy | Getting on track!
Exhibit 131: Capital requirement (INR b)
Bank CET1 % Equity capital required by (CET1 of 9%: 1% above minimum req.)
FY16
SBIN 9.3PNB 8.7BOB 9.8
010
FY17
0480
FY18
0738
FY19
010331
FY16
596718
AT1 Bonds required by (1.5%)
FY17
1577868
FY18 FY19
173 19791 10791 107

7/24/2015 India Strategy: Getting on track!– Detailed Report
http://www.motilaloswal.com/site/rreports/HTML/635721163512170886/index.htm 53/85
BOI 7.2
CBK 7.4UNBK 7.2OBC 8.1INBK 10.6ANDB 7.5ALBK 7.6CRPBK 7.3Top 11 Banks total
67
5338110151521220
124
10669320313136478
159
14589460414148651
199
191114631535362871
61
5743270212624401
71
67503112243027617
84 98
79 9258 6837 4321 3229 3335 4132 38730 855
Source: Company, MOSL
Exhibit 132: Government plans to infuse USD3b/6b in FY16/17; we believe this would be sufficient only to meet the minimumrequirements. Raising AT1 Bonds remains an uphill task
~INR200b by GoI in FY16
Total Capitalneeded by FY19
Equity INR1.3t
Private BanksINR200b
PSU Banks INR1.1t
~INR400b by GoI in FY17
Remaining amount through futureinfusion by GoI or public issuances
INR2.7t
AT1 Bonds
Source: Company, MOSL
PSU bank valuations near multi‐year low
Exhibit 133: Over the last four years, the P/BV discount has increased from 36% to ~68%—led by a sharp upgrade in privatebanks’ multiples (2.9x now v/s 2.2x earlier)
4.0
3.0
2.0
1.0
0.0
PSU Banks PBV (x)
Valuationdifferential
Private Banks PBV (x)PSU Banks trading at 68% discountto Private Banks – a 12 year low
Source: Company, MOSL
July 2015 51
India Strategy | Getting on track!
Exhibit 134: We expect gradual increase in PSU banks’ multiples over the next three years, led by: (a) Pickup in economicgrowth allaying concerns over asset quality, (b) government reforms and measures to resolve stuck projects, (c) phasedimplementation of Nayak Committee report to improve corporate governance
10081
PSU Banks PBV discount (%) 70
60 57
SBI discount to Private Banks (%)58 62
Average discount
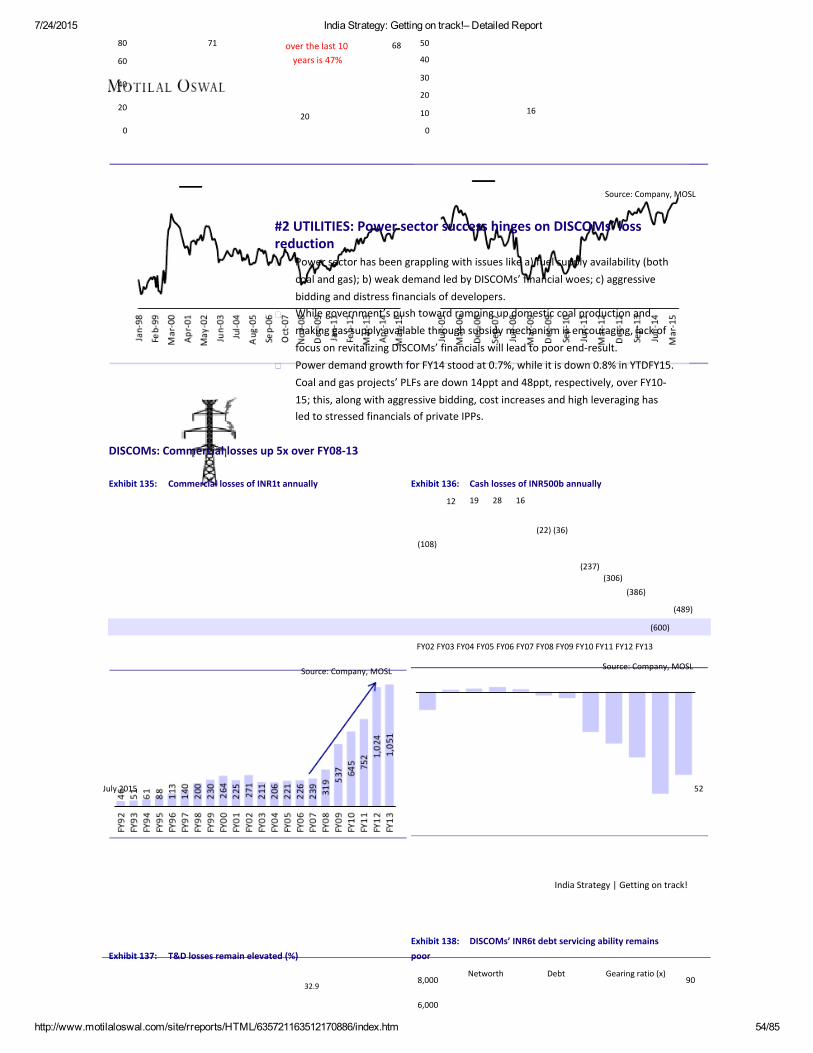
7/24/2015 India Strategy: Getting on track!– Detailed Report
http://www.motilaloswal.com/site/rreports/HTML/635721163512170886/index.htm 54/85
80
60
40
20
020
71 68 50
40
30
20
10
0
16
over the last 10years is 47%
Source: Company, MOSL
#2 UTILITIES: Power sector success hinges on DISCOMs’ lossreduction
Power sector has been grappling with issues like a) fuel supply availability (bothcoal and gas); b) weak demand led by DISCOMs’ financial woes; c) aggressivebidding and distress financials of developers.While government’s push toward ramping up domestic coal production andmaking gas supply available through subsidy mechanism is encouraging, lack offocus on revitalizing DISCOMs’ financials will lead to poor end‐result.Power demand growth for FY14 stood at 0.7%, while it is down 0.8% in YTDFY15.Coal and gas projects’ PLFs are down 14ppt and 48ppt, respectively, over FY10‐15; this, along with aggressive bidding, cost increases and high leveraging hasled to stressed financials of private IPPs.
DISCOMs: Commercial losses up 5x over FY08‐13
Exhibit 135: Commercial losses of INR1t annually Exhibit 136: Cash losses of INR500b annually
12 19 28 16
(22) (36)(108)
(237)(306)
(386)
(489)
(600)
FY02 FY03 FY04 FY05 FY06 FY07 FY08 FY09 FY10 FY11 FY12 FY13
Source: Company, MOSL Source: Company, MOSL
July 2015 52
India Strategy | Getting on track!
Exhibit 137: T&D losses remain elevated (%)
32.9
Exhibit 138: DISCOMs’ INR6t debt servicing ability remainspoor
8,000
6,000
Networth Debt Gearing ratio (x)90

7/24/2015 India Strategy: Getting on track!– Detailed Report
http://www.motilaloswal.com/site/rreports/HTML/635721163512170886/index.htm 55/85
23.3
17.5
25.3842224723.654,000
302,000
0
‐2,000FY06 FY07 FY08 FY09 FY10 FY11 FY12 FY13
0
‐30
Source: Company, MOSL
6021.1
Source: Company, MOSL
Key macro indicator in shambles
Exhibit 139: Power demand on three‐year rolling CAGR basisis trending down (%)
10.79.8
9.3
6.5
6.3
7.7
9.08.8
8.2 6.87.2
6.5
8.58.6
6.1
5.15.4 4.4
3.34.2
7.3
Exhibit 140: Deficit near all‐time low, partly aided byimproved supply (%)
7.7
7.16.3
5.0
6.4
6.2 5.15.3
4.5
7.9%
7.5%7.0%
10.1%
8.9% 8.7%8.5%7.5%5.0% 8.5%
4.2%6.7%6.3%4.3% 3.6%
6.4
4.6
Source: Company, MOSL Source: Company, MOSL
Exhibit 141: Coal project PLF down 14ppt over FY10‐15 Exhibit 142: Gas project PLF down 48ppt over FY10‐15
Source: Company, MOSL Source: Company, MOSL
July 2015 53
India Strategy | Getting on track!
Exhibit 143: IPPs face high losses, gearing
Company Name
Adani Power
GMR Infra
GVK Power
Consolidated PAT (INR b)
FY13 FY14 FY15
‐23
‐3
‐3
‐3
‐4
‐4
‐8
‐27
‐8
Consolidated DER (x)
FY14 FY15
6.1
4.5
7.9
7.2
6.1
11.5

7/24/2015 India Strategy: Getting on track!– Detailed Report
http://www.motilaloswal.com/site/rreports/HTML/635721163512170886/index.htm 56/85
Jaiprakash PowerKSK Energy
Lanco Infratech
RattanIndia Power
Tata Power
42
‐11
‐1
‐1
0‐2
‐23
‐1
‐3
2‐3
‐20
‐7
2
3.94.5
23.9
1.9
2.8
4.25.6
‐84.1
2.1
2.6
Source: Company, MOSL
Exhibit 144: Power sector exposure high at 10% of financial for the financial sector
Power sector Power sector exposure (%)
FY98 FY99 FY00 FY01 FY02 FY03 FY04 FY05 FY06 FY07 FY08 FY09 FY10 FY11 FY12 FY13 FY14 FY15
Source: Company, MOSL
July 2015 54
India Strategy | Getting on track!
ECONOMY A strong macro at early stage of recovery to createa virtuous investment cycleRevenue buoyancy on growth to accelerate fiscal correction
Tax‐GDP ratio increased by around 400bp in the previous upcycle between FY02 to

7/24/2015 India Strategy: Getting on track!– Detailed Report
http://www.motilaloswal.com/site/rreports/HTML/635721163512170886/index.htm 57/85
FY08. The current phase of fiscal consolidation is being achieved on the back ofexpenditure compression and increased tax effort. However, a repeat of tax buoyancyseen in the previous upcycle would allow accelerated reduction in fiscal deficit to aslow as 2% by FY20.Higher revenue, besides fiscal correction, would allow a jump in governmentexpenditure. Together with an expenditure switch towards capex spend away fromsubsidy this would act as a big booster to investments in general.While many private infrastructure companies came up in the previous cycle ploughingsizable investments in the economy; the winners of the current cycle are likely to be
those well positioned to benefit from the direction of the economy that thegovernment is seeking to give in the next five years.The fiscal discipline and macro stability should bring in its wake a revision in the ratingof India several notches higher than the current investment grade, particularly whenthe criteria laid out by S&P in its Sep‐14 rating outlook upgrade have all been satisfiedby a comfortable margin and countries with comparable macro parameters and credithistory enjoy much higher ratings.On the inflation front, government has taken a multitude of measures to ensure thatthe backbone of food inflation is broken through a series of intervention aimed atcurbing prices, providing subsidy and other forms of support, improved co‐ordinationwith the states and smoothing the supply chain to ensure higher food availability.Other drivers of inflation viz., global commodity and food prices, rural wage andpressure points on inflation in the nature of premium food have all eased.The structural decline in inflation can take the interest rate and bond yield to a leveleven lower than the low point of previous cycle particularly when net marketborrowing by the government is slated to decline in absolute terms releasing a gooddeal of financial savings to be channelized into other forms of investments.After the bouts of volatility during late 2013, INR has returned to stability to emerge
as one of the best performing among the major currencies barring the dollar peggedones. The external stability parameters have also strengthened on the back ofincreased capital flows.Greenshoots of a capex recovery on the back of higher public spend towardsinfrastructure are visible already with CMIE capex data, recovery of IIP capital goodsand sectors facing the focus areas of the government showing an uptrend. However,the biggest silver lining comes from a marked improvement in credit quality and somedecline in the indebtedness of infra companies that makes them lendable again. Withinterest rate cycle headed south and selective push from the government this indeedis a more surefooted recipe for investment recovery.
Rise in tax‐to‐GDP ratio a key catalystThe current phase of fiscal correction has been achieved on the back ofexpenditure compression, particularly towards the end of the year, and one‐offrevenue flows – spectrum auction and disinvestment.The 350bp correction in fiscal deficit (as percentage of GDP) over FY02‐FY08 washowever, achieved on the back of sharp rise in revenue buoyancy (~400bp risein gross tax to GDP ratio), as corporate profit surged during the upturn.Fiscal stimulus during the post crisis phase had taken the shape of both taxconcessions and expenditure spike. This swelled the deficit back by 400bp.
55July 2015
India Strategy | Getting on track!
Subsequently, while revenue was steadied through higher tax effort, deficitreduction was mainly achieved through expenditure reduction.As growth and corporate profitability returns, there would be a surge in taxcollection. A 400bp rise in tax‐to‐GDP in the coming cycle would pave the wayfor an accelerated decline in deficit to just 2% by 2020.
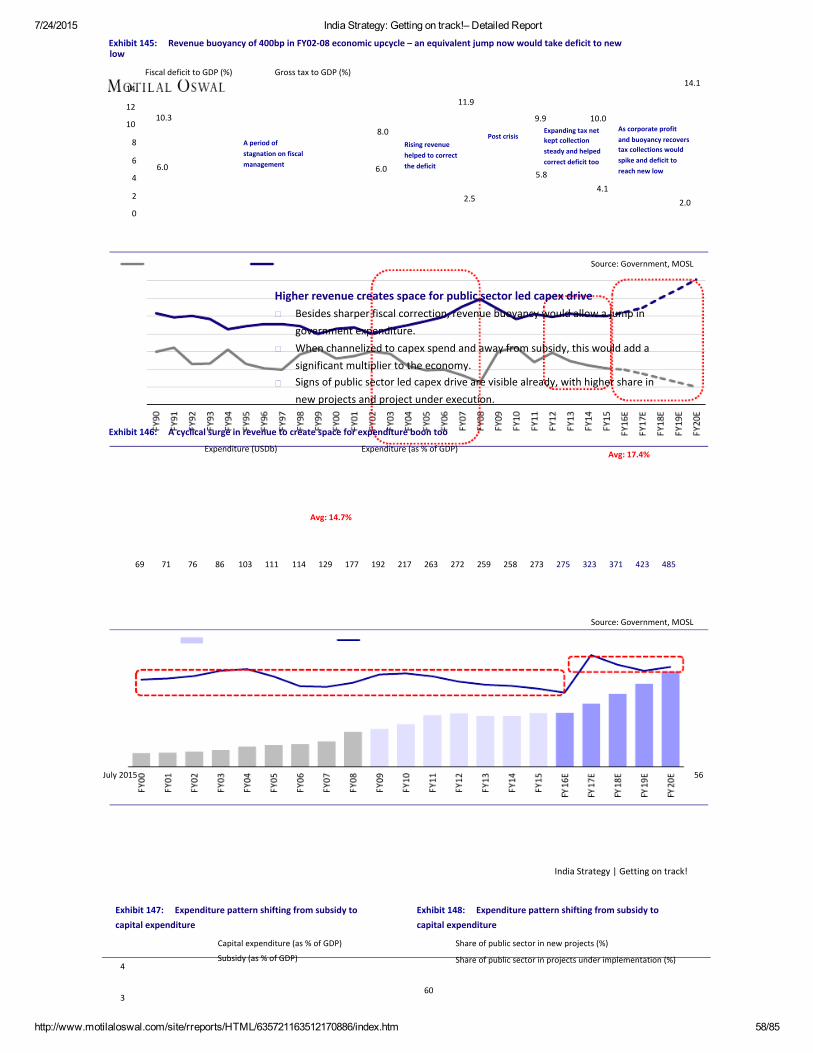
7/24/2015 India Strategy: Getting on track!– Detailed Report
http://www.motilaloswal.com/site/rreports/HTML/635721163512170886/index.htm 58/85
Exhibit 145: Revenue buoyancy of 400bp in FY02‐08 economic upcycle – an equivalent jump now would take deficit to newlow
Fiscal deficit to GDP (%)
14
12
10
8
6
4
2
0
6.0
11.9
10.3
A period ofstagnation on fiscalmanagement
Gross tax to GDP (%)14.1
9.98.0
6.0
Rising revenuehelped to correctthe deficit
Post crisis
10.0Expanding tax netkept collectionsteady and helpedcorrect deficit too
5.84.1
As corporate profitand buoyancy recoverstax collections wouldspike and deficit toreach new low
2.5 2.0
Source: Government, MOSL
Higher revenue creates space for public sector led capex driveBesides sharper fiscal correction, revenue buoyancy would allow a jump ingovernment expenditure.When channelized to capex spend and away from subsidy, this would add asignificant multiplier to the economy.Signs of public sector led capex drive are visible already, with higher share innew projects and project under execution.
Exhibit 146: A cyclical surge in revenue to create space for expenditure boon too
Expenditure (USDb) Expenditure (as % of GDP)Avg: 17.4%
Avg: 14.7%
69 71 76 86 103 111 114 129 177 192 217 263 272 259 258 273 275 323 371 423 485
Source: Government, MOSL
July 2015 56
India Strategy | Getting on track!
Exhibit 147: Expenditure pattern shifting from subsidy tocapital expenditure
Capital expenditure (as % of GDP)
4
3
Subsidy (as % of GDP)
60
Exhibit 148: Expenditure pattern shifting from subsidy tocapital expenditure
Share of public sector in new projects (%)
Share of public sector in projects under implementation (%)

7/24/2015 India Strategy: Getting on track!– Detailed Report
http://www.motilaloswal.com/site/rreports/HTML/635721163512170886/index.htm 59/85
2
1
40
20
Source: Government, MOSL Source: Government, MOSL
Public spending to drive investment cycle in this roundInfra players, particularly in the private sector, performed remarkably well in thelast cycle.The capex drivers in the coming upcycle would be players in greater alignmentto the selective push the government is providing in the areas of rail, defense,power, roads and urbanization.
Exhibit 149: Rise in capex spend in the last decade
Capex drivers (no. of times increase in grossblock, addition during FY04 to FY14)
Reliance (5x, USD46b)
JPA (11x, USD12b)
GMR (13x, USD9b)
Adani (67x, USD9b)
JSW (10x, USD9b)
Rel Power (31x, USD8b)
Lanco (10x, USD7b)
GVK (11x, USD4b)
Source: Government, MOSLNote: Increase in gross block includes CWIP and calculated during the period FY04‐FY14. However, forcalculation of no. of times above, the initial period is reckoned as the year when they gained aminimum size and differs for a few companies – GMR (FY05), GVK and Coal India (FY06), Adani andLanco (FY07), Reliance Power (FY08).
Capex by PSUs (no. of times increase in grossblock, addition during FY04 to FY14)
ONGC (3x, USD27b)
NTPC (3x, USD20b)
Powergrid (5x, USD19b)
SAIL (2x, USD8b)
HPCL (4x, USD8b)
Coal India (1x, USD7b)
July 2015 57
India Strategy | Getting on track!
Exhibit 150: Government would be a significant catalyst for coming capex cycle
ManoharParikkar
Suresh PrabhuMinister of Railways
(USD94b) Piyush Goyal
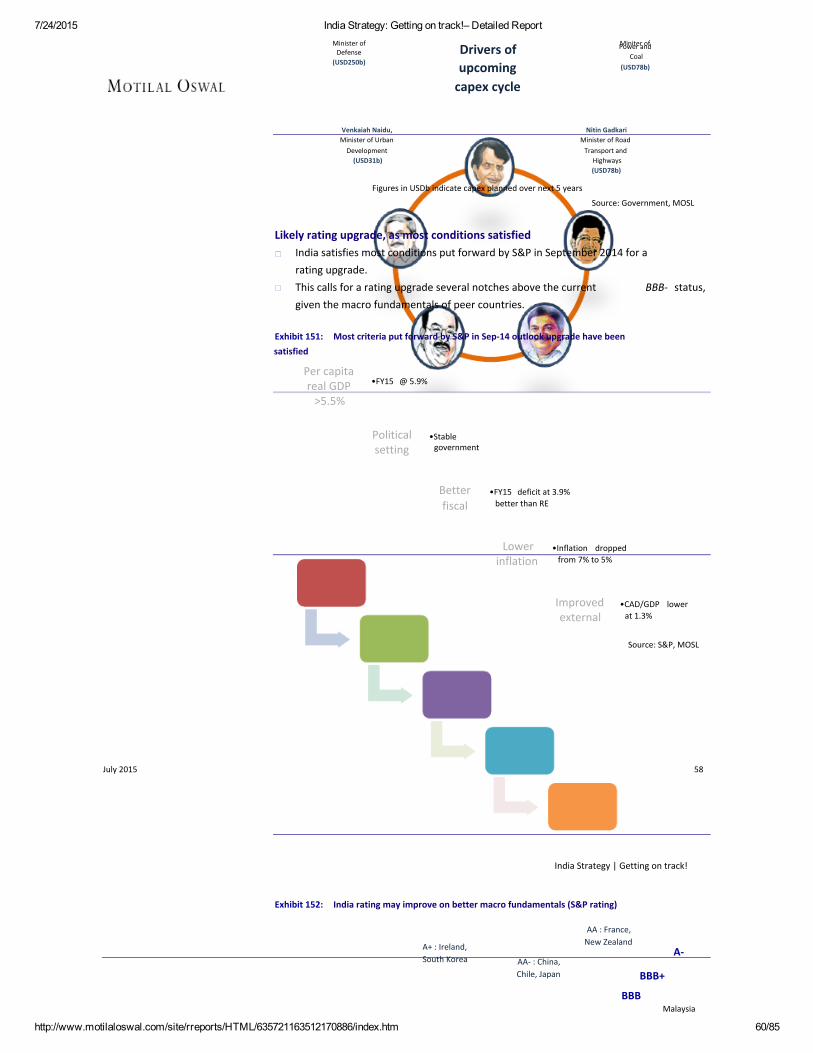
7/24/2015 India Strategy: Getting on track!– Detailed Report
http://www.motilaloswal.com/site/rreports/HTML/635721163512170886/index.htm 60/85
Minister ofDefense
(USD250b)Drivers ofupcomingcapex cycle
Miniter ofPower andCoal
(USD78b)
Venkaiah Naidu,Minister of UrbanDevelopment(USD31b)
Nitin GadkariMinister of RoadTransport and
Highways(USD78b)
Figures in USDb indicate capex planned over next 5 years
Source: Government, MOSL
Likely rating upgrade, as most conditions satisfiedIndia satisfies most conditions put forward by S&P in September 2014 for arating upgrade.This calls for a rating upgrade several notches above the current BBB‐ status,given the macro fundamentals of peer countries.
Exhibit 151: Most criteria put forward by S&P in Sep‐14 outlook upgrade have beensatisfied
Per capitareal GDP>5.5%
•FY15 @ 5.9%
Politicalsetting
•Stablegovernment
Betterfiscal
•FY15 deficit at 3.9%better than RE
Lowerinflation
•Inflation droppedfrom 7% to 5%
Improvedexternal
•CAD/GDP lowerat 1.3%
Source: S&P, MOSL
July 2015 58
India Strategy | Getting on track!
Exhibit 152: India rating may improve on better macro fundamentals (S&P rating)
AA : France,New Zealand
AA‐ : China,Chile, Japan
A+ : Ireland,South Korea
A‐
BBB+
BBBMalaysia

7/24/2015 India Strategy: Getting on track!– Detailed Report
http://www.motilaloswal.com/site/rreports/HTML/635721163512170886/index.htm 61/85
BBB‐
BB+
BB
ColumbiaPhilippines
Spain
MexicoThailand
Poland
Source: S&P, MOSL
The backbone of inflation has been broken finallyGovernment used its iron hand to deal with inflation
Since the current government assumed office, it has taken several measures toensure that food inflation collapses.Successive years of low rainfall prospects posed challenges on the way. Thegovernment has also prepared a contingency plan to deal with possible setbackto rural income.
A contingency plan to dealwith monsoon fallout
1
2
3
4
5
6
7
Plan to increase employment days underMGNREGA to 150 from current 100
Resort to large scale imports to check theprices of pulses
Exhibit 153: How government broke the back of food inflation
A new crop insurance policy
Wider dissemination through exclusivefarmers' channel; agro advisors
States directed to keep adequate quantityof seeds besides other inputs such asfertilisers, micro nutrients and pesticides
District wise contingency plans inconsultation with state governments
Ensure coal availability to make do for anyshortfall in hydro power
Source: Government, MOSL
July 2015 59
India Strategy | Getting on track!
Other drivers of inflation too are at low ebbIn USD terms, global prices have retreated by six years to FY09. In INR terms,they are ruling at levels lower than in FY11 and FY08. Even global food priceshave walked back by five years.Domestic drivers such as rural wage growth and pressure points such asvegetables, fruits and protein items are at lower single‐digit levels.
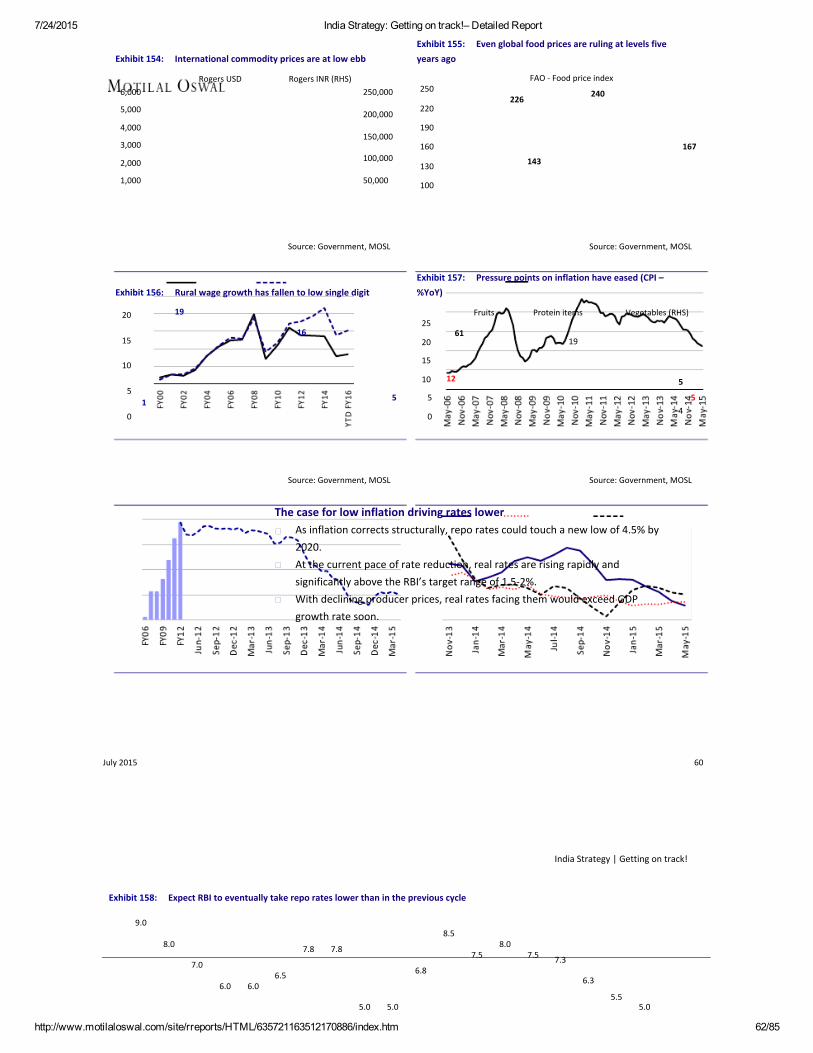
7/24/2015 India Strategy: Getting on track!– Detailed Report
http://www.motilaloswal.com/site/rreports/HTML/635721163512170886/index.htm 62/85
Exhibit 155: Even global food prices are ruling at levels fiveyears ago
250
220
190
160
130
100
143
167
FAO ‐ Food price index
226240
Exhibit 154: International commodity prices are at low ebb
Rogers USD6,000
5,000
4,000
3,000
2,000
1,000
Rogers INR (RHS)250,000
200,000
150,000
100,000
50,000
Source: Government, MOSL Source: Government, MOSL
Exhibit 156: Rural wage growth has fallen to low single digit
20
15
10
5
01 5
19
16
Exhibit 157: Pressure points on inflation have eased (CPI –%YoY)
25
20
15
10
5
04
12 5
5
Fruits
61
Protein items
19
Vegetables (RHS)
Source: Government, MOSL Source: Government, MOSL
The case for low inflation driving rates lowerAs inflation corrects structurally, repo rates could touch a new low of 4.5% by2020.At the current pace of rate reduction, real rates are rising rapidly andsignificantly above the RBI’s target range of 1.5‐2%.With declining producer prices, real rates facing them would exceed GDPgrowth rate soon.
July 2015 60
India Strategy | Getting on track!
Exhibit 158: Expect RBI to eventually take repo rates lower than in the previous cycle
9.0
8.0
7.0
6.0 6.06.5
5.0 5.0
7.8 7.8
6.8
8.5
7.58.0
7.5 7.3
6.3
5.55.0

7/24/2015 India Strategy: Getting on track!– Detailed Report
http://www.motilaloswal.com/site/rreports/HTML/635721163512170886/index.htm 63/85
4.5
Source: RBI, MOSL
Exhibit 159: Real rates are rising fast to make it more asavers’ economy
Real repo rate (CPI adjusted)Real repo rate (CPI adjusted) ‐ LPA (0.2%)Real repo rate (CPI adjusted) ‐ RBI indicative (1.75%)
6
4
2
0
‐2
‐4
‐6
‐8
‐4.1 ‐3.7‐7.4
5.23.7
3.02.1 2.2 2.1
1.0 1.51.9
0.1
‐1.5‐2.7
3.0
Exhibit 160: For producers facing WPI, this has becomereally hard
Real repo rate (WPI adjusted)Real repo rate (WPI adjusted) ‐ LPA (1.2%)Real repo rate (WPI adjusted) ‐ RBI indicative (1.75%)
8
4.44
0
‐4
1.90.5
‐0.4
‐3.1 ‐2.8
5.5
3.6
2.01.2
3.0
1.2
‐0.4
0.12.0
8.8
Source: RBI, Government, MOSL Source: RBI, Government, MOSL
Lower borrowing to lead to sizable drop in 10‐year yieldsSharper than expected drop in fiscal deficit would imply a decline in absoluteborrowing.Higher flow of financial savings on the other hand would create shortage.This would result in very sharp drop in government yield, taking it to lower thanthe previous cycle.
Exhibit 161: Net market borrowing to go down in absolute terms releasing a lot of financial savings for equity marketNet market borrowing (USDb) Net market borrowing (as % of household financial savings) (RHS)
69
34
1410
16
5816 16 18 20 19 22 24 33 51 84 71 91 86 75 73 71 76 72 66
Source: Government, RBI, MOSL
July 2015 61
India Strategy | Getting on track!
Exhibit 162: 10‐year yields may crash to see a new bottom in the coming cycle on account of this
11.4 10.9
8.7
6.9
5.4
6.67.4 7.6 7.7 7.3 7.6 7.7
8.4 8.08.5
8.07.5
6.55.5
5.04.5

7/24/2015 India Strategy: Getting on track!– Detailed Report
http://www.motilaloswal.com/site/rreports/HTML/635721163512170886/index.htm 64/85
Source: Government, RBI, MOSL
INR stable and most resilient among major currenciesTo ward off external threats, limiting their impact
INR has returned to stability, as foreign investment flows have remainedbuoyant. Excess capital flow was used to spike up reserves by around USD80bsince Dr Rajan assumed office, resulting in upturn in import cover to 11 monthsfrom the low of 7 months in FY13.The INR has outperformed most major currencies, barring the ones pegged withthe USD.
Exhibit 164: FDI flows have revived too
Net FDI (USDb)
33
22
16
8
18
11
22 20 22
Exhibit 163: Currency volatility has come down significantly
30
20
10
USDINR 6 Month ATM Implied Volatility
Periods of high
30
5 3 2 4 3
Source: RBI, Government, MOSL Source: RBI, Government, MOSL
Exhibit 165:Exhibit 166: Forex balance and reserves cover comfortable
Forex reserves (USD)
17
15
11
7
10
5
Import cover (months, RHS)20
Exhibit 167: In the last one year, INR has been more stable –USD‐pegged currencies the exceptions
0.0
0.0‐5.4 ‐5.8 ‐8.1 ‐8.8
‐12.3‐20.6 ‐22.2 ‐22.8
‐62.6
Source: RBI, Government, MOSL Source: RBI, Government, MOSL
July 2015 62
India Strategy | Getting on track!
Greenshoots of a revival of the capex cycleCMIE data indicate an upturn in capex activity. Though the data indicatevolatility, the quantum of projects under implementation and outstanding hasstarted growing again after a period of lull. The government has provided somethrust to this revival, with higher share of public sector.The recovery of IIP from no growth to 2.8% in FY15 was also on the back of 6.3%growth in capital goods.
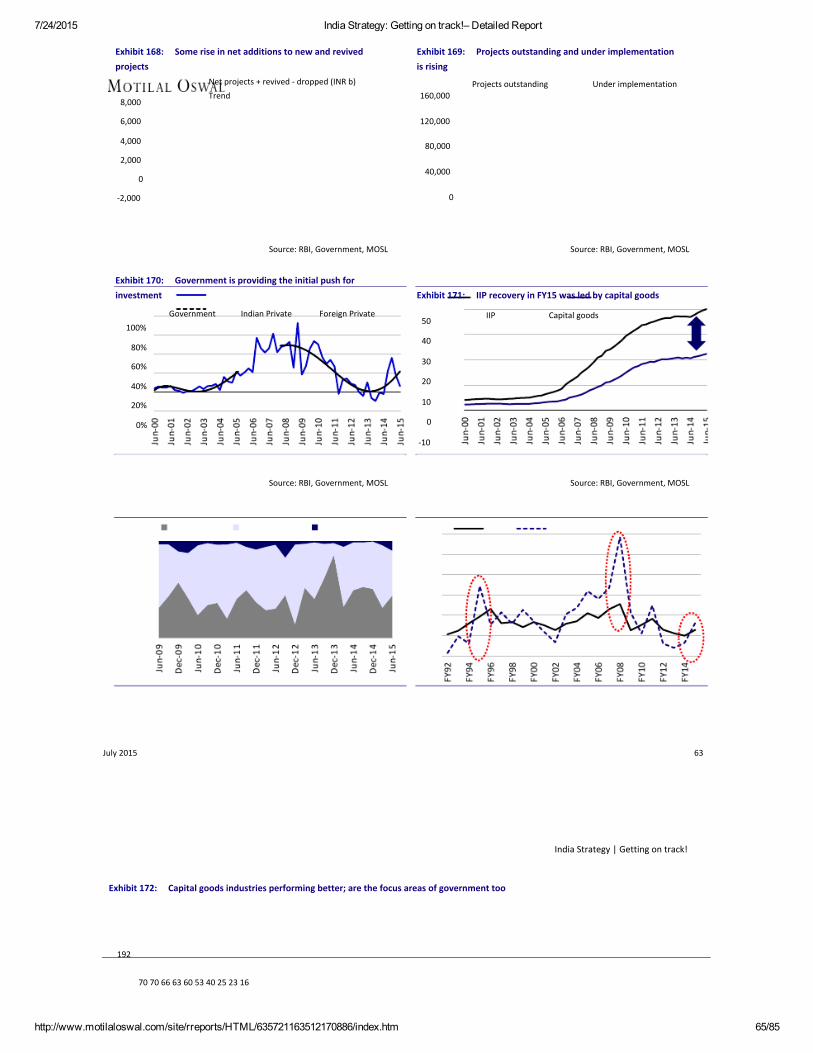
7/24/2015 India Strategy: Getting on track!– Detailed Report
http://www.motilaloswal.com/site/rreports/HTML/635721163512170886/index.htm 65/85
Exhibit 169: Projects outstanding and under implementationis rising
160,000
120,000
80,000
40,000
0
Projects outstanding Under implementation
Exhibit 168: Some rise in net additions to new and revivedprojects
8,000
6,000
4,000
2,000
0
‐2,000
Net projects + revived ‐ dropped (INR b)Trend
Source: RBI, Government, MOSL Source: RBI, Government, MOSL
Exhibit 170: Government is providing the initial push forinvestment
Government100%
80%
60%
40%
20%
0%
Indian Private Foreign Private
Exhibit 171: IIP recovery in FY15 was led by capital goods
50
40
30
20
10
0
‐10
IIP Capital goods
Source: RBI, Government, MOSL Source: RBI, Government, MOSL
July 2015 63
India Strategy | Getting on track!
Exhibit 172: Capital goods industries performing better; are the focus areas of government too
192
70 70 66 63 60 53 40 25 23 16
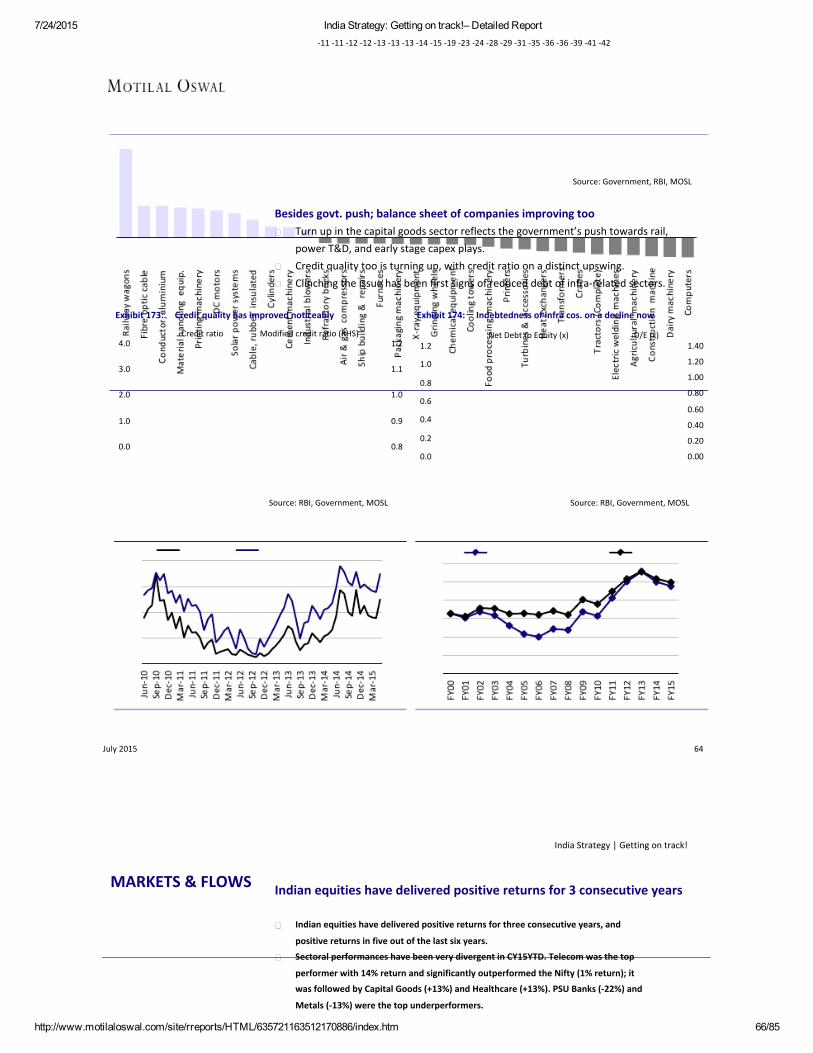
7/24/2015 India Strategy: Getting on track!– Detailed Report
http://www.motilaloswal.com/site/rreports/HTML/635721163512170886/index.htm 66/85
‐11 ‐11 ‐12 ‐12 ‐13 ‐13 ‐13 ‐14 ‐15 ‐19 ‐23 ‐24 ‐28 ‐29 ‐31 ‐35 ‐36 ‐36 ‐39 ‐41 ‐42
Source: Government, RBI, MOSL
Besides govt. push; balance sheet of companies improving tooTurn up in the capital goods sector reflects the government’s push towards rail,power T&D, and early stage capex plays.Credit quality too is turning up, with credit ratio on a distinct upswing.Clinching the issue has been first signs of reduced debt of infra‐related sectors.
Exhibit 174: Indebtedness of infra cos. on a decline now
1.2
1.1
1.0
0.9
0.8
1.2
1.0
0.8
0.6
0.4
0.2
0.0
Net Debt to Equity (x) D/E (x)1.40
1.20
1.00
0.80
0.60
0.40
0.20
0.00
Exhibit 173: Credit quality has improved noticeably
4.0
3.0
2.0
1.0
0.0
Credit ratio Modified credit ratio (RHS)
Source: RBI, Government, MOSL Source: RBI, Government, MOSL
July 2015 64
India Strategy | Getting on track!
MARKETS & FLOWS Indian equities have delivered positive returns for 3 consecutive years
Indian equities have delivered positive returns for three consecutive years, and
positive returns in five out of the last six years.
Sectoral performances have been very divergent in CY15YTD. Telecom was the top
performer with 14% return and significantly outperformed the Nifty (1% return); it
was followed by Capital Goods (+13%) and Healthcare (+13%). PSU Banks (‐22%) and
Metals (‐13%) were the top underperformers.

7/24/2015 India Strategy: Getting on track!– Detailed Report
http://www.motilaloswal.com/site/rreports/HTML/635721163512170886/index.htm 67/85
Lupin was the best‐performing Sensex stock (32% return) for CY15, followed by Maruti
Suzuki (21%) and HUL (21%). Hindalco, Tata Steel, Sesa Sterlite, Hero Motocorp, SBI,
ITC, ICICI Bank, GAIL and Tata Motors were the top underperformers (delivering
negative returns of 10‐30%).
Valuations of Indian equities are near the long‐term averages; need growth to pick‐up.
The Sensex trades at 16.9x P/E (slightly above its long‐period average of 16.2x) and
near its 10‐year average P/B of 2.8x.
Domestic MFs have turned big buyers in Indian equities for 14 consecutive months. DII
(ex MFs) have also turned net buyers by pumping in USD1.3b in last three months
after 13 months of outflows.
FIIs invested another USD6.2b in the first half of CY15 compared with USD16.2b in
CY14. However, FIIs have been net sellers in recent months.
FII holding in BSE‐200 companies is at an all‐time high of 25.6% compared with DII at
10.9%. FIIs have bought USD 169b in 23 years. Since Jan 2000, FIIs bought USD158b
compared with DIIs’ USD8.8b. We expect this trend to stabilize as domestic flows have
turned positive now.
Financial savings to increase; higher share toward equities likely.
Exhibit 175: Markets: Indian equities have delivered positive returns for three consecutive years
Indian equities have delivered positive returns for the third consecutive year and in five out of the last six years
Source: Bloomberg, MOSL
July 2015 65
India Strategy | Getting on track!
Exhibit 176: Sectoral performances have been very divergent—CY15YTD Sectoral performance (%): Telecom, Capital Goodsand Healthcare led the pack
14 13 139
63 1 1 1 0 0
0‐1 ‐3
‐9 ‐11 ‐13

7/24/2015 India Strategy: Getting on track!– Detailed Report
http://www.motilaloswal.com/site/rreports/HTML/635721163512170886/index.htm 68/85
‐22
Source: Bloomberg, MOSL
Exhibit 177: Sensex: Best and worst performers for CY15YTD (%)
32
21 21 19 1914 12 12 11
10 9 6 4 4 1
0 0 ‐2 ‐2 ‐4‐7 ‐9
‐11 ‐12 ‐13 ‐14‐16 ‐19 ‐19
‐24‐29
Source: Bloomberg, MOSL
Valuations are near long‐term averages; need growth to pick‐upMarket valuations are at long‐term averages
Valuations of Indian equities remain attractive. The Sensex trades at 16.9x P/E,slightly above its long‐period average of 16.2x. Sensex P/B is near its 10‐yearaverage of 2.8x.Market cap‐to‐GDP ratio of 71%(FY16E GDP) is below the long‐period average of76%
Exhibit 179: 12‐month forward Sensex P/B (x)
4.3
10 Year Avg:16.2x
16.86
4.2
Exhibit 178: 12‐month forward Sensex P/E (x)
25
21
17
13
910.67
24.65
3.6
2.9
2.2
1.5 1.6
10 Year Avg:2.7x
2.8
Source: MOSL
July 2015
Source: MOSL
66
India Strategy | Getting on track!
Exhibit 180: 12‐month forward Sensex RoE (%)
24.5
22.0
19.5
17.0
10 Year Avg:18.2%
Exhibit 181: India’s market cap‐to‐GDP (%)
103
82
52
83
55
95Average of 76%
88 for the period
24.09
7080
64 6671
16.56

7/24/2015 India Strategy: Getting on track!– Detailed Report
http://www.motilaloswal.com/site/rreports/HTML/635721163512170886/index.htm 69/85
14.515.84
Source: MOSL Source: MOSL
Market valuations at a premium; factoring growth recovery of 2HFY16
Exhibit 182: Trend in Sensex EPS (INR) and P/E(x)
FY15‐17E: 19%CAGR
FY93‐FY14: 14% CAGR
FY03‐08: 25%CAGR
FY08‐15:7% CAGR
FY93‐96: 45%CAGR
FY96‐03: 1% CAGR
30Sensex P/E (x)
Sensex CAGR 14% Sensex CAGR ‐1%
2424.3 24.6
Sensex CAGR39%
24.6
SensexCAGR ‐1%
18
Average of15.1x
17.9
12
8.06
Source: MOSL
July 2015 67
India Strategy | Getting on track!
Each cycle sees many new entrants in Top 30Total market cap of the top 30 companies in Dec‐02 was INR3.7t. Currently, TCSalone commands a market cap of INR5t.Out of the top 10 companies with the highest market cap, eight have changedsince Dec‐2007
Exhibit 183: Top 30 market cap companies: Eight out of the top companies have changed since Dec‐2007
Rank CompanyMkt Cap (INR b) ‐
Dec 2002Company
Mkt Cap (INR b)‐ Dec 2007
Mkt Cap (INR b)‐ June 2015
Company
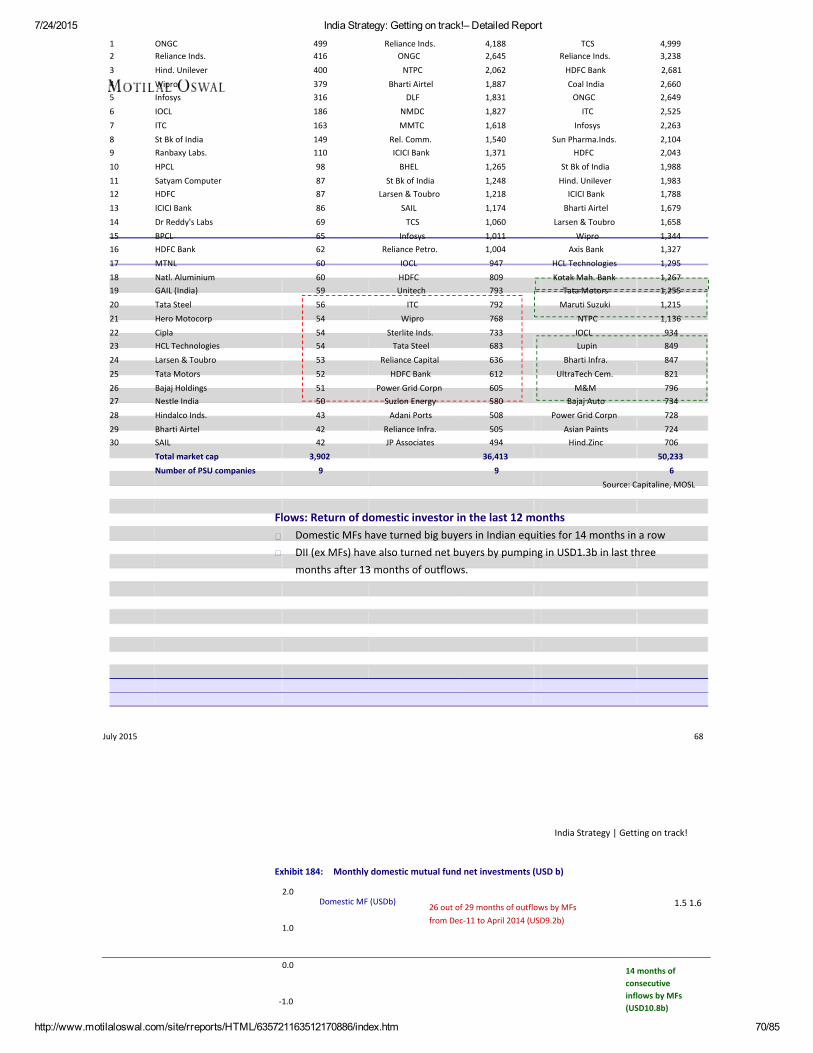
7/24/2015 India Strategy: Getting on track!– Detailed Report
http://www.motilaloswal.com/site/rreports/HTML/635721163512170886/index.htm 70/85
123456789101112131415161718192021222324252627282930
ONGCReliance Inds.Hind. UnileverWiproInfosysIOCLITCSt Bk of IndiaRanbaxy Labs.HPCLSatyam ComputerHDFCICICI BankDr Reddy's LabsBPCLHDFC BankMTNLNatl. AluminiumGAIL (India)Tata SteelHero MotocorpCiplaHCL TechnologiesLarsen & ToubroTata MotorsBajaj HoldingsNestle IndiaHindalco Inds.Bharti AirtelSAILTotal market capNumber of PSU companies
499416400379316186163149110988787866965626060595654545453525150434242
3,9029
Reliance Inds.ONGCNTPC
Bharti AirtelDLF
NMDCMMTC
Rel. Comm.ICICI BankBHEL
St Bk of IndiaLarsen & Toubro
SAILTCS
InfosysReliance Petro.
IOCLHDFCUnitech
ITCWipro
Sterlite Inds.Tata Steel
Reliance CapitalHDFC Bank
Power Grid CorpnSuzlon EnergyAdani Ports
Reliance Infra.JP Associates
4,1882,6452,0621,8871,8311,8271,6181,5401,3711,2651,2481,2181,1741,0601,0111,004947809793792768733683636612605580508505494
36,4139
TCS 4,999Reliance Inds. 3,238HDFC Bank 2,681Coal India 2,660ONGC 2,649
ITC 2,525Infosys 2,263
Sun Pharma.Inds. 2,104HDFC 2,043
St Bk of India 1,988Hind. Unilever 1,983
ICICI Bank 1,788Bharti Airtel 1,679
Larsen & Toubro 1,658Wipro 1,344
Axis Bank 1,327HCL Technologies 1,295Kotak Mah. Bank 1,267
Tata Motors 1,255Maruti Suzuki 1,215
NTPC 1,136IOCL 934Lupin 849
Bharti Infra. 847UltraTech Cem. 821
M&M 796Bajaj Auto 734
Power Grid Corpn 728Asian Paints 724Hind.Zinc 706
50,2336
Source: Capitaline, MOSL
Flows: Return of domestic investor in the last 12 monthsDomestic MFs have turned big buyers in Indian equities for 14 months in a rowDII (ex MFs) have also turned net buyers by pumping in USD1.3b in last threemonths after 13 months of outflows.
July 2015 68
India Strategy | Getting on track!
Exhibit 184: Monthly domestic mutual fund net investments (USD b)
2.0
1.0
0.0
‐1.0
Domestic MF (USDb)26 out of 29 months of outflows by MFsfrom Dec‐11 to April 2014 (USD9.2b)
1.5 1.6
14 months ofconsecutiveinflows by MFs(USD10.8b)
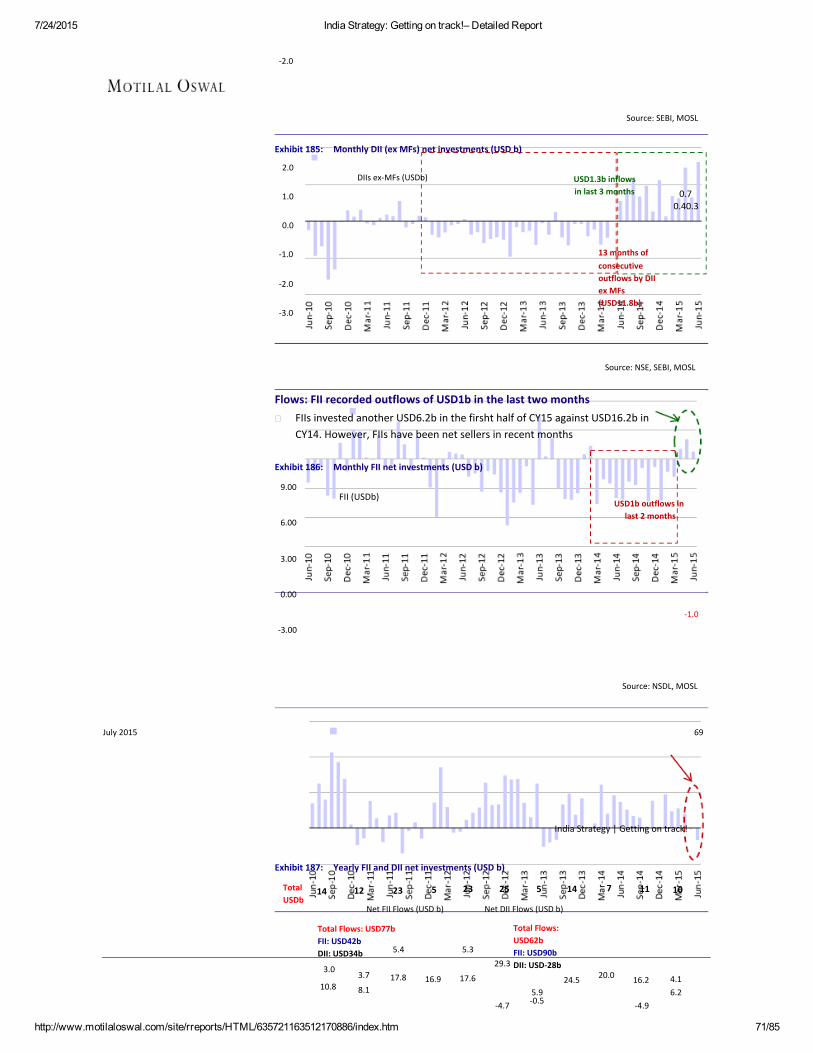
7/24/2015 India Strategy: Getting on track!– Detailed Report
http://www.motilaloswal.com/site/rreports/HTML/635721163512170886/index.htm 71/85
‐2.0
Source: SEBI, MOSL
Exhibit 185: Monthly DII (ex MFs) net investments (USD b)
2.0
1.0
0.0
‐1.0
‐2.0
‐3.0
13 months ofconsecutiveoutflows by DIIex MFs(USD11.8b)
DIIs ex‐MFs (USDb) USD1.3b inflowsin last 3 months 0.7
0.40.3
Source: NSE, SEBI, MOSL
Flows: FII recorded outflows of USD1b in the last two monthsFIIs invested another USD6.2b in the firsht half of CY15 against USD16.2b inCY14. However, FIIs have been net sellers in recent months
Exhibit 186: Monthly FII net investments (USD b)
9.00
6.00
3.00
0.00
‐1.0
‐3.00
FII (USDb)USD1b outflows in
last 2 months
Source: NSDL, MOSL
July 2015 69
India Strategy | Getting on track!
Exhibit 187: Yearly FII and DII net investments (USD b)
TotalUSDb
14 12 23 5 23 25 5 14 7 11 10
Net FII Flows (USD b)
Total Flows: USD77bFII: USD42b
5.4DII: USD34b
3.0
10.83.7
8.117.8 16.9
Net DII Flows (USD b)
Total Flows:USD62bFII: USD90b
29.3 DII: USD‐28b
24.55.9‐0.5‐4.7
5.3
17.6 20.0 16.2
‐4.9
4.16.2

7/24/2015 India Strategy: Getting on track!– Detailed Report
http://www.motilaloswal.com/site/rreports/HTML/635721163512170886/index.htm 72/85
‐12.2 ‐10.9 ‐13.0
CY05 CY06 CY07 CY08 CY09 CY10 CY11 CY12 CY13 CY14 CY15YTD
Source: NSDL, SEBI, NSE, MOSL
Financial savings to increase; higher share toward equities likely
Exhibit 188: Trend in financial savings and shares/debentures
Savings in shares & debentures (USD b)
10.111.9
8.6
2.7
2.0 8.5 11.6 19.0
11.3
10.9
13.2
11.6
10.112.0
6.2
0.7
‐0.8
‐1.0
FY05 FY06 FY07 FY08 FY09 FY10 FY11 FY12 FY13 FY14 FY15E FY16E FY17E FY18E FY19E
10.1 1.3
Financial savings % to GDP
9.9
Shares and Debentures % of Financial Savings
9.7 10.2 10.6
8.0
22.8
11.0
8.5
27.6
7.2
0.1
0.2
7.2
6.6
7.2 7.7
3.3
8.7 4.5
4.0
6.4
6.0
12.8
7.0
17.4
Source: RBI, Capitaline, MOSL
Exhibit 189: Trend in GDP and shares/debentures (% to GDP)
2.0
0.27
8.5
1.02
11.6
1.22
19.01.53
‐1.0GDP (USD T)
1.310.1
0.740.07
‐0.08
0.7 0.8 0.9 1.2 1.2 1.4 1.7 1.8 1.8 1.9 2.1 2.2 2.4 2.7 3.0
0.2
0.01
Shares & debentures % to GDP8.7 4.5 6.4 12.8
0.48 0.24 0.310.58
17.4
0.71
22.8
0.85
27.6
0.94
FY05 FY06 FY07 FY08 FY09 FY10 FY11 FY12 FY13 FY14 FY15E FY16E FY17E FY18E FY19E
Source: RBI, Capitaline, MOSL
Shares & debentures(USDb)
Holding: FIIs’ share in India at all‐time high of 51%
July 2015
FII holding in BSE‐200 companies is at an all‐time high of 25.6%. DII holding waslow at 10.9%.FIIs bought USD169b in 23 years, taking holding of BSE‐200 from 0% to 25.6%.Since Jan 2000, FIIs bought USD158b compared with USD8.8b for DII.We expect this trend to stabilize as domestic flows have turned positive now
70
India Strategy | Getting on track!
Exhibit 190: Trend in FII and DII holding (%)
27.0
24.5
22.0
19.5
12.6
22.512.0
19.511.2
11.8
11.3
BSE200 FII Holding (%) BSE200 DII Holding (%) ‐ RHS
25.6
23.8
12.8
12.3

7/24/2015 India Strategy: Getting on track!– Detailed Report
http://www.motilaloswal.com/site/rreports/HTML/635721163512170886/index.htm 73/85
17.0
18.110.9
10.8
11.5
Source: Capitaline, MOSL
FII ownership as a proportion of free float of BSE‐200 remained high at 51.2%.DII ownership as a proportion of free float was at 21.8%
Exhibit 191: FII share in India at all‐time high; DIIs record a fall
55.027.7
51.0
47.0
43.0
40.0
39.0
26.1
42.6
25.9
41.9
46.448.3
22.6
21.8
21.0
FII Proportion of Free Float (%) DII Proportion of Free Float (%) ‐ RHS
51.227.0
25.0
23.0
29.0
23.7
Source: Capitaline, MOSL
July 2015 71
India Strategy | Getting on track!
MOSL modelportfolio
Sector / Portfolio Picks
Financials
Private
ICICI Bank
HDFC Bank
Axis Bank
Yes Bank
NBFCs
MMFS
IDFC
BSE‐100
30.2
18.5
5.2
6.1
2.8
0.8
8.2
0.2
0.6
MOSL Wt
30.0
20
6
6
5
3
6
3
3
Wt relative to BSE‐100
‐0.2
1.5
0.8
‐0.1
2.2
2.2
‐2.2
2.8
2.4
Sector Stance
Overweight
Overweight
Buy
Buy
Buy
Buy
Neutral
Buy
Buy

7/24/2015 India Strategy: Getting on track!– Detailed Report
http://www.motilaloswal.com/site/rreports/HTML/635721163512170886/index.htm 74/85
PSUSBI
Auto
Maruti
Tata Motors
Ashok Leyland
Bharat Forge
Cap Goods, Infra & Cement
UltraTech
Larsen & Toubro
BHEL
Consumer / Retail / Media
ITC
Asian Paints
Zee
Technology
Infosys
TCS
Energy
HPCL
ONGC
Utilities
Coal India
Healthcare
Lupin
Aurobindo
Midcaps/Others
Arvind
Bata India
Gateway Distripak
DCB Bank
Jain Irrigation
Inox Wind
Havells India
Dewan Housing
Voltas
Sobha DevelopersCash
TOTAL
3.52.4
9.6
1.6
2.4
0.3
0.4
9.3
0.9
4.3
0.7
11.4
5.2
1.0
0.6
12.7
5.6
3.8
8.6
0.4
1.6
4.0
1.6
7.7
1.3
0.6
6.5
0.0
0.0
0.0
0.0
0.0
0.0
0.0
0.0
0.0
0.00.0
100.0
44
13.0
5
4
2
2
12.0
5
5
2
10.0
4
3
3
9.0
5
4
6.0
4
2
5.0
5
5.0
3
2
10.0
1
1
1
1
1
1
1
1
1
10.0
100.0
0.51.6
3.4
3.4
1.6
1.7
1.6
2.7
4.1
0.7
1.3
‐1.4
‐1.2
2.0
2.4
‐3.7
‐0.6
0.2
‐2.6
3.6
0.4
1.0
3.4
‐2.7
1.7
1.4
3.5
1.0
1.0
1.0
1.0
1.0
1.0
1.0
1.0
1.0
1.00.00
OverweightBuy
Overweight
Buy
Buy
Buy
Buy
Overweight
Buy
Buy
Buy
Underweight
Neutral
Buy
Buy
Underweight
Buy
Neutral
Neutral
Buy
Buy
Overweight
Buy
Underweight
Buy
Buy
Overweight
Buy
Buy
Buy
Buy
Buy
Buy
Buy
Buy
Buy
Buy
July 2015 72
India Strategy | Getting on track!
Sectors & CompaniesBSE Sensex: 27,574 S&P CNX: 8,329 July 2015

7/24/2015 India Strategy: Getting on track!– Detailed Report
http://www.motilaloswal.com/site/rreports/HTML/635721163512170886/index.htm 75/85
MOSL Universe:1QFY16 Highlights
&Ready Reckoner
Note: In our quarterly performance tables, our four‐quarter numbers may not always add up to the full‐yearnumbers. This is because of differences in classification of account heads in the company’s quarterly and annualresults or because of differences in the way we classify account heads as opposed to the company.
All stock prices and indices as on 30 June 2015, unless otherwise stated.
July 2015 73
India Strategy | Getting on track!
MOSL Universe: 1QFY16 aggregate performance highlights (Ex RMs)Exhibit 192: Quarter‐wise sales growth (% YoY)
5.4%
1.3%
Exhibit 193: Quarter‐wise net profit growth (% YoY)
7.4%
0.7%
‐0.8%
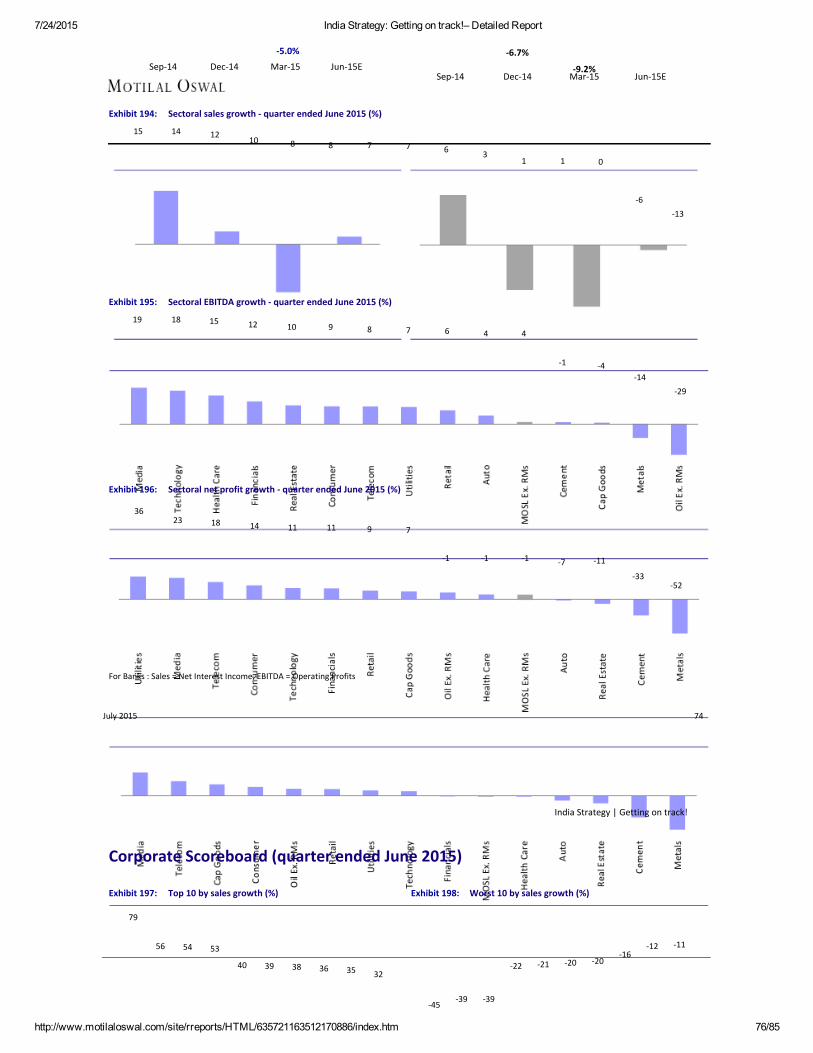
7/24/2015 India Strategy: Getting on track!– Detailed Report
http://www.motilaloswal.com/site/rreports/HTML/635721163512170886/index.htm 76/85
‐5.0%
Mar‐15‐6.7%
Jun‐15ESep‐14 Dec‐14
‐9.2%Mar‐15 Jun‐15E
Sep‐14 Dec‐14
Exhibit 194: Sectoral sales growth ‐ quarter ended June 2015 (%)
15 14 1210 8 8 7 7 6 3
1 1 0
‐6‐13
Exhibit 195: Sectoral EBITDA growth ‐ quarter ended June 2015 (%)
19 18 15 12 10 9 8 7 6 4 4
‐1 ‐4‐14
‐29
Exhibit 196: Sectoral net profit growth ‐ quarter ended June 2015 (%)
3623 18 14 11 11 9 7
‐1 ‐1 ‐1 ‐7 ‐11
‐33‐52
For Banks : Sales = Net Interest Income, EBITDA = Operating Profits
July 2015 74
India Strategy | Getting on track!
Corporate Scoreboard (quarter ended June 2015)
Exhibit 197: Top 10 by sales growth (%)
79
56 54 53
40 39 38 36 35 32
‐45‐39 ‐39
‐22 ‐21 ‐20 ‐20‐16
‐12 ‐11
Exhibit 198: Worst 10 by sales growth (%)

7/24/2015 India Strategy: Getting on track!– Detailed Report
http://www.motilaloswal.com/site/rreports/HTML/635721163512170886/index.htm 77/85
Exhibit 199: Top 10 by EBITDA growth (%)
440
Exhibit 200: Worst 10 by EBITDA growth (%)
205
108 98 88 68 66 62 56 54‐62
‐76
‐59 ‐57‐50
‐41 ‐38 ‐38 ‐36 ‐33
Exhibit 201: Top 10 by net profit growth (%)
878
Exhibit 202: Worst 10 by net profit growth (%)
335 ‐58234 209 152 126 117 106
‐9077 71
‐81 ‐79 ‐78 ‐76‐57
‐49 ‐49 ‐48
Source: MOSL
July 2015 75
India Strategy | Getting on track!
Annual performance ‐ MOSL universe (INR Billion)
SECTOR Sales Change YoY (%) EBITDA Change YoY (%) PAT Change YoY (%)FY15 FY16E FY17E FY15 FY16E FY17E FY15 FY16E FY17E FY15 FY16E FY17E FY15 FY16E FY17E FY15 FY16E FY17E
492
174146
304
1,395540
491
3.2
‐9.1‐16.8
7.8
9.614.9
3.2
31.8
29.335.7
23.0
18.919.2
20.6
27.9
35.579.7
18.4
23.420.7
30.2
Auto (11) 4,854 5,630 6,551 11.0 16.0 16.4 708 829 974 12.1 17.1 17.6 292 385
Capital Goods (12) 1,566 1,620 1,944 ‐2.5 3.5 20.0 172 180 230 6.8 4.5 28.0 99 128Cement (14) 1,209 1,484 1,777 6.8 22.7 19.8 184 243 350 0.5 32.4 43.8 60 81
Consumer (15) 1,479 1,643 1,884 8.3 11.1 14.6 310 363 428 9.4 17.2 18.0 209 257
Financials (31) 2,649 2,979 3,503 12.4 12.5 17.6 2,103 2,364 2,816 14.3 12.4 19.2 951 1,131Pvt Banks (10) 737 869 1,046 17.1 17.9 20.4 644 750 906 17.7 16.5 20.7 376 448
PSU Banks (10) 1,470 1,594 1,845 9.1 8.4 15.8 1,031 1,117 1,324 11.4 8.3 18.6 313 377
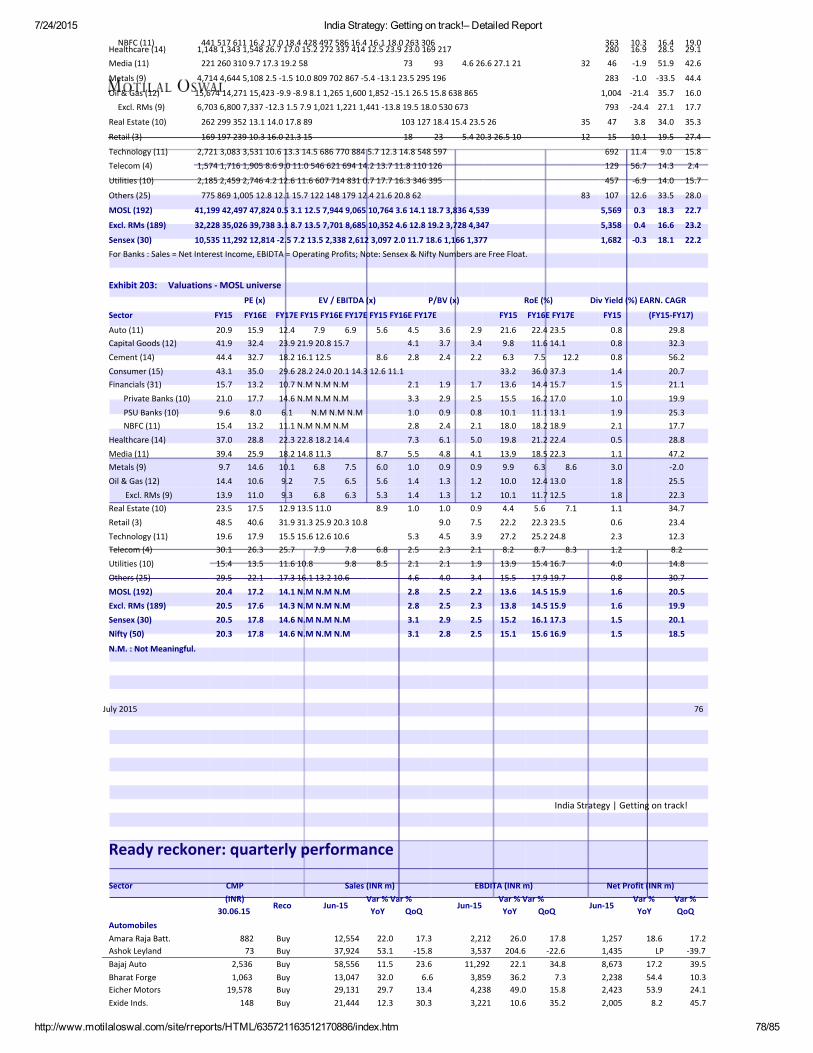
7/24/2015 India Strategy: Getting on track!– Detailed Report
http://www.motilaloswal.com/site/rreports/HTML/635721163512170886/index.htm 78/85
36328046
283
1,004793
47
15
692129
457
107
5,569
5,358
1,682
10.316.9‐1.9
‐1.0
‐21.4‐24.4
3.8
10.1
11.456.7
‐6.9
12.6
0.3
0.4
‐0.3
16.428.551.9
‐33.5
35.727.1
34.0
19.5
9.014.3
14.0
33.5
18.3
16.6
18.1
19.029.142.6
44.4
16.017.7
35.3
27.4
15.82.4
15.7
28.0
22.7
23.2
22.2
NBFC (11) 441 517 611 16.2 17.0 18.4 428 497 586 16.4 16.1 18.0 263 306Healthcare (14) 1,148 1,343 1,548 26.7 17.0 15.2 272 337 414 12.5 23.9 23.0 169 217Media (11) 221 260 310 9.7 17.3 19.2 58 73 93 4.6 26.6 27.1 21 32
Metals (9) 4,714 4,644 5,108 2.5 ‐1.5 10.0 809 702 867 ‐5.4 ‐13.1 23.5 295 196
Oil & Gas (12) 15,674 14,271 15,423 ‐9.9 ‐8.9 8.1 1,265 1,600 1,852 ‐15.1 26.5 15.8 638 865Excl. RMs (9) 6,703 6,800 7,337 ‐12.3 1.5 7.9 1,021 1,221 1,441 ‐13.8 19.5 18.0 530 673
Real Estate (10) 262 299 352 13.1 14.0 17.8 89 103 127 18.4 15.4 23.5 26 35
Retail (3) 169 197 239 10.3 16.0 21.3 15 18 23 5.4 20.3 26.5 10 12
Technology (11) 2,721 3,083 3,531 10.6 13.3 14.5 686 770 884 5.7 12.3 14.8 548 597Telecom (4) 1,574 1,716 1,905 8.6 9.0 11.0 546 621 694 14.2 13.7 11.8 110 126
Utilities (10) 2,185 2,459 2,746 4.2 12.6 11.6 607 714 831 0.7 17.7 16.3 346 395
Others (25) 775 869 1,005 12.8 12.1 15.7 122 148 179 12.4 21.6 20.8 62 83
MOSL (192) 41,199 42,497 47,824 0.5 3.1 12.5 7,944 9,065 10,764 3.6 14.1 18.7 3,836 4,539
Excl. RMs (189) 32,228 35,026 39,738 3.1 8.7 13.5 7,701 8,685 10,352 4.6 12.8 19.2 3,728 4,347
Sensex (30) 10,535 11,292 12,814 ‐2.5 7.2 13.5 2,338 2,612 3,097 2.0 11.7 18.6 1,166 1,377For Banks : Sales = Net Interest Income, EBIDTA = Operating Profits; Note: Sensex & Nifty Numbers are Free Float.
Exhibit 203: Valuations ‐ MOSL universe
Sector
Auto (11)Capital Goods (12)Cement (14)Consumer (15)Financials (31)
Private Banks (10)PSU Banks (10)NBFC (11)
Healthcare (14)Media (11)Metals (9)Oil & Gas (12)
Excl. RMs (9)Real Estate (10)Retail (3)Technology (11)Telecom (4)Utilities (10)Others (25)MOSL (192)Excl. RMs (189)Sensex (30)Nifty (50)
N.M. : Not Meaningful.
FY15
20.941.944.443.115.721.09.615.437.039.49.714.413.923.548.519.630.115.429.520.420.520.520.3
PE (x)
FY16E
15.932.432.735.013.217.78.013.228.825.914.610.611.017.540.617.926.313.522.117.217.617.817.8
EV / EBITDA (x) P/BV (x)
FY17E FY15 FY16E FY17E FY15 FY16E FY17E
12.4 7.9 6.9 5.6 4.5 3.6 2.923.9 21.9 20.8 15.7 4.1 3.7 3.418.2 16.1 12.5 8.6 2.8 2.4 2.229.6 28.2 24.0 20.1 14.3 12.6 11.110.7 N.M N.M N.M 2.1 1.9 1.714.6 N.M N.M N.M 3.3 2.9 2.56.1 N.M N.M N.M 1.0 0.9 0.811.1 N.M N.M N.M 2.8 2.4 2.122.3 22.8 18.2 14.4 7.3 6.1 5.018.2 14.8 11.3 8.7 5.5 4.8 4.110.1 6.8 7.5 6.0 1.0 0.9 0.99.2 7.5 6.5 5.6 1.4 1.3 1.29.3 6.8 6.3 5.3 1.4 1.3 1.212.9 13.5 11.0 8.9 1.0 1.0 0.931.9 31.3 25.9 20.3 10.8 9.0 7.515.5 15.6 12.6 10.6 5.3 4.5 3.925.7 7.9 7.8 6.8 2.5 2.3 2.111.6 10.8 9.8 8.5 2.1 2.1 1.917.3 16.1 13.2 10.6 4.6 4.0 3.414.1 N.M N.M N.M 2.8 2.5 2.214.3 N.M N.M N.M 2.8 2.5 2.314.6 N.M N.M N.M 3.1 2.9 2.514.6 N.M N.M N.M 3.1 2.8 2.5
FY15
21.69.86.333.213.615.510.118.019.813.99.910.010.14.422.227.28.213.915.513.613.815.215.1
RoE (%) Div Yield (%) EARN. CAGR
FY16E FY17E FY15 (FY15‐FY17)
22.4 23.5 0.8 29.811.6 14.1 0.8 32.37.5 12.2 0.8 56.236.0 37.3 1.4 20.714.4 15.7 1.5 21.116.2 17.0 1.0 19.911.1 13.1 1.9 25.318.2 18.9 2.1 17.721.2 22.4 0.5 28.818.5 22.3 1.1 47.26.3 8.6 3.0 ‐2.012.4 13.0 1.8 25.511.7 12.5 1.8 22.35.6 7.1 1.1 34.722.3 23.5 0.6 23.425.2 24.8 2.3 12.38.7 8.3 1.2 8.215.4 16.7 4.0 14.817.9 19.7 0.8 30.714.5 15.9 1.6 20.514.5 15.9 1.6 19.916.1 17.3 1.5 20.115.6 16.9 1.5 18.5
July 2015 76
India Strategy | Getting on track!
Ready reckoner: quarterly performance
Sector CMP(INR)
30.06.15
88273
2,5361,063
19,578148
Reco
BuyBuyBuyBuyBuyBuy
Sales (INR m)Var % Var %
Jun‐15YoY QoQ
12,55437,92458,55613,04729,13121,444
22.053.111.532.029.712.3
17.3‐15.823.66.6
13.430.3
EBDITA (INR m)Var % Var %
Jun‐15YoY QoQ
2,2123,537
11,2923,8594,2383,221
26.0204.622.136.249.010.6
17.8‐22.634.87.3
15.835.2
Net Profit (INR m)Var % Var %
Jun‐15YoY QoQ
1,2571,4358,6732,2382,4232,005
18.6LP
17.254.453.98.2
17.2‐39.739.510.324.145.7
AutomobilesAmara Raja Batt.Ashok LeylandBajaj AutoBharat ForgeEicher MotorsExide Inds.
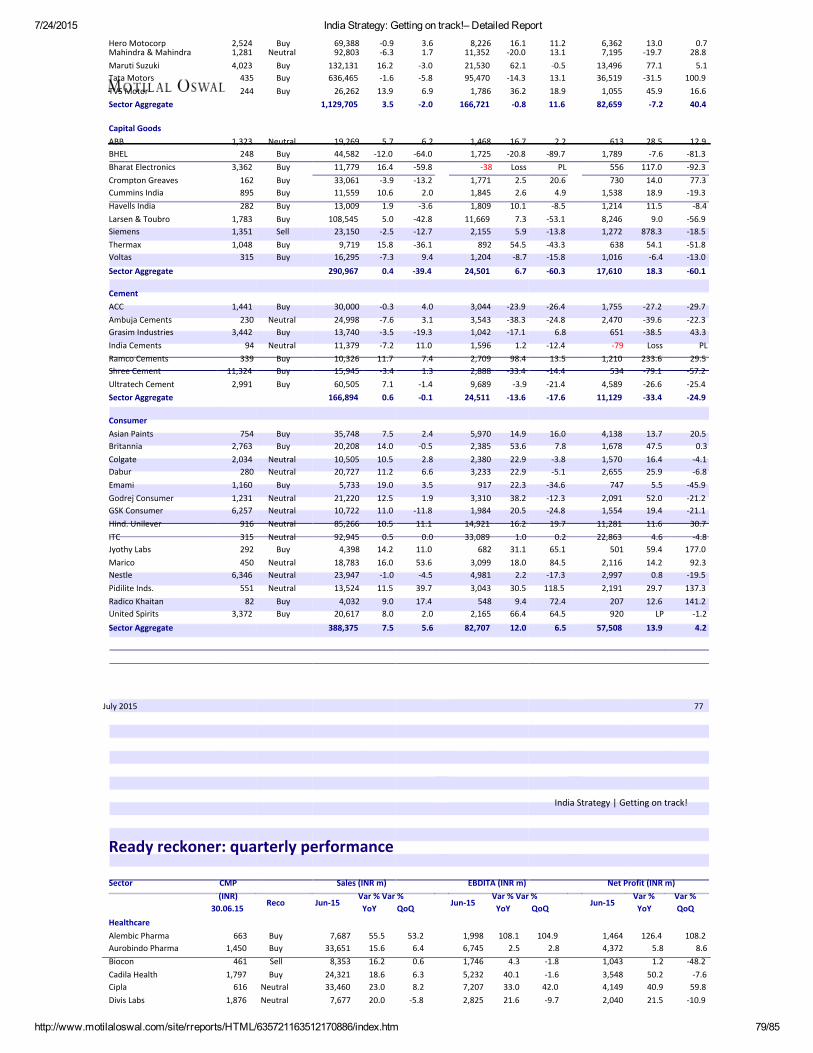
7/24/2015 India Strategy: Getting on track!– Detailed Report
http://www.motilaloswal.com/site/rreports/HTML/635721163512170886/index.htm 79/85
2,5241,2814,023435244
BuyNeutralBuyBuyBuy
69,38892,803
132,131636,46526,262
1,129,705
19,26944,58211,77933,06111,55913,009
108,54523,1509,719
16,295290,967
30,00024,99813,74011,37910,32615,94560,505
166,894
35,74820,20810,50520,7275,733
21,22010,72285,26692,9454,398
18,78323,94713,5244,032
20,617388,375
‐0.9‐6.316.2‐1.613.93.5
5.7‐12.016.4‐3.910.61.95.0‐2.515.8‐7.30.4
‐0.3‐7.6‐3.5‐7.211.7‐3.47.10.6
7.514.010.511.219.012.511.010.50.5
14.216.0‐1.011.59.08.07.5
3.61.7‐3.0‐5.86.9‐2.0
6.2‐64.0‐59.8‐13.22.0‐3.6
‐42.8‐12.7‐36.19.4
‐39.4
4.03.1
‐19.311.07.41.3‐1.4‐0.1
2.4‐0.52.86.63.51.9
‐11.811.10.0
11.053.6‐4.539.717.42.05.6
8,22611,35221,53095,4701,786
166,721
1,4681,725
‐381,7711,8451,809
11,6692,155892
1,20424,501
3,0443,5431,0421,5962,7092,8889,689
24,511
5,9702,3852,3803,233917
3,3101,984
14,92133,089
6823,0994,9813,043548
2,16582,707
16.1‐20.062.1‐14.336.2‐0.8
16.7‐20.8Loss2.52.6
10.17.35.9
54.5‐8.76.7
‐23.9‐38.3‐17.11.2
98.4‐33.4‐3.9
‐13.6
14.953.622.922.922.338.220.516.21.0
31.118.02.2
30.59.4
66.412.0
11.213.1‐0.513.118.911.6
2.2‐89.7
PL20.64.9‐8.5
‐53.1‐13.8‐43.3‐15.8‐60.3
‐26.4‐24.86.8
‐12.413.5‐14.4‐21.4‐17.6
16.07.8‐3.8‐5.1
‐34.6‐12.3‐24.819.70.2
65.184.5‐17.3118.572.464.56.5
6,3627,195
13,49636,5191,055
82,659
6131,789556730
1,5381,2148,2461,272638
1,01617,610
1,7552,470651‐79
1,210534
4,58911,129
4,1381,6781,5702,655747
2,0911,554
11,28122,863
5012,1162,9972,191207920
57,508
13.0‐19.777.1‐31.545.9‐7.2
28.5‐7.6
117.014.018.911.59.0
878.354.1‐6.418.3
‐27.2‐39.6‐38.5Loss
233.6‐79.1‐26.6‐33.4
13.747.516.425.95.5
52.019.411.64.6
59.414.20.8
29.712.6
LP13.9
0.728.85.1
100.916.640.4
12.9‐81.3‐92.377.3‐19.3‐8.4
‐56.9‐18.5‐51.8‐13.0‐60.1
‐29.7‐22.343.3
PL29.5‐57.2‐25.4‐24.9
20.50.3‐4.1‐6.8
‐45.9‐21.2‐21.130.7‐4.8
177.092.3‐19.5137.3141.2‐1.24.2
Hero MotocorpMahindra & MahindraMaruti SuzukiTata MotorsTVS MotorSector Aggregate
Capital GoodsABBBHELBharat ElectronicsCrompton GreavesCummins IndiaHavells IndiaLarsen & ToubroSiemensThermaxVoltasSector Aggregate
CementACCAmbuja CementsGrasim IndustriesIndia CementsRamco CementsShree CementUltratech CementSector Aggregate
ConsumerAsian PaintsBritanniaColgateDaburEmamiGodrej ConsumerGSK ConsumerHind. UnileverITCJyothy LabsMaricoNestlePidilite Inds.Radico KhaitanUnited SpiritsSector Aggregate
1,323248
3,362162895282
1,7831,3511,048315
NeutralBuyBuyBuyBuyBuyBuySellBuyBuy
1,441230
3,44294
33911,3242,991
BuyNeutralBuy
NeutralBuyBuyBuy
7542,7632,034280
1,1601,2316,257916315292450
6,34655182
3,372
BuyBuy
NeutralNeutralBuy
NeutralNeutralNeutralNeutralBuy
NeutralNeutralNeutralBuyBuy
July 2015 77
India Strategy | Getting on track!
Ready reckoner: quarterly performance
Sector CMP(INR)
30.06.15
6631,450461
1,797616
1,876
Reco
BuyBuySellBuy
NeutralNeutral
Sales (INR m)Var % Var %
Jun‐15YoY QoQ
7,68733,6518,353
24,32133,4607,677
55.515.616.218.623.020.0
53.26.40.66.38.2‐5.8
EBDITA (INR m)Var % Var %
Jun‐15YoY QoQ
1,9986,7451,7465,2327,2072,825
108.12.54.3
40.133.021.6
104.92.8‐1.8‐1.642.0‐9.7
Net Profit (INR m)Var % Var %
Jun‐15YoY QoQ
1,4644,3721,0433,5484,1492,040
126.45.81.2
50.240.921.5
108.28.6
‐48.2‐7.659.8‐10.9
HealthcareAlembic PharmaAurobindo PharmaBioconCadila HealthCiplaDivis Labs
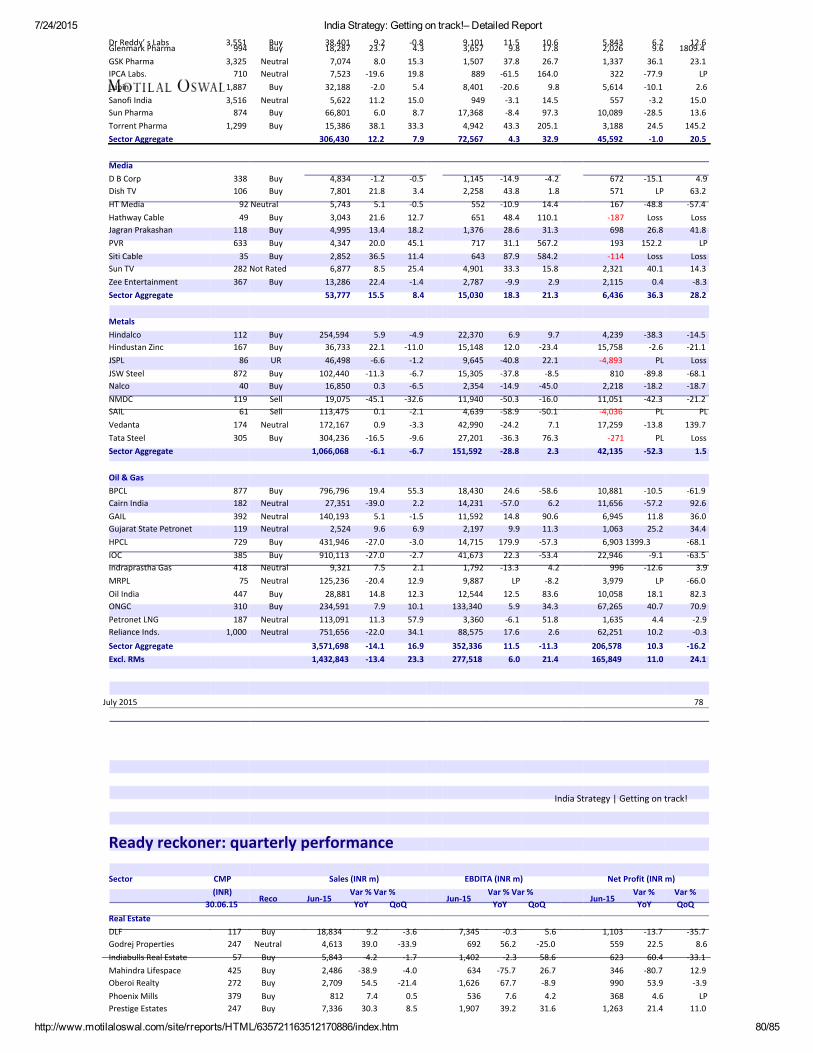
7/24/2015 India Strategy: Getting on track!– Detailed Report
http://www.motilaloswal.com/site/rreports/HTML/635721163512170886/index.htm 80/85
3,551994
3,325710
1,8873,516874
1,299
BuyBuy
NeutralNeutralBuy
NeutralBuyBuy
38,40118,2877,0747,523
32,1885,622
66,80115,386
306,430
9.223.78.0
‐19.6‐2.011.26.0
38.112.2
‐0.84.3
15.319.85.4
15.08.7
33.37.9
9,1013,6571,507889
8,401949
17,3684,942
72,567
11.59.8
37.8‐61.5‐20.6‐3.1‐8.443.34.3
10.617.826.7
164.09.8
14.597.3
205.132.9
5,8432,0261,337322
5,614557
10,0893,188
45,592
6.29.6
36.1‐77.9‐10.1‐3.2
‐28.524.5‐1.0
12.61809.4
23.1LP2.6
15.013.6
145.220.5
Dr Reddy’ s LabsGlenmark PharmaGSK PharmaIPCA Labs.LupinSanofi IndiaSun PharmaTorrent PharmaSector Aggregate
MediaD B CorpDish TVHT MediaHathway CableJagran PrakashanPVRSiti CableSun TVZee EntertainmentSector Aggregate
MetalsHindalcoHindustan ZincJSPLJSW SteelNalcoNMDCSAILVedantaTata SteelSector Aggregate
Oil & GasBPCLCairn IndiaGAILGujarat State PetronetHPCLIOCIndraprastha GasMRPLOil IndiaONGCPetronet LNGReliance Inds.Sector AggregateExcl. RMs
338 Buy106 Buy92 Neutral49 Buy
118 Buy633 Buy35 Buy
282 Not Rated367 Buy
4,8347,8015,7433,0434,9954,3472,8526,877
13,28653,777
‐1.221.85.1
21.613.420.036.58.5
22.415.5
‐0.53.4‐0.512.718.245.111.425.4‐1.48.4
1,1452,258552651
1,376717643
4,9012,787
15,030
‐14.943.8‐10.948.428.631.187.933.3‐9.918.3
‐4.21.8
14.4110.131.3
567.2584.215.82.9
21.3
672571167‐187698193‐114
2,3212,1156,436
‐15.1LP
‐48.8Loss26.8
152.2Loss40.10.4
36.3
4.963.2‐57.4Loss41.8
LPLoss14.3‐8.328.2
11216786
87240
11961
174305
BuyBuyURBuyBuySellSell
NeutralBuy
254,59436,73346,498
102,44016,85019,075
113,475172,167304,236
1,066,068
5.922.1‐6.6
‐11.30.3
‐45.10.10.9
‐16.5‐6.1
‐4.9‐11.0‐1.2‐6.7‐6.5
‐32.6‐2.1‐3.3‐9.6‐6.7
22,37015,1489,645
15,3052,354
11,9404,639
42,99027,201
151,592
6.912.0‐40.8‐37.8‐14.9‐50.3‐58.9‐24.2‐36.3‐28.8
9.7‐23.422.1‐8.5
‐45.0‐16.0‐50.1
7.176.32.3
4,23915,758‐4,893
8102,218
11,051‐4,03617,259
‐27142,135
‐38.3‐2.6PL
‐89.8‐18.2‐42.3
PL‐13.8
PL‐52.3
‐14.5‐21.1Loss‐68.1‐18.7‐21.2
PL139.7Loss1.5
87718239211972938541875
447310187
1,000
BuyNeutralNeutralNeutralBuyBuy
NeutralNeutralBuyBuy
NeutralNeutral
796,79627,351
140,1932,524
431,946910,113
9,321125,23628,881
234,591113,091751,656
3,571,6981,432,843
19.4‐39.05.19.6
‐27.0‐27.07.5
‐20.414.87.9
11.3‐22.0‐14.1‐13.4
55.32.2‐1.56.9‐3.0‐2.72.1
12.912.310.157.934.116.923.3
18,43014,23111,5922,197
14,71541,6731,7929,887
12,544133,340
3,36088,575
352,336277,518
24.6‐57.014.89.9
179.922.3‐13.3
LP12.55.9‐6.117.611.56.0
‐58.66.2
90.611.3‐57.3‐53.4
4.2‐8.283.634.351.82.6
‐11.321.4
10,881 ‐10.511,656 ‐57.26,945 11.81,063 25.26,903 1399.3
22,946 ‐9.1996 ‐12.6
3,979 LP10,058 18.167,265 40.71,635 4.4
62,251 10.2206,578 10.3165,849 11.0
‐61.992.636.034.4‐68.1‐63.5
3.9‐66.082.370.9‐2.9‐0.3
‐16.224.1
July 2015 78
India Strategy | Getting on track!
Ready reckoner: quarterly performance
Sector CMP(INR)
30.06.15
11724757
425272379247
Reco
BuyNeutralBuyBuyBuyBuyBuy
Sales (INR m)Var % Var %
Jun‐15YoY QoQ
18,8344,6135,8432,4862,709812
7,336
9.239.0‐4.2
‐38.954.57.4
30.3
‐3.6‐33.9‐1.7‐4.0
‐21.40.58.5
EBDITA (INR m)Var % Var %
Jun‐15YoY QoQ
7,345692
1,402634
1,626536
1,907
‐0.356.2‐2.3
‐75.767.77.6
39.2
5.6‐25.058.626.7‐8.94.2
31.6
Net Profit (INR m)Var % Var %
Jun‐15YoY QoQ
1,103559623346990368
1,263
‐13.722.560.4‐80.753.94.6
21.4
‐35.78.6
‐33.112.9‐3.9LP
11.0
Real EstateDLFGodrej PropertiesIndiabulls Real EstateMahindra LifespaceOberoi RealtyPhoenix MillsPrestige Estates

7/24/2015 India Strategy: Getting on track!– Detailed Report
http://www.motilaloswal.com/site/rreports/HTML/635721163512170886/index.htm 81/85
357 Buy 5,57648,209
‐3.58.0
10.1‐5.7
1,50615,648
‐1.9‐3.6
6.08.4
5425,795
‐5.0‐11.2
‐12.50.3
Sobha DevelopersSector Aggregate
RetailJubilant FoodworksShopper's StopTitan CompanySector Aggregate
TechnologyHCL TechnologiesHexaware Tech.InfosysKPIT Tech.MindtreeMphasiSPersistent SystemsTCSTata ElxsiTech MahindraWiproSector Aggregate
TelecomBharti AirtelBharti InfratelIdea CellularReliance CommSector Aggregate
UtilitiesCESCCoal IndiaJSW EnergyNHPCNTPCPower Grid Corp.PTC IndiaRattanIndia PowerReliance InfraTata PowerSector AggregateOthersArvindBata IndiaCastrol IndiaConcorCoromandel Interl
1,856397366
BuyNeutralNeutral
6,0086,861
29,20442,073
26.012.51.05.8
10.8‐15.918.09.8
823377
2,7163,916
39.622.6‐1.07.6
17.4‐23.19.46.6
41833
1,8302,280
50.6335.3
3.210.8
32.4‐68.3‐14.9‐11.3
92125598593
1,269411601
2,5521,201478544
BuySellBuyUR
NeutralNeutralNeutralNeutralBuy
NeutralNeutral
97,4757,556
140,5167,8389,915
14,9165,061
257,6852,136
62,412123,655729,165
238,22131,57088,83958,873
417,503
16,592189,60720,12421,676
202,38246,49737,7482,572
25,72295,139
658,059
20,0306,7189,450
15,00220,688
15.723.810.013.617.50.1
16.416.512.021.911.014.3
3.711.117.56.67.4
‐10.96.5
‐21.35.5
11.918.12.3
79.21.48.97.2
13.08.03.8
18.210.0
5.25.94.82.78.04.41.76.4‐7.62.01.84.6
3.57.15.53.24.1
17.2‐8.7‐8.147.35.2‐0.362.874.0‐8.216.54.2
‐1.836.718.70.2
‐31.0
22,7451,424
37,552725
2,0272,231958
72,699421
9,37427,923
178,080
85,11913,56432,30921,235
152,227
3,93747,4377,309
14,47642,70440,097
5621,1854,972
25,580188,259
2,4641,0682,5723,1911,370
2.640.09.1
‐12.820.3‐9.80.9
14.211.81.09.59.7
10.315.029.014.014.8
4.110.8‐19.39.9
30.719.0‐1.5
440.415.546.319.3
12.59.6
36.86.9
12.3
8.812.10.6
110.713.510.7‐4.72.9
‐11.10.91.43.2
5.71.55.47.55.5
‐12.7‐12.1‐18.066.0‐6.8‐0.230.6LP
‐12.335.40.7
‐5.1127.937.30.2
‐14.2
18,5501,082
30,132421
1,5281,857670
56,849252
5,97822,426
139,745
13,4395,3579,9191,565
30,281
1,71742,5422,6127,290
23,72313,298
560‐2,1643,2064,067
96,853
755666
1,7812,859556
1.041.44.4
‐17.118.16.2‐2.612.421.0‐5.26.67.2
21.215.836.2‐4.322.9
13.75.9
‐24.32.7
17.111.728.0Loss‐0.363.08.7
‐13.09.4
38.79.2
70.9
10.229.7‐2.7
‐16.418.74.5
‐11.8‐3.7
‐15.726.7‐1.40.0
7.1‐3.95.3
1638.79.6
‐39.40.6
‐19.7158.4‐14.8‐5.9‐0.7Loss‐28.894.9‐1.3
2.3163.940.7‐2.4
‐19.0
42044617662
BuyBuyUR
Neutral
5584219820
138139697
38874
BuyBuy
NeutralNeutralBuyBuyBuyBuyBuy
Neutral
2691,0574341,674248
BuyBuy
NeutralNeutralBuy
July 2015 79
India Strategy | Getting on track!
Ready reckoner: quarterly performanceSector CMP
(INR)30.06.15
Reco
Sales (INR m)Var % Var %
Jun‐15YoY QoQ
3,8412,7122,0041,7453,13717,0871,715
‐9.6‐3.119.120.435.010.027.0
‐1.12.36.60.844.1‐16.39.7
EBDITA (INR m)Var % Var %
Jun‐15YoY QoQ
3468081,1894804332,207454
‐25.37.220.3‐2.550.010.033.7
4.51.95.6‐11.4311.9‐21.37.3
Net Profit (INR m)Var % Var %
Jun‐15YoY QoQ
434441,104489141418349
‐75.820.337.120.6208.7105.824.2
‐15.6‐8.98.8‐41.0LP
‐59.3‐25.9
OthersDynamatic Tech. 2,934 BuyGateway Distriparks 343 BuyGujarat Pipavav 218 BuyInfo Edge 855 BuyInox Leisure 177 BuyJain Irrigation 67 BuyJust Dial 1,267 Buy

7/24/2015 India Strategy: Getting on track!– Detailed Report
http://www.motilaloswal.com/site/rreports/HTML/635721163512170886/index.htm 82/85
8,7653,01815,5093,70030,6555,255
171,031
6.014.015.310.011.210.011.0
2094.3347.8‐28.729.3‐15.419.0‐4.4
2,4549752,5374636,061409
29,479
5.617.722.312.716.01.014.0
2805.9LP‐37.9151.8‐22.815.94.2
2,3958868762933,182246
17,483
3.924.833.510.521.610.318.4
18077.3LP‐57.0213.3‐29.522.36.0
Kaveri Seed 736 NeutralMonsanto India 2,818 BuySintex Inds. 100 BuyTTK Prestige 3,888 BuyUPL 535 BuyV‐Guard Inds 897 NeutralSector AggregatePL: Profit to Loss; LP: Loss to Profit
Sector
(INR m)
FinancialsPrivate BanksAxis BankDCB BankFederal BankHDFC BankICICI BankIndusInd BankKotak Mahindra BankYes Bank
Pvt Sector AggregatePSU BanksBank of BarodaBank of IndiaIndian BankPunjab National BankState BankUnion Bank
PSU Sector AggregateNBFCBajaj FinanceDewan HousingHDFCIDFCIndiabulls HousingLIC Housing FinM & M FinancialPower Finance CorpRepco Home FinRural Electric. Corp.Shriram Transport Fin.
NBFC Sector AggregateSector Aggregate
CMP Net Interest Income
Jun‐15Var % Var %YoY QoQ
Operating Profit
Jun‐15Var % Var %YoY QoQ
Net Profit
Jun‐15Var % Var %YoY QoQ
(INR)Reco.
30.06.15
559Buy130Buy148Buy
1,067Buy308Buy872Buy
1,388Neutral843Buy
38,6271,3966,37162,84651,4689,79216,83110,401
197,731
33,12528,64111,38040,185138,11721,129
272,578
9,4253,952
20,1566,8955,5466,2517,800
25,438657
21,76511,449
120,300590,609
16.70.412.921.514.622.314.939.6
18.5
‐0.56.66.2‐8.24.2‐0.2
1.6
26.720.515.51.116.023.514.711.123.814.818.3
16.09.6
1.77.62.24.51.35.83.46.5
3.1
4.40.62.76.0‐6.1‐0.4
‐1.8
15.38.2
‐14.47.6
‐31.2‐3.8
‐11.70.0‐0.8‐1.15.5
‐3.1‐0.5
34,7077284,32346,21751,0438,70911,0568,933
165,716
24,22520,7937,50928,13192,03112,578
185,267
5,5172,977
20,0698,8607,0465,9354,851
24,236562
21,4708,444
110,933461,915
19.9‐10.523.020.213.016.212.941.3
17.9
‐2.30.917.9‐10.04.7‐8.3
0.4
36.720.32.46.531.519.35.2
13.618.915.114.1
14.19.4
‐13.57.0‐7.8‐2.1‐6.72.4‐5.5‐4.7
‐6.4
‐10.145.8‐8.1‐12.2‐25.8‐23.9
‐16.6
20.44.1
‐25.85.5‐6.03.0
‐24.6‐2.2‐3.52.45.3
‐5.1‐10.5
19,6544332,52426,81229,6405,2266,4295,577
96,296
7,6704,0742,1525,88333,8193,463
57,062
17.9‐3.214.620.111.624.112.229.2
16.8
‐43.7‐49.43.9‐58.11.0‐47.8
‐26.8
‐9.9‐31.2‐10.0‐4.51.45.5‐4.01.2
‐3.4
28.2LP4.491.9‐9.6‐22.0
8.9
13.96.8
‐26.8‐9.2‐4.12.7
‐41.02.3
‐15.427.20.6
‐2.3‐0.2
144Neutral171Neutral141Buy139Buy263Buy147Buy
5,457Buy421Buy
1,296Buy148Buy622Buy452Buy280Buy256Buy644Buy275Buy852Buy
2,631 24.51,734 17.9
13,635 1.43,471 ‐27.95,284 24.73,883 20.51,965 26.9
16,262 6.5329 17.5
14,247 9.23,185 3.9
68,024 8.8221,381 ‐0.7
July 2015 80
India Strategy | Getting on track!
Ready reckoner: valuations
Sector /Companies
AutomobilesAmara Raja Batt.Ashok LeylandBharat ForgeBajaj AutoEicher MotorsExide Inds.Hero MotocorpMahindra & Mahindra
CMP(INR)
Reco. EPS (INR)FY15 FY16E FY17E
24.30.8
31.5105.3227.1
6.4127.247.8
30.63.5
43.3129.0387.6
8.2144.273.2
42.86.2
58.6168.7680.7
9.0176.297.8
PE (x)FY15 FY16E FY17E
36.288.233.824.186.223.119.826.8
28.820.724.619.750.518.017.517.5
20.611.718.115.028.816.414.313.1
EV/EBIDTA (x)FY15 FY16E FY17E
19.320.321.411.837.614.415.95.9
16.010.213.212.326.99.4
12.25.1
11.76.3
10.19.7
15.08.2
10.24.0
ROE (%)FY15 FY16E FY17E
27.24.9
24.030.026.913.541.915.9
27.518.326.432.737.115.340.316.5
30.527.528.936.746.315.041.217.8
882Buy73Buy
1,063Buy2,536Buy
19,578Buy148Buy
2,524Buy1,281Neutral

7/24/2015 India Strategy: Getting on track!– Detailed Report
http://www.motilaloswal.com/site/rreports/HTML/635721163512170886/index.htm 83/85
Maruti SuzukiTata MotorsTVS MotorSector Aggregate
Capital GoodsABBBHELBharat ElectronicsCrompton GreavesCummins IndiaHavells IndiaLarsen & ToubroSiemensSolar Inds.ThermaxVa Tech WabagVoltas
Sector Aggregate
CementACCAmbuja CementsBirla CorporationDalmia BharatGrasim IndustriesIndia CementsJ K CementsJaiprakash AssociatesJK Lakshmi Cem.Orient CementPrism CementRamco CementsShree CementUltratech CementSector Aggregate
ConsumerAsian PaintsBritanniaColgateDaburEmamiGodrej ConsumerGSK ConsumerHind. UnileverITC
July 2015
125.543.67.3
187.450.110.8
242.460.016.4
32.010.033.320.9
122.740.823.055.335.734.136.8
155.243.149.039.830.8
41.9
31.426.918.0
520.818.1
‐37.3‐2.027.218.155.333.3
113.540.744.4
50.957.849.545.953.747.545.152.426.0
21.58.7
22.615.9
90.820.620.423.333.529.734.188.132.635.727.026.4
32.4
31.633.536.318.217.134.438.6
‐166.552.217.444.020.667.838.632.7
39.941.941.837.347.534.236.644.523.3
16.67.2
14.912.4
55.713.917.313.727.123.725.866.827.227.019.520.5
23.9
19.320.810.39.6
11.98.1
11.84.2
13.510.413.814.230.225.518.2
31.435.534.432.135.928.130.437.620.6
14.44.3
22.27.9
48.219.119.219.132.325.916.381.725.426.920.519.6
21.9
21.919.910.618.97.29.4
16.414.116.816.026.314.929.820.716.1
37.032.732.835.340.827.533.635.918.3
11.23.7
14.56.9
40.413.016.213.829.417.620.549.021.621.512.619.5
20.8
18.313.318.27.95.89.0
12.58.3
14.713.614.311.322.419.012.5
26.928.627.230.035.524.026.131.715.7
8.63.2
10.05.6
30.38.0
13.210.224.014.315.942.317.616.110.114.3
15.7
11.28.96.45.84.06.17.17.58.06.87.88.4
14.113.58.6
20.923.821.725.527.719.721.426.013.8
15.723.122.721.6
8.14.4
14.75.5
23.828.412.97.4
21.611.710.716.1
9.8
10.713.46.70.37.60.87.5‐9.811.421.69.89.57.2
11.26.3
20.125.027.922.4
10.48.1
14.710.523.528.013.311.524.014.814.016.6
11.6
10.59.33.38.27.52.27.7‐0.15.8
19.211.613.911.210.87.5
21.922.733.223.5
15.211.015.315.426.529.815.113.523.717.317.118.6
14.1
16.811.110.814.09.88.5
21.04.6
20.226.829.817.721.814.612.2
4,023Buy435Buy244Buy
1,323Neutral248Buy
3,362Buy162Buy895Buy282Buy
1,783Buy1,351Sell3,703Buy1,048Buy740Buy315Buy
10.8 14.6 23.76.1 12.0 17.9
145.9 164.7 194.12.9 7.0 11.9
25.1 26.7 33.08.3 9.5 11.9
48.4 52.2 69.18.7 15.3 20.2
85.9 113.6 136.221.4 29.4 38.818.6 27.4 38.010.2 11.9 15.4
1,441Buy230Neutral410Buy588Buy
3,442Buy94Neutral
666Buy11Buy
346Buy172Neutral109Buy339Buy
11,324Buy2,991Buy
45.9 45.6 74.68.5 6.8 11.0
22.8 11.3 39.61.1 32.3 61.3
190.5 200.7 289.00.0 2.7 11.7
17.9 17.3 56.2‐5.6 ‐0.1 2.712.7 6.6 25.79.5 9.9 16.52.0 2.5 8.0
10.2 16.5 23.999.8 167.1 375.373.4 77.5 117.4
754Buy2,763Buy2,034Neutral280Neutral
1,160Buy1,231Neutral6,257Neutral916Neutral315Neutral
14.8 18.9 24.047.8 66.0 77.941.1 48.6 59.16.1 7.5 8.7
21.6 24.4 32.325.9 36.0 43.8
138.8 171.0 206.017.5 20.6 24.412.1 13.5 15.3
32.4 35.2 37.561.9 62.4 54.088.0 92.8 99.935.9 35.7 33.845.3 41.5 45.820.4 24.2 24.829.6 31.0 31.6
108.1 116.6 133.434.8 34.9 35.6
81
India Strategy | Getting on track!
Ready reckoner: valuations
Sector /Companies
ConsumerJyothy LabsMaricoNestlePidilite Inds.Radico KhaitanUnited SpiritsSector Aggregate
CMP(INR)
Reco. EPS (INR)FY15 FY16E FY17E
4.4 9.1 8.28.9 10.8 13.4
130.2 116.0 145.310.2 13.6 15.85.7 6.2 7.5
‐47.2 41.4 62.3
PE (x)FY15 FY16E FY17E
66.850.648.754.114.3‐71.543.1
32.141.754.740.613.281.535.0
35.533.543.734.810.854.129.6
EV/EBIDTA (x)FY15 FY16E FY17E
35.128.631.939.110.974.228.2
25.627.031.526.38.7
44.524.0
21.321.625.722.47.2
33.620.1
ROE (%)FY15 FY16E FY17E
16.633.548.223.18.6
‐21.733.2
26.431.040.125.98.9
16.836.0
22.432.651.826.010.120.937.3
292Buy450Neutral
6,346Neutral551Neutral82Buy
3,372Buy

7/24/2015 India Strategy: Getting on track!– Detailed Report
http://www.motilaloswal.com/site/rreports/HTML/635721163512170886/index.htm 84/85
HealthcareAlembic PharmaAurobindo PharmaBioconCadila HealthCiplaDivis LabsDr Reddy’ s LabsGlenmark PharmaGSK PharmaIPCA Labs.LupinSanofi IndiaSun PharmaTorrent PharmaSector Aggregate
MediaD B CorpDen NetworksDish TVHathway CableHindustan MediaHT MediaJagran PrakashanPVRSiti CableSun TVZee Entertainment
Sector Aggregate
MetalsHindalcoHindustan ZincJSPLJSW SteelNalcoNMDCSAILTata SteelVedantaSector Aggregate
Oil & GasBPCLCairn IndiaGAIL
44.226.122.930.841.929.227.356.753.335.835.341.146.329.337.0
22.622.218.523.328.724.523.730.246.028.130.736.934.223.728.8
23.117.616.419.022.519.820.223.142.518.925.528.423.020.722.3
21.715.213.920.826.619.917.720.744.816.626.221.425.721.222.8
12.025.113.221.06.86.49.4
16.625.010.224.5
14.8
9.35.1
10.37.33.84.3
10.78.14.86.8
7.92.6
13.1
16.615.611.015.616.617.215.217.640.115.819.721.120.815.318.2
9.67.2
12.611.44.33.07.7
13.711.25.5
23.7
11.3
8.06.0
13.07.53.27.2
14.77.45.37.5
7.82.7
10.9
16.412.39.6
13.013.413.712.813.333.012.616.316.115.013.514.4
7.97.98.06.63.01.96.99.39.54.7
17.0
8.7
6.34.8
12.16.61.56.99.75.24.46.0
7.41.99.1
36.336.412.330.811.026.419.915.823.112.030.413.320.234.219.8
26.0‐7.4NA
‐17.420.99.9
21.73.4
‐55.921.831.3
13.9
12.420.13.08.09.4
20.84.81.3
17.29.9
23.012.010.8
49.931.513.833.714.026.919.223.133.913.627.314.021.333.021.2
25.94.2NA‐3.419.47.5
22.04.86.3
23.728.1
18.5
7.913.7‐11.23.97.5
15.7‐1.011.012.26.3
22.76.4
10.5
35.329.814.031.815.428.618.922.837.017.726.116.926.130.422.4
28.01.1NA
11.718.68.3
21.810.66.1
25.530.7
22.3
15.013.8‐10.7
6.49.6
11.22.0
26.510.18.6
21.25.6
11.7
663Buy1,450Buy461Sell
1,797Buy616Neutral
1,876Neutral3,551Buy994Buy
3,325Neutral710Neutral
1,887Buy3,516Neutral874Buy
1,299Buy
15.0 29.3 28.755.4 65.2 82.520.1 25.0 28.158.3 77.2 94.614.7 21.4 27.464.1 76.4 95.0
130.2 149.9 176.117.5 32.9 43.062.4 72.3 78.219.8 25.3 37.653.5 61.4 74.085.5 95.2 123.918.9 25.6 37.944.4 54.8 62.7
338Buy142Neutral106Buy49Buy
211Buy92Neutral
118Buy633Buy35Buy
282Not Rated367Buy
17.2‐8.10.0‐2.919.28.57.23.3‐1.618.710.2
19.34.52.2‐0.621.77.28.36.10.2
21.911.4
23.61.36.52.1
25.18.79.3
18.40.3
25.815.2
19.6 17.5 14.3‐17.5 31.2 110.5
‐ 47.8 16.4‐17.1 ‐83.8 23.211.0 9.7 8.410.9 12.9 10.616.3 14.2 12.7
189.4 104.1 34.3‐21.8 145.8 139.915.1 12.9 10.936.0 32.3 24.1
39.4 25.9 18.2
8.38.7
12.411.78.87.1
12.0106.6
8.69.7
13.27.6
16.6
13.411.4‐3.723.210.512.1‐58.714.710.014.6
11.68.9
15.6
6.410.3‐4.414.07.8
11.529.75.3
10.210.1
10.89.7
13.0
112Buy167Buy86UR
872Buy40Buy
119Sell61Sell
305Buy174Neutral
13.519.26.9
74.54.6
16.65.12.9
20.3
8.314.7‐22.937.53.89.8‐1.020.717.4
17.616.2‐19.462.15.1
10.32.1
57.217.0
877Buy182Neutral392Neutral
66.523.923.6
75.620.525.2
81.018.730.2
July 2015 82
India Strategy | Getting on track!
Ready reckoner: valuations
Sector /Companies
Oil & GasGujarat State PetronetHPCLIndraprastha GasIOCMRPLOil IndiaONGCPetronet LNG
CMP(INR)
Reco. EPS (INR)FY15 FY16E FY17E
6.480.631.313.4‐9.841.820.810.0
8.4 9.585.4 93.731.2 35.844.7 49.913.6 13.160.0 69.332.3 39.210.3 12.5
PE (x)FY15 FY16E FY17E
18.79.0
13.428.8‐7.710.714.918.7
14.28.5
13.48.65.57.59.6
18.1
12.67.8
11.77.75.76.47.9
14.9
EV/EBIDTA (x)FY15 FY16E FY17E
8.57.27.4
15.6‐6.39.24.99.8
8.07.37.16.84.25.94.2
10.7
7.36.86.06.04.64.93.88.8
ROE (%)FY15 FY16E FY17E
12.517.622.64.7
‐27.611.710.016.7
12.317.219.214.538.015.614.313.2
12.517.119.014.428.516.615.814.4
119Neutral729Buy418Neutral385Buy75Neutral
447Buy310Buy187Neutral
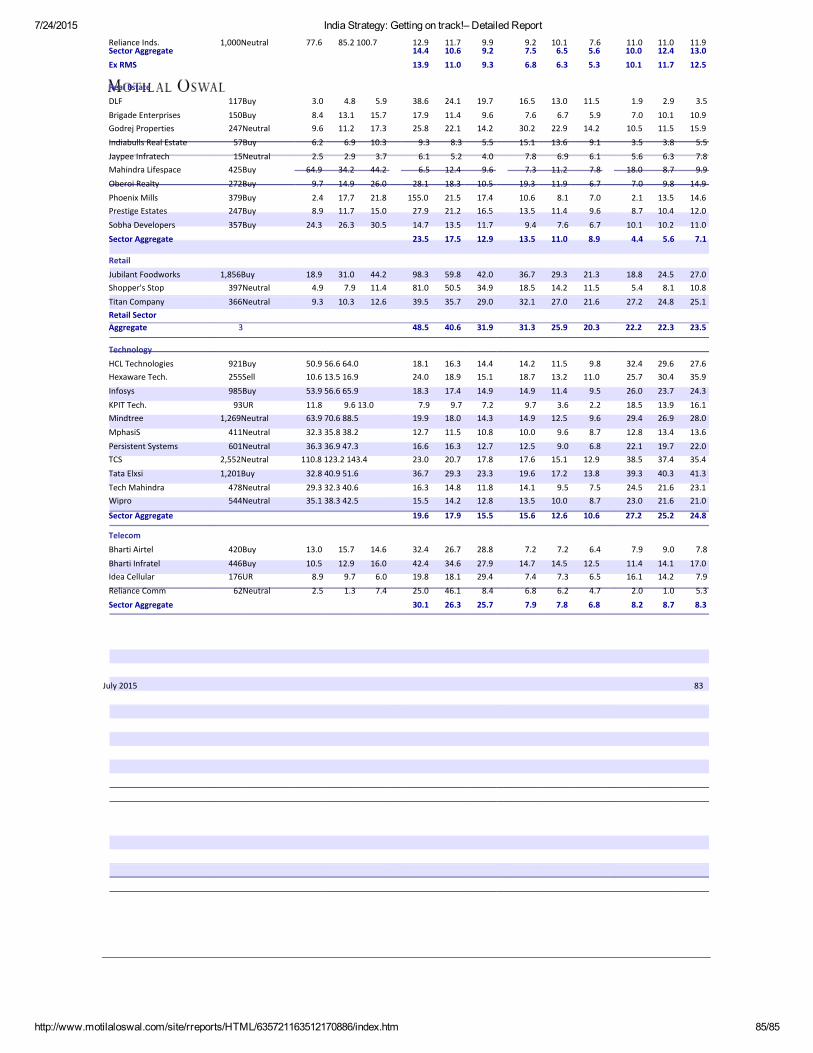
7/24/2015 India Strategy: Getting on track!– Detailed Report
http://www.motilaloswal.com/site/rreports/HTML/635721163512170886/index.htm 85/85
Reliance Inds.Sector AggregateEx RMS
Real EstateDLFBrigade EnterprisesGodrej PropertiesIndiabulls Real EstateJaypee InfratechMahindra LifespaceOberoi RealtyPhoenix MillsPrestige EstatesSobha DevelopersSector Aggregate
RetailJubilant FoodworksShopper's StopTitan CompanyRetail SectorAggregate
TechnologyHCL TechnologiesHexaware Tech.InfosysKPIT Tech.MindtreeMphasiSPersistent SystemsTCSTata ElxsiTech MahindraWipro
Sector Aggregate
TelecomBharti AirtelBharti InfratelIdea CellularReliance CommSector Aggregate
77.6 85.2 100.7 12.914.413.9
38.617.925.89.36.16.5
28.1155.027.914.723.5
98.381.039.5
48.5
50.9 56.6 64.010.6 13.5 16.953.9 56.6 65.911.8 9.6 13.063.9 70.6 88.532.3 35.8 38.236.3 36.9 47.3
110.8 123.2 143.432.8 40.9 51.629.3 32.3 40.635.1 38.3 42.5
18.124.018.37.9
19.912.716.623.036.716.315.5
19.6
32.442.419.825.030.1
11.710.611.0
24.111.422.18.35.2
12.418.321.521.213.517.5
59.850.535.7
40.6
16.318.917.49.7
18.011.516.320.729.314.814.2
17.9
26.734.618.146.126.3
9.99.29.3
19.79.6
14.25.54.09.6
10.517.416.511.712.9
42.034.929.0
31.9
14.415.114.97.2
14.310.812.717.823.311.812.8
15.5
28.827.929.48.4
25.7
9.27.56.8
16.57.6
30.215.17.87.3
19.310.613.59.4
13.5
36.718.532.1
31.3
14.218.714.99.7
14.910.012.517.619.614.113.5
15.6
7.214.77.46.87.9
10.16.56.3
13.06.7
22.913.66.9
11.211.98.1
11.47.6
11.0
29.314.227.0
25.9
11.513.211.43.6
12.59.69.0
15.117.29.5
10.0
12.6
7.214.57.36.27.8
7.65.65.3
11.55.9
14.29.16.17.86.77.09.66.78.9
21.311.521.6
20.3
9.811.09.52.29.68.76.8
12.913.87.58.7
10.6
6.412.56.54.76.8
11.010.010.1
1.97.0
10.53.55.6
18.07.02.18.7
10.14.4
18.85.4
27.2
22.2
32.425.726.018.529.412.822.138.539.324.523.0
27.2
7.911.416.12.08.2
11.012.411.7
2.910.111.53.86.38.79.8
13.510.410.25.6
24.58.1
24.8
22.3
29.630.423.713.926.913.419.737.440.321.621.6
25.2
9.014.114.21.08.7
11.913.012.5
3.510.915.95.57.89.9
14.914.612.011.07.1
27.010.825.1
23.5
27.635.924.316.128.013.622.035.441.323.121.0
24.8
7.817.07.95.38.3
1,000Neutral
117Buy150Buy247Neutral57Buy15Neutral
425Buy272Buy379Buy247Buy357Buy
3.08.49.66.22.5
64.99.72.48.9
24.3
4.813.111.26.92.9
34.214.917.711.726.3
5.915.717.310.33.7
44.226.021.815.030.5
1,856Buy397Neutral366Neutral
3
921Buy255Sell985Buy93UR
1,269Neutral411Neutral601Neutral
2,552Neutral1,201Buy478Neutral544Neutral
18.94.99.3
31.07.9
10.3
44.211.412.6
420Buy446Buy176UR62Neutral
13.010.58.92.5
15.712.99.71.3
14.616.06.07.4
July 2015 83