interim report 2017 中期報告 - 馬鞍山鋼鐵股份有限公司 · 6 6.2 major financial...
TRANSCRIPT
Interim Report 2017 中
期報告

Maanshan Iron & Steel Company Limited
2017 InterimReport
1
Content
I. DEFINITIONS 2
II. COMPANY INTRODUCTION AND MAJOR FINANCIAL INDICATORS 4
III. OVERVIEW OF THE COMPANY’S BUSINESS 8
IV. DISCUSSION AND ANALYSIS ON OPERATION 11
V. SIGNIFICANT EVENTS 29
VI. MOVEMENTS IN SHARE CAPITAL AND SHAREHOLDERS 38
VII. DIRECTORS, SUPERVISORS AND SENIOR MANAGEMENT 42
VIII. FINANCIAL STATEMENTS 43
IX. DOCUMENTS AVAILABLE FOR INSPECTION 230
Important Notice
1. The board of directors (the “Board”), the supervisory committee, the directors, the
supervisors and senior management of the Company warrant that there are no false
representations or misleading statements contained in, or material omissions from, this
report, and jointly and severally accept full responsibility for the truthfulness, accuracy and
completeness of the information contained in the interim report.
2. All members of the Board attended the board meeting.
3. The interim report of the Company is unaudited but reviewed by the Audit Committee of the
Company.
4. Mr. Ding Yi, representative of the Company, Mr. Qian Haifan, person overseeing the
accounting operations, and Mr. Xing Qunli, head of Accounting Department, make
representations in respect of the truthfulness, accuracy and completeness of the financial
statements contained in the interim report.
5. The Company had no profit distribution plan or plan for the capitalization of capital reserve
during the reporting period.
6. Forward-looking statements, including future plans, contained in this report do not
constitute any substantive commitments to investors by the Company. Investors should be
aware of the relevant risks.
7. No appropriation of fund on a non-operating basis by the controlling shareholder or its
related parties was found during the reporting period.
8. There was no violation of regulations, decisions or procedures in relation to provisions of
external guarantees during the reporting period.
9. The report analyzes major risks faced by the Company. Please refer to “(3) Potential risks” of
“2. Other Disclosures” of “IV. Discussion and Analysis on Operation”
Content
Maanshan Iron & Steel Company Limited
2017 InterimReport
2
I. Definitions
In this report, unless the context otherwise requires, the following terms have the following meanings:
Definitions of common terms
The Company and Magang means Maanshan Iron and Steel Company Limited
The Group means the Company and its subsidiaries
The Group Company means Magang (Group) Holding Company Limited
Board of Directors or the Board means the board of directors of the Company
Directors means the directors of the Company
Supervisory Committee means the supervisory committee of the Company
Supervisors means the supervisors of the Company
Senior Management means the senior management of the Company
Hong Kong Stock Exchange means the Stock Exchange of Hong Kong Limited
SSE means Shanghai Stock Exchange
A Shares means the ordinary shares in the share capital of the Company with a
nominal value of RMB1.00 per share, which are listed on the
SSE, and subscribed for and traded in RMB
H Shares means The foreign shares in the share capital of the Company with a
nominal value of RMB1.00 per share, which are listed on the
Hong Kong Stock Exchange, and subscribed for and traded in
Hong Kong dollars
SD&C Shanghai Branch means Shanghai Branch of China Securities Depository and Clearing
Corporation Limited
PRC means the People’s Republic of China
Hong Kong means the Hong Kong Special Administrative Region
RMB means Renminbi
CSRC means China Securities Regulatory Commission
CBRC means China Banking Regulatory Commission
MIIT means The Ministry of Industry and Information Technology of the
People’s Republic of China
CISA means China Iron and Steel Association
I. Definitions

Maanshan Iron & Steel Company Limited
2017 InterimReport
3
CRCC means China Railway Test & Certification Center
The Articles of Association means The articles of association of Maanshan Iron and Steel Company
Limited
Environmental Protection
Company; Xinchuang
Environmental Protection
means Anhui Xinchuang Energy Saving and Environment Protection
Science and Technology Company, Limited, a controlling
subsidiary of the Group Company, and an investee subsidiary of
the Company
Magang Investment Limited means Magang Group Investment Limited, a wholly owned subsidiary of
the Group Company
Masteel Financial means Magang Group Finance Co.Ltd., a controlling subsidiary of the
Company
Hefei Company; Ma Steel Hefei
Iron & Steel
means Ma Steel (Hefei) Iron & Steel Co., Ltd., a controlling subsidiary of
the Company
Changjiang Steel means Anhui Changjiang Steel Co.,Ltd., a controlling subsidiary of the
Company
Rail Transportation Co.; Rail Co. means Magang Rail Transportation Equipment Co. Ltd., a wholly owned
subsidiary of the Company
MG-VALDUNES means MG-VALDUNES S.A.S, a wholly owned subsidiary of the
Company
reporting period means From 1 January 2017 to 30 June 2017

Maanshan Iron & Steel Company Limited
2017 InterimReport
4
II. Company Introduction and Major Financial Indicators
1. COMPANY PROFILE
Statutory Chinese name of the Company 馬鞍山鋼鐵股份有限公司
Statutory Chinese short name of the Company 馬鋼股份
Statutory English name of the Company MAANSHAN IRON & STEEL COMPANY LIMITED
Statutory English short name of the Company MAS C.L.
Legal representative of the Company Ding Yi
2. CONTACT PERSON
Representative for Securities Affairs
Name He Hongyun
Correspondence address No.8 Jiu Hua Xi Road, Maanshan City, Anhui Province, the PRC
Telephone 86-555-2888158/2875251
Fax 86-555-2887284
Email address [email protected]
Note: At the twenty-fifth meeting of the eighth session of the Board of the Company on 14 February 2017, the
resignation of Mr. Hu Shunliang as the Secretary to the Board (Company Secretary) of the Company was
approved. The Board has also resolved that the duties of the Secretary to the Board (Company Secretary)
will be temporarily performed by Mr. Ding Yi, the legal representative and Chairman of the Company. The
Company will appoint a new Secretary to the Board (Company Secretary) as soon as possible.
3. BASIC INFORMATION
Registered address No.8 Jiu Hua Xi Road, Maanshan City, Anhui Province, the PRC
Postal code of the registered address 243003
Office address No.8 Jiu Hua Xi Road, Maanshan City, Anhui Province, the PRC
Postal code of the office address 243003
The Company’s website http://www.magang.com.cn (A Shares);
http://www.magang.com.hk (H Shares)
Email address [email protected]
4. INFORMATION DISCLOSURE AND CHANGES IN LOCATION FOR INSPECTION
Name of newspaper designated
for information disclosure
Shanghai Securities News
Internet website designated by CSRC
for interim report publication
www.sse.com.cn
Location for inspection of interim report of
the Company
The secretariat office of the Board of
Maanshan Iron & Steel Company Limited
II. Company Introduction and Major Financial Indicators

Maanshan Iron & Steel Company Limited
2017 InterimReport
5
5. BRIEF INFORMATION ON THE SHARES OF THE COMPANY
Type of shares
Stock exchange
for listing of shares Short name of stock Stock code
A Shares The Shanghai Stock Exchange Magang Stock 600808
H Shares The Stock Exchange of Hong Kong Limited Maanshan Iron& Steel 00323
6. MAJOR ACCOUNTING DATA AND FINANCIAL INDICATORS
6.1 MAJOR ACCOUNTING DATA
Unit: RMB
Major accounting data
Reporting
period
(January
to June)
Corresponding
period of
the previous
year
Increase/
decrease at
the reporting period
as compared to
the corresponding
period of the
previous year
(%)
Revenue 35,187,579,640 21,001,162,560 67.55
Net profit attributable to owners of the parent 1,643,396,514 452,752,971 262.98
Net profit excluding non-recurring gains or
losses attributable to owners of the parent 1,531,119,148 469,788,228 225.92
Net cash flows from operating activities 1,459,592,056 527,215,501 176.85
As at
the end of
the reporting
period
As at
the end of
previous year
Increase/
decrease at
the end of
the reporting period
as compared
over the end of
the previous year
(%)
Net assets attributable to
owners of the parent 21,426,635,020 19,764,171,955 8.41
Total assets 66,223,275,209 66,245,531,030 –0.03

II. Company Introduction and Major Financial Indicators (Continued)
Maanshan Iron & Steel Company Limited
2017 InterimReport
6
6.2 MAJOR FINANCIAL INDICATORS
Major Financial Indicators
Reporting
period
(January
to June)
Corresponding
period of
the previous
year
Increase/
decrease at
the reporting period
as compared to
the corresponding
period of the
previous year
(%)
Basic earnings per share (RMB/share) 0.213 0.059 261.02
Diluted earnings per share (RMB/share) 0.213 0.059 261.02
Basic earnings per share excluding
non-recurring gains or losses (RMB/share) 0.199 0.061 226.23
Return on net assets (weighted average) (%)
7.98 2.42
Increased by
5.56 percentage
points
Return on net assets excluding non-recurring
gains or losses (weighted average) (%)
7.44 2.51
Increased by
4.93 percentage
points

Maanshan Iron & Steel Company Limited
2017 InterimReport
7
7. DIFFERENCES ON ACCOUNTING DATA UNDER ACCOUNTING POLICIES IN DOMESTIC AND ABROAD
□ Applicable ✔ Not applicable
8. NON-OPERATING ITEMS AND AMOUNT
Unit: RMB
Non-operating items Amount
Gains/(losses) from disposal of non-current assets –42,907,112
Government grants recognized in current gains/losses
(excluding those having close relationship with the Company’s normal business,
conforming to the national policies and regulations and enjoying ongoing
fixed amount or quantity according to certain standard) 68,914,690
Government grants related to the Company’s normal business 83,563,376
Employee termination benefits –46,825,916
In addition to effective hedging business related to normal operations of
the Company, changes in fair value of trading financial assets and
trading financial liabilities held, as well as the return on
investment generated from the disposal of trading financial assets,
trading financial liabilities and available-for-sale financial assets 57,402,823
Reversal of provision for trade receivables assessed for impairment individually 1,207,196
Non-operating income and expenses other than the above items –6,603,579
Investment income from disposal of a subsidiary 736,943
Impact of minority interests –734,663
Impact of income tax –2,476,392
Total 112,277,366

Maanshan Iron & Steel Company Limited
2017 InterimReport
8
III. Overview of the Company’s Business
1. INTRODUCTION OF THE COMPANY’S MAJOR BUSINESSES AND OPERATION MODEL AND INDUSTRY PERFORMANCE DURING THE REPORTING PERIOD
As one of the largest iron and steel producers and sellers in China, the Company’s major businesses
are production and sales of iron and steel products; the main production processes include iron
making, steelmaking, steel rolling, etc. Major products of the Company is steel, which can be roughly
divided into three types, i.e. plates, long products and wheels and axles.
Plates: Major products include thin plate and medium plates. Thin plates can be
further categorized into hot and cold-rolled thin plates, galvanized plates and
coil-coating plates. Hot-rolled thin plates are mostly used in the construction,
automobi le , br idge-bu i ld ing, machinery bus inesses and pet ro leum
transportation, while cold-rolled thin plates are used in high-grade light
industries, home electrical appliances, and medium and high-grade production
of automobile parts. Galvanized plates are positioned to be used as
automobile plates, home electrical appliances plates, high-grade construction
plates, and plates for businesses like packaging and utensil manufacturing.
Coil-coating plates can be used in both interior and exterior of construction
projects, home electrical appliances and steel windows. Standards adopted
by thin plate products of the Company include GB, the national standard of
the PRC, Japan’s JIS standard, Germany’s DIN standard and the US ASTM
standard. Medium plates are widely used in boilers, pressurized utensils, ship-
building, container manufacturing, and so forth. Plates used for building ship
structures have been endorsed by certificates issued by six ship classification
societies from China, the United Kongdom, Germany, the United States,
France and Norway.
III. Overview of the Company’s Business

Maanshan Iron & Steel Company Limited
2017 InterimReport
9
Long Products: Major products include section steel and wire rod. Major products include
section steel and wire rod. H-shaped steel is mostly used in construction,
steel structures, machinery manufacturing and the construction of petroleum
drilling platforms and railways. It has been awarded the “ Golden Cup Prized
of Quality Metal Products” and has been hailed as a “Reliable and Reputable
Construction Material Brand Name Product” by the China Construction
Materials Enterprise Management Association and selected in the Catalog
of China’s Top Brands by the China Promotion Commission for Top Brand
Strategy. The Company owns the core technology and patent of the shock
and fire resistant H-shaped steel for construction. The H-shaped steel
products have been certified under the Japanese JIS standards, Korean
KS standards, European Union CE mark, Russian and Kazakhstan’s GOST
standards, Thai TISI standards, Indonesian SNI standards, Malaysian SIRIM
standards and China Metallurgical Products. Common medium-shaped steel
is mostly used in construction structures, machinery manufacturing and steel
structures used in shipbuilding. It has also been awarded the “Golden Cup
Prize of Quality Metal Products”. The stable corten steel has passed the on-
site review of China Railways Product Certification Center (“CRCC”). High-
speed wire rod products are mostly used in the production of robust materials,
pre-stressing strand steel wires and spring steel wires, and are occasionally
used in construction materials. The Company owns the core technology
and patent of the high-efficiency, low-cost cold-forged steel with wire-
softening treatment. Hot-rolled reinforced steel used in armored concrete is
mainly used in construction. It has been acclaimed “The First Lot of Quality
Products Exempted from Inspection” by the General Administration of Quality
Supervision, Inspection and Quarantine of the PRC, and has been hailed as
a “Reliable and Reputable Construction Material Brand Name Product” by
the China Construction Materials Enterprise Management Association. It has
also been endorsed by the registered BS standards in Hong Kong. Hot-rolled
reinforcing steel and hot-rolled wire rods have been endorsed by the quality
control system certification and product certification of the UK Certification
Authority for Reinforcing Steels (CARES).

III. Overview of the Company’s Business (Continued)
Maanshan Iron & Steel Company Limited
2017 InterimReport
10
Wheels and axles: Major products include train wheels, axles and rings, which are widely used
in railway transport, port machinery, petrochemical industries, aerospace
industry, and so forth. Train wheel products are bestowed the honor of
“Famous Brand of China”. The Company owns the core technology and
patent of train wheels used for high-speed railroads. High-speed wheels
of standardized electric multiple units have passed the CRCC product
certification and obtained the first CRCC certification in China. The production
quality assurance system for train wheels is accredited with authoritative
certifications including the ISO9001: 2008 quality system, International
Railway Industry Standard, the AAR issued by the North American Railway
Committee, RISAS issued by British Rail, European Union Railway TSI, EN and
so forth.
During the reporting period, the major businesses, main products and the usage, operation modes,
major driving factors of performance did not experience substantial change.
2. DURING THE REPORTING PERIOD, THERE WAS NO MATERIAL CHANGE IN THE COMPANY’S ASSETS.
3. DURING THE REPORTING PERIOD, THERE WAS NO MATERIAL CHANGE IN THE COMPANY’S CORE COMPETITIVENESS.

Maanshan Iron & Steel Company Limited
2017 InterimReport
11
IV. Discussion and Analysis on Operation
1. DISCUSSION AND ANALYSIS ON OPERATION
1. THE MACRO ENVIRONMENT FOR PRODUCTION AND OPERATION
During the period under review, China’s national economic performance remained steady
and showed improvement. GDP grew by 6.9%, up 0.2 percentage point compared with
corresponding period of the previous year. As the growth rate of major downstream steel using
industries such as automobiles, electrical appliances and equipment increased, the demand
for steel improved while the State intensively pushed forward the resolution of iron and steel
overcapacity, which achieved significant results in particularly the ban on ground steel strip.
All these had led to the relief of oversupply contradiction of steel and the rise of steel price.
During the first half of the year, the average composite price index for domestic steel products
was 99.79 points, representing an increase of 31.5% compared with last year which was
75.88 points. The consolidated price index for domestic steel products as at the end of June
was 101.13 points, up 47.23% compared with corresponding period of the previous year, and
up 1.63% compared with the end of last year. According to China Iron and Steel Association
(CISA), member companies posted an average profit margin of 3.04% in the first half of this
year, indicating a year-on-year improvement, but it was still at a relatively low level in the
industrial sector.
As for raw materials and fuels, iron ore price rose and remained in overall high level in the
second quarter following a fall in the first quarter. According to China Customs, during January
to May this year, average price of imported iron ore rose approximately 64.8% year-on-year.
Coke prices remained high and volatile. In general, raw materials prices increased sharply year-
on-year during the period.
As for imports and exports, according to CISA, exported steel products during the first half of
2017 amounted to 40,990,000 tonnes, a decrease of 28.24% as compared with corresponding
period of the previous year, while imported steel products amounted to 6,800,000 tonnes,
an increase of 5.26% as compared with corresponding period of the previous year. The
accumulated net export of equivalent crude steel amounted to 35,610,000 tonnes, a decrease
of 32.24% as compared with corresponding period of the previous year.
2. PRODUCTION AND OPERATION OF THE COMPANY
During the reporting period, the Company adhering to the strategy of unswervingly deepening
reforms and strengthening branding, the Company actively seized the opportunities to develop
markets, adjust structures, stabilize production, reduce cost, intensify management, improve
efficiency, promote branding and transformation, emerging from the supply-side structural
reform policies pushed forward by the State. Riding on the encouraging momentum from the
second half of 2016, the production and operation achieved a fairly good operating result.
IV. Discussion and Analysis on Operation

IV. Discussion and Analysis on Operation (Continued)
Maanshan Iron & Steel Company Limited
2017 InterimReport
12
During the reporting period, the Company’s main work included:
• Lean manufacturing was intensively pushed forward. The iron-making system achieved
stable production of blast furnace; the steel rolling system controlled the ratio of iron and
steel, improved products quality and supported orders deliveries. During the reporting
period, the Group produced 9,320,000 tonnes of pig iron, 9,970,000 tonnes of crude
steel, 9,430,000 tonnes of steel products, representing an increase of 10.56%, 11.77%
and 11.33%, respectively, compared with corresponding period of the previous year (in
which the Company produced 7,310,000 tonnes of pig iron, 7,840,000 tonnes of crude
steel and 7,330,000 tonnes of steel products, representing an increase of 10.93%,
11.84% and 11.74%, respectively, compared with corresponding period of the previous
year).
• Our purchasing division has actively built the model of “integration of purchase
and supply service” and monitoring system as well as improved the early-warning
mechanism and preventive measures. Our sales division conducted integrated marketing
strategies to strengthen market expansion. We enhanced proportion of high value added
products and brand impact in the regional product markets. During the reporting period,
the Group’s total sales of steel products amounted to 9,450,000 tonnes, among which
4,550,000 tonnes are long products, 4,810,000 tonnes are steel plates and 90,000
tonnes are wheels and axles.
• Deepened product structure adjustment. Seized the trend of price differentiation in the
plates and long products markets to optimize resource allocation and realize higher
production and better efficiency of products with higher return. During the reporting
period, new product development achieved remarkable results with total sales volume
reaching 200,000 tonnes. The newly developed product, gooseneck hot rolled H-beam
for special vehicles, was the first of its kind in the country, while galvanized plates for
vehicles, undersea pipeline steel, and enamel sheet realized batch delivery.
• Leveraging the new honor of the National Quality Award, fully promoted brand
awareness for Magang. Upholding the concept of innovation driven and technological
precedence and guided by customers satisfaction, continuously improved the
effectiveness of quality system operation through active promotion of technology
and innovation and fine-tuning of process management. With product certification
work enhanced, the products were increasingly accepted by high-end users, thereby
expanding the high-end market and strengthening product position.

Maanshan Iron & Steel Company Limited
2017 InterimReport
13
• Practised environmental management philosophy, and achieved green development.
During the reporting period, the Company was named as the Creditworthy Enterprise of
Environmental Protection in Anhui Province and passed the Government’s environmental
inspection.
3. FINANCIAL POSITION AND EXCHANGE RATE RISKS
As of 30 June 2017, the total loans of the Group amounted to RMB13,163 million, including
short-term loans of RMB4,588 million and long-term loans of RMB8,575 million. Except for
foreign currency loans amounting to US$162 million and Euro€40 million, all other loans
were denominated in Renminbi. Among the Renminbi-denominated loans of the Group, loans
amounting to RMB5,254 million carried fixed interest rates and loans amounting to RMB6,507
million carried floating interest rates. Among the foreign currency loans, loans amounting to
US$136 million and Euro€30 million carried fixed interest rates, and US$26 million and Euro€10
million carried floating interest rates. In addition, the Group issued the medium-term note
with a registration amount of RMB4 billion in 2015, and short-term commercial paper with
an amount of RMB2 billion in April 2017. The payment for the short-term commercial paper
with an amount of RMB2 billion issued in August 2016 was completed on 4 August 2017.
The Group’s level of loans and borrowings varies according to the scale of production and
progress of construction projects. The Group had no overdue loans in the reporting period,
except for a short-term bank loans amounting to approximately RMB100 million belonged to a
subsidiary, Maanshan Iron & Steel Company Limited (Shanghai) Trade Co., Ltd. At the end of
the reporting period, the Group’s asset-liability ratio was 63.56%, representing a decrease of
3.11 percentage points from the end of last year.
At present, the Group is financing its capital projects primarily via its own funds. As at the end
of the reporting period, banking facilities available to the Group amounted to approximately
RMB43,393 million in which RMB18,663 million was unutilized.
As of 30 June 2017, the Group’s cash and bank balances amounted to RMB4,833 million
and notes receivable amounted to RMB4,687 million, the majority of which derived from sales
proceeds.
The Group’s import of raw materials was mainly settled in US dollar, while purchase of
equipment and spare parts was settled in Euro or Japanese Yen, and export of products was
settled in US dollar. During the reporting period, the Company’s purchase of equipment in
Europe and Japan was not significant and, as a result, the impact of foreign exchange rate
fluctuations on procurement payment was relatively immaterial.
IV. Discussion and Analysis on Operation (Continued)
Maanshan Iron & Steel Company Limited
2017 InterimReport
14
4. INTERNAL CONTROL AND RISK MANAGEMENT
The Company has an internal auditing system. Our regulatory auditing department audits
and supervises the financial revenue, expenditure and every economic activity of the
Company. Pursuant to the Basic Internal Control Norms for Enterprises jointly issued by
the Ministry of Finance, the CSRC, the National Audit Office, the CBRC and CIRC, the
Company has established an internal control system for every aspect of production, operation
and management, including internal environment, risk assessment, social responsibilities,
information and communication, internal supervision, human resources, funds management,
procurement, asset management, sales, research and development, projects, guarantees,
outsourcing, financial reports, comprehensive budget, contract management and information
systems. We pay extra attention to high-risk areas, e.g. procurement risks, operational risks
and financial risks, risks related to the control over subsidiaries. This system acts as a guideline
for the Company’s operation, helping the Company recognize and control its major risks.
The Board reviewed and approved the 2016 Internal Control Assessment Report on 29 March
2017. The report confirms that the Company implemented an effective internal control related
to financial report over all important aspects pursuant to the Basic Internal Control Norms for
Enterprises and other relevant requirements. The Company appointed Ernst & Young Hua Ming
LLP as our auditor to audit the effectiveness of our internal control related to financial report as
at 31 December 2016 and issued a standard unqualified internal control audit report.
During the reporting period, the Company enhanced control measures to improve the internal
control policy and continued to improve the internal control system to ensure that its internal
control always remains effective.

Maanshan Iron & Steel Company Limited
2017 InterimReport
15
(1) ANALYSIS OF PRINCIPAL OPERATIONS
1. Analysis of the change in items of the financial statements
Unit: RMB
Items
Amount of
the reporting
period
Amount of the
corresponding
period of the
previous year Change
(%)
Revenue 35,187,579,640 21,001,162,560 67.55
Cost of sales 31,308,620,140 18,177,307,489 72.24
Selling expenses 412,156,137 317,938,952 29.63
General and administrative
expenses 670,018,970 1,048,469,131 –36.10
Financial expenses 528,207,382 407,254,444 29.70
Net cash flows from operating
activities 1,459,592,056 527,215,501 176.85
Net cash flows used in
investing activities –2,128,708,572 –589,987,048 –
Net cash flows used in
financing activities –180,321,712 –739,537,353 –
Taxes and surcharges 322,600,519 105,586,947 205.53
Impairment losses 107,667,257 672,332,416 –83.99
Gain on the changes in fair value 14,148,342 3,461,591 308.72
Investment income 286,628,017 78,697,625 264.21
Other income 83,563,376 – –
Non-operating income 70,707,120 140,391,902 –49.64
Non-operating expenses 51,303,121 1,748,742 2,833.72
Income tax expense 337,919,171 62,157,221 443.65
Net profit attributable to owners of
the parent 1,643,396,514 452,752,971 262.98
Net profit or loss attributable to
non-controlling interests 260,737,284 –21,834,635 –
Exchange differences on
translation of foreign operations 9,821,211 39,247,618 –74.98

IV. Discussion and Analysis on Operation (Continued)
Maanshan Iron & Steel Company Limited
2017 InterimReport
16
Reasons for changes in the figures of the above main items in the financial statement are
as follows:
Explanation for the change in revenue: mainly resulting from the price increases of the
steel and the sales volume increase of the steel.
Explanation for the change in cost of sales: mainly resulting from the price increase of
the raw materials and fuels and the sales volume increase of the steel.
Explanation for the change in selling expenses: mainly resulting from the frequent
deliveries caused by the sales increase of the steel and the increase of transportation fee
per unit.
Explanation for the change in general and administrative expenses: mainly resulting
from the decrease of employee termination benefits; and the impact of Value Added Tax
Accounting Treatment Regulations for not including taxes such as real estate tax, land
usage tax, vehicle and vessel usage tax, stamp duty and etc. in this item.
Explanation for the change in financial expenses: mainly resulting from the increase of
foreign exchange loss for the period and the increase of finance costs.
Explanation for the change in net cash flows from operating activities: mainly resulting
from the increase of cash inflows caused by the increase of profit during the reporting
period.
Explanation for the change in net cash flows from investing activities: mainly resulting
from the increase of cash paid by Masteel Financial for investment such as purchasing
financial assets, etc. during the period as compared with corresponding period of the
previous year.
Explanation for the change in net cash flows from financing activities: mainly resulting
from the increase of cash received from borrowings as compared with corresponding
period of the previous year.
Explanation for the change in taxes and surcharges: mainly resulting from the increase
of value-added tax for the reporting period as compared with corresponding period
of the previous year which caused the corresponding increase of surcharges such as
city construction tax, etc.; and the impact of Value Added Tax Accounting Treatment
Regulations for re-categorizing the audition of taxes such as real estate tax, land usage
tax, vehicle and vessel usage tax, stamp duty and etc. from general and administrative
expenses to this item.
Maanshan Iron & Steel Company Limited
2017 InterimReport
17
Explanation for the change in impairment loss: mainly resulting from the more stable
price of steel products and the decrease of provision for inventory impairment during the
reporting period as compared with corresponding period of the previous year.
Explanation for the change in gain on the changes in fair value: mainly resulting from the
change of fair value of fund held by Masteel Financial Co. during the reporting period.
Explanation for the change in investment income: mainly resulting from the increase
in share of profits of associates and joint ventures in this period as compared with
corresponding period of the previous year.
Explanation for the change in other income: mainly resulting from the impact of China
Accounting Standard No. 16 – Government Grants (Revised in 2017) that government
grants related to daily corporate activities are included in this item instead of non-
operating income.
Explanation for the change in of non-operating income: mainly resulting from the impact
of China Accounting Standard No. 16 – Government Grants (Revised in 2017) that
government grants related to daily corporate activities are not included in this item.
Explanation for the change in non-operating expenses: mainly resulting from the increase
in loss of disposed and scrapped fixed assets caused by demolition of equipment for
environmental reasons during the period.
Explanation for change in income tax expense: mainly resulting from the increase of
profitability level of certain subsidiaries during the period.
Explanation for the change in net profit attributable to owners of the parent: mainly
resulting from the increase of gross profit of steel products during the reporting period.
Explanation for the change in net profit or loss attributable to non-controlling intrests:
mainly resulting from the increase of profit of non-wholly owned subsidiaries during the
reporting period as compared with corresponding period of the previous year.
Explanation for the change in exchange differences on translation of foreign operations:
mainly resulting from the appreciation in functional currency of overseas subsidiaries
against Renminbi during the reporting period.

IV. Discussion and Analysis on Operation (Continued)
Maanshan Iron & Steel Company Limited
2017 InterimReport
18
2. R&D costs
During the reporting period, R&D costs amounted to approximately RMB385 million,
representing an increase of 11.13% from approximately RMB346 million as compared
with corresponding period of the previous year.
3. Others
No significant change incurred in the composition or sources of the Company profit.
(2) NON-PRINCIPAL OPERATIONS DID NOT CAUSE SIGNIFICANT CHANGES IN PROFIT
(3) ANALYSIS OF ASSETS AND LIABILITIES
1. Assets and liabilities
Unit: RMB
Items
Closing
balance of
the reporting
period
Percentage of
closing
balance of
the reporting
period in
total assets
Closing
balance of
2016
Percentage of
closing
balance of
2016 in total
assets
Year-on-
year Change
(%) (%) (%)
Financial assets measured at
fair value through profit or loss 827,186,934 1.25 555,322,261 0.84 48.96
Prepayments 592,589,456 0.89 925,051,274 1.40 –35.94
Other receivables 323,233,960 0.49 127,614,834 0.19 153.29
Financial assets purchased under
agreements to resell – – 230,047,000 0.35 –
Held-to-maturity investments 201,463,387 0.30 – – –
Available-for-sale financial investments 1,428,658,949 2.16 577,947,698 0.87 147.20
Repurchase agreements 198,900,000 0.30 596,565,698 0.90 –66.66
Short-term loans 4,588,142,228 6.93 6,942,952,420 10.48 –33.92
Interest payable 227,033,926 0.34 107,691,398 0.16 110.82
Non-current liabilities due within
one year 549,859,584 0.83 3,211,056,320 4.85 –82.88
Other current liabilities 4,307,180,685 6.50 2,273,058,356 3.43 89.49
Long-term loans 8,024,820,080 12.12 5,163,168,960 7.79 55.42
Long-term payables 210,000,000 0.32 – – –
Special reserve 38,116,097 0.06 27,969,571 0.04 36.28
Maanshan Iron & Steel Company Limited
2017 InterimReport
19
Reasons for changes in the figures of the above main items in the financial statement are
as follows:
The financial assets measured at fair value through profit or loss increased by 48.96%
from the end of last year, mainly due to the increase of fund products held by Masteel
Financial during the reporting period.
The prepayment decreased by 35.94% from the end of last year, mainly due to the
decrease of prepayment for raw materials and fuel during the reporting period.
Other receivables increased by 153.29% from the end of last year, mainly due to the
increase of deposits for steel futures during the period.
The financial assets purchased under agreements to resell was nil as compared with
RMB230,047,000 recorded at the end of last year, mainly due to the maturity of reverse-
repurchased operations of Masteel Financial during the reporting period.
The held-to-maturity investments amounted to RMB201,463,387 as compared with nil
at the end of last year, mainly due to the purchase of intended held-to-maturity treasury
bonds by Masteel Financial during the reporting period.
The available-for-sale financial assets increased by 147.20% from the end of last year,
mainly due to the increase of interbank deposits in Masteel Financial during the reporting
period.
The repurchase agreements decreased by 66.66% from the end of last year, mainly due
to the decrease in discount of notes and bonds carried out by Masteel Financial for other
financial institutions during the reporting period.
The short-term loans decreased by 33.92% from the end of last year, mainly due to the
maturity of repayment of the short-term borrowings.
The interest payable increased by 110.82% from the end of last year was mainly due to
the provision of the interest of medium-term note during the reporting period.
The non-current liabilities due within one year decreased by 82.88% from the end of
last year, mainly due to the repayment of long-term loans due within one year during the
reporting period.
IV. Discussion and Analysis on Operation (Continued)
Maanshan Iron & Steel Company Limited
2017 InterimReport
20
Other current liabilities increased by 89.49% from the end of last year, mainly due to the
issue of RMB2 billion one-year short-term commercial papers.
The long-term loans increased by 55.42% from the end of last year, mainly due to the
new long-term borrowings raised by the Company during the reporting period.
The long-term payables amounted to RMB210,000,000 as compared with nil for the end
of last year, mainly due to the nil-interest bearing loan borrowed by Ma Steel (Hefei) Steel
Plates Co., Ltd. from Hefei Industrial Investment Holding Co., Ltd. during the reporting
period.
The special reserve increased by 36.28% from the end of last year, mainly due to the
increase in safety production reserve provided by the Company during the reporting
period.
2. Major restricted assets at the end of the reporting period
At the end of the reporting period, the restricted assets of the Company totaling
approximately RMB1,955 million consisted of mandatory reserves with the central bank
of approximately RMB533 million, bill deposits placed in bank of approximately RMB854
million and bank promissory notes pledged for borrowings of approximately RMB568
million.
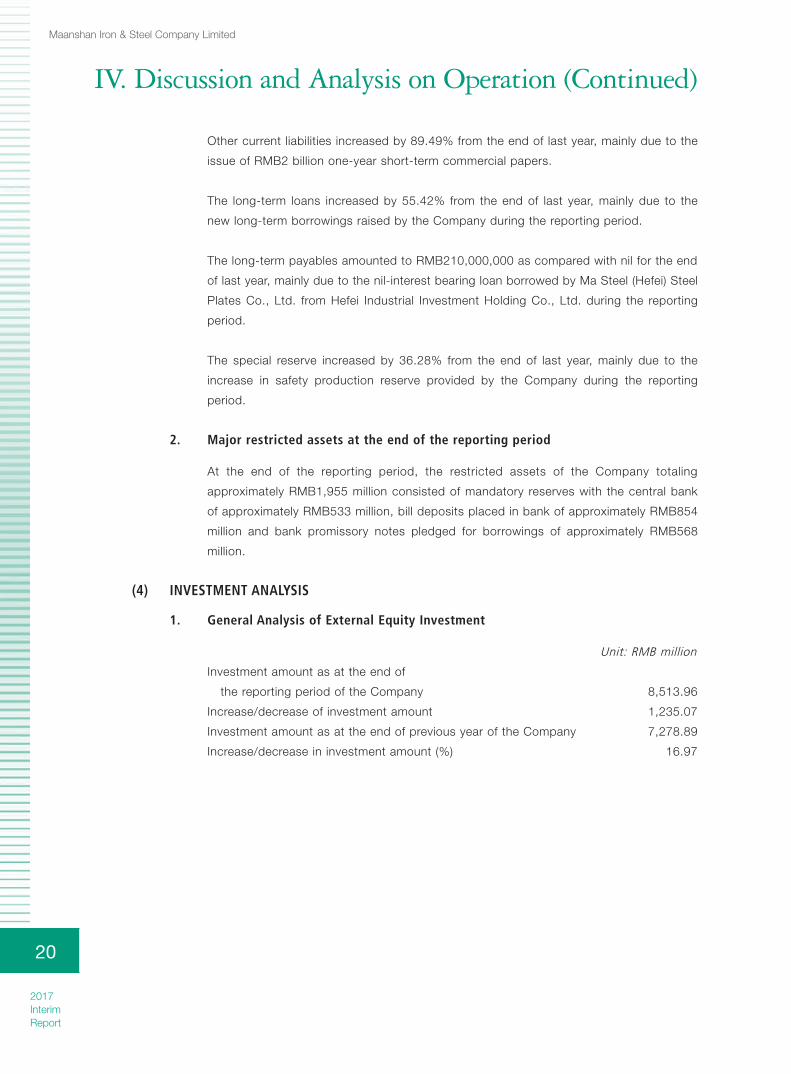
(4) INVESTMENT ANALYSIS
1. General Analysis of External Equity Investment
Unit: RMB million
Investment amount as at the end of
the reporting period of the Company 8,513.96
Increase/decrease of investment amount 1,235.07
Investment amount as at the end of previous year of the Company 7,278.89
Increase/decrease in investment amount (%) 16.97

Maanshan Iron & Steel Company Limited
2017 InterimReport
21
(1) Significant Equity Investment
Unit: RMB’000
Invested companyEquity
interest Main business
Additional investment during the reporting
period
Magang Group Finance Co., Ltd.
91% Financial and financing consultancy, credit verification and relevant consultancy, agency business to members of the group; assisting members of the group in the collection and payment of transaction amount; approved insurance agency business; guarantee provided to members of the group; entrusted loans among members of the group; bill acceptance and discounting provided to members of the group; settlement of internal transfer among members of the group and relevant settlement, design of liquidation plans; accepting deposits from members of the group; loans and finance leasing provided to members of the group; engagement in inter-bank borrowing; underwriting of corporate bonds of members of the group; investment in marketable securities (limited to various products issued in the interbank market, money market funds, securities investment funds, local government bonds, corporate bonds, and bank financial products, trusts and wealth management products issued by other financial institutions); buyer’s credit of products of member of the group.
910,000
MG-VALDUNES S.A.S. 100% Design, manufacturing, processing, putting into production and maintaining of all kinds of products and facilities that are applied in railway transportation, urban transportation and mechanical industry; sales, import and export of various shapes of steel products.
113,877
Mascometal Co., Ltd. 66% Development, manufacturing and sales of steel wire rods and bars used in automobile industry and finished iron and steel products, the provisions of after-sales services and related technical services, as well as trading businesses (excluding distribution).
78,432
Anhui Ma Steel Antirust Materials Technology Co., Ltd.
51% Development, transfer, consultation and services of anti-rust technology; volatile corrosion inhibitor, neutral paper and composite materials, non-woven fabrics and composite materials, plastic film and composite materials, woven fabrics and composite materials, anti-rust liquid, cleaning agents, rust-proof oil, derusting agent, metal surface passivation solution and coating liquid treatment agent, metal processing fluid, machine working fluid, anti-rust drying agents, processing and manufacturing, sales of deoxidizer (the above projects do not contain dangerous chemicals and easy-to-make drugs).
1,530

IV. Discussion and Analysis on Operation (Continued)
Maanshan Iron & Steel Company Limited
2017 InterimReport
22
(2) Significant Non-equity Investment
Unit: RMB million
Project name
Budgeted total
investment
New investment
during reporting
periodProject
progress
Product quality projects 4,981 63 51%Energy-saving and environment
protection projects 2,202 141 83%Equipment advancement and
other modification projects 1,540 119 77%Other projects N/A 299 N/A
Total N/A 622 N/A
Details of the main projects are as follows:
Unit: RMB million
Project name
Budgeted
total
investment Project progress
Heavy duty H – section steel rolling
line project 1,196
Construction
preparation
Section steel upgrade and public and
ancillary supporting project 810 Civil construction
Special steel bars and wire rods
for high-end vehicle spare parts
processing and public and ancillary
supporting project 650
Civil construction and
pipeline installation
Combination of purification system
of coal coking company (Southern
District) project 380 Civil construction
No.2 Iron general factory 2# blast
furnace technical transformation
project 320
Civil construction and
furnace piping
Silicon steel high grade transformation
project for cold rolling factory
260
Construction
preparation and
equipment tender
Total 3,616 /
The projects were mainly financed by the Company’s own fund.

Maanshan Iron & Steel Company Limited
2017 InterimReport
23
(3) Financial assets measured at fair value
Unit:RMB
ItemBeginning
balanceEnding
balance
Changes during
the period
Impact on the profit of the current
period
Financial assets measured at fair value through profit or loss 555,322,261 827,186,934 271,864,673 31,336,038
Total 555,322,261 827,186,934 271,864,673 31,336,038
(5) DISPOSAL OF SIGNIFICANT ASSETS AND EQUITY
During the reporting period, there were no disposal of significant assets and equity.
(6) ANALYSIS OF THE GROUP’S MAJOR SUBSIDIARIES AND INVESTEES
• Ma Steel (Hefei) Iron & Steel Co., Ltd. has a registered capital of RMB2,500 million, in
which the Company holds a direct stake of 71%. It is mainly engaged in metallurgy and
extended processing of ferrous metals and sale of resulting products, by-products and
semi-finished products; production and sale of coke and coke chemical products and
energy, extended processing of iron and steel products, production and sale of metallic
products. It also engaged in sales distribution of steel products, steel technical services
and steel industry-related business; quay operations, warehousing, transportation
services; construction; asset leasing; provision of labor and engineering and technical
services; waste materials processing and electrical equipment repair. Net loss for the
reporting period amounted to RMB55 million. As at the end of the reporting period, it
had total assets amounting to RMB4,940 million and net assets of RMB2,082 million.
• Anhui Changjiang Iron and Steel Co., Ltd. has a registered capital of RMB1,200
million, in which the Company holds a direct stake of 55%. It is mainly engaged in the
production and sales (conducted by its gas branch only) of gases and liquefied gases
(i.e. nitrogen, oxygen and argon), screw threaded steel, round steel, section steel, angle
steel, flat steel, deformed steel, tube blank steel, wire, rod, ferrous metal, steel billet and
pig iron, as well as the sales and the import and export of iron ore, iron ore fines and
scrap steel. During the reporting period, it recorded a revenue of RMB6,609 million, an
operating profit of RMB736 million and a net profit of approximately RMB546 million. At
the end of the reporting period, its total assets and net assets amounted to RMB6,940
million and RMB3,011 million, respectively.

IV. Discussion and Analysis on Operation (Continued)
Maanshan Iron & Steel Company Limited
2017 InterimReport
24
• Magang Group Finance Co., Ltd. has a registered capital of RMB2,000 million, in which
the Company holds a direct stake of 91%. Its business scope is as follows: financial and
financing consultancy, credit verification and relevant consultancy, agency business to
members of the group; assisting members of the group in the collection and payment
of transaction amount; approved insurance agency business; guarantee provided to
members of the group; entrusted loans among members of the group; bill acceptance
and discounting provided to members of the group; settlement of internal transfer
among members of the group and relevant settlement, design of liquidation plans;
accepting deposits from members of the group; loans and finance leasing provided to
members of the group; engagement in inter-bank borrowing; underwriting of corporate
bonds of members of the group; investment in marketable securities (limited to various
products issued in the interbank market, money market funds, securities investment
funds, local government bonds, corporate bonds, and bank financial products, trusts
and wealth management products issued by other financial institutions); buyer’s credit of
products of member of the group. During the reporting period, it recorded a net profit of
approximately RMB85 million. At the end of the reporting period, its total assets and net
assets amounted to RMB9,600 million and RMB2,657 million, respectively.
• Maanshan BOC-Ma Steel Gases Company Limited has a registered capital of RMB468
million, in which the Company holds a direct stake of 50%. Its core business includes
the production and sales of gases, liquefied gases (e.g. nitrogen, oxygen, argon and
other gases) and other gas products for industrial use. The core business also includes
the provision of engineering and technical support relating to the sales, supply and use
of products, after-sales service and other relevant services. During the reporting period,
it recorded a net profit of approximately RMB88 million. At the end of the reporting
period, its total assets and net assets amounted to RMB633 million and RMB577 million,
respectively.
• Henan Jinma Energy Co., Ltd. has a registered capital of RMB400 million, in which the
Company holds a direct stake of 36%. Its core business includes the production and
sales of coke, coal tar, crude benzene, ammonium sulfate and coke oven gas. The core
business also includes coke oven gas power and heat generation. During the reporting
period, it recorded a net profit of approximately RMB249 million. At the end of the
reporting period, its total assets and net assets amounted to RMB2,350 million and
RMB1,123 million, respectively.

Maanshan Iron & Steel Company Limited
2017 InterimReport
25
• Shenglong Chemical Co., Ltd. has a registered capital of RMB568.8 million, in which
the Company holds a direct stake of 32%. Its core business includes the sales and
production of methanol, crude benzene, coal tar, oxygen, argon, nitrogen (the business
items are operated under a production safety license which is valid until June 11,
2017) within the scope authorized by the license. The business scope also covers the
production of products for industrial use (hazardous chemicals excluded), e.g. coke,
ammonium sulfate, coke; the sales of chemical products (hazardous chemicals and
precursor chemicals excluded); the repair and processing of mechanical equipment
(special equipment excluded). During the reporting period, it recorded a net profit of
approximately RMB264 million. At the end of the reporting period, its total assets and
net assets amounted to RMB3,671 million and RMB1,232 million, respectively.
(7) DURING THE REPORTING PERIOD, THE COMPANY HAD NO STRUCTURE ENTITY.
2. OTHER DISCLOSURES
(1) THE ENVIRONMENT FOR PRODUCTION AND OPERATION AND COPING STRATEGIES
In the second half of the year, China will continue to push forward the work of “addressing
overcapacity, reducing inventory, deleveraging, lowering costs, and bolstering areas of
weakness”, deepen supply side structural reform and ensure the steady and healthy
development of economy. The iron and steel industry will grasp the opportunities of initial
improvement of operation environment of the industry as the work of addressing overcapacity,
pushing forward the work of deleveraging and lowering corporate financial costs is pursued.
Demand for better quality and service of iron and steel products are increasingly strong in the
downstream market so that iron and steel enterprises needs to adapt actively.
The Company’s main work in the second half of the year includes:
• To grasp favorable market situation, tilting resources towards key orders and customers
through efficient production and lean operation. To fully leverage the advantage of the
Company’s product structure and to maximize benefits from resource allocation.
• To construct a new pattern of effective, specialized production. To arrange reasonable
division of various production lines and to achieve a production system that marks
with production-and-sales synergy and complementary advantages. To continuously
promote cost reduction work, and to implement excessive capacity reduction plans and
transformation projects in good order.

IV. Discussion and Analysis on Operation (Continued)
Maanshan Iron & Steel Company Limited
2017 InterimReport
26
• With the core aim of long-term, stable and efficient operation of the blast furnace, to
explore the potentials by benchmarking and continuous improvement and to ensure
organized production work of the blast furnace.
• Firmly upholding the production safety concept that a hidden danger is an accident
waiting to happen, to improve management system from the start, look into details to
identify potential problems, and perform well in the basic management.
• Led by brand strategy, to promote product structure upgrade, and steadily enhance
product quality. To enhance brand awareness and implement customer satisfaction
improvement program, and create a strong brand culture.
(2) ALERT AND EXPLANATION ON A POSSIBLE ACCUMULATIVE NET LOSS OR A SIGNIFICANT CHANGE OF THE COMPANY’S PROFIT FOR THE PERIOD STARTING FROM THE BEGINNING OF THE YEAR TO THE END OF THE NEXT REPORTING PERIOD
The net profit attributable to owners of the parent of the Company was RMB1,643 million
in the first half of 2017, which was higher than the net profit for the period from January to
September of last year at RMB759 million. Considering the current production operation of the
Company has improved, the profits at the third quarter expected to maintain. Therefore, the
Company expects a significant increase of accumulative net profit for the period staring from
the beginning of the year to the end of next reporting period, compared to the period of last
year.
(3) POTENTIAL RISKS
1. Risks relating to Environmental policy and the industry
China is implementing the environmental inspection and the establishment of a
collaboration mechanism for the prevention and control of atmospheric pollution for
Beijing-Tianjin-Hebei Region at different levels. Environmental protection initiatives will
have different degrees of impact on the manufacture of steel and iron as well as the
downstream manufacturing industry, resulting in a change in supply and demand.
Countermeasures: The Company always attaches great importance to environment
protection, therefore, China’s environment protection policies have little impact on our
production. However, the restrictions on manufacturing industry do affect the demand
from downstream market, resulting in a change in the overall supply and demand in
steel market. The Company will step up its research and analysis efforts on policies
and market trends. It will also take full advantage of the production and operational risk
warning mechanism. The operation and operation plans will be adjusted as appropriate.
Maanshan Iron & Steel Company Limited
2017 InterimReport
27
2. Risk relating to the supply and demand of crude fuel
The frequent environment inspections and production curtailments in the second half of
the year will affect the supply of various types of crude fuel (e.g. coal, coke, domestic
ore and ferroalloy) to some extent. Meanwhile, the supply and demand equilibrium of
coal and coke is not looking up, and the prices of coal and coke may remain high and
volatile.
Countermeasures: sol id research on crude fuel market, t imely adjustment on
procurement strategies, expansion of procurement channels and inventory adjustment
according to supply and demand in the market and market prices will help maintain
steady production and lower procurement costs of crude fuel for the Company.
3. Risk of significant fluctuations in RMB exchange rate
With the US dollar entering into the rate hike cycle, the RMB exchange rate is likely to
be affected. Not only will changes in exchange rate bring certain price risk to the import
of iron ore and the export of steel but it may bring some risks to the Company’s non-
Renminbi debts.
Countermeasures: give full play to the financing advantage of the subsidiaries, actively
adjust liabilities structure and funding status of the Company, increase steel exports to
improve USD-denominated revenue and maintain balance between foreign exchange
assets and liabilities of the Company.
(4) OTHER DISCLOSURES
• Audit Committee
During the reporting period, the audit committee held two meetings. All members of
the audit committee (i.e. Mr. Qin Tongzhou, Ms. Yang Yada and Mr. Liu Fangduan
(independent directors)) attended all the meetings in person. The meeting mainly
discussed the following topics: to consider the audited financial statement for 2016; to
review the report of internal control for 2016, to consider the internal control assessment
report for 2016; to review the report of connected transactions for 2016; to consider
connected transactions for 2016; to consider external guarantees for 2016; to consider
the remuneration of the auditor and the reappointment of accounting firm for 2016; and
to consider the unaudited financial report for the first quarter of 2017.

IV. Discussion and Analysis on Operation (Continued)
Maanshan Iron & Steel Company Limited
2017 InterimReport
28
• Purchase, sale or redemption of listed securities of the Company
During the reporting period, the Group did not redeem any of its listed stocks, nor did
the Group purchase or resale any of the listed stocks.
• Pre-emptive rights
According to Chinese laws and the Articles of Association of the Company, it is not
required that the current shareholders shall purchase new shares based on their holding
shares before the Company issues new shares.
• Code on corporate governance practices
During the reporting period, the Company has complied with all the code provisions
of the Code on Corporate Governance Practices set out in Appendix 14 of the Rules
Governing the Listing of Securities on The Stock Exchange of Hong Kong Limited. No
deviation behavior from the code was found.
• Model Code for Securities Transactions by Directors of Listed Issuers
During the reporting period, the Company had complied with the requirements stipulated
by the Model Code for Securities Transactions by Directors of Listed Issuers in Appendix
10 of the Hong Kong Listing Rules. No deviation behavior from the code was found.
• Shareholder’s rights
Shareholders who individually or in aggregate hold 10% or more of total voting rights
of the Company are entitled to convene the extraordinary shareholders’ meeting or
class meeting in accordance with Article 87 of the Articles of Association. At the annual
general meeting convened by the Company, shareholders qualified under Article 59 of
the Articles of Association shall have the right to put forward new proposals in writing to
the Company in accordance with the requirements thereof. Shareholders may send their
enquires and suggestions to the board of the Company at its office in Maanshan City,
Anhui Province (No. 8 Jiu Hua Xi Road, Maanshan City, Anhui Province, the PRC).
Maanshan Iron & Steel Company Limited
2017 InterimReport
29
V. Significant Events
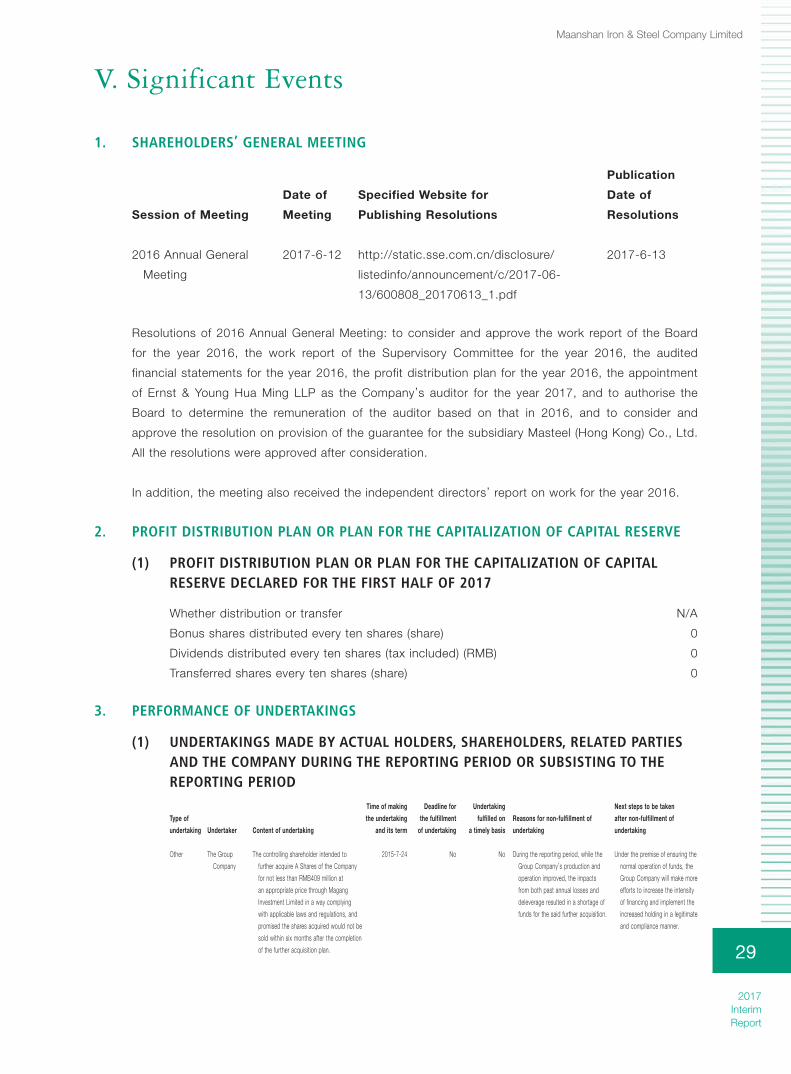
1. SHAREHOLDERS’ GENERAL MEETING
Session of Meeting
Date of
Meeting
Specified Website for
Publishing Resolutions
Publication
Date of
Resolutions
2016 Annual General
Meeting
2017-6-12 http://static.sse.com.cn/disclosure/
listedinfo/announcement/c/2017-06-
13/600808_20170613_1.pdf
2017-6-13
Resolutions of 2016 Annual General Meeting: to consider and approve the work report of the Board
for the year 2016, the work report of the Supervisory Committee for the year 2016, the audited
financial statements for the year 2016, the profit distribution plan for the year 2016, the appointment
of Ernst & Young Hua Ming LLP as the Company’s auditor for the year 2017, and to authorise the
Board to determine the remuneration of the auditor based on that in 2016, and to consider and
approve the resolution on provision of the guarantee for the subsidiary Masteel (Hong Kong) Co., Ltd.
All the resolutions were approved after consideration.
In addition, the meeting also received the independent directors’ report on work for the year 2016.
2. PROFIT DISTRIBUTION PLAN OR PLAN FOR THE CAPITALIZATION OF CAPITAL RESERVE
(1) PROFIT DISTRIBUTION PLAN OR PLAN FOR THE CAPITALIZATION OF CAPITAL RESERVE DECLARED FOR THE FIRST HALF OF 2017
Whether distribution or transfer N/A
Bonus shares distributed every ten shares (share) 0
Dividends distributed every ten shares (tax included) (RMB) 0
Transferred shares every ten shares (share) 0
3. PERFORMANCE OF UNDERTAKINGS
(1) UNDERTAKINGS MADE BY ACTUAL HOLDERS, SHAREHOLDERS, RELATED PARTIES AND THE COMPANY DURING THE REPORTING PERIOD OR SUBSISTING TO THE REPORTING PERIOD
Type of
undertaking Undertaker Content of undertaking
Time of making
the undertaking
and its term
Deadline for
the fulfillment
of undertaking
Undertaking
fulfilled on
a timely basis
Reasons for non-fulfillment of
undertaking
Next steps to be taken
after non-fulfillment of
undertaking
Other The Group
Company
The controlling shareholder intended to
further acquire A Shares of the Company
for not less than RMB409 million at
an appropriate price through Magang
Investment Limited in a way complying
with applicable laws and regulations, and
promised the shares acquired would not be
sold within six months after the completion
of the further acquisition plan.
2015-7-24 No No During the reporting period, while the
Group Company’s production and
operation improved, the impacts
from both past annual losses and
deleverage resulted in a shortage of
funds for the said further acquisition.
Under the premise of ensuring the
normal operation of funds, the
Group Company will make more
efforts to increase the intensity
of financing and implement the
increased holding in a legitimate
and compliance manner.
V. Significant Events

V. Significant Events (Continued)
Maanshan Iron & Steel Company Limited
2017 InterimReport
30
4. APPOINTMENT AND REMOVAL OF AUDITORS
During the reporting period,the Board continued the appointment of Ernst & Young Hua Ming LLP as
the Company’s auditor. The resolution was approved during 2016 Annual General Meeting on 12 June
2017. During the reporting period, there were no changes in the appointment of the auditor, and no
“non-standard audit opinions” were issued by the auditor.
5. THERE WERE NO INSOLVENCY OR RESTRUCTURING RELATED MATTERS DURING THE REPORTING PERIOD.
6. THERE WERE NO MAJOR LITIGATION AND ARBITRATION CASES DURING THE REPORTING PERIOD.
7. THERE WAS NO PUNISHMENT AND RECTIFICATION ON THE COMPANY AND ITS DIRECTORS, SUPERVISORS, SENIOR MANAGEMENT, CONTROLLING SHAREHOLDERS, AND ACTUAL CONTROLLER DURING THE REPORTING PERIOD.
8. THE COMPANY DID NOT FORMULATE OR IMPLEMENT STOCK OPTION INCENTIVE PLAN, EMPLOYEE STOCK OWNERSHIP PLAN OR OTHER EMPLOYEE INCENTIVE MEASURES DURING THE REPORTING PERIOD.
9. EXPLANATION OF THE CREDIBILITY OF THE COMPANY, ITS CONTROLLING SHAREHOLDERS AND ACTUAL CONTROLLER
There were no non-fulfillment of the court’s effective judgments and unsettled expired debt of larger
amount by the Company, its controlling shareholders and actual controller during the reporting period.

Maanshan Iron & Steel Company Limited
2017 InterimReport
31
10. SUBSTANTIAL CONNECTED TRANSACTIONS
(1) CONNECTED TRANSACTIONS RELATED TO NORMAL OPERATIONS
Transactions between the Group and the Group Company and its subsidiaries carried out in the
normal course of business were settled in cash or bills. The details of which are as follows:
(1) Normal operations between the Group and the Group Company
To ensure that the Company has sufficient ore to meet the production demands, the
Group Company agreed to continuously provide the Group with ore on a first priority
basis.
For the period between 1 January 2017 and 30 June 2017, transaction of the Group in
respect of the “Sale and Purchase of Ore Agreement”, which was signed in 2015, was
as follows (RMB’000):
Amount
Proportion of
transaction of
the same
category
(%)
Purchase of iron ore, limestone and dolomite 2,030,915 25
Price for iron ore, limestone and dolomite in tonne acquired by the Group from Group
Company and its subsidiaries will be determined after arm’s length negotiation between
both sides under normal commercial terms with reference to comparable market
price and shall not be higher than the market price of the same categories of iron ore,
dolomite and limestone provided by independent third parties in the same area in the
vicinity of the Company in Maanshan City, Anhui Province, the PRC.
All Directors of the Board who are not associated with Group Company (including
Independent Non-executive Directors) considered that those transactions were carried
out under normal commercial terms or were no less favorable than the terms agreed
between the Company with any independent third party. They were in the best interest of
the Company and its shareholders. The continuing connected transactions contemplated
under the “Sale and Purchase of Ore Agreement” between the Company and the Group
Company and its subsidiaries were approved at the shareholders’ general meeting. In
the reporting period, such transactions were carried out according to the terms for the
“Sale and Purchase of Ore Agreement” for the years of 2016-2018 and their transaction
amount was under the annual cap for the year of 2017 stipulated by the agreement, i.e.,
RMB4,873 million.

V. Significant Events (Continued)
Maanshan Iron & Steel Company Limited
2017 InterimReport
32
(2) In the reporting period, businesses between Masteel Financial and Group Company
Business nature
Amount of loan
or deposit Interest income/expenses
RMB100 million RMB’000
Deposit Maximum daily deposit 46.9 Interest
expenses
18,335
Monthly average maximum
daily deposit 41.7
Loan Maximum daily loan 4.98 Interest
income
10,574
Monthly average maximum
daily loan 4.97
Other income
Net income from handling fee and commission (RMB’000) 319
Interest income from discount (RMB’000) 20,379
The continuing connected transactions contemplated under the “Financial Services
Agreement” between Masteel Financial and the Group Company during the reporting
period were approved by the Board. All Directors of the Board who were not associated
with Group Company (including Independent Non-executive Directors) considered that
those transactions were conducted under normal commercial terms and were in the best
interest of the Company and its shareholders and that the daily cap of RMB500 million
was not exceeded, while interests, handling and service fees were less than RMB60
million.
(3) Business transactions between the Group and Environmental Protection Company
For the period between 1 January 2017 and 30 June 2017, transaction of the Company
in respect of the “Energy Saving and Environmental Protection Agreement”, which was
signed in 2015, was as follows (RMB’000):
Amount
Proportion of
transaction of
the same
category
(%)
Energy saving and environmental protection
engineering and services 367,756 14
Sale of useful resources for steel production
including slag and coal ash (wastes) 8,751 1
Total 376,507

Maanshan Iron & Steel Company Limited
2017 InterimReport
33
The continuing connected transactions under The “Energy Saving and Environmental
Protection Agreement” between the Group and Environment Protection Company were
approved by the shareholders’ general meeting. All Directors of the Board who were
not associated with Group Company (including Independent Non-executive Directors)
considered that those transactions were conducted under normal commercial terms and
were in the best interest of the Company and its shareholders. Their transaction amount
did not exceed the cap of RMB665 million specified in the agreement.
(4) Save for the connected transactions made pursuant to the aforementioned
Sale and Purchase of Ore Agreement, Financial Services Agreement, and Energy
Saving and Environmental Protection Agreement, amounts of other connected
transactions in the normal course of business with the Group Company are as
follows (RMB’000):
Amount
Proportion of
transaction of
the same
category
(%)
Steel products and other products purchased by
the Group Company from the Company 725,015 2
Water, electricity, telephone and other services
purchased by the Group Company from
the Company 73,101 7
Fixed assets and construction services purchased
by the Company from the Group Company 182,355 24
Other services and products purchased by
the Company from the Group Company 1,525,012 85
Total 2,505,483
All Directors of the Board who were not associated with Group Company (including
Independent Non-executive Directors) considered that such transactions were carried
out between the Company and the Group Company in their normal course of business
in compliance with normal commercial requirements, and the terms of such transactions
using market price as the pricing benchmark were at least as favorable to the Company
when they were compared with normal commercial terms.
Those transactions were approved by the Board and the shareholders' general meeting
and conducted under the related terms of the agreement. The transaction amount did
not exceed the cap of RMB5,284 million.

V. Significant Events (Continued)
Maanshan Iron & Steel Company Limited
2017 InterimReport
34
(2) CONNECTED TRANSACTION ABOUT ASSET ACQUISITION, EQUITY ACQUISITION AND SALE
Matters disclosed in temporary announcement but no progress in subsequent
implemention or changes
Summary of matters Query index
The acquisition of 9% equity interests of
Ma Steel (Hong Kong) Co., Ltd. from
Ma Steel International Trade and
Economic Co., Ltd.
http://static.sse.com.cn/disclosure/listedinfo/
announcement/c/2017-04-26/600808_20170426_3.pdf
11. MATERIAL CONTRACTS AND PERFORMANCE THEREOF
1 DURING THE REPORTING PERIOD, THE COMPANY HAD NO ENTRUSTMENT, CONTRACTING AND LEASING OR ONES THAT HAD HAPPENED IN THE PREVIOUS PERIODS AND POSTPONED TO THE REPORTING PERIOD.

Maanshan Iron & Steel Company Limited
2017 InterimReport
35
2 GUARANTEES
Unit: RMB100 million
Guarantees Offered by the Company (excluding guarantees offered to subsidiaries)
Guarantees incurred in the reporting
period (excluding guarantees offered to
subsidiaries) 0
Total ending balance of guarantees
(excluding guarantees offered to
subsidiaries) (A) 0
Guarantees Offered to Subsidiaries
Total amount of guarantees newly offered to
subsidiaries during the reporting period 31.56
Total ending balance of guarantees offered
to subsidiaries (B) 37.23
Total Amount of Guarantees Offered by the Company
(including guarantees offered to subsidiaries)
Total amount of guarantees (A+B) 37.23
Total amount of guarantees as a percentage
of net assets of the Company (%) 17.38
Of which:
Amount of guarantees offered to
shareholders, actual controller and their
related parties (C) 0
Amount of debt guarantees offered to those
with asset-liability ratio exceeding 70%,
directly or indirectly (D) 0
The portion of total guarantees in excess of
50% of net assets (E) 0
Total amount of the preceding three types of
guarantees (C+D+E) 0

V. Significant Events (Continued)
Maanshan Iron & Steel Company Limited
2017 InterimReport
36
Explanation on guarantees During the reporting period, the Company provided MG-
Valdunes S.A.S, its wholly-owned subsidiary, a guarantee
of Euro52 million and RMB170 million,totalled RMB573
million; and provided the holding subsidiary Ma Steel
(Hong Kong) Co., Ltd., a guarantee of banking facilities
of RMB3 billion for its trade financing. Additionally, at
the end of the reporting period, Changjiang Steel (as a
controlling subsidiary of the Company) provided guarantee
of RMB150 million to its wholly-owned subsidiary. All
guarantees obtained approval from the independent
directors in prior, as well as the approval from the Board of
Directors.
Pursuant to the requirements of the China Securities
Regulatory Commission, the independent directors of the
Company carried out due diligence process in relation to
the outstanding guarantees of the year and guarantees
offered by the Company in the reporting period. Details are
as follows:
(1) As at 30 June 2017, the approval procedures of
all external guarantees offered by the Company
complied with related regulations and procedures.
(2) As at 30 June 2017, the Company did not provide
any guarantees to connected parties in which the
Company and its shareholders held less than 50%
equity interest, non-legal entities or individuals.
(3) As at 30 June 2017, the total amount of external
guarantees outstanding and guarantees provided
by the Company in the reporting period accounted
for less than 50% of the net assets of the Company
as stated in i ts latest consol idated f inancial
statements.
12. THERE WAS NO CONVERTIBLE CORPORATE BONDS ISSUED BY THE COMPANY OR EXISTED DURING THE PERIOD.

Maanshan Iron & Steel Company Limited
2017 InterimReport
37
13. DESCRIPTION OF THE ENVIRONMENTAL PROTECTION OF THE LISTED COMPANIES AND ITS SUBSIDIARIES IN THE HEAVY POLLUTION INDUSTRY AS PRESCRIBED BY THE MINISTRY OF ENVIRONMENTAL PROTECTION
The Company and its subsidiaries, Ma Steel (Hefei) and Anhui Changjiang Iron and Steel, are in the
heavy pollution industry as prescribed by the State Environmental Protection Department.
During the reporting period, there was no major environmental problem occurred in the Company and
its subsidiaries Hefei Company and Changjiang Steel and their environmental protection facilities was
built and operated under the principle of three simultaneousness. The environmental pollution accident
emergency plan was regularly revised and maneuvered. The major pollutants were discharged up to
standard and the total emissions satisfied the requirements of the State, province and city on the
emission reduction of the total amount of pollutant.
14. OTHER MAJOR EVENTS
(1) CHANGES TO ACCOUNTING POLICIES, ACCOUNTING ESTIMATES AND ACCOUNTING METHODS FROM THE PREVIOUS PERIOD, WITH REASONS FOR THE CHANGES AND THEIR IMPACT
Change of presentation of government grants
In 2017, based on the issuance of China Accounting Standard No. 16 – Government Grants
(Revised in 2017) (Accounting [2017] No. 15) (“Revised CAS 16”), the Group accounted the
government grants related to daily corporate activities as other income or offsetting relevant
costs according to the nature of business. Government grants not related to daily corporate
activities would be included in non-operating income. Governments grants existing as at 1
January 2017 applies the change in future application, and the government grants newly
granted during the period from 1 January 2017 to the application date (12 June 2017) will be
accounted according to the Revised CAS 16. Impacted by application of Revised CAS 16, the
Group’s non-operating income and other income are presented differently for the six months
ended 30 June 2017, compared with the year of 2016. The application of Revised CAS 16 will
have no impact on the Group’s and the Company’s net profit and equity for the six months
ended 30 June 2017.
The accounting policies adopted in the preparation of the interim financial statements are
consistent with those followed in the preparation of the Group’s annual consolidated financial
statements for the year ended 31 December 2016, except for the change of the presentation of
government grants as mentioned above.
(2) DETAILS, CORRECTION AMOUNT, REASONS AND INFLUENCE OF SIGNIFICANT ACCOUNTING ERRORS DURING THE REPORTING PERIOD
There were no significant accounting errors amended by retrospective restatement during the
reporting period.

Maanshan Iron & Steel Company Limited
2017 InterimReport
38
VI. Movements in Share Capital and Shareholders
1. SHARE MOVEMENTS
(1) TABLE ON SHARE MOVEMENTS
(1) Table on share movements
Unit: ShareBefore the change Increase/(decrease) during the period After the change
Number of shares Percentage
New shares issued Bonus shares
Shares converted
from surplus reserve Others Sub-total
Number of shares Percentage
(%) (%)
A. Shares with selling restriction – – – – – – – – –1. State-owned shares – – – – – – – – –2. State-owned legal person shares – – – – – – – – –3. Other domestically owned shares – – – – – – – – –Including: Domestic non-state-owned
legal person shares – – – – – – – – –Shares owned by domestic natural
persons4. Foreign shareholding – – – – – – – – –Including: Overseas legal person shares – – – – – – – – –
Overseas natural person shares – – – – – – – – –B. Shares without selling restriction 7,700,681,186 100 – – – – – 7,700,681,186 100
1. RMB ordinary shares 5,967,751,186 77.50 – – – – – 5,967,751,186 77.502. Foreign shares listed domestically – – – – – – – – –3. Foreign shares listed overseas 1,732,930,000 22.50 – – – – – 1,732,930,000 22.504. Other shares – – – – – – – – –
C. Total 7,700,681,186 100 – – – – – 7,700,681,186 100
During the reporting period, there were no changes in the total number of shares and the
share capital structure.
VI. Movements in Share Capital and Shareholders

Maanshan Iron & Steel Company Limited
2017 InterimReport
39
2. SHAREHOLDERS
(1) TOTAL NUMBER OF SHAREHOLDERS
Number of ordinary shareholders by the end of reporting period (accounts) 235,892
(2) SHAREHOLDING OF THE TOP TEN SHAREHOLDERS AT THE END OF THE REPORTING PERIOD AND THE TOP TEN TRADABLE-SHARE HOLDER (OR SHAREHOLDERS WITHOUT SELLING RESTRICTIONS):
Unit: ShareHoldings of top ten shareholders
Shareholders’ names
(Full names)
Increase/
decrease
within the
reporting
period
No. of
shares at
the end of
period Percentage
No. of
shares under
restricted
condition
for sales
Pledged or frozen situations
ShareholderShare status Number
(%)
Magang (Group) Holding
Co., Limited – 3,506,467,456 45.54 – Pledged 800,000,000 State-owned
Hong Kong Securities Clearing
Company Nominees Limited 810,000 1,711,624,900 22.23 – Unknown Unknown Unknown
Central Huijin Investment Ltd. Unknown 142,155,000 1.85 – Unknown Unknown State-owned
China Securities Finance
Corporation Limited Unknown 88,096,538 1.14 – Unknown Unknown State-owned
Bosera Funds – Agricultural
Bank of China (ABC) – Bosera
China Securities Finance Asset
Management Plan Unknown 33,609,200 0.44 – Unknown Unknown Unknown
E Fund – ABC – E Fund China
Securities Finance Asset
Management Plan Unknown 33,609,200 0.44 – Unknown Unknown Unknown
Dacheng Fund – ABC – Dacheng
China Securities Finance Asset
Management Plan Unknown 33,609,200 0.44 – Unknown Unknown Unknown
Harvest Fund – ABC – Harvest
China Securities Finance Asset
Management Plan Unknown 33,609,200 0.44 – Unknown Unknown Unknown
GF Fund Management – ABC
– GF China Securities Finance
Asset Management Plan Unknown 33,609,200 0.44 – Unknown Unknown Unknown
Zhong Ou Fund – ABC – Zhong
Ou China Securities Finance
Asset Management Plan Unknown 33,609,200 0.44 – Unknown Unknown Unknown

VI. Movements in Share Capital and Shareholders (Continued)
Maanshan Iron & Steel Company Limited
2017 InterimReport
40
Shareholding of top ten shareholders without selling restrictions
Shareholders’ name
Number of
shares held
without selling
restrictions Type and number of shares
Type Number
Magang (Group) Holding Co., Limited
3,506,467,456
RMB denominated
ordinary shares 3,506,467,456
Hong Kong Securities Clearing Company
Nominees Limited 1,711,624,900
Overseas-listed
foreign shares 1,711,624,900
Central Huijin Investment Ltd.
142,155,000
RMB denominated
ordinary shares 142,155,000
China Securities Finance Corporation Limited
88,096,538
RMB denominated
ordinary shares 88,096,538
Bosera Funds – Agricultural Bank of China (ABC)
– Bosera China Securities Finance Asset
Management Plan 33,609,200
RMB denominated
ordinary shares 33,609,200
E Fund – ABC – E Fund China Securities Finance
Asset Management Plan 33,609,200
RMB denominated
ordinary shares 33,609,200
Dacheng Fund – ABC – Dacheng China Securities
Finance Asset Management Plan 33,609,200
RMB denominated
ordinary shares 33,609,200
Harvest Fund – ABC – Harvest China Securities
Finance Asset Management Plan 33,609,200
RMB denominated
ordinary shares 33,609,200
GF Fund Management – ABC – GF China Securities
Finance Asset Management Plan 33,609,200
RMB denominated
ordinary shares 33,609,200
Zhong Ou Fund – ABC – Zhong Ou China Securities
Finance Asset Management Plan 33,609,200
RMB denominated
ordinary shares 33,609,200
Notes on the above
shareholders’
affiliated relation or
concerted action
Magang (Group) Holding Co., Limited has no affiliated relation with any of the other foregoing
shareholders, nor is it a person acting in concerted action; however, it is not in the knowledge
of the Company whether there is any affiliated relation among other foregoing shareholders
and whether they are persons acting in concerted action.
In December 2016, the Group Company used the 800 million shares it held in the Company for
stock-pledged repo transaction. Apart from metioned, in the reporting period, above, no other
shares held by Group Company were pledged, frozen or hosted, but the Company was not
aware whether shares held by other shareholders who had 5% and above of the Company’s
shares were pledged, frozen or hosted.
Hong Kong Securities Clearing Company Nominees Limited held 1,711,624,900 shares of the
Company on behalf of multiple clients

Maanshan Iron & Steel Company Limited
2017 InterimReport
41
Based on the data accessible for the Company and to the best knowledge of the Board of
directors, as of the announcement date of the report, the Company met relevant requirements
about public holdings in Securities Listing Rules of Stock Exchange of Hong Kong Limited.
As at 30 June 2017, none of the directors, supervisors, senior management had any interests
or short positions in the shares or underlying shares of the Company or any of its associated
corporations (within the meaning of the Securities and Futures Ordinance).
As at 30 June 2017, to the best knowledge of the Company, the following persons were
recorded in the registry kept by the Company for holding interests or short positions in
the shares or underlying shares of the Company according to the Securities and Futures
Ordinance:
Shareholders
Capacity as holder or
deemed holder of interests
Number of
shares owned or
deemed owned
Approximate
percentage of
the Company’s
issued H shares
(Shares) (%)
Citigroup Inc. Interests held by legal entities controlled
by the substantial shareholder
13,041,031
(Long positions)
0.75
Custodian corporation/approved
lending agent
80,718,726
(Long positions)
4.66
N/A 80,718,726
(Lending pool)
4.66
Save as disclosed above, as at 30 June 2017, the Company was no aware of any interests or
short positions recorded according to the Securities and Futures Ordinance, according to the
Securities and Futures Ordinance.
(3) STRATEGIC INVESTORS OR COMMON LEGAL PERSONS WHO BECAME ONE OF THE TOP TEN SHAREHOLDERS AS A RESULT OF SUBSCRIPTION OF NEW SHARES ALLOTTED TO THEM
During the reporting period, the Company did not have any strategic investor or common legal
person who became one of the top ten shareholders as a result of subscription of new shares
allotted to them.
3. CHANGE OF CONTROLLING SHAREHOLDERS OR ACTUAL CONTROLLERS
During the reporting period, there were no changes of controlling shareholder or actual controller.

Maanshan Iron & Steel Company Limited
2017 InterimReport
42
VII. Directors, Supervisors, and Senior Management
1. CHANGES IN SHAREHOLDING
(1) CHANGES IN SHAREHOLDING HELD BY INCUMBENT AND RESIGNED DIRECTORS, SUPERVISORS AND SENIOR MANAGEMENT IN THE REPORTING PERIOD
During the reporting period, none of the current or resigned Directors, supervisors and senior
management held any shares of the Company.
(2) DIRECTORS, SUPERVISORS, AND SENIOR MANAGEMENT OF THE COMPANY AWARDED WITH STOCK OPTION INCENTIVE DURING THE REPORTING PERIOD
During the reporting period, no directors, supervisors, and senior management of the Company
were awarded with stock option incentive.
2. PERSONNEL MOVEMENT OF DIRECTORS, SUPERVISORS AND SENIOR MANAGEMENT
Name Position Movement
Hu Shunliang Secretary to the Board (Company Secretary) Resignation
Tian Jun Deputy General Manager Appointment
Zhang Wenyang Deputy General Manager Appointment
EXPLANATION ON PERSONNEL MOVEMENT OF DIRECTORS, SUPERVISORS AND SENIOR MANAGEMENT
On 14 February 2017, Mr. Hu Shunliang resigned as the Secretary to the Board (Company Secretary)
of the Company. The duties of the Secretary to the Board (Company Secretary) will be temporarily
performed by Mr. Ding Yi, Chairman of the Company. Based on the nomination by General Manager
Qin Haifan, the Board appointed Mr. Tian Jun and Mr Zhang Wenyang as Deputy General Managers of
the Company.
VII. Directors, Supervisors, and Senior Management

Maanshan Iron & Steel Company Limited
2017 InterimReport
43
VIII. Financial Statements
CONTENTSPages
INTERIM FINANCIAL STATEMENTS (UNAUDITED)
CONSOLIDATED STATEMENT OF FINANCIAL POSITION 44
CONSOLIDATED STATEMENT OF PROFIT OR LOSS 47
CONSOLIDATED STATEMENT OF CHANGES IN EQUITY 49
CONSOLIDATED STATEMENT OF CASH FLOWS 50
STATEMENT OF FINANCIAL POSITION 53
STATEMENT OF PROFIT OR LOSS 55
STATEMENT OF CHANGES IN EQUITY 56
STATEMENT OF CASH FLOWS 57
NOTES TO INTERIM FINANCIAL STATEMENTS 59
SUPPLEMENTARY INFORMATION APPENDICES
1. Breakdown of non-recurring gains or losses 228
2. Return on net assets and earnings per share 229
Note: The notes to the financial statements with “*” are disclosed in accordance with the disclosure requirements of
the Rules Governing the Listing of Securities on The Stock Exchange of Hong Kong Limited and the Hong Kong
Companies Ordinance.
VIII. Financial Statements

Maanshan Iron & Steel Company Limited
2017 InterimReport
44
Consolidated Statement of Financial PositionAs at 30 June 2017Renminbi Yuan
ASSETS 30 June 31 December
Note V 2017 2016
Unaudited Audited
CURRENT ASSETS
Cash and bank balances 1 4,832,966,727 5,312,101,041
Financial assets at fair value through profit or loss 2 827,186,934 555,322,261
Notes receivable 3 4,687,305,835 3,608,459,121
Trade receivables 4 928,199,991 859,929,107
Interest receivable 2,839,596 4,044,939
Prepayments 5 592,589,456 925,051,274
Other receivables 6 323,233,960 127,614,834
Inventories 7 10,036,548,828 10,548,061,832
Financial assets purchased under agreements to resell 8 – 230,047,000
Loans and advances to customers 9 1,513,036,793 1,555,212,556
Held-to-maturity investments 10 201,463,387 –
Other current assets 11 837,672,914 692,471,233
Total current assets 24,783,044,421 24,418,315,198
NON-CURRENT ASSETS
Available-for-sale financial investments 12 1,428,658,949 577,947,698
Long-term equity investments 13 1,322,971,835 1,239,776,313
Investment properties 14 58,320,467 58,833,998
Property, plant and equipment 15 33,806,482,252 35,522,601,715
Construction in progress 16 2,635,172,202 2,258,191,398
Intangible assets 17 1,900,941,778 1,821,768,927
Deferred tax assets 18 287,683,305 348,095,783
Total non-current assets 41,440,230,788 41,827,215,832
TOTAL ASSETS 66,223,275,209 66,245,531,030
Consolidated Statement of Financial Position
As at 30 June 2017
Renminbi Yuan
The accompanying notes are an integral part of these financial statements.

Consolidated Statement of Financial Position (Continued)As at 30 June 2017Renminbi Yuan
Maanshan Iron & Steel Company Limited
2017 InterimReport
45
LIABILITIES AND SHAREHOLDERS’ EQUITY 30 June 31 December
Note V 2017 2016
Unaudited Audited
CURRENT LIABILITIES
Deposits and balances from banks and
other financial institutions 20 2,878,114,976 3,708,225,021
Repurchase agreements 21 198,900,000 596,565,698
Short-term loans 22 4,588,142,228 6,942,952,420
Notes payable 23 3,620,019,631 3,584,228,362
Accounts payable 24 5,937,434,223 6,668,807,923
Advances from customers 25 3,419,347,414 3,682,322,418
Payroll and employee benefits payable 26 569,393,753 550,444,683
Taxes payable 27 235,899,031 274,232,114
Interest payable 28 227,033,926 107,691,398
Dividends payable 29 9,050,620 8,713,584
Other payables 30 1,825,213,618 1,912,575,078
Non-current liabilities due within one year 31 549,859,584 3,211,056,320
Accrued liabilities 32 37,187,787 29,580,435
Other current liabilities 33 4,307,180,685 2,273,058,356
Total current liabilities 28,402,777,476 33,550,453,810
NON-CURRENT LIABILITIES
Long-term loans 34 8,024,820,080 5,163,168,960
Bonds payable 35 3,991,666,667 3,987,666,667
Deferred income 36 1,260,054,211 1,269,496,538
Long-term payables 37 210,000,000 –
Long-term employee benefits payable 26 162,590,718 159,173,203
Deferred tax liabilities 18 36,607,390 35,065,411
Total non-current liabilities 13,685,739,066 10,614,570,779
Total liabilities 42,088,516,542 44,165,024,589
The accompanying notes are an integral part of these financial statements.

Consolidated Statement of Financial Position (Continued)As at 30 June 2017Renminbi Yuan
Maanshan Iron & Steel Company Limited
2017 InterimReport
46
SHAREHOLDERS’ EQUITY
Share capital 38 7,700,681,186 7,700,681,186
Capital reserve 39 8,348,606,325 8,348,726,741
Other comprehensive income 40 (110,223,013) (119,263,454)
Special reserve 41 38,116,097 27,969,571
Surplus reserve 3,843,231,617 3,843,231,617
General reserve 153,394,916 153,394,916
Retained profits/(accumulated losses) 1,452,827,892 (190,568,622)
Equity attributable to owners of the parent 21,426,635,020 19,764,171,955
Non-controlling interests 2,708,123,647 2,316,334,486
Total shareholders’ equity 24,134,758,667 22,080,506,441
TOTAL LIABILITIES AND SHAREHOLDERS’ EQUITY 66,223,275,209 66,245,531,030
The accompanying notes are an integral part of these financial statements.
The financial statements were signed by the following persons:
Legal Representative: Chief Accountant: Head of Accounting:
Ding Yi Qian Haifan Xing Qunli
LIABILITIES AND SHAREHOLDERS’ EQUITY (CONTINUED) 30 June 31 December
Note V 2017 2016
Unaudited Audited

Maanshan Iron & Steel Company Limited
2017 InterimReport
47
Consolidated Statement of Profit or LossFor the six months ended 30 June 2017Renminbi Yuan
For the six months
ended 30 June
Note V 2017 2016
Unaudited Unaudited
Revenue 42 35,187,579,640 21,001,162,560
Less: Cost of sales 42 31,308,620,140 18,177,307,489
Taxes and surcharges 43 322,600,519 105,586,947
Selling expenses 44 412,156,137 317,938,952
General and administrative expenses 45 670,018,970 1,048,469,131
Financial expenses 46 528,207,382 407,254,444
Impairment losses 47 107,667,257 672,332,416
Add: Gain on changes in fair value 14,148,342 3,461,591
Investment income 48 286,628,017 78,697,625
Including: share of profits of associates and
joint ventures 48 241,096,593 69,346,926
Other income 49 83,563,376 –
Operating profit 2,222,648,970 354,432,397
Add: Non-operating income 50 70,707,120 140,391,902
Including: profit from disposal of non-current assets 808,004 154,474
Less: Non-operating expenses 51 51,303,121 1,748,742
Including: loss from disposal of non-current assets 43,715,116 976,959
Profit before tax 2,242,052,969 493,075,557
Less: Income tax expense 52 337,919,171 62,157,221
Net profit 1,904,133,798 430,918,336
Net profit attributable to owners of the parent 1,643,396,514 452,752,971
Net profit/(loss) attributable to non-controlling interests 260,737,284 (21,834,635)
Consolidated Statement of Profit or Loss
For the six months ended 30 June 2017
Renminbi Yuan
The accompanying notes are an integral part of these financial statements.

Consolidated Statement of Profit or Loss (Continued)For the six months ended 30 June 2017Renminbi Yuan
Maanshan Iron & Steel Company Limited
2017 InterimReport
48
For the six months
ended 30 June
Note V 2017 2016
Unaudited Unaudited
Other comprehensive income, net of tax
Other comprehensive income attributable to
owners of the parent, net of tax
Other comprehensive income to be reclassified to
profit or loss in subsequent periods
Fair value changes of available-for-sale
financial investments 40 (780,770) –
Exchange differences on translation
of foreign operations 40 9,821,211 39,247,618
Other comprehensive income attributable to
non-controlling interests, net of tax 40 (506,405) 372,801
Total comprehensive income 1,912,667,834 470,538,755
Including:
Total comprehensive income attributable to
owners of the parent 1,652,436,955 492,000,589
Total comprehensive income attributable to
non-controlling interests 260,230,879 (21,461,834)
EARNINGS PER SHARE:
Basic earnings per share 53 21.34 cents 5.88 cents
Diluted earnings per share 53 21.34 cents 5.88 cents
The accompanying notes are an integral part of these financial statements.
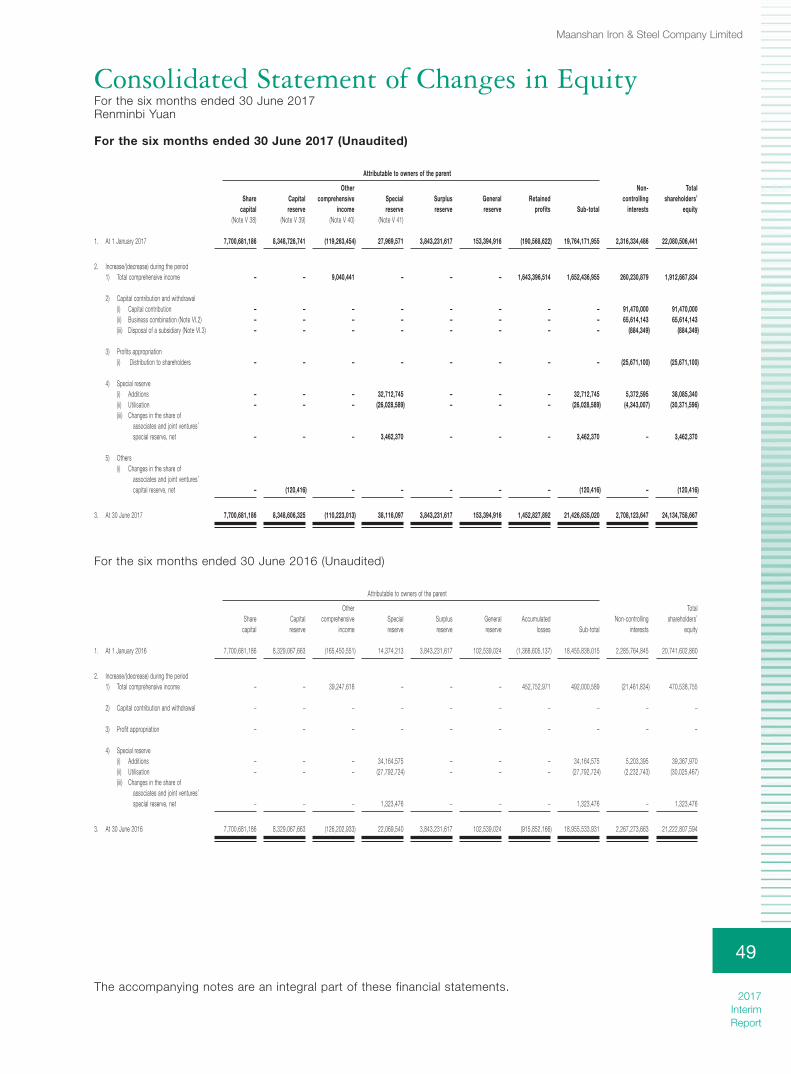
Maanshan Iron & Steel Company Limited
2017 InterimReport
49
Consolidated Statement of Changes in EquityFor the six months ended 30 June 2017Renminbi Yuan
For the six months ended 30 June 2017 (Unaudited)
Attributable to owners of the parent
Sharecapital
Capitalreserve
Othercomprehensive
incomeSpecialreserve
Surplusreserve
Generalreserve
Retainedprofits Sub-total
Non-controlling
interests
Totalshareholders’
equity(Note V 38) (Note V 39) (Note V 40) (Note V 41)
1. At 1 January 2017 7,700,681,186 8,348,726,741 (119,263,454) 27,969,571 3,843,231,617 153,394,916 (190,568,622) 19,764,171,955 2,316,334,486 22,080,506,441
2. Increase/(decrease) during the period1) Total comprehensive income – – 9,040,441 – – – 1,643,396,514 1,652,436,955 260,230,879 1,912,667,834
2) Capital contribution and withdrawal(i) Capital contribution – – – – – – – – 91,470,000 91,470,000(ii) Business combination (Note VI.2) – – – – – – – – 65,614,143 65,614,143(iii) Disposal of a subsidiary (Note VI.3) – – – – – – – – (884,349) (884,349)
3) Profits appropriation(i) Distribution to shareholders – – – – – – – – (25,671,100) (25,671,100)
4) Special reserve(i) Additions – – – 32,712,745 – – – 32,712,745 5,372,595 38,085,340(ii) Utilisation – – – (26,028,589) – – – (26,028,589) (4,343,007) (30,371,596)(iii) Changes in the share of
associates and joint ventures’ special reserve, net – – – 3,462,370 – – – 3,462,370 – 3,462,370
5) Others(i) Changes in the share of
associates and joint ventures’ capital reserve, net – (120,416) – – – – – (120,416) – (120,416)
3. At 30 June 2017 7,700,681,186 8,348,606,325 (110,223,013) 38,116,097 3,843,231,617 153,394,916 1,452,827,892 21,426,635,020 2,708,123,647 24,134,758,667
For the six months ended 30 June 2016 (Unaudited)
Attributable to owners of the parent
Sharecapital
Capitalreserve
Othercomprehensive
incomeSpecialreserve
Surplusreserve
Generalreserve
Accumulatedlosses Sub-total
Non-controllinginterests
Totalshareholders’
equity
1. At 1 January 2016 7,700,681,186 8,329,067,663 (165,450,551) 14,374,213 3,843,231,617 102,539,024 (1,368,605,137) 18,455,838,015 2,285,764,845 20,741,602,860
2. Increase/(decrease) during the period1) Total comprehensive income – – 39,247,618 – – – 452,752,971 492,000,589 (21,461,834) 470,538,755
2) Capital contribution and withdrawal – – – – – – – – – –
3) Profit appropriation – – – – – – – – – –
4) Special reserve(i) Additions – – – 34,164,575 – – – 34,164,575 5,203,395 39,367,970(ii) Utilisation – – – (27,792,724) – – – (27,792,724) (2,232,743) (30,025,467)(iii) Changes in the share of
associates and joint ventures’ special reserve, net – – – 1,323,476 – – – 1,323,476 – 1,323,476
3. At 30 June 2016 7,700,681,186 8,329,067,663 (126,202,933) 22,069,540 3,843,231,617 102,539,024 (915,852,166) 18,955,533,931 2,267,273,663 21,222,807,594
Consolidated Statement of Changes in Equity
For the six months ended 30 June 2017
Renminbi Yuan
The accompanying notes are an integral part of these financial statements.

Maanshan Iron & Steel Company Limited
2017 InterimReport
50
Consolidated Statement of Cash FlowsFor the six months ended 30 June 2017Renminbi Yuan
For the six months
ended 30 June
Note V 2017 2016
Unaudited Unaudited
1. Cash flows from operating activities
Cash received from sale of goods and
rendering service 39,139,433,476 24,635,525,466
Cash received for interest charges,
fees and commissions 50,417,268 28,465,276
Tax refunds received – 49,351,264
Net decrease in deposits in central bank – 71,727,130
Net decrease in loans and advances to customers 46,218,288 –
Net decrease in financial assets purchased
under agreements to resell 230,047,000 –
Net increase in repurchase agreements
of financial assets – 125,266,272
Cash received relating to other operating activities 54 127,463,477 197,671,817
Sub-total of cash inflows 39,593,579,509 25,108,007,225
Cash paid for purchase of goods and services (32,905,122,314) (20,570,374,534)
Cash paid to or on behalf of employees (1,926,494,889) (1,953,551,894)
Taxes and surcharges paid (1,602,505,535) (1,040,145,583)
Net increase in deposits in central bank (38,113,076) –
Net decrease in repurchase agreements
of financial assets (397,665,698) –
Net decrease in customer deposits and
deposits from banks (830,110,045) (242,347,687)
Net increase in loans and advances to customers – (337,774,106)
Cash paid for interest charges, fees and commissions (27,622,969) (8,715,820)
Cash paid relating to other operating activities 54 (406,352,927) (427,882,100)
Sub-total of cash outflows (38,133,987,453) (24,580,791,724)
Net cash flows from operating activities 55(1) 1,459,592,056 527,215,501
Consolidated Statement of Cash Flows
For the six months ended 30 June 2017
Renminbi Yuan
The accompanying notes are an integral part of these financial statements.

Consolidated Statement of Cash Flows (Continued)For the six months ended 30 June 2017Renminbi Yuan
Maanshan Iron & Steel Company Limited
2017 InterimReport
51
For the six months
ended 30 June
Note V 2017 2016
Unaudited Unaudited
2. Cash flows from investing activities
Cash received from disposal of investments – 492,416,498
Cash received from investment income 121,100,872 79,000,000
Net cash from acquisition of subsidiaries and
other operating units 115,777,566 –
Proceeds from disposal of items of property,
plant and equipment, intangible assets and
other non-current assets 2,987,026 1,265,196
Net cash from disposal of subsidiaries and
other operating units 4,854,451 –
Cash received relating to other investing activities 54 14,908,915 135,488,506
Sub-total of cash inflows 259,628,830 708,170,200
Purchases of property, plant and equipment,
intangible assets and other non-current assets (998,870,449) (1,030,427,781)
Cash paid for investments (1,188,003,566) (267,729,467)
Net increase in held-to-maturity investments (201,463,387) –
Sub-total of cash outflows (2,388,337,402) (1,298,157,248)
Net cash flows used in investing activities (2,128,708,572) (589,987,048)
The accompanying notes are an integral part of these financial statements.

Consolidated Statement of Cash Flows (Continued)For the six months ended 30 June 2017Renminbi Yuan
Maanshan Iron & Steel Company Limited
2017 InterimReport
52
For the six months
ended 30 June
Note V 2017 2016
Unaudited Unaudited
3. Cash flows from financing activities
Cash received from borrowings 7,963,827,700 7,178,827,357
Cash received relating to other financing activities 210,000,000 494,559,399
Cash received from investors 91,470,000 –
Including: capital injection from a subsidiary’s
non-controlling interests 91,470,000 –
Sub-total of cash inflows 8,265,297,700 7,673,386,756
Repayment of borrowings (8,097,524,552) (8,003,623,315)
Cash paid for distribution of dividends or profits and
for interest expenses (348,094,860) (409,300,794)
Including: dividends paid to non-controlling interests
by subsidiaries (25,671,100) –
Sub-total of cash outflows (8,445,619,412) (8,412,924,109)
Net cash flows used in financing activities (180,321,712) (739,537,353)
4. Effect of foreign exchange rate changes on cash and
cash equivalents (28,607,718) 55,156,864
5. Net decrease in cash and cash equivalents 55(2) (878,045,946) (747,152,036)
Add: Cash and cash equivalents
at the beginning of the period 4,324,131,687 3,546,410,358
6. Cash and cash equivalents at the end of the period 55(2) 3,446,085,741 2,799,258,322
The accompanying notes are an integral part of these financial statements.

Maanshan Iron & Steel Company Limited
2017 InterimReport
53
Statement of Financial PositionAs at 30 June 2017Renminbi Yuan
ASSETS 30 June 31 December
Note XIV 2017 2016
Unaudited Audited
CURRENT ASSETS
Cash and bank balances 4,037,926,638 3,851,576,750
Financial assets at fair value through profit or loss 59,155,301 3,789,546
Notes receivable 4,501,601,962 3,518,320,171
Trade receivables 1 2,322,868,045 1,953,223,578
Dividends receivable 6,356,770 5,672,730
Prepayments 457,397,696 649,277,673
Other receivables 2 167,651,845 41,040,509
Inventories 6,589,168,978 7,370,937,053
Other current assets 302,813,412 294,632,327
Total current assets 18,444,940,647 17,688,470,337
NON-CURRENT ASSETS
Available-for-sale financial investments 126,722,160 126,722,160
Long-term equity investments 3 8,387,237,440 7,152,166,287
Investment properties 72,754,527 73,988,855
Property, plant and equipment 25,857,872,098 27,272,692,483
Construction in progress 1,645,320,418 1,629,607,224
Intangible assets 919,099,327 933,763,504
Deferred tax assets 256,426,674 261,808,739
Total non-current assets 37,265,432,644 37,450,749,252
TOTAL ASSETS 55,710,373,291 55,139,219,589
Statement of Financial Position
As at 30 June 2017
Renminbi Yuan
The accompanying notes are an integral part of these financial statements.
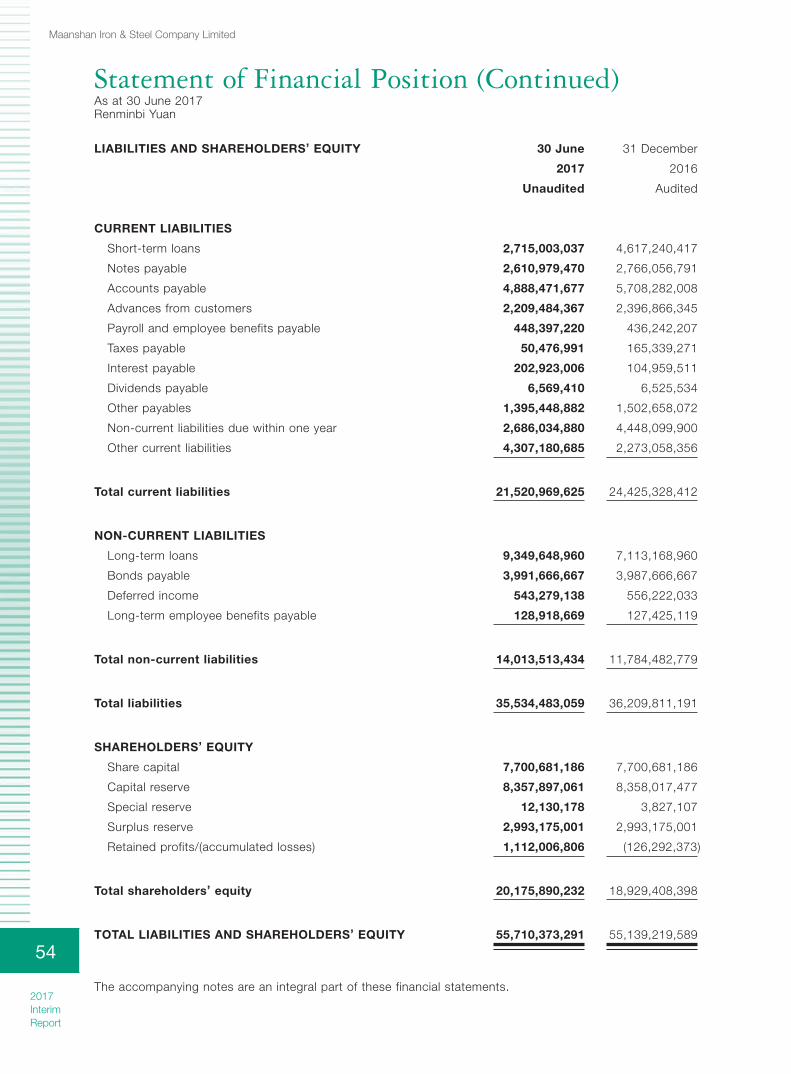
Statement of Financial Position (Continued)As at 30 June 2017Renminbi Yuan
Maanshan Iron & Steel Company Limited
2017 InterimReport
54
LIABILITIES AND SHAREHOLDERS’ EQUITY 30 June 31 December
2017 2016
Unaudited Audited
CURRENT LIABILITIES
Short-term loans 2,715,003,037 4,617,240,417
Notes payable 2,610,979,470 2,766,056,791
Accounts payable 4,888,471,677 5,708,282,008
Advances from customers 2,209,484,367 2,396,866,345
Payroll and employee benefits payable 448,397,220 436,242,207
Taxes payable 50,476,991 165,339,271
Interest payable 202,923,006 104,959,511
Dividends payable 6,569,410 6,525,534
Other payables 1,395,448,882 1,502,658,072
Non-current liabilities due within one year 2,686,034,880 4,448,099,900
Other current liabilities 4,307,180,685 2,273,058,356
Total current liabilities 21,520,969,625 24,425,328,412
NON-CURRENT LIABILITIES
Long-term loans 9,349,648,960 7,113,168,960
Bonds payable 3,991,666,667 3,987,666,667
Deferred income 543,279,138 556,222,033
Long-term employee benefits payable 128,918,669 127,425,119
Total non-current liabilities 14,013,513,434 11,784,482,779
Total liabilities 35,534,483,059 36,209,811,191
SHAREHOLDERS’ EQUITY
Share capital 7,700,681,186 7,700,681,186
Capital reserve 8,357,897,061 8,358,017,477
Special reserve 12,130,178 3,827,107
Surplus reserve 2,993,175,001 2,993,175,001
Retained profits/(accumulated losses) 1,112,006,806 (126,292,373)
Total shareholders’ equity 20,175,890,232 18,929,408,398
TOTAL LIABILITIES AND SHAREHOLDERS’ EQUITY 55,710,373,291 55,139,219,589
The accompanying notes are an integral part of these financial statements.

Maanshan Iron & Steel Company Limited
2017 InterimReport
55
Statement of Profit or LossFor the six months ended 30 June 2017Renminbi Yuan
For the six months
ended 30 June
Note XIV 2017 2016
Unaudited Unaudited
Revenue 5 29,186,631,452 18,058,111,721
Less: Cost of sales 5 26,862,921,216 15,757,662,387
Taxes and surcharges 237,603,318 72,958,537
Selling expenses 186,194,763 151,013,725
General and administrative expenses 426,802,707 460,865,245
Financial expenses 525,019,932 415,400,334
Impairment losses 94,777,557 621,092,726
Loss on changes in fair value 2,273,548 3,658,207
Add: Investment income 6 297,973,623 67,093,792
Including: share of profits of associates and
joint ventures 6 241,096,593 69,346,926
Other income 76,014,555 –
Operating profit 1,225,026,589 642,554,352
Add: Non-operating income 69,397,362 112,567,459
Including: profit from disposal of non-current assets 291,998 –
Less: Non-operating expenses 50,742,706 1,002,066
Including: loss from disposal of non-current assets 43,583,048 615,211
Profit before tax 1,243,681,245 754,119,745
Less: Income tax expense 5,382,066 78,585,194
Net profit 1,238,299,179 675,534,551
Other comprehensive income, net of tax – –
Total comprehensive income 1,238,299,179 675,534,551
Statement of Profit or Loss
For the six months ended 30 June 2017
Renminbi Yuan
The accompanying notes are an integral part of these financial statements.

Maanshan Iron & Steel Company Limited
2017 InterimReport
56
Statement of Changes in EquityFor the six months ended 30 June 2017Renminbi Yuan
For the six months ended 30 June 2017 (Unaudited)
Sharecapital
Capitalreserve
Specialreserve
Surplusreserve
Retainedprofits
Totalshareholders’
equity
1. At 1 January 2017 7,700,681,186 8,358,017,477 3,827,107 2,993,175,001 (126,292,373) 18,929,408,398
2. Increase/(decrease) during the period1) Total comprehensive income – – – – 1,238,299,179 1,238,299,179
2) Capital contribution and withdrawal – – – – – –
3) Profit appropriation – – – – – –
4) Special reserve(i) Additions – – 17,456,654 – – 17,456,654(ii) Utilisation – – (12,615,953) – – (12,615,953)(iii) Changes in the share of
associates and joint ventures’ special reserve, net – – 3,462,370 – – 3,462,370
5) Others(i) Changes in the share of
associates and joint ventures’ capital reserve, net – (120,416) – – – (120,416)
3. At 30 June 2017 7,700,681,186 8,357,897,061 12,130,178 2,993,175,001 1,112,006,806 20,175,890,232
For the six months ended 30 June 2016 (Unaudited)
Sharecapital
Capitalreserve
Specialreserve
Surplusreserve
Accumulatedlosses
Totalshareholders’
equity
1. At 1 January 2016 7,700,681,186 8,338,358,399 (1,517,185) 2,993,175,001 (1,488,834,218) 17,541,863,183
2. Increase/(decrease) during the period1) Total comprehensive income – – – – 675,534,551 675,534,551
2) Capital contribution and withdrawal – – – – – –
3) Profit appropriation – – – – – –
4) Special reserve(i) Additions – – 19,224,132 – – 19,224,132(ii) Utilisation – – (19,224,131) – – (19,224,131)(iii) Changes in the share of
associates and joint ventures’ special reserve, net – – 1,323,476 – – 1,323,476
3. At 30 June 2016 7,700,681,186 8,338,358,399 (193,708) 2,993,175,001 (813,299,667) 18,218,721,211
Statement of Changes in Equity
For the six months ended 30 June 2017
Renminbi Yuan
The accompanying notes are an integral part of these financial statements.
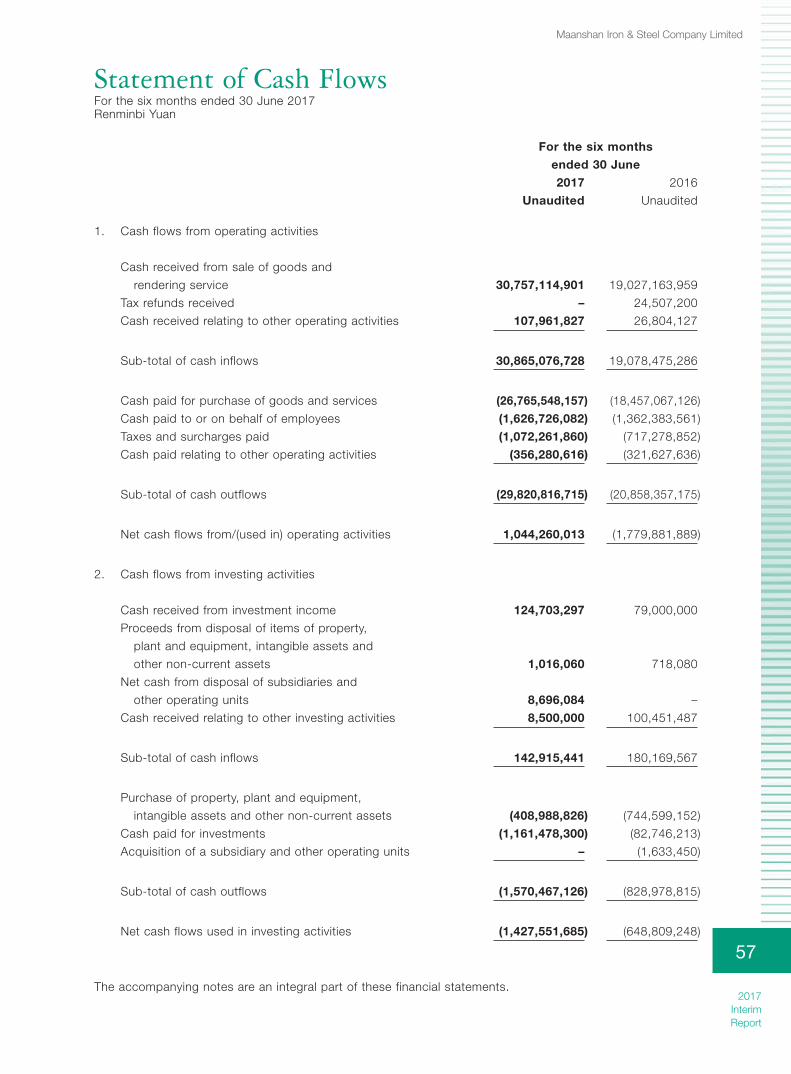
Maanshan Iron & Steel Company Limited
2017 InterimReport
57
Statement of Cash FlowsFor the six months ended 30 June 2017Renminbi Yuan
For the six months
ended 30 June
2017 2016
Unaudited Unaudited
1. Cash flows from operating activities
Cash received from sale of goods and
rendering service 30,757,114,901 19,027,163,959
Tax refunds received – 24,507,200
Cash received relating to other operating activities 107,961,827 26,804,127
Sub-total of cash inflows 30,865,076,728 19,078,475,286
Cash paid for purchase of goods and services (26,765,548,157) (18,457,067,126)
Cash paid to or on behalf of employees (1,626,726,082) (1,362,383,561)
Taxes and surcharges paid (1,072,261,860) (717,278,852)
Cash paid relating to other operating activities (356,280,616) (321,627,636)
Sub-total of cash outflows (29,820,816,715) (20,858,357,175)
Net cash flows from/(used in) operating activities 1,044,260,013 (1,779,881,889)
2. Cash flows from investing activities
Cash received from investment income 124,703,297 79,000,000
Proceeds from disposal of items of property,
plant and equipment, intangible assets and
other non-current assets 1,016,060 718,080
Net cash from disposal of subsidiaries and
other operating units 8,696,084 –
Cash received relating to other investing activities 8,500,000 100,451,487
Sub-total of cash inflows 142,915,441 180,169,567
Purchase of property, plant and equipment,
intangible assets and other non-current assets (408,988,826) (744,599,152)
Cash paid for investments (1,161,478,300) (82,746,213)
Acquisition of a subsidiary and other operating units – (1,633,450)
Sub-total of cash outflows (1,570,467,126) (828,978,815)
Net cash flows used in investing activities (1,427,551,685) (648,809,248)
Statement of Cash Flows
For the six months ended 30 June 2017
Renminbi Yuan
The accompanying notes are an integral part of these financial statements.

Statement of Cash Flows (Continued)For the six months ended 30 June 2017Renminbi Yuan
Maanshan Iron & Steel Company Limited
2017 InterimReport
58
For the six months
ended 30 June
2017 2016
Unaudited Unaudited
3. Cash flows from financing activities
Cash received from borrowings 7,637,471,840 3,877,525,413
Cash received relating to other financing activities – 213,511,565
Sub-total of cash inflows 7,637,471,840 4,091,036,978
Repayment of borrowings (7,051,341,593) (2,073,057,489)
Cash paid for the distribution of dividend or profits and
for interest expenses (306,602,492) (284,981,145)
Sub-total of cash outflows (7,357,944,085) (2,358,038,634)
Net cash flows from financing activities 279,527,755 1,732,998,344
4. Effect of foreign exchange rate changes on cash and
cash equivalents (34,286,195) 49,424,315
5. Net decrease in cash and cash equivalents (138,050,112) (646,268,478)
Add: Cash and cash equivalents
at the beginning of the period 3,851,576,750 4,025,186,295
6. Cash and cash equivalents at the end of the period 3,713,526,638 3,378,917,817
The accompanying notes are an integral part of these financial statements.

Maanshan Iron & Steel Company Limited
2017 InterimReport
59
Notes to Interim Financial Statements30 June 2017Renminbi Yuan
I. GENERAL INFORMATION OF THE GROUP
Maanshan Iron & Steel Company Limited (the “Company”), a joint stock limited company incorporated
after the reorganisation of a state-owned enterprise known as Maanshan Iron and Steel Company
(the “Original Magang”, now named as Magang (Group) Holding Company Limited), was established
in Maanshan City, Anhui Province, the People’s Republic of China (the “PRC”) on 1 September 1993.
The unified social credit code of the Company’s business license is 91340000610400837Y. The
Company’s A shares and H shares were issued and listed on the Shanghai Stock Exchange and Hong
Kong Stock Exchange, respectively. The headquarters of the Company are located at No. 8 Jiu Hua Xi
Road, Maanshan City, Anhui Province, the PRC.
As of 30 June 2017, the Company had issued 7,700,680,000 shares in total, including ordinary A
shares of 5,967,750,000 shares and ordinary H shares of 1,732,930,000. The nominal value of each
share is RMB1.
The Company together with its subsidiaries (collectively known as the “Group”) is principally engaged
in the manufacture and sale of iron and steel products and related by-products.
The parent of the Group is Magang (Group) Holding Company Limited (the “Holding”), which is
established in the PRC.
The financial statements were approved by the board of directors on 23 August 2017.
The scope of the consolidated financial statements is determined on the control basis. The change in
the scope of consolidation during the period is described in Note VI.
The interim financial statements were unaudited.
II. BASIS OF PREPARATION
The financial statements were prepared in accordance with “China Accounting Standards for Business
Enterprises – General Principles” and other issued application guidance, interpretations and other
related regulations issued later (collectively known as the “CAS”).
The consolidated financial statements were prepared on going concern basis.
As of 30 June 2017, the net current liabilities of the Group amounted to RMB3,619,733,055. The
directors of the Company have considered the availability of funding sources, including but not limited
to an unused banking credit quota of RMB18.7 billion obtained on 30 June 2017. After assessment,
the Company’s board of directors believes that the Group has sufficient resources to continue as a
going concern for not less than 12 months after the end of reporting period. Therefore, the Company’s
board of directors continues to prepare the Group’s interim financial statements for the six months
ended 30 June 2017 on a going concern basis.
The financial statements have been prepared under the historical cost convention, except for certain
financial instruments which have been measured at fair value. Provision for asset impairment is
provided in accordance with related regulations.
Notes to Interim Financial Statements
30 June 2017
Renminbi Yuan

Notes to Interim Financial Statements (Continued)30 June 2017Renminbi Yuan
Maanshan Iron & Steel Company Limited
2017 InterimReport
60
III. SIGNIFICANT ACCOUNTING POLICIES AND ACCOUNTING ESTIMATES
The Group has determined the accounting policies and accounting estimates based on the
characteristics of the operation, especially those related to bad debt provision for trade receivables
and inventory provision, depreciation of fixed assets, amortisation of intangible assets, impairment of
non-current assets excluding the financial instruments (other than goodwill), recognition of deferred
tax assets, recognition and measurement of revenue, etc.
1. STATEMENT OF COMPLIANCE WITH THE CAS
The financial statements have been prepared in accordance with the CAS, and presented truly
and completely the financial position of the Company and the Group as of 30 June 2017, and
the results of their operations and their cash flows for the six months ended 30 June 2017.
2. ACCOUNTING PERIOD
The accounting year of the Group is from 1 January to 31 December of each calendar year.
3. REPORTING CURRENCY
Renminbi, in which the financial statements are presented, is used as the Group’s recording
and functional currency. All values are rounded to the nearest Renminbi Yuan (“RMB”) except
when otherwise indicated.
The Group’s subsidiaries use their respective local currencies as the reporting currencies for
recording purposes in accordance with their own operating environment, which are translated
into Renminbi in the preparation of the consolidated financial statements.
4. BUSINESS COMBINATION
A business combination represents a transaction or event where two, or more than two
separate entities form one reporting entity. Business combinations are classified into “Business
combination involving entities under common control” and “Business combination involving
entities not under common control.”
Business combination involving entities under common control
Business combination involving entities under common control is a business combination in
which all of the combining entities are ultimately controlled by the same party or parties both
before and after the business combination, and that control is not transitory. Under a business
combination involving entities under common control, the combining entity obtains control of
another involving entity on the combination date. The combination date is the date on which
the combining entity effectively obtains control of the entity being combined.

Notes to Interim Financial Statements (Continued)30 June 2017Renminbi Yuan
Maanshan Iron & Steel Company Limited
2017 InterimReport
61
III. SIGNIFICANT ACCOUNTING POLICIES AND ACCOUNTING ESTIMATES (CONTINUED)
4. BUSINESS COMBINATION (CONTINUED)
Business combination involving entities under common control (Continued)
The assets and liabilities obtained under common control (including the goodwill arising
from the acquisition of the acquiree as part of the ultimate controlling party’s investment)
are measured at the carrying amounts as recorded by the ultimate controlling party at the
acquisition date. The difference between the carrying amount of the net assets obtained and
the carrying amount of the consideration paid for the combination (or the total face value of
the shares issued) is adjusted to share premium, which is included in the capital reserve. If
the balance of the share premium reserve is insufficient, any excess is adjusted to retained
earnings.
Business combination involving entities not under common control
Business combination involving entities not under common control is a business combination
in which all of the combining entities are not ultimately controlled by the same party or parties
before and after the business combination. Under a business combination involving entities
not under common control, the involving entity (the acquirer) obtains control of other involving
entities (the acquiree) on the acquisition date. The acquisition date is the date on which the
acquirer effectively obtains control of the acquiree.
The acquirer shall, at the acquisition date, recognise the acquiree’s identifiable assets, liabilities
and contingent liabilities that satisfy the recognition criteria at their fair values at the date of
acquisition.
Any excess of the sum of the fair value of the consideration paid for a business combination
(or the fair value of equity securities issued) and the fair value of the acquiree’s equity interest
held before the acquisition date over the acquirer’s interest in the fair value of the acquiree’s
identifiable net assets is recorded as goodwill, which is measured at cost less any accumulated
impairment losses subsequently. If the acquirer’s interest in the net fair value of the acquiree’s
identifiable net assets exceeds the sum of the fair value of the consideration paid for a business
combination (or the fair value of equity securities issued) and the fair value of the acquiree’s
equity interest held before the acquisition date, the acquirer shall reassess the measurement of
the fair value of the acquiree’s identifiable assets, liabilities or contingent liabilities, as well as
the fair value of the consideration paid for a business combination (or the fair value of equity
securities issued) and the fair value of the acquiree’s equity interest held before the acquisition
date, and recognise immediately in profit or loss any excess remaining after reassessment.

Notes to Interim Financial Statements (Continued)30 June 2017Renminbi Yuan
Maanshan Iron & Steel Company Limited
2017 InterimReport
62
III. SIGNIFICANT ACCOUNTING POLICIES AND ACCOUNTING ESTIMATES (CONTINUED)
5. CONSOLIDATED FINANCIAL STATEMENTS
The scope of the consolidated financial statements is determined on the control basis, which
consists of financial statements of the Company and its subsidiaries for the six months ended
30 June 2017. A subsidiary is a company or entity that is controlled by the Company.
The financial year of subsidiaries is coterminous and the accounting policies of subsidiaries
are applied consistently with those of the Company when preparing consolidated financial
statements. All intercompany balances, transactions and unrealised gains and losses resulting
from intercompany transactions, and dividends within the Group are fully eliminated on
consolidation.
Where the current loss assumed by non-controlling shareholders of a subsidiary exceeds the
opening minority interests, the balance offsets non-controlling interests.
For subsidiaries acquired through a business combination involving entities not under common
control, the operating results and cash flows of the acquired company are included in the
consolidated financial statements from the acquisition date until the date on which the Group
ceases the control of the subsidiary. In preparing the consolidated financial statements,
adjustments are made to the subsidiaries’ financial statements based on the fair value of the
identifiable assets, liabilities and contingent liabilities at the acquisition date.
For subsidiaries acquired through a business combination involving entities under common
control, the operating results and cash flows of a subsidiary are included in the consolidated
financial statements from the beginning of the combination period. In preparing consolidated
financial statements, adjustments are made to related items in prior years’ financial statements,
as if the combination had occurred from the date when the combining entities first came under
control of the ultimate controlling party.
The investor shall reassess its control when changes in relevant facts and circumstances lead
to changes in the elements of control.
Any change in the non-controlling interests without losing control is recognised as an equity
transaction.
6. JOINT ARRANGEMENTS AND JOINT OPERATIONS
A joint arrangement is classified as either a joint operation or a joint venture. A joint operation is
a joint arrangement whereby the parties that have joint control of the arrangement have rights
to the assets and obligations for the liabilities, relating to the arrangement. A joint venture is a
type of joint arrangement whereby the parties that have joint control of the arrangement have
rights to the net assets of the joint venture.
The joint arrangements of the Group are all joint ventures.

Notes to Interim Financial Statements (Continued)30 June 2017Renminbi Yuan
Maanshan Iron & Steel Company Limited
2017 InterimReport
63
III. SIGNIFICANT ACCOUNTING POLICIES AND ACCOUNTING ESTIMATES (CONTINUED)
7. CASH AND CASH EQUIVALENTS
Cash represents cash on hand and deposits which are readily available for payment. Cash
equivalents represent the Group’s short-term highly liquid investments which are readily
convertible into known amounts of cash and subject to an insignificant risk of changes in value.
8. FOREIGN OPERATIONS AND FOREIGN CURRENCY TRANSLATION
The Group translates foreign currencies into the reporting currency when foreign currency
transactions occur.
Foreign currency transactions are initially recorded using the functional currency rates ruling
at the dates of the transactions. Monetary items denominated in foreign currencies are
translated into functional currencies at the rates of exchange ruling at the end of the reporting
period. The resulting exchange differences are recognised in profit or loss, except for those
arising from the principals and interest on foreign currency borrowings specifically for the
purpose of acquisition, construction or production of qualifying assets. Non-monetary items
denominated in foreign currencies that are measured at historical cost are translated into
functional currencies using the foreign exchange rates at the transaction date. Non-monetary
items denominated in foreign currencies that are measured at fair value are translated using the
foreign exchange rates at the date the fair value is determined, and the exchange differences
are recognised in profit or loss or other comprehensive income.
The Group translates functional currencies of overseas businesses into Renminbi when
preparing financial statements. All assets and liabilities are translated at the rates of exchange
ruling at the end of the reporting period; shareholders’ equity, with the exception of retained
profits, are translated at the rates of exchange ruling at the transaction date; all income and
expense items in the statement of comprehensive income are translated at the average rates
of exchange during the period. Exchange differences arising from the translation mentioned
above are recognised as other comprehensive income. When an overseas business is disposed
of, other comprehensive income of the overseas business will be transferred to profit or loss
in the same period. In the case of a partial disposal, only the proportionate share of other
comprehensive income is transferred to profit or loss.
The foreign currency cash flows and cash flows of a foreign subsidiary shall be translated at
the rates of exchange ruling at the dates of the cash flows. The effect of changes in rates of
exchange on cash and cash equivalents is presented separately in the statement of cash flows.
9. FINANCIAL INSTRUMENTS
A financial instrument is any contract that gives rise to a financial asset of one entity and a
financial liability or equity instrument of another entity.

Notes to Interim Financial Statements (Continued)30 June 2017Renminbi Yuan
Maanshan Iron & Steel Company Limited
2017 InterimReport
64
III. SIGNIFICANT ACCOUNTING POLICIES AND ACCOUNTING ESTIMATES (CONTINUED)
9. FINANCIAL INSTRUMENTS (CONTINUED)
Recognition and derecognition of financial instruments
The Group recognises a financial asset or a financial liability when, and only when, it becomes a
party to the contractual provisions of the instrument.
A financial asset (either a part of financial asset or a part of a group of similar financial assets)
will be derecognised, which means writing off from the account and the statement of financial
position:
(1) The contractual rights to the cash flows from the financial asset expire; or
(2) It transfers the contractual rights to receive the cash flows of the financial asset, or
assumes a contractual obligation to pay the cash flows to one or more recipients in
a “transfer arrangement” and that (a) substantially transfers all the risks and rewards
of ownership of the financial asset, or (b) neither transfers nor retains substantially all
the risks and rewards of ownership of the financial asset, but abandons control of the
financial asset.
A financial liability is derecognised when, and only when, the current obligation is discharged
or cancelled or expires. If an existing financial liability is replaced by the same debtor with a
new financial liability, whose contractual stipulations is substantially different from those of the
existing financial liability, or if an enterprise makes substantial revisions to almost all of the
contractual stipulations of the existing financial liability, it shall terminate the recognition of the
existing financial liability, and at the same time recognise the financial liability after revising the
contractual stipulation as a new financial liability, and the difference is recognised in profit or
loss.
All financial assets purchased or sold in a regular way are recognised or derecognised on the
trade date, that is, the date that the Group commits to purchase or sell the asset. Regular way
purchases or sales are purchases or sales of financial assets that require delivery of assets
within the period generally established by regulation or convention in the marketplace.
Classification and measurement of financial assets
The Group classifies its financial assets into four categories at initial recognition, including:
financial assets at fair value through profit or loss, held-to-maturity investments, loans and
receivables, and available-for-sale financial investments. Financial assets are measured at fair
value initially. For financial assets at fair value through profit or loss, the directly associated
transaction costs are charged to profit or loss; for other financial assets, the directly associated
transaction costs are recognised as initial investment costs.

Notes to Interim Financial Statements (Continued)30 June 2017Renminbi Yuan
Maanshan Iron & Steel Company Limited
2017 InterimReport
65
III. SIGNIFICANT ACCOUNTING POLICIES AND ACCOUNTING ESTIMATES (CONTINUED)
9. FINANCIAL INSTRUMENTS (CONTINUED)
Classification and measurement of financial assets (Continued)
The subsequent measurement of financial assets depends on their classification as follows:
Financial assets at fair value through profit or loss
Financial assets at fair value through profit or loss comprise financial assets held for trading
and those that are designated as at fair value through profit or loss upon initial recognition.
A financial asset is classified as held for trading if it is: 1) acquired principally for the purpose
of selling it in the near term; 2) part of a portfolio of identified financial instruments that are
managed together and for which there is evidence of a recent actual pattern of short-term
profit-taking; or 3) a derivative (except for a derivative that is a financial guarantee contract or a
designated and effective hedging instrument, or is linked to and must be settled by delivery of
such unquoted equity instruments in an active market, and whose fair value cannot be reliably
measured). Such financial assets are measured under the fair value method subsequently. All
the realised and unrealised gains or losses are recognised in profit or loss. All dividends or
interest related to financial assets at fair value through profit or loss is recognised in profit or
loss.
Financial assets are designated as financial assets at fair value through profit or loss, if one of
the following criteria is satisfied:
(1) The designation is able to eliminate or obviously reduce the discrepancies in the
recognition or measurement of the relevant gains or losses arising from the different
measurement bases of financial instruments.
(2) Official written documents on risk management or investment strategies have recorded
that the combination of financial instruments will be managed, evaluated and reported to
key management personnel on the basis of fair value.
(3) Hybrid instruments which contain one or more embedded derivatives, unless the
embedded derivatives does not have a substantial effect on the cash flows of the hybrid
instruments, or the embedded derivatives obviously should not be separated from the
relevant hybrid instruments.
(4) Hybrid instruments which contain embedded derivatives that should split, but cannot be
measured separately when acquired or at the end of subsequent reporting period.

Notes to Interim Financial Statements (Continued)30 June 2017Renminbi Yuan
Maanshan Iron & Steel Company Limited
2017 InterimReport
66
III. SIGNIFICANT ACCOUNTING POLICIES AND ACCOUNTING ESTIMATES (CONTINUED)
9. FINANCIAL INSTRUMENTS (CONTINUED)
Classification and measurement of financial assets (Continued)
Financial assets at fair value through profit or loss (Continued)
For the equity investment where there is not a quoted market price from an active market or the fair value cannot be reliably measured, such equity investment shall not be designated as a financial asset at fair value through profit or loss.
Upon the designation of a financial asset as a financial asset at fair value through profit or loss at initial recognition, it shall not be reclassified to other categories of financial assets. Also, assets from other categories of financial assets shall not be reclassified to financial assets at fair value through profit or loss.
In accordance with the above conditions, the financial assets of this kind designated by the Group are mainly money market fund and financial products issued by banks.
Held-to-maturity investments
Held-to-maturity investments are non-derivative financial assets with fixed or determinable payments and fixed maturity that the Group has the positive intention and ability to hold to maturity. Held-to-maturity investments are subsequently measured at amortised cost using the effective interest rate method. Gains or losses are recognised in profit or loss when the held-to-maturity investments are derecognised, impaired, or amortised.
Loans and receivables
Loans and receivables are non-derivative financial assets with fixed or determinable payments that are unquoted in an active market. Loans and receivables are subsequently measured at amortised cost using the effective interest rate method. Gains or losses are recognised in profit or loss when the loans and receivables are derecognised, impaired, or amortised.
Available-for-sale financial investments
Available-for-sale financial investments are those non-derivative financial assets that are initially designated as available for sale or are not classified as the above-mentioned categories of financial instruments. Such available-for-sale financial investments are measured at fair value in subsequent measurement. The premium or discount is amortised using the effective interest method, with interest recognised as interest income or expense. The fair value changes of available-for-sale financial assets are recognised as other comprehensive income except for changes arising from impairment losses or foreign exchange conversion on non-Renminbi monetary financial assets which are recognised in profit or loss. When the financial asset is derecognised or impaired, the accumulated gains or losses recognised in prior periods are transferred to profit or loss. All dividends or interest income related to available-for-sale financial investments are recognised in profit or loss.
Investments in equity instruments that do not have a quoted market price in an active market and whose fair value cannot be reliably measured are measured at cost.

Notes to Interim Financial Statements (Continued)30 June 2017Renminbi Yuan
Maanshan Iron & Steel Company Limited
2017 InterimReport
67
III. SIGNIFICANT ACCOUNTING POLICIES AND ACCOUNTING ESTIMATES (CONTINUED)
9. FINANCIAL INSTRUMENTS (CONTINUED)
Classification and measurement of financial liabilities
The Group classifies its financial liabilities, when they are recognised initially as financial
liabilities at fair value through profit or loss and other financial liabilities. With respect to financial
liabilities at fair value through profit or loss, transaction costs are charged to profit or loss;
whereas for other financial liabilities, transaction costs are recognised as initial costs.
The subsequent measurement of financial liabilities depends on their classification:
Financial liabilities at fair value through profit or loss
Financial liabilities at fair value through profit or loss comprise financial liabilities held for trading
and those that are designated as at fair value through profit or loss upon initial recognition.
A financial liability is classified as held for trading if it is: incurred principally for the purpose
of repurchasing in the near term; part of a portfolio of identified financial instruments that are
managed together and for which there is evidence of a recent actual pattern of short-term
profit-taking; or a derivative (except for a derivative that is a financial guarantee contract or a
designated and effective hedging instrument, or is linked to and must be settled by delivery of
such unquoted equity instruments in an active market, and whose fair value cannot be reliably
measured). Such financial liabilities are subsequently measured at fair value. All the realised and
unrealised gains or losses are recognised in profit or loss.
Upon the designation of a financial liability as a financial liability at fair value through profit or
loss at initial recognition, it shall not be reclassified to other categories of financial liabilities.
Also, liabilities from other categories of financial liabilities shall not be reclassified to financial
liabilities at fair value through profit or loss.
Other financial liabilities
Other financial liabilities are subsequently measured at amortised cost using the effective
interest rate method.
Offsetting of financial instruments
Financial assets and financial liabilities are offset and the net amount is reported in the
statement of financial position if there is a currently enforceable legal right to offset the
recognised amounts and there is an intention to settle on a net basis, or to realise the assets
and settle the liabilities simultaneously.
Notes to Interim Financial Statements (Continued)30 June 2017Renminbi Yuan
Maanshan Iron & Steel Company Limited
2017 InterimReport
68
III. SIGNIFICANT ACCOUNTING POLICIES AND ACCOUNTING ESTIMATES (CONTINUED)
9. FINANCIAL INSTRUMENTS (CONTINUED)
Impairment of financial assets
The Group assesses the carrying amount of a financial asset at the end of each reporting
period and provides impairment provision when there is any objective evidence that the
financial asset is impaired. Such objective evidence refers to events that occurred after the
initial recognition of the financial asset and could impact the estimated future cash flows of the
financial asset, and such impacts can be reliably measured. Evidence of impairment of financial
assets may include indications that a debtor or a group of debtors is experiencing significant
financial difficulty, default or delinquency in interest or principal payments, the probability that
they will enter bankruptcy or other financial reorganisation and observable data indicating that
there is a measureable decrease in the estimated future cash flows, such as changes in arrears
or economic conditions that correlate with defaults.
Financial assets carried at amortised cost
When an impairment loss has incurred, the amount of the loss is measured as the difference
between the asset’s carrying amount and the present value of estimated future cash flows
(excluding future credit losses that have not been incurred). The present value of the estimated
future cash flows is discounted at the financial asset’s original effective interest rate (i.e.,
the effective interest rate computed at initial recognition) and take the value of the relevant
guarantee into consideration. Accordingly, the relevant interest income is recognised based on
the discount rate of the present value of the estimated future cash flows when an impairment
loss has incurred. In respect of loans and trade receivables, if the expectation of recovery does
not exist and all collateral is realised or transferred into the Group, loans and trade receivables
and the relevant impairment loss will be written off.
For assets that are individually significant, impairment assessment is made on an individual
basis, and an impairment loss is recognised in profit or loss when objective evidence of
impairment exists. Assets that are individually insignificant are assessed for impairment
individually.
If, in a subsequent period, the amount of the impairment loss decreases and the decrease can
be related objectively to an event occurring after the impairment was recognised, the previously
recognised impairment loss is reversed and recognised in profit or loss. The reversal shall not
result in a carrying amount of the financial asset that exceeds what the amortised cost would
be had the impairment not been recognised at the reversal date.
Notes to Interim Financial Statements (Continued)30 June 2017Renminbi Yuan
Maanshan Iron & Steel Company Limited
2017 InterimReport
69
III. SIGNIFICANT ACCOUNTING POLICIES AND ACCOUNTING ESTIMATES (CONTINUED)
9. FINANCIAL INSTRUMENTS (CONTINUED)
Impairment of financial assets (Continued)
Available-for-sale financial investments
If an available-for-sale financial investments is impaired, an amount comprising the difference
between its cost (net of any principal payment and amortisation) and its current fair value,
less any impairment loss previously recognised in profit or loss, is removed from other
comprehensive income and recognised in profit or loss.
In the case of equity investments classified as available for sale, objective evidence would
include a significant or prolonged decline in the fair value of an investment below its cost.
“Significant” is evaluated against the original cost of the investment and “prolonged” against
the period in which the fair value has been below its original cost. Where there is evidence of
impairment, the cumulative loss – measured as the difference between the acquisition cost
and the current fair value, less any impairment loss on that investment previously recognised in
profit or loss – is removed from other comprehensive income and recognised in profit or loss.
Impairment losses on equity instruments classified as available for sale are not reversed through
profit or loss. Increases in their fair value after impairment are recognised directly in other
comprehensive income.
The determination of what is “significant” or “prolonged” requires judgment. In making this
judgment, the Group evaluates, among other factors, the duration or extent to which the fair
value of an investment is less than its cost.
Impairment losses on debt instruments are reversed through profit or loss if the subsequent
increase in fair value of the instruments can be objectively related to an event occurring after
the impairment loss was recognised in profit or loss.
Financial assets carried at cost
If there is objective evidence that an impairment loss has incurred, the amount of the loss is
measured as the difference between the asset’s carrying amount and the present value of
estimated future cash flows discounted at the current market rate of return for a similar financial
asset and recognised in profit or loss. Impairment losses on these assets are not reversed.

Notes to Interim Financial Statements (Continued)30 June 2017Renminbi Yuan
Maanshan Iron & Steel Company Limited
2017 InterimReport
70
III. SIGNIFICANT ACCOUNTING POLICIES AND ACCOUNTING ESTIMATES (CONTINUED)
9. FINANCIAL INSTRUMENTS (CONTINUED)
Transfer of financial assets
If the Group transfers substantially all the risks and rewards of ownership of the assets, it shall
derecognise the financial assets. Whereas, if it retains substantially all the risks and rewards of
ownership of the assets, it should not derecognise the financial assets.
When the Group has neither transferred nor retained substantially all the risks and rewards of
the financial asset, the following treatment shall be used: if the control over the financial asset
is lost, the Group should derecognise the financial asset and recognise the related assets
and liabilities incurred; if the Group has not lost control over the financial asset, the Group
recognises the financial asset to the extent of its continuing involvement of the financial asset
and recognises an associated liability.
Continuing involvement that takes the form of a guarantee over the transferred asset is
measured at the lower of the original carrying amount of the asset and the maximum amount of
consideration that the Group could be required to repay.
10. RECEIVABLES/LOANS AND ADVANCES TO CUSTOMERS
(1) The Group assesses impairment individually for financial assets that are individually
significant. The benchmark is RMB2 million. If there is objective evidence that an
impairment loss has been incurred, the amount of loss is charged to the profit or loss.
(2) For financial assets that are not individually significant, if there is objective evidence that
an impairment loss has been incurred, the amount is recognised as an impairment loss
and charged to profit or loss.
(3) Since loans and advances to customers have similar credit risk characteristics, they are
managed as a group of financial assets, and the bad debt provision for them is accrued
at no less than 2.5% of the balance as of the period end, and the amount is recognised
as an impairment loss and charged to profit or loss.

Notes to Interim Financial Statements (Continued)30 June 2017Renminbi Yuan
Maanshan Iron & Steel Company Limited
2017 InterimReport
71
III. SIGNIFICANT ACCOUNTING POLICIES AND ACCOUNTING ESTIMATES (CONTINUED)
11. INVENTORIES
Inventories include raw materials, work in progress, finished goods and spare parts.
Inventories are initially recognised at cost, which comprises purchase cost, processing cost,
and other costs. Costs of delivered inventories, other than construction contracts and spare
parts, are determined on the weighted average basis. Costs of general spare parts, lower
valued consumables and packing materials are charged to profit or loss when issued; accident
spare parts are amortised in 8 years with 4% residual rate; large rolls on rolling mills are
amortised according to the grinding amount.
Inventories are accounted for using the perpetual inventory system.
At the end of each reporting period, inventories shall be measured at the lower of cost and
net realisable value. If the cost is in excess of the amounts expected to be realised from their
sale or use, provision for inventories is recognised in profit or loss. When the circumstances
that previously caused inventories to be written down below cost no longer exist and the net
realisable value is higher than the carrying amount, the original amount of the write-down is
reversed and charged to profit or loss.
Net realisable value is the estimated selling price on normal business terms deducted by the
estimated costs to completion, the estimated selling expenses and related taxes. Provision is
considered on a category basis for raw materials, and on an individual basis for finished goods.
And for the inventories sold, the carrying amount of the inventory should be recognised as an
expense in the period in which revenue was recognised, and the inventory provision should be
written back accordingly, and the current period’s cost of sales should be reversed.
12. LONG-TERM EQUITY INVESTMENTS
Long-term equity investments consist of equity investments in subsidiaries, joint ventures and
associates.

Notes to Interim Financial Statements (Continued)30 June 2017Renminbi Yuan
Maanshan Iron & Steel Company Limited
2017 InterimReport
72
III. SIGNIFICANT ACCOUNTING POLICIES AND ACCOUNTING ESTIMATES (CONTINUED)
12. LONG-TERM EQUITY INVESTMENTS (CONTINUED)
Long-term equity investments are recognised at initial investment cost upon acquisition.
For a long-term equity investment acquired through a business combination under common
control, the initial investment cost of the long-term equity investment shall be the absorbing
party’s share of the carrying amount of the owners’ equity of the party being absorbed in the
consolidated financial statements of the ultimate controlling party at combination date. The
difference between the initial investment cost and the carrying amount of cash paid, non-cash
assets transferred and liabilities assumed shall be adjusted to capital reserve. If the balance of
capital reserve is not sufficient, any excess shall be adjusted to retained earnings. Any other
comprehensive income previously recognised shall be accounted for on the same basis as
would have been required if the investee had directly disposed of the related assets or liabilities.
The portion recognised based on changes in the investee’s equity (other than net profit or loss,
other comprehensive income and profit distribution) is charged to profit or loss upon disposal
of such long-term equity investment. For those partially disposed equity investments, gains or
losses upon disposal are proportionately recognised in profit or loss when they still constitutes
long-term equity investments after the disposal and are fully charged to profit or loss when they
are reclassified to financial instruments after the disposal. For business combination involving
entities not under common control, the initial investment cost should be the cost of acquisition
(for step acquisitions not under common control, the initial investment cost is the sum of the
carrying amount of the equity investment in the acquiree held before the acquisition date and
the additional investment cost paid on the acquisition date), which is the sum of the fair value
of assets transferred, liabilities incurred or assumed and equity instruments issued. If the equity
investments in the acquiree involve other comprehensive income prior to the acquisition date,
when disposing of the investments, the relevant other comprehensive income will be accounted
for on the same basis as would have been required if the investee had directly disposed of the
related assets or liabilities. The portion recognised based on changes in the investee’s equity
(other than net profit or loss, other comprehensive income and profit distribution) is charged to
profit or loss upon disposal of such long-term equity investment. For those partially disposed
equity investments, gains or losses upon disposal are proportionately recognised in profit or
loss when they still constitutes long-term equity investments after the disposal and are fully
charged to profit or loss when they are reclassified to financial instruments after the disposal.
The initial investment cost of a long-term equity investment acquired otherwise than through
a business combination shall be determined as follows: for a long-term equity investment
acquired by paying cash, the initial investment cost shall be the actual purchase price has
been paid plus those costs, taxes and other necessary expenditures directly attributable to
the acquisition of the long-term equity investment; for those acquired by the issue of equity
securities, the initial investment cost shall be the fair value of the equity securities issued.

Notes to Interim Financial Statements (Continued)30 June 2017Renminbi Yuan
Maanshan Iron & Steel Company Limited
2017 InterimReport
73
III. SIGNIFICANT ACCOUNTING POLICIES AND ACCOUNTING ESTIMATES (CONTINUED)
12. LONG-TERM EQUITY INVESTMENTS (CONTINUED)
The cost method is applied for long-term equity investments in the financial statements of the
Company when the investee is controlled by the Company. Control refers to the power over the
investee such that the Company is able to direct the relevant activities, has exposure or rights
to variable returns from its involvement with the investee and has the ability to use its power
over the investee to affect the amount of the investor’s returns.
When the cost method is adopted, long-term equity investments are recorded at initial
investment cost. The cost of long-term equity investments is adjusted if there is additional
capital injection or withdrawal. Profits or cash dividends declared to be distributed by the
investee should be recognised as investment income in the current period.
The equity method is applied for long-term equity investments when the investees are jointly
controlled or significantly influenced by the Group. Joint control is the agreed sharing of
control of an arrangement, which exists only when decisions about the relevant activities
require unanimous consent of the parties sharing control. Significant influence is the power to
participate in the financial and operating policy decisions of the investee but is not control or
joint control over those policies.
When the equity method is adopted, the initial cost of an investment in excess of the share
of investee’s fair value on identifiable net assets remains unchanged; the initial cost of the
investment that falls short of the share of investee’s fair value on identifiable net assets shall be
adjusted, by which the difference had been charged to profit or loss.
When the equity method is adopted, the investor recognises its investment income and
other comprehensive income respectively and adjusts the carrying amount of the investment
based on the post-acquisition change in the investor’s share of net assets of the investee.
The recognition of the investee’s results should be based on the fair values of the individual
identifiable assets of the investee according to the Group’s accounting policies and accounting
period. The gains and losses resulting from intercompany transactions with the investee
should be eliminated to the extent of the amount attributable to the investor according to the
shareholding (but if the gains and losses belong to asset impairment losses, they should be
entirely recognised). The recognition should be based on the adjusted net profit of the investee
except for those assets contributed or sold which constituted business. The investor’s share
of profit distributions or cash dividends declared by the investee is deducted from the carrying
amount of the investment. The Group recognises net losses incurred by the investee to the
extent that the carrying amount of the investment and other long-term equity interests that are
investment in the investee in substance is reduced to zero, except for which the investor has an
extra obligation to assume loss of it. For the changes of equity in an investee other than profit
or loss, other comprehensive income or profits appropriation, the investor adjusts the carrying
amount of the investment and recognised it in shareholders’ equity.

Notes to Interim Financial Statements (Continued)30 June 2017Renminbi Yuan
Maanshan Iron & Steel Company Limited
2017 InterimReport
74
III. SIGNIFICANT ACCOUNTING POLICIES AND ACCOUNTING ESTIMATES (CONTINUED)
12. LONG-TERM EQUITY INVESTMENTS (CONTINUED)
When long-term equity investments are disposed of, the difference between the carrying
amount and the actual proceeds received should be charged to profit or loss. For long-term
equity investments under the equity method, if the method would not be adopted after the
disposal, the basis of the accounting treatment on the related other comprehensive income
under original equity method is the same as that on disposal of related assets or liabilities by
the investee, the amount recognised in the equity on the changes in other equity movements
except for the net profit or loss, other comprehensive income and profit distribution, should be
all charged to profit or loss for the year; if the equity method would continue to be adopted
after the disposal, the basis of the accounting treatment on the related other comprehensive
income under the original equity method is the same as that on disposal of related assets
or liabilities by the investee, the amount recognised in the equity on the changes in other
equity movements except for the net profit or loss, other comprehensive income and profit
distribution, should be charged to profit or loss for the year in proportion.
If the Company loses control of an investee with joint control or significant influence retained
after partial disposal of its shares, the equity investment should be accounted as long-term
investment in accordance with the rules of conversion from the cost method to the equity
method; if no joint control or significant influence was retained, the equity investment should be
accounted as financial assets. The difference between the fair value on the day of losing control
and the book value is recognised in profit or loss.
13. INVESTMENT PROPERTIES
Investment properties are interests in land and buildings (including the leasehold interest under
an operating lease for a property) held to earn rental income and/or for capital appreciation.
Investment properties are measured initially at cost. As for the subsequent expenses related to
investment properties, if the economic benefits of the assets are likely to flow into the Company
and its cost can be measured reliably, then it will be included in the cost of investment
properties. Otherwise, the subsequent cost will be calculated in the current profits and losses
when it occurs.
The Group uses the cost model for subsequent measurement of investment properties and
the estimated useful life is determined by the period that it can bring economic benefits to the
Group. Depreciation is calculated on the straight-line basis to write off the cost of each item of
investment properties over its estimated useful life of 24-50 years. The estimated residual value
is 3% to 10% of the cost.

Notes to Interim Financial Statements (Continued)30 June 2017Renminbi Yuan
Maanshan Iron & Steel Company Limited
2017 InterimReport
75
III. SIGNIFICANT ACCOUNTING POLICIES AND ACCOUNTING ESTIMATES (CONTINUED)
14. PROPERTY, PLANT AND EQUIPMENT
Property, plant and equipment is recognised in situations when it is probable that their related
future economic benefits will flow into the Group, and their cost can be measured reliably. The
subsequent expenditure is recorded in the cost of fixed assets only if the conditions above
are met and the carrying amount of parts which had been replaced shall be derecognised;
otherwise,it is charged to profit or loss.
Property, plant and equipment is initially recorded at cost, and taking the effects of expected
disposal expenses into consideration. The purchase cost of fixed assets comprises its
purchase price, related taxes, and any directly attributable expenditure for bringing the asset to
its working condition for its intended use.
In addition to the land abroad purchased by an overseas subsidiary of the Group, depreciation
is calculated on the straight-line basis. The estimated useful lives, estimated residual values,
and the annual depreciation rates of each category of fixed assets are as follows:
Estimated
useful life
Estimated
residual value
Annual
depreciation
rate
Buildings 10 – 30 years 3% 3.2 – 9.7%
Plant and machinery 10 – 15 years 3% 6.5 – 9.7%
Office equipment 5 – 10 years 3% 9.7 – 19.4%
Motor vehicles 5 – 8 years 3% 12.1 – 19.4%
Where parts of an item of property, plant and equipment have different useful lives or provide
economic benefits for enterprises in different ways, each part is depreciated separately.
Residual values, useful lives and the depreciation method are reviewed, and adjusted if
appropriate, at least at each financial year end.
15. CONSTRUCTION IN PROGRESS
Construction in progress represents a building under construction, which is stated at actual
projects’ cost. Cost comprises the direct costs of construction and capitalised borrowing costs
on related borrowed funds during the period of construction.
Construction in progress is reclassified to the appropriate category of property, plant and
equipment when completed and ready for use.

Notes to Interim Financial Statements (Continued)30 June 2017Renminbi Yuan
Maanshan Iron & Steel Company Limited
2017 InterimReport
76
III. SIGNIFICANT ACCOUNTING POLICIES AND ACCOUNTING ESTIMATES (CONTINUED)
16. BORROWING COSTS
Borrowing costs are interests and other expenses arising from borrowings of the Group,
including borrowing interest, amortisation of discounts or premiums, ancillary expenses and
exchange differences arising from foreign currency borrowings.
All the borrowing costs that are directly attributable to construction or production of all
qualifying assets are capitalised and other borrowing costs are treated as an expense. A
qualifying asset is defined as a fixed asset, investment property or inventory that necessarily
takes a substantial period of time to get ready for its intended use or sale.
The capitalization of borrowing costs commences when:
(1) Expenditures for the assets are incurred;
(2) Borrowing costs are incurred; or
(3) The acquisition and construction activities that are necessary to bring the assets to get
ready for their intended use or sale have commenced.
The capitalization of borrowing costs ceases when the asset being acquired or constructed
is substantially ready for its intended use or sale and borrowing costs incurred thereafter are
treated as an expense.
Within the capitalization period, the amounts of capitalised borrowing costs for each accounting
period are determined by the following methods:
(1) For specific borrowings, the borrowing costs eligible for capitalization are the actual
borrowing costs incurred during the current period deducted by any temporary interest
or investment income.
(2) For general borrowings, the borrowing costs eligible for capitalization are determined
by applying a capitalization rate to the weighted average of capital expenditure that
exceeds the specific borrowings.
Capitalization of borrowing costs is suspended during extended periods in which the
acquisition or construction of a property, plant and equipment is interrupted abnormally and the
interruption lasts for more than three months. Borrowing costs is recognised as expenses in
profit or loss during the interruption until the acquisition or construction is resumed.

Notes to Interim Financial Statements (Continued)30 June 2017Renminbi Yuan
Maanshan Iron & Steel Company Limited
2017 InterimReport
77
III. SIGNIFICANT ACCOUNTING POLICIES AND ACCOUNTING ESTIMATES (CONTINUED)
17. INTANGIBLE ASSETS
Intangible assets are recognised if and only if it is probable that the related economic benefits
will flow into the Group and the costs of which can be measured reliably. Intangible assets are
measured at cost initially. However, for an intangible asset acquired in the business combination
not under common control whose fair value can be reliably measured, it is separately
recognised and is measured at its fair value.
The useful lives of intangible assets are assessed based on estimated economic benefit
periods. Those intangible assets without foreseeable economic benefit periods are classified as
intangible assets with indefinite useful lives.
The useful lives of the Group’s intangible assets are as follows:
Useful life
Concession contract 25 years
Land use rights 50 years
Mining rights 25 years
Patent rights 3 years
Concession right is the right to operate water supply factories. It is recorded at cost minus
accumulative amortisations and impairment, if any. The amortisation is calculated in a period of
25 years using the straight-line method.
The Group generally accounted for land use rights obtained by the Group in intangible assets.
For internally generated plants and other buildings, the land use rights and buildings are
accounted for as intangible assets and fixed assets, respectively. With respect to the land use
right purchased together with buildings, the acquisition cost is allocated between the two parts
proportionately, or otherwise, it is wholly accounted for as a fixed asset if it is difficult to be
allocated reasonably.
Intangible assets with finite useful lives are amortised over the useful lives on the straight-line
basis. The Group reviews the useful lives and amortisation method of intangible assets with
finite useful lives, and adjusts then if appropriate, at least at the end of each reporting period.

Notes to Interim Financial Statements (Continued)30 June 2017Renminbi Yuan
Maanshan Iron & Steel Company Limited
2017 InterimReport
78
III. SIGNIFICANT ACCOUNTING POLICIES AND ACCOUNTING ESTIMATES (CONTINUED)
17. INTANGIBLE ASSETS (CONTINUED)
The expenditures for internal research and development projects of the Group were classified
as research expenditures and development expenditures. All research costs are charged
to profit or loss as incurred. Expenditure incurred on projects to develop new products is
capitalised and deferred only when the Group can demonstrate the technical feasibility of
completing the intangible asset so that it will be available for use or sale, its intention to
complete and its ability to use or sell the asset, how the asset will generate future economic
benefits, the availability of resources to complete the project and the ability to measure reliably
the expenditure during the development. Product development expenditure which does not
meet these criteria is expensed when incurred.
18. IMPAIRMENT OF ASSETS
The Group determines the impairment of assets according to the following method, except for
inventories, deferred tax assets and financial assets:
The Group assesses whether an indication of impairment exists as at the end of each reporting
period, and performed impairment test on estimation of the asset’s recoverable amount if
such indications exist. For the goodwill acquired in business combinations and intangible
assets with indefinite lives, an annual impairment test is performed no matter whether there
is any indication of impairment. Intangible assets that not available for use are also tested for
impairment annually.
An asset’s recoverable amount is calculated as the higher of the asset’s fair value less costs to
sell and the present value of estimated future cash flows of the assets. The recoverable amount
is calculated for an individual asset unless it is not applicable, in which case the recoverable
amount is determined for the asset groups to which the asset belongs. An asset group is
recognised based on whether the cash inflows generated by the asset group are largely
independent to those of other assets or asset groups.
When the recoverable amount of an asset or an asset group is less than its carrying amount,
the carrying amount is reduced to its recoverable amount. The reduction amount is charged to
profit or loss and an impairment allowance is provided.
Impairment losses cannot be reversed in subsequent accounting periods.

Notes to Interim Financial Statements (Continued)30 June 2017Renminbi Yuan
Maanshan Iron & Steel Company Limited
2017 InterimReport
79
III. SIGNIFICANT ACCOUNTING POLICIES AND ACCOUNTING ESTIMATES (CONTINUED)
19. PAYROLL AND EMPLOYEE BENEFITS PAYABLE
Employee benefits are all forms of consideration given by an entity in exchange for service
rendered by employees or the termination of employment, including short-term employee
benefits, post-employment benefits, termination benefits and other long-term employee
benefits. The benefits that the Group provides to the spouses, children and dependents
of employees, the late employees’ family and other beneficiaries also shall be deemed as
employee benefits.
Short-term employee benefits payable
During the accounting period in which the employee provides the service, the actual short-term
employee benefits is recognised as a liability and included in profit or loss or related assets’
costs.
Post-employment benefit (defined contribution plans)
Expenditures for employees’ endowment insurance and unemployment insurance managed by
the local government and enterprise annuity established by the Group are capitalised in the
related assets or charged to profit or loss.
Post-employment benefit (defined benefit plans)
The Group’s overseas subsidiary operates a defined benefit pension plan which requires
contributions to be made to a separately administered fund. The benefits are unfunded. The
cost of providing benefits under the defined benefit plan is determined using the projected unit
credit actuarial valuation method.
Remeasurements arising from defined benefit pension plans, comprising actuarial gains and
losses, the effect of the asset ceiling (excluding amounts included in net interest on the net
defined benefit liability) and the return on plan assets (excluding amounts included in net
interest on the net defined benefit liability), are recognised immediately in the consolidated
statement of financial position with a corresponding debit or credit to shareholders’ equity
through other comprehensive income in the period in which they occur. Remeasurements are
not reclassified to profit or loss in subsequent periods.
Past service costs are recognised in profit or loss at the earlier of:
• the date of the plan amendment; and
• the date that the Group recognises restructuring-related costs or termination benefits.
Notes to Interim Financial Statements (Continued)30 June 2017Renminbi Yuan
Maanshan Iron & Steel Company Limited
2017 InterimReport
80
III. SIGNIFICANT ACCOUNTING POLICIES AND ACCOUNTING ESTIMATES (CONTINUED)
19. PAYROLL AND EMPLOYEE BENEFITS PAYABLE (CONTINUED)
Post-employment benefit (defined benefit plans) (Continued)
Net interest is calculated by applying the discount rate to the net defined benefit liability
or asset. The Group recognises the following changes in the net defined benefit obligation
under “cost of sales”, “general and administrative expenses” and “financial expenses” in the
consolidated statement of comprehensive income by function:
• service costs comprising current service costs, past-service costs, gains and losses on
curtailments and non-routine settlements; and
• net interest expense or income comprising interest income on plan assets, interest
expense on plan obligations and the interest influenced by asset limit.
Termination benefits
An entity is required to recognise termination benefits and charge to profit or loss at the earlier
of when the entity can no longer withdraw an offer of those benefits and when it recognises any
related restructuring costs or expenses related to paying termination benefits.
Other long-term employee benefits
Other long-term employee benefits apply the same recognition and measurement as for post-
employment benefits but all changes in the carrying amount of liabilities for other long-term
employment benefits are recognised to profit or loss.
20. PROVISIONS
Except for contingent considerations or contingent liabilities assumed for business combination
not under common control, a provision is recognised if:
(1) the obligation is a present obligation assumed by the Group; and
(2) it is probable that an outflow of resources embodying economic benefits will be required
to settle the obligation; and
(3) a reliable estimate can be made of the amount of the obligation.
Provisions are initially measured at the best estimate of the expenditure required to settle the
present obligation, after considering risks, uncertainties, present value, etc. Provisions shall be
reviewed at the end of each reporting period and adjusted to reflect the current best estimate if
there is conclusive evidence that the carrying amount does not reflect the best estimate at this
moment.

Notes to Interim Financial Statements (Continued)30 June 2017Renminbi Yuan
Maanshan Iron & Steel Company Limited
2017 InterimReport
81
III. SIGNIFICANT ACCOUNTING POLICIES AND ACCOUNTING ESTIMATES (CONTINUED)
20. PROVISIONS (CONTINUED)
For the provision acquired from business combination, it should be initially measured at fair
value. After initial recognition, the amount of provision should be subsequently measured at the
higher of the amount being recognised and the initially recognised amount after deducting the
accumulated amortisation in accordance with the policy for revenue recognition.
21. REPURCHASE AND REVERSE REPURCHASE TRANSACTIONS
Assets sold under agreements to repurchase at a specified future date (“repos”) are not
derecognised from the statement of financial position. The corresponding cash received,
including accrued interest, is recognised as “repurchase agreement” on the statement of
financial position, reflecting the economic nature that such cash is a loan to the Group. The
difference between the sale and repurchase prices is treated as an interest expense and is
accrued over the life of the agreement using the effective interest rate method.
Conversely, assets purchased under agreements to resell at a specified future date (“reverse
repos”) are not recognised in the statement of financial position as a “reverse repurchase
agreement.” The corresponding cash paid, including accrued interest, is recognised as a
“reverse repurchase agreement” in the statement of financial position. The difference between
the purchase and resale prices is treated as interest income and is accrued over the life of the
agreement using the effective interest rate method.
22. REVENUE
Revenue is recognised when it is probable that the economic benefits associated with a
transaction will flow to the Group and the relevant amounts of revenue can be measured
reliably, as well as all the following conditions are satisfied.
Revenue from the sale of goods
Revenue from the sale of goods is recognised when the significant risks and rewards in relation
to ownership of the goods have been transferred to the buyer, the Group retains neither
continuing management nor effective control over the goods sold; and the relevant amounts of
costs can be measured reliably. The revenue from the sale of goods shall be determined by the
amount received or receivable by the purchaser stipulated in the contract or agreement, unless
the amount received or receivable stipulated in the contract or agreement is not at fair value.
If the receivable method of the amount stated in the contract or agreement is made by the
deferred method and it contains the nature of financing, the revenue should be determined by
the fair value of the amount receivable as stated in the contract or agreement.
Notes to Interim Financial Statements (Continued)30 June 2017Renminbi Yuan
Maanshan Iron & Steel Company Limited
2017 InterimReport
82
III. SIGNIFICANT ACCOUNTING POLICIES AND ACCOUNTING ESTIMATES (CONTINUED)
22. REVENUE (CONTINUED)
Revenue from the rendering service
As of the end of reporting period, when the outcome of a transaction involving the rendering
service can be estimated reliably, revenue is recognised by reference to the percentage of
completion method; otherwise, revenue is recognised only to the extent of the expenses
recognised that are recoverable. The outcome of a transaction can be estimated reliably when
all the following conditions are satisfied: the amount of revenue can be measured reliably; it
is probable that the economic benefits associated with the transaction will flow to the Group;
the stage of completion of the transaction can be measured reliably; the costs incurred for the
transaction and the costs to complete the transaction can be measured reliably. The stage of
completion is determined by the proportion of costs incurred to date to the estimated total
costs of the transaction. For the revenue from the rendering service, it is determined by the
amount received or receivable from the party receiving the service as stated in the contract or
agreement unless the amount received or receivable as stated in the contract or agreement is
not at fair value.
When the Group enters into a contract or agreement with other parties which contains both
the sale of goods and rendering service, if the portions of the sale of goods and rendering
service can be separately measured, the portions of the sale of goods and rendering service
are measured individually. If the portions of the sale of goods and rendering service cannot be
separately measured or even if they could be separately measured but cannot be measured
individually, it is deemed to be the sale of goods.
Interest income
Interest income is recognised based on the time horizon of the use of the Group’s cash and
bank balances by others and the effective interest rate.
Royalty income
Royalty income is recognised according to the agreed contract terms.
Lease income
Lease income from operating leases is recognised over the lease terms on the straight-line
basis. Contingent lease income is recognised when incurred.
Notes to Interim Financial Statements (Continued)30 June 2017Renminbi Yuan
Maanshan Iron & Steel Company Limited
2017 InterimReport
83
III. SIGNIFICANT ACCOUNTING POLICIES AND ACCOUNTING ESTIMATES (CONTINUED)
23. GOVERNMENT GRANTS
Government grants are recognised where there is reasonable assurance that the grant will
be received and all attaching conditions will be complied with. If a government grant is in the
form of a transfer of a monetary asset, it is measured at the amount received or receivable. If a
government grant is in the form of a non-monetary asset, it is measured at fair value. If the fair
value cannot be reliably determined, it is measured at a nominal amount.
Asset-related government grants are recognised when the government document designates
that the government grants are used for constructing or forming long-term assets. If the
government document is inexplicit, the Company should make a judgement based on the basic
conditions to obtain the government grants, and recognises them as asset-related government
grants if the conditions are to form long-term assets through construction or other method.
Otherwise, the government grants should be income-related.
If a government grant related to income is a compensation for related expenses or losses
in the future period, the grant is recognised in deferred income, and the grant is recognised
in profit or loss during the period in which its related expenses is recognised. If the grant
is a compensation for related expenses or losses already incurred, the grant is recognised
immediately in profit or loss for the period. A government grant related to an asset is
recognised as deferred income, and evenly amortised to profit or loss over the useful life of the
related asset. A government grant measured at a nominal amount is recognised immediately in
profit or loss for the period.
The Group accounts for government grants related to operating activities in other income
or offsets related costs and expenses according to its business nature. Government grants
unrelated to operating activities are recognised in non-operating income.
Gained policy preferential loan discounts are discounts appropriated to lending banks by the
government, and the lending banks provide loans with policy preferential discounts. The Group
accounts for loans with the actual received amount, and calculates the relevant borrowing
expenses based on principal and the preferential discounts of the loans. For discounts funds
appropriated by the government directly, the discounts offset relevant borrowing expenses.

Notes to Interim Financial Statements (Continued)30 June 2017Renminbi Yuan
Maanshan Iron & Steel Company Limited
2017 InterimReport
84
III. SIGNIFICANT ACCOUNTING POLICIES AND ACCOUNTING ESTIMATES (CONTINUED)
24. INCOME TAX
Income tax comprises current tax and deferred tax, and is normally recognised as income or
expense in profit or loss, except for goodwill generated in a business combination or items that
have been recognised directly in equity.
Current tax assets and liabilities for the current and prior periods are measured at the amount
expected to be recovered or paid according to the taxation laws and regulations.
Based on the differences between the carrying amount of an asset or liability in the statement
of financial position and its tax base, and the differences between the carrying amounts of
some items that have a tax base but are not recognised as assets and liabilities and their tax
base, the Group adopts the liability method for the provision of deferred tax.
A deferred tax liability is recognised in respect of all taxable temporary differences except:
(1) those are arising from the initial recognition of goodwill; or the initial recognition of an
asset or liability in a transaction which is not a business combination, and at the time of
the transaction, affects neither accounting profit nor taxable profit; and
(2) as to temporary differences associated with subsidiaries, joint ventures and associates:
the Group is able to control the timing of the reversal of the temporary difference and it is
probable that the temporary difference will not reverse in the foreseeable future.
Deferred tax assets are recognised for all deductible temporary differences, the carryforward of
unused tax credits and any unused tax losses. Deferred tax assets are recognised by the Group
to the extent that it is probable that taxable profit will be available against which the deductible
temporary differences, the carryforward of unused tax credits and unused tax losses can be
utilised, except:
(1) those arising from the initial recognition of an asset or liability in a transaction which
is not a business combination, and at the time of the transaction, affects neither
accounting profit nor taxable profit; and
(2) as to deductible temporary differences associated with subsidiaries, joint ventures and
associates: a deferred tax asset is recognised to the extent that it is probable that the
temporary difference will reverse in the foreseeable future, and taxable profit will be
available against which the temporary difference can be utilised.

Notes to Interim Financial Statements (Continued)30 June 2017Renminbi Yuan
Maanshan Iron & Steel Company Limited
2017 InterimReport
85
III. SIGNIFICANT ACCOUNTING POLICIES AND ACCOUNTING ESTIMATES (CONTINUED)
24. INCOME TAX (CONTINUED)
At the end of each reporting period, deferred tax assets and liabilities are measured, based on
taxation laws and regulations, at the tax rates that are expected to apply to the period when the
asset is realised or the liability is settled, and reflecting the income tax effect of expected asset
realisation or liability settlement at the end of each reporting period.
The carrying amount of a deferred tax asset is reviewed at the end of each reporting period
and is reduced to the extent that it is no longer probable that sufficient taxable profits will be
available to allow the related tax benefit to be utilised. Any such reduction is reversed to the
extent that it becomes probable that sufficient taxable profits will be available.
Deferred tax assets and deferred tax liabilities are offset if a legally enforceable right exists to
set off current tax assets against current tax liabilities and the deferred taxes relate to the same
taxable entity and the same taxation authority.
25. LEASES
A lease that transfers substantially all of the risks and benefits of ownership of an asset to the
lessee is termed as a finance lease. All the other leases are termed as operating leases.
As lessee in operating leases
Rentals payable under operating leases are charged to profit or loss or capitalised on the
straight-line basis over the lease terms, and contingent rental payment is charged to profit or
loss when it incurs.
As lessor in operating leases
Rentals receivable under operating leases are credited to profit or loss over the lease terms on
the straight-line basis, and contingent rental payment is charged to profit or loss when it incurs.
26. PROFIT DISTRIBUTION
The cash dividend of the Company is recognised as a liability upon the approval at the annual
general meeting.
27. SAFETY PRODUCTION RESERVE
Safety production reserve set aside in compliance with relevant regulations, is included in the
cost of relevant products or recognised in profit or loss for the period, and credited to the
special reserve at the same time. When safety production reserve is utilised, it is accounted for
based on whether a fixed asset is generated or not: if the costs incurred can be categorised
as expenditure, the costs incurred should be charged against the special reserve; if the reserve
is used to build up fixed assets, the costs should be charged to construction in progress,
and reclassified to fixed assets when the projects reach the status ready for intended use.
Meantime, expenditures in building up fixed assets are directly charged against the special
reserve with the accumulated depreciation recognised at the same amount.

Notes to Interim Financial Statements (Continued)30 June 2017Renminbi Yuan
Maanshan Iron & Steel Company Limited
2017 InterimReport
86
III. SIGNIFICANT ACCOUNTING POLICIES AND ACCOUNTING ESTIMATES (CONTINUED)
28. GENERAL RESERVE
According to the relevant policy of the MOF, Masteel Group Financial Co., Ltd. (“Masteel
Financial”) accrues the general reserve from net profit as profit distribution. After 1 July 2012,
the balance of the general reserve should not be less than 1.5% of the balance of the risk
assets.
29. FAIR VALUE MEASUREMENT
The Group measures listed equity investment instruments at fair value at the end of each
reporting period. Fair value is the price that would be received to sell an asset or paid to
transfer a liability in an orderly transaction between market participants at the measurement
date. The fair value measurement is based on the presumption that the transaction to sell the
asset or transfer the liability takes place in the principal market for the asset or liability or in
the most advantageous market for the asset or liability when a principal market is absent. The
principal or the most advantageous market must be accessible to by the Group. The fair value
of an asset or a liability is measured using the assumptions that market participants would use
when pricing the asset or liability, assuming that market participants act in their economic best
interest.
A fair value measurement of a non-financial asset takes into account a market participant’s
ability to generate economic benefits by using the asset in its highest and best use or by selling
it to another market participant that would use the asset in its highest and best use.
The Group uses valuation techniques that are appropriate in the circumstances and for which
sufficient data and other supporting information are available to measure fair value, giving
priority to the use of relevant observable inputs, and using unobservable inputs only when
observable inputs are unavailable or not feasible to obtain.
All assets and liabilities for which fair value is measured or disclosed in the financial statements
are categorised within the fair value hierarchy, described as follows, based on the lowest level
input that is significant to the fair value measurement as a whole:
Level 1 – Quoted (unadjusted) market prices in active markets for identical assets or
liabilities;
Level 2 – Valuation techniques for which the lowest level input that is significant to the
fair value measurement is directly or indirectly observable;
Level 3 – Valuation techniques for which the lowest level input that is significant to the
fair value measurement is unobservable.
For assets and liabilities that are recognised in the financial statements on a recurring basis,
the Group determines whether transfers have occurred between levels in the hierarchy by re-
assessing categorisation at the end of each reporting period.

Notes to Interim Financial Statements (Continued)30 June 2017Renminbi Yuan
Maanshan Iron & Steel Company Limited
2017 InterimReport
87
III. SIGNIFICANT ACCOUNTING POLICIES AND ACCOUNTING ESTIMATES (CONTINUED)
30. SIGNIFICANT ACCOUNTING JUDGMENTS AND ESTIMATES
The preparation of the Group’s financial statements requires management to make judgments,
estimates and assumptions that affect the reported amounts of revenues, expenses, assets and
liabilities, and the disclosure of contingent liabilities, at the reporting date. However, uncertainty
about these assumptions and estimates could result in outcomes that could require a material
adjustment to the carrying amounts of the assets or liabilities affected in the future.
Judgments
In the process of applying the Group’s accounting policies, management has made the
following judgments, which have significant effect on the amounts recognised in the financial
statements:
Going concern
As stated in Note II, the going-concern ability of the Group relies on the cash inflows from
borrowings and operating activities, in order to maintain sufficient cash on the due date of
the relevant liabilities. The uncertainty of the Group’s going-concern ability involves once the
Group cannot obtain sufficient cash. The financial statements do not include any necessary
adjustments related to book value and classification of assets and liabilities when the Group
cannot operate continuously.
Operating lease – as lessor
The Group has entered into operating leases on its investment properties. The Group has
determined that it retains all the significant risks and rewards of ownership of these properties
which are leased out and hence has classified the leases as operating leases according to the
lease contracts.
Classification between investment properties and owner-occupied properties
The Group determines whether a property qualifies as an investment property, and has
developed criteria in making that judgement. Investment property is a property held to earn
rentals or for capital appreciation or both. Therefore, the Group considers whether a property
generates cash flows largely independently of the other assets held by the Group.

Notes to Interim Financial Statements (Continued)30 June 2017Renminbi Yuan
Maanshan Iron & Steel Company Limited
2017 InterimReport
88
III. SIGNIFICANT ACCOUNTING POLICIES AND ACCOUNTING ESTIMATES (CONTINUED)
30. SIGNIFICANT ACCOUNTING JUDGMENTS AND ESTIMATES (CONTINUED)
Judgments (Continued)
Classification between investment properties and owner-occupied properties (Continued)
Some properties comprise a portion that is held to earn rentals or for capital appreciation and
another portion that is held for use in the production or supply of goods or services or for
administrative purposes. If these portions could be sold separately (or leased out separately
under a finance lease), the portions are accounted for separately. If the portions could not be
sold separately, the property is an investment property only if the portion held for use in the
production or supply of goods or services or for administrative purposes is not significant.
Judgement is made on an individual basis to determine whether ancillary services are so
significant that a property does not qualify as an investment property.
Judgement on entities in which the Group holds less than 20% of voting rights but has a significant influence over them
As of 30 June 2017, the Group holds 16.34% equity interests in Anhui Xinchuang Economize
Resource Co., Ltd. (“Xinchuang Economize Resource”). The directors represent that the
Company is able to exercise significant influence over Xinchuang Economize Resource although
the equity interests that the Company holds in Xinchuang Economize Resource are less than
20%, according to the requirements of the Articles of Association of Xinchuang Economize
Resource, the Company designated one director and one supervisor to Xinchuang Economize
Resource. Thus, the Company can exercise significant influence over Xinchuang Economize
Resource, and the investment in Xinchuang Economize Resource is accounted for as an
associate.
As of 30 June 2017, the Group holds 12% equity interests in Anhui Linhuan Chemical Co.,
Ltd. (“Anhui Linhuan Chemical”). The directors represent that the Company is able to exercise
significant influence over Anhui Linhuan Chemical although the equity interests that the
Company holds in Anhui Linhuan Chemical are less than 20%, according to the requirements
of the Articles of Association of Anhui Linhuan Chemical, the Company designated one director
to Anhui Linhuan Chemical. Thus, the Company can exercise significant influence over Anhui
Linhuan Chemical, and the investment in Anhui Linhuan Chemical is accounted for as an
associate.

Notes to Interim Financial Statements (Continued)30 June 2017Renminbi Yuan
Maanshan Iron & Steel Company Limited
2017 InterimReport
89
III. SIGNIFICANT ACCOUNTING POLICIES AND ACCOUNTING ESTIMATES (CONTINUED)
30. SIGNIFICANT ACCOUNTING JUDGMENTS AND ESTIMATES (CONTINUED)
Estimation uncertainty
The key assumptions concerning the future and other key sources of estimation uncertainty at
the end of the reporting period, that have a significant risk of causing a material adjustment to
the carrying amounts of assets and liabilities within the next financial year, are discussed below.
Impairment of non-financial assets (other than goodwill)
The Group assesses whether there are any indicators of impairment for all non-financial assets
at each reporting date. Indefinite life intangible assets are tested for impairment annually and at
other times when such an indicator exists. Other non-financial assets are tested for impairment
when there are indicators that the carrying amounts may not be recoverable. When the carrying
amount of an asset or assets group is higher than its recoverable amount, that is the higher
of fair value less costs to sell and the present value of estimated future cash flows, the related
asset or assets group is impaired. The fair value less costs to sell of an asset is determined as
the contractual price of similar assets in an arm’s length transaction, or the observable market
price of similar assets, after deducting the additional costs directly attributable to the disposal
of this asset. When value in use calculations are undertaken, management must estimate
the expected future cash flows from the asset or cash-generating unit and choose a suitable
discount rate in order to calculate the present value of those cash flows.
Deferred tax assets
Deferred tax assets are recognised to the extent that it is probable that taxable profit will be
available against which the deductible temporary difference and unused tax credit can be
utilised. Significant management judgement is required to determine the amount of deferred tax
assets that can be recognised, based upon the likely timing and level of future taxable profits
together with tax planning strategies.
Estimation of useful life of fixed assets
The Group’s management determines the estimated useful life of its fixed assets. This estimate
is based on the historical experience of the actual useful lives of fixed assets of similar nature
and functions.

Notes to Interim Financial Statements (Continued)30 June 2017Renminbi Yuan
Maanshan Iron & Steel Company Limited
2017 InterimReport
90
III. SIGNIFICANT ACCOUNTING POLICIES AND ACCOUNTING ESTIMATES (CONTINUED)
30. SIGNIFICANT ACCOUNTING JUDGMENTS AND ESTIMATES (CONTINUED)
Estimation uncertainty (Continued)
Provision for bad debts of receivables
The Group’s management determines the provision for impairment of receivables. This estimate
is based on the credit history of its customers and the current market condition. Management
reassesses the estimation at the end of each reporting period.
Estimation of inventories under net realisable value
Management reviews the condition of inventories (including spare parts) of the Group and their
net realisable values and makes provision accordingly. The Group carries out an inventory
review at the end of each reporting period and makes provision accordingly.
Net realisable value of inventories is the estimated selling price in the ordinary course of
business, less estimated costs of completion and selling expenses. These estimates are
based on the current market condition and the historical experience of manufacturing and
selling products of a similar nature. Management reassesses the estimation at the end of each
reporting period.
31. CHANGES IN ACCOUNTING POLICIES
Changes in government grants disclosure
In 2017, based on the issuance of China Accounting Standard No. 16 – Government Grants
(Revised in 2017) (Accounting [2017] No.15) (“Revised CAS 16”), the Group accounted the
government grants related to daily corporate activities as other income or offsetting relevant
costs according to the nature of business. Government grants not related to daily corporate
activities would be included in non-operating income. Government grants existing as at 1
January 2017 applies the change in future application, and the government grants newly
granted during the period from 1 January 2017 to the application date (12 June 2017) will be
accounted according to the Revised CAS 16. Impacted by application of Revised CAS 16, the
Group’s non-operating income and other income are presented differently for the six months
ended 30 June 2017, compared with the year of 2016. The application of Revised CAS 16 will
have no impact on the Group’s and the Company’s net profit and equity for the six months
ended 30 June 2017.
Notes to Interim Financial Statements (Continued)30 June 2017Renminbi Yuan
Maanshan Iron & Steel Company Limited
2017 InterimReport
91
IV. TAX
1. THE PRINCIPAL KINDS OF TAXES AND THE RELATED RATES ARE AS FOLLOWS:
Value-added tax The output VAT rate of domestic sales is 17%. VAT payable is the net difference between output VAT and deductible input VAT. According to national tax regulations, the Company adopted the “Exempt, Offset, Refund” arrangements for VAT in export sales with the refund rates of 9% to 17%. A subsidiary of the Group adopted the “levy first, refund afterwards” arrangements for VAT in its own export sales.
City construction and maintenance tax
Payable based on 5% to 7% of the turnover taxes to be paid.
Income tax The Group and certain of its subsidiaries were subject to corporate income tax (“CIT”) at a rate of 25% on their assessable profits. In 2014, the New and High Technology Enterprise certification of the Group’s subsidiary, Anhui Masteel Holly Industrial Co., Ltd. (“Holly Industrial”), was renewed by the subsidiary’s application to the authority and the entity was recognised by the local authority as a New and High Technology Enterprise. The period of validity is three years from 1 January 2014. The tax benefits had expired on 31 December 2016.
Maanshan Iron & Steel (HK) Limited (“Ma Steel (HK)”) was established and registered in Hong Kong (China), the applicable income tax rate is 16.5%. Maanshan Iron and Steel (Australia) Proprietary Limited (“Ma Steel (Australia”)) was established and registered in Australia, the applicable income tax rate is 30%. MG Trading and Development GmbH (“MG Trading”) was established and registered in Germany, the applicable income tax rate is 30%. MG-VALDUNES S.A.S (“MG-VALDUNES”) was established and registered in France, the applicable income tax rate is 33.3%. MASTEEL AMERICA INC (“Masteel America”) was established and registered in the United States, the applicable income tax rate is 30%.
Land appreciation tax Payable based on appreciation of land use right and building at a progressive tax rate of 30%-60% as a result of the transfer of ownership.
Education surcharge Payable based on 3% of the turnover taxes to be paid.
Local education surcharge
Payable based on 2% of the turnover taxes to be paid.
Real estate tax Payable based on a certain percentage of the cost of real estate with legal title in accordance with relevant regulations.
Other taxes In accordance with tax laws and other relevant regulations.

Notes to Interim Financial Statements (Continued)30 June 2017Renminbi Yuan
Maanshan Iron & Steel Company Limited
2017 InterimReport
92
V. MAJOR NOTES TO CONSOLIDATED FINANCIAL STATEMENTS
1. CASH AND BANK BALANCES
30 June 31 December
2017 2016
Unaudited Audited
Cash on hand 73,655 90,515
Bank balances 3,446,012,086 4,324,041,172
Other cash and bank balances 853,919,992 493,121,436
Mandatory reserves of Masteel Financial
deposited in central bank 532,960,994 494,847,918
4,832,966,727 5,312,101,041
As of 30 June 2017, the Group’s other monetary assets amounting to RMB853,919,992
have been pledged to banks as security (31 December 2016: RMB493,121,436) for bank
acceptance notes, domestic letters of credit and performance guarantees.
As of 30 June 2017, the Group had cash and bank balances amounting to RMB540,680,491
that have been deposited outside the PRC (31 December 2016: RMB335,758,549).
Cash deposited in current accounts earns interest at floating interest rates. The terms of time
deposits are from three months, six months and one year respectively, depending on the cash
demand of the Group. Such deposits earn interest at the respective bank deposit rates.
2. FINANCIAL ASSETS AT FAIR VALUE THROUGH PROFIT OR LOSS
30 June 31 December
2017 2016
Unaudited Audited
Financial assets designated as at fair value through
profit or loss
Investments in debt instruments 766,683,533 555,322,261
Others 60,503,401 –
827,186,934 555,322,261
As of 30 June 2017 and 31 December 2016, the investments in debt instruments were mainly
money market fund and financial products issued by banks held by the Group.
As of 30 June 2017, there was no material restriction on the realisation of these investments.

Notes to Interim Financial Statements (Continued)30 June 2017Renminbi Yuan
Maanshan Iron & Steel Company Limited
2017 InterimReport
93
V. MAJOR NOTES TO CONSOLIDATED FINANCIAL STATEMENTS (CONTINUED)
3. NOTES RECEIVABLE
30 June 31 December
2017 2016
Unaudited Audited
Bank acceptance notes 4,687,305,835 3,608,459,121
As of 30 June 2017, bank acceptance notes of the Group amounting to RMB567,646,581 (31
December 2016: RMB738,206,842) were pledged for bank loans.
As of balance sheet date, the undue notes receivable endorsed or discounted were as
follows:
30 June 2017 (Unaudited) 31 December 2016 (Audited)
DerecognisedNot
derecognised DerecognisedNot
derecognised
Bank acceptance notes 2,927,511,109 62,323,524 5,196,770,076 156,827,864
As of 30 June 2017 and 31 December 2016, there were no trade receivables transferred from
notes receivable because of the drawers’ inability to pay.
4. TRADE RECEIVABLES
The Group’s trade receivables are interest-free with normal credit terms of 30 to 90 days.
The aging of trade receivables is analysed below:
30 June 31 December
2017 2016
Unaudited Audited
Within one year 857,535,606 756,196,252
One to two years 39,650,795 66,905,447
Two to three years 15,881,257 24,337,627
Over three years 35,605,372 33,219,589
948,673,030 880,658,915
Less: Provisions for bad debts 20,473,039 20,729,808
928,199,991 859,929,107
* The aging analysis of trade receivables of the Group is based on the invoice date.

Notes to Interim Financial Statements (Continued)30 June 2017Renminbi Yuan
Maanshan Iron & Steel Company Limited
2017 InterimReport
94
V. MAJOR NOTES TO CONSOLIDATED FINANCIAL STATEMENTS (CONTINUED)
4. TRADE RECEIVABLES (CONTINUED)
The movements of provisions for bad debts against trade receivables for the period are
disclosed in Note V.19.
The balances of trade receivables are analysed as follows:
30 June 2017 (Unaudited) 31 December 2016 (Audited)
Book value Provision for bad debts Book value Provision for bad debtsAmount Ratio (%) Amount Ratio (%) Amount Ratio (%) Amount Ratio (%)
Individually significant and assessed for impairment individually 891,823,306 94 (6,927,040) 1 825,690,228 94 (6,927,040) 1
Other insignificant but assessed for impairment individually 56,849,724 6 (13,545,999) 24 54,968,687 6 (13,802,768) 25
948,673,030 100 (20,473,039) 880,658,915 100 (20,729,808)
As of 30 June 2017, those individually significant and assessed for impairment individually were
as follows:
Book value
Provisions for
bad debts Ratio (%) Reason
Company 1 121,652,399 – – /
Company 2 58,680,735 – – /
Company 3 48,312,244 – – /
Company 4 43,470,026 – – /
Company 5 28,555,094 – – /
Company 6 28,149,429 – – /
Company 7 21,938,310 – – /
Company 8 20,874,910 – – /
Company 9 20,279,298 – – /
Company 10 20,221,020 – – /
Company 11 19,484,684 – – /
Company 12 17,779,311 – – /
Company 13 17,066,302 – – /
Company 14 15,787,663 – – /
Company 15 15,617,537 – – /
Others 393,954,344 (6,927,040) Note 1
891,823,306 (6,927,040)

Notes to Interim Financial Statements (Continued)30 June 2017Renminbi Yuan
Maanshan Iron & Steel Company Limited
2017 InterimReport
95
V. MAJOR NOTES TO CONSOLIDATED FINANCIAL STATEMENTS (CONTINUED)
4. TRADE RECEIVABLES (CONTINUED)
During the current period, provision for bad debts was RMB950,427 (for the six months ended
30 June 2016: RMB812,016) and the recovery or reversal of provision for bad debts was
RMB1,207,196 (for the six months ended 30 June 2016: Nil).
During the current period, there was no write-off of provision for bad debts (for the six months
ended 30 June 2016: Nil).
As of 30 June 2017 and 31 December 2016, there were no trade receivables that were
derecognised due to the transfer of financial assets.
As of 31 December 2016, those individually significant and assessed for impairment individually
were as follows:
Book value
Provisions for
bad debts Ratio (%) Reason
Company 1 117,299,709 – – /
Company 2 48,312,244 – – /
Company 3 35,735,250 – – /
Company 4 29,169,562 – – /
Company 5 24,738,742 – – /
Company 6 21,908,132 – – /
Company 7 21,573,834 – – /
Company 8 20,666,702 – – /
Company 9 20,279,298 – – /
Company 10 18,563,390 – – /
Company 11 17,592,138 – – /
Company 12 17,075,094 – – /
Company 13 17,025,890 – – /
Company 14 15,632,872 – – /
Company 15 13,653,503 – – /
Others 386,463,868 (6,927,040) Note 1
825,690,228 (6,927,040)
Note 1: The Company has confirmed that one of its trade receivables was uncollectable. Therefore,
provision for bad debts was fully recognised amounting to RMB6,927,040.

Notes to Interim Financial Statements (Continued)30 June 2017Renminbi Yuan
Maanshan Iron & Steel Company Limited
2017 InterimReport
96
V. MAJOR NOTES TO CONSOLIDATED FINANCIAL STATEMENTS (CONTINUED)
4. TRADE RECEIVABLES (CONTINUED)
Top five trade receivables classified by debtors are as follows:
30 June 2017
Relationship
with the Group
Ending
balance Aging
Percentage
of trade
receivables
Ending
balance of
provision
for bad debts
Company 1 Third Party 121,652,399 Within 1 year 13% –
Company 2 Third Party 58,680,735 Within 1 year 6% –
Company 3 Third Party 48,312,244 Within 3 years 5% –
Company 4 Third Party 43,470,026 Within 1 year 5% –
Company 5 Third Party 28,555,094 Within 1 year 3% –
300,670,498 32%
31 December 2016
Relationship
with the Group
Ending
balance Aging
Percentage
of trade
receivables
Ending
balance of
provision
for bad debts
Company 1 Third Party 117,299,709 Within 1 year 14% –
Company 2 Third Party 48,312,244 Within 3 years 5% –
Company 3 Third Party 35,735,250 Within 1 year 4% –
Company 4 Third Party 29,169,562 Within 1 year 3% –
Company 5 Third Party 24,738,742 Within 1 year 3% –
255,255,507 29%
As of 30 June 2017, the Group had no assets or liabilities deriving from transferring trade
receivables in which the Group was continuingly involved (31 December 2016: Nil).

Notes to Interim Financial Statements (Continued)30 June 2017Renminbi Yuan
Maanshan Iron & Steel Company Limited
2017 InterimReport
97
V. MAJOR NOTES TO CONSOLIDATED FINANCIAL STATEMENTS (CONTINUED)
5. PREPAYMENTS
Aging analysis of the prepayments is as follows:
30 June 2017 (Unaudited) 31 December 2016 (Audited)
Book value Ratio (%) Book value Ratio (%)
Within one year 567,118,668 96 896,450,454 96
One to two years 11,129,824 2 14,669,580 2
Two to three years 2,216,412 – 5,222,283 1
Over three years 12,124,552 2 8,708,957 1
592,589,456 100 925,051,274 100
Prepayments aged over one year were mainly unsettled prepayments for the materials and
equipment purchase. The goods were not yet delivered which resulted in the corresponding
prepayments not being settled.
Top five prepayments classified by debtors are as follows:
30 June 2017
Relationship
with the Group
Ending
balance Aging
Percentage of
prepayments
Company 1 Associate 155,591,317 Within 1 year 26%
Company 2 Third Party 89,190,473 Within 1 year 15%
Company 3 Third Party 84,418,804 Within 1 year 14%
Company 4 Third Party 73,629,750 Within 1 year 12%
Company 5 Third Party 52,513,333 Within 1 year 9%
455,343,677 76%
31 December 2016
Relationship
with the Group
Ending
balance Aging
Percentage of
prepayments
Company 1 Third Party 164,095,911 Within 1 year 18%
Company 2 Third Party 130,035,843 Within 1 year 14%
Company 3 Third Party 104,989,589 Within 1 year 11%
Company 4 Associate 100,000,000 Within 1 year 11%
Company 5 Third Party 96,486,201 Within 1 year 10%
595,607,544 64%

Notes to Interim Financial Statements (Continued)30 June 2017Renminbi Yuan
Maanshan Iron & Steel Company Limited
2017 InterimReport
98
V. MAJOR NOTES TO CONSOLIDATED FINANCIAL STATEMENTS (CONTINUED)
6. OTHER RECEIVABLES
Aging analysis of other receivables is as follows:
30 June 31 December
2017 2016
Unaudited Audited
Within one year 257,249,651 66,975,647
One to two years 56,841,960 51,655,401
Two to three years 459,813 3,087,522
Over three years 601,200,611 600,141,779
915,752,035 721,860,349
Less: Provision for bad debts 592,518,075 594,245,515
323,233,960 127,614,834
The movements of provision for bad debts against other receivables for the period are
disclosed in Note V.19.
The balances of other receivables are analysed as follows:
30 June 2017 (Unaudited) 31 December 2016 (Audited)
Book value Provision for bad debts Book value Provision for bad debtsAmount Ratio (%) Amount Ratio (%) Amount Ratio (%) Amount Ratio (%)
Individually significant and assessed for impairment individually 871,733,687 95 (587,934,699) 67 700,662,861 97 (587,934,699) 84
Other insignificant but assessed for impairment individually 44,018,348 5 (4,583,376) 10 21,197,488 3 (6,310,816) 30
915,752,035 100 (592,518,075) 721,860,349 100 (594,245,515)

Notes to Interim Financial Statements (Continued)30 June 2017Renminbi Yuan
Maanshan Iron & Steel Company Limited
2017 InterimReport
99
V. MAJOR NOTES TO CONSOLIDATED FINANCIAL STATEMENTS (CONTINUED)
6. OTHER RECEIVABLES (CONTINUED)
As of 30 June 2017, those individually significant and assessed for impairment individually were
as follows:
Book value
Provision for
bad debts Ratio (%) Reason
Company 1 132,058,434 (132,058,434) 100 (i)
Company 2 127,685,367 (127,685,367) 100 (i)
Company 3 76,821,224 (76,821,224) 100 (ii)
Company 4 60,939,960 (60,939,960) 100 (i)
Company 5 57,988,833 (57,988,833) 100 (iv)
Company 6 37,243,732 (37,243,732) 100 (i)
Company 7 34,783,463 (34,783,463) 100 (ii)
Company 8 17,079,513 (17,079,513) 100 (ii)
Company 9 10,056,058 (10,056,058) 100 (ii)
Company 10 9,051,133 (9,051,133) 100 (ii)
Company 11 7,396,979 (7,396,979) 100 (ii)
Company 12 5,216,988 (5,216,988) 100 (ii)
Company 13 5,143,596 (5,143,596) 100 (ii)
Company 14 4,069,419 (4,069,419) 100 (ii)
Company 15 2,400,000 (2,400,000) 100 (iii)
Others 283,798,988 – /
871,733,687 (587,934,699)

Notes to Interim Financial Statements (Continued)30 June 2017Renminbi Yuan
Maanshan Iron & Steel Company Limited
2017 InterimReport
100
V. MAJOR NOTES TO CONSOLIDATED FINANCIAL STATEMENTS (CONTINUED)
6. OTHER RECEIVABLES (CONTINUED)
As of 31 December 2016, those individually significant and assessed for impairment individually
were as follows:
Book value
Provision for
bad debts Ratio (%) Reason
Company 1 132,058,434 (132,058,434) 100 (i)
Company 2 127,685,367 (127,685,367) 100 (i)
Company 3 76,821,224 (76,821,224) 100 (ii)
Company 4 60,939,960 (60,939,960) 100 (i)
Company 5 57,988,833 (57,988,833) 100 (iv)
Company 6 37,243,732 (37,243,732) 100 (i)
Company 7 34,783,463 (34,783,463) 100 (ii)
Company 8 17,079,513 (17,079,513) 100 (ii)
Company 9 10,056,058 (10,056,058) 100 (ii)
Company 10 9,051,133 (9,051,133) 100 (ii)
Company 11 7,396,979 (7,396,979) 100 (ii)
Company 12 5,216,988 (5,216,988) 100 (ii)
Company 13 5,143,596 (5,143,596) 100 (ii)
Company 14 4,069,419 (4,069,419) 100 (ii)
Company 15 2,400,000 (2,400,000) 100 (iii)
Others 112,728,162 – /
700,662,861 (587,934,699)
(i) The companies were former steel trading suppliers of the Company, which were in operating
difficulties. The fair value of the assets which pledged the receivables has changed, the
management of the Company assessed that it was difficult to collect the receivables as second in
line pledgee, therefore, provision for the bad debts was fully recognised.
(ii) The companies were former steel trading suppliers of Maanshan Iron & Steel Company Limited
(Shanghai) Trade Co., Ltd (“Masteel Shanghai Trading”), a subsidiary of the Company. The
management of the Group assessed that it was difficult to collect the receivables because that the
companies were in operating difficulties, and provision for the bad debts was fully recognised.
(iii) As the company was in operating difficulties, the management assessed that it was difficult to
collect the receivables and provision for the bad debts was fully recognised.

Notes to Interim Financial Statements (Continued)30 June 2017Renminbi Yuan
Maanshan Iron & Steel Company Limited
2017 InterimReport
101
V. MAJOR NOTES TO CONSOLIDATED FINANCIAL STATEMENTS (CONTINUED)
6. OTHER RECEIVABLES (CONTINUED)
(iv) For purpose of protecting the Group’s interest as the creditor, Maanshan Iron and Steel (Wuhu)
Processing and Distribution Co., Ltd. (“Ma Steel (Wuhu)”), a subsidiary of the Group, signed an
equity interest transfer agreement and its supplementary agreement (collectively known as the
“Agreements”) with this debtor’s original shareholder, pursuant to which to acquire its 60% equity
interest at a purchase consideration of RMB1. The Agreements stipulated that Ma Steel (Wuhu)
would sell all the holding interests to the original shareholders at the original purchase consideration
once the debtor repay all the debts to Ma Steel (Wuhu) before 31 December 2014, and Ma Steel
(Wuhu) would not participate the daily operation and share the profit or loss before 31 December
2014. In December 2015, Ma Steel (Wuhu) signed a memorandum with the debtor, agreeing to
postpone the settlement date to 31 December 2016 and other terms retain unchanged. Ma Steel
(Wuhu) did not participate the daily operation of the debtor and shared no profit or loss. In October
2016, the debtor repaid part of the debt with real estates, and Ma Steel (Wuhu) returned the equity
interest to the original shareholders of the company according to the Agreements. The book value
of the rest amounting to RMB57,988,833 was unable to be collected by the Company. Therefore,
provision of RMB2,686,251 for bad debts was further recognised in 2016. As of 31 December
2016, provision for the bad debts was fully recognised.
During the period, there was no provision recognised for bad debts (for the six months ended
2016: Nil) and no recovery or reversal of provision for bad debts was made (for the six months
ended 2016: Nil).
During the period, the write-off of provision for the debts was RMB1,727,440 (for the six
months ended 2016: Nil).

Notes to Interim Financial Statements (Continued)30 June 2017Renminbi Yuan
Maanshan Iron & Steel Company Limited
2017 InterimReport
102
V. MAJOR NOTES TO CONSOLIDATED FINANCIAL STATEMENTS (CONTINUED)
6. OTHER RECEIVABLES (CONTINUED)
Other receivables analysed by nature were as follows:
30 June 31 December
2017 2016
Unaudited Audited
Payment on behalf of other companies 50,733,791 50,733,791
Tax refunds 5,237,911 5,237,911
Prepaid guarantee to China Customs for
customs duties and VAT 5,893,845 11,167,848
Prepayment for trading 585,534,699 585,534,699
Prepaid guarantee for steel futures 141,706,521 28,061,996
Others 126,645,268 41,124,104
915,752,035 721,860,349
Less:Provision for bad debts 592,518,075 594,245,515
323,233,960 127,614,834
As of 30 June 2017, top five other receivables were as follows:
Balance
Ratio in other
receivables (%) Nature Aging
Balance of
provision
for bad debts
Company 1 132,058,434 14 Prepayment
for trading
More than
3 years
132,058,434
Company 2 127,685,367 14 Prepayment
for trading
More than
3 years
127,685,367
Company 3 76,821,224 8 Prepayment
for trading
More than
3 years
76,821,224
Company 4 60,939,960 7 Prepayment
for trading
More than
3 years
60,939,960
Company 5 57,988,833 6 Prepayment
for trading
More than
3 years
57,988,833
455,493,818 49 455,493,818

Notes to Interim Financial Statements (Continued)30 June 2017Renminbi Yuan
Maanshan Iron & Steel Company Limited
2017 InterimReport
103
V. MAJOR NOTES TO CONSOLIDATED FINANCIAL STATEMENTS (CONTINUED)
6. OTHER RECEIVABLES (CONTINUED)
As of 31 December 2016, top five other receivables were as follows:
Balance
Ratio in other
receivables (%) Nature Aging
Balance of
provision
for bad debts
Company 1 132,058,434 18 Prepayment
for trading
More than
3 years
132,058,434
Company 2 127,685,367 18 Prepayment
for trading
More than
3 years
127,685,367
Company 3 76,821,224 11 Prepayment
for trading
More than
3 years
76,821,224
Company 4 60,939,960 8 Prepayment
for trading
More than
3 years
60,939,960
Company 5 57,988,833 8 Prepayment
for trading
More than
3 years
57,988,833
455,493,818 63 455,493,818
As of 30 June 2017, the government grants receivable were as follows:
Government
grant project Balance Aging
Expected
receiving
time, amount
and basis
Other receivable due from
Taibai Town Government
Policy return from
2004 to 2009
5,237,911 More than
three years
Note
As of 31 December 2016, the government grants receivable were as follows:
Government
grant project Balance Aging
Expected
receiving
time, amount
and basis
Other receivable due from
Taibai Town Government
Policy return from
2004 to 2009
5,237,911 More than
three years
Note

Notes to Interim Financial Statements (Continued)30 June 2017Renminbi Yuan
Maanshan Iron & Steel Company Limited
2017 InterimReport
104
V. MAJOR NOTES TO CONSOLIDATED FINANCIAL STATEMENTS (CONTINUED)
6. OTHER RECEIVABLES (CONTINUED)
Note: The balance is the government grant owned by a subsidiary named Anhui Changjiang Iron and
Steel Co., Ltd. (“Anhui Changjiang Iron and Steel”) in 2009 from the Town Government of Taibai,
Dangtu in Anhui Province because of its timely and fully tax payments between 2004 and 2009.
This government grant was recorded as non-operating income in 2009. After communicating with
the government, the rest of the amount is expected to be received in 2017.
The balances of other receivables as of 30 June 2017 and 31 December 2016 did not contain
any amount derecognised due to the transfer of financial assets.
7. INVENTORIES
30 June 2017 (Unaudited) 31 December 2016 (Audited)
BalanceProvision for
impairment Carrying amount BalanceProvision for
impairment Carrying amount
Raw materials 4,873,167,861 (103,394,289) 4,769,773,572 5,068,139,785 (83,746,075) 4,984,393,710Work in progress 902,457,756 (26,262,178) 876,195,578 864,371,940 (17,659,670) 846,712,270Finished goods 3,131,836,608 (53,421,489) 3,078,415,119 3,425,296,042 (64,188,089) 3,361,107,953Spare parts 1,167,707,109 (89,017,199) 1,078,689,910 1,249,285,417 (126,912,167) 1,122,373,250Others (Note) 233,474,649 – 233,474,649 233,474,649 – 233,474,649
10,308,643,983 (272,095,155) 10,036,548,828 10,840,567,833 (292,506,001) 10,548,061,832
Note: The Company, as the creditor, received real estate amounting to RMB233,474,649 from one debtor
in 2016. Please refer to Note V.6 for details.
At the end of the reporting period, inventories were measured at the lower of costs and net
realisable values, and provision for impairment was made for items whose costs were higher
than their net realisable values. Net realisable value is the estimated selling price under normal
business terms deducted by the estimated costs to completion, the estimated selling expenses
and related taxes.
The movements of impairment provision against inventories for the period are disclosed in Note
V.19.
As of 30 June 2017, the Group had no pledged inventories (31 December 2016: Nil).

Notes to Interim Financial Statements (Continued)30 June 2017Renminbi Yuan
Maanshan Iron & Steel Company Limited
2017 InterimReport
105
V. MAJOR NOTES TO CONSOLIDATED FINANCIAL STATEMENTS (CONTINUED)
8. FINANCIAL ASSETS PURCHASED UNDER AGREEMENTS TO RESELL
30 June 31 December
2017 2016
Unaudited Audited
Bonds – 230,047,000
Financial assets purchased under agreements to resell are bonds that are bought first and to be
sold at a fixed price by Masteel Financial according to the resell agreements.
9. LOANS AND ADVANCES TO CUSTOMERS
30 June 31 December
2017 2016
Unaudited Audited
Loans 497,500,000 474,500,000
Discounted notes 1,059,019,825 1,128,238,113
1,556,519,825 1,602,738,113
Less:Bad debt provision for loans and advances 43,483,032 47,525,557
1,513,036,793 1,555,212,556
The movements of the provision for bad debts against loans and advances to customers for the
current period are disclosed in Note V.19.
The customers related to loans and advances are the Holding and its subsidiaries. After risk
evaluation, bad debt provision for loans and advances to customers was accrued at 2.8%
(2016: 3%) of its closing balance. As of 30 June 2017, there was no non-performing loan in
the Group’s loans and advances to customers. Loans and advances to customers due from
shareholders who held 5% or above of the Company’s equity interests and other related
parties as of 30 June 2017 and 31 December 2016 are disclosed in Note X.6 to the financial
statements.

Notes to Interim Financial Statements (Continued)30 June 2017Renminbi Yuan
Maanshan Iron & Steel Company Limited
2017 InterimReport
106
V. MAJOR NOTES TO CONSOLIDATED FINANCIAL STATEMENTS (CONTINUED)
10. HELD-TO-MATURITY INVESTMENTS
30 June 2017 (Unaudited) 31 December 2016 (Audited)
BalanceProvision for
impairment Carrying amount BalanceProvision for
impairment Carrying amount
Treasury bonds 201,463,387 – 201,463,387 – – –
Significant held-to-maturity investments are as follows:
Par Value
Nominal
interest
rate
Actual
interest
rate Purchase date Maturity date
17 interest-bearing
bonds 03
100,000,000 2.78% 3.11% 28 April 2017 13 February 2018
17 interest-bearing
bonds 03
100,000,000 2.78% 3.53% 21 June 2017 13 February 2018
11. OTHER CURRENT ASSETS
30 June 31 December
2017 2016
Unaudited Audited
Accumulated deductible value added tax 532,365,681 386,609,452
Prepaid income tax 305,307,233 301,317,710
Others – 4,544,071
837,672,914 692,471,233
12. AVAILABLE-FOR-SALE FINANCIAL INVESTMENTS
30 June 2017 (Unaudited) 31 December 2016 (Audited)
Book valueProvision for
impairmentCarrying amount Book value
Provision for impairment
Carrying amount
Available-for-sale debt instruments (Note) 1,301,936,789 – 1,301,936,789 451,225,538 – 451,225,538
Available-for-sale equity instruments measured at cost 126,722,160 – 126,722,160 126,722,160 – 126,722,160
1,428,658,949 – 1,428,658,949 577,947,698 – 577,947,698

Notes to Interim Financial Statements (Continued)30 June 2017Renminbi Yuan
Maanshan Iron & Steel Company Limited
2017 InterimReport
107
V. MAJOR NOTES TO CONSOLIDATED FINANCIAL STATEMENTS (CONTINUED)
12. AVAILABLE-FOR-SALE FINANCIAL INVESTMENTS (CONTINUED)
Available-for-sale financial investments measured at fair value:
30 June 31 December
2017 2016
Unaudited Audited
Available-for-sale debt instruments
Debt instruments’ amortised cost 1,304,258,221 452,402,983
Fair value 1,301,936,789 451,225,538
Accumulated fair value changes recorded
in other comprehensive income (2,321,432) (1,177,445)
Provision – –
Note: Available-for-sale debt instruments held by the Group were mainly bonds investment and interbank
deposits purchased by Masteel Financial.
Available-for-sale financial investments measured at cost:
30 June 2017 (Unaudited)
Book value Provision for impairmentEquity
interests (%)
Cash dividend during the
periodOpening balance Addition Decrease Ending balance
Opening balance Addition Decrease
Ending balance
Henan Longyu Energy Co., Ltd. 10,000,000 – – 10,000,000 – – – – 0.66 –China MCC17 Group Co., Ltd. 8,554,800 – – 8,554,800 – – – – 1.56 1,540,000Shanghai LuoJing Ore Quay Co., Ltd. 88,767,360 – – 88,767,360 – – – – 12.00 –Beijing Zhonglian Steel Ecommerce Co., Ltd. 1,000,000 – – 1,000,000 – – – – 3.40 –Anshan Huatai CDQ Engineering Technology
Co., Ltd. 400,000 – – 400,000 – – – – 5.00 –CFHI (Group) Ma’anshan Heavy Industry Co., Ltd. 15,000,000 – – 15,000,000 – – – – 15.00 –Guoqi (Beijing) Lightweight of Automotive
Technology Institute Co., Ltd. 3,000,000 – – 3,000,000 – – – – 6.90 –
126,722,160 – – 126,722,160 – – – – 1,540,000
As of 30 June 2017, the Group’s available-for-sale financial investments are equity investments
in non-listed companies in China. The fair values of these assets could not be reliably measured
since there were no market prices in the active market. These assets are recorded at cost less
impairment at the end of each reporting period, and their fair values were not disclosed.

Notes to Interim Financial Statements (Continued)30 June 2017Renminbi Yuan
Maanshan Iron & Steel Company Limited
2017 InterimReport
108
V. MAJOR NOTES TO CONSOLIDATED FINANCIAL STATEMENTS (CONTINUED)
12. AVAILABLE-FOR-SALE FINANCIAL INVESTMENTS (CONTINUED)
Available-for-sale financial investments measured at cost (Continued) :
31 December 2016 (Audited)
Book value Provision for impairmentEquity
interests (%)
Cash dividend during the year
Opening balance Addition Decrease
Ending balance
Opening balance Addition Decrease
Ending balance
Henan Longyu Energy Co., Ltd. 10,000,000 – – 10,000,000 – – – – 0.66 –China MCC17 Group Co., Ltd. 8,554,800 – – 8,554,800 – – – – 1.56 –Shanghai LuoJing Ore Quay Co., Ltd. 88,767,360 – – 88,767,360 – – – – 12.00 –Beijing Zhonglian Steel Ecommerce Co., Ltd. 1,000,000 – – 1,000,000 – – – – 3.40 –Anshan Huatai CDQ Engineering Technology
Co., Ltd. 400,000 – – 400,000 – – – – 5.00 40,000CFHI (Group) Ma’anshan Heavy Industry Co., Ltd. 15,000,000 – – 15,000,000 – – – – 15.00 –Guoqi (Beijing) Lightweight of Automotive
Technology Institute Co., Ltd. 3,000,000 – – 3,000,000 – – – – 6.90 –Anhui Masteel Stereoscopic Auto-parking
Equipments Co., Ltd. 2,212,250 – (2,212,250) – – – – – – –
128,934,410 – (2,212,250) 126,722,160 – – – – 40,000
13. LONG-TERM EQUITY INVESTMENTS
30 June 2017 (Unaudited)
Movements during the period
Opening
Balance Increase Decrease
Investment
income under
the equity
method
Other
comprehensive
income
Other equity
movement
Cash dividend
received
Provision for
impairment
Closing
balance
Impairment
at the end
of the
period
Joint ventures
Ma’ anshan BOC-Ma Steel Gases Co., Ltd.
(“BOC-Ma Steel”) 319,018,068 – – 44,214,106 – 109,528 (75,000,000) – 288,341,702 –
Masteel-CMI International Training Centre
Co., Ltd. (“MASTEEL-CMI”) 541,433 – – – – – – – 541,433 –
Mascometal Co., Ltd.(Mascometal) (Note) 53,284,037 78,431,997 (127,368,631) (4,347,403) – – – – – –
Associates
Henan Jinma Energy Co., Ltd.
(“Henan Jinma Energy”) 296,196,390 – – 110,111,926 – 1,261,613 (36,000,000) – 371,569,929 –
Shenglong Chemical Co., Ltd.
(“Shenglong Chemical”) 309,396,424 – – 84,540,762 – 444,750 – – 394,381,936 –
Shanghai Iron and Steel Electronic Deal
Center Co., Ltd. (“Shanghai Iron and
Steel Electronic”) 27,120,592 – – 276,442 – – – – 27,397,034 –
Xinchuang Economize Resource 43,780,961 – – 3,286,876 – 284 (1,306,391) – 45,761,730 –
Anhui Linhuan Chemical 72,000,000 – – – – 712,744 – – 72,712,744 –
Ma-Steel OCI Chemical Co., Ltd.
(“Ma-Steel OCI Chemical”) 118,438,408 – – 3,013,884 – 813,035 – – 122,265,327 –
1,239,776,313 78,431,997 (127,368,631) 241,096,593 – 3,341,954 (112,306,391) – 1,322,971,835 –

Notes to Interim Financial Statements (Continued)30 June 2017Renminbi Yuan
Maanshan Iron & Steel Company Limited
2017 InterimReport
109
V. MAJOR NOTES TO CONSOLIDATED FINANCIAL STATEMENTS (CONTINUED)
13. LONG-TERM EQUITY INVESTMENTS (CONTINUED)
31 December 2016 (Audited)
Movements during the year
Opening balance Increase Decrease
Investment
income under
the equity
method
Other
comprehensive
income
Other equity
movement
Cash dividend
received
Provision for
impairment
Closing
balance
Impairment
at the end
of the year
Joint ventures
BOC-Ma Steel 316,030,791 – – 80,857,392 – 1,129,885 (79,000,000) – 319,018,068 –
MASTEEL-CMI 539,342 – – 2,091 – – – – 541,433 –
Mascometal – 58,171,378 (4,879,915) (7,426) – – – – 53,284,037 –
Associates
Henan Jinma Energy 241,098,393 – – 77,296,589 – 3,361,408 (25,560,000) – 296,196,390 –
Shenglong Chemical 242,402,338 – – 66,810,341 – 183,745 – – 309,396,424 –
Shanghai Iron and Steel Electronic 26,604,521 – – 4,516,071 – – (4,000,000) – 27,120,592 –
Xinchuang Economize Resource 35,539,691 – – 3,059,233 – 5,182,037 – – 43,780,961 –
Anhui Linhuan Chemical 72,000,000 – – – – – – – 72,000,000 –
Ma-Steel OCI Chemical 95,638,431 22,513,793 – 286,184 – – – – 118,438,408 –
1,029,853,507 80,685,171 (4,879,915) 232,820,475 – 9,857,075 (108,560,000) – 1,239,776,313 –
Note: In 2016, the Company jointly established Mascometal with registered capital amounting to EUR32
million with a foreign invested enterprise (FIE), Asco Industries Co., Ltd., in which the Company
and Asco Industries Co., Ltd. hold 75% and 25% of equity interests respectively, according to the
requirements of the joint venture contract and the Articles of Association. The Company designated
three directors in the board of directors and Asco Industries Co., Ltd. designated one director.
According to the Articles of Association of Mascometal, the board of directors is the supreme
authority, some important financial and operating decisions must be approved by all the directors.
According to the requirements of the Articles of Association as above, the directors represent that
the Company is unable to exercise control over Mascometal, but able to exercise joint control over
Mascometal with Asco Industries Co., Ltd. Therefore, the equity investment in Mascometal was
accounted for as a joint venture, and Mascometal has not been included in the consolidation scope
of the Group in 2016.
In August 2016, the Company disposed of 9% equity interest of Mascometal to Maanshan Yushan
District City Investment and Development Co., Ltd., as a result, the equity interests the Company
holds changed to 66%.
In June 2017, Mascometal held the first board of directors’ 6th meeting. The meeting approved
the revised Article of Association which changed the approval criteria of significant finance and
operating decision from unanimous approval of all the directors to more than 50% of the directors’
approval. According to the revised Article of Association, the directors of the Company represent
that the Company is able to exercise control over Mascometal, therefore it is accounted for as a
subsidiary and included in the scope of consolidation of the Group instead of being accounted
for as a joint venture, thus forming a business combination involving entities not under common
control. For details regarding this business combination involving entities not under common control
of Mascometal, please refer to Note VI.2.

Notes to Interim Financial Statements (Continued)30 June 2017Renminbi Yuan
Maanshan Iron & Steel Company Limited
2017 InterimReport
110
V. MAJOR NOTES TO CONSOLIDATED FINANCIAL STATEMENTS (CONTINUED)
13. LONG-TERM EQUITY INVESTMENTS (CONTINUED)
Note: (Continued)
According to the requirements of the joint venture contract, the Company completed the capital
contribution of EUR10,296,000 in June 2017, which is equivalent to RMB78,431,997.
14. INVESTMENT PROPERTIES
Investment properties measured at cost:
30 June 2017 (Unaudited)
Buildings and
plant
Cost:
At 1 January 2017 65,075,379
At 30 June 2017 65,075,379
Accumulated depreciation:
At 1 January 2017 6,241,381
Provided 513,531
At 30 June 2017 6,754,912
Provision for impairment:
At 1 January 2017 and 30 June 2017 –
Net carrying amount:
At 30 June 2017 58,320,467
At 1 January 2017 58,833,998
* The Group’s investment properties are located in Mainland China, and are held under
medium term leases.

Notes to Interim Financial Statements (Continued)30 June 2017Renminbi Yuan
Maanshan Iron & Steel Company Limited
2017 InterimReport
111
V. MAJOR NOTES TO CONSOLIDATED FINANCIAL STATEMENTS (CONTINUED)
14. INVESTMENT PROPERTIES (CONTINUED)
Investment properties measured at cost: (Continued)
31 December 2016 (Audited)
Buildings and
plant
Cost:
At 1 January 2016 67,649,781
Addition –
Transferred into fixed assets (2,574,402)
At 31 December 2016 65,075,379
Accumulated depreciation:
At 1 January 2016 5,293,198
Provided 1,708,470
Transferred into fixed assets (760,287)
At 31 December 2016 6,241,381
Provision for impairment:
At 1 January 2016 and 31 December 2016 –
Net carrying amount:
At 31 December 2016 58,833,998
At 1 January 2016 62,356,583
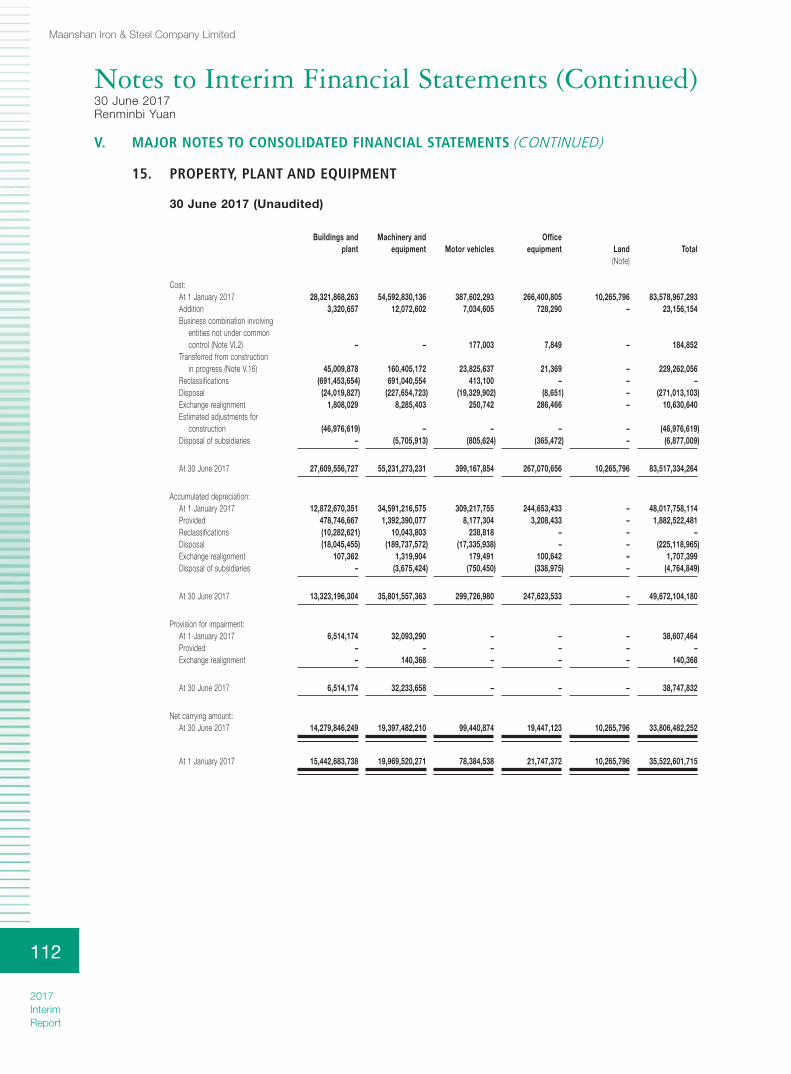
Notes to Interim Financial Statements (Continued)30 June 2017Renminbi Yuan
Maanshan Iron & Steel Company Limited
2017 InterimReport
112
V. MAJOR NOTES TO CONSOLIDATED FINANCIAL STATEMENTS (CONTINUED)
15. PROPERTY, PLANT AND EQUIPMENT
30 June 2017 (Unaudited)
Buildings and plant
Machinery and equipment Motor vehicles
Office equipment Land Total
(Note)
Cost:At 1 January 2017 28,321,868,263 54,592,830,136 387,602,293 266,400,805 10,265,796 83,578,967,293Addition 3,320,657 12,072,602 7,034,605 728,290 – 23,156,154Business combination involving
entities not under common control (Note VI.2) – – 177,003 7,849 – 184,852
Transferred from construction in progress (Note V.16) 45,009,878 160,405,172 23,825,637 21,369 – 229,262,056
Reclassifications (691,453,654) 691,040,554 413,100 – – –Disposal (24,019,827) (227,654,723) (19,329,902) (8,651) – (271,013,103)Exchange realignment 1,808,029 8,285,403 250,742 286,466 – 10,630,640Estimated adjustments for
construction (46,976,619) – – – – (46,976,619)Disposal of subsidiaries – (5,705,913) (805,624) (365,472) – (6,877,009)
At 30 June 2017 27,609,556,727 55,231,273,231 399,167,854 267,070,656 10,265,796 83,517,334,264
Accumulated depreciation:At 1 January 2017 12,872,670,351 34,591,216,575 309,217,755 244,653,433 – 48,017,758,114Provided 478,746,667 1,392,390,077 8,177,304 3,208,433 – 1,882,522,481Reclassifications (10,282,621) 10,043,803 238,818 – – –Disposal (18,045,455) (189,737,572) (17,335,938) – – (225,118,965)Exchange realignment 107,362 1,319,904 179,491 100,642 – 1,707,399Disposal of subsidiaries – (3,675,424) (750,450) (338,975) – (4,764,849)
At 30 June 2017 13,323,196,304 35,801,557,363 299,726,980 247,623,533 – 49,672,104,180
Provision for impairment:At 1 January 2017 6,514,174 32,093,290 – – – 38,607,464Provided – – – – – –Exchange realignment – 140,368 – – – 140,368
At 30 June 2017 6,514,174 32,233,658 – – – 38,747,832
Net carrying amount:At 30 June 2017 14,279,846,249 19,397,482,210 99,440,874 19,447,123 10,265,796 33,806,482,252
At 1 January 2017 15,442,683,738 19,969,520,271 78,384,538 21,747,372 10,265,796 35,522,601,715

Notes to Interim Financial Statements (Continued)30 June 2017Renminbi Yuan
Maanshan Iron & Steel Company Limited
2017 InterimReport
113
V. MAJOR NOTES TO CONSOLIDATED FINANCIAL STATEMENTS (CONTINUED)
15. PROPERTY, PLANT AND EQUIPMENT (CONTINUED)
31 December 2016 (Audited)
Buildings and plant
Machinery andequipment
Motorvehicles
Officeequipment Land Total
Cost:At 1 January 2016 26,337,817,814 52,433,784,044 388,260,936 353,968,343 10,265,796 79,524,096,933Addition 8,203,647 88,449,039 7,769,757 7,702,254 – 112,124,697Transferred from construction
in progress 2,390,223,425 2,591,670,469 13,178,320 18,378,038 – 5,013,450,252Reclassifications (21,601,634) 138,103,232 (4,042,687) (112,458,911) – –Disposal (66,178,321) (260,848,701) (17,695,392) – – (344,722,414)Transferred from investment
properties 2,574,402 – – – – 2,574,402Exchange realignment 828,930 1,672,053 131,359 100,118 – 2,732,460Estimated adjustments
for construction (330,000,000) (400,000,000) – (1,289,037) – (731,289,037)
At 31 December 2016 28,321,868,263 54,592,830,136 387,602,293 266,400,805 10,265,796 83,578,967,293
Accumulated depreciation:At 1 January 2016 12,245,942,502 32,017,310,492 312,099,544 343,333,299 – 44,918,685,837Provided 694,973,483 2,662,489,850 16,696,545 3,606,239 – 3,377,766,117Reclassifications (20,672,194) 126,871,668 (3,885,716) (102,313,758) – –Disposal (48,396,925) (215,894,967) (15,746,318) – – (280,038,210)Transferred from investment
properties 760,287 – – – – 760,287Exchange realignment 63,198 439,532 53,700 27,653 – 584,083
At 31 December 2016 12,872,670,351 34,591,216,575 309,217,755 244,653,433 – 48,017,758,114
Provision for impairment:At 1 January 2016 – – – – – –Provided 6,514,174 32,093,290 – – – 38,607,464
At 31 December 2016 6,514,174 32,093,290 – – – 38,607,464
Net carrying amount:At 31 December 2016 15,442,683,738 19,969,520,271 78,384,538 21,747,372 10,265,796 35,522,601,715
At 1 January 2016 14,091,875,312 20,416,473,552 76,161,392 10,635,044 10,265,796 34,605,411,096
Note: The land in fixed assets was obtained by a subsidiary of the Group, MG-VALDUNES, in France.
As of 30 June 2017, certificates of ownership in respect of 34 of the Group’s buildings
in Mainland China, with an aggregate cost of RMB1,329,717,946 (31 December 2016:
RMB1,273,300,682), have not been issued by the relevant government authorities. The
directors represent that the Group is in the process of obtaining the relevant certificates, and
this will not have any significant adverse impact on the Group’s operations.
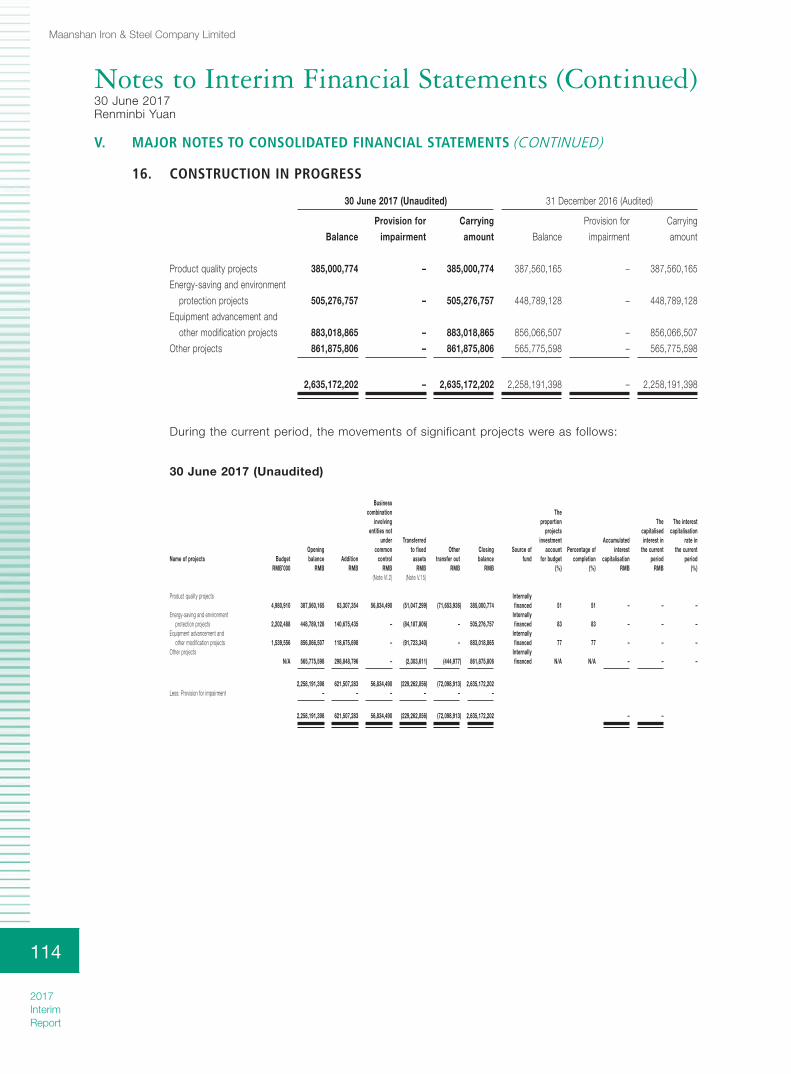
Notes to Interim Financial Statements (Continued)30 June 2017Renminbi Yuan
Maanshan Iron & Steel Company Limited
2017 InterimReport
114
V. MAJOR NOTES TO CONSOLIDATED FINANCIAL STATEMENTS (CONTINUED)
16. CONSTRUCTION IN PROGRESS
30 June 2017 (Unaudited) 31 December 2016 (Audited)
Balance
Provision for
impairment
Carrying
amount Balance
Provision for
impairment
Carrying
amount
Product quality projects 385,000,774 – 385,000,774 387,560,165 – 387,560,165
Energy-saving and environment
protection projects 505,276,757 – 505,276,757 448,789,128 – 448,789,128
Equipment advancement and
other modification projects 883,018,865 – 883,018,865 856,066,507 – 856,066,507
Other projects 861,875,806 – 861,875,806 565,775,598 – 565,775,598
2,635,172,202 – 2,635,172,202 2,258,191,398 – 2,258,191,398
During the current period, the movements of significant projects were as follows:
30 June 2017 (Unaudited)
Name of projects BudgetOpening balance Addition
Business combination
involving entities not
under common
control
Transferred to fixed assets
Other transfer out
Closing balance
Source of fund
The proportion
projects investment
account for budget
Percentage of completion
Accumulated interest
capitalisation
The capitalised interest in
the current period
The interest capitalisation
rate in the current
periodRMB’000 RMB RMB RMB RMB RMB RMB (%) (%) RMB RMB (%)
(Note VI.2) (Note V.15)
Product quality projects4,980,910 387,560,165 63,307,354 56,834,490 (51,047,299) (71,653,936) 385,000,774
Internally financed 51 51 – – –
Energy-saving and environment protection projects 2,202,488 448,789,128 140,675,435 – (84,187,806) – 505,276,757
Internally financed 83 83 – – –
Equipment advancement and other modification projects 1,539,556 856,066,507 118,675,698 – (91,723,340) – 883,018,865
Internally financed 77 77 – – –
Other projectsN/A 565,775,598 298,848,796 – (2,303,611) (444,977) 861,875,806
Internally financed N/A N/A – – –
2,258,191,398 621,507,283 56,834,490 (229,262,056) (72,098,913) 2,635,172,202Less: Provision for impairment – – – – – –
2,258,191,398 621,507,283 56,834,490 (229,262,056) (72,098,913) 2,635,172,202 – –
Notes to Interim Financial Statements
30 June 2017
Renminbi Yuan

Notes to Interim Financial Statements (Continued)30 June 2017Renminbi Yuan
Maanshan Iron & Steel Company Limited
2017 InterimReport
115
V. MAJOR NOTES TO CONSOLIDATED FINANCIAL STATEMENTS (CONTINUED)
16. CONSTRUCTION IN PROGRESS (CONTINUED)
In 2016, the movements of significant projects are as follows:
31 December 2016 (Audited)
Name of projects BudgetOpening balance Addition
Transferred to fixed assets
Closing balance
Source of fund
The proportion projects
investment account for
budgetPercentage of
completion
Accumulated interest
capitalisation
The capitalised interest in
current year
The interest capitalisation
rate in current year
RMB’000 RMB RMB RMB RMB (%) (%) RMB RMB (%)
Product quality projects6,416,968 1,201,603,354 1,343,913,180 (2,157,956,369) 387,560,165
Internally financed/loan 82 82 9,671,641 2,140,342 4.4
Energy-saving and environment protection projects 2,623,235 1,206,463,445 994,194,028 (1,751,868,345) 448,789,128
Internally financed/loan 84 84 4,816,770 2,761,338 4.4
Equipment advancement and other modification projects 2,359,778 1,651,195,135 272,488,041 (1,067,616,669) 856,066,507
Internally financed/loan 85 85 7,597,740 1,655,800 4.4
Other projectsN/A 186,500,934 415,283,533 (36,008,869) 565,775,598
Internally financed/loan N/A N/A 3,005,256 619,779 –
4,245,762,868 3,025,878,782 (5,013,450,252) 2,258,191,398Less: Provision for impairment – – – –
4,245,762,868 3,025,878,782 (5,013,450,252) 2,258,191,398 25,091,407 7,177,259

Notes to Interim Financial Statements (Continued)30 June 2017Renminbi Yuan
Maanshan Iron & Steel Company Limited
2017 InterimReport
116
V. MAJOR NOTES TO CONSOLIDATED FINANCIAL STATEMENTS (CONTINUED)
17. INTANGIBLE ASSETS
30 June 2017 (Unaudited)
Concession assets
Land use rights Mining rights Patent Total
(Note)
Cost:At 1 January 2017 136,979,410 2,288,788,651 139,904,847 692,411 2,566,365,319Addition – 109,101,790 – – 109,101,790Exchange realignment and
others – – 4,508,421 41,962 4,550,383
At 30 June 2017 136,979,410 2,397,890,441 144,413,268 734,373 2,680,017,492
Accumulated depreciation:At 1 January 2017 30,218,625 664,229,102 49,837,103 311,562 744,596,392Provided 2,956,721 26,316,389 3,094,642 104,303 32,472,055Exchange realignment and
others – – 1,988,386 18,881 2,007,267
At 30 June 2017 33,175,346 690,545,491 54,920,131 434,746 779,075,714
Provision for impairment:At 1 January 2017 and
at 30 June 2017 – – – – –
Net carrying amount:At 30 June 2017 103,804,064 1,707,344,950 89,493,137 299,627 1,900,941,778
At 1 January 2017 106,760,785 1,624,559,549 90,067,744 380,849 1,821,768,927
Note: The concession is owned by a subsidiary of the Company, Maanshan Iron & Steel (Hefei) Limited
Industrial Water Supply Co., Ltd. (“Hefei Water Supply”). On 18 May 2011, Hefei Water Supply
obtained a concession by signing the “Concession Arrangement for Hefei Circle Economy Park
Industrial Water Supply” (the “Arrangement”) with the Administrative Committee of Hefei Circle
Economy Park (the “Park”) through open tender. According to the Arrangement, Hefei Water Supply
has the right to receive fees from water users in the Park by providing principal services including:
industrial water supply, and designing, constructing, occupying, operating and maintaining
the industrial water treatment plant, water abstraction and pipe networks. The infrastructure
construction contract was applied, and no construction service revenue was recognised. According
to the agreement, the payment for the project during the construction was recognised as intangible
assets. The specified concession service period is 25 years. Hefei Water Supply is obliged to
transfer all infrastructures to the grantor, the Administrative Committee of Hefei Circle Economy
Park, at the end of the period of the Arrangement with smooth operation guaranteed.
On 30 June 2017, the carrying amount of intangible assets that have not been issued
certificates of ownership amounted to RMB109,101,790. The amount refers to the land use
rights of Anhui Changjiang Iron and Steel that have not been issued certificates of ownership.
The management represents that the Group is in the process of obtaining the relevant
certificates, and it will not have any impact on the use of land use rights.
* The Group’s land use rights are located in Mainland China and are held under medium term leases.

Notes to Interim Financial Statements (Continued)30 June 2017Renminbi Yuan
Maanshan Iron & Steel Company Limited
2017 InterimReport
117
V. MAJOR NOTES TO CONSOLIDATED FINANCIAL STATEMENTS (CONTINUED)
17. INTANGIBLE ASSETS (CONTINUED)
31 December 2016 (Audited)
Concession assets
Land use rights Mining rights Patent Total
Cost:At 1 January 2016 136,979,410 2,296,421,463 137,120,350 587,217 2,571,108,440Addition – 1,567,188 – 87,682 1,654,870Disposals – (9,200,000) – – (9,200,000)Exchange realignment
and others – – 2,784,497 17,512 2,802,009
At 31 December 2016 136,979,410 2,288,788,651 139,904,847 692,411 2,566,365,319
Accumulated depreciation:At 1 January 2016 24,305,184 614,246,226 41,097,193 101,677 679,750,280Provided 5,913,441 51,424,739 6,056,366 206,852 63,601,398Disposals – (1,441,863) – – (1,441,863)Exchange realignment
and others – – 2,683,544 3,033 2,686,577
At 31 December 2016 30,218,625 664,229,102 49,837,103 311,562 744,596,392
Provision for impairment:At 1 January 2016 and
at 31 December 2016 – – – – –
Net carrying amount:At 31 December 2016 106,760,785 1,624,559,549 90,067,744 380,849 1,821,768,927
At 1 January 2016 112,674,226 1,682,175,237 96,023,157 485,540 1,891,358,160

Notes to Interim Financial Statements (Continued)30 June 2017Renminbi Yuan
Maanshan Iron & Steel Company Limited
2017 InterimReport
118
V. MAJOR NOTES TO CONSOLIDATED FINANCIAL STATEMENTS (CONTINUED)
18. DEFERRED TAX ASSETS/LIABILITIES
30 June 2017 (Unaudited) 31 December 2016 (Audited)
Deductible
temporary
differences
Deferred
tax assets
Deductible
temporary
differences
Deferred
tax assets
Deferred tax assets
Asset impairment provision 342,133,440 85,533,360 251,160,664 62,790,166
Sales incentive 129,342,492 32,335,623 352,819,600 88,204,900
Payroll payable 32,131,384 8,032,846 30,313,204 7,578,301
Government grants 572,819,812 143,204,953 621,341,760 155,335,440
Others 74,306,092 18,576,523 136,747,904 34,186,976
1,150,733,220 287,683,305 1,392,383,132 348,095,783
30 June 2017 (Unaudited) 31 December 2016 (Audited)
Taxable
temporary
differences
Deferred
tax liabilities
Taxable
temporary
differences
Deferred
tax liabilities
Deferred tax liabilities
Fair value adjustments related to
business combination not under
common control 112,191,208 28,047,802 117,824,896 29,456,224
Changes in fair value of funds and
financial products 16,683,532 4,170,883 1,619,352 404,838
Others 17,554,820 4,388,705 20,817,396 5,204,349
146,429,560 36,607,390 140,261,644 35,065,411

Notes to Interim Financial Statements (Continued)30 June 2017Renminbi Yuan
Maanshan Iron & Steel Company Limited
2017 InterimReport
119
V. MAJOR NOTES TO CONSOLIDATED FINANCIAL STATEMENTS (CONTINUED)
18. DEFERRED TAX ASSETS/LIABILITIES (CONTINUED)
As of 30 June 2017 and 31 December 2016, the Group’s unrecognised deferred tax assets
arising from deductible temporary differences and deductible tax losses were as follows:
30 June
2017
31 December
2016
(Unaudited) (Audited)
Deductible temporary differences 1,530,550,266 817,739,042
Deductible tax losses 8,618,721,318 9,605,772,407
10,149,271,584 10,423,511,449
Unrecognised deferred tax assets arising from deductible tax losses will expire in the following
years:
30 June
2017
31 December
2016
(Unaudited) (Audited)
To expire in 2017 2,152,402,424 3,171,336,504
To expire in 2018 483,216,836 483,216,836
To expire in 2019 781,213,612 781,213,612
To expire in 2020 4,555,266,671 4,555,266,671
To expire in 2021 614,738,784 614,738,784
To expire in 2022 31,882,991 –
8,618,721,318 9,605,772,407
The Group has not recognised the deferred tax assets related to the above deductible
temporary differences and unused tax losses, because it is highly probable that future taxable
profit will not be available to be utilised.
Based on the current rules and regulations of taxation and preferential tax policy committed
by local tax authorities or the Group deserved to have, the Group estimated the amount of
income tax and deferred tax. In business activities, there were uncertainties of tax treatments
for several transactions and issues. Therefore, if the final recognised results of issues in tax
treatments are different from the initial amount, the differences will pose influences on the
amount of income tax and deferred tax, which were recognised in the above time periods
accordingly.

Notes to Interim Financial Statements (Continued)30 June 2017Renminbi Yuan
Maanshan Iron & Steel Company Limited
2017 InterimReport
120
V. MAJOR NOTES TO CONSOLIDATED FINANCIAL STATEMENTS (CONTINUED)
18. DEFERRED TAX ASSETS/LIABILITIES (CONTINUED)
Uncovered deficit and other temporary deductible differences, such as non-deductible provision
for trade receivables before tax, inventories, fixed assets, construction in progress and so
on, the deferred tax assets are recognised to the extent that the deficit covered by taxable
profit which would probably arise in future or the deductible temporary differences that could
be reversed. The deferred tax assets are recognised based on the significant judgement by
management after considering when and how much taxable profit would arise and its tax
planning.
19. ASSET IMPAIRMENT PROVISIONS
30 June 2017 (Unaudited)
Decrease during
the current period
Opening
balance
Increase
during the
current period Reversal
Write-back/
write-off
Exchange
realignment
Closing
balance
Provisions for bad debts 662,500,880 950,427 (5,249,721) (1,727,440) – 656,474,146
Including: Trade receivables 20,729,808 950,427 (1,207,196) – – 20,473,039
Other receivables 594,245,515 – – (1,727,440) – 592,518,075
Loans and advances
to customers 47,525,557 – (4,042,525) – – 43,483,032
Inventory impairment
provision (Note) 292,506,001 111,966,551 – (132,377,397) – 272,095,155
Including: Raw materials 83,746,075 84,052,622 – (64,404,408) – 103,394,289
Work in progress 17,659,670 17,048,717 – (8,446,209) – 26,262,178
Finished goods 64,188,089 10,865,212 – (21,631,812) – 53,421,489
Spare parts 126,912,167 – – (37,894,968) – 89,017,199
Property, plant and equipment
impairment provision 38,607,464 – – – 140,368 38,747,832
Including: Buildings and plant 6,514,174 – – – – 6,514,174
Machinery and
equipment 32,093,290 – – – 140,368 32,233,658
993,614,345 112,916,978 (5,249,721) (134,104,837) 140,368 967,317,133
Note: Generally, the provision for inventories is assessed and made at the end of every half year. The
provision for inventories will be written back and credited to the cost of sales upon the sale of
corresponding inventories.

Notes to Interim Financial Statements (Continued)30 June 2017Renminbi Yuan
Maanshan Iron & Steel Company Limited
2017 InterimReport
121
V. MAJOR NOTES TO CONSOLIDATED FINANCIAL STATEMENTS (CONTINUED)
19. ASSET IMPAIRMENT PROVISIONS (CONTINUED)
31 December 2016 (Audited)
Decrease during the year
Opening
balance
Increase
during
the year Reversal
Write-back/
write-off
Exchanges
realignment
Closing
balance
Provisions for bad debts 627,660,520 36,124,204 (927,877) (355,967) – 662,500,880
Including: Trade receivables 19,196,395 2,517,257 (927,877) (55,967) – 20,729,808
Other receivables 591,559,264 2,986,251 – (300,000) – 594,245,515
Loans and advances
to customers 16,904,861 30,620,696 – – – 47,525,557
Inventory impairment provision 1,004,097,488 990,453,845 – (1,702,045,332) – 292,506,001
Including: Raw materials 350,365,789 443,512,539 – (710,132,253) – 83,746,075
Work in progress 102,234,757 152,393,221 – (236,968,308) – 17,659,670
Finished goods 491,923,981 326,693,412 – (754,429,304) – 64,188,089
Spare parts 59,572,961 67,854,673 – (515,467) – 126,912,167
Property, plant and equipment
impairment provision – 38,607,464 – – – 38,607,464
Including: Buildings and plant – 6,514,174 – – – 6,514,174
Machinery and
equipment – 32,093,290 – – – 32,093,290
1,631,758,008 1,065,185,513 (927,877) (1,702,401,299) – 993,614,345
20. DEPOSITS AND BALANCES FROM BANKS AND OTHER FINANCIAL INSTITUTIONS
30 June 31 December
2017 2016
Unaudited Audited
Demand deposits 2,117,114,647 2,681,506,250
Notice deposits 25,300,000 285,300,000
Time deposits 735,700,329 741,418,771
2,878,114,976 3,708,225,021
Details of customer deposits of Masteel Financial relate to shareholders who held 5% or more
of voting shares and the related parties at 30 June 2017 and 31 December 2016 are disclosed
in Note X.6.

Notes to Interim Financial Statements (Continued)30 June 2017Renminbi Yuan
Maanshan Iron & Steel Company Limited
2017 InterimReport
122
V. MAJOR NOTES TO CONSOLIDATED FINANCIAL STATEMENTS (CONTINUED)
21. REPURCHASE AGREEMENTS
30 June 31 December
2017 2016
Unaudited Audited
Bonds – 397,900,000
Notes 198,900,000 198,665,698
198,900,000 596,565,698
Repurchase agreements is the money arising from notes and bonds discounted by Masteel
Financial to other financial institutions according to the repurchase agreements.
22. SHORT-TERM LOANS
30 June
2017
31 December
2016
Unaudited Audited
Unsecured loans 3,837,248,073 6,002,740,320
Inward documentary notes and
usance letters of credit (Note) 750,894,155 940,212,100
4,588,142,228 6,942,952,420
Note: As of 30 June 2017, the outstanding letters of credit of the Group amounted to RMB750,894,155
(31 December 2016: RMB940,212,100).
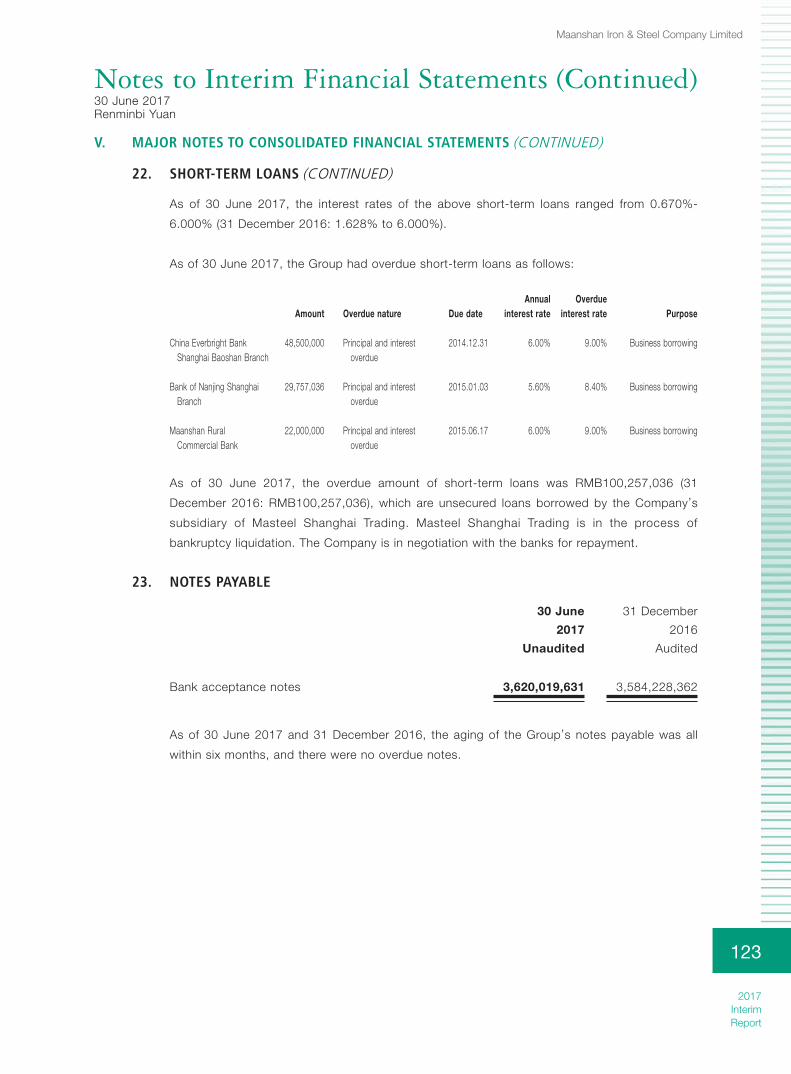
Notes to Interim Financial Statements (Continued)30 June 2017Renminbi Yuan
Maanshan Iron & Steel Company Limited
2017 InterimReport
123
V. MAJOR NOTES TO CONSOLIDATED FINANCIAL STATEMENTS (CONTINUED)
22. SHORT-TERM LOANS (CONTINUED)
As of 30 June 2017, the interest rates of the above short-term loans ranged from 0.670%-
6.000% (31 December 2016: 1.628% to 6.000%).
As of 30 June 2017, the Group had overdue short-term loans as follows:
Amount Overdue nature Due dateAnnual
interest rateOverdue
interest rate Purpose
China Everbright Bank Shanghai Baoshan Branch
48,500,000 Principal and interest overdue
2014.12.31 6.00% 9.00% Business borrowing
Bank of Nanjing Shanghai Branch
29,757,036 Principal and interest overdue
2015.01.03 5.60% 8.40% Business borrowing
Maanshan Rural Commercial Bank
22,000,000 Principal and interest overdue
2015.06.17 6.00% 9.00% Business borrowing
As of 30 June 2017, the overdue amount of short-term loans was RMB100,257,036 (31
December 2016: RMB100,257,036), which are unsecured loans borrowed by the Company’s
subsidiary of Masteel Shanghai Trading. Masteel Shanghai Trading is in the process of
bankruptcy liquidation. The Company is in negotiation with the banks for repayment.
23. NOTES PAYABLE
30 June 31 December
2017 2016
Unaudited Audited
Bank acceptance notes 3,620,019,631 3,584,228,362
As of 30 June 2017 and 31 December 2016, the aging of the Group’s notes payable was all
within six months, and there were no overdue notes.

Notes to Interim Financial Statements (Continued)30 June 2017Renminbi Yuan
Maanshan Iron & Steel Company Limited
2017 InterimReport
124
V. MAJOR NOTES TO CONSOLIDATED FINANCIAL STATEMENTS (CONTINUED)
24. ACCOUNTS PAYABLE
The aging analysis of accounts payable is as follows:
30 June 31 December
2017 2016
Unaudited Audited
Within one year 5,386,809,438 6,491,661,696
One to two years 420,001,971 62,554,813
Two to three years 64,981,339 52,430,647
Over three years 65,641,475 62,160,767
5,937,434,223 6,668,807,923
* The aging analysis of accounts payable of the Group is based on the invoice date.
The accounts payable are interest-free and are normally settled within three months, and
projects payable are paid according to the period and schedule of the project.
The amounts due to shareholders who held 5% or above of the Company’s equity interests
and other related parties among the balances of accounts payable as of 30 June 2017 and 31
December 2016 are disclosed in Note X.6 to the financial statements.
As of 30 June 2017, the material accounts payable aged over one year were as follows:
Amount due
Reason for
non-settlement
Company 1 261,938,841 Note
Company 2 79,305,425 Note
Company 3 45,648,406 Note
Company 4 19,000,000 Note
Company 5 17,000,000 Note
422,892,672
Note: The Group’s accounts payable aged over one year are mainly attributable to the balances of
projects with settlement periods beyond one year.

Notes to Interim Financial Statements (Continued)30 June 2017Renminbi Yuan
Maanshan Iron & Steel Company Limited
2017 InterimReport
125
V. MAJOR NOTES TO CONSOLIDATED FINANCIAL STATEMENTS (CONTINUED)
25. ADVANCES FROM CUSTOMERS
30 June
2017
31 December
2016
Unaudited Audited
Advances from customers 3,419,347,414 3,682,322,418
As of 30 June 2017, the material advances from customers aged over one year were as
follows:
Amount
receivable
Reason for
outstanding
Company 1 14,259,800 Note
Company 2 6,340,000 Note
Company 3 6,250,000 Note
Company 4 5,560,000 Note
Company 5 5,240,000 Note
Company 6 4,333,253 Note
Company 7 3,970,000 Note
Company 8 2,185,715 Note
Company 9 2,050,000 Note
50,188,768
Note: the Group’s advances from customers aged over one year were mainly advances from customers
relating to the contracts not fully executed.

Notes to Interim Financial Statements (Continued)30 June 2017Renminbi Yuan
Maanshan Iron & Steel Company Limited
2017 InterimReport
126
V. MAJOR NOTES TO CONSOLIDATED FINANCIAL STATEMENTS (CONTINUED)
26. PAYROLL AND EMPLOYEE BENEFITS PAYABLE
30 June 2017 (Unaudited)
Openingbalance
Increase during
the period
Decrease during
the periodClosingbalance
Short-term employee benefits 516,403,174 1,610,907,600 1,610,782,155 516,528,619Post-employment benefits
(defined contribution plans) 471,321 280,476,011 270,116,158 10,831,174Supplementary retirement benefits (i) 1,127,023 806,879 738,580 1,195,322One-off termination compensation (ii) – 16,273,243 16,273,243 –Early retirement benefits due
within one year 32,443,165 29,059,123 20,663,650 40,838,638
550,444,683 1,937,522,856 1,918,573,786 569,393,753
31 December 2016 (Audited)
Opening balance
Increase during
the year
Decrease during
the yearClosing balance
Short-term employee benefits 263,336,940 3,268,054,882 3,014,988,648 516,403,174Post-employment benefits
(defined contribution plans) 10,057,259 539,619,532 549,205,470 471,321Supplementary retirement benefits 1,220,524 1,477,159 1,570,660 1,127,023One-off termination compensation – 172,343,335 172,343,335 –Early retirement benefits due
within one year – 32,443,165 – 32,443,165
274,614,723 4,013,938,073 3,738,108,113 550,444,683
(i) MG-VALDUNES provides retired workers with supplementary benefits, including supplementary
pension allowance, medical expenses and supplementary medical insurance, which are regarded
as defined benefit plans. The present value of the defined benefit plans is equal to the discounted
value of the estimated future cash outflow. The discounted rate is determined by the interest rate
of treasury bond of which maturity is close to the payment date of the defined benefit plans. The
payroll and employee benefits payable with maturity of more than one year are recognised in long-
term compensation.
(ii) One-off termination compensation during the current period was mainly the termination
compensation paid by the Company to its employees due to human resource optimization policy.

Notes to Interim Financial Statements (Continued)30 June 2017Renminbi Yuan
Maanshan Iron & Steel Company Limited
2017 InterimReport
127
V. MAJOR NOTES TO CONSOLIDATED FINANCIAL STATEMENTS (CONTINUED)
26. PAYROLL AND EMPLOYEE BENEFITS PAYABLE (CONTINUED)
Short-term employee benefits:
30 June 2017 (Unaudited)
Opening
balance
Increase
during
the period
Decrease
during
the period
Closing
balance
Salaries, bonuses and subsidies 469,991,142 1,235,951,131 1,296,711,510 409,230,763
Welfare 19,192,058 89,469,981 59,092,787 49,569,252
Social insurance – 112,231,155 93,941,648 18,289,507
Including: Medical insurance – 94,270,184 78,933,170 15,337,014
Work-related injury insurance – 14,613,514 12,138,919 2,474,595
Maternity insurance – 3,347,457 2,869,559 477,898
Housing fund 20,309,142 132,336,581 132,525,771 20,119,952
Labor union fee and employee education fee 6,910,832 40,918,752 28,510,439 19,319,145
516,403,174 1,610,907,600 1,610,782,155 516,528,619
31 December 2016 (Audited)
Opening
balance
Increase
during
the year
Decrease
during
the year
Closing
balance
Salaries, bonuses and subsidies 211,386,627 2,588,861,452 2,330,256,937 469,991,142
Welfare 21,019,222 119,535,313 121,362,477 19,192,058
Social insurance 15,911 220,098,717 220,114,628 –
Including: Medical insurance (3,693) 183,533,733 183,530,040 –
Work-related injury insurance 13,004 29,378,746 29,391,750 –
Maternity insurance 6,600 7,186,238 7,192,838 –
Housing fund 25,661,454 272,985,670 278,337,982 20,309,142
Labor union fee and employee education fee 5,253,726 66,573,730 64,916,624 6,910,832
263,336,940 3,268,054,882 3,014,988,648 516,403,174

Notes to Interim Financial Statements (Continued)30 June 2017Renminbi Yuan
Maanshan Iron & Steel Company Limited
2017 InterimReport
128
V. MAJOR NOTES TO CONSOLIDATED FINANCIAL STATEMENTS (CONTINUED)
26. PAYROLL AND EMPLOYEE BENEFITS PAYABLE (CONTINUED)
Defined contribution plans:
30 June 2017 (Unaudited)
Opening
balance
Increase
during
the period
Decrease
during
the period
Closing
balance
Pension insurance – 239,537,627 239,437,274 100,353
Unemployment insurance – 11,528,567 7,795,718 3,732,849
Enterprise annuity 471,321 29,409,817 22,883,166 6,997,972
471,321 280,476,011 270,116,158 10,831,174
31 December 2016 (Audited)
Opening
balance
Increase
during
the year
Decrease
during
the year
Closing
balance
Pension insurance 365,178 493,460,702 493,825,880 –
Unemployment insurance 184,483 27,324,716 27,509,199 –
Enterprise annuity 9,507,598 18,834,114 27,870,391 471,321
10,057,259 539,619,532 549,205,470 471,321

Notes to Interim Financial Statements (Continued)30 June 2017Renminbi Yuan
Maanshan Iron & Steel Company Limited
2017 InterimReport
129
V. MAJOR NOTES TO CONSOLIDATED FINANCIAL STATEMENTS (CONTINUED)
26. PAYROLL AND EMPLOYEE BENEFITS PAYABLE (CONTINUED)
In addition to the basic social endowment insurance, employees (including employees of the
Company and some wholly-owned subsidiaries) participated in the established retirement
benefit contribution plans (hereinafter referred to as the “Annuity Plan”) established by the
Group. The employees who participated in the Annuity Plan use the bases of social insurance
premiums as their deposit base. The deposit rates of the Group and employee are 5% and 1%,
respectively.
Long-term compensation:
30 June
2017
31 December
2016
(Unaudited) (Audited)
1. Post-employment benefits – net liability of
defined benefit plans (Note) 169,757,308 159,868,285
Less: Early retirement benefits due within one year 40,838,638 32,443,165
2. Supplementary retirement benefit 34,867,370 32,875,106
Less: Supplementary retirement benefit due
within one year 1,195,322 1,127,023
162,590,718 159,173,203
Note: Post-employment benefits – net defined benefit liability
30 June 2017 (Unaudited)
Opening
balance Increase Decrease
Closing
balance
Less: Due
within
one year
Closing
balance
Early retirement benefits 159,868,285 30,552,673 (20,663,650) 169,757,308 40,838,638 128,918,670

Notes to Interim Financial Statements (Continued)30 June 2017Renminbi Yuan
Maanshan Iron & Steel Company Limited
2017 InterimReport
130
V. MAJOR NOTES TO CONSOLIDATED FINANCIAL STATEMENTS (CONTINUED)
26. PAYROLL AND EMPLOYEE BENEFITS PAYABLE (CONTINUED)
Early retirement benefits expected to be paid by the Group:
30 June
2017
31 December
2016
(Unaudited) (Audited)
Undiscounted value
Within one year 41,304,260 32,443,165
One to two years 33,272,402 29,197,924
Two to three years 27,514,391 26,523,841
Over three years 86,267,897 90,136,936
188,358,950 178,301,866
Financial charges unrecognised (18,601,642) (18,433,581)
169,757,308 159,868,285
Less: Due within one year 40,838,638 32,443,165
128,918,670 127,425,120
Early retirement benefit scheme was implemented by the Company due to the implementation
of the human resource optimisation policy, which allowed qualified employees to early retire on
a voluntary basis. The Company undertakes obligation to pay the early retirement employees’
living expenses for one to ten years in the future. The Company calculated the amounts of
monthly payments to employees participating in the early retirement plan based on an internally
decided standard, and the Company is also responsible for social insurance and housing fund
in accordance with local social security requirement. The Company forecasted the amount of
early retirement benefits needed to be paid in the future years using a growth rate of 1.66%
which is based on the average growth rate of CPI. When deciding the payment responsibility
in the future for the employees participating in the early retirement plan, the Company adjusted
the payment responsibility based on average mortality of Chinese people from “China Life
Insurance Mortality Table (2010 to 2013)”. The adjusted payment responsibility was discounted
by the treasure bond rate of 30 June 2017 and accounted in general administrative expenses.
As of 30 June 2017, the current portion of the payment responsibility was accounted for in
short-term employee benefits.

Notes to Interim Financial Statements (Continued)30 June 2017Renminbi Yuan
Maanshan Iron & Steel Company Limited
2017 InterimReport
131
V. MAJOR NOTES TO CONSOLIDATED FINANCIAL STATEMENTS (CONTINUED)
27. TAXES PAYABLE
30 June 31 December
2017 2016
Unaudited Audited
Value-added tax 49,735,379 112,249,203
Corporate income tax 93,659,716 48,757,600
City construction and maintenance tax 18,855,789 34,523,584
Other taxes 73,648,147 78,701,727
235,899,031 274,232,114
The basis of calculation and the applicable tax rates are disclosed in Note IV to the financial
statements.
28. INTEREST PAYABLE
30 June 31 December
2017 2016
Unaudited Audited
Interest payable for short-term loans 35,770,834 9,590,649
Installment interest payables for
long-term loans repayable on due date 5,554,051 10,280,475
Interest payables for medium term notes 185,709,041 87,820,274
227,033,926 107,691,398
As of 30 June 2017, the Group had an overdue interest payable of RMB21,479,527. It was
incurred by the Group’s subsidiary, Masteel Shanghai Trading, due to the shortage of cash.
Refer to Note V.22.
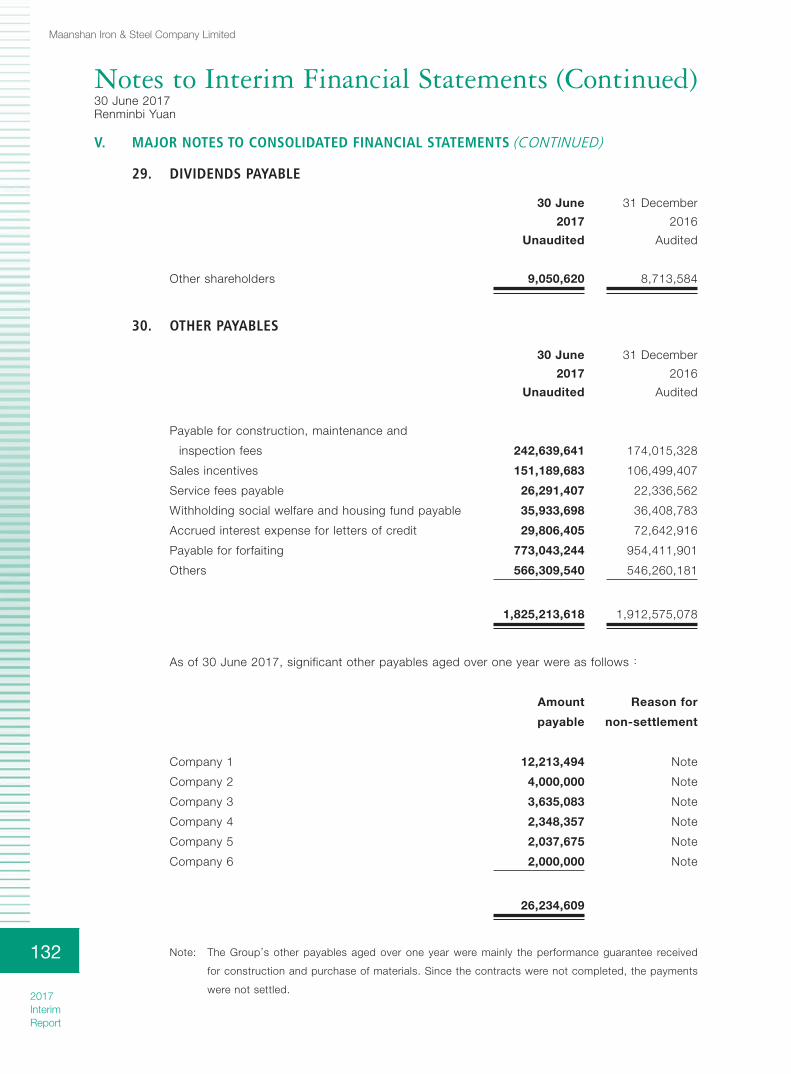
Notes to Interim Financial Statements (Continued)30 June 2017Renminbi Yuan
Maanshan Iron & Steel Company Limited
2017 InterimReport
132
V. MAJOR NOTES TO CONSOLIDATED FINANCIAL STATEMENTS (CONTINUED)
29. DIVIDENDS PAYABLE
30 June 31 December
2017 2016
Unaudited Audited
Other shareholders 9,050,620 8,713,584
30. OTHER PAYABLES
30 June 31 December
2017 2016
Unaudited Audited
Payable for construction, maintenance and
inspection fees 242,639,641 174,015,328
Sales incentives 151,189,683 106,499,407
Service fees payable 26,291,407 22,336,562
Withholding social welfare and housing fund payable 35,933,698 36,408,783
Accrued interest expense for letters of credit 29,806,405 72,642,916
Payable for forfaiting 773,043,244 954,411,901
Others 566,309,540 546,260,181
1,825,213,618 1,912,575,078
As of 30 June 2017, significant other payables aged over one year were as follows:
Amount
payable
Reason for
non-settlement
Company 1 12,213,494 Note
Company 2 4,000,000 Note
Company 3 3,635,083 Note
Company 4 2,348,357 Note
Company 5 2,037,675 Note
Company 6 2,000,000 Note
26,234,609
Note: The Group’s other payables aged over one year were mainly the performance guarantee received
for construction and purchase of materials. Since the contracts were not completed, the payments
were not settled.

Notes to Interim Financial Statements (Continued)30 June 2017Renminbi Yuan
Maanshan Iron & Steel Company Limited
2017 InterimReport
133
V. MAJOR NOTES TO CONSOLIDATED FINANCIAL STATEMENTS (CONTINUED)
31. NON-CURRENT LIABILITIES DUE WITHIN ONE YEAR
30 June 31 December
2017 2016
Unaudited Audited
Long-term loans due within one year (Note V.34) (Note) 549,859,584 3,211,056,320
Note: As of 30 June 2017, the Group had a long-term loan due within one year amounting to
RMB400,000,000 which was pledged with notes (31 December 2016: RMB600,000,000).
32. ACCRUED LIABILITIES
30 June 2017 (Unaudited)
Opening balance
Increase during
the period
Decrease during
the periodClosing balance
Pending litigation or arbitration 10,867,075 3,069,950 1,972,554 11,964,471
Pending onerous contract (Note) 14,284,847 21,956,843 13,639,109 22,602,581
Others 4,428,513 387,265 2,195,043 2,620,735
29,580,435 25,414,058 17,806,706 37,187,787
Note: The accrued liabilities of the pending onerous contract represents an expected loss from executing
some sales orders entered by the Group’s subsidiary, MG-VALDUNES. Management estimated the
cost of executing those orders would exceed the agreed price. Therefore, the accrued liabilities
were estimated on 30 June 2017.
33. OTHER CURRENT LIABILITIES
30 June 31 December
2017 2016
Unaudited Audited
Short-term commercial paper (i) 4,122,870,685 2,046,438,356
Others (ii) 184,310,000 226,620,000
4,307,180,685 2,273,058,356

Notes to Interim Financial Statements (Continued)30 June 2017Renminbi Yuan
Maanshan Iron & Steel Company Limited
2017 InterimReport
134
V. MAJOR NOTES TO CONSOLIDATED FINANCIAL STATEMENTS (CONTINUED)
33. OTHER CURRENT LIABILITIES (CONTINUED)
(i) Other current l iab i l i t ies o f the Group were the pr inc ipa l and in terest amount ing to
RMB2,000,000,000 and RMB102,473,973 respectively of the short-term commercial paper issued
by the Company on 2 August 2016, and the principal and interest amounting to RMB2,000,000,000
and RMB20,396,712 respectively of the short-term commercial paper issued by the Company on
18 April 2017.
(ii) The Company received the advance of land use tax refund for 2017 from the local Finance Bureau
amounting to RMB142,000,000 in 2016 and the advance of development and reform subsidy for
2017 from the municipal government amounting to RMB42,310,000.
34. LONG-TERM LOANS
30 June 31 December
2017 2016
Unaudited Audited
Guaranteed loans 2,847,448,960 1,175,968,960
Unsecured loans 5,177,371,120 3,987,200,000
8,024,820,080 5,163,168,960
As of 30 June 2017, the interest rates of the above long-term loans ranged from 1.200% to
4.750% (31 December 2016: from 1.200% to 4.750%).
* Analysis on the due date of long-term loans is as follows:
30 June
2017
31 December
2016
Unaudited Audited
Within one year or on demand (Note V. 31) 549,859,584 3,211,056,320
One to two years (inclusive) 6,904,030,704 4,255,056,320
Two to three years (inclusive) 999,859,584 761,056,320
Three to five years (inclusive) 24,929,792 51,056,320
Over five years 96,000,000 96,000,000
8,574,679,664 8,374,225,280

Notes to Interim Financial Statements (Continued)30 June 2017Renminbi Yuan
Maanshan Iron & Steel Company Limited
2017 InterimReport
135
V. MAJOR NOTES TO CONSOLIDATED FINANCIAL STATEMENTS (CONTINUED)
35. BONDS PAYABLE
30 June
2017
31 December
2016
Unaudited Audited
Medium-term note payable 3,991,666,667 3,987,666,667
As of 30 June 2017, the bonds payable balances were as follows:
Unaudited Issue dateTerm to
maturityAmount on offer
Opening balance
Current period
issuanceAmortisation
of discount
Current period
repaymentClosing balance
Current period
accrued interest
Medium-term note payable – 2015 first issue 2015/07 3 years 2,000,000,000 1,994,000,000 – 2,000,000 – 1,996,000,000 50,283,2882015 second issue 2015/08 3 years 2,000,000,000 1,993,666,667 – 2,000,000 – 1,995,666,667 47,605,479
4,000,000,000 3,987,666,667 – 4,000,000 – 3,991,666,667 97,888,767
As of 31 December 2016, the bonds payable balances were as follows:
Audited Issue dateTerm to maturity
Amount on offer
Opening balance
Current year
issuanceAmortisation
of discount
Current year
repaymentClosing balance
Current year
accrued interest
Medium-term note payable – 2015 first issue 2015/07 3 years 2,000,000,000 1,990,000,000 – 4,000,000 – 1,994,000,000 101,533,5912015 second issue 2015/08 3 years 2,000,000,000 1,989,666,667 – 4,000,000 – 1,993,666,667 96,106,355
Corporate bonds – 5 years 2011/08 5 years 2,340,000,000 2,337,066,519 – 2,933,481 2,340,000,000 – 86,975,115
6,340,000,000 6,316,733,186 – 10,933,481 2,340,000,000 3,987,666,667 284,615,061

Notes to Interim Financial Statements (Continued)30 June 2017Renminbi Yuan
Maanshan Iron & Steel Company Limited
2017 InterimReport
136
V. MAJOR NOTES TO CONSOLIDATED FINANCIAL STATEMENTS (CONTINUED)
35. BONDS PAYABLE (CONTINUED)
Medium-term note payable
In June 2015, the Company obtained the approval of the National Association of Financial
Market Institutional Investors regarding the issuance of a medium-term note with a registration
amount of RMB4 billion, which will expire within two years. The medium-term note is allowed to
be issued by stages in its registration period of validity.
On 9 July 2015, the Company issued the first batch of medium-term note of RMB2 billion
(abbreviated as 15 Magang MTN001). The issuance price was RMB100/Note, and has a fixed
rate of interest at 5.07% per annum. On 6 August 2015, the Company issued the second batch
of medium-term note of RMB2 billion (abbreviated as 15 Magang MTN002). The issuance price
is RMB100/Note, and has a fixed rate of interest at 4.80% per annum.
The interest for the period of the above medium-term note was included in interest payable.
36. DEFERRED INCOME
Deferred income was the government funding for particular projects obtained by the Group, the
movements were as follows:
During the six months ended 30 June 2017 (Unaudited)
Opening
balance Increase Decrease
Ending
balance
Government grants 1,269,496,538 14,908,915 24,351,242 1,260,054,211
2016 (Audited)
Opening
balance Increase Decrease
Ending
balance
Government grants 1,285,164,299 103,844,476 119,512,237 1,269,496,538

Notes to Interim Financial Statements (Continued)30 June 2017Renminbi Yuan
Maanshan Iron & Steel Company Limited
2017 InterimReport
137
V. MAJOR NOTES TO CONSOLIDATED FINANCIAL STATEMENTS (CONTINUED)
36. DEFERRED INCOME (CONTINUED)
As of 30 June 2017, liabilities related to government subsidies were as follows:
Opening
balance
Increase
during
the current
period
Included
in other
income
Closing
balance
Related to
assets/
income
Compensation of land
purchasing and storage (Note) 652,138,319 – – 652,138,319 income
Technological transformation fund
for Phase II silicon steel 86,241,669 – (2,200,000) 84,041,669 assets
Subsidy for hot-rolled 1580 project 38,808,750 – (990,000) 37,818,750 assets
New-zone Thermal Power Plant
CCPP system engineering 31,065,972 – (2,156,000) 28,909,972 assets
EMU steel wheel production line project 34,974,990 – (1,100,000) 33,874,990 assets
Environmental subsidy funds for flue
gas desulfurisation and 135 MW
thermal power 12,900,000 – (236,500) 12,663,500 assets
Fixed assets subsidy
for thin plate project 31,448,673 – (1,136,953) 30,311,720 assets
Environmental funds
for desulfurisation project of
3rd iron plant’s flue gas (BOT) 13,420,000 – (246,033) 13,173,967 assets
Subsidy for material modification of
high speed wheel and axle 33,720,000 – – 33,720,000 assets
Subsidy for Maanshan railway industry
(Maanshan) 13,160,100 – (504,000) 12,656,100 assets
Comprehensive utilisation of gas for
power generation of a thermal
power plant 24,699,103 – (545,380) 24,153,723 assets
Others 296,918,962 14,908,915 (15,236,376) 296,591,501 assets
Total 1,269,496,538 14,908,915 (24,351,242) 1,260,054,211
Note: The government subsidies related to income was mainly attributed to the compensation for disposal
of land use right received from Hefei Municipal Land Reserve Center by Ma Steel (Heifei) Iron &
Steel Co., Ltd. (“Ma Steel (Hefei)”).
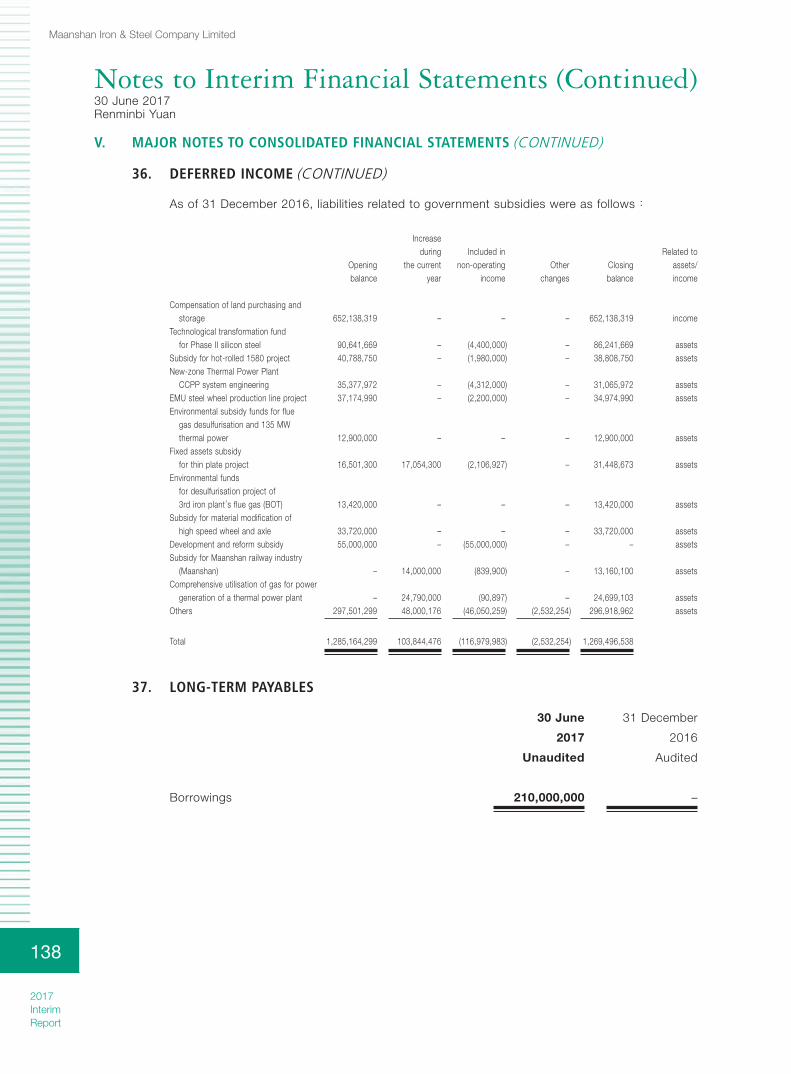
Notes to Interim Financial Statements (Continued)30 June 2017Renminbi Yuan
Maanshan Iron & Steel Company Limited
2017 InterimReport
138
V. MAJOR NOTES TO CONSOLIDATED FINANCIAL STATEMENTS (CONTINUED)
36. DEFERRED INCOME (CONTINUED)
As of 31 December 2016, liabilities related to government subsidies were as follows:
Opening balance
Increase during
the current year
Included in non-operating
incomeOther
changesClosing balance
Related to assets/ income
Compensation of land purchasing and storage 652,138,319 – – – 652,138,319 income
Technological transformation fund for Phase II silicon steel 90,641,669 – (4,400,000) – 86,241,669 assets
Subsidy for hot-rolled 1580 project 40,788,750 – (1,980,000) – 38,808,750 assetsNew-zone Thermal Power Plant
CCPP system engineering 35,377,972 – (4,312,000) – 31,065,972 assetsEMU steel wheel production line project 37,174,990 – (2,200,000) – 34,974,990 assetsEnvironmental subsidy funds for flue
gas desulfurisation and 135 MW thermal power 12,900,000 – – – 12,900,000 assets
Fixed assets subsidy for thin plate project 16,501,300 17,054,300 (2,106,927) – 31,448,673 assets
Environmental funds for desulfurisation project of 3rd iron plant’s flue gas (BOT) 13,420,000 – – – 13,420,000 assets
Subsidy for material modification of high speed wheel and axle 33,720,000 – – – 33,720,000 assets
Development and reform subsidy 55,000,000 – (55,000,000) – – assetsSubsidy for Maanshan railway industry
(Maanshan) – 14,000,000 (839,900) – 13,160,100 assetsComprehensive utilisation of gas for power
generation of a thermal power plant – 24,790,000 (90,897) – 24,699,103 assetsOthers 297,501,299 48,000,176 (46,050,259) (2,532,254) 296,918,962 assets
Total 1,285,164,299 103,844,476 (116,979,983) (2,532,254) 1,269,496,538
37. LONG-TERM PAYABLES
30 June
2017
31 December
2016
Unaudited Audited
Borrowings 210,000,000 –
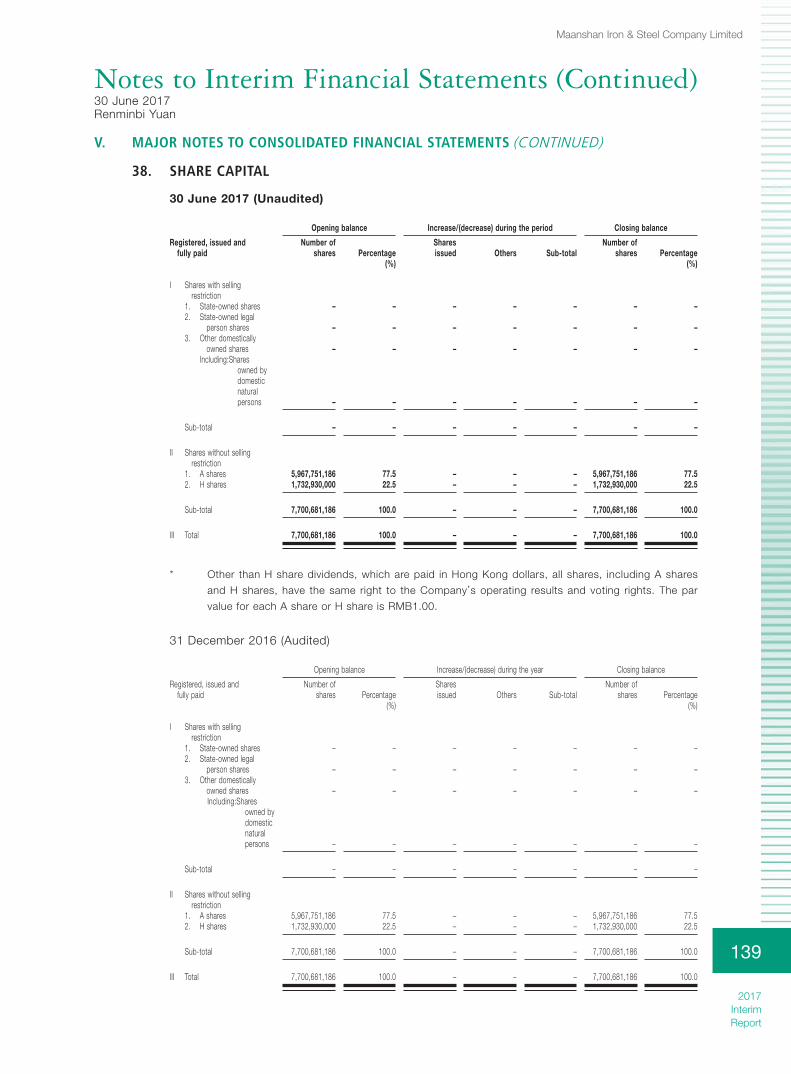
Notes to Interim Financial Statements (Continued)30 June 2017Renminbi Yuan
Maanshan Iron & Steel Company Limited
2017 InterimReport
139
V. MAJOR NOTES TO CONSOLIDATED FINANCIAL STATEMENTS (CONTINUED)
38. SHARE CAPITAL
30 June 2017 (Unaudited)
Opening balance Increase/(decrease) during the period Closing balance
Registered, issued and fully paid
Number of shares Percentage
Shares issued Others Sub-total
Number of shares Percentage
(%) (%)
I Shares with selling restriction1. State-owned shares – – – – – – –2. State-owned legal
person shares – – – – – – –3. Other domestically
owned shares – – – – – – –Including:Shares
owned by domestic natural persons – – – – – – –
Sub-total – – – – – – –
II Shares without selling restriction1. A shares 5,967,751,186 77.5 – – – 5,967,751,186 77.52. H shares 1,732,930,000 22.5 – – – 1,732,930,000 22.5
Sub-total 7,700,681,186 100.0 – – – 7,700,681,186 100.0
III Total 7,700,681,186 100.0 – – – 7,700,681,186 100.0
* Other than H share dividends, which are paid in Hong Kong dollars, all shares, including A shares
and H shares, have the same right to the Company’s operating results and voting rights. The par
value for each A share or H share is RMB1.00.
31 December 2016 (Audited)
Opening balance Increase/(decrease) during the year Closing balance
Registered, issued and fully paid
Number of shares Percentage
Shares issued Others Sub-total
Number of shares Percentage
(%) (%)
I Shares with selling restriction1. State-owned shares – – – – – – –2. State-owned legal
person shares – – – – – – –3. Other domestically
owned shares – – – – – – –Including:Shares
owned by domestic natural persons – – – – – – –
Sub-total – – – – – – –
II Shares without selling restriction1. A shares 5,967,751,186 77.5 – – – 5,967,751,186 77.52. H shares 1,732,930,000 22.5 – – – 1,732,930,000 22.5
Sub-total 7,700,681,186 100.0 – – – 7,700,681,186 100.0
III Total 7,700,681,186 100.0 – – – 7,700,681,186 100.0
Notes to Interim Financial Statements
30 June 2017
Renminbi Yuan

Notes to Interim Financial Statements (Continued)30 June 2017Renminbi Yuan
Maanshan Iron & Steel Company Limited
2017 InterimReport
140
V. MAJOR NOTES TO CONSOLIDATED FINANCIAL STATEMENTS (CONTINUED)
39. CAPITAL RESERVE
30 June 2017 (Unaudited)
Opening
balance
Increase
during
the period
Decrease
during
the period
Closing
balance
Share premium 8,329,067,663 – – 8,329,067,663
Others 19,659,078 – (120,416) 19,538,662
Total 8,348,726,741 – (120,416) 8,348,606,325
31 December 2016 (Audited)
Opening
balance
Increase
during
the year
Decrease
during
the year
Closing
balance
Share premium 8,329,067,663 – – 8,329,067,663
Others – 19,659,078 – 19,659,078
Total 8,329,067,663 19,659,078 – 8,348,726,741
40. OTHER COMPREHENSIVE INCOME
Closing balance of other comprehensive income attributable to owners of the parent in the
consolidated statement of financial position:
1 January
2016
Increase/
(decrease)
31 December
2016
Increase/
(decrease)
30 June
2017
Audited Unaudited
Change in fair value of
available-for-sale financial
investments – (803,607) (803,607) (780,770) (1,584,377)
Exchange differences arising from
foreign currency translation (165,450,551) 46,990,704 (118,459,847) 9,821,211 (108,638,636)
(165,450,551) 46,187,097 (119,263,454) 9,040,441 (110,223,013)

Notes to Interim Financial Statements (Continued)30 June 2017Renminbi Yuan
Maanshan Iron & Steel Company Limited
2017 InterimReport
141
V. MAJOR NOTES TO CONSOLIDATED FINANCIAL STATEMENTS (CONTINUED)
40. OTHER COMPREHENSIVE INCOME (CONTINUED)
Amount of other comprehensive income in the statement of profit or loss:
During the six months ended 30 June 2017 (Unaudited)
Amount
before tax
Income
tax
Attributable to
the parent
Attributable to
non-controlling
interests
Exchange differences arising from foreign
currency translation 9,392,026 – 9,821,211 (429,185)
Changes in fair value of available-for-sale
financial investments (1,143,987) 285,997 (780,770) (77,220)
Less: Recorded in other comprehensive
income originally, transferred in and
included in current profit or loss – – – –
8,248,039 285,997 9,040,441 (506,405)
2016 (Audited)
Amount
before tax
Income
tax
Attributable to
the parent
Attributable to
non-controlling
interests
Exchange differences arising from
foreign currency translation 47,982,490 – 46,990,704 991,786
Changes in fair value of available-for-sale
financial investments (1,177,446) 294,362 (803,607) (79,477)
Less: Recorded in other comprehensive
income originally, transferred in and
included in current profit or loss – – – –
46,805,044 294,362 46,187,097 912,309

Notes to Interim Financial Statements (Continued)30 June 2017Renminbi Yuan
Maanshan Iron & Steel Company Limited
2017 InterimReport
142
V. MAJOR NOTES TO CONSOLIDATED FINANCIAL STATEMENTS (CONTINUED)
41. SPECIAL RESERVE
30 June 2017 (Unaudited)
Opening
balance
Increase
during
the period
Decrease
during
the period
Closing
balance
Safety fund 27,969,571 36,175,115 (26,028,589) 38,116,097
31 December 2016 (Audited)
Opening
balance
Increase
during
the year
Decrease
during
the year
Closing
balance
Safety fund 14,374,213 98,487,391 (84,892,033) 27,969,571
Special reserve is the safety fund accrued according to the article of No.16 “The regulation
on the accrual and usage of enterprise’s safety production fee”, carried out by the Ministry
of Finance and State Administration of Work Safety on 14 February 2012. The fees are
mainly related to the industries of mining, gas, communication and transportation, metallurgy,
manufacturing, and construction services.
42. REVENUE AND COST OF SALES
For the six months ended 30 June
2017 (Unaudited) 2016 (Unaudited)
Revenue Cost of sales Revenue Cost of sales
Principal operating income 34,729,861,626 30,883,831,678 20,610,123,498 17,779,983,575
Other operating income 457,718,014 424,788,462 391,039,062 397,323,914
35,187,579,640 31,308,620,140 21,001,162,560 18,177,307,489
* Principal operating income represents the net invoiced value of goods sold, after allowance for
returns and trade discounts, and excludes value added taxes and intra-group transactions.

Notes to Interim Financial Statements (Continued)30 June 2017Renminbi Yuan
Maanshan Iron & Steel Company Limited
2017 InterimReport
143
V. MAJOR NOTES TO CONSOLIDATED FINANCIAL STATEMENTS (CONTINUED)
42. REVENUE AND COST OF SALES (CONTINUED)
Revenue is presented as follows:
For the six months
ended 30 June
2017 2016
Unaudited Unaudited
Sale of products 35,065,320,571 20,916,000,131
Rendering of services 73,047,146 56,925,591
Others 49,211,923 28,236,838
35,187,579,640 21,001,162,560
43. TAXES AND SURCHARGES
For the six months
ended 30 June
2017 2016
Unaudited Unaudited
City construction and maintenance tax 79,933,019 56,331,483
Education surcharge 60,692,904 41,583,924
Land usage tax 94,928,023 –
Vehicle and vessel usage tax 178,588 –
Real estate tax 54,546,306 –
Stamp duty 19,840,324 –
Others 12,481,355 7,671,540
322,600,519 105,586,947
According to the notice of “Value Added Tax Accounting Treatment Regulations” (Accounting
[2016] No.22), land usage tax, real estate tax, vehicle and vessel usage tax and stamp duty
have been recorded in “taxes and surcharges” instead of “general and administrative expenses”
since 1 May 2016.
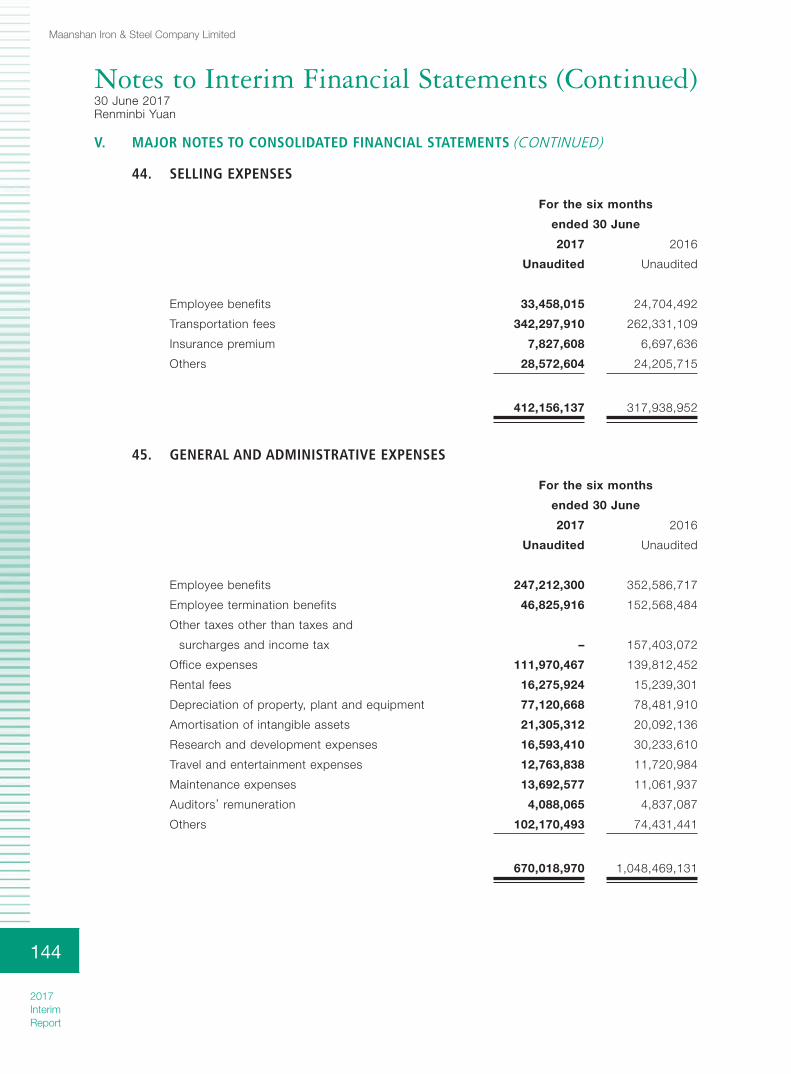
Notes to Interim Financial Statements (Continued)30 June 2017Renminbi Yuan
Maanshan Iron & Steel Company Limited
2017 InterimReport
144
V. MAJOR NOTES TO CONSOLIDATED FINANCIAL STATEMENTS (CONTINUED)
44. SELLING EXPENSES
For the six months
ended 30 June
2017 2016
Unaudited Unaudited
Employee benefits 33,458,015 24,704,492
Transportation fees 342,297,910 262,331,109
Insurance premium 7,827,608 6,697,636
Others 28,572,604 24,205,715
412,156,137 317,938,952
45. GENERAL AND ADMINISTRATIVE EXPENSES
For the six months
ended 30 June
2017 2016
Unaudited Unaudited
Employee benefits 247,212,300 352,586,717
Employee termination benefits 46,825,916 152,568,484
Other taxes other than taxes and
surcharges and income tax – 157,403,072
Office expenses 111,970,467 139,812,452
Rental fees 16,275,924 15,239,301
Depreciation of property, plant and equipment 77,120,668 78,481,910
Amortisation of intangible assets 21,305,312 20,092,136
Research and development expenses 16,593,410 30,233,610
Travel and entertainment expenses 12,763,838 11,720,984
Maintenance expenses 13,692,577 11,061,937
Auditors’ remuneration 4,088,065 4,837,087
Others 102,170,493 74,431,441
670,018,970 1,048,469,131

Notes to Interim Financial Statements (Continued)30 June 2017Renminbi Yuan
Maanshan Iron & Steel Company Limited
2017 InterimReport
145
V. MAJOR NOTES TO CONSOLIDATED FINANCIAL STATEMENTS (CONTINUED)
46. FINANCIAL EXPENSES
For the six months
ended 30 June
2017 2016
Unaudited Unaudited
Interest expenses (Note) 475,699,142 474,490,153
Less: Interest income 17,007,814 39,698,595
Less: Capitalised interest – 4,004,429
Exchange loss/(gain) 53,884,246 (50,883,197)
Others 15,631,808 27,350,512
528,207,382 407,254,444
Note: The Group’s interest expenses included interest on bank loans, other loans, corporate bonds, MTN
(Medium-term Note) and short-term commercial paper. Capitalised amount of borrowing costs had
been recorded in construction in progress.
47. ASSET IMPAIRMENT LOSS
For the six months
ended 30 June
2017 2016
Unaudited Unaudited
(Reversal)/provision for bad debts (4,299,294) 812,016
Including: Trade receivables (256,769) 812,016
Loans and advances (4,042,525) –
Provision for inventories 111,966,551 671,520,400
107,667,257 672,332,416

Notes to Interim Financial Statements (Continued)30 June 2017Renminbi Yuan
Maanshan Iron & Steel Company Limited
2017 InterimReport
146
V. MAJOR NOTES TO CONSOLIDATED FINANCIAL STATEMENTS (CONTINUED)
48. INVESTMENT INCOME
For the six months
ended 30 June
2017 2016
Unaudited Unaudited
Investment income from long-term equity
investments under the equity method 241,096,593 69,346,926
Investment income from disposal of a subsidiary
(Note VI.3) 736,943 –
Investment income from available-for-sale
financial investments during holding period 1,540,000 948,303
Investment income from disposal of
available-for-sale financial investments 26,066,785 –
Investment income from disposal of financial assets
at fair value through profit or loss 17,187,696 8,402,396
286,628,017 78,697,625
* During the current period, the Group’s investment income from unlisted companies amounted to
RMB286,628,017 (for the six months ended 30 June 2016:RMB78,697,625).
49. OTHER INCOME
Details of government grants charged to profit or loss relating to daily operation are as follows:
For the six months
ended 30 June
2017 2016
Unaudited Unaudited
Government grants related to assets 24,351,242 –
Government grants related to income:
– Tax refund 42,610,000 –
– Others 16,602,134 –
83,563,376 –

Notes to Interim Financial Statements (Continued)30 June 2017Renminbi Yuan
Maanshan Iron & Steel Company Limited
2017 InterimReport
147
V. MAJOR NOTES TO CONSOLIDATED FINANCIAL STATEMENTS (CONTINUED)
50. NON-OPERATING INCOME
For the six months ended 30 June
2017
Unaudited
2016
Unaudited
Included in
non-recurring
gains and
losses for the
six months
ended
30 June 2017
Unaudited
Gain on disposal of
non-current assets 808,004 154,474 808,004
Including: Gain on disposal of
fixed assets 808,004 154,474 808,004
Government grants (Note) 68,914,690 138,966,140 68,914,690
Others 984,426 1,271,288 984,426
70,707,120 140,391,902 70,707,120
Note: Details of government grants recorded in the profit or loss are as follows:
For the six months
ended 30 June
2017 2016
Unaudited Unaudited
Government grants related to assets – 86,681,426
Government grants related to income:
– Tax refund – 48,151,264
– Employee settlement grants for
addressing overcapacity 68,914,690 –
– Others – 4,133,450
68,914,690 138,966,140
In 2017, the Group accounts for government grants related to daily operation in other income
in accordance with the revised version of China Accounting Standard for Business Enterprises
No.16 – Government Grants (Accounting [2017] No.15). Please refer to Note V.49 for details.

Notes to Interim Financial Statements (Continued)30 June 2017Renminbi Yuan
Maanshan Iron & Steel Company Limited
2017 InterimReport
148
V. MAJOR NOTES TO CONSOLIDATED FINANCIAL STATEMENTS (CONTINUED)
51. NON-OPERATING EXPENSES
For the six months ended 30 June
2017
Unaudited
2016
Unaudited
Included in
non-recurring
gains and
losses for the
six months
ended
30 June 2017
Unaudited
Loss on disposal of non-current
assets 43,715,116 976,959 43,715,116
Including: Loss on disposal of
fixed assets 43,715,116 976,959 43,715,116
Compensation for quality objection 6,811,267 – 6,811,267
Public relief donation 173,950 278,650 173,950
Penalty expenditure 13,610 100,816 13,610
Others 589,178 392,317 589,178
51,303,121 1,748,742 51,303,121
52. INCOME TAX EXPENSE
For the six months
ended 30 June
2017 2016
Unaudited Unaudited
Mainland China:
Current income tax expense 264,181,195 25,257,004
Deferred tax expense 66,663,565 27,630,599
Hong Kong current income tax expense 55,603 –
Overseas current income tax expense 11,441,919 8,960,307
Overseas deferred income tax expense (4,423,111) 309,311
337,919,171 62,157,221

Notes to Interim Financial Statements (Continued)30 June 2017Renminbi Yuan
Maanshan Iron & Steel Company Limited
2017 InterimReport
149
V. MAJOR NOTES TO CONSOLIDATED FINANCIAL STATEMENTS (CONTINUED)
52. INCOME TAX EXPENSE (CONTINUED)
Reconciliation between income tax and profit before tax:
For the six months
ended 30 June
2017 2016
Unaudited Unaudited
Profit before tax 2,242,052,969 493,075,557
Tax at the applicable tax rate of 25% (Note) 560,513,242 123,268,889
Effect of different tax rates of subsidiaries (4,830,217) (4,216,531)
Non-deductible expenses 44,992,901 38,380,394
Adjustments in respect of current tax of
previous periods 10,803 733
Other tax preference (9,357,749) (5,878,193)
Income not subject to tax (1,337,348) (59,514)
Unrecognised deductible temporality difference
and tax losses 23,553,966 107,569,857
Tax losses utilised (215,352,279) (179,571,682)
Share of profits and losses of joint ventures
and associates (60,274,148) (17,336,732)
Income tax charge at the Group’s effective rate 337,919,171 62,157,221
Effective tax rate 15.07% 12.61%
Note: The Group’s income tax has been provided at the rate on the estimated taxable profits arising in the
PRC during the period. Taxes on profits assessable elsewhere have been calculated at the rates of
tax prevailing in the countries or regions in which the Group operates, based on existing legislation,
interpretations and practices in respect thereof.

Notes to Interim Financial Statements (Continued)30 June 2017Renminbi Yuan
Maanshan Iron & Steel Company Limited
2017 InterimReport
150
V. MAJOR NOTES TO CONSOLIDATED FINANCIAL STATEMENTS (CONTINUED)
53. EARNINGS PER SHARE
Basic earnings per share shall be calculated by dividing the profit attributable to owners of the
parent (the numerator) by the weighted average number of ordinary shares outstanding (the
denominator) during the period. Shares are usually included in the weighted average number of
shares from the date of their issue.
The calculations of the basic and diluted earnings per share amounts are based on:
For the six months
ended 30 June
2017 2016
Unaudited Unaudited
Earnings
Profit attributable to owners of the parent
as used in the basic/diluted
earnings per share calculations 1,643,396,514 452,752,971
Number of shares
Weighted average number of ordinary shares
in issue during the period as used in
the basic/diluted earnings per share calculations 7,700,681,186 7,700,681,186
Earnings per share
Basic and diluted 21.34 cents 5.88 cents
For the six months ended 30 June 2017 and 2016, there was no diluted item to adjust the
Company’s basic earnings per share.
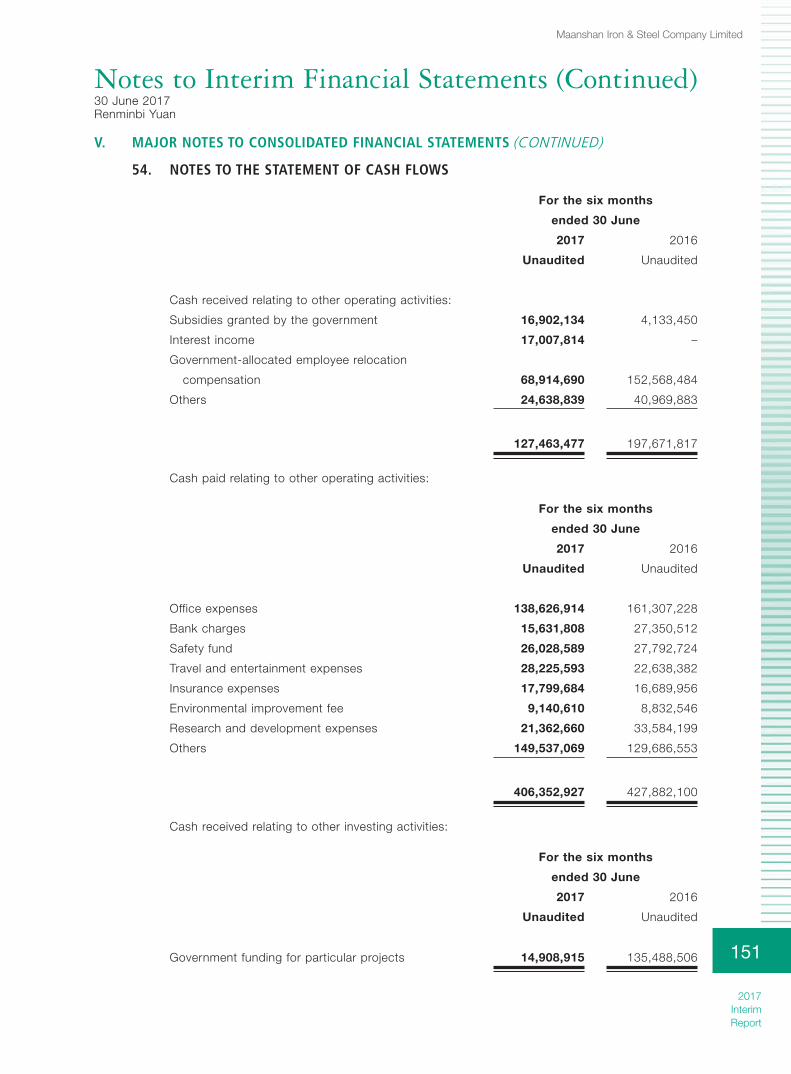
Notes to Interim Financial Statements (Continued)30 June 2017Renminbi Yuan
Maanshan Iron & Steel Company Limited
2017 InterimReport
151
V. MAJOR NOTES TO CONSOLIDATED FINANCIAL STATEMENTS (CONTINUED)
54. NOTES TO THE STATEMENT OF CASH FLOWS
For the six months
ended 30 June
2017 2016
Unaudited Unaudited
Cash received relating to other operating activities:
Subsidies granted by the government 16,902,134 4,133,450
Interest income 17,007,814 –
Government-allocated employee relocation
compensation 68,914,690 152,568,484
Others 24,638,839 40,969,883
127,463,477 197,671,817
Cash paid relating to other operating activities:
For the six months
ended 30 June
2017 2016
Unaudited Unaudited
Office expenses 138,626,914 161,307,228
Bank charges 15,631,808 27,350,512
Safety fund 26,028,589 27,792,724
Travel and entertainment expenses 28,225,593 22,638,382
Insurance expenses 17,799,684 16,689,956
Environmental improvement fee 9,140,610 8,832,546
Research and development expenses 21,362,660 33,584,199
Others 149,537,069 129,686,553
406,352,927 427,882,100
Cash received relating to other investing activities:
For the six months
ended 30 June
2017 2016
Unaudited Unaudited
Government funding for particular projects 14,908,915 135,488,506
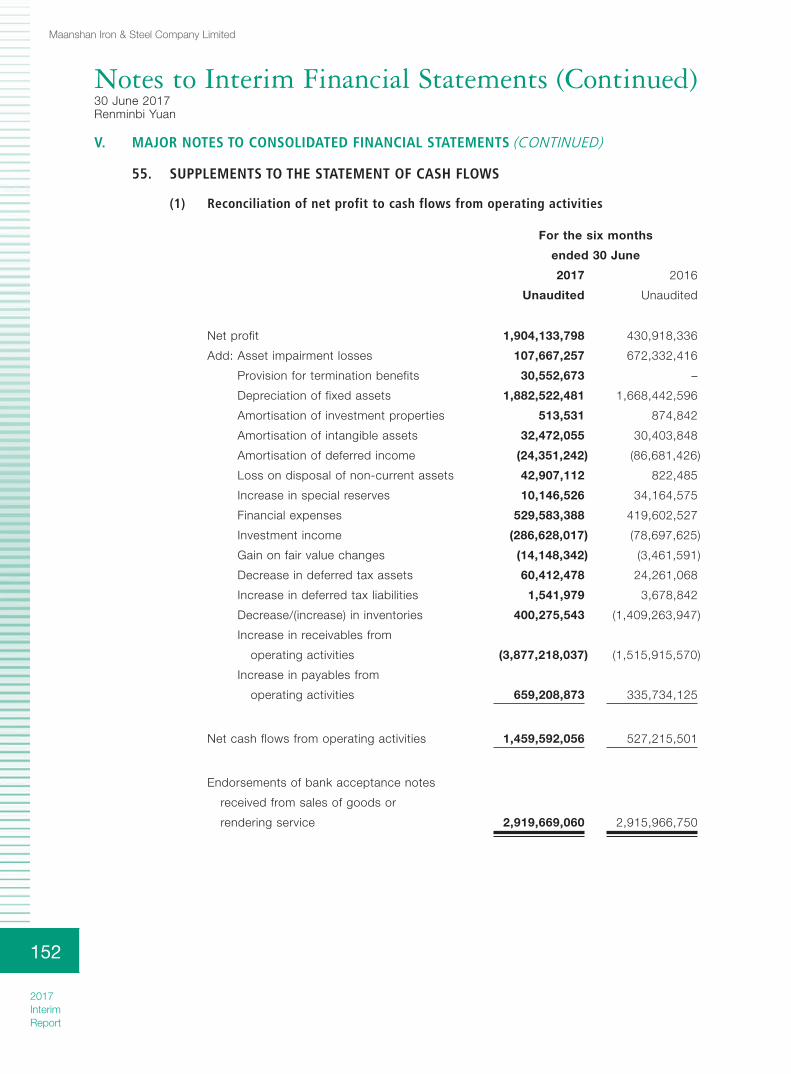
Notes to Interim Financial Statements (Continued)30 June 2017Renminbi Yuan
Maanshan Iron & Steel Company Limited
2017 InterimReport
152
V. MAJOR NOTES TO CONSOLIDATED FINANCIAL STATEMENTS (CONTINUED)
55. SUPPLEMENTS TO THE STATEMENT OF CASH FLOWS
(1) Reconciliation of net profit to cash flows from operating activities
For the six months
ended 30 June
2017 2016
Unaudited Unaudited
Net profit 1,904,133,798 430,918,336
Add: Asset impairment losses 107,667,257 672,332,416
Provision for termination benefits 30,552,673 –
Depreciation of fixed assets 1,882,522,481 1,668,442,596
Amortisation of investment properties 513,531 874,842
Amortisation of intangible assets 32,472,055 30,403,848
Amortisation of deferred income (24,351,242) (86,681,426)
Loss on disposal of non-current assets 42,907,112 822,485
Increase in special reserves 10,146,526 34,164,575
Financial expenses 529,583,388 419,602,527
Investment income (286,628,017) (78,697,625)
Gain on fair value changes (14,148,342) (3,461,591)
Decrease in deferred tax assets 60,412,478 24,261,068
Increase in deferred tax liabilities 1,541,979 3,678,842
Decrease/(increase) in inventories 400,275,543 (1,409,263,947)
Increase in receivables from
operating activities (3,877,218,037) (1,515,915,570)
Increase in payables from
operating activities 659,208,873 335,734,125
Net cash flows from operating activities 1,459,592,056 527,215,501
Endorsements of bank acceptance notes
received from sales of goods or
rendering service 2,919,669,060 2,915,966,750

Notes to Interim Financial Statements (Continued)30 June 2017Renminbi Yuan
Maanshan Iron & Steel Company Limited
2017 InterimReport
153
V. MAJOR NOTES TO CONSOLIDATED FINANCIAL STATEMENTS (CONTINUED)
55. SUPPLEMENTS TO THE STATEMENT OF CASH FLOWS (CONTINUED)
(2) Net movement of cash and cash equivalents
For the six months
ended 30 June
2017 2016
Unaudited Unaudited
Closing balance of cash 3,446,085,741 2,799,258,322
Less: Opening balance of cash 4,324,131,687 3,546,410,358
Add: Closing balance of cash equivalents – –
Less: Opening balance of cash equivalents – –
Net decrease of cash and cash equivalents (878,045,946) (747,152,036)
For the six months
ended 30 June
2017 2016
Unaudited Unaudited
Cash 3,446,085,741 2,799,258,322
Include: Cash on hand 73,655 119,148
Balances in banks without restriction 3,446,012,086 2,799,139,174
Balances in other cash and
bank balances without restriction – –
Ending balance of cash and cash equivalents 3,446,085,741 2,799,258,322
56. DIVIDENDS*
The board of directors did not recommend distribution of any interim dividends to shareholders
for the six months ended 30 June 2017 (for the six months ended 30 June 2016: Nil).

Notes to Interim Financial Statements (Continued)30 June 2017Renminbi Yuan
Maanshan Iron & Steel Company Limited
2017 InterimReport
154
V. MAJOR NOTES TO CONSOLIDATED FINANCIAL STATEMENTS (CONTINUED)
57. RESTRICTED ASSETS
30 June
2017
31 December
2016
Unaudited Audited
Cash and bank balances (Note V.1) 1,386,880,986 987,969,354 (i)
Notes receivable (Note V.3) 567,646,581 738,206,842 (ii)
1,954,527,567 1,726,176,196
(i) As of 30 June 2017, the Group’s restr icted cash and bank balances amount ing to
RMB1,386,880,986 (31 December 2016: RMB987,969,354) had been pledged to banks, including
cash deposits as collateral amounting to RMB853,919,992 (31 December 2016: RMB493,121,436)
pledged as security for bank acceptance notes and performance bonds, and mandatory reserves
with the central bank of RMB532,960,994 (31 December 2016: RMB494,847,918).
(ii) As of 30 June 2017, the Company had bank acceptance notes of RMB567,646,581 (31 December
2016: RMB738,206,842) pledged as security to obtain long-term bank loans of RMB400,000,000
(31 December 2016: RMB600,000,000) which will be due in one year.
58. MONETARY ITEMS DENOMINATED IN FOREIGN CURRENCIES
30 June 2017 (Unaudited) 31 December 2016 (Audited)
Original Exchange Equivalent of Original Exchange Equivalent ofCurrency Rate RMB Currency Rate RMB
Cash and bank balancesHKD 49,261,210 0.8679 42,753,804 2,584,446 0.8945 2,311,787USD 251,549,882 6.7744 1,704,099,521 249,525,036 6.9370 1,730,955,175EUR 21,403,464 7.7496 165,868,285 17,340,991 7.3068 126,707,153JPY 4,842 0.0604 292 3,311 0.0596 197AUD 14,350,932 5.2099 74,766,921 15,816,608 5.0157 79,331,361CAD 1,095,044 5.2144 5,709,997 1,226,862 5.1406 6,306,807GBP 573 8.8144 5,051 1,389 8.5094 11,820ZAR 4,707,944 0.5208 2,451,897 – 0.5083 –
1,995,655,768 1,945,624,300
Trade receivablesUSD 29,116,707 6.7744 197,248,220 23,181,111 6.9370 160,807,367EUR 10,340,217 7.7496 80,132,546 9,366,726 7.3068 68,440,794CAD – 5.2144 – 172,568 5.1406 887,103AUD 5,005,017 5.2099 26,075,638 5,535,040 5.0157 27,762,100HKD 15,258,738 0.8679 13,243,059 5,306,863 0.8945 4,746,989ZAR 7,110,000 0.5208 3,702,888 15,097,946 0.5083 7,674,286
320,402,351 270,318,639

Notes to Interim Financial Statements (Continued)30 June 2017Renminbi Yuan
Maanshan Iron & Steel Company Limited
2017 InterimReport
155
30 June 2017 (Unaudited) 31 December 2016 (Audited)
Original Exchange Equivalent of Original Exchange Equivalent ofCurrency Rate RMB Currency Rate RMB
Other receivablesHKD 8,289,336 0.8679 7,194,315 7,265,781 0.8945 6,499,241EUR 1,769,927 7.7496 13,716,226 1,165,632 7.3068 8,517,040AUD 5,422,160 5.2099 28,248,911 4,019 5.0157 20,158USD 17,061 6.7744 115,578 – 6.9370 –
49,275,030 15,036,439
Accounts payableAUD 60,022 5.2099 312,709 60,135 5.0157 301,619USD 194,639 6.7744 1,318,562 7,012 6.9370 48,642EUR 14,541,157 7.7496 112,688,150 12,798,731 7.3068 93,517,768JPY 76,150,000 0.0604 4,599,460 – 0.0596 –HKD – 0.8679 – 47,251,614 0.8945 42,266,569
118,918,881 136,134,598
Other payablesAUD 254,303 5.2099 1,324,893 208,721 5.0157 1,046,882HKD 34,342,341 0.8679 29,805,718 81,210,639 0.8945 72,642,917EUR 2,038,692 7.7496 15,799,048 1,862,155 7.3068 13,606,394USD 861 6.7744 5,833 – 6.9370 –
46,935,492 87,296,193
Short-term loansUSD 130,404,180 6.7744 883,410,077 219,672,148 6.9370 1,523,865,691EUR 30,000,000 7.7496 232,488,000 29,868,315 7.3068 218,241,804
1,115,898,077 1,742,107,495
Long-term loans due within one year
USD 12,700,000 6.7744 86,034,880 7,360,000 6.9370 51,056,320
Long-term loansEUR 9,700,000 7.7496 75,171,120 – 7.3068 –USD 18,400,000 6.7744 124,648,960 22,080,000 6.9370 153,168,960
199,820,080 153,168,960
V. MAJOR NOTES TO CONSOLIDATED FINANCIAL STATEMENTS (CONTINUED)
58. MONETARY ITEMS DENOMINATED IN FOREIGN CURRENCIES (CONTINUED)

Notes to Interim Financial Statements (Continued)30 June 2017Renminbi Yuan
Maanshan Iron & Steel Company Limited
2017 InterimReport
156
VI. CHANGE IN THE SCOPE OF CONSOLIDATION
1. NEWLY ESTABLISHED SUBSIDIARY
For the six months ended 30 June 2017, the Company established the following subsidiary,
and included it in the scope of consolidation since then.
Date of
establishment
Registered
capital
Percentage
of equity
interest
Investment
form
Capital paid
as of
period end
Anhui Ma Steel Antirust
Materials Technology
Co., Ltd.
(“Ma Steel Antirust”)
April 2017 RMB10,000,000 51% Cash RMB1,530,000
2. BUSINESS COMBINATION NOT UNDER COMMON CONTROL
(1) Business combination not under common control during the current period
Name of acquiree
Time at which the acquirer obtains control
Consideration of equity
interest
Ratio of equity
interest
Method of obtaining equity interest
Acquisition date
Basis for acquisition date
Acquiree’s revenue from
acquisition date to
the end of the period
Acquiree’s net profit from
acquisition date to
the end of the period
Mascometal 5 June 2017 127,368,631 66% Non-cash 5 June 2017 The board of directors’ approval for revising the Articles of Association
– –
Mascometal, in which the Company held 66% equity interests, was originally a joint
venture of the Company. On 5 June 2017, Mascometal held the first board of directors’
6th meeting, and approved the revised Article of Association which changed the
approval criteria from unanimous approval of all the directors to more than 50% of
the directors’ approval in respect of some key board of directors’ resolution matters.
According to the revised Article of Association, as directors of the Company represent
that the Company holds more than 50% of voting rights in the board of directors of
Mascometal, the Company is able to exercise control over Mascometal. Mascometal is
accounted for as a subsidiary and included in the scope of consolidation of the Group.
Based on the availability of financial data and taking into account the timeliness
requirement of financial information, the financial information of Mascometal based on 30
June 2017 is disclosed as follows.

Notes to Interim Financial Statements (Continued)30 June 2017Renminbi Yuan
Maanshan Iron & Steel Company Limited
2017 InterimReport
157
VI. CHANGE IN THE SCOPE OF CONSOLIDATION (CONTINUED)
2. BUSINESS COMBINATION NOT UNDER COMMON CONTROL (CONTINUED)
(2) Identifiable assets and liabilities of acquiree on the acquisition date
Fair value
on the
acquisition date
Carrying amount
on the
acquisition date
(Note 1)
ASSETS
Cash and bank balances 115,777,566 115,777,566
Trade receivables 281,580 281,580
Inventories 507,360 507,360
Other receivables 1,691,964 1,691,964
Prepayments 13,794,701 13,794,701
Other current assets 7,237,420 7,237,420
Property, plant and equipment 184,852 184,852
Construction in progress 56,834,490 56,834,490
LIABILITIES
Accounts payable 2,055,346 2,055,346
Payroll and employee benefits payable 968,659 968,659
Taxes payable 6,964 6,964
Other payables 296,190 296,190
Net assets 192,982,774 192,982,774
Less: Non-controlling interests 65,614,143 65,614,143
Net assets acquired 127,368,631 127,368,631
66% equity interests’ fair value 127,368,631
Effect of gains or losses during the current period –
Consideration (Note 2) 127,368,631
Note 1: As of the reporting date, the valuation of the identifiable assets and liabilities of
Mascometal has not yet been completed, therefore the Company initially recorded
assets and liabilities of Mascometal with its carrying amount as of 30 June 2017 and
would adjust it after the completion of the valuation.
Note 2: The Company’s acquisit ion consideration in the business combination is the
carrying amount of the long-term equity investment in Mascometal amounted to
RMB127,368,631 originally held by the Company on the acquisition date.

Notes to Interim Financial Statements (Continued)30 June 2017Renminbi Yuan
Maanshan Iron & Steel Company Limited
2017 InterimReport
158
VI. CHANGE IN THE SCOPE OF CONSOLIDATION (CONTINUED)
3. DISPOSAL OF A SUBSIDIARY
Place of registration
Business
nature
Total equity
interests
that the
Group holds
Total voting
right
that the
Group holds
Reason for
not being
a subsidiary
any longer
Maanshan Masteel”Huayang
Equipment Inspection &
Engineering Co., Ltd.
(“Huayang Equipment”)
Anhui Province, PRC Manufacturing 90% 90% Note
Note: The Company signed an equity interest transfer agreement with Xinchuang Economize Resource
on 1 January 2017 to sell 90% equity interests of Huayang Equipment held by the Company
at a consideration of RMB8,696,084, which was based on the results of an independent third-
party valuation agency. The disposal date was 1 January 2017. Therefore, Xinchuang Economize
Resource will no longer be included in the scope of consolidation of the Group since 1 January
2017. The related financial information of Xinchuang Economize Resource is as follows:
Carrying amount
as at
1 January
2017
Current assets 9,903,072
Non-current assets 2,112,160
Current liabilities 3,171,742
Non-current liabilities –
8,843,490
Non-controlling interests 884,349
Disposal gains or losses 736,943
Disposal consideration 8,696,084
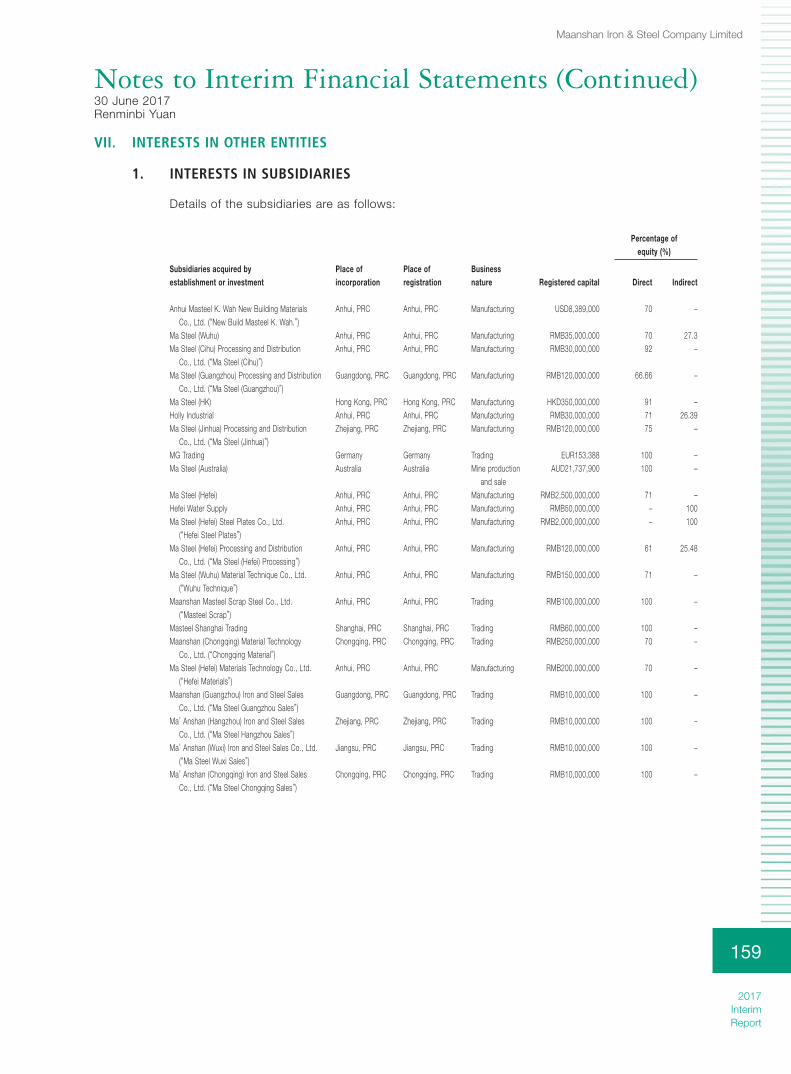
Notes to Interim Financial Statements (Continued)30 June 2017Renminbi Yuan
Maanshan Iron & Steel Company Limited
2017 InterimReport
159
VII. INTERESTS IN OTHER ENTITIES
1. INTERESTS IN SUBSIDIARIES
Details of the subsidiaries are as follows:
Percentage of equity (%)
Subsidiaries acquired by establishment or investment
Place of incorporation
Place of registration
Business nature Registered capital Direct Indirect
Anhui Masteel K. Wah New Building Materials Co., Ltd. (“New Build Masteel K. Wah.”)
Anhui, PRC Anhui, PRC Manufacturing USD8,389,000 70 –
Ma Steel (Wuhu) Anhui, PRC Anhui, PRC Manufacturing RMB35,000,000 70 27.3Ma Steel (Cihu) Processing and Distribution
Co., Ltd. (“Ma Steel (Cihu)”)Anhui, PRC Anhui, PRC Manufacturing RMB30,000,000 92 –
Ma Steel (Guangzhou) Processing and Distribution Co., Ltd. (“Ma Steel (Guangzhou)”)
Guangdong, PRC Guangdong, PRC Manufacturing RMB120,000,000 66.66 –
Ma Steel (HK) Hong Kong, PRC Hong Kong, PRC Manufacturing HKD350,000,000 91 –Holly Industrial Anhui, PRC Anhui, PRC Manufacturing RMB30,000,000 71 26.39Ma Steel (Jinhua) Processing and Distribution
Co., Ltd. (“Ma Steel (Jinhua)”)Zhejiang, PRC Zhejiang, PRC Manufacturing RMB120,000,000 75 –
MG Trading Germany Germany Trading EUR153,388 100 –Ma Steel (Australia) Australia Australia Mine production
and saleAUD21,737,900 100 –
Ma Steel (Hefei) Anhui, PRC Anhui, PRC Manufacturing RMB2,500,000,000 71 –Hefei Water Supply Anhui, PRC Anhui, PRC Manufacturing RMB50,000,000 – 100Ma Steel (Hefei) Steel Plates Co., Ltd.
(“Hefei Steel Plates”)Anhui, PRC Anhui, PRC Manufacturing RMB2,000,000,000 – 100
Ma Steel (Hefei) Processing and Distribution Co., Ltd. (“Ma Steel (Hefei) Processing”)
Anhui, PRC Anhui, PRC Manufacturing RMB120,000,000 61 25.48
Ma Steel (Wuhu) Material Technique Co., Ltd. (“Wuhu Technique”)
Anhui, PRC Anhui, PRC Manufacturing RMB150,000,000 71 –
Maanshan Masteel Scrap Steel Co., Ltd. (“Masteel Scrap”)
Anhui, PRC Anhui, PRC Trading RMB100,000,000 100 –
Masteel Shanghai Trading Shanghai, PRC Shanghai, PRC Trading RMB60,000,000 100 –Maanshan (Chongqing) Material Technology
Co., Ltd. (“Chongqing Material”)Chongqing, PRC Chongqing, PRC Trading RMB250,000,000 70 –
Ma Steel (Hefei) Materials Technology Co., Ltd. (“Hefei Materials”)
Anhui, PRC Anhui, PRC Manufacturing RMB200,000,000 70 –
Maanshan (Guangzhou) Iron and Steel Sales Co., Ltd. (“Ma Steel Guangzhou Sales”)
Guangdong, PRC Guangdong, PRC Trading RMB10,000,000 100 –
Ma’ Anshan (Hangzhou) Iron and Steel Sales Co., Ltd. (“Ma Steel Hangzhou Sales”)
Zhejiang, PRC Zhejiang, PRC Trading RMB10,000,000 100 –
Ma’ Anshan (Wuxi) Iron and Steel Sales Co., Ltd.(“Ma Steel Wuxi Sales”)
Jiangsu, PRC Jiangsu, PRC Trading RMB10,000,000 100 –
Ma’ Anshan (Chongqing) Iron and Steel Sales Co., Ltd. (“Ma Steel Chongqing Sales”)
Chongqing, PRC Chongqing, PRC Trading RMB10,000,000 100 –

Notes to Interim Financial Statements (Continued)30 June 2017Renminbi Yuan
Maanshan Iron & Steel Company Limited
2017 InterimReport
160
Percentage of equity (%)
Subsidiaries acquired by establishment or investment
Place of incorporation
Place of registration
Business nature Registered capital Direct Indirect
Ma’ Anshan (Nanjing) Iron and Steel Sales Co., Ltd. (“Ma Steel Nanjing Sales”)
Jiangsu, PRC Jiangsu, PRC Trading RMB10,000,000 100 –
Ma’ Anshan (Wuhan) Iron and Steel Sales Co., Ltd. (“Ma Steel Wuhan Sales”)
Hubei, PRC Hubei, PRC Trading RMB10,000,000 100 –
Ma’ Anshan (Shanghai) Iron and Steel Sales Co., Ltd. (“Ma Steel Shanghai Sales”)
Shanghai, PRC Shanghai, PRC Trading RMB10,000,000 100 –
Anhui Chang Jiang Iron and Steel Trading Co., Ltd., Heifei (“Chang Jiang Iron and Steel, Hefei”)
Anhui, PRC Anhui, PRC Trading RMB30,000,000 – 100
Anhui Chang Jiang Iron and Steel Trading Co., Ltd., Nanjing (“Chang Jiang Iron and Steel, Nanjing”)
Jiangsu, PRC Jiangsu, PRC Trading RMB30,000,000 – 100
Ma’anshan Chang Jiang Iron and Steel Trading Co., Ltd. (“Chang Jiang Iron and Steel Trading”)
Anhui, PRC Anhui, PRC Trading RMB30,000,000 – 100
MG-VALDUNES (Note 1) France France Manufacturing EUR55,200,000 100 –Ma’anshan Oubang Color-coated Technology
Co., Ltd. (“Masteel Oubang Color-coated”)Anhui, PRC Anhui, PRC Manufacturing RMB50,000,000 67 –
Masteel America USA USA Service industry USD500,000 100 –Ma Steel Antirust (Note 2) Anhui, PRC Anhui, PRC Manufacturing RMB10,000,000 51 –
Percentage of equity (%)
Subsidiaries acquired not under common control
Place of incorporation
Place of registration
Business nature Registered capital Direct Indirect
Ma Steel (Yangzhou) Processing and Distribution Co., Ltd. (“Ma Steel (Yangzhou) Processing”)
Jiangsu, PRC Jiangsu, PRC Manufacturing USD20,000,000 71 –
Anhui ChangJiang Iron and Steel Anhui, PRC Anhui, PRC Manufacturing RMB1,200,000,000 55 –Ma-Steel Rail Transportation Equipment Co., Ltd.
(“Ma-Steel Rail Transportation”)Anhui, PRC Anhui, PRC Manufacturing RMB360,000,000 100 –
Mascometal (Note 3) Anhui, PRC Anhui, PRC Manufacturing EUR32,000,000 66 –
Percentage of equity (%)
Subsidiary acquired under common controlPlace of incorporation
Place of registration
Business nature Registered capital Direct Indirect
Masteel Financial (Note 4) Anhui, PRC Anhui, PRC Financial services RMB2,000,000,000 91 –
Note1: In June 2017, the Company injected capital of EUR15,000,000 which is equivalent to
RMB113,877,000 to MG-VALDUNES.
Note2: For the information of the newly established subsidiary, please refer to Note VI.1.
Note3: During the period, the Company obtained control over Mascometal and included it into the
scope of consolidation of the Group. Please refer to Note VI.2 for details.
Note4: In January 2017, the Company injected capital of RMB910,000,000 to Masteel Financial.
VII. INTERESTS IN OTHER ENTITIES (CONTINUED)
1. INTERESTS IN SUBSIDIARIES (CONTINUED)

Notes to Interim Financial Statements (Continued)30 June 2017Renminbi Yuan
Maanshan Iron & Steel Company Limited
2017 InterimReport
161
VII. INTERESTS IN OTHER ENTITIES (CONTINUED)
1. INTERESTS IN SUBSIDIARIES (CONTINUED)
Subsidiaries which had material non-controlling interests are as follows:
30 June 2017
or for the six months
ended 30 June 2017
31 December 2016
or for the six months
ended 30 June 2016
UnauditedAudited/
Unaudited
The proportion of equity held by non-controlling shareholders:
Ma Steel (Hefei) 29% 29%Anhui Changjiang Iron and Steel 45% 45%Masteel Financial 9% 9%
Profit or loss attributable to non-controlling interests:
Ma Steel (Hefei) (15,896,512) (125,001,761)Anhui Changjiang Iron and Steel 245,873,784 86,601,845Masteel Financial 7,608,153 4,582,180
Dividends paid to non-controlling interests:
Anhui Changjiang Iron and Steel 20,670,280 –Masteel Financial 1,127,828 –
Cumulative balances of non-controlling interests at the end of the reporting period:
Ma Steel (Hefei) 603,680,634 619,631,673Anhui Changjiang Iron and Steel 1,354,784,150 1,128,514,595Masteel Financial 239,209,545 142,729,220

Notes to Interim Financial Statements (Continued)30 June 2017Renminbi Yuan
Maanshan Iron & Steel Company Limited
2017 InterimReport
162
VII. INTERESTS IN OTHER ENTITIES (CONTINUED)
1. INTERESTS IN SUBSIDIARIES (CONTINUED)
The summarised financial information of the above subsidiaries is as follows. The amounts
listed below are the amounts before the group intra-elimination.
Ma Steel
(Hefei)
Anhui Changjiang
Iron and Steel
Masteel
Financial
30 June 2017 or for the
six months ended
30 June 2017 (Unaudited)
Current assets 955,268,118 2,576,833,580 2,576,746,752
Non-current assets 3,984,710,562 4,363,019,116 7,023,046,424
Total assets 4,939,978,680 6,939,852,696 9,599,793,176
Current liabilities (1,964,167,458) (3,858,245,493) (6,938,267,699)
Non-current liabilities (894,153,864) (70,975,758) (4,499,632)
Total liabilities (2,858,321,322) (3,929,221,251) (6,942,767,331)
Revenue 1,801,517,243 6,608,923,730 110,324,959
Net (loss)/profit (54,815,557) 546,386,187 84,535,032
Total comprehensive income (54,815,557) 546,386,187 85,393,022
Net cash flows from/(used in)
operating activities 8,850,474 845,222,575 (617,918,883)

Notes to Interim Financial Statements (Continued)30 June 2017Renminbi Yuan
Maanshan Iron & Steel Company Limited
2017 InterimReport
163
VII. INTERESTS IN OTHER ENTITIES (CONTINUED)
1. INTERESTS IN SUBSIDIARIES (CONTINUED)
Ma Steel
(Hefei)
Anhui Changjiang
Iron and Steel
Masteel
Financial
31 December 2016 (Audited)
or for the six months ended
30 June 2016 (Unaudited)
Current assets 781,451,671 2,015,885,136 3,190,666,377
Non-current assets 3,952,650,687 4,314,065,378 5,833,102,023
Total assets 4,734,102,358 6,329,950,514 9,023,768,400
Current liabilities (1,912,013,349) (3,794,758,309) (7,437,233,334)
Non-current liabilities (685,428,067) (27,381,995) (654,837)
Total liabilities (2,597,441,416) (3,822,140,304) (7,437,888,171)
Revenue 1,437,964,902 3,483,828,844 87,623,671
Net (loss)/profit (431,040,557) 192,448,544 50,913,108
Total comprehensive income (431,040,557) 192,448,544 50,913,108
Net cash flows from operating activities 22,534,518 122,266,951 1,734,291,919

Notes to Interim Financial Statements (Continued)30 June 2017Renminbi Yuan
Maanshan Iron & Steel Company Limited
2017 InterimReport
164
VII. INTERESTS IN OTHER ENTITIES (CONTINUED)
2. INTERESTS IN JOINT VENTURES AND ASSOCIATES
Percentage of equity (%)
Place of operation
Place ofregistration
Businessnature
Registeredcapital Directly Indirectly
Accountingmethod
Joint venturesBOC-Ma Steel Anhui, PRC Anhui, PRC Manufacturing RMB468,000,000 50 – Equity
methodMASTEEL-CMI Anhui, PRC Anhui, PRC Service industry RMB1,000,000 50 – Equity
method
AssociatesHenan Jinma Energy Henan, PRC Henan, PRC Manufacturing RMB400,000,000 36 – Equity
methodShenglong Chemical Shandong, PRC Shandong, PRC Manufacturing RMB568,800,000 32 – Equity
methodShanghai Iron and Steel
ElectronicShanghai, PRC Shanghai, PRC Manufacturing RMB20,000,000 20 – Equity
methodXinchuang Economize
Resource (Note 1)Anhui, PRC Anhui, PRC Service industry RMB122,381,990 16.34 – Equity
methodAnhui Linhuan Chemical
(Note 2)Anhui, PRC Anhui, PRC Manufacturing RMB600,000,000 12 – Equity
methodMa-Steel OCI Chemical Anhui, PRC Anhui, PRC Manufacturing USD47,125,000 40 – Equity
method
Note 1: As of 30 June 2017, the Group held 16.34% equity interests of Xinchuang Economize
Resource. The directors deemed that the Company was able to exercise significant influence
over Xinchuang Economize Resource although the equity interests in Xinchuang Economize
Resource held by the Company was less than 20%, as according to the requirements of the
Articles of Association of Xinchuang Economize Resource, the Company designated one
director and one supervisor to Xinchuang Economize Resource. Thus, the equity investment in
Xinchuang Economize Resource was accounted as an associate.
Note 2: As of 30 June 2017, the Group held 12% equity interests of Anhui Linhuan Chemical. The
directors deemed that the Company was able to exercise significant influence over Anhui
Linhuan Chemical although the equity interests in Anhui Linhuan Chemical held by the Company
was less than 20%, as according to the requirement of the Articles of Association of Anhui
Linhuan Chemical, the Company designated one director to Anhui Linhuan Chemical. Thus, the
equity investment in Anhui Linhuan Chemical was accounted as an associate.

Notes to Interim Financial Statements (Continued)30 June 2017Renminbi Yuan
Maanshan Iron & Steel Company Limited
2017 InterimReport
165
VII. INTERESTS IN OTHER ENTITIES (CONTINUED)
2. INTERESTS IN JOINT VENTURES AND ASSOCIATES (CONTINUED)
BOC-Ma Steel, one of the Group’s material joint ventures, principally engaged in the
manufacture and sale of gas and liquid products, which include nitrogen, oxygen, argon and
other industrial gases products, was accounted under the equity method.
The financial information of BOC-Ma Steel is as follows, which has been adjusted to all the
accounting policy differences and reconciled to the carrying amount of the financial statements.
30 June 2017
or for the six months
ended 30 June 2017
31 December 2016
or for the six months
ended 30 June 2016
UnauditedAudited/
Unaudited
Current assets 358,446,055 428,661,283Non-current assets 274,845,196 299,955,412
Total assets 633,291,251 728,616,695
Current liabilities 56,607,847 90,580,560Non-current liabilities – –
Total liabilities 56,607,847 90,580,560
Non-controlling interests – –Equity attributable to the parent 576,683,404 638,036,135The Group’s share of net assets 288,341,702 319,018,068Adjustment – –
The carrying amount of the investment 288,341,702 319,018,068
Revenue 277,742,567 262,608,543Income tax expense 29,159,911 23,838,041
Net profit 88,428,211 71,514,124Other comprehensive income – –
Total comprehensive income 88,428,211 71,514,124
Dividends received 75,000,000 79,000,000

Notes to Interim Financial Statements (Continued)30 June 2017Renminbi Yuan
Maanshan Iron & Steel Company Limited
2017 InterimReport
166
VII. INTERESTS IN OTHER ENTITIES (CONTINUED)
2. INTERESTS IN JOINT VENTURES AND ASSOCIATES (CONTINUED)
As the strategic partners and also the material associates of the Group, Henan Jinma Energy and Shenglong Chemical engaged in coke production, were accounted under the equity method.
The financial information of material associates is as follows, which has been adjusted to all the accounting policy differences and reconciled to the carrying amount of the financial statements:
Henan Jinma Energy30 June
2017 or for the
six months ended
30 June 2017
31 December 2016
or for the six months
ended 30 June 2016
UnauditedAudited/
Unaudited
Current assets 1,117,202,291 1,177,771,242Non-current assets 1,232,581,846 1,101,444,297
Total assets 2,349,784,137 2,279,215,539
Current liabilities 786,280,643 868,068,750Non-current liabilities 440,918,307 557,179,565
Total liabilities 1,227,198,950 1,425,248,315
Non-controlling interests 90,446,496 31,199,473
Equity attributable to the parent 1,032,138,691 822,767,751
The Group’s share of net assets 371,569,929 296,196,390Adjustment – –
The carrying amount of the investment 371,569,929 296,196,390
Revenue 2,556,554,820 1,219,617,849Income tax expense 83,102,443 18,902,887
Net profit 249,241,268 56,708,660Other comprehensive income – –
Total comprehensive income 249,241,268 56,708,660
Dividends received 36,000,000 –
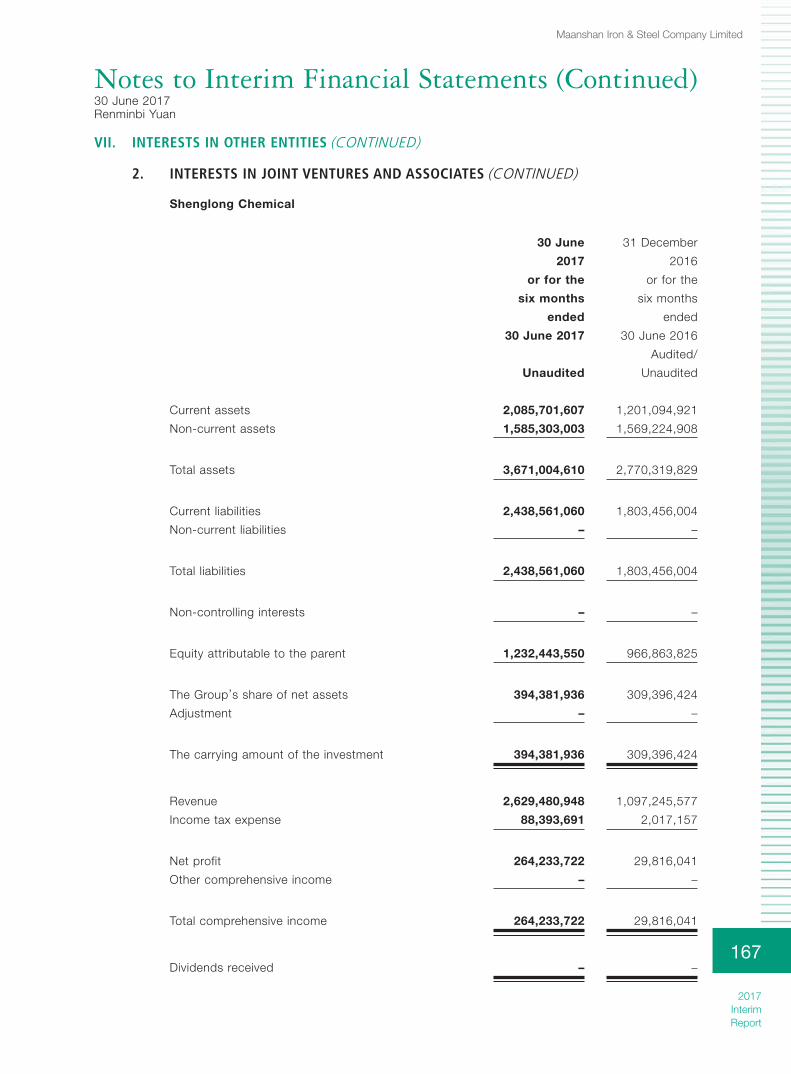
Notes to Interim Financial Statements (Continued)30 June 2017Renminbi Yuan
Maanshan Iron & Steel Company Limited
2017 InterimReport
167
VII. INTERESTS IN OTHER ENTITIES (CONTINUED)
2. INTERESTS IN JOINT VENTURES AND ASSOCIATES (CONTINUED)
Shenglong Chemical
30 June
2017
or for the
six months
ended
30 June 2017
31 December
2016
or for the
six months
ended
30 June 2016
Unaudited
Audited/
Unaudited
Current assets 2,085,701,607 1,201,094,921
Non-current assets 1,585,303,003 1,569,224,908
Total assets 3,671,004,610 2,770,319,829
Current liabilities 2,438,561,060 1,803,456,004
Non-current liabilities – –
Total liabilities 2,438,561,060 1,803,456,004
Non-controlling interests – –
Equity attributable to the parent 1,232,443,550 966,863,825
The Group’s share of net assets 394,381,936 309,396,424
Adjustment – –
The carrying amount of the investment 394,381,936 309,396,424
Revenue 2,629,480,948 1,097,245,577
Income tax expense 88,393,691 2,017,157
Net profit 264,233,722 29,816,041
Other comprehensive income – –
Total comprehensive income 264,233,722 29,816,041
Dividends received – –

Notes to Interim Financial Statements (Continued)30 June 2017Renminbi Yuan
Maanshan Iron & Steel Company Limited
2017 InterimReport
168
VII. INTERESTS IN OTHER ENTITIES (CONTINUED)
2. INTERESTS IN JOINT VENTURES AND ASSOCIATES (CONTINUED)
The financial information of the joint ventures and the associates that are not material to the
Group is as follows:
30 June
2017
31 December
2016
(Unaudited) (Audited)
Joint ventures
The carrying amount of the investments 541,433 53,825,470
For the six months
ended 30 June
2017 2016
(Unaudited) (Unaudited)
Total shown as below (calculated according to
the respective equity holding percentage)
Net loss (4,347,403) (330,010)
Other comprehensive income – –
Total comprehensive income (4,347,403) (330,010)
30 June
2017
31 December
2016
(Unaudited) (Audited)
Associates
The carrying amount of the investments 268,136,835 261,339,961
For the six months
ended 30 June
2017 2016
(Unaudited) (Unaudited)
Total shown as below (calculated according to
the respective equity holding percentage)
Net profit 6,577,202 3,456,779
Other comprehensive income – –
Total comprehensive income 6,577,202 3,456,779
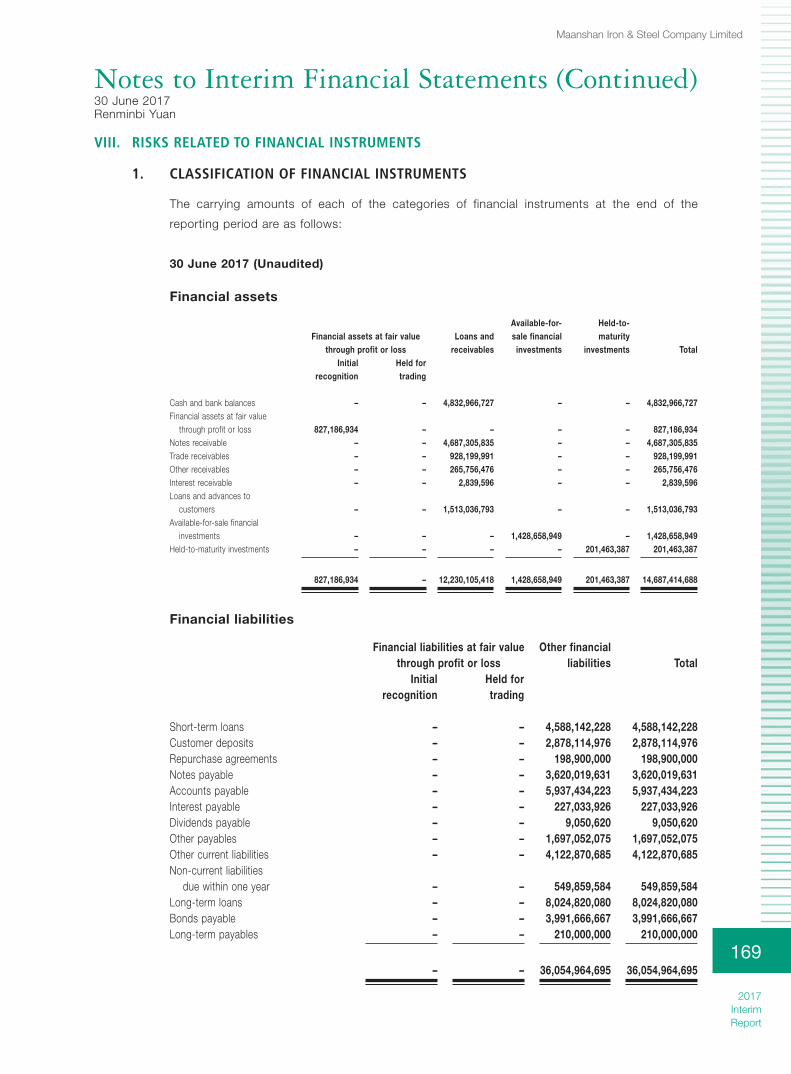
Notes to Interim Financial Statements (Continued)30 June 2017Renminbi Yuan
Maanshan Iron & Steel Company Limited
2017 InterimReport
169
VIII. RISKS RELATED TO FINANCIAL INSTRUMENTS
1. CLASSIFICATION OF FINANCIAL INSTRUMENTS
The carrying amounts of each of the categories of financial instruments at the end of the
reporting period are as follows:
30 June 2017 (Unaudited)
Financial assets
Financial assets at fair value through profit or loss
Loans andreceivables
Available-for-sale financial
investments
Held-to-maturity
investments TotalInitial
recognitionHeld for trading
Cash and bank balances – – 4,832,966,727 – – 4,832,966,727Financial assets at fair value
through profit or loss 827,186,934 – – – – 827,186,934Notes receivable – – 4,687,305,835 – – 4,687,305,835Trade receivables – – 928,199,991 – – 928,199,991Other receivables – – 265,756,476 – – 265,756,476Interest receivable – – 2,839,596 – – 2,839,596Loans and advances to
customers – – 1,513,036,793 – – 1,513,036,793Available-for-sale financial
investments – – – 1,428,658,949 – 1,428,658,949Held-to-maturity investments – – – – 201,463,387 201,463,387
827,186,934 – 12,230,105,418 1,428,658,949 201,463,387 14,687,414,688
Financial liabilities
Financial liabilities at fair value through profit or loss
Other financialliabilities Total
Initial recognition
Held for trading
Short-term loans – – 4,588,142,228 4,588,142,228Customer deposits – – 2,878,114,976 2,878,114,976Repurchase agreements – – 198,900,000 198,900,000Notes payable – – 3,620,019,631 3,620,019,631Accounts payable – – 5,937,434,223 5,937,434,223Interest payable – – 227,033,926 227,033,926Dividends payable – – 9,050,620 9,050,620Other payables – – 1,697,052,075 1,697,052,075Other current liabilities – – 4,122,870,685 4,122,870,685Non-current liabilities
due within one year – – 549,859,584 549,859,584Long-term loans – – 8,024,820,080 8,024,820,080Bonds payable – – 3,991,666,667 3,991,666,667Long-term payables – – 210,000,000 210,000,000
– – 36,054,964,695 36,054,964,695

Notes to Interim Financial Statements (Continued)30 June 2017Renminbi Yuan
Maanshan Iron & Steel Company Limited
2017 InterimReport
170
VIII. RISKS RELATED TO FINANCIAL INSTRUMENTS (CONTINUED)
1. CLASSIFICATION OF FINANCIAL INSTRUMENTS (CONTINUED)
The carrying amounts of each of the categories of financial instruments at the end of the
reporting period are as follows (Continued) :
31 December 2016 (Audited)
Financial assets
Financial assets at fair value through profit or loss
Loans andreceivables
Available-for-salefinancial assets Total
Initial recognition
Held for trading
Cash and bank balances – – 5,312,101,041 – 5,312,101,041Financial assets at fair value
through profit or loss 555,322,261 – – – 555,322,261Notes receivable – – 3,608,459,121 – 3,608,459,121Trade receivables – – 859,929,107 – 859,929,107Other receivables – – 98,676,949 – 98,676,949Interest receivable – – 4,044,939 – 4,044,939Financial assets purchased
under agreements to resell – – 230,047,000 – 230,047,000Loans and advances to
customers – – 1,555,212,556 – 1,555,212,556Available-for-sale financial
investments – – – 577,947,698 577,947,698
555,322,261 – 11,668,470,713 577,947,698 12,801,740,672
Financial Liabilities
Financial liabilities at fair value through profit or loss
Other financialliabilities Total
Initial recognition
Held for trading
Short-term loans – – 6,942,952,420 6,942,952,420Customer deposits – – 3,708,225,021 3,708,225,021Repurchase agreements – – 596,565,698 596,565,698Notes payable – – 3,584,228,362 3,584,228,362Accounts payable – – 6,668,807,923 6,668,807,923Interest payable – – 107,691,398 107,691,398Dividends payable – – 8,713,584 8,713,584Other payables – – 1,785,430,167 1,785,430,167Other current liabilities – – 2,046,438,356 2,046,438,356Non-current liabilities due within one year – – 3,211,056,320 3,211,056,320Long-term loans – – 5,163,168,960 5,163,168,960Bonds payable – – 3,987,666,667 3,987,666,667
– – 37,810,944,876 37,810,944,876

Notes to Interim Financial Statements (Continued)30 June 2017Renminbi Yuan
Maanshan Iron & Steel Company Limited
2017 InterimReport
171
VIII. RISKS RELATED TO FINANCIAL INSTRUMENTS (CONTINUED)
2. OFFSETTING OF FINANCIAL INSTRUMENTS
For the six months ended 30 June 2017, there were no offsetting arrangements for trade
receivables (2016: Nil).
3. TRANSFER OF FINANCIAL ASSETS
Financial assets transferred but not yet fully derecognised
As of 30 June 2017, the Group endorsed to its suppliers (but not yet fully derecognised) bank
acceptance notes for settlement of accounts payable and discounted to banks the bank
acceptance notes with carrying amount of RMB61,323,524 and RMB1,000,000 respectively.
As of 30 June 2017, their maturity period ranged from 1 to 12 months. Pursuant to the relevant
provisions of “Law of Negotiable Instruments”, the holders of commercial instruments shall
have the right of recourse against the Group (“Continuing Involvement”) if relevant acceptance
bank defaults. As the Group was of the opinion that the Group had retained substantially all
their risks and rewards, including the default risk associated, the Group continued to recognise
them and the settled accounts payable or short-term borrowings associated therewith. After
the endorsement or discount, the Group no longer reserved the rights to use them, including
the rights to sell, transfer or pledge to any other third party. As of 30 June 2017, the carrying
amount of accounts payable settled by the Group through them amounted to RMB61,323,524
(31 December 2016: RMB156,827,864), and short-term loans which were secured by notes
receivable amounted to RMB1,000,000 (31 December 2016: Nil).
Transferred financial assets fully derecognised but with continuing involvement
As of 30 June 2017, the Group endorsed to its suppliers (and fully derecognised) bank
acceptance notes for settlement of accounts payable and discounted to banks the bank
acceptance notes with carrying amount of RMB2,919,669,060 and RMB7,842,049 (31
December 2016: RMB5,196,770,076 and nil respectively). As of 30 June 2017, their maturity
period ranged from 1 to 12 months. Pursuant to the relevant provisions of “Law of Negotiable
Instruments”, the holders of commercial instruments shall have the right of recourse against the
Group (“Continuing Involvement”) if relevant acceptance bank defaults. As the Group was of the
opinion that the Group had transferred substantially all their risks and rewards, the Group had
derecognised them and then settled accounts payable associated therewith.
For the six months ended 30 June 2017, no gain or loss was recognised in the date of transfer.
No income or expense was recognised for the current period or on an accumulative basis as a
result of the Group’s Continuing Involvement in derecognised financial assets. Endorsements
were incurred basically evenly during the period.
Notes to Interim Financial Statements (Continued)30 June 2017Renminbi Yuan
Maanshan Iron & Steel Company Limited
2017 InterimReport
172
VIII. RISKS RELATED TO FINANCIAL INSTRUMENTS (CONTINUED)
4. FINANCIAL INSTRUMENTS RISK
The Group’s principal financial instruments are comprised of bank loans, other interest bearing
borrowings, cash and bank balances, etc. The main purpose of these financial instruments is to
finance for the Group’s operations. The Group has various other financial assets and liabilities
such as trade receivables and accounts payable, which arise directly from its operations.
The main risks arising from the Group’s financial instruments are credit risk, liquidity risk, and
market risk. The Group’s risk management policies are outlined below.
Credit risk
The Group only trades with recognised and creditworthy third parties. It is the Group’s
policy that all customers who wish to trade on credit terms are subject to credit verification
procedures. In addition, the balances of trade receivables and notes receivable are monitored
on an ongoing basis to ensure that the Group’s exposure to bad debts is not significant. For
transactions that are not denominated in the recording currency of the relevant operating
unit, the Group does not offer credit terms without the specific approval of the Head of Credit
Control.
The credit risk of other financial assets of the Group, which are comprised of cash and bank
balances, available-for-sale financial investments, other receivables, interest receivable, loans
and advances to customers, etc, arises from default of the counterparties, with a maximum
exposure equal to the carrying amounts of these instruments.
Since the Group only trades with recognised and creditworthy third parties, there is no
requirement for collateral. Credit risk is managed in accordance with customer, counterparty,
geographical region and industry intensively. At the end of the reporting period, the Group had
a certain concentration of credit risk as 13% (2016: 13%) and 32% (2016: 29%) of the Group’s
trade receivables were due from the Group’s largest customer and five largest customers
in terms of trade receivables respectively. The Group did not hold any collateral or credit
enhancements for the balance of trade receivables.
Further quantitative data in respect of the Group’s exposure to credit risk arising from trade and
other receivables are stated in Note V.4 and Note V.6 to the financial statements.
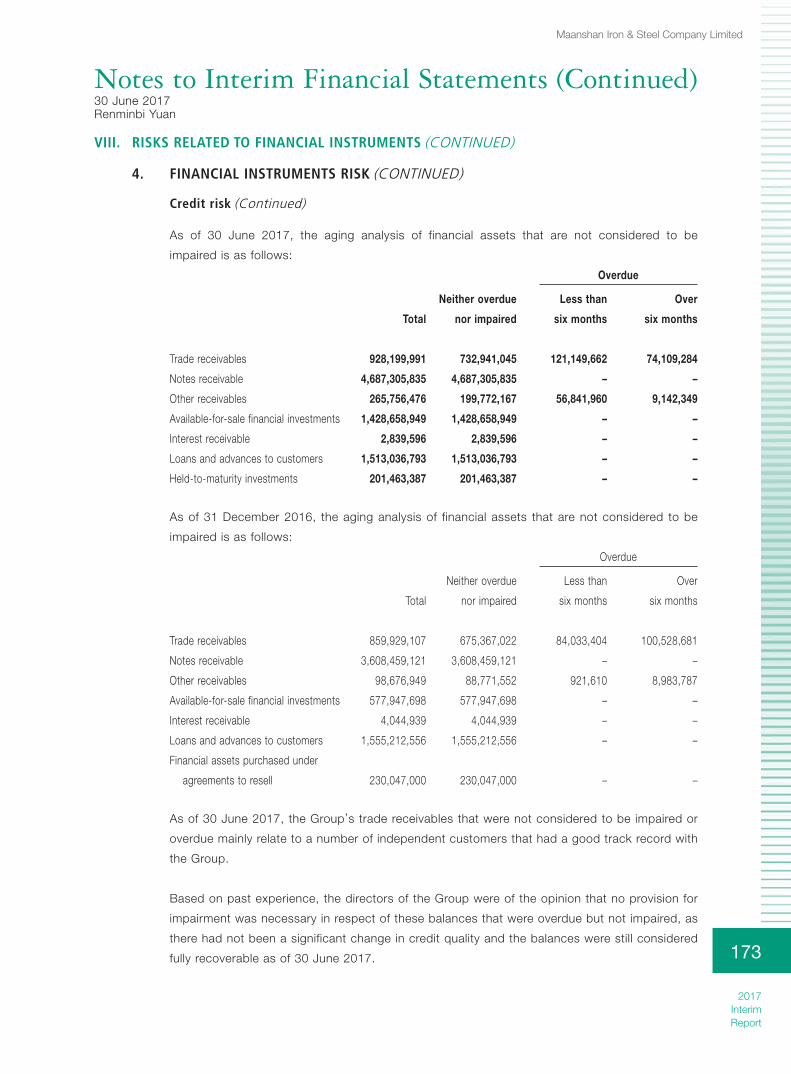
Notes to Interim Financial Statements (Continued)30 June 2017Renminbi Yuan
Maanshan Iron & Steel Company Limited
2017 InterimReport
173
VIII. RISKS RELATED TO FINANCIAL INSTRUMENTS (CONTINUED)
4. FINANCIAL INSTRUMENTS RISK (CONTINUED)
Credit risk (Continued)
As of 30 June 2017, the aging analysis of financial assets that are not considered to be
impaired is as follows:
Overdue
Total
Neither overdue
nor impaired
Less than
six months
Over
six months
Trade receivables 928,199,991 732,941,045 121,149,662 74,109,284
Notes receivable 4,687,305,835 4,687,305,835 – –
Other receivables 265,756,476 199,772,167 56,841,960 9,142,349
Available-for-sale financial investments 1,428,658,949 1,428,658,949 – –
Interest receivable 2,839,596 2,839,596 – –
Loans and advances to customers 1,513,036,793 1,513,036,793 – –
Held-to-maturity investments 201,463,387 201,463,387 – –
As of 31 December 2016, the aging analysis of financial assets that are not considered to be
impaired is as follows:
Overdue
Total
Neither overdue
nor impaired
Less than
six months
Over
six months
Trade receivables 859,929,107 675,367,022 84,033,404 100,528,681
Notes receivable 3,608,459,121 3,608,459,121 – –
Other receivables 98,676,949 88,771,552 921,610 8,983,787
Available-for-sale financial investments 577,947,698 577,947,698 – –
Interest receivable 4,044,939 4,044,939 – –
Loans and advances to customers 1,555,212,556 1,555,212,556 – –
Financial assets purchased under
agreements to resell 230,047,000 230,047,000 – –
As of 30 June 2017, the Group’s trade receivables that were not considered to be impaired or
overdue mainly relate to a number of independent customers that had a good track record with
the Group.
Based on past experience, the directors of the Group were of the opinion that no provision for
impairment was necessary in respect of these balances that were overdue but not impaired, as
there had not been a significant change in credit quality and the balances were still considered
fully recoverable as of 30 June 2017.

Notes to Interim Financial Statements (Continued)30 June 2017Renminbi Yuan
Maanshan Iron & Steel Company Limited
2017 InterimReport
174
VIII. RISKS RELATED TO FINANCIAL INSTRUMENTS (CONTINUED)
4. FINANCIAL INSTRUMENTS RISK (CONTINUED)
Liquidity risk
The Group applies a liquidity planning tool to manage liquidity risk of funding shortfalls, which
takes both maturity of financial instruments and estimated operating cash flows of the Group
into consideration.
The Group’s aim is to balance the sustainability and flexibility of the financing through bank
loans and other interest-bearing borrowings. The Group’s policy is that no more than 80% of
the borrowings should be due within 12 months according to the book value in the financial
statements. As of 30 June 2017, 66% of the Group’s debts were due within 12 months (31
December 2016: 76%).
The maturity profile of the Group’s financial liabilities was as of the end of reporting period is
shown in the table below. The amounts disclosed in the table are the contractual undiscounted
cash flows.
30 June 2017 (Unaudited)
Within 1 to 2 2 to 3 3 to 5 Over1 year years years years 5 years Total
Short-term loans 4,588,142,228 – – – – 4,588,142,228Customer deposits 2,878,114,976 – – – – 2,878,114,976Notes payable 3,620,019,631 – – – – 3,620,019,631Accounts payable 5,937,434,223 – – – – 5,937,434,223Dividends payable 9,050,620 – – – – 9,050,620Other payables 1,697,052,075 – – – – 1,697,052,075Repurchase agreements 198,900,000 – – – – 198,900,000Long-term loans due
within one year 549,859,584 – – – – 549,859,584Long-term loans – 6,904,030,704 999,859,584 24,929,792 96,000,000 8,024,820,080Bonds payable – 4,000,000,000 – – – 4,000,000,000Long-term payables – 210,000,000 – – – 210,000,000Other current liabilities 4,122,870,685 – – – – 4,122,870,685Interest payable for interest-
bearing liabilities 573,271,054 127,378,618 34,341,341 1,037,523 4,308,360 740,336,896
Total 24,174,715,076 11,241,409,322 1,034,200,925 25,967,315 100,308,360 36,576,600,998

Notes to Interim Financial Statements (Continued)30 June 2017Renminbi Yuan
Maanshan Iron & Steel Company Limited
2017 InterimReport
175
VIII. RISKS RELATED TO FINANCIAL INSTRUMENTS (CONTINUED)
4. FINANCIAL INSTRUMENTS RISK (CONTINUED)
Liquidity risk (Continued)
31 December 2016 (Audited)
Within 1 to 2 2 to 3 3 to 5 Over1 year years years years 5 years Total
Short-term loans 6,942,952,420 – – – – 6,942,952,420Customer deposits 3,708,225,021 – – – – 3,708,225,021Repurchase agreements 596,565,698 – – – – 596,565,698Notes payable 3,584,228,362 – – – – 3,584,228,362Accounts payable 6,668,807,923 – – – – 6,668,807,923Dividends payable 8,713,584 – – – – 8,713,584Other payables 1,785,430,167 – – – – 1,785,430,167Long-term loans due
within one year 3,211,056,320 – – – – 3,211,056,320Long-term loans – 4,255,056,320 761,056,320 51,056,320 96,000,000 5,163,168,960Bonds payable – 4,000,000,000 – – – 4,000,000,000Other current liabilities 2,046,438,356 – – – – 2,046,438,356Interest payable for interest-
bearing liabilities 708,657,506 265,441,922 11,595,323 1,633,260 4,807,920 992,135,931
Total 29,261,075,357 8,520,498,242 772,651,643 52,689,580 100,807,920 38,707,722,742

Notes to Interim Financial Statements (Continued)30 June 2017Renminbi Yuan
Maanshan Iron & Steel Company Limited
2017 InterimReport
176
VIII. RISKS RELATED TO FINANCIAL INSTRUMENTS (CONTINUED)
4. FINANCIAL INSTRUMENTS RISK (CONTINUED)
Market risk
Interest rate risk
The Group’s exposure to the risk of changes in market interest rates relates primarily to the
Group’s liabilities with a floating interest rate.
The following table demonstrates the sensitivity to a reasonably possible change in market
interest rates, with all other variables held constant, of the Group’s net profit (through the
impact on floating rate borrowings).
Increase/
(decrease) in
Increase/
(decrease) in
basis points net profit
For the six months ended 30 June 2017 (Unaudited)
RMB 50 (12,540,867)
USD 50 (336,919)
EUR 50 (73,762)
RMB (50) 12,540,867
USD (50) 336,919
EUR (50) 73,762
2016 Audited
RMB 50 (37,553,708)
USD 50 (965,033)
EUR 50 (358,115)
RMB (50) 37,553,708
USD (50) 965,033
EUR (50) 358,115
Notes to Interim Financial Statements (Continued)30 June 2017Renminbi Yuan
Maanshan Iron & Steel Company Limited
2017 InterimReport
177
VIII. RISKS RELATED TO FINANCIAL INSTRUMENTS (CONTINUED)
4. FINANCIAL INSTRUMENTS RISK (CONTINUED)
Market risk (Continued)
Foreign currency risk
The Group has transactional foreign currency risk. This risk arises from the sales and purchases
carried out by operating units which were denominated in currencies other than its recording
currencies.
The businesses of the Group are principally located in the PRC. While most of the transactions
are conducted in Renminbi, certain of its sales, purchases and borrowings are denominated in
United States dollars, Euros and Japanese Yen. Fluctuations of the exchange rates of Renminbi
against these foreign currencies can affect the Group’s results of operations.
The carrying amounts and related maximum exposure to foreign currency risk of Group’s cash
and bank balances, trade receivables, other receivables, short-term loans, accounts payable,
other payables and long-term loans are stated in Notes V.1, 4, 6, 22, 24, 30, 31, 34 to the
financial statements, respectively.
The following table demonstrates the sensitivity at the end of the reporting period to a
reasonably possible change in the exchange rates of the USD, EUR, JPY, AUD, HKD, CAD,
GBP and ZAR with all other variables held constant, of the Group’s net profit (due to changes in
the fair values of monetary assets and liabilities) and equity.

Notes to Interim Financial Statements (Continued)30 June 2017Renminbi Yuan
Maanshan Iron & Steel Company Limited
2017 InterimReport
178
VIII. RISKS RELATED TO FINANCIAL INSTRUMENTS (CONTINUED)
4. FINANCIAL INSTRUMENTS RISK (CONTINUED) )
Market risk (Continued)
Foreign currency risk (Continued)
30 June 2017 (Unaudited)
Increase/
(decrease) in
exchange rate
Increase/
(decrease) in
net profit
Increase/
(decrease) in
equity
(Note)
Depreciation of RMB to USD 1% 6,036,371 (18,015)
Depreciation of RMB to EUR 1% 198,696 (2,224,522)
Depreciation of RMB to JPY 1% (34,494) –
Depreciation of RMB to AUD 1% – (2,100,744)
Depreciation of RMB to HKD 1% 417 (1,829,363)
Depreciation of RMB to CAD 1% 42,825 –
Depreciation of RMB to GBP 1% 38 –
Depreciation of RMB to ZAR 1% 46,164 –
Appreciation of RMB to USD (1%) (6,036,371) 18,015
Appreciation of RMB to EUR (1%) (198,696) 2,224,522
Appreciation of RMB to JPY (1%) 34,494 –
Appreciation of RMB to AUD (1%) – 2,100,744
Appreciation of RMB to HKD (1%) (417) 1,829,363
Appreciation of RMB to CAD (1%) (42,825) –
Appreciation of RMB to GBP (1%) (38) –
Appreciation of RMB to ZAR (1%) (46,164) –

Notes to Interim Financial Statements (Continued)30 June 2017Renminbi Yuan
Maanshan Iron & Steel Company Limited
2017 InterimReport
179
VIII. RISKS RELATED TO FINANCIAL INSTRUMENTS (CONTINUED)
4. FINANCIAL INSTRUMENTS RISK (CONTINUED) )
Market risk (Continued)
Foreign currency risk (Continued)
31 December 2016 (Audited)
Increase/
(decrease) in
exchange rate
Increase/
(decrease) in
net profit
Increase/
(decrease) in
equity
(Note)
Depreciation of RMB to USD 1% (1,209,031) (29,008)
Depreciation of RMB to EUR 1% (341,902) (1,340,107)
Depreciation of RMB to JPY 1% (1) –
Depreciation of RMB to AUD 1% – (1,870,414)
Depreciation of RMB to HKD 1% (99) (1,752,142)
Depreciation of RMB to CAD 1% (53,954) –
Depreciation of RMB to GBP 1% (89) –
Depreciation of RMB to ZAR 1% (57,553) –
Appreciation of RMB to USD (1%) 1,209,031 29,008
Appreciation of RMB to EUR (1%) 341,902 1,340,107
Appreciation of RMB to JPY (1%) 1 –
Appreciation of RMB to AUD (1%) – 1,870,414
Appreciation of RMB to HKD (1%) 99 1,752,142
Appreciation of RMB to CAD (1%) 53,954 –
Appreciation of RMB to GBP (1%) 89 –
Appreciation of RMB to ZAR (1%) 57,553 –
Note: Except for retained earnings.

Notes to Interim Financial Statements (Continued)30 June 2017Renminbi Yuan
Maanshan Iron & Steel Company Limited
2017 InterimReport
180
VIII. RISKS RELATED TO FINANCIAL INSTRUMENTS (CONTINUED)
5. CAPITAL MANAGEMENT
The main objective of the Group’s capital management is to ensure the Group’s ability to
continue operations and to maintain healthy capital ratios in order to support business growth
and maximise shareholders’ value.
The Group manages its capital structure and makes adjustments according to changes in
economic conditions and the risk characteristics of the relevant assets. In order to maintain or
adjust the capital structure, the Group may adjust the distribution of profits to shareholders,
return capital to shareholders or issue new shares. The Group is not subject to externally
imposed capital requirements constraints. For the six months ended 30 June 2017 and the
year of 2016, the capital management objectives, policies or procedures of the Group did not
change.
The Group uses a gearing ratio to manage its capital. The gearing ratio refers to the percentage
of net debt versus the amount of adjusted capital plus net debt, and the target gearing ratio for
the Group is between 50% and 70%. Net debt includes customer deposits, bank loans, notes
payable, bonds payable, accounts payable, payroll and employee benefits payable, interest
payable, dividends payable and other payables, minus cash and bank balances. Capital refers
to total capital attributable to owners of the parent. The Group’s gearing ratio at the end of the
reporting period was as follows:

Notes to Interim Financial Statements (Continued)30 June 2017Renminbi Yuan
Maanshan Iron & Steel Company Limited
2017 InterimReport
181
VIII. RISKS RELATED TO FINANCIAL INSTRUMENTS (CONTINUED)
5. CAPITAL MANAGEMENT (CONTINUED)
30 June
2017
31 December
2016
Unaudited Audited
Customer deposits 2,878,114,976 3,708,225,021
Repurchase agreements 198,900,000 596,565,698
Short-term loans 4,588,142,228 6,942,952,420
Notes payable 3,620,019,631 3,584,228,362
Accounts payable 5,937,434,223 6,668,807,923
Payroll and employee benefits payable 569,393,753 550,444,683
Interest payable 227,033,926 107,691,398
Dividends payable 9,050,620 8,713,584
Other payables 1,825,213,618 1,912,575,078
Other current liabilities 4,307,180,685 2,273,058,356
Non-current liabilities due within one year 549,859,584 3,211,056,320
Long-term loans 8,024,820,080 5,163,168,960
Bonds payable 3,991,666,667 3,987,666,667
Long-term payables 210,000,000 –
Long-term employee benefits payable 162,590,718 159,173,203
Less: Cash and bank balances 4,832,966,727 5,312,101,041
Net liabilities 32,266,453,982 33,562,226,632
Capital attributable to owners of the parent 21,426,635,020 19,764,171,955
Adjusted capital 21,426,635,020 19,764,171,955
Capital and net liabilities 53,693,089,002 53,326,398,587
Gearing ratio 60% 63%

Notes to Interim Financial Statements (Continued)30 June 2017Renminbi Yuan
Maanshan Iron & Steel Company Limited
2017 InterimReport
182
IX. DISCLOSURE OF FAIR VALUE
1. FINANCIAL ASSETS MEASURED AT FAIR VALUE
30 June 2017 (Unaudited)
Inputs used by fair value measurement
Quoted prices
in active
markets
Level 1
Significant
observable
inputs
Level 2
Significant
Unobservable
inputs
Level 3 Total
Recurring fair value measurement for:
Financial assets at fair value
through profit or loss
(i) Investments in debt instrument 460,706,459 305,977,074 – 766,683,533
(ii) Others 60,503,401 – – 60,503,401
Available-for-sale financial investments
(i) Investments in debt instrument 1,301,936,789 – – 1,301,936,789
31 December 2016 (Audited)
Inputs used by fair value measurement
Quoted prices
in active
markets
Level 1
Significant
observable
inputs
Level 2
Significant
Unobservable
inputs
Level 3 Total
Recurring fair value measurement for:
Financial assets at fair value
through profit or loss 555,322,261 – – 555,322,261
Available-for-sale financial
investments
Investments in debt instrument 451,225,538 – – 451,225,538
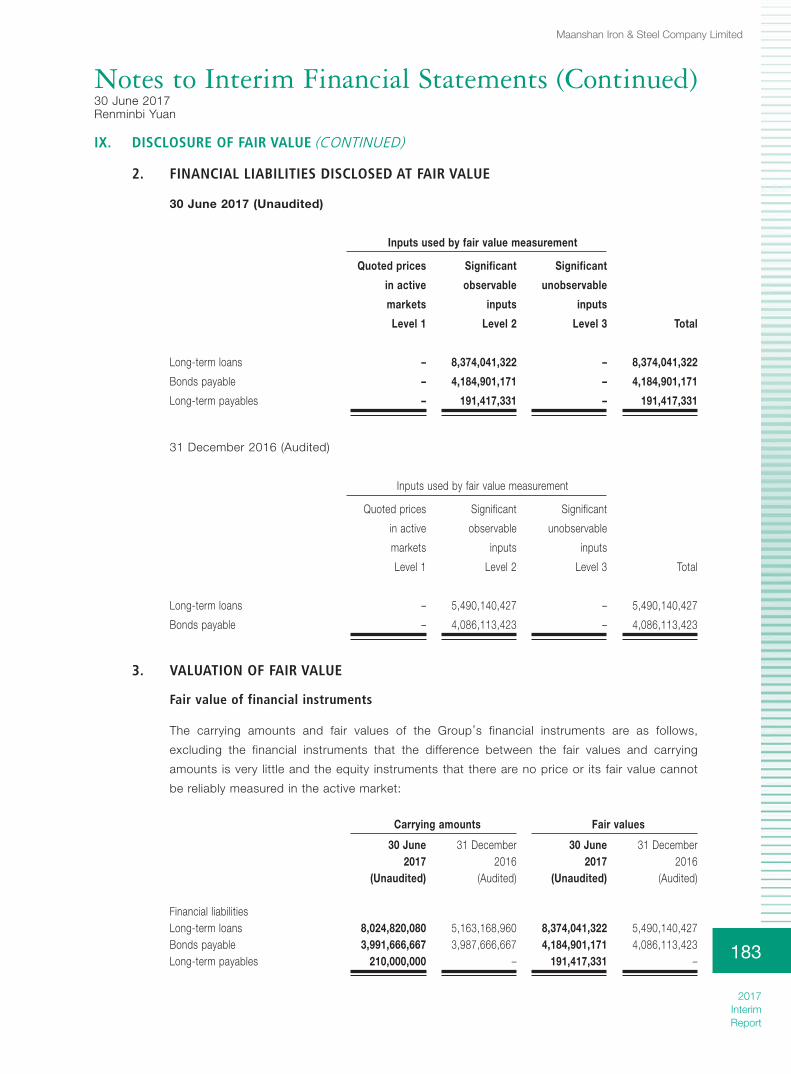
Notes to Interim Financial Statements (Continued)30 June 2017Renminbi Yuan
Maanshan Iron & Steel Company Limited
2017 InterimReport
183
IX. DISCLOSURE OF FAIR VALUE (CONTINUED)
2. FINANCIAL LIABILITIES DISCLOSED AT FAIR VALUE
30 June 2017 (Unaudited)
Inputs used by fair value measurement
Quoted prices
in active
markets
Significant
observable
inputs
Significant
unobservable
inputs
Level 1 Level 2 Level 3 Total
Long-term loans – 8,374,041,322 – 8,374,041,322
Bonds payable – 4,184,901,171 – 4,184,901,171
Long-term payables – 191,417,331 – 191,417,331
31 December 2016 (Audited)
Inputs used by fair value measurement
Quoted prices
in active
markets
Significant
observable
inputs
Significant
unobservable
inputs
Level 1 Level 2 Level 3 Total
Long-term loans – 5,490,140,427 – 5,490,140,427
Bonds payable – 4,086,113,423 – 4,086,113,423
3. VALUATION OF FAIR VALUE
Fair value of financial instruments
The carrying amounts and fair values of the Group’s financial instruments are as follows,
excluding the financial instruments that the difference between the fair values and carrying
amounts is very little and the equity instruments that there are no price or its fair value cannot
be reliably measured in the active market:
Carrying amounts Fair values
30 June 2017
31 December 2016
30 June 2017
31 December 2016
(Unaudited) (Audited) (Unaudited) (Audited)
Financial liabilitiesLong-term loans 8,024,820,080 5,163,168,960 8,374,041,322 5,490,140,427Bonds payable 3,991,666,667 3,987,666,667 4,184,901,171 4,086,113,423Long-term payables 210,000,000 – 191,417,331 –

Notes to Interim Financial Statements (Continued)30 June 2017Renminbi Yuan
Maanshan Iron & Steel Company Limited
2017 InterimReport
184
IX. DISCLOSURE OF FAIR VALUE (CONTINUED)
3. VALUATION OF FAIR VALUE (CONTINUED)
Fair value of financial instruments (Continued)
Management had assessed the fair value of cash and bank balances, notes receivable, trade
receivables, dividends receivable, interest receivable, other receivables, financial assets
purchased under agreements to resell, notes payable, accounts payable, interest payable,
dividends payable, other payables, loans and advances to customers, customer deposits,
repurchase agreements, short-term loans, non-current liabilities due within one year and other
current liabilities. Since the residual terms of the above-mentioned items were not long, the fair
values were similar to the book values.
The policies and procedures for accounting financial instruments at fair value are developed by
the Group’s finance team led by the finance manager. The Group’s finance team reports directly
to the chief accountant and the Audit Committee. At each balance sheet date, the finance
team analyses changes in the value of financial instruments and determines the main applicable
inputs to the valuation. Valuations are subject to the approval of the financial officer. The finance
team discusses the valuation process and results twice a year with the Audit Committee for
interim and annual financial reporting.
The fair value of the financial assets and liabilities is the amount for which an asset could be
exchanged, or a liability settled, between knowledgeable and willing parties in an arm’s length
transaction rather than under circumstances of forced sell–out or bankruptcy. The following
methods and assumptions are used in estimating fair value.
The method of discounted cash flows is adopted to determine the fair value of long-term loans,
long-term payables, medium-term note payable and bonds payable, in which the market return
rate of other financial instruments with similar contract terms, credit risk, remaining maturity
and yield characteristics is used as the discount rate. As of 30 June 2017, default risk of long–
term loans was evaluated as not significant.
X. RELATED PARTIES AND RELATED PARTY TRANSACTIONS
1. PARENT COMPANY
Registered Share of Share ofPlace of Business capital equity voting
Name of parent Registration nature RMB interests (%) rights (%)
The Holding Anhui, PRC Manufacturing 6,298,290,000 45.535 45.535
The Company is ultimately controlled by the Holding.
2. SUBSIDIARIES
Details of the subsidiaries are stated in Note VII.1 to the financial statements.

Notes to Interim Financial Statements (Continued)30 June 2017Renminbi Yuan
Maanshan Iron & Steel Company Limited
2017 InterimReport
185
X. RELATED PARTIES AND RELATED PARTY TRANSACTIONS (CONTINUED)
3. ASSOCIATES AND JOINT VENTURES
Details of associates and joint ventures are stated in Note VII.2 to the financial statements.
4. OTHER RELATED PARTIES
Name
Relationship
with the Company
Magang (Group) Investment Co., Ltd. Controlled by the Holding
Magang (Group) logistics Co., Ltd. Controlled by the Holding
Maanshan Iron & Steel Group Mining Co., Ltd. Controlled by the Holding
An Hui Masteel Zhang Zhuang Mining Co., Ltd. Controlled by the Holding
Anhui Masteel Luo He Mining Co., Ltd. Controlled by the Holding
Masteel Engineering Technology (Group) Co., Ltd. Controlled by the Holding
Masteel Automation and Information Technology Co., Ltd. Controlled by the Holding
Anhui Xiangyun Technology Co., Ltd. Controlled by the Holding
Masteel Group Design and Research Institute Co., Ltd. Controlled by the Holding
Maanshan Masteel Yan Tu Construction Survey Mining
Co., Ltd. Controlled by the Holding
Masteel Group Mapping Co., Ltd. Controlled by the Holding
Masteel Heavy Machinery Manufacturing Co., Ltd. Controlled by the Holding
Masteel Transportation Equipment Manufacturing Co., Ltd. Controlled by the Holding
Maanshan Masteel Surface Engineering Technology Co., Ltd. Controlled by the Holding
Shanghai Maanshan Iron & Steel Electrical and
Mechanical Technology Co., Ltd. Controlled by the Holding
Masteel Group Kang Tai Land Development Co., Ltd. Controlled by the Holding
Maanshan Yu Tai Property Management Co., Ltd. Controlled by the Holding
Masteel Group Kang Cheng Building and Installing Co., Ltd. Controlled by the Holding
Maanshan Gang Chen Industry Co., Ltd. Controlled by the Holding
Masteel Shen Ma Metal Co., Ltd. Controlled by the Holding
Masteel Industry Sheng Xing Raw Material Processing
Co., Ltd. Controlled by the Holding
Masteel Green Energy Technology Development Co., Ltd. Controlled by the Holding
Tongling Yuanda Co., Ltd. Controlled by the Holding
Maanshan Gang Chen Steel Logistics Park Co., Ltd. Controlled by the Holding
Maanshan Gang Chen Hydrogen Industry Co., Ltd. Controlled by the Holding
Shenzhen Yue Hai Masteel Industry Co., Ltd. Controlled by the Holding
Anhui BRC & Masteel Weldmesh Co., Ltd. Controlled by the Holding
Masteel Refractory Materials Co., Ltd. Controlled by the Holding
Maanshan Bo Li Construction Supervising Co., Ltd. Controlled by the Holding
Maanshan Jia Hua Commodity Concrete Co., Ltd. Controlled by the Holding

Notes to Interim Financial Statements (Continued)30 June 2017Renminbi Yuan
Maanshan Iron & Steel Company Limited
2017 InterimReport
186
Name
Relationship
with the Company
Xinchuang Economize Resource Controlled by the Holding
Masteel Automobile Transportation Service Co., Ltd. Controlled by the Holding
Maanshan Used Vehicle Trading Centre Co., Ltd. Controlled by the Holding
Anhui Masteel Dangerous Goods Transportation Co., Ltd. Controlled by the Holding
Ma Steel International Trade and Economic Co., Ltd. Controlled by the Holding
Anhui Jiangnan Iron and Steel Material Quality Monitoring
and Testing Co., Ltd. Controlled by the Holding
Shanghai Masteel International Trade and Economic Co., Ltd. Controlled by the Holding
Anhui Zhonglian Shipping Co., Ltd. Controlled by the Holding
Maanshan Masteel Electric Repair Co., Ltd. Controlled by the Holding
Ma Steel Powder Metallurgy Co., Ltd. Controlled by the Holding
Ma Steel Gongchang United Roller Co., Ltd. (Note 1) Controlled by the Holding
Anhui Masteel Xinba Environmental Co., Ltd. Controlled by the Holding
Anhui Masteel Dongli Transmission Equipment Co., Ltd. Controlled by the Holding
Ma Steel (Hefei) Logistics Co., Ltd. Controlled by the Holding
Maanshan Xinchuangbaineng Energy Technology Co., Ltd.
(Note 2) Controlled by the Holding
Huayang Equipment (Note 2) Controlled by the Holding
Hefei Industrial Investment Holding Co., Ltd. Non-controlling interests
Note 1: During the current period, Ma Steel United Electric Steel Roller Co., Ltd. changed its name
to Ma Steel Gongchang United Roller Co., Ltd.
Note 2: The newly established companies are controlled by the Holding.
X. RELATED PARTIES AND RELATED PARTY TRANSACTIONS (CONTINUED)
4. OTHER RELATED PARTIES (CONTINUED)

Notes to Interim Financial Statements (Continued)30 June 2017Renminbi Yuan
Maanshan Iron & Steel Company Limited
2017 InterimReport
187
X. RELATED PARTIES AND RELATED PARTY TRANSACTIONS (CONTINUED)
5. SIGNIFICANT TRANSACTIONS CARRIED OUT BETWEEN THE GROUP AND ITS RELATED PARTIES
(1) Purchases of ore from related parties
For the six months
ended 30 June
2017 2016
Unaudited Unaudited
Note Amount Amount
The Holding (i) 1,978,192,113 1,081,236,119
Ma Steel International Trade and
Economic Co., Ltd. (i) 923,430 68,483,092
An Hui Masteel Zhang Zhuang Mining
Co., Ltd. (i) 51,621,848 –
Masteel Shen Ma Metal Co., Ltd. (i) 177,805 –
Tongling Yuanda Co., Ltd. (i) – 16,723,217
Anhui Masteel Luo He Mining Co., Ltd. (i) – 1,815,419
2,030,915,196 1,168,257,847
(i) The terms for the purchases of iron ore from the Holding were determined in accordance
with an agreement dated 10 September 2015 entered into between the Company and the
Holding. The agreement stipulated that the price should be determined based on the Platts
Index. The Group purchased ore from Tongling Yuanda Co., Ltd., Ma Steel International
Trade and Economic Co., Ltd., and Anhui Masteel Luo He Mining Co., Ltd., and the price
was subject to negotiation according to market prices.
Notes to Interim Financial Statements
30 June 2017
Renminbi Yuan

Notes to Interim Financial Statements (Continued)30 June 2017Renminbi Yuan
Maanshan Iron & Steel Company Limited
2017 InterimReport
188
X. RELATED PARTIES AND RELATED PARTY TRANSACTIONS (CONTINUED)
5. SIGNIFICANT TRANSACTIONS CARRIED OUT BETWEEN THE GROUP AND ITS RELATED PARTIES (CONTINUED)
(2) Fees paid for labor, logistics and other services
For the six months
ended 30 June
2017 2016
Unaudited Unaudited
Note Amount Amount
The Holding (ii) 28,952,993 42,680,667
Masteel Refractory Materials Co., Ltd. (ii) 447,873,597 311,489,554
Xinchuang Economize Resource (ii) 213,870,442 139,113,059
Masteel Automobile Transportation
Service Co., Ltd. (ii) 101,375,670 98,628,803
Masteel Heavy Machinery
Manufacturing Co., Ltd. (ii) 154,763,989 126,109,589
Masteel Engineering Technology
(Group) Co., Ltd. (ii) 291,941,833 240,826,607
Maanshan Masteel Surface
Engineering Technology Co., Ltd. (ii) 96,481,534 75,881,042
Ma Steel International Trade and
Economic Co., Ltd. (ii) 47,301,550 19,389,803
Masteel Automation and
Information Technology Co., Ltd. (ii) 83,514,567 70,477,169
Masteel Transportation Equipment
Manufacturing Co., Ltd. (ii) 46,177,349 36,946,832
Maanshan Gang Chen Industry
Co., Ltd. (ii) 7,261,974 2,011,285
Anhui Zhonglian Shipping Co., Ltd. (ii) 53,505,920 32,113,568
Magang (Group) logistics Co., Ltd. (ii) 73,362,774 5,915,581
Maanshan Xinchuangbaineng
Energy Technology Co., Ltd. (ii) 24,377,732 –
Others (ii) 93,721,826 50,165,040
1,764,483,750 1,251,748,599
(ii) The terms for the provision of certain services, including on-the-job training, food
and sanitary services, environmental and hygiene services, maintenance of roads and
landscaping services, telecommunications service, contract of transportation service,
equipment repair and maintenance services, and engineering design services, were
determined in accordance with a service agreement between the Group and the Holding.
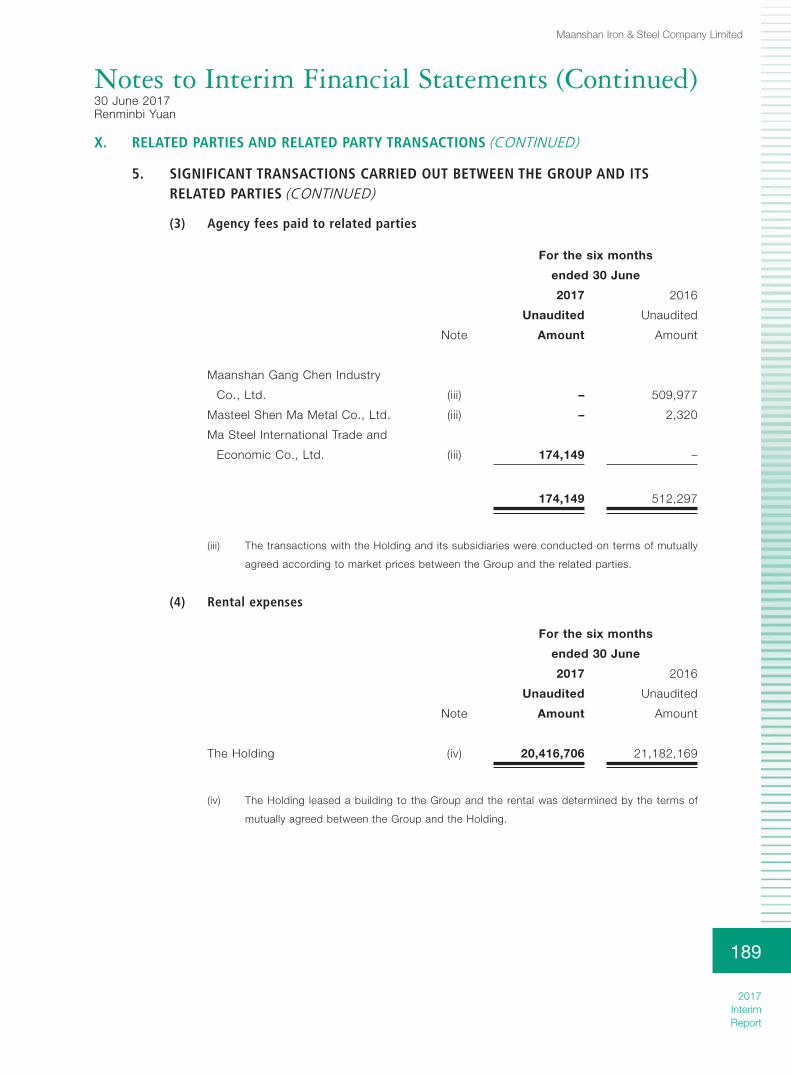
Notes to Interim Financial Statements (Continued)30 June 2017Renminbi Yuan
Maanshan Iron & Steel Company Limited
2017 InterimReport
189
X. RELATED PARTIES AND RELATED PARTY TRANSACTIONS (CONTINUED)
5. SIGNIFICANT TRANSACTIONS CARRIED OUT BETWEEN THE GROUP AND ITS RELATED PARTIES (CONTINUED)
(3) Agency fees paid to related parties
For the six months
ended 30 June
2017 2016
Unaudited Unaudited
Note Amount Amount
Maanshan Gang Chen Industry
Co., Ltd. (iii) – 509,977
Masteel Shen Ma Metal Co., Ltd. (iii) – 2,320
Ma Steel International Trade and
Economic Co., Ltd. (iii) 174,149 –
174,149 512,297
(iii) The transactions with the Holding and its subsidiaries were conducted on terms of mutually
agreed according to market prices between the Group and the related parties.
(4) Rental expenses
For the six months
ended 30 June
2017 2016
Unaudited Unaudited
Note Amount Amount
The Holding (iv) 20,416,706 21,182,169
(iv) The Holding leased a building to the Group and the rental was determined by the terms of
mutually agreed between the Group and the Holding.

Notes to Interim Financial Statements (Continued)30 June 2017Renminbi Yuan
Maanshan Iron & Steel Company Limited
2017 InterimReport
190
X. RELATED PARTIES AND RELATED PARTY TRANSACTIONS (CONTINUED)
5. SIGNIFICANT TRANSACTIONS CARRIED OUT BETWEEN THE GROUP AND ITS RELATED PARTIES (CONTINUED)
(5) Purchases of fixed assets and construction services
For the six months
ended 30 June
2017 2016
Unaudited Unaudited
Note Amount Amount
Masteel Engineering Technology
(Group) Co., Ltd. (iii) 133,892,131 263,776,746
Xinchuang Economize Resource (iii) 21,814,810 22,640,457
Masteel Automation and Information
Technology Co., Ltd. (iii) 17,478,462 36,060,822
Masteel Group Kang Cheng Building
and Installing Co., Ltd. (iii) – 861,385
Masteel Transportation Equipment
Manufacturing Co., Ltd. (iii) 314,800 –
Masteel Heavy Machinery
Manufacturing Co., Ltd. (iii) 7,248,000 –
Maanshan Masteel Electric Repair
Co., Ltd. (iii) – 402,479
Others (iii) 1,607,039 7,884
182,355,242 323,749,773
(iii) The transactions with the Holding and its subsidiaries were conducted on terms of mutually
agreed according to market prices between the Group and the related parties.

Notes to Interim Financial Statements (Continued)30 June 2017Renminbi Yuan
Maanshan Iron & Steel Company Limited
2017 InterimReport
191
X. RELATED PARTIES AND RELATED PARTY TRANSACTIONS (CONTINUED)
5. SIGNIFICANT TRANSACTIONS CARRIED OUT BETWEEN THE GROUP AND ITS RELATED PARTIES (CONTINUED)
(6) Sales of steel products and other by-products
For the six months
ended 30 June
2017 2016
Unaudited Unaudited
Note Amount Amount
The Holding (iii) 225,017 –
Masteel Engineering Technology
(Group) Co., Ltd. (iii) 92,104,703 54,182,623
Masteel Heavy Machinery
Manufacturing Co., Ltd. (iii) 27,708,246 597,979
Maanshan Gang Chen Industry
Co., Ltd. (iii) 577,653,008 1,187,711
Masteel International Trade and
Economic Co., Ltd. (iii) 10,901,153 558,607
Anhui BRC & Masteel Weldmesh
Co., Ltd. (iii) 10,270,315 –
Anhui Luo He Mining Co., Ltd. (iii) 4,435,754 –
Maanshan Jia Hua Commodity
Concrete Co., Ltd. (iii) 1,717,240 –
725,015,436 56,526,920
(iii) The transactions with the Holding and its subsidiaries were conducted on terms of mutually
agreed according to market prices between the Group and the related parties.

Notes to Interim Financial Statements (Continued)30 June 2017Renminbi Yuan
Maanshan Iron & Steel Company Limited
2017 InterimReport
192
X. RELATED PARTIES AND RELATED PARTY TRANSACTIONS (CONTINUED)
5. SIGNIFICANT TRANSACTIONS CARRIED OUT BETWEEN THE GROUP AND ITS RELATED PARTIES (CONTINUED)
(7) Fees received for the supply of utilities, services and other goods
For the six months
ended 30 June
2017 2016
Unaudited Unaudited
Note Amount Amount
The Holding (iii) 1,761,556 1,943,674
Xinchuang Economize Resource (iii) 116,444,340 43,959,957
Maanshan Jia Hua Commodity
Concrete Co., Ltd. (iii) 638,655 4,623,036
Masteel Heavy Machinery
Manufacturing Co., Ltd. (iii) 12,204,652 9,542,416
Ma Steel Powder Metallurgy Co., Ltd. (iii) 26,229,142 5,715,689
Masteel Engineering Technology
(Group) Co., Ltd. (iii) 8,670,709 14,600,123
Masteel Refractory Materials Co., Ltd. (iii) 4,702,138 3,758,009
Maanshan Masteel Surface Engineering
Technology Co., Ltd. (iii) 7,868,218 2,531,304
Masteel Automation and Information
Technology Co., Ltd. (iii) 2,407,821 2,459,750
Masteel Transportation Equipment
Manufacturing Co., Ltd. (iii) 774,058 990,792
Masteel Gang Chen Industry Co., Ltd. (iii) 484,347 437,749
An Hui Masteel Zhang Zhuang Mining
Co., Ltd. (iii) 20,104 6,436
Shanghai Masteel International Trade
and Economic Co., Ltd. (iii) – 6,242,294
Others (iii) 7,339,568 9,105,080
189,545,308 105,916,309
(iii) The transactions with the Holding and its subsidiaries were conducted on terms of mutually
agreed according to market prices between the Group and the related parties.

Notes to Interim Financial Statements (Continued)30 June 2017Renminbi Yuan
Maanshan Iron & Steel Company Limited
2017 InterimReport
193
X. RELATED PARTIES AND RELATED PARTY TRANSACTIONS (CONTINUED)
5. SIGNIFICANT TRANSACTIONS CARRIED OUT BETWEEN THE GROUP AND ITS RELATED PARTIES (CONTINUED)
(8) Financial service interest cost paid to related parties
For the six months
ended 30 June
2017 2016
Unaudited Unaudited
Note Amount Amount
The Holding (v) 9,858,995 4,190,907
Masteel Engineering Technology
(Group) Co., Ltd. (v) 1,208,342 625,762
Maanshan Gang Chen Industry
Co., Ltd. (v) 221,400 2,874
Maanshan Iron & Steel Group
Mining Co., Ltd. (v) 961,785 863,243
Maanshan Masteel Surface
Engineering Technology Co., Ltd. (v) 245,375 –
Masteel International Trade and
Economic Co., Ltd. (v) 611,002 173,359
An Hui Masteel Zhang Zhuang
Mining Co., Ltd. (v) 2,229,353 336,248
Xinchuang Economize Resource (v) 271,084 –
Anhui Luo He Mining Co., Ltd. (v) 125,518 –
Masteel Group Kang Tai Land
Development Co., Ltd. (v) 246,509 –
Others (v) 2,355,662 1,191,877
18,335,025 7,384,270
(v) Masteel Financial absorbed deposits from the Holding and its subsidiaries, and paid interest
to them with the interest rate ranging from 0.42% to 3.99% for the six months ended 30
June 2017 (for the six months ended 30 June 2016: 0.42% – 3.30%).

Notes to Interim Financial Statements (Continued)30 June 2017Renminbi Yuan
Maanshan Iron & Steel Company Limited
2017 InterimReport
194
X. RELATED PARTIES AND RELATED PARTY TRANSACTIONS (CONTINUED)
5. SIGNIFICANT TRANSACTIONS CARRIED OUT BETWEEN THE GROUP AND ITS RELATED PARTIES (CONTINUED)
(9) Financial service income received from related parties
For the six months
ended 30 June
2017 2016
Unaudited Unaudited
Note Amount Amount
The Holding (vi) 17,210,070 4,009,309
Maanshan Iron & Steel Group
Mining Co., Ltd. (vi) 8,509,600 6,183,592
Anhui Masteel Luo He Mining Co., Ltd. (vi) 2,447,323 2,521,875
Anhui BRC & Masteel Weldmesh
Co., Ltd. (vi) 769,105 261,664
Maanshan Gang Chen Industry
Co., Ltd. (vi) 1,752,305 1,286,367
Xinchuang Economize Resource (vi) – 135,402
Masteel Engineering Technology
(Group) Co., Ltd. (vi) 38,251 67,786
Ma Steel International Trade and
Economic Co., Ltd. (vi) 9,434 299,388
Maanshan Xinchuangbaineng Energy
Technology Co., Ltd. (vi) 333,504 –
Others (vi) 202,180 205,769
31,271,772 14,971,152
(vi) Masteel Financial, a subsidiary of the Group, obtained financial service income for the
financial services it rendered to the Holding and its subsidiaries, including providing loans,
bank acceptance notes discounting and entrusted loan. The lending rates were not lower
than the benchmark loan interest rates issued by the People’s Bank of China, and the other
service charge was not lower than the benchmark charge issued by the People’s Bank of
China.

Notes to Interim Financial Statements (Continued)30 June 2017Renminbi Yuan
Maanshan Iron & Steel Company Limited
2017 InterimReport
195
X. RELATED PARTIES AND RELATED PARTY TRANSACTIONS (CONTINUED)
5. SIGNIFICANT TRANSACTIONS CARRIED OUT BETWEEN THE GROUP AND ITS RELATED PARTIES (CONTINUED)
(10) Purchases of coke from an associate
For the six months
ended 30 June
2017 2016
Unaudited Unaudited
Note Amount Amount
Henan Jinma Energy (vii) 459,954,023 –
(vii) These transactions were made between the Group and Henan Jinma Energy and were
conducted in accordance with the terms of mutually agreed according to market prices
between the parties.
(11) Sales of coke-related products to an associate
For the six months
ended 30 June
2017 2016
Unaudited Unaudited
Note Amount Amount
Ma-Steel OCI Chemical (viii) 160,132,068 –
(viii) These transactions were made between the Group and Ma-Steel OCI Chemical and were
conducted in accordance with the terms of mutually agreed according to market prices
between the parties.

Notes to Interim Financial Statements (Continued)30 June 2017Renminbi Yuan
Maanshan Iron & Steel Company Limited
2017 InterimReport
196
X. RELATED PARTIES AND RELATED PARTY TRANSACTIONS (CONTINUED)
5. SIGNIFICANT TRANSACTIONS CARRIED OUT BETWEEN THE GROUP AND ITS RELATED PARTIES (CONTINUED)
(12) Fees received for the supply of electricity from an associate
For the six months
ended 30 June
2017 2016
Unaudited Unaudited
Note Amount Amount
Ma-Steel OCI Chemical (viii) 7,214,477 –
(viii) These transactions were made between the Group and Ma-Steel OCI Chemical and were
conducted in accordance with the terms of mutually agreed according to market prices
between the parties.
(13) Rental income from a joint venture
For the six months
ended 30 June
2017 2016
Unaudited Unaudited
Note Amount Amount
BOC-Ma Steel (ix) 1,250,000 1,250,000
(ix) These transactions were made between the Group and BOC-Ma Steel and were conducted
in accordance with the terms of mutually agreed according to market prices between the
parties.

Notes to Interim Financial Statements (Continued)30 June 2017Renminbi Yuan
Maanshan Iron & Steel Company Limited
2017 InterimReport
197
X. RELATED PARTIES AND RELATED PARTY TRANSACTIONS (CONTINUED)
5. SIGNIFICANT TRANSACTIONS CARRIED OUT BETWEEN THE GROUP AND ITS RELATED PARTIES (CONTINUED)
(14) Fees received for the supply of electricity from a joint venture
For the six months
ended 30 June
2017 2016
Unaudited Unaudited
Note Amount Amount
BOC-Ma Steel (ix) 118,030,601 122,578,450
(ix) These transactions were made between the Group and BOC-Ma Steel and were conducted
in accordance with the terms of mutually agreed according to market prices between the
parties.
(15) Fees received for utilities and facilities from a joint venture
For the six months
ended 30 June
2017 2016
Unaudited Unaudited
Note Amount Amount
BOC-Ma Steel (ix) 5,595,376 5,519,644
(ix) These transactions were made between the Group and BOC-Ma Steel and were conducted
in accordance with the terms of mutually agreed according to market prices between the
parties.

Notes to Interim Financial Statements (Continued)30 June 2017Renminbi Yuan
Maanshan Iron & Steel Company Limited
2017 InterimReport
198
X. RELATED PARTIES AND RELATED PARTY TRANSACTIONS (CONTINUED)
5. SIGNIFICANT TRANSACTIONS CARRIED OUT BETWEEN THE GROUP AND ITS RELATED PARTIES (CONTINUED)
(16) Fees received for supply of gas from a joint venture
For the six months
ended 30 June
2017 2016
Unaudited Unaudited
Note Amount Amount
BOC-Ma Steel (ix) 1,473,581 1,992,183
(ix) These transactions were made between the Group and BOC-Ma Steel and were conducted
in accordance with the terms of mutually agreed according to market prices between the
parties.
(17) Fees received for providing electricity and broadband from a joint venture
For the six months
ended 30 June
2017 2016
Unaudited Unaudited
Note Amount Amount
BOC-Ma Steel (ix) 18,515 18,416
(ix) These transactions were made between the Group and BOC-Ma Steel and were conducted
in accordance with the terms of mutually agreed according to market prices between the
parties.

Notes to Interim Financial Statements (Continued)30 June 2017Renminbi Yuan
Maanshan Iron & Steel Company Limited
2017 InterimReport
199
X. RELATED PARTIES AND RELATED PARTY TRANSACTIONS (CONTINUED)
5. SIGNIFICANT TRANSACTIONS CARRIED OUT BETWEEN THE GROUP AND ITS RELATED PARTIES (CONTINUED)
(18) Purchase of gas products from a joint venture
For the six months
ended 30 June
2017 2016
Unaudited Unaudited
Note Amount Amount
BOC-Ma Steel (ix) 272,320,596 257,608,018
(ix) These transactions were made between the Group and BOC-Ma Steel and were conducted
in accordance with the terms of mutually agreed according to market prices between the
parties.
(19) Fees received for providing equipment inspection from a joint venture
For the six months
ended 30 June
2017 2016
Unaudited Unaudited
Note Amount Amount
BOC-Ma Steel (ix) 320,755 –
(ix) These transactions were made between the Group and BOC-Ma Steel and were conducted
in accordance with the terms of mutually agreed according to market prices between the
parties.

Notes to Interim Financial Statements (Continued)30 June 2017Renminbi Yuan
Maanshan Iron & Steel Company Limited
2017 InterimReport
200
X. RELATED PARTIES AND RELATED PARTY TRANSACTIONS (CONTINUED)
5. SIGNIFICANT TRANSACTIONS CARRIED OUT BETWEEN THE GROUP AND ITS RELATED PARTIES (CONTINUED)
(20) Guarantee from a related party
30 June 2017 (Unaudited)
Note
Guarantee’s
name
Guarantee
amount Start date End date
Has guarantee
matured or not
(RMB)
The Holding (x) The Company 2.897 billion 2014.7 2025.10 Not yet as of
the approval date
of the report
31 December 2016 (Audited)
Note
Guarantee
name
Guarantee
amount Start date End date
Has guarantee
matured or not
(RMB)
The Holding (x) The Company 2.487 billion 2014.7 2025.10 Not yet as of
the approval date
of the report
(x) For the six months ended 30 June 2017, the Holding had guaranteed additional certain
bank loans of the Group amounting to RMB1.7 billion (the holding had guaranteed addition
certain bank loans and bonds of the Group amounting to RMB0.94 billion in 2016) without
attached conditions. As of 30 June 2017, the Holding had guaranteed part of bank loans
and bonds without attached conditions amounting to approximately RMB2.897 billion (31
December 2016: approximately RMB2.487 billion).

Notes to Interim Financial Statements (Continued)30 June 2017Renminbi Yuan
Maanshan Iron & Steel Company Limited
2017 InterimReport
201
X. RELATED PARTIES AND RELATED PARTY TRANSACTIONS (CONTINUED)
5. SIGNIFICANT TRANSACTIONS CARRIED OUT BETWEEN THE GROUP AND ITS RELATED PARTIES (CONTINUED)
(21) Borrowings from related parties
30 June 2017 (Unaudited)
Note Amount Start date End date
Anhui Zhonglian Shipping
Co., Ltd.
(xi) 70,000,000 2016/09/27 2017/9/26
Maanshan Masteel Surface
Engineering Technology
Co., Ltd.
(xi) 20,000,000 2016/07/29 2017/7/28
Maanshan Masteel Surface
Engineering Technology
Co., Ltd.
(xi) 20,000,000 2016/11/18 2017/11/17
The Holding (xi) 40,000,000 2016/08/30 2017/8/29
Anhui Zhonglian Shipping
Co., Ltd.
(xi) 30,000,000 2017/05/04 2018/5/3
Hefei Industrial Investment
Holding Co., Ltd.
(xi) 210,000,000 2017/06/12 2019/6/12
31 December 2016 (Audited)
Note Amount Start date End date
Anhui Zhonglian Shipping
Co., Ltd.
(xi) 70,000,000 2016/09/27 2017/09/26
Maanshan Masteel Surface
Engineering Technology
Co., Ltd.
(xi) 20,000,000 2016/07/29 2017/07/28
Maanshan Masteel Surface
Engineering Technology
Co., Ltd.
(xi) 20,000,000 2016/11/18 2017/11/17
The Holding (xi) 40,000,000 2016/08/30 2017/08/29

Notes to Interim Financial Statements (Continued)30 June 2017Renminbi Yuan
Maanshan Iron & Steel Company Limited
2017 InterimReport
202
X. RELATED PARTIES AND RELATED PARTY TRANSACTIONS (CONTINUED)
5. SIGNIFICANT TRANSACTIONS CARRIED OUT BETWEEN THE GROUP AND ITS RELATED PARTIES (CONTINUED)
(21) Borrowings from related parties (Continued)
(xi) On 27 September 2016, Anhui Zhonglian Shipping Co., Ltd. entrusted Masteel Financial to
provide the Company a short-term loan of RMB70,000,000 with the annual interest rate of
3.915%, and repay the principal and interest on the expiration date. The Company accrued
interest of RMB1,377,863, which was paid yet as of 30 June 2017.
On 29 July 2016, Maanshan Masteel Surface Engineering Technology Co., Ltd. entrusted
Masteel Financial to provide the Company a short-term loan of RMB20,000,000 with the
annual interest rate of 3.915%, and repay the principal and interest on the expiration date.
The Company accrued interest of RMB393,675, which was paid yet as of 30 June 2017.
On 18 November 2016, Maanshan Masteel Surface Engineering Technology Co., Ltd.
entrusted Masteel Financial to provide the Company a short-term loan of RMB20,000,000
with the annual interest rate of 3.915%, and repay the principal and interest on the
expiration date. The Company accrued interest of RMB393,675, which was paid yet as of
30 June 2017.
On 30 August 2016, The Holding entrusted Masteel Financial to provide the Company
a short-term loan of RMB40,000,000 with the annual interest rate of 4.35%, and repay
the principal and interest on the expiration date. The Company accrued interest of
RMB874,833, which was paid yet as of 30 June 2017.
On 4 May 2017, Anhui Zhonglian Shipping Co., Ltd. entrusted Masteel Financial to provide
the Company a short-term loan of RMB30,000,000 with the annual interest rate of 3.915%,
and repay the principal and interest on the expiration date. The Company accrued interest
of RMB189,225, which was paid yet as of 30 June 2017.
On 12 June 2017, as a non-controlling interest of Hefei Steel Plates, Hefei Industrial
Investment Holding Co., Ltd. offered Hefei Steel Plates which is a subsidiary of the
Company a two years’ loan of RMB210,000,000, and the contract stipulated that the loan
was interest free.

Notes to Interim Financial Statements (Continued)30 June 2017Renminbi Yuan
Maanshan Iron & Steel Company Limited
2017 InterimReport
203
X. RELATED PARTIES AND RELATED PARTY TRANSACTIONS (CONTINUED)
5. SIGNIFICANT TRANSACTIONS CARRIED OUT BETWEEN THE GROUP AND ITS RELATED PARTIES (CONTINUED)
(22) According to the financial service agreement signed by Masteel Financial and the
Holding on 29 December 2016, Masteel Financial provides financing services and
deposit transactions to the Group and its subsidiaries, and from 1 January 2017 to 31
December 2017, the highest daily outstanding loan should be less than RMB500 million,
other financial service charge should be less than RMB60 million. The annual cap was
the highest demand for daily deposits, which was decided according to the Holding
and its affiliates’ expectations of the capital and operational requirement. During the
current period, the highest daily deposit balance was RMB4.69 billion (2016: RMB4.35
billion); the highest average daily deposit balance on a monthly basis was RMB4.17
billion (2016: RMB3.63 billion); the highest daily loan balance was RMB0.498 billion
(2016: RMB0.498 billion); the highest average daily loan balance on a monthly basis was
RMB0.497 billion (2016: RMB0.496 billion).
(23) In January 2017, the Company transferred 90% of equity interests of Huayang
Equipment to Xinchuang Economize Resource, which constituted a related party
transaction. Please refer to Note VI.3 for details.
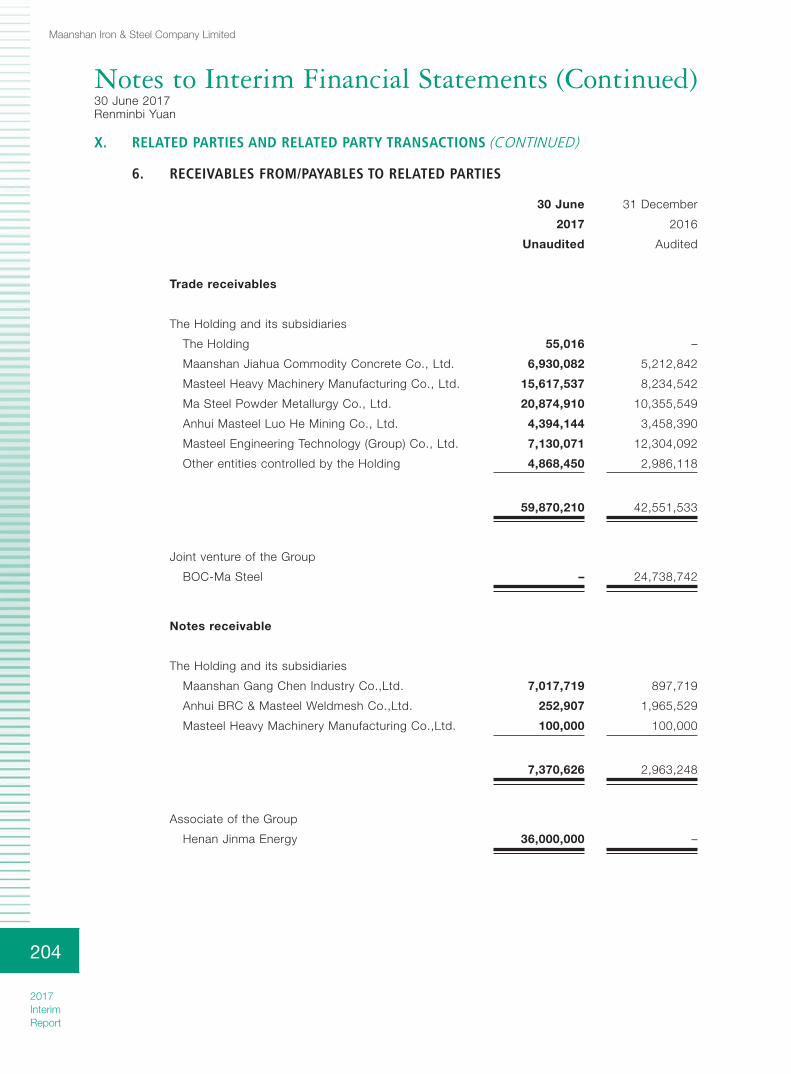
Notes to Interim Financial Statements (Continued)30 June 2017Renminbi Yuan
Maanshan Iron & Steel Company Limited
2017 InterimReport
204
X. RELATED PARTIES AND RELATED PARTY TRANSACTIONS (CONTINUED)
6. RECEIVABLES FROM/PAYABLES TO RELATED PARTIES
30 June
2017
31 December
2016
Unaudited Audited
Trade receivables
The Holding and its subsidiaries
The Holding 55,016 –
Maanshan Jiahua Commodity Concrete Co., Ltd. 6,930,082 5,212,842
Masteel Heavy Machinery Manufacturing Co., Ltd. 15,617,537 8,234,542
Ma Steel Powder Metallurgy Co., Ltd. 20,874,910 10,355,549
Anhui Masteel Luo He Mining Co., Ltd. 4,394,144 3,458,390
Masteel Engineering Technology (Group) Co., Ltd. 7,130,071 12,304,092
Other entities controlled by the Holding 4,868,450 2,986,118
59,870,210 42,551,533
Joint venture of the Group
BOC-Ma Steel – 24,738,742
Notes receivable
The Holding and its subsidiaries
Maanshan Gang Chen Industry Co.,Ltd. 7,017,719 897,719
Anhui BRC & Masteel Weldmesh Co.,Ltd. 252,907 1,965,529
Masteel Heavy Machinery Manufacturing Co.,Ltd. 100,000 100,000
7,370,626 2,963,248
Associate of the Group
Henan Jinma Energy 36,000,000 –

Notes to Interim Financial Statements (Continued)30 June 2017Renminbi Yuan
Maanshan Iron & Steel Company Limited
2017 InterimReport
205
Prepayments
The Holding and its subsidiaries
The Holding 328,164 28,164
Ma Steel International Trade and Economic Co., Ltd. 45,457,448 25,316,196
Other entities controlled by the Holding 313,060 313,060
46,098,672 25,657,420
Associate of the Group
Henan Jinma Energy 155,591,317 100,000,000
Other receivables
The Holding and its subsidiaries
Magang (Group) Investment Co., Ltd. 4,938,202 –
Masteel Engineering Technology (Group) Co., Ltd. – 4,000
Masteel Automobile Transportation Service Co., Ltd. – 323
4,938,202 4,323
Short-term loans
The Holding and its subsidiaries
The Holding 40,000,000 40,000,000
Anhui Zhonglian Shipping Co., Ltd. 100,000,000 70,000,000
Maanshan Masteel Surface Engineering
Technology Co., Ltd. 40,000,000 40,000,000
180,000,000 150,000,000
X. RELATED PARTIES AND RELATED PARTY TRANSACTIONS (CONTINUED)
6. RECEIVABLES FROM/PAYABLES TO RELATED PARTIES (CONTINUED)
30 June
2017
31 December
2016
Unaudited Audited

Notes to Interim Financial Statements (Continued)30 June 2017Renminbi Yuan
Maanshan Iron & Steel Company Limited
2017 InterimReport
206
X. RELATED PARTIES AND RELATED PARTY TRANSACTIONS (CONTINUED)
6. RECEIVABLES FROM/PAYABLES TO RELATED PARTIES (CONTINUED)
30 June
2017
31 December
2016
Unaudited Audited
Accounts payable
The Holding and its subsidiaries
The Holding 90,529,515 988,765
Xinchuang Economize Resource 42,785,768 54,584,324
Masteel Engineering Technology (Group) Co., Ltd. 344,871,557 150,278,616
Maanshan Masteel Surface Engineering Technology
Co., Ltd. 37,394,206 47,203,701
Masteel Automation and Information Technology
Co., Ltd. 19,354,799 19,950,761
Masteel Automobile Transportation Service Co., Ltd. 23,277,774 21,490,195
Masteel Shen Ma Metal Co., Ltd. 6,898,344 5,314,349
Masteel Heavy Machinery Manufacturing Co., Ltd. 36,070,994 44,360,504
Other entities controlled by the Holding 39,508,588 75,002,591
640,691,545 419,173,806
Joint ventures and associates of the Group
BOC-Ma Steel 53,025,591 55,481,931
Ma-Steel OCI Chemical – 159,811
Shenglong Chemical 366,902 366,902
53,392,493 56,008,644

Notes to Interim Financial Statements (Continued)30 June 2017Renminbi Yuan
Maanshan Iron & Steel Company Limited
2017 InterimReport
207
X. RELATED PARTIES AND RELATED PARTY TRANSACTIONS (CONTINUED)
6. RECEIVABLES FROM/PAYABLES TO RELATED PARTIES (CONTINUED)
30 June
2017
31 December
2016
Unaudited Audited
Advances from customers
The Holding and its subsidiaries
The Holding 178,120 190,788
Maanshan Gang Chen Industry Co., Ltd. 34,208,789 32,651,727
Anhui BRC & Masteel Weldmesh Co., Ltd. 17,085 5,283,354
Other entities controlled by the Holding 6,778,254 11,987,789
41,182,248 50,113,658
Associates of the Group
Ma-Steel OCI Chemical 22,811,548 7,078,117
Shenglong Chemicals – 11
22,811,548 7,078,128
Other payables
The Holding and its subsidiaries
Masteel Automobile Transportation Service Co., Ltd. 8,438,483 6,295,101
Masteel Engineering Technology (Group) Co., Ltd. 10,300,724 13,720,456
Xinchuang Economize Resource 14,662,983 22,495,594
Maanshan Masteel Electric Repair Co., Ltd. 844,787 963,873
Maanshan Gang Chen Industry Co., Ltd. 200,000 110,040
Other entities controlled by the Holding 7,179,086 3,233,755
41,626,063 46,818,819
Joint venture of the Group
BOC-Ma Steel 70,000 70,000
Long-term payables
Non-controlling interests
Hefei Industrial Investment Holding Co., Ltd. 210,000,000 –

Notes to Interim Financial Statements (Continued)30 June 2017Renminbi Yuan
Maanshan Iron & Steel Company Limited
2017 InterimReport
208
X. RELATED PARTIES AND RELATED PARTY TRANSACTIONS (CONTINUED)
6. RECEIVABLES FROM/PAYABLES TO RELATED PARTIES (CONTINUED)
30 June
2017
31 December
2016
Unaudited Audited
Loans and advances to customers
The Holding and its subsidiaries
The Holding – 16,698,711
Anhui Masteel Luo He Mining Co., Ltd. 166,135,701 112,224,379
Anhui BRC & Masteel Weldmesh Co., Ltd. 46,452,891 31,811,230
Ma Steel International Trade and Economic Co., Ltd. – 50,982,046
Maanshan Iron & Steel Group Mining Co., Ltd. 1,197,520,993 1,193,527,145
Other entities controlled by the Holding 101,068,437 136,864,275
1,511,178,022 1,542,107,786
Customer deposits
The Holding and its subsidiaries
The Holding 1,145,675,194 1,830,191,701
Masteel Engineering Technology (Group) Co., Ltd. 351,907,841 273,754,756
Maanshan Gang Chen Industry Co., Ltd. 24,912,685 19,128,371
An Hui Masteel Zhang Zhuang Mining Co., Ltd. 310,693,139 252,042,388
Ma Steel International Trade and Economic Co., Ltd. 25,711,714 304,878,663
Masteel Group Kang Tai Land Development Co., Ltd. 78,941,343 49,183,147
Masteel Heavy Machinery Manufacturing Co., Ltd. 97,277,291 94,000,665
Other entities controlled by the Holding 648,185,658 621,115,481
2,683,304,865 3,444,295,172
The fee charged by Masteel Financial for the financing services and deposit transactions
provided to the Holding and its subsidiaries was determined based on negotiation between the
two parties.
* As of 30 June 2017, in current assets and current liabilities, except for the interests charge for the
deposit and loans provided by Masteel Financial, all these receivables and payables had no interest,
no pledge and would be paid in the future.

Notes to Interim Financial Statements (Continued)30 June 2017Renminbi Yuan
Maanshan Iron & Steel Company Limited
2017 InterimReport
209
X. RELATED PARTIES AND RELATED PARTY TRANSACTIONS (CONTINUED)
7. THE COMMITMENT OF THE GROUP WITH RELATED PARTIES
As of 30 June 2017, the Group did not make any commitments to the related parties. (As of
31 December 2016, the Company had made an investment commitment to Mascometal, which
was a Joint Venture, amounting to EUR16.07 million).
XI. COMMITMENTS AND CONTINGENCIES
1. SIGNIFICANT COMMITMENTS
30 June
2017
31 December
2016
Unaudited Audited
Contracted, but not provided for
Capital commitments 1,983,800,244 2,419,658,635
Investment commitments 15,000,000 155,870,276
1,998,800,244 2,575,528,911
The group did not have matters that was accounted in the joint venture capital commitment
during the current period, please refer to Note X.7.
2. CONTINGENT EVENTS
Difference of corporate income tax
The State Administration of Taxation issued “The notice of income tax collection and
management on Shanghai Petrochemical Company Limited and other eight companies listed
overseas corporation” (Guo Shui Han [2007] No. 664) in June 2007, with stated claims that the
relevant local tax bureaus must correct immediately the expired tax incentives of the nine Hong
Kong listed companies. The income tax difference between the results of the previously expired
preferential rate and the applicable rate should be treated in accordance with the relevant
provisions of the “People’s Republic of China Administration of Tax Collection Law”.
The Company is one of the nine companies mentioned above and used a 15% preferential tax
rate in the previous year. After understanding the above information, the Company and the tax
authorities issued a comprehensive communication and according to the tax authorities, the
applicable corporate income tax rate in 2007 was 33%, which is adjusted from the original
15%. The Company has not been recovered prior year income tax differences.

Notes to Interim Financial Statements (Continued)30 June 2017Renminbi Yuan
Maanshan Iron & Steel Company Limited
2017 InterimReport
210
XI. COMMITMENTS AND CONTINGENCIES (CONTINUED)
2. CONTINGENT EVENTS (CONTINUED)
Difference of corporate income tax (Continued)
Based on the comprehensive communication between the Company and the tax authorities,
it is uncertain whether the tax authorities will recover the difference between the previous
year’s income tax at this stage, and the final result of this matter cannot be estimated reliably.
Therefore, the financial statements have not made any provision or adjustments related to the
income tax differences.
Pending litigation
As of 30 June 2017, the Group and the Company did not have significant pending litigation.
XII. EVENTS AFTER THE BALANCE SHEET DATE
As of the date of approval of the financial statements, the Group had no significant event after the
balance sheet date that needs to be disclosed.
XIII. OTHER SIGNIFICANT EVENTS
1. LEASES
As lessor
The Group had leased certain of its investment properties under operating lease arrangements
ranging from one to eighteen years. The periodic rental was fixed during the operating lease
periods.
30 June
2017
31 December
2016
Unaudited Audited
Remaining lease period
Within 1 year, inclusive 1,250,000 1,301,120
1 to 2 years, inclusive 1,250,000 1,250,000
2 to 3 years, inclusive 1,250,000 1,250,000
Over 3 years 3,282,534 3,907,534
7,032,534 7,708,654

Notes to Interim Financial Statements (Continued)30 June 2017Renminbi Yuan
Maanshan Iron & Steel Company Limited
2017 InterimReport
211
XIII. OTHER SIGNIFICANT EVENTS (CONTINUED)
2. OPERATING SEGMENT INFORMATION
Operating segment
The Group divides the operation services into two operating segments which are determined
based on the internal organisation structure, management requirements and internal reporting
system:
• Production and sale of iron and steel products and related by-products: the Company
and its subsidiaries except for Masteel Financial;
• Financial service: Masteel Financial.
The Group did not consider financial service as individual reportable segments, as Masteel
Financial mainly offers financial service to internal companies. Therefore, the Group focuses on
the production and sale of iron and steel products and by-products, and it is unnecessary for
the Group to disclose more detailed information.
Other information
Product and service information
External principal operating income
For the six months
ended 30 June
2017 2016
Unaudited Unaudited
Sale of steel products 32,685,470,879 19,705,371,213
Sale of steel billets and pig iron 982,818,293 371,861,145
Sale of coke by-products 210,793,879 155,735,957
Others 850,778,575 377,155,183
34,729,861,626 20,610,123,498

Notes to Interim Financial Statements (Continued)30 June 2017Renminbi Yuan
Maanshan Iron & Steel Company Limited
2017 InterimReport
212
XIII. OTHER SIGNIFICANT EVENTS (CONTINUED)
2. OPERATING SEGMENT INFORMATION (CONTINUED)
Other information (Continued)
Geographical information
External principal operating income
For the six months
ended 30 June
2017 2016
Unaudited Unaudited
The PRC 32,372,797,968 18,866,675,458
Overseas 2,357,063,658 1,743,448,040
34,729,861,626 20,610,123,498
Non-current assets
30 June
2017
31 December
2016
Unaudited Audited
The PRC 39,406,551,890 40,595,765,043
Overseas 317,336,644 305,407,308
39,723,888,534 40,901,172,351
The non-current asset information above is based on the locations of assets and excludes
financial assets and deferred tax assets.
Major customer information
The Group has not placed reliance on any single external customer which accounted for 10%
or more of its revenue.

Notes to Interim Financial Statements (Continued)30 June 2017Renminbi Yuan
Maanshan Iron & Steel Company Limited
2017 InterimReport
213
XIV. MAJOR NOTES TO COMPANY FINANCIAL STATEMENTS
1. TRADE RECEIVABLES
The Company’s trade receivables were interest-free with normal credit terms of 30 to 90 days.
An aging analysis of trade receivables is as follows:
30 June
2017
31 December
2016
Unaudited Audited
Within one year 2,150,606,463 1,782,014,214
One to two years 129,783,597 125,625,110
Two to three years 15,303,962 27,273,361
Over three years 46,847,382 31,693,096
2,342,541,404 1,966,605,781
Less: Provisions for bad debts 19,673,359 13,382,203
2,322,868,045 1,953,223,578
* The aging analysis of trade receivables of the Company is based on the invoice date.
The trade receivable balances are analysed as follows:
30 June 2017 (Unaudited) 31 December 2016 (Audited)
Book value Provision for bad debts Book value Provision for bad debtsAmount Ratio Amount Ratio Amount Ratio Amount Ratio
(%) (%) (%) (%)
Individually significant and assessed for impairment individually 2,312,597,065 99 (13,218,196) 1 1,952,062,818 99 (6,927,040) –
Other insignificant but assessed for impairment individually 29,944,339 1 (6,455,163) 22 14,542,963 1 (6,455,163) 44
2,342,541,404 100 (19,673,359) 1,966,605,781 100 (13,382,203)
The movements of provision for bad debts against trade receivables for the period are
disclosed in Note XIV.4.

Notes to Interim Financial Statements (Continued)30 June 2017Renminbi Yuan
Maanshan Iron & Steel Company Limited
2017 InterimReport
214
XIV. MAJOR NOTES TO COMPANY FINANCIAL STATEMENTS (CONTINUED)
1. TRADE RECEIVABLES (CONTINUED)
As of 30 June 2017, those individually significant and assessed for impairment individually were
as follows:
Book value
Provision for
bad debts Ratio (%) Reason
Company 1 770,779,205 – – /
Company 2 194,088,011 – – /
Company 3 161,162,237 – – /
Company 4 121,652,399 – – /
Company 5 110,890,578 – – /
Company 6 105,098,986 – – /
Company 7 95,823,216 – – /
Company 8 92,667,392 – – /
Company 9 90,809,606 – – /
Company 10 58,680,735 – – /
Company 11 48,312,244 – – /
Company 12 39,914,420 – – /
Company 13 28,797,957 – – /
Company 14 28,555,094 – – /
Company 15 28,149,429 – – /
Others 337,215,556 (13,218,196) Note1
2,312,597,065 (13,218,196)
Note 1: The Company had confirmed that two of the Company’s trade receivables cannot be recovered,
therefore, full provision for the bad debts amounting to RMB6,927,040 and RMB6,291,156 were
made, respectively.
During the current period, the provision for bad debts was RMB6,291,156 (for the six months
ended 2016: Nil), and there was no recovery or reversal of provision for bad debts (for the six
months ended 2016: Nil).
During the current period, there was no trade receivables that had been written off (for the six
months ended 2016: Nil).

Notes to Interim Financial Statements (Continued)30 June 2017Renminbi Yuan
Maanshan Iron & Steel Company Limited
2017 InterimReport
215
XIV. MAJOR NOTES TO COMPANY FINANCIAL STATEMENTS (CONTINUED)
1. TRADE RECEIVABLES (CONTINUED)
As of 31 December 2016, those individually significant and assessed for impairment individually
were as follows:
Book value
Provision for
bad debts Ratio (%) Reason
Company 1 694,446,823 – – /
Company 2 214,069,244 – – /
Company 3 117,299,709 – – /
Company 4 92,487,872 – – /
Company 5 90,266,047 – – /
Company 6 64,514,240 – – /
Company 7 61,374,572 – – /
Company 8 55,798,074 – – /
Company 9 48,312,244 – – /
Company 10 35,735,250 – – /
Company 11 29,117,360 – – /
Company 12 24,738,742 – – /
Company 13 24,563,898 – – /
Company 14 21,908,132 – – /
Company 15 21,573,834 – – /
Others 355,856,777 (6,927,040)
1,952,062,818 (6,927,040)

Notes to Interim Financial Statements (Continued)30 June 2017Renminbi Yuan
Maanshan Iron & Steel Company Limited
2017 InterimReport
216
XIV. MAJOR NOTES TO COMPANY FINANCIAL STATEMENTS (CONTINUED)
1. TRADE RECEIVABLES (CONTINUED)
The top five trade receivables classified by debtor:
30 June 2017 (Unaudited)
Relationship with the Company Ending balance Aging
Percentage of trade
receivables
Ending balance of
provision
Company 1 Subsidiary 770,779,205 Within one year 33% –Company 2 Subsidiary 194,088,011 Within one year 8% –Company 3 Subsidiary 161,162,237 Within one year 7% –Company 4 Third party 121,652,399 Within one year 5% –Company 5 Subsidiary 110,890,578 Within one year 5% –
1,358,572,430 58%
31 December 2016 (Audited)
Relationship with the Company Ending balance Aging
Percentage of trade
receivables
Ending balance of
provision
Company 1 Subsidiary 694,446,823 Within one year 36% –Company 2 Subsidiary 214,069,244 Within one year 11% –Company 3 Third party 117,299,709 Within one year 6% –Company 4 Subsidiary 92,487,872 One to two years 5% –Company 5 Subsidiary 90,266,047 Within one year 5% –
1,208,569,695 63%

Notes to Interim Financial Statements (Continued)30 June 2017Renminbi Yuan
Maanshan Iron & Steel Company Limited
2017 InterimReport
217
XIV. MAJOR NOTES TO COMPANY FINANCIAL STATEMENTS (CONTINUED)
2. OTHER RECEIVABLES
An aging analysis of the other receivables is as follows:
30 June
2017
31 December
2016
Unaudited Audited
Within one year 166,431,627 39,486,862
One to two years 297,870 615,777
Two to three years 154,154 1,093,937
Over three years 423,615,434 422,691,173
590,499,085 463,887,749
Less: Provisions for bad debts 422,847,240 422,847,240
167,651,845 41,040,509
The movements of provisions for bad debts against other receivables for the period are
disclosed in Note XIV.4.
The other receivables balances are analysed as follows:
30 June 2017 (Unaudited) 31 December 2016 (Audited)
Book value Provision for bad debts Book value Provision for bad debtsAmount Ratio Amount Ratio Amount Ratio Amount Ratio
(%) (%) (%) (%)
Individually significant and assessed for impairment individually 562,331,493 95 (418,316,326) 74 452,496,848 98 (418,316,326) 92
Individually insignificant but assessed for impairment individually 28,167,592 5 (4,530,914) 16 11,390,901 2 (4,530,914) 40
590,499,085 100 (422,847,240) 463,887,749 100 (422,847,240)

Notes to Interim Financial Statements (Continued)30 June 2017Renminbi Yuan
Maanshan Iron & Steel Company Limited
2017 InterimReport
218
XIV. MAJOR NOTES TO COMPANY FINANCIAL STATEMENTS (CONTINUED)
2. OTHER RECEIVABLES (CONTINUED)
As of 30 June 2017, those individually significant and assessed for impairment individually were
as follows:
Book value
Provision for
bad debts Ratio(%) Reason
Company 1 132,058,434 (132,058,434) 100 Note
Company 2 127,685,367 (127,685,367) 100 Note
Company 3 60,939,960 (60,939,960) 100 Note
Company 4 57,988,833 (57,988,833) 100 Note
Company 5 37,243,732 (37,243,732) 100 Note
Company 6 2,400,000 (2,400,000) 100 Note
Others 144,015,167 – /
562,331,493 (418,316,326)
As of 31 December 2016, those individually significant and assessed for impairment individually
were as follows:
Book value
Provision for
bad debts Ratio(%) Reason
Company 1 132,058,434 (132,058,434) 100 Note
Company 2 127,685,367 (127,685,367) 100 Note
Company 3 60,939,960 (60,939,960) 100 Note
Company 4 57,988,833 (57,988,833) 100 Note
Company 5 37,243,732 (37,243,732) 100 Note
Company 6 2,400,000 (2,400,000) 100 Note
Others 34,180,522 – /
452,496,848 (418,316,326)
Note: Provision for bad debts were made as a result of these long-term uncollected other receivables
were less expected to recover.
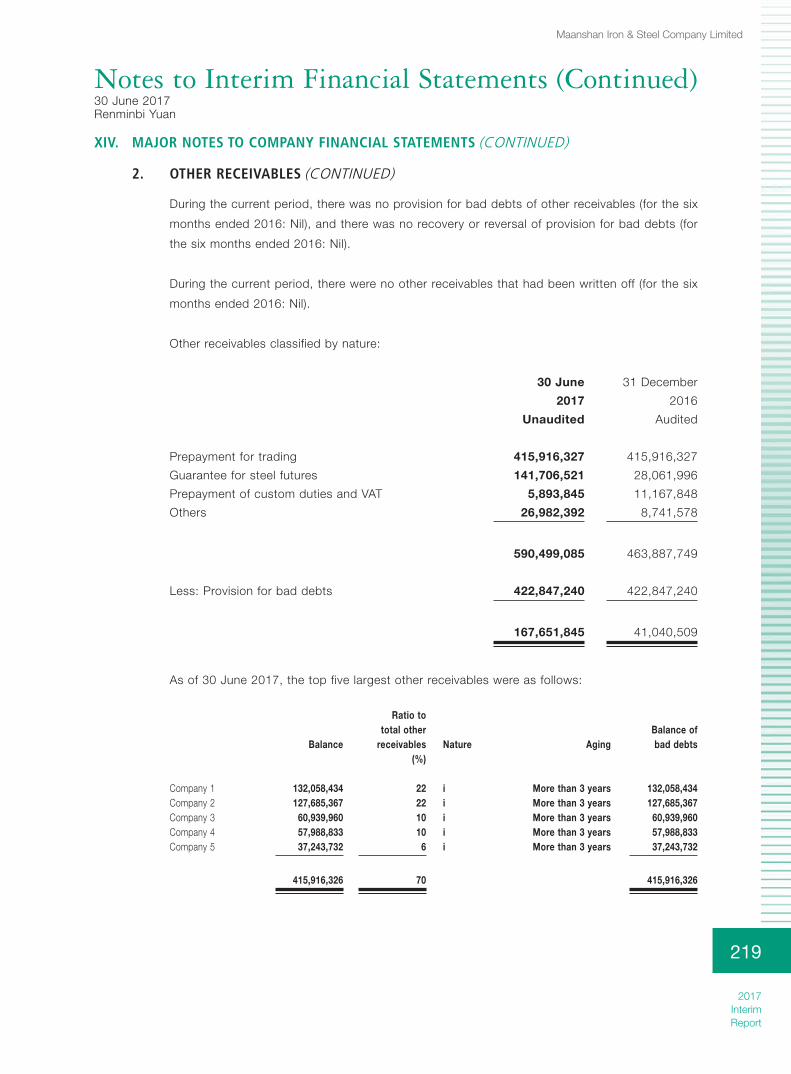
Notes to Interim Financial Statements (Continued)30 June 2017Renminbi Yuan
Maanshan Iron & Steel Company Limited
2017 InterimReport
219
XIV. MAJOR NOTES TO COMPANY FINANCIAL STATEMENTS (CONTINUED)
2. OTHER RECEIVABLES (CONTINUED)
During the current period, there was no provision for bad debts of other receivables (for the six
months ended 2016: Nil), and there was no recovery or reversal of provision for bad debts (for
the six months ended 2016: Nil).
During the current period, there were no other receivables that had been written off (for the six
months ended 2016: Nil).
Other receivables classified by nature:
30 June
2017
31 December
2016
Unaudited Audited
Prepayment for trading 415,916,327 415,916,327
Guarantee for steel futures 141,706,521 28,061,996
Prepayment of custom duties and VAT 5,893,845 11,167,848
Others 26,982,392 8,741,578
590,499,085 463,887,749
Less: Provision for bad debts 422,847,240 422,847,240
167,651,845 41,040,509
As of 30 June 2017, the top five largest other receivables were as follows:
Balance
Ratio to total other
receivables Nature AgingBalance of bad debts
(%)
Company 1 132,058,434 22 i More than 3 years 132,058,434Company 2 127,685,367 22 i More than 3 years 127,685,367Company 3 60,939,960 10 i More than 3 years 60,939,960Company 4 57,988,833 10 i More than 3 years 57,988,833Company 5 37,243,732 6 i More than 3 years 37,243,732
415,916,326 70 415,916,326

Notes to Interim Financial Statements (Continued)30 June 2017Renminbi Yuan
Maanshan Iron & Steel Company Limited
2017 InterimReport
220
XIV. MAJOR NOTES TO COMPANY FINANCIAL STATEMENTS (CONTINUED)
2. OTHER RECEIVABLES (CONTINUED)
As of 31 December 2016, the top five largest other receivables were as follows:
Balance
Ratio to total other
receivables Nature AgingBalance of bad debts
(%)
Company 1 132,058,434 28 i More than 3 years 132,058,434Company 2 127,685,367 28 i More than 3 years 127,685,367Company 3 60,939,960 13 i More than 3 years 60,939,960Company 4 57,988,833 13 i More than 3 years 57,988,833Company 5 37,243,732 8 i More than 3 years 37,243,732
415,916,326 90 415,916,326
i The nature of the other receivables was prepayment for trading.

Notes to Interim Financial Statements (Continued)30 June 2017Renminbi Yuan
Maanshan Iron & Steel Company Limited
2017 InterimReport
221
XIV. MAJOR NOTES TO COMPANY FINANCIAL STATEMENTS (CONTINUED)
3. LONG-TERM EQUITY INVESTMENTS
30 June
2017
31 December
2016
Unaudited Audited
Long-term investments under the equity method
Joint ventures (i) 288,883,135 372,843,538
Associates (i) 1,034,088,700 866,932,775
Long-term investments under the cost method
Subsidiaries (ii) 7,124,265,605 5,972,389,974
Subtotal 8,447,237,440 7,212,166,287
Less: Provision for impairment 60,000,000 60,000,000
Total 8,387,237,440 7,152,166,287
In the opinion of the directors, there was no material restriction on the realisation of investments
as of the balance sheet date.
The movements of impairment provision for long-term investments for the period are disclosed
in Note XIV.4.

Notes to Interim Financial Statements (Continued)30 June 2017Renminbi Yuan
Maanshan Iron & Steel Company Limited
2017 InterimReport
222
XIV. MAJOR NOTES TO COMPANY FINANCIAL STATEMENTS (CONTINUED)
3. LONG-TERM EQUITY INVESTMENTS (CONTINUED)
(i) Joint ventures and associates
30 June 2017 (Unaudited)
Movements during the period
Opening balance Increase Decrease
Investment income under
the equity method
Other comprehensive
income
Other equity
movement
Cash dividend received
Provision for impairment
Closing balance
Impairment at the end of
the period
Joint venturesBOC-Ma Steel 319,018,068 – – 44,214,106 – 109,528 (75,000,000) – 288,341,702 –MASTEEL-CMI 541,433 – – – – – – – 541,433 –Mascometal (Note) 53,284,037 78,431,997 (127,368,631) (4,347,403) – – – – – –
AssociatesHenan Jinma Energy 296,196,390 – – 110,111,926 – 1,261,613 (36,000,000) – 371,569,929 –Shenglong Chemical 309,396,424 – – 84,540,762 – 444,750 – – 394,381,936 –Shanghai Iron and
Steel Electronic 27,120,592 – – 276,442 – – – – 27,397,034 –Xinchuang Economize Resource 43,780,961 – – 3,286,876 – 284 (1,306,391) – 45,761,730 –Anhui Linhuan Chemical 72,000,000 – – – – 712,744 – – 72,712,744 –Ma-Steel OCI Chemical 118,438,408 – – 3,013,884 – 813,035 – – 122,265,327 –
1,239,776,313 78,431,997 (127,368,631) 241,096,593 – 3,341,954 (112,306,391) – 1,322,971,835 –
Note: Please refer to Note V.13 for details.
31 December 2016 (Audited)
Movements during the year
Opening balance Increase Decrease
Investment income under
the equity method
Other comprehensive
income
Other equity
movement
Cash dividend received
Provision for impairment
Closing balance
Impairment at the end of
the year
Joint venturesBOC-Ma Steel 316,030,791 – – 80,857,392 – 1,129,885 (79,000,000) – 319,018,068 –MASTEEL-CMI 539,342 – – 2,091 – – – – 541,433 –Mascometal – 58,171,378 (4,879,915) (7,426) – – – – 53,284,037 –
AssociatesHenan Jinma Energy 241,098,393 – – 77,296,589 – 3,361,408 (25,560,000) – 296,196,390 –Shenglong Chemical 242,402,338 – – 66,810,341 – 183,745 – – 309,396,424 –Shanghai Iron and Steel
Electronic 26,604,521 – – 4,516,071 – – (4,000,000) – 27,120,592 –Xinchuang Economize Resource 35,539,691 – – 3,059,233 – 5,182,037 – – 43,780,961 –Anhui Linhuan Chemical 72,000,000 – – – – – – – 72,000,000 –Ma-Steel OCI Chemical 95,638,431 22,513,793 – 286,184 – – – – 118,438,408 –
1,029,853,507 80,685,171 (4,879,915) 232,820,475 – 9,857,075 (108,560,000) – 1,239,776,313 –
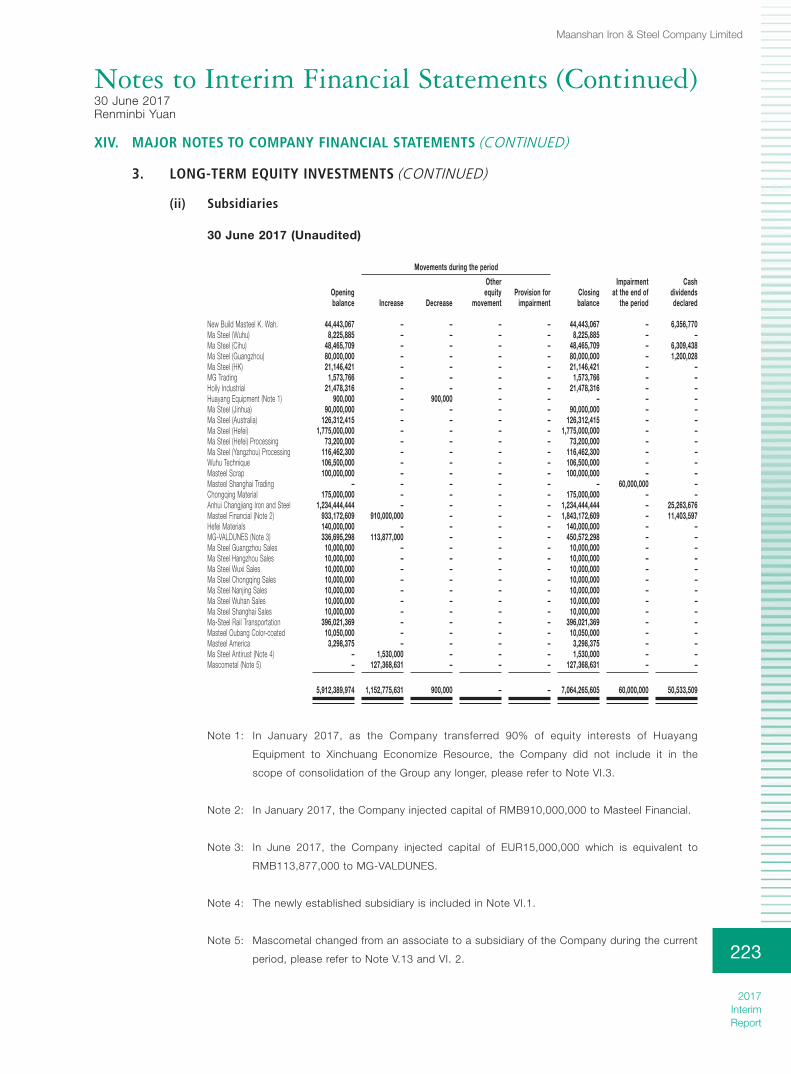
Notes to Interim Financial Statements (Continued)30 June 2017Renminbi Yuan
Maanshan Iron & Steel Company Limited
2017 InterimReport
223
XIV. MAJOR NOTES TO COMPANY FINANCIAL STATEMENTS (CONTINUED)
3. LONG-TERM EQUITY INVESTMENTS (CONTINUED)
(ii) Subsidiaries
30 June 2017 (Unaudited)
Movements during the period
Opening balance Increase Decrease
Other equity
movementProvision for
impairmentClosing balance
Impairment at the end of
the period
Cash dividends declared
New Build Masteel K. Wah. 44,443,067 – – – – 44,443,067 – 6,356,770Ma Steel (Wuhu) 8,225,885 – – – – 8,225,885 – –Ma Steel (Cihu) 48,465,709 – – – – 48,465,709 – 6,309,438Ma Steel (Guangzhou) 80,000,000 – – – – 80,000,000 – 1,200,028Ma Steel (HK) 21,146,421 – – – – 21,146,421 – –MG Trading 1,573,766 – – – – 1,573,766 – –Holly Industrial 21,478,316 – – – – 21,478,316 – –Huayang Equipment (Note 1) 900,000 – 900,000 – – – – –Ma Steel (Jinhua) 90,000,000 – – – – 90,000,000 – –Ma Steel (Australia) 126,312,415 – – – – 126,312,415 – –Ma Steel (Hefei) 1,775,000,000 – – – – 1,775,000,000 – –Ma Steel (Hefei) Processing 73,200,000 – – – – 73,200,000 – –Ma Steel (Yangzhou) Processing 116,462,300 – – – – 116,462,300 – –Wuhu Technique 106,500,000 – – – – 106,500,000 – –Masteel Scrap 100,000,000 – – – – 100,000,000 – –Masteel Shanghai Trading – – – – – – 60,000,000 –Chongqing Material 175,000,000 – – – – 175,000,000 – –Anhui Changjiang Iron and Steel 1,234,444,444 – – – – 1,234,444,444 – 25,263,676Masteel Financial (Note 2) 933,172,609 910,000,000 – – – 1,843,172,609 – 11,403,597Hefei Materials 140,000,000 – – – – 140,000,000 – –MG-VALDUNES (Note 3) 336,695,298 113,877,000 – – – 450,572,298 – –Ma Steel Guangzhou Sales 10,000,000 – – – – 10,000,000 – –Ma Steel Hangzhou Sales 10,000,000 – – – – 10,000,000 – –Ma Steel Wuxi Sales 10,000,000 – – – – 10,000,000 – –Ma Steel Chongqing Sales 10,000,000 – – – – 10,000,000 – –Ma Steel Nanjing Sales 10,000,000 – – – – 10,000,000 – –Ma Steel Wuhan Sales 10,000,000 – – – – 10,000,000 – –Ma Steel Shanghai Sales 10,000,000 – – – – 10,000,000 – –Ma-Steel Rail Transportation 396,021,369 – – – – 396,021,369 – –Masteel Oubang Color-coated 10,050,000 – – – – 10,050,000 – –Masteel America 3,298,375 – – – – 3,298,375 – –Ma Steel Antirust (Note 4) – 1,530,000 – – – 1,530,000 – –Mascometal (Note 5) – 127,368,631 – – – 127,368,631 – –
5,912,389,974 1,152,775,631 900,000 – – 7,064,265,605 60,000,000 50,533,509
Note 1: In January 2017, as the Company transferred 90% of equity interests of Huayang
Equipment to Xinchuang Economize Resource, the Company did not include it in the
scope of consolidation of the Group any longer, please refer to Note VI.3.
Note 2: In January 2017, the Company injected capital of RMB910,000,000 to Masteel Financial.
Note 3: In June 2017, the Company injected capital of EUR15,000,000 which is equivalent to
RMB113,877,000 to MG-VALDUNES.
Note 4: The newly established subsidiary is included in Note VI.1.
Note 5: Mascometal changed from an associate to a subsidiary of the Company during the current
period, please refer to Note V.13 and VI. 2.
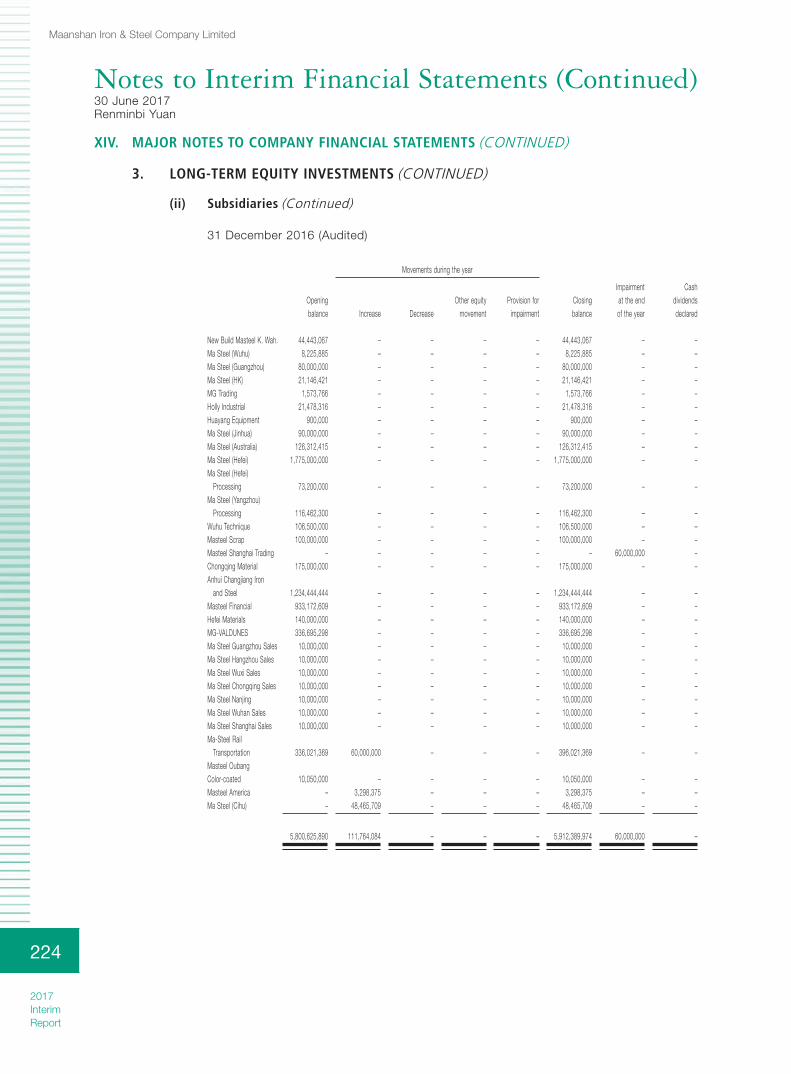
Notes to Interim Financial Statements (Continued)30 June 2017Renminbi Yuan
Maanshan Iron & Steel Company Limited
2017 InterimReport
224
XIV. MAJOR NOTES TO COMPANY FINANCIAL STATEMENTS (CONTINUED)
3. LONG-TERM EQUITY INVESTMENTS (CONTINUED)
(ii) Subsidiaries (Continued)
31 December 2016 (Audited)
Movements during the year
Opening balance Increase Decrease
Other equity movement
Provision for impairment
Closing balance
Impairment at the end of the year
Cash dividends declared
New Build Masteel K. Wah. 44,443,067 – – – – 44,443,067 – –Ma Steel (Wuhu) 8,225,885 – – – – 8,225,885 – –Ma Steel (Guangzhou) 80,000,000 – – – – 80,000,000 – –Ma Steel (HK) 21,146,421 – – – – 21,146,421 – –MG Trading 1,573,766 – – – – 1,573,766 – –Holly Industrial 21,478,316 – – – – 21,478,316 – –Huayang Equipment 900,000 – – – – 900,000 – –Ma Steel (Jinhua) 90,000,000 – – – – 90,000,000 – –Ma Steel (Australia) 126,312,415 – – – – 126,312,415 – –Ma Steel (Hefei) 1,775,000,000 – – – – 1,775,000,000 – –Ma Steel (Hefei)
Processing 73,200,000 – – – – 73,200,000 – –Ma Steel (Yangzhou)
Processing 116,462,300 – – – – 116,462,300 – –Wuhu Technique 106,500,000 – – – – 106,500,000 – –Masteel Scrap 100,000,000 – – – – 100,000,000 – –Masteel Shanghai Trading – – – – – – 60,000,000 –Chongqing Material 175,000,000 – – – – 175,000,000 – –Anhui Changjiang Iron
and Steel 1,234,444,444 – – – – 1,234,444,444 – –Masteel Financial 933,172,609 – – – – 933,172,609 – –Hefei Materials 140,000,000 – – – – 140,000,000 – –MG-VALDUNES 336,695,298 – – – – 336,695,298 – –Ma Steel Guangzhou Sales 10,000,000 – – – – 10,000,000 – –Ma Steel Hangzhou Sales 10,000,000 – – – – 10,000,000 – –Ma Steel Wuxi Sales 10,000,000 – – – – 10,000,000 – –Ma Steel Chongqing Sales 10,000,000 – – – – 10,000,000 – –Ma Steel Nanjing 10,000,000 – – – – 10,000,000 – –Ma Steel Wuhan Sales 10,000,000 – – – – 10,000,000 – –Ma Steel Shanghai Sales 10,000,000 – – – – 10,000,000 – –Ma-Steel Rail
Transportation 336,021,369 60,000,000 – – – 396,021,369 – –Masteel Oubang Color-coated 10,050,000 – – – – 10,050,000 – –Masteel America – 3,298,375 – – – 3,298,375 – –Ma Steel (Cihu) – 48,465,709 – – – 48,465,709 – –
5,800,625,890 111,764,084 – – – 5,912,389,974 60,000,000 –
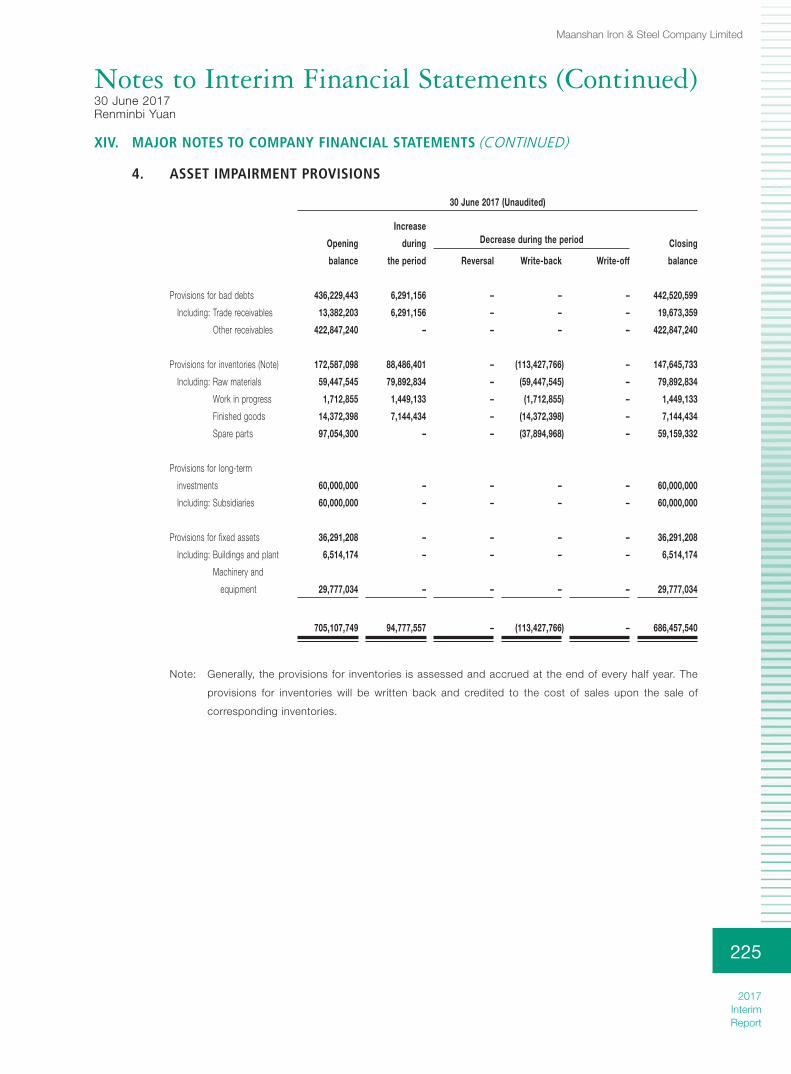
Notes to Interim Financial Statements (Continued)30 June 2017Renminbi Yuan
Maanshan Iron & Steel Company Limited
2017 InterimReport
225
XIV. MAJOR NOTES TO COMPANY FINANCIAL STATEMENTS (CONTINUED)
4. ASSET IMPAIRMENT PROVISIONS
30 June 2017 (Unaudited)
Opening
balance
Increase
during
the period
Decrease during the period Closing
balanceReversal Write-back Write-off
Provisions for bad debts 436,229,443 6,291,156 – – – 442,520,599
Including: Trade receivables 13,382,203 6,291,156 – – – 19,673,359
Other receivables 422,847,240 – – – – 422,847,240
Provisions for inventories (Note) 172,587,098 88,486,401 – (113,427,766) – 147,645,733
Including: Raw materials 59,447,545 79,892,834 – (59,447,545) – 79,892,834
Work in progress 1,712,855 1,449,133 – (1,712,855) – 1,449,133
Finished goods 14,372,398 7,144,434 – (14,372,398) – 7,144,434
Spare parts 97,054,300 – – (37,894,968) – 59,159,332
Provisions for long-term
investments 60,000,000 – – – – 60,000,000
Including: Subsidiaries 60,000,000 – – – – 60,000,000
Provisions for fixed assets 36,291,208 – – – – 36,291,208
Including: Buildings and plant 6,514,174 – – – – 6,514,174
Machinery and
equipment 29,777,034 – – – – 29,777,034
705,107,749 94,777,557 – (113,427,766) – 686,457,540
Note: Generally, the provisions for inventories is assessed and accrued at the end of every half year. The
provisions for inventories will be written back and credited to the cost of sales upon the sale of
corresponding inventories.

Notes to Interim Financial Statements (Continued)30 June 2017Renminbi Yuan
Maanshan Iron & Steel Company Limited
2017 InterimReport
226
XIV. MAJOR NOTES TO COMPANY FINANCIAL STATEMENTS (CONTINUED)
4. ASSET IMPAIRMENT PROVISIONS (CONTINUED)
31 December 2016 (Audited)
Opening
balance
Increase
during
the year
Decrease during the year Closing
balanceReversal Write-back Write-off
Provisions for bad debts 433,543,192 2,686,251 – – – 436,229,443
Including: Trade receivables 13,382,203 – – – – 13,382,203
Other receivables 420,160,989 2,686,251 – – – 422,847,240
Provisions for inventories 650,924,678 883,565,693 – (1,361,903,273) – 172,587,098
Including: Raw materials 333,960,186 410,086,420 – (684,599,061) – 59,447,545
Work in progress 86,639,975 136,107,577 – (221,034,697) – 1,712,855
Finished products 170,751,556 299,376,796 – (455,755,954) – 14,372,398
Spare parts 59,572,961 37,994,900 – (513,561) – 97,054,300
Provisions for long-term
investments 60,000,000 – – – – 60,000,000
Including: Subsidiaries 60,000,000 – – – – 60,000,000
Provisions for fixed assets – 36,291,208 – – – 36,291,208
Including: Buildings and plant – 6,514,174 – – – 6,514,174
Machinery and
equipment – 29,777,034 – – – 29,777,034
1,144,467,870 922,543,152 – (1,361,903,273) – 705,107,749
5. REVENUE AND COST OF SALES
For the six months ended 30 June
2017
Unaudited
2016
Unaudited
Revenue Cost of sales Revenue Cost of sales
Principal operating income 28,812,859,261 26,489,292,378 17,719,002,669 15,403,616,320
Other operating income 373,772,191 373,628,838 339,109,052 354,046,067
29,186,631,452 26,862,921,216 18,058,111,721 15,757,662,387

Notes to Interim Financial Statements (Continued)30 June 2017Renminbi Yuan
Maanshan Iron & Steel Company Limited
2017 InterimReport
227
XIV. MAJOR NOTES TO COMPANY FINANCIAL STATEMENTS (CONTINUED)
5. REVENUE AND COST OF SALES (CONTINUED)
Principal operating income is presented as follows:
For the six months
ended 30 June
2017 2016
Unaudited Unaudited
Sale of products 29,164,896,323 18,039,321,411
Rendering service 21,735,129 18,790,310
29,186,631,452 18,058,111,721
6. INVESTMENT INCOME
For the six months
ended 30 June
2017 2016
Unaudited Unaudited
Long-term equity investment income
under the equity method 241,096,593 69,346,926
Long-term equity investment income
under the cost method 50,533,509 –
Investment income from disposal of a subsidiary 7,796,084 –
Investment income from available-for-sale
financial assets during the holding period 1,540,000 –
Investment loss from disposal of financial assets
at fair value through profit or loss (2,992,563) (2,253,134)
297,973,623 67,093,792
* During the current period, the Company’s investment income from unlisted companies amounted
to RMB297,973,623 (for the six months ended 30 June 2016: investment income from unlisted
companies amounted to RMB67,093,792).
As of 30 June 2017 and 31 December 2016, there was no significant restriction imposed upon
the remittance of the Company’s investment income.

Maanshan Iron & Steel Company Limited
2017 InterimReport
228
Supplementary Information30 June 2017Renminbi Yuan
1. BREAKDOWN OF NON-RECURRING GAINS OR LOSSES
The calculation of non-recurring gains or losses is in accordance with “Regulation for the preparation
of information disclosure by listed securities companies No.1 – Non-recurring Gains or Losses (2008
revised)” (No.43 [2008]) issued by the CSRC.
For the
six months
ended 30 June
2017
Unaudited
Items of non-recurring gains or losses
Gain or loss on disposal of non-current assets (42,907,112)
Government grants unrelated to daily operation 68,914,690
Other net non-operating loss, exclude items above (6,603,579)
Government grants related to daily operation 83,563,376
Employee termination compensation (Note) (46,825,916)
Reversal of provision for receivables assessed for impairment individually 1,207,196
Gain on fair value changes of financial assets at fair value through profit or loss 14,148,342
Investment income from disposal of a subsidiary 736,943
Investment income from disposal of available-for-sale financial investments 26,066,785
Investment income from disposal of financial assets
at fair value through profit or loss 17,187,696
115,488,421
Less: Income tax effect of non-recurring gains or losses 2,476,392
Non-recurring gains or losses attributable to minority shareholders 734,663
Net effect of non-recurring gains or losses 112,277,366
Net profit attributable to owners of the parent excluding
non-recurring gains or losses
Net profit attributable to owners of the parent 1,643,396,514
Less: net effect of non-recurring gains or losses 112,277,366
Net profit attributable to owners of the parent
excluding non-recurring gains or losses 1,531,119,148
Note: Employee termination compensation is the employee settlement due to addressing overcapacity plan and
human resource optimisation during the current period.
Supplementary Information
30 June 2017
Renminbi Yuan

Supplementary Information (Continued)30 June 2017Renminbi Yuan
Maanshan Iron & Steel Company Limited
2017 InterimReport
229
2. RETURN ON NET ASSETS AND EARNINGS PER SHARE
For the six months ended 30 June 2017 (Unaudited)
Return on
weighted
average
net assets (%) Earnings per share (RMB)
Basic Diluted
Net profit attributable to owners of
the Company 7.98 0.213 0.213
Net profit attributable to owners of
the Company excluding
non-recurring gains or losses 7.44 0.199 0.199
For the six months ended 30 June 2016 (Unaudited)
Return on
weighted
average
net assets (%) Earnings per share (RMB)
Basic Diluted
Net profit attributable to owners of
the Company 2.42 0.059 0.059
Net loss attributable to owners of
the Company excluding
non-recurring gains or losses 2.51 0.061 0.061
Return on net assets and earnings per share are calculated based on the formula stipulated in
the “Regulation for the preparation of information disclosure for listed securities companies [2010]
No.9 – Calculation and disclosure of return on net assets and earnings per share” (2010 revised)
issued by the CSRC.

Maanshan Iron & Steel Company Limited
2017 InterimReport
230
IX. Documents Available For Inspection
1. Interim report signed by Chairman of the Company;
2. Financial reports signed and stamped by the Company’s legal representative, chief accountant and
head of Accounting Department;
3. Original copies of all documents and announcements of the Company disclosed in newspapers
designated by the CSRC during the reporting period;
4. The Company’s Articles of Association;
5. Interim report disclosed in other securities market;
6. Other related information.
Chairman: Ding Yi
Submission date approved by the Board of Directors: 2017-8-23
IX. Documents Available For Inspection