internationalisation of the food industry in the baltic region tapani yrjölä pellervo economic...
TRANSCRIPT
Internationalisation of the food industry in the Baltic Region
Tapani YrjöläPellervo Economic Research Institute PTT
YEMCo Meeting, GothenburgNov 24, 2007
Outline
• PTT• Internationalisation• M&A’s• Forecasts
Pellervo Economic Research Institute PTT
• Non-profit economic research institute• Est. 1979• Owners:
– Central Union of Agricultural Producers and Forest Owners
– Finn COOP Pellervo– Commercial cooperatives
• Budget: 1,8 M€ (2007)• 20-22 employees
Pellervo Economic Research Institute PTT
• Research focus:– General economics
• Public sector• Regional development• Entrepreneurship and cooperative enterprises
– Agricultural and food economics• Viability of Finnish agriculture• Competitiveness of Finnish food industry
– Forestry economics
PTT ongoing agrifood research projects
• Changes in management on Finnish farms
• Agricultural trade agreements (TRADEAG)
• Financial risks on Finnish farms• Anticipation of future political
operational environment of agriculture (MAPTEN)
PTT ongoing agrifood research projects
• Effects of choices of technology on costs on cattle farms (TEKNOTILA)
• Effects of the removal of milk quotas on EU and Finnish Dairy market
• Regional bioenergy potential (BIOREG)• Ex post evaluation of the rural
development scheme 2000-2006• The effects of the market changes on
food industry
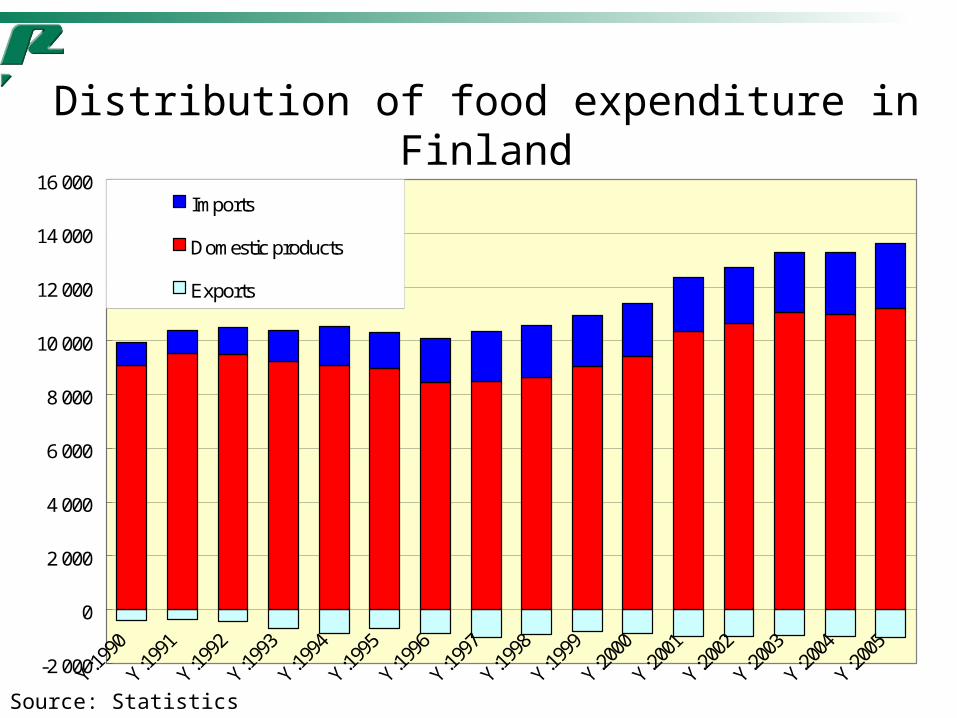
Distribution of food expenditure in Finland
-2 000
0
2 000
4 000
6 000
8 000
10 000
12 000
14 000
16 000Imports
Domestic products
Exports
Source: Statistics Finland
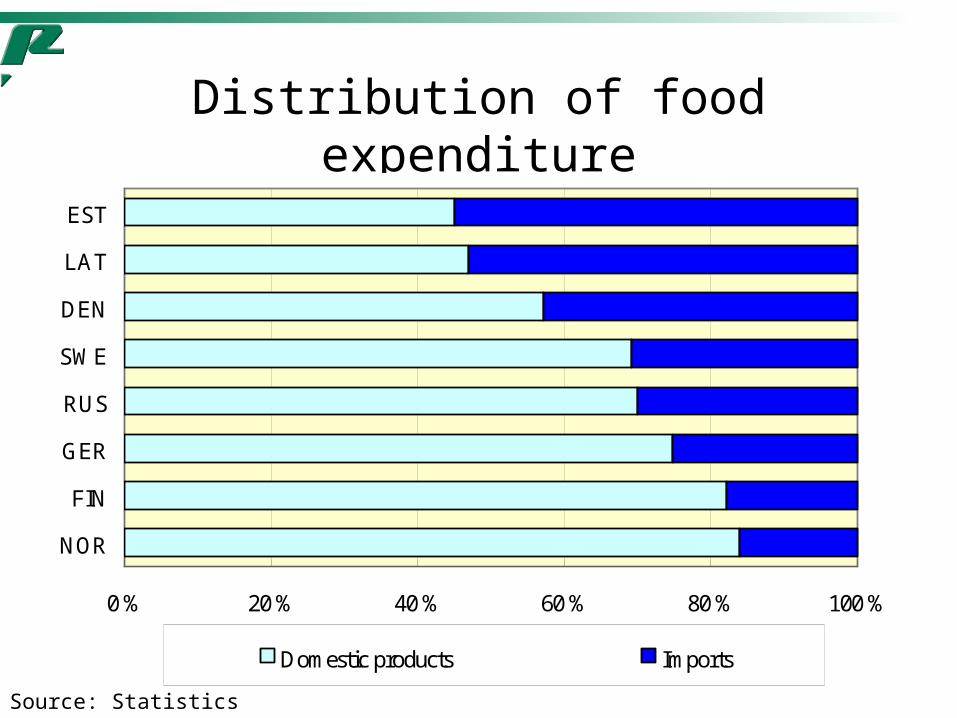
Distribution of food expenditure
0 % 20 % 40 % 60 % 80 % 100 %
NOR
FIN
GER
RUS
SWE
DEN
LAT
EST
Domestic products Imports
Source: Statistics offices
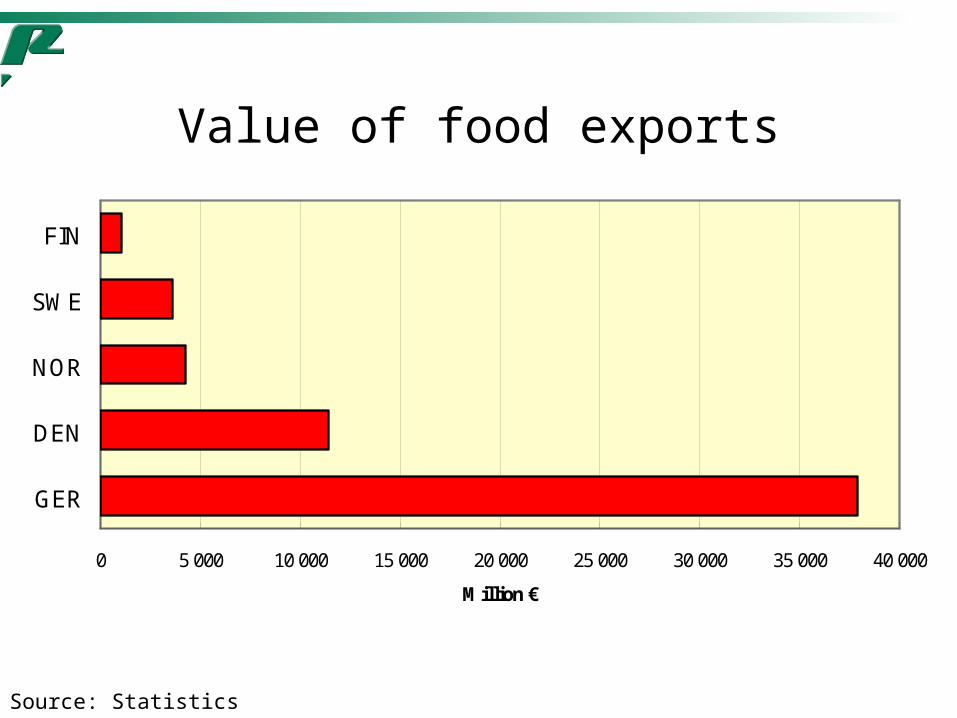
Value of food exports
Source: Statistics offices
0 5 000 10 000 15 000 20 000 25 000 30 000 35 000 40 000
GER
DEN
NOR
SWE
FIN
Million €
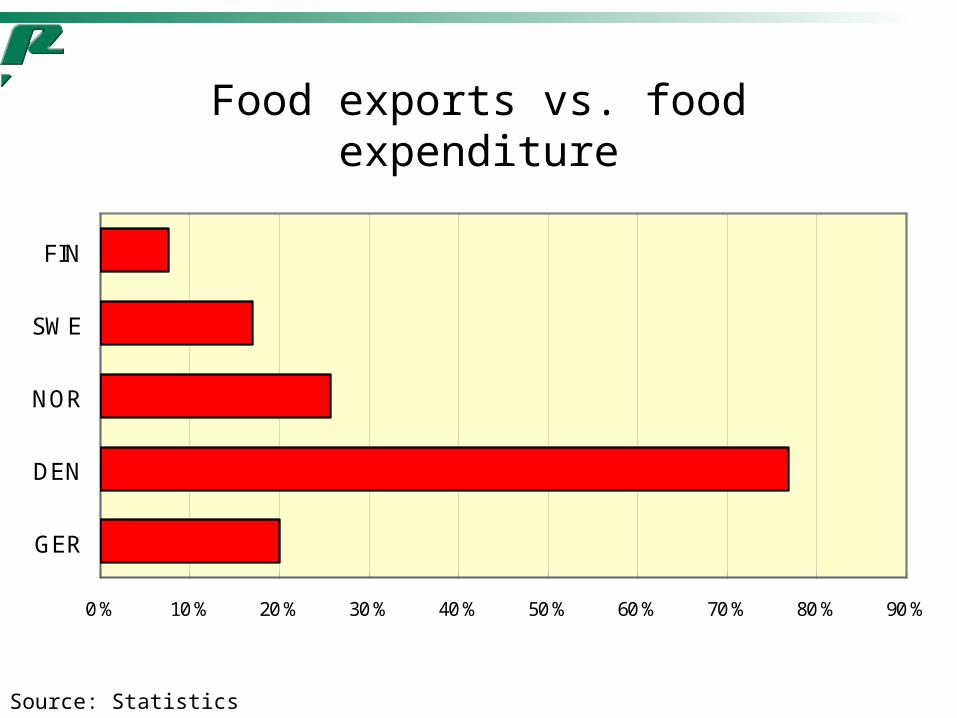
Food exports vs. food expenditure
Source: Statistics offices
0 % 10 % 20 % 30 % 40 % 50 % 60 % 70 % 80 % 90 %
GER
DEN
NOR
SWE
FIN
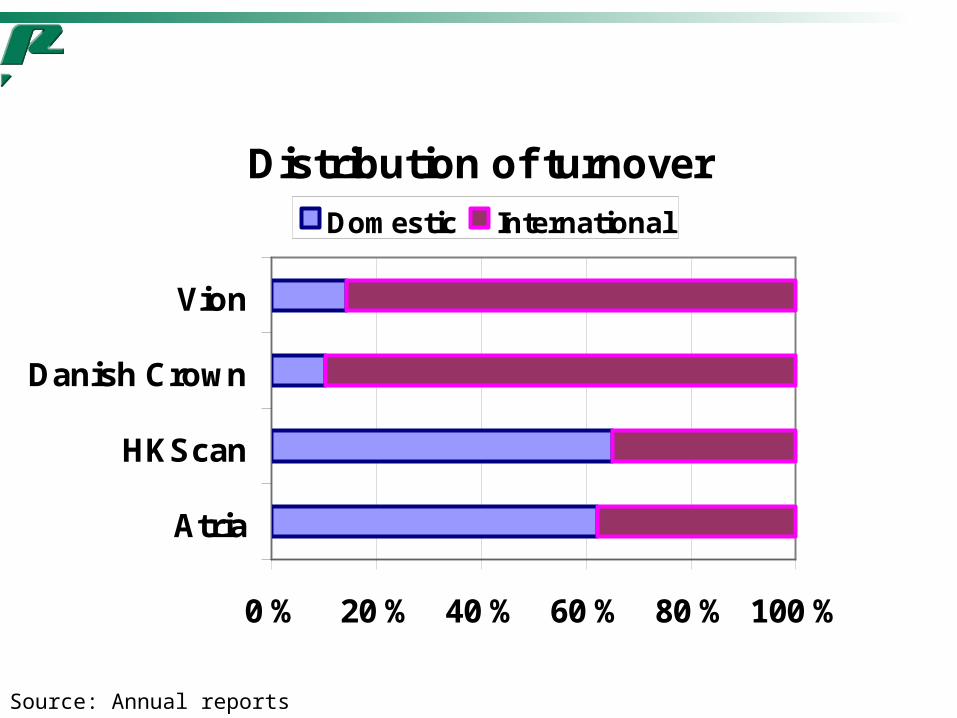
Distribution of turnover
0 % 20 % 40 % 60 % 80 % 100 %
Atria
HKScan
Danish Crown
Vion
Domestic International
Source: Annual reports
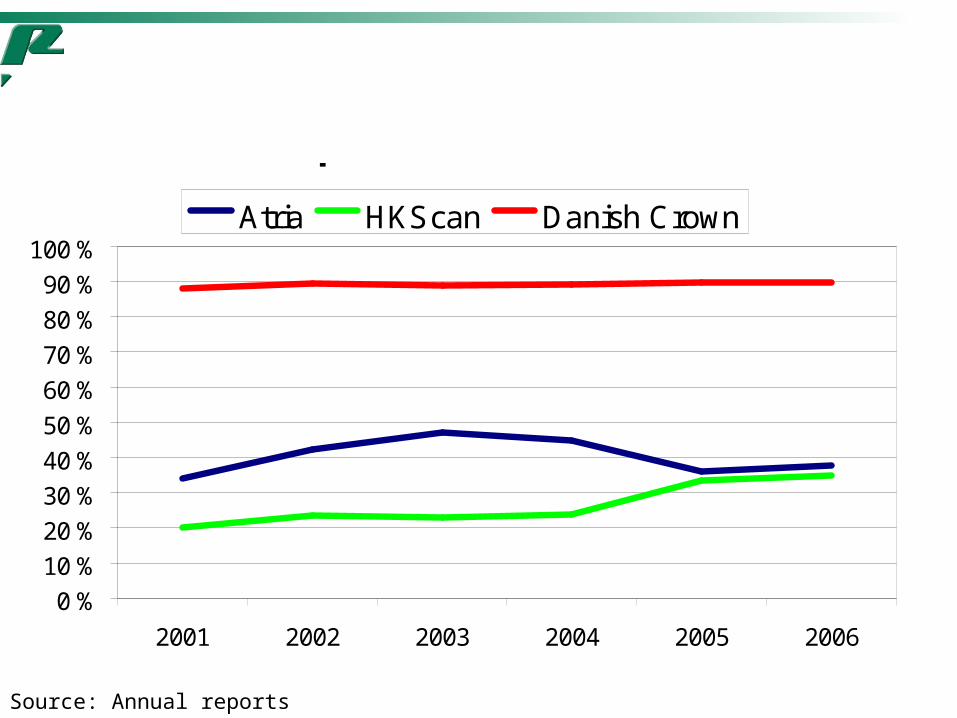
Source: Annual reports
0 %
10 %
20 %
30 %
40 %
50 %
60 %
70 %
80 %
90 %
100 %
2001 2002 2003 2004 2005 2006
Atria HKScan Danish Crown
International operation's share of turnover
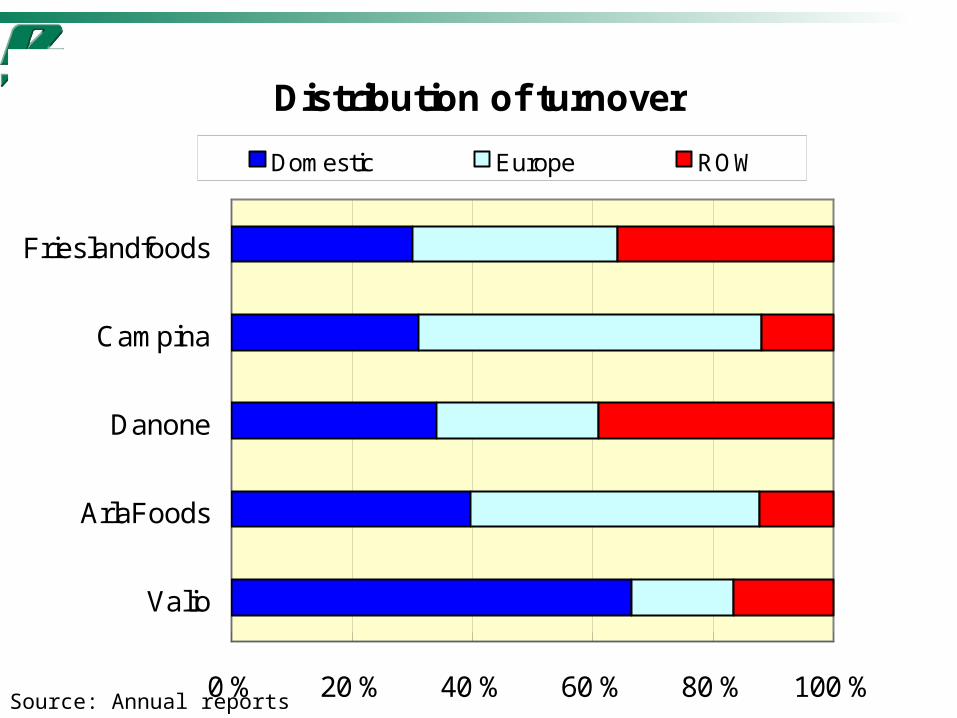
Distribution of turnover
0 % 20 % 40 % 60 % 80 % 100 %
Valio
ArlaFoods
Danone
Campina
Frieslandfoods
Domestic Europe ROW
Source: Annual reports

0 %
10 %
20 %
30 %
40 %
50 %
60 %
2001 2002 2003 2004 2005 2006
Valio Ingman Arla Foods
International operation's share of turnover
Source: Annual reports
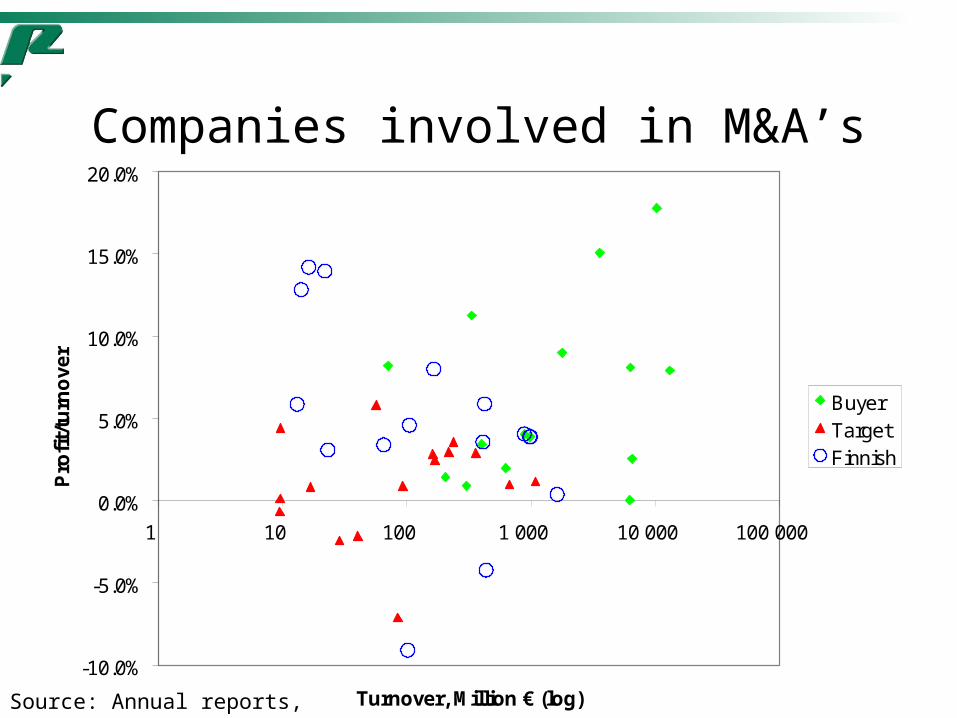
Companies involved in M&A’s
-10.0%
-5.0%
0.0%
5.0%
10.0%
15.0%
20.0%
1 10 100 1 000 10 000 100 000
Turnover, Million € (log)
Pro
fit/
turn
ove
r
BuyerTargetFinnish
Source: Annual reports, D&B
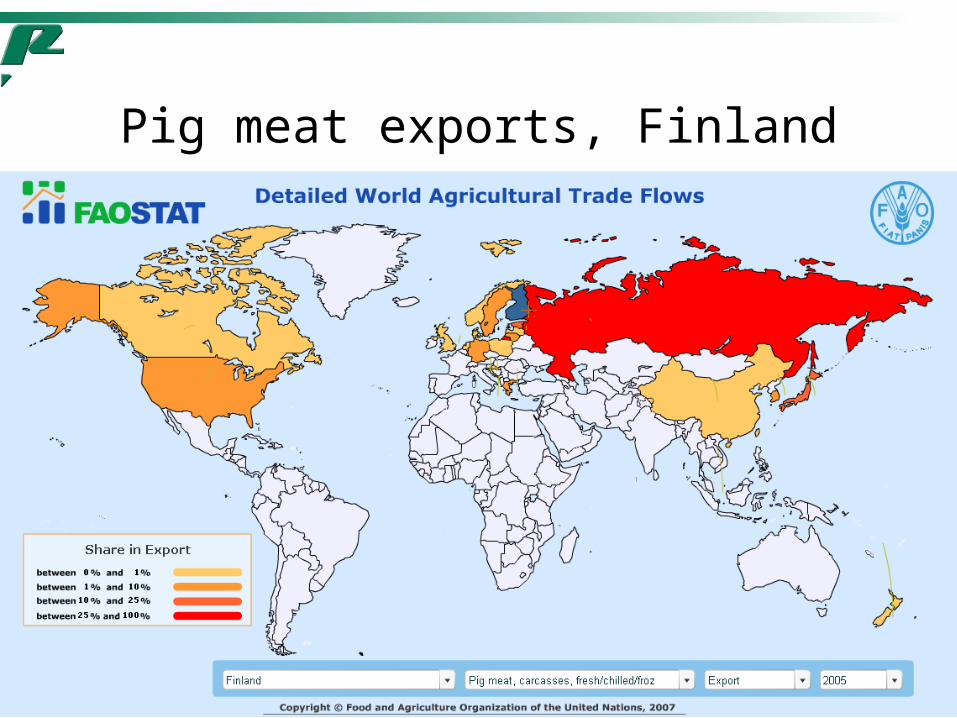
Pig meat exports, Finland
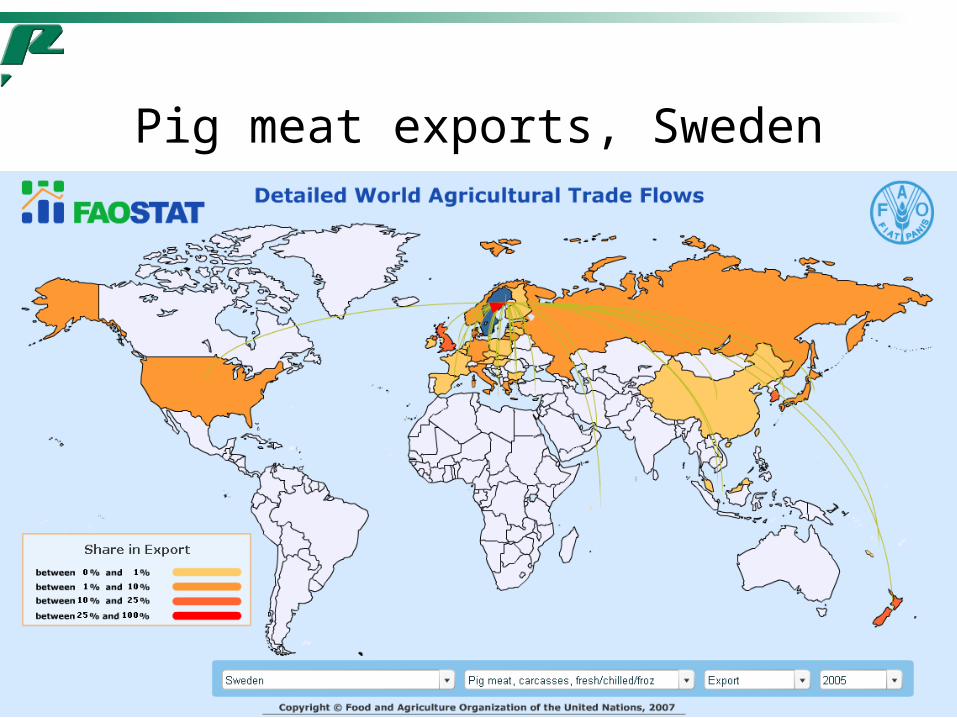
Pig meat exports, Sweden
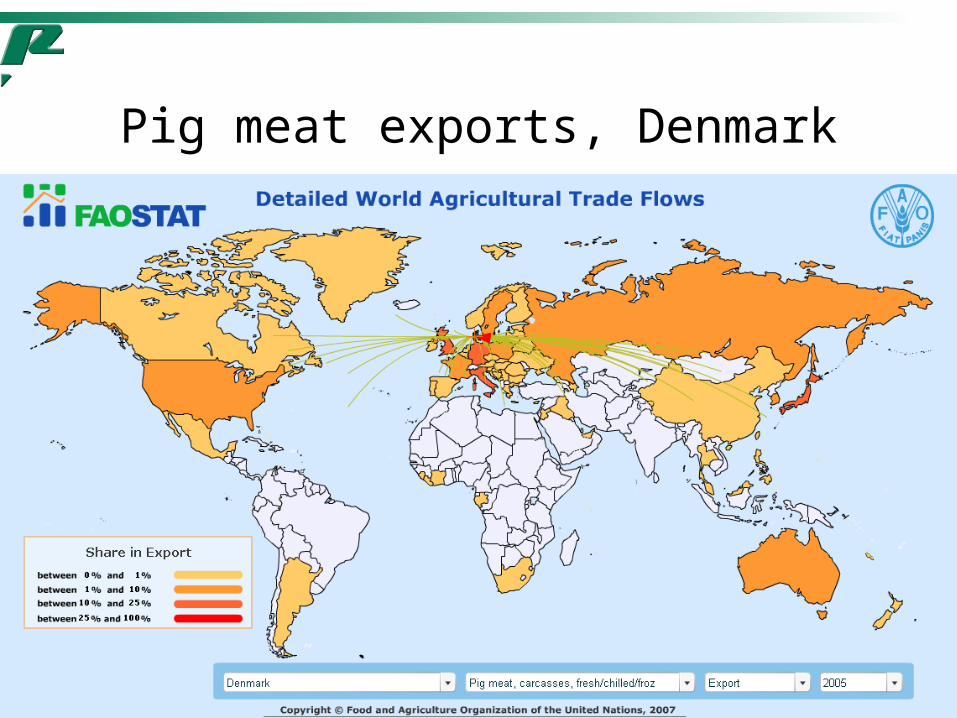
Pig meat exports, Denmark
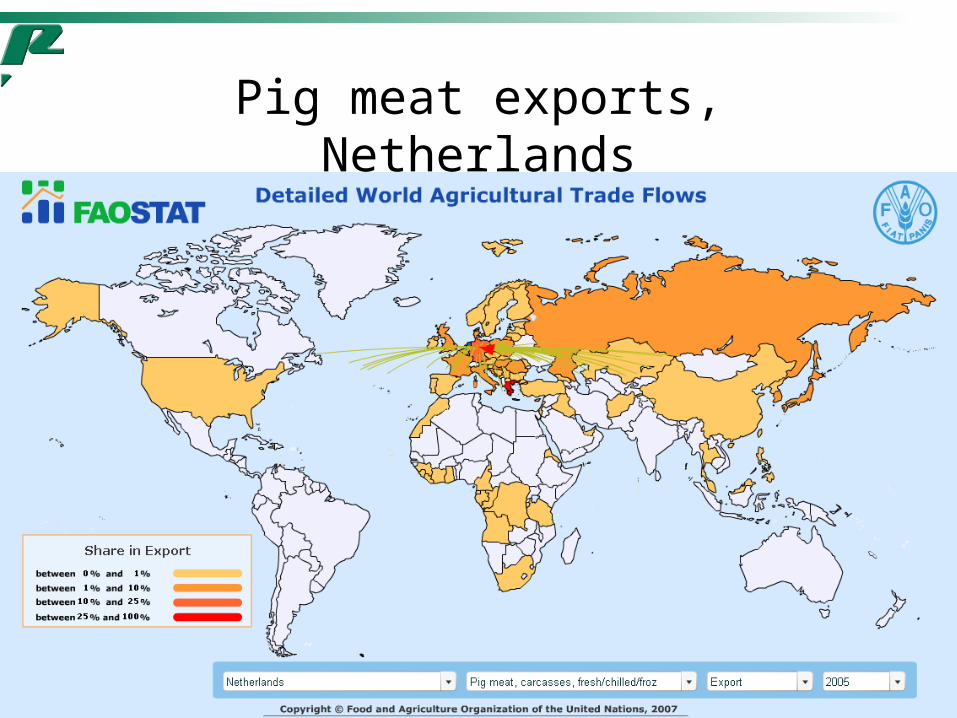
Pig meat exports, Netherlands
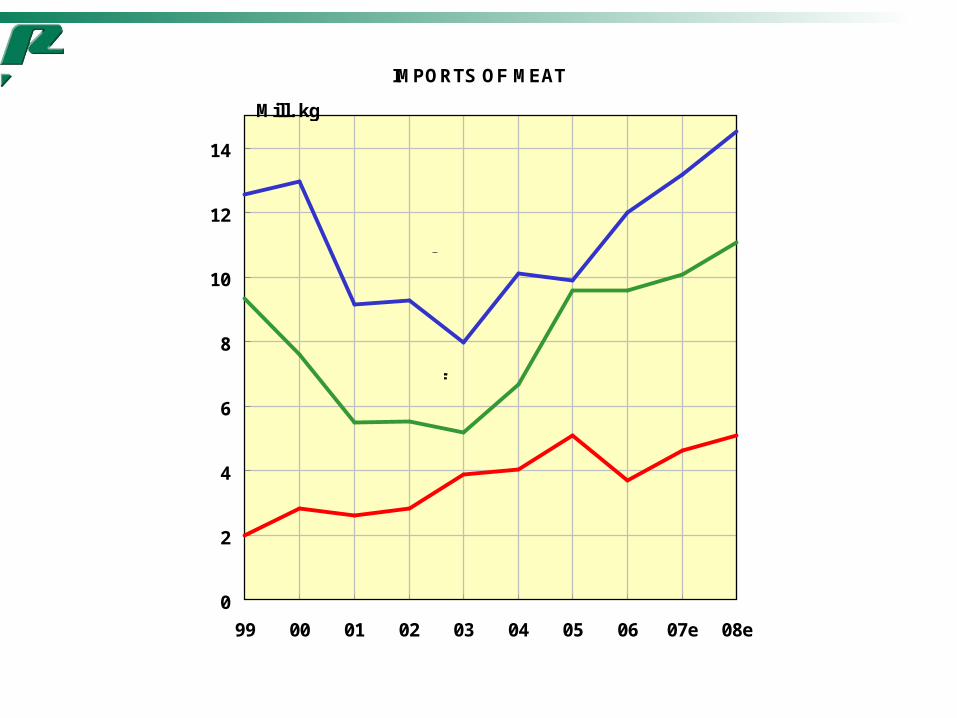
IMPORTS OF MEAT
0
2
4
6
8
10
12
14
99 00 01 02 03 04 05 06 07e 08e
Mill. kg
Pigmeat
Beef
Source: National Board of Customs, forecast PTT
Poultry
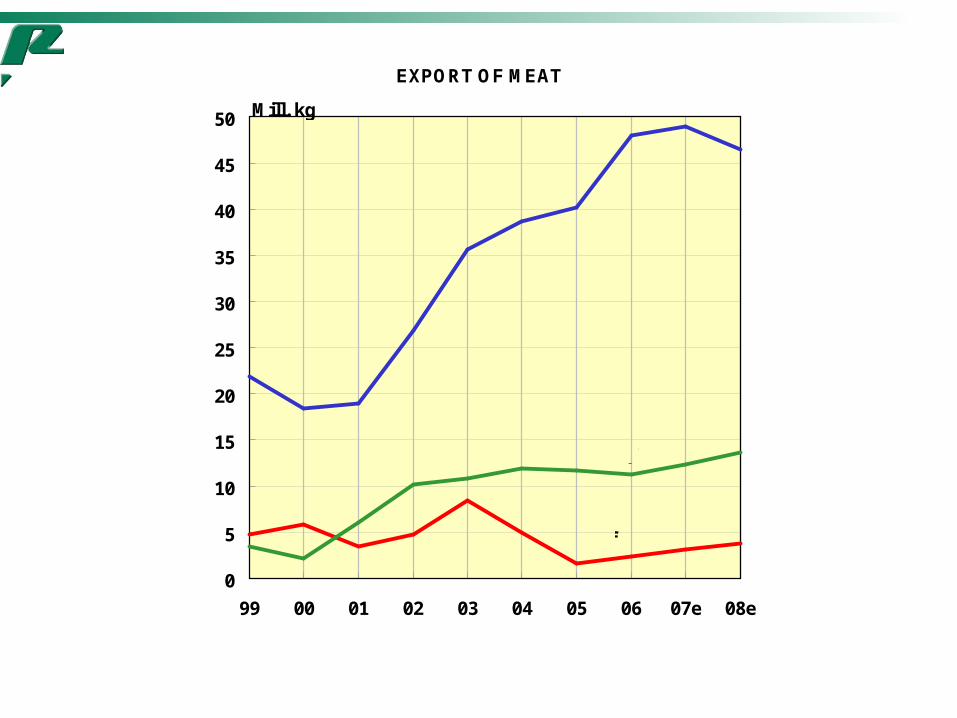
EXPORT OF MEAT
0
5
10
15
20
25
30
35
40
45
50
99 00 01 02 03 04 05 06 07e 08e
Mill. kg
Poultry
Pork
Beef
Source: National Board of Customs, forecast PTT
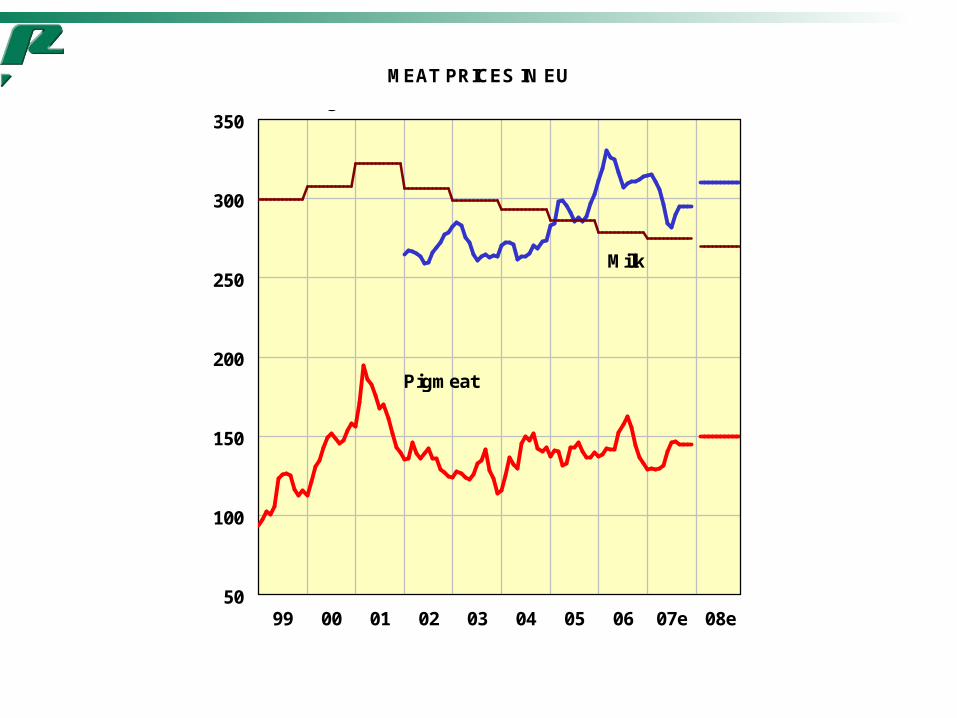
MEAT PRICES IN EU
99 00 01 02 03 04 05 06 07e 08e50
100
150
200
250
300
350
Pigmeat
Source: European Commission, forecast PTT
€/100 kg
Beef
Milk
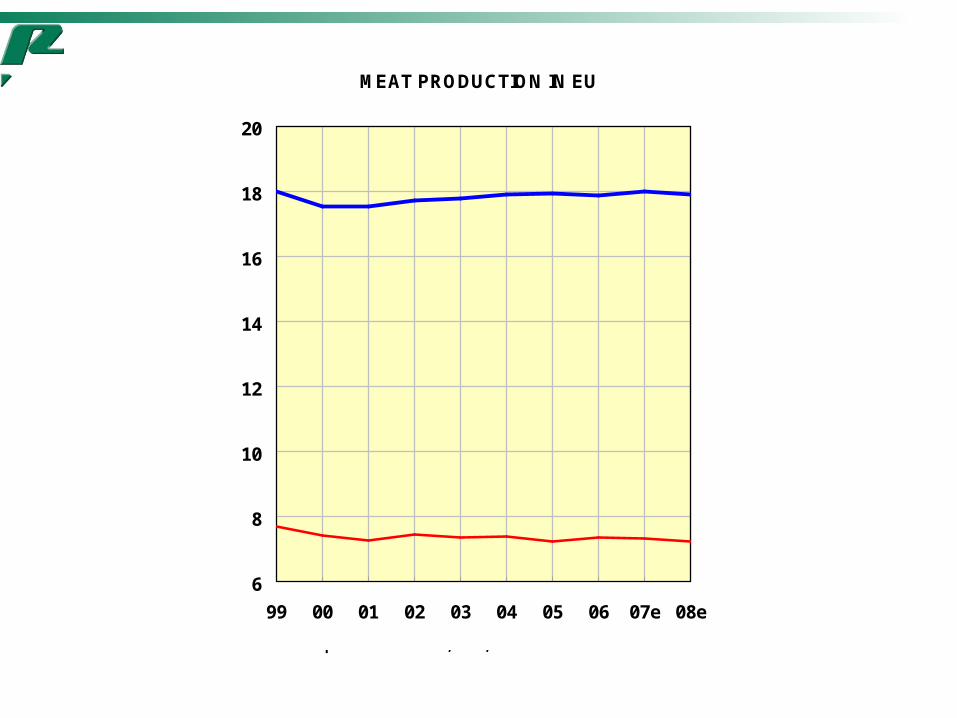
MEAT PRODUCTION IN EU
6
8
10
12
14
16
18
20
99 00 01 02 03 04 05 06 07e 08e
Mill. tonnes
Pigmeat
Beef
Source: European Commission, ZMP, forecast PTT
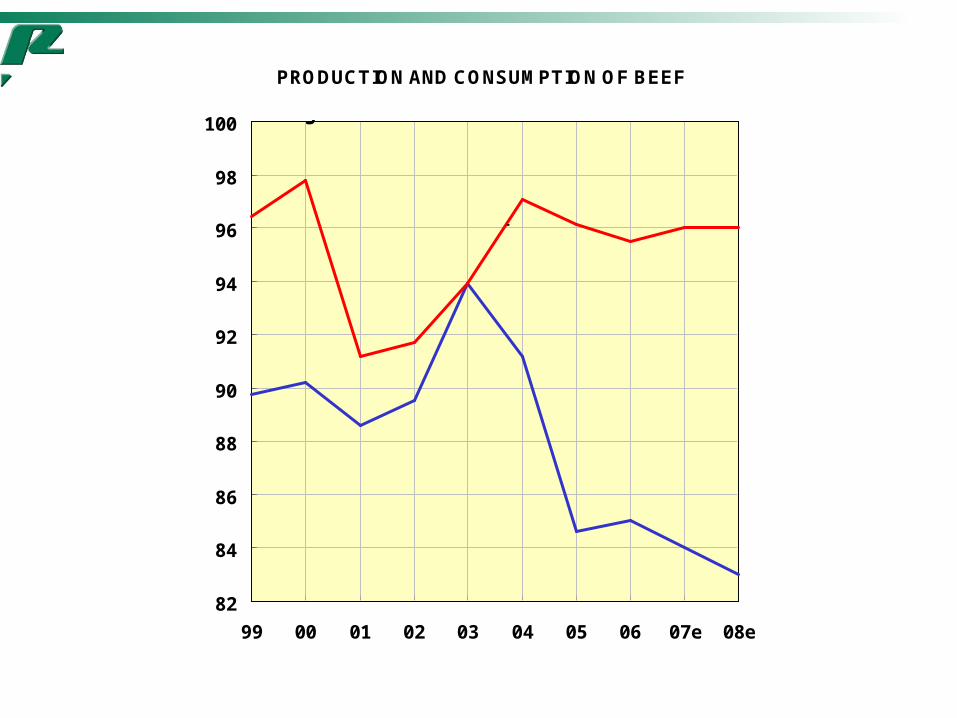
PRODUCTION AND CONSUMPTION OF BEEF
82
84
86
88
90
92
94
96
98
100
99 00 01 02 03 04 05 06 07e 08e
Mill. kg
Consumption
Production
Source: MMM, Gallup Elintarviketieto, forecast PTT
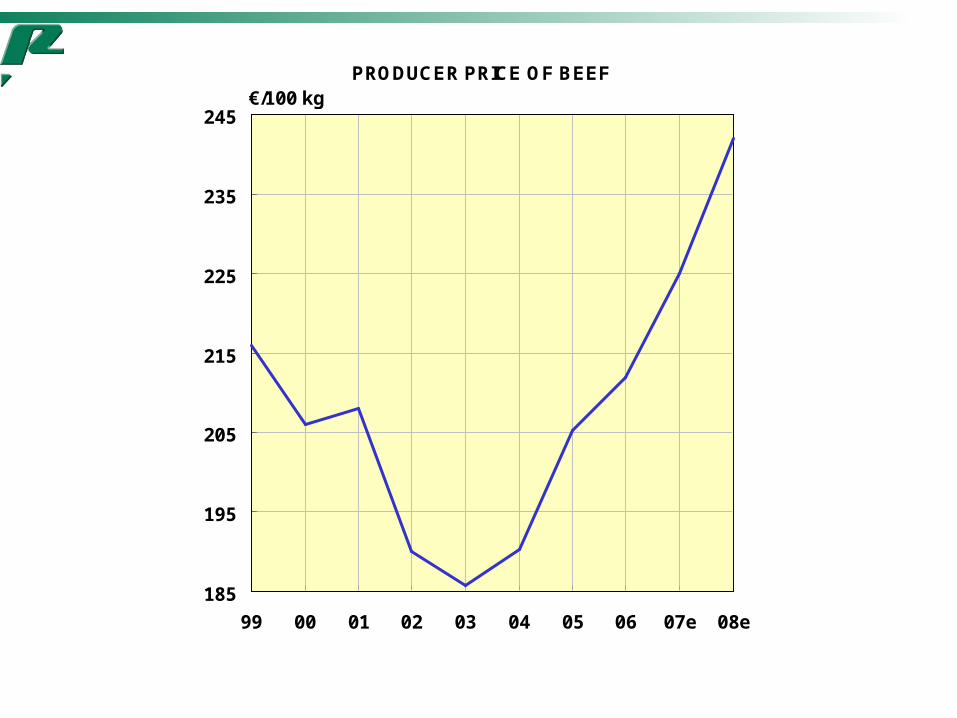
PRODUCER PRICE OF BEEF
185
195
205
215
225
235
245
99 00 01 02 03 04 05 06 07e 08e
Source: MMM, forecast PTT
€/100 kg
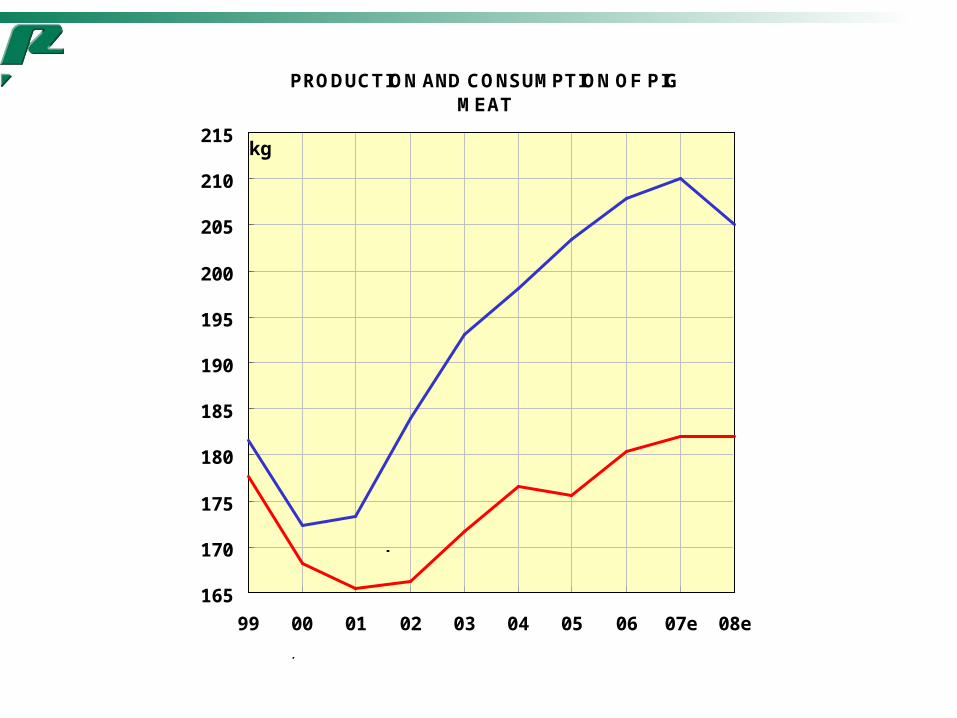
PRODUCTION AND CONSUMPTION OF PIG MEAT
165
170
175
180
185
190
195
200
205
210
215
99 00 01 02 03 04 05 06 07e 08e
Mill. kg
Consumption
Production
Source: MMM, forecast PTT
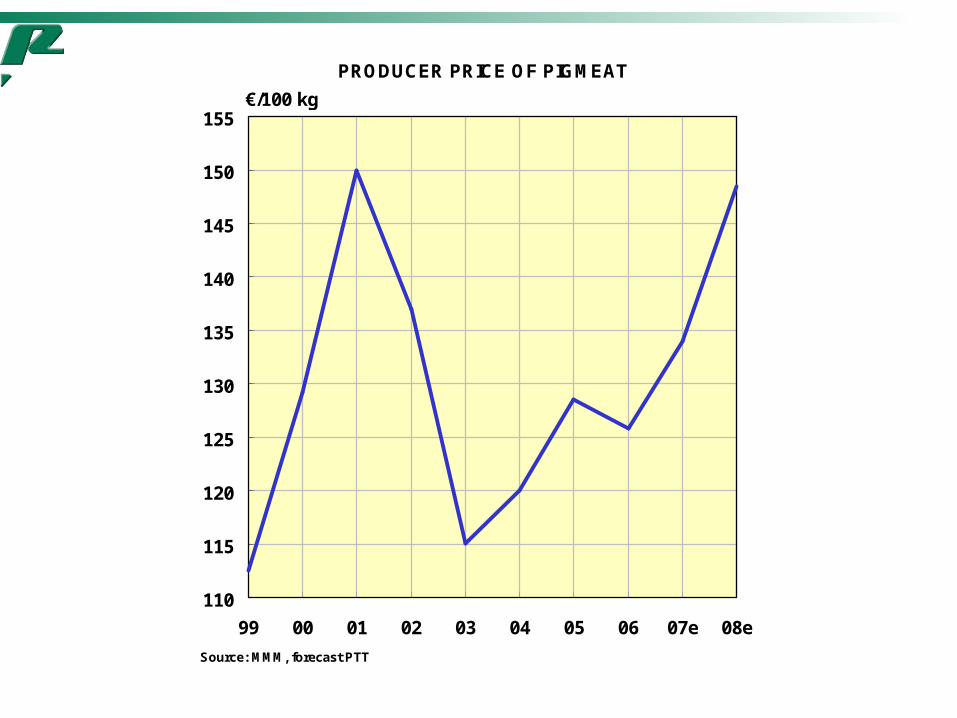
PRODUCER PRICE OF PIGMEAT
110
115
120
125
130
135
140
145
150
155
99 00 01 02 03 04 05 06 07e 08e
€/100 kg
Source: MMM, forecast PTT
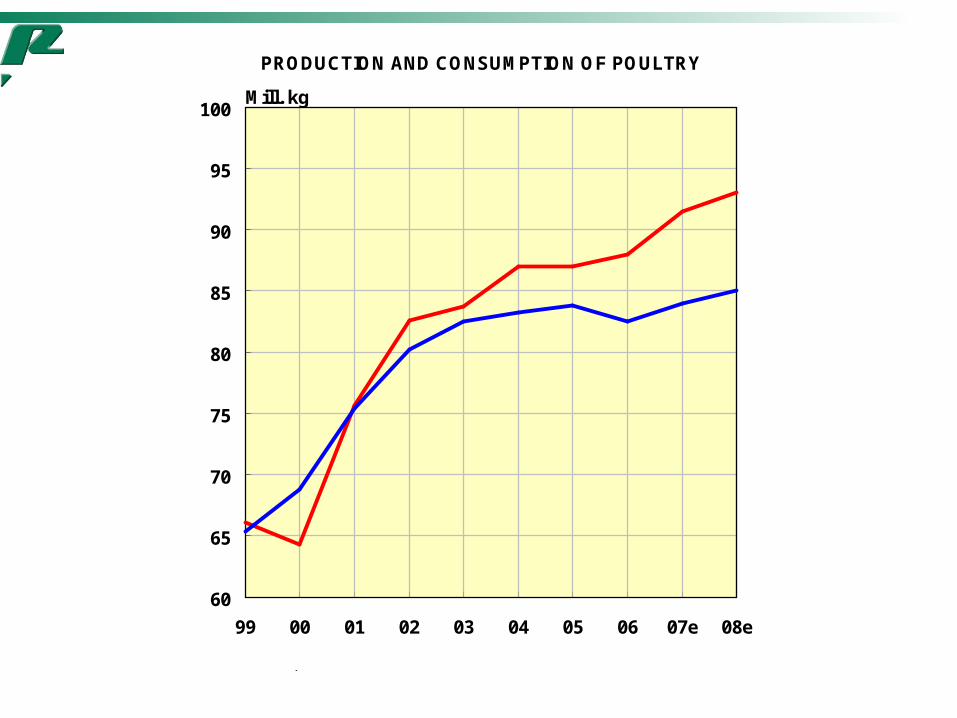
PRODUCTION AND CONSUMPTION OF POULTRY
60
65
70
75
80
85
90
95
100
99 00 01 02 03 04 05 06 07e 08e
Mill. kg
Consumption
Production
Source: MMM, forecast PTT
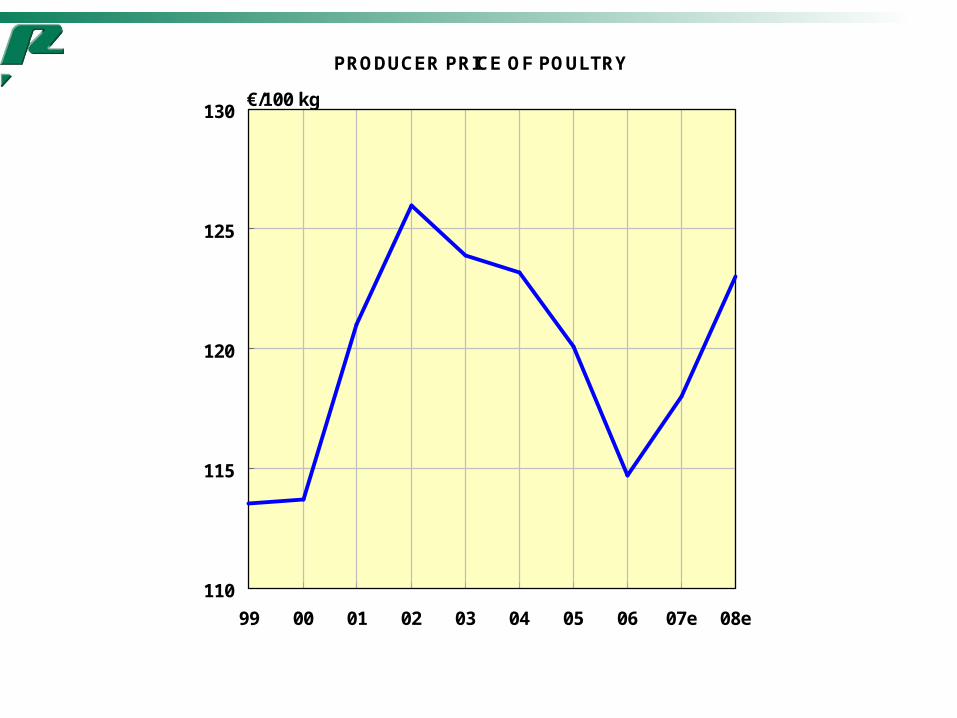
PRODUCER PRICE OF POULTRY
110
115
120
125
130
99 00 01 02 03 04 05 06 07e 08e
€/100 kg
Source: MMM, forecast PTT