it dc center icrisat development
TRANSCRIPT

Farmer Producer Organization In Andhra Pradesh: A Scoping Study
ISBN 978-92-9066-592-2
ICRISAT-India (Headquarters)Patancheru, Telangana, [email protected]
ICRISAT-India Liaison OfficeNew Delhi, India
ICRISAT-NigeriaKano, [email protected]
ICRISAT-MalawiLilongwe, [email protected], [email protected]
ICRISAT-NigerNiamey, [email protected]
ICRISAT-EthiopiaAddis Ababa, [email protected]
ICRISAT works in agricultural research for development across the drylands of Africa and Asia, making farming profitable for smallholder farmers while reducing malnutrition and environmental degradation.
We work across the entire value chain from developing new varieties to agri-business and linking farmers to markets.
ICRISAT appreciates the support of CGIAR investors to help overcome poverty, malnutrition and environmental degradation in the harshest dryland regions of the world. See http://www.icrisat.org/icrisat-donors.htm for full list of donors.
About ICRISAT: www.icrisat.org ICRISAT’s scientific information: EXPLOREit.icrisat.org
We believe all people have a right to nutritious food and a better livelihood.
ICRISAT-Mali (Regional hub WCA)Bamako, [email protected]
ICRISAT-ZimbabweBulawayo, [email protected]
ICRISAT-Kenya (Regional hub ESA)Nairobi, [email protected]
/ICRISAT /ICRISAT /ICRISATco/company/ ICRISAT
/PHOTOS/ ICRISATIMAGES /ICRISATSMCO
01-2017
Rythu Kosam Project
Research Report IDC-16ICRISAT Development Center
DC ICRISAT DEVELOPMENT CENTER

Citation: Raju KV, Kumar R, Vikraman S, Moses Shyam D, Srikanth R, Kumara Charyulu D and Wani SP. 2017. Farmer Producer Organization in Andhra Pradesh: A Scoping Study. Rythu Kosam Project. Research Report IDC-16. Patancheru 502 324. Telangana, India: International Crops Research Institute for the Semi-Arid Tropics. 160 pp. ISBN 978-92-9066-592-2
ICRISAT holds the copyright to its publications, but these can be shared and duplicated for non-commercial purposes. Permission to make digital or hard copies of part(s) or all of any publication for non-commercial use is hereby granted as long as ICRISAT is properly cited. For any clarification, please contact the Director of Strategic Marketing and Communication at [email protected]. Department of Agriculture, Government of India and ICRISAT’s name and logo are registered trademarks and may not be used without permission. You may not alter or remove any trademark, copyright or other notice
© International Crops Research Institute for the Semi-Arid Tropics (ICRISAT), 2017. All rights reserved.
Cover page photos:
This report is available at http://oar.icrisat.org/9870
Prawns, Turmeric, Jasmine flowers and Banana: KV Raju, ICRISATGroundnuts: Rajesh Nune, ICRISAT

Farmer Producer OrganizationIn Andhra Pradesh: A Scoping Study
KV Raju, Ranjit Kumar, Surjit Vikraman, Moses Shyam, Srikanth R, D Kumara Charyulu and Suhas P Wani
Rythu Kosam Project
DC ICRISAT DEVELOPMENT CENTER


Message
The Government of Andhra Pradesh has envisaged, “Sunrise Andhra Pradesh: Vision 2029 to promote a happy, inclusive and globally competitive society”. As part of this, the state has set up seven missions and the Primary Sector Mission is one of them. To begin with, the state in collaboration with the International Crops Research Institute for the Semi-Arid Tropics (ICRISAT) has developed a strategy for Primary Sector development to enable double-digit growth in the Primary Sector across its 13 districts of the state.
In order to improve welfare and living standards of farmers, particularly small holders, the government wishes to create an appropriate ecosystem in the state. Certain commodities are identified for providing necessary support system for the entire products and creating value chain. In this entire process, one of the important elements is by promoting innovative institution for farmers to support this transformation. Considering this, the Government of Andhra Pradesh (GoAP) based on a series of consultations with public and private organizations, experts, NGOs and farmers, had brought out the Policy and Operational Guidelines to promote Farmer Producers Organizations (FPOs). Further, the GoAP requested the ICRISAT to carry out a comprehensive scoping study of the functional FPOs in the state. This study is an outcome of intensive discussions with several proposed and functional FPOs and other stakeholders across Andhra Pradesh.
I am sure, this study would provide valuable input to the Government of Andhra Pradesh and its various departments, besides, other state governments in India and other countries, who plan to promote FPOs. I am congratulating the ICRISAT team for bringing this timely publication for the benefit of farming community in the state.
Sri N Chandrababu NaiduChief Minister, Andhra Pradesh
(Nara Chandrababu Naidu)


The new state of Andhra Pradesh, during the last two years have been relentlessly striving to achieve multidimensional growth. Enormous efforts have been directed to strengthen agriculture, horticulture, and fisheries, dairy, and meat/livestock sectors in terms of new technology, productivity improvement, infrastructure, knowledge, IT applications, market intelligence, linkages, and credit and finance arrangements and so on. But, majority of small and marginal farmer producers in the state are unorganized and fragmented. They are highly prone to underpricing at various stages of production, marketing and value addition. The lack of synergy among concerned government departments is further escalating this situation in the state. Even though the state has robust existing social capital and their productive relationships across commodities are absent. To overcome this situation and to generate more wealth for the farmers, there is an urgent need for creating of membership based institutions which are globally found to be backbone for primary sector growth. So, both Union and State governments are clearly putting considerable emphasis on promoting “Farmers Producers Organizations (FPOs)” as an important policy for creating an ecosystem for enhancing farmers’ profits in the state across sub-sectors.
This comprehensive report on ‘Farmer Producer Organization in Andhra Pradesh – A Scoping study’ under Rythu Kosam Project is a timely effort delivered by ICRISAT team to deeply understand the snapshot of FPOs in the state. I am quite confident this report will enhance the understanding of all concerned departments, academicians, researchers, scholars and NGOs.
Sri S P TuckerChief Secretary, Andhra Pradesh
(Satya Prakash Tucker)
Message


Contents
List of Abbreviations ..................................................................................................................................... xv
Preface ........................................................................................................................................................ xvii
About the Authors ..................................................................................................................................... xviii
Executive Summary ........................................................................................................................................1
Chapter 1. Introduction .................................................................................................................................4
1.1 Background ........................................................................................................................................4
1.2 FPOs in Andhra Pradesh .....................................................................................................................4
1.3 Why this study? ..................................................................................................................................5
1.4 Pre-study planning .............................................................................................................................5
1.5 Consultations with the government departments .............................................................................6
1.6 Report outline ....................................................................................................................................7
Chapter 2. Literature Review .........................................................................................................................8
2.1 Need for setting up of FPOs................................................................................................................8
2.2 Current status of FPOs .......................................................................................................................9
2.3 Reasons for success and failure of FPOs ......................................................................................... 12
2.4 Review of national policy and process guidelines on FPOs ............................................................. 15
2.5 An overview of the current policy and operational guidelines for FPOs of Andhra Pradesh state ............................................................................................................................ 16
2.6 Critical lessons learnt and gaps ....................................................................................................... 18
Chapter 3. Methodology ............................................................................................................................ 20
3.1 Research design ............................................................................................................................... 20
3.2 Methods .......................................................................................................................................... 20
3.3 FPOs categorization: ....................................................................................................................... 21
3.4 Sampling framework ...................................................................................................................... 22
3.5 Data analysis .................................................................................................................................... 25
3.6 Limitations of the study ................................................................................................................... 25
Chapter 4. Strategy of Andhra Pradesh State for FPOs .............................................................................. 26
4.1 Functional FPOs structure in Andhra Pradesh ................................................................................ 26
4.2 Proposed FPOs structure in Andhra Pradesh ................................................................................. 27
Chapter 5. Status of existing FPOs in Andhra Pradesh state ....................................................................... 38
5.1 Insights from scoping study of existing FPOs (proposed) ................................................................ 38
5.2 Insights from functional FPOs ......................................................................................................... 45
5.3 Case studies on some functional FPOs ............................................................................................ 50
Case study 1 ........................................................................................................................................... 51
Case study 2 ........................................................................................................................................... 52
Case study 3 ........................................................................................................................................... 53

Case study 4 ........................................................................................................................................... 54
Case study 5 ........................................................................................................................................... 55
Case study 6 ........................................................................................................................................... 56
Case study 7 ........................................................................................................................................... 57
Case study 8 ........................................................................................................................................... 58
Case study 9 ........................................................................................................................................... 59
Case study 10 ......................................................................................................................................... 60
Case study 11 ......................................................................................................................................... 61
Chapter 6. Mapping Potentials for FPOs in Andhra Pradesh ...................................................................... 63
6.1 Mapping of potential commodities and regions .............................................................................. 63
6.2 Identifying crop and crop combinations for FPOs ............................................................................ 64
6.3 Potentials of livestock sector in AP State......................................................................................... 88
6.4 Potential clusters for fisheries, prawns and shrimp ......................................................................... 91
6.5 Coverage of APMC regulated markets in AP state ............................................................................ 92
6.6 Summary and way forward ............................................................................................................ 100
Chapter 7. Issues and Options .................................................................................................................. 101
7.1 Key Issues and Options ................................................................................................................... 101
References ............................................................................................................................................ 106
Appendixes ................................................................................................................................................ 109

xi
List of FiguresFigure 2.1. Typology of producer companies in India. . ................................................................................ 13
Figure 3.1. Categorization of FPOs based on functionality and source. .......................................................21
Figure 5.1. Snehanjali Inland fisheries share certificate. .............................................................................. 51
Figure 5.2. Interviewing the banana growers at Changantipadu FPO. .........................................................52
Figure 5.3. ICRISAT staff with Samyuktha Fisheries Producer Company. ......................................................53
Figure 5.4 Jasmine Producers Organization in Krishna district. ....................................................................54
Figure 5.5. Mechanical threshing of groundnut by the farmers of groundnut FPO in Prakasam. ................55
Figure 5.6. Display of coconut based products at Noveeal FPO. ..................................................................56
Figure 5.7. Details of board members in seed FPO in West Godavari. .........................................................57
Figure 5.8. Interactions with milk producers at dairy FPO in Kurnool. .........................................................58
Figure 5.9. Pulses and millets FPO supported by Reliance Foundation. .......................................................59
Figure 5.10. Bank account details of BPFPC. ................................................................................................ 60
Figure 5.11. Usage of modern technology in turmeric processing in Guntur. ..............................................61
Figure 6.1. Geographical area and population of all the districts in Andhra Pradesh state..........................63
Figure 6.2. Area under major crops, Anantapur district. .............................................................................. 66
Figure 6.3. Area under major corps, Chittoor district. .................................................................................. 67
Figure 6.4. Area under major crops, East Godavari district. .........................................................................68
Figure 6.5. Area under major crops, Guntur district..................................................................................... 71
Figure 6.6. Area under major crops, Kadapa district. ................................................................................... 72
Figure 6.7. Area under major crops, Krishna district. .................................................................................. 74
Figure 6.8. Area under major crops, Kurnool district. .................................................................................. 76
Figure 6.9. Area under major crops, Nellore district. ................................................................................... 77
Figure 6.10. Area under major crops, Prakasam district. ............................................................................. 78
Figure 6.11. Area under major crops, Srikakulam. ....................................................................................... 81
Figure 6.12. Area under major crops, Vizianagaram district. .......................................................................83
Figure 6.13. Area under major crops, Vishakhapatnam. .............................................................................. 84
Figure 6.14. Area under major crops, West Godavari district ......................................................................86
Figure 6.15. Geospatial spread of cattle population in the state. .................................................................89
Figure 6.17. Spread of sheep population in A.P. ........................................................................................... 89
Figure 6.16. Geospatial spread of buffalo population in the state. ..............................................................89
Figure 6.18. Spread of goat population in A.P. ............................................................................................. 89

xii
List of TablesTable 1.1 Summary of consultations with state line departments .................................................................6
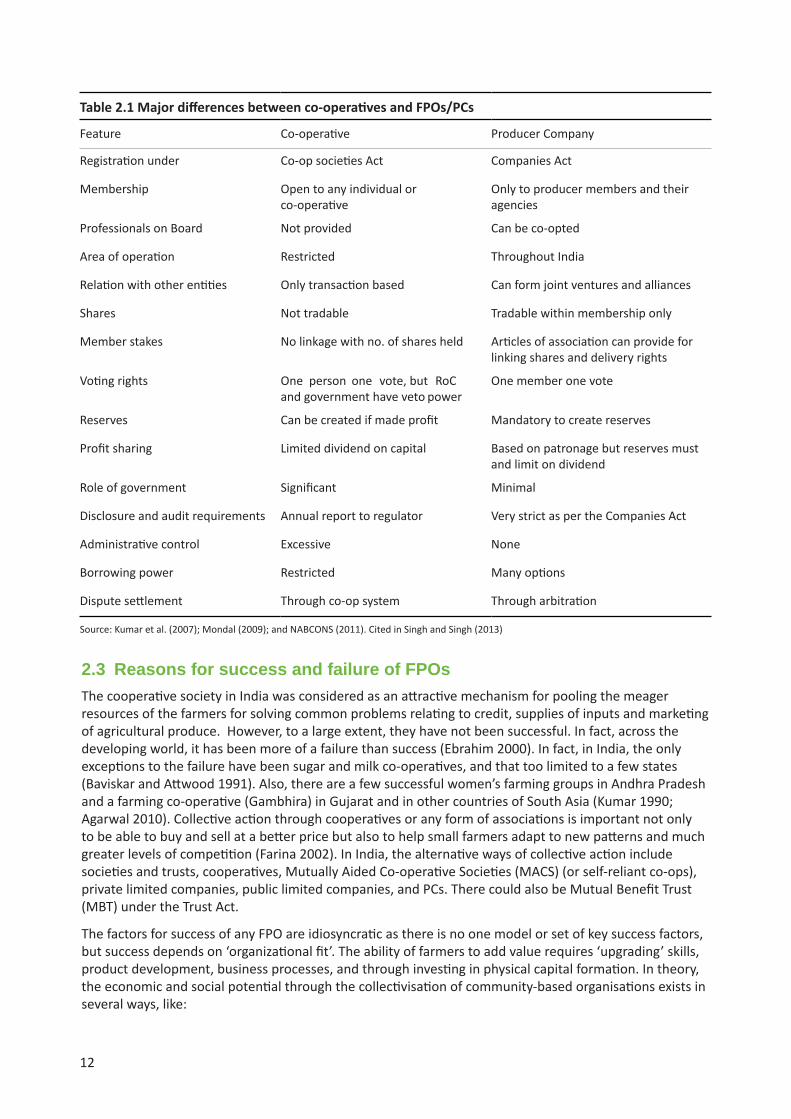
Table 2.1 Major differences between co-operatives and FPOs/PCs ............................................................ 12
Table 2.2 Problems at different levels of farmers’ association .................................................................... 15
Table 2.3 Issues that emanate from the review of literature of FPOs ......................................................... 19
Table 3.1 Sampling frame for coverage of proposed FPOs in strata-1 ......................................................... 23
Table 3.2 Sampling frame for coverage of proposed FPOs under strata-2 .................................................. 24
Table 3.3 Sampling frame for coverage of proposed FPOs under strata-3 .................................................. 24
Table 4.1 List of FPOs set up by SFAC in Andhra Pradesh, 2016 ................................................................. 26
Table 4.2 District-wise sanctioned FPOs by NABARD in Andhra Pradesh .................................................... 27
Table 4.3 Break-up of proposed FPOs across sub-sectors ........................................................................... 28
Table 4.4 Break-up of NF/NPM proposed FPOs in the state by the department of agriculture .................. 29
Table 4.5 Proposed FPOs by SFAC under primary sector mission ................................................................ 29
Table 4.6 Selected mandals and proposed FPOs under millets revival program ......................................... 30
Table 4.7 District-wise status of FPOs under PRODUCE fund ...................................................................... 30
Table 4.8 District and commodity-wise FPOs registered/proposed with NABARD during the years 2014-15 and 2015-16 ....................................................................................................... 31
Table 4.9 District-wise proposed FPOs in livestock sector ........................................................................... 34
Table 4.10 Proposed FPOs under fisheries department .............................................................................. 35
Table 4.11 SERP proposed FPOs in Andhra Pradesh .................................................................................... 36
Table 5.1 Coverage of primary survey in the study ..................................................................................... 38
Table 5.2 Nature and organizational structure of proposed FPOs ............................................................... 39
Table 5.3 Classification of FPOs based on activities initiated by POPI and RSA ........................................... 39
Table 5.4 Stages of FPO formation .............................................................................................................. 40
Table 5.5 Target membership pattern and unit share values ...................................................................... 41
Table 5.6 Nature and composition of FPO members ................................................................................... 41
Table 5.8 Major constraints in setting up of the FPO .................................................................................. 44
Table 5.9 Basic profile of selected operational FPOs in Andhra Pradesh ..................................................... 46
Table 5.10 Operational and financial status of the selected FPOs ............................................................... 47
Table 5.11 Productivity enhancing/ promotional strategies of the selected FPOs ...................................... 48
Table 5.12 Challenges and risks faced by the selected FPOs ....................................................................... 49
Table 5.13 Effectiveness of FPO on small and marginal producers .............................................................. 50
Table 6.1 District-wise importance of different crops in Andhra Pradesh state .......................................... 64
Table 6.2 Potential clusters for crop-based FPOs in Anantapur district ....................................................... 65
Table 6.3 Potential clusters for crop-based FPOs in Chittoor district .......................................................... 67
Table 6.5 Potential clusters for crop-based FPOs in Guntur district ............................................................ 70
Table 6.6 Potential clusters for crop-based FPOs in Kadapa district ............................................................ 70
xiii
Table 6.7 Potential clusters for crop-based FPOs in Krishna district ............................................................ 73
Table 6.8 Potential clusters for crop-based FPOs in Kurnool district ........................................................... 79
Table 6.9 Potential clusters for crop-based FPOs in Nellore district ............................................................ 79
Table 6.10 Potential clusters for crop-based FPOs in Prakasam district ...................................................... 80
Table 6.11 Potential clusters for crop-based FPOs in Srikakulam district .................................................... 80
Table 6.12 Potential clusters for crop-based FPOs in Vizianagaram district ................................................ 82
Table 6.13 Potential clusters for crop-based FPOs in Visakhapatnam district ............................................. 85
Table 6.14 Potential clusters for crop-based FPOs in West Godavari district .............................................. 85
Table 6.15 Distribution of possible FPOs based on agricultural commodities across districts of AP state ........................................................................................................................... 87
Table 6.16 Percentage distribution of different livestock across the districts in AP state ........................... 88
Table 6.17 Summary of district-wise potential mandals by livestock type .................................................. 90
Table 6.18 District wise fish production in Andhra Pradesh, 2014-15 ......................................................... 92
Table 6.19 Transaction of major agricultural produce at regulated markets in AP state in 2014 ............... 93
Table 6.20 District-wise marketed and marketable surplus of rice in AP State ........................................... 94
Table 6.21 District-wise marketed and marketable surplus of maize in AP State ........................................ 95
Table 6.22 District-wise marketed and marketable surplus of jowar (sorghum) in AP State ....................... 96
Table 6.23 District-wise marketed and marketable surplus of ragi (finger millet) in AP State..................... 97
Table 6.24 District-wise marketed and marketable surplus of red gram in AP State ................................... 98
Table 6.25 District-wise marketed and marketable surplus of black gram in AP State ................................ 99
Table 7.1 Summary of issues, options and enabling institutions ............................................................... 105

xiv
List of AppendixesAppendix 2.1 Process involved in establishing FPOs ................................................................................. 109
Appendix 2.2 Budget estimate for setting up 1000 FPOs in AP state ........................................................ 110
Appendix 2.3 Target of setting up of 2000 FPOs by NABARD .................................................................... 111
Appendix 3.1 Functional FPO – Case study questionnaire ....................................................................... 112
Appendix 3.2 Proposed FPO – Baseline questionnaire .............................................................................. 113
Appendix 3.3 District-mandal commodity matrix for strata-1 ................................................................... 117
Appendix 4.1 District-wise proposed FPOs by sub-sector in AP State ...................................................... 126
Appendix 5.1 Activities initiated by POPIs ................................................................................................. 127
Appendix 5.2 Activities initiated by RSA .................................................................................................... 128
Appendix 6.1 Functional & proposed FPOs in Andhra Pradesh ................................................................. 129
Appendix 6.2 Number of godowns and capacity ....................................................................................... 130
Appendix 6.3 Sector and commodity wise cold storages in districts of Andhra Pradesh .......................... 131
Appendix 6.4 Details of storage facilities available including in Andhra Pradesh as reported by the Marine Products Export Development Authority ....................................................... 132
Appendix 6.5 District wise warehouses and capacity ................................................................................ 133
Appendix 6.6 Number of godowns and capacity under AP Markfed ........................................................ 133
Appendix 6.7 Animal husbandry facilities available district-wise .............................................................. 134
Appendix 6.8 District wise slaughter houses available .............................................................................. 134
Appendix 6.9 District maps with mandals ................................................................................................. 135
xv
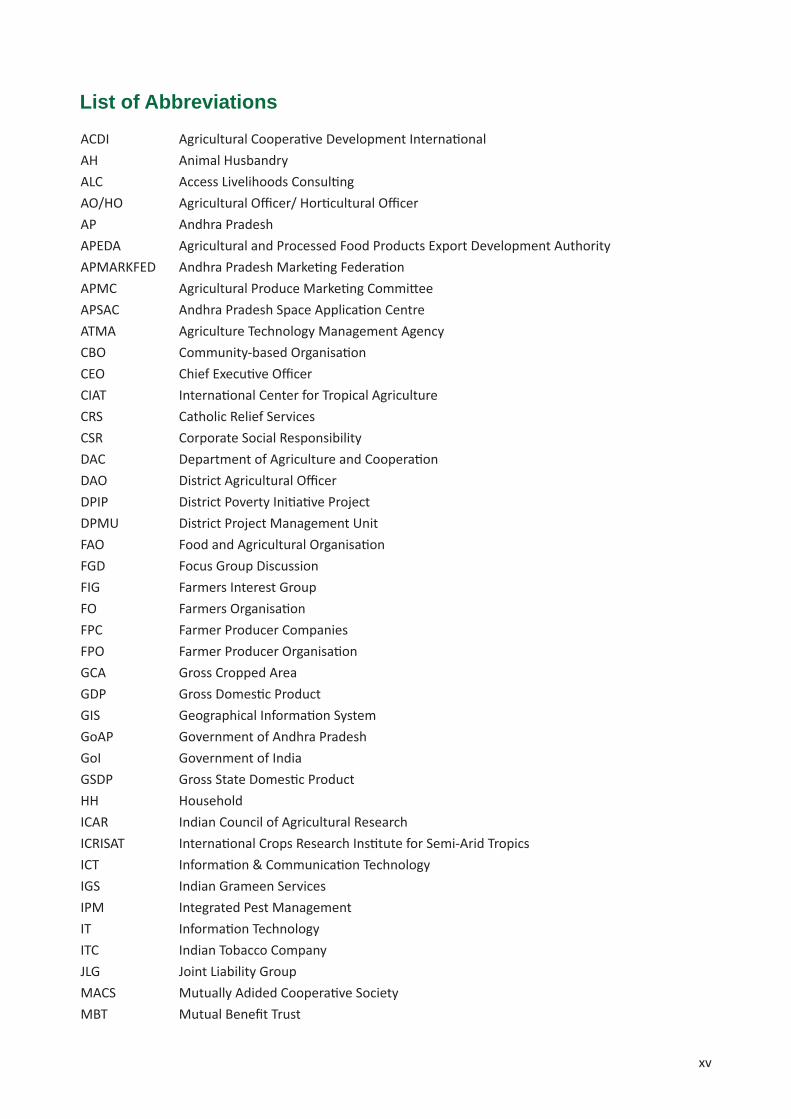
ACDI Agricultural Cooperative Development InternationalAH Animal HusbandryALC Access Livelihoods ConsultingAO/HO Agricultural Officer/ Horticultural OfficerAP Andhra PradeshAPEDA Agricultural and Processed Food Products Export Development AuthorityAPMARKFED Andhra Pradesh Marketing FederationAPMC Agricultural Produce Marketing CommitteeAPSAC Andhra Pradesh Space Application CentreATMA Agriculture Technology Management AgencyCBO Community-based OrganisationCEO Chief Executive OfficerCIAT International Center for Tropical AgricultureCRS Catholic Relief ServicesCSR Corporate Social ResponsibilityDAC Department of Agriculture and CooperationDAO District Agricultural OfficerDPIP District Poverty Initiative ProjectDPMU District Project Management UnitFAO Food and Agricultural OrganisationFGD Focus Group DiscussionFIG Farmers Interest GroupFO Farmers OrganisationFPC Farmer Producer CompaniesFPO Farmer Producer OrganisationGCA Gross Cropped AreaGDP Gross Domestic ProductGIS Geographical Information SystemGoAP Government of Andhra PradeshGoI Government of IndiaGSDP Gross State Domestic ProductHH HouseholdICAR Indian Council of Agricultural ResearchICRISAT International Crops Research Institute for Semi-Arid TropicsICT Information & Communication TechnologyIGS Indian Grameen ServicesIPM Integrated Pest ManagementIT Information TechnologyITC Indian Tobacco CompanyJLG Joint Liability GroupMACS Mutually Adided Cooperative SocietyMBT Mutual Benefit Trust
List of Abbreviations

xvi
MEDP Micro Entrepreneur Development ProjectMIS Management Information SystemMMT Million Metric TonMoA Ministry of AgricultureMPEDA Marine Products Exports Development AuthorityMRP Maximum Retail PriceMS MicrosoftMSR Marketed Surplus RatioNABARD National Bank for Agriculture and Rural DevelopmentNABCONS NABARD Consultancy ServicesNASFAM National Smallholder Farmers’Association of MalawiNCDEX National Commodity and Derivative ExchangeNF Natural FarmingNFSM National Food Security MissionNGC New Generation CooperativesNGO Non- Governmental OrganisationNPM Non-Pesticidal ManagementNSSO National Sample Survey OrganisationOCFCU Oromia Coffee Farmers Cooperation UnionPACS Primary Agricultural Cooperative SocietyPC Producer CompanyPDS Public Distribution SystemPMU Project Management UnitPO Producers OrganisationPODF Producers Organisation Development FundPOPI Producer Organisation Promoting Institution PRODUCE Producers Development and Upliftment CorpusPSU Project Support UnitRCE Rural Commuinity-based EnterprisesRI Resource InstitutionsRKVY Rashtriya Krishi Vikas YojanaRoC Registrar of Companyroi Return on InvestmentRSA Resource Supporting AgencySADP Smallholder Agribusiness Development ProjectSAU State Agricultural UniversitySERP Society for Elimination of Rural PovertySFAC Small Farmers Agribusiness ConsortiumSHG Self Help GroupSMF Small and Marginal FarmersUSAID United States Agency for International DevelopmentVFA Village Farmers’ AssociationWASSAN Watershed Support Services and Activity NetworkZBNF Zero Budget Natural Farming

xvii
PrefaceThe Government of Andhra Pradesh has envisaged, ‘Sunrise Andhra Pradesh: Vision 2029 to promote a happy, inclusive and globally competitive society’. As part of this, the state has set up seven missions and the Primary Sector Mission is one of them. To begin with, the state in collaboration with the ICRISAT, has developed a strategy to enable higher and faster growth in the Primary Sector across 13 districts of the state.
In order to improve welfare and living standards of farmers, particularly small holders, the government wishes to create an appropriate ecosystem in the state. Certain commodities are identified for providing necessary support system for the entire products and creating value chain. In this entire process, one of the important elements is by promoting innovative institution for farmers to support this transformation. Considering this, the Government of Andhra Pradesh (GoAP) based on a series of consultations with public and private organizations, experts, NGOs and farmers, had brought out the Policy and Operational Guidelines to promote Farmer Producers Organizations (FPOs). Further, the GoAP requested ICRISAT to carry out a comprehensive scoping study of the functional FPOs in the state. This study is an outcome of intensive discussions with several proposed and functional FPOs and other stakeholders in 13 districts of Andhra Pradesh.
We are sure, this study would provide valuable input to the Government of Andhra Pradesh and its various departments, besides, other state governments in India and abroad, who plan to promote FPOs. It is also expected that it would help stakeholders such as NGOs, researchers, teachers and students, who may like to understand FPOs and its various dimensions.
We gratefully acknowledge the Government of Andhra Pradesh for providing us the opportunity to carry out this study, in particular, the support provided by the Honorable Chief Minister Sri N Chandrababu Naidu; Sri Prathipati Pulla Rao, Minister for Agriculture, Agri-Processing, Marketing and warehousing, Animal Husbandry, Dairy Development and Fisheries and Chief Secretary SP Tucker. We sincerely thank Principal Secretaries and Secretaries for their enormous support, mainly, T. Vijay Kumar, former Special Chief Secretary, Agriculture department; Dr Manmohan Singh, Principal Secretary, Animal Husbandry and Fisheries department; Chiranjeev Chaudhari, Commissioner, Horticulture & Sericulture; Ram Shankar Naik, Commissioner, Fisheries department; all the senior officers of Agri and Allied departments; NABARD, NGOs specifically Basix, Vrutti, ALC, NESTHAM, Nilagiris. We highly appreciate the support provided by the executive committee members of Functional FPOs who cooperated during our field visits, executive committee members of Proposed FPOs and district level officers. We are also very grateful to the distinguished reviewers of this report, namely Prof Sukhpal Singh, IIMA, Prof Gopal Naik, IIMB and Dr K Raja Reddy, ANGRAU, Guntur for their valuable inputs and suggestions. We sincerely thank Dr David Bergvinson, Director General, ICRISAT, who relentlessly inspired the team. We are thankful to Suchita Vithlani for meticulous secretarial assistance in completing this study and Arun Seshadri for good copy editing.
Authors

xviii
About the AuthorsKV Raju Theme Leader, Policy & Impact, Research Program-Asia, ICRISAT, India.
Ranjit Kumar Head, Agribusiness Division, National Academy of Agricultural Research Management (NAARM), Hyderabad.
Surjit Vikraman Scientist, Policy & Impact, Research Program-Asia, ICRISAT, India.
D Moses Shyam Visiting Scientist, ICRISAT Development Center, Research Program-Asia, ICRISAT, India.
R Srikanth Scientist, Digital Agriculture, ICRISAT, India.
D Kumara Charyulu Senior Scientist (Agricultural Economics), Policy & Impact, Research Program-Asia, ICRISAT, India.
Suhas P Wani Research Program Director, Asia & Director, ICRISAT Development Center ICRISAT, India.

1
Executive SummaryThe declining profitability and rising risk associated with agriculture and allied its activities is being considered some of the major challenges in improving the livelihoods of the rural population in India. Mainly small and marginal farmers constitute the largest group of cultivators (about 85%) in Indian agriculture; having smaller than or about two hectares of operational holdings. The vulnerability to these households is largely attributed to lower scale of operation, lack of information, poor access to cheaper credit, weak participation in the consumers’ markets and consequently, exploitation by intermediaries in procuring inputs and marketing of their produce.
A variety of approaches have emerged over the years to address these problems. Agricultural cooperatives, formed under the Co-operative Credit Societies Act, 1904, have long been the dominant form of farmer collectives; however, the experience with cooperatives point to many limitations, except few successful exceptions in the field of dair farming. In recent years, collectivization of producers, especially small and marginal farmers, into producer organizations has emerged as one of the most effective pathways to address the many challenges of agriculture. Hence, on the recommendations of a high-power committee, the Government of India introduced the Companies (Amendment) Act 2002, which paved the way to Producer Companies (PCs).
The Government of Andhra Pradesh (GoAP) has envisioned double digit growth in primary sector and in collaboration with the International Crops Research Institute for the Semi-Arid Tropics (ICRISAT) has developed a strategy to enable higher and faster growth in the Primary Sector across its 13 districts of the state. To give further fillip to the mission, the GoAP had brought out the Policy and Operational Guidelines to promote Farmer Producers Organizations (FPOs) and requested ICRISAT to carry out a comprehensive scoping study of the FPOs in the state, which can provide a strong base for setting up of 1000 FPOs in the state spread across the 13 districts catering to all farm and off-farm needs. This study is an outcome of intensive discussions with several proposed and functional FPOs and other stakeholders in the state of Andhra Pradesh. Keeping in view, the need and wide canvas of this study, an elaborate literature review with experiences and lessons learnt over the years in India and across the globe were carried out. The study covered the mapping of various commodities produced in the state, their consumptions, extent of regulated market coverage and marketable surplus; and documented the functions and operations of selected FPOs- proposed and functional. The study also identified potential clusters of different commodities to set up FPOs and; in the end, the study distils out key issues and possible options to move forward.
As per secondary sources of information, there are 98 FPOs that are being registered formally and which are functioning in the state. They are formed based on two sources of funds: 1) SFAC and 2) PRODUCE fund under NABARD. The present study conducted an extensive survey of 45 FPOs Currently, five FPOs are registered with help of SFAC, while NABARD has set-up nearly 93 (30 proposed and 15 functional) in thirteen districts of Andhra Pradesh covering diverse commodities and mandals (smallest administrative unit) in the state.
Currently, five FPOs are registered with help of SFAC, while NABARD has set-up nearly 93 FPOs. Besides, various state departments and SERP are planning to set up 689 FPOs across different sub-sectors like agriculture, horticulture, animal husbandry, fisheries, etc. The Department of Agriculture has proposed to support 131 FPOs under natural farming/ non-pesticide management scheme, SFAC has proposed 56 FPOs, also 47 FPOs has been planned for revival of millets in the state. Similarly, the department of Horticulture has a target to set up 105 FPOs along with the support of NABARD’s PRODUCE fund, out of which 26 are already registered, while Animal Husbandry department has target of 246 FPOs to register as dairy/sheep & goat/ poultry/fodder FPOs. Besides, fisheries department has proposed to set up about 65 FPOs for freshwater fish, shrimp/prawn, marine, seabass/mud-crab, etc. In this process, several independent organisations like NGOs, have been empanelled to act as POPI for these FPOs.
From the field survey of proposed and functional FPOs, interesting patterns emerged. These FPOs represent field crops, horticulture, animal husbandry and fisheries. They are at different stages of

2
formation, about half of them have just identified the priority commodities and are in the process of group formation. About 17% of them have registered as ‘Producer Company’, though membership number varied from less than 50 to 500. Initial financial support is the major hiccup for these FPOs. In the absence of any business plan for most of the FPOs, the members are reluctant in contributing the equity, as the expected benefits are obscure. However, many of the FPOs, where some financial support from external agencies has come, initiated the field visit and less capital intensive training program was initiated. The lack of experts for technical guidance and fuzzy business plan are creating major roadblocks in wider acceptability of the concept among rural households. These new institutions also need liberal financial support for creating basic infrastructure, particularly at the initial stage. In case of some of the functional FPOs, a group of large farmers have invested personally to initiate business aggregation services. Overall, the current efforts of setting up of FPOs require more systematic analysis of production base of different commodities, existing ecosystem to support the initiatives, market potentials, etc.
In order to address these concerns, the present study attempted to map the potential agricultural commodities and livestock in each district at mandal-levels to suggest the plausible clusters of mandals to join together to form producer company. The 13 districts in the state of Andhra Pradesh has as many as 657 mandals. Taking into account the area (production data not available at mandal level) under different crops in the year 2013-14, a cluster of 4-5 mandals were considered for an FPO with a minimum of 10,000 ha area under each crop/commodity. In special cases, this criteria has been relaxed for high value commodities and/or concentration of it in certain isolated mandal(s). Accordingly, around 174 potential clusters of different agricultural commodities appeared to be a good number to start with for setting up of FPOs in Andhra Pradesh state. These potential FPOs are spread across different districts with different driving commodity wherein other commodities can also be added for continuous operation of the FPO throughout the year. According to this, 55 FPOs are being suggested for rice-based, 25 FPOs for fruits, 15-20 FPOs each for cotton and groundnut, 10-13 FPOs each for bengal gram and maize. Besides, there are good scope for 12 FPOs for blackgram and greengram together, 2-3 FPOs for redgram and redgram with blackgram. Similarly, crops like chillies and coconut has the potential to be aggregated in 5-6 clusters. Further, there is some scope to set up a couple of FPOs for crops like jowar (sorghum), bajra, ragi (finger millet), sesamum, castor, etc. Moreover, it should also be kept in mind that rice-based FPOs may face serious challenge in upgrading the value chain due to its limited scope of value addition, and may have prevailing problems of any regular commodities. Above all, the data on market arrival in APMC mandi clearly revealed that transaction at regulated markets is very minimal (less than 2%). So, there is a need for strengthening the existing regulated markets and their functionaries.
In case of livestock sector, there is good potential for setting up of FPOs in the highly dense districts like, Chittoor for milk, milk products and fodder; Kurnool, Srikakulam, Vishakhapatnam and Vizianagaram districts for cow milk; while in East Godavari, Guntur, Kadapa, Krishna, Nellore, Prakasam and West Godavari for buffalo milk. Similarly, for small ruminants like sheep and goats, the efforts may be made in Chittoor, Kadapa, Kurnool, Nellore and Prakasam districts. Moreover, we also need information about existing dairy companies in operation in these districts and mandals, where they are having their own milk collection centres.
In fisheries, Krishna and West Godavari districts together constitute nearly 81% of the total fresh water fish production in the state; while East Godavari, Nellore, Srikakulam and Visakhapatnam are the top 4 producers of marine fish in the state. Also brackish water fish production is mainly concentrated in East Godavari, Krishna, Nellore and West Godavari districts. In total, East Godavari, Krishna, Nellore and West Godavari districts together are contributing to nearly 80% of the Andhra Pradesh fish production in all forms, thus present strong potential for setting up of FPOs in fisheries sector.
Thus, the present study highlights some key issues and suggest possible options to address the emerging challenges in translating the vision of setting up of large number of FPOs to act as vehicle for rural transformation and engine for future growth of state economy. The most important issue that emerged from this study is the lack of convergence of government agencies in delineating their jurisdiction for either going solo or hand-in-hand with other sister-agencies to set up the producer company in any

3
district. The state of AP has already built robust social capital through SHGs, JLGs, Co-operatives, MACS, Rythu Mithra groups etc. The effort of FPOs/ Producer Company should be essentially built upon these social institutions. Also the need for identifying right support agencies with appropriate technical experts on the ground with workable and scalable business plan and management team will be key for success of any producer company. Most importantly, the suitably identified/selected clusters to be scaled up in producer company needs to be financially supported right from the time of community mobilization.

4
Chapter 1. Introduction
1.1 BackgroundThe Government of Andhra Pradesh has provided high priority to primary sector – agriculture and allied sectors. Considerable efforts have been made to strengthen agriculture, fisheries, horticulture, dairy, meat and livestock sectors in terms of new technology, productivity improvement, infrastructure, knowledge, IT applications, market intelligence , linkages, credit and finance arrangements (GoAP 2014; GoAP 2015). In order to improve the welfare and living standards of farmers, particularly small holders, there is a need to create appropriate ecosystem in the state. Certain commodities are also identified for providing necessary support systems for the entire production/ value chain. In this entire process, one of the important elements is innovative institutions to support farmers in this transformation.
Also, experiences in India and other parts of the world clearly indicate that farmers’ institutions that are membership based, financially robust, adopt business model and well integrated (to technology, research, markets, banks and other infrastructure facilities) could provide enormous economic benefits to its members viz. farmers. Such collective action goes beyond coming together for merely aggregation of outputs, but goes to realms of business and markets through scale of operations. Such institutional arrangement/ membership-based institutions are found to be the backbone for primary sector. With this background, both central and state governments are stressing on promoting ‘Farmer Producer Organization (FPO)’ as an important strategy for creating an ecosystem for enhancing farmers’ profits. Considering the importance of this agenda, the Department of Planning, Government of Andhra Pradesh (GoAP) had facilitated a series of discussions, brainstorming sessions with various departments, experts and civil society organizations for providing direction to this agenda. These efforts have led further to a series of discussions, which provided concrete shape to push the agenda forward with clear milestones, targets and deliverables. Further, all these combined energies has resulted in preparation of a draft document ‘Strategies and Operational Guidelines for FPOs’. It was officially released by the Honorable Chief Minister, Government of Andhra Pradesh in a public meeting held at Ananthapur on 6th August 2016 (GoAP 2016).
1.2 FPOs in Andhra PradeshCollectivization of producers, especially small and marginal farmers, into producer organizations has emerged as one of the most effective pathways to address the many challenges of agriculture, most importantly, improved access to technology, inputs and markets. The Department of Agriculture and Cooperation, Ministry of Agriculture, Government of India has identified farmer producer organizations to be registered under the special provisions of the Companies Act, 20131 as the most appropriate institutional form to mobilize farmers and build their capacity to collectively leverage their production and marketing strength. Some of the plausible reasons for developing a focused strategy for Farmers Producer Organizations/ Farmers Producer Companies (FPOs/FPCs)2 promotion in Andhra Pradesh are given below (GoAP 2016):
a. Large number of farmers (agriculture, horticulture, vegetables, fisheries, dairy, meat, flowers and other commodities) are unorganized (Dev 2012). As a result, they are exploited at various stages of the value chain.
b. Several departments of the state government need considerable support in promoting the FPOs. It is important to avoid duplication of efforts and develop greater synergies among these departments, for promoting/ nurturing FPOs.
c. In the light of existing social capital in Andhra Pradesh (in the form of self-help groups and other project based institutions), there is a need for developing appropriate harmony/relationship among these new
1. This is in pursuant to sub-section (2) of Section 7 of the Companies Act, 2013, Ministry of Corporate Affairs, Government of India. 2. In true sense, these are ‘Producer Companies’, as per the provisions of Part IX A (section 581A to 581ZT) of the Companies Act, 1956. The details
are given in Chapter 2.

5
FPOs. This process is challenging, given the complexity of experiences/ status of existing social capital in the state.
d. ICT tools/applications, financial inclusion processes, web based/ mobile based tools could offer new methods/ opportunities for creating collectives of farmers. This requires considerable experimentation, without compromising on fundamentals of FPOs.
e. This agenda requires stewardship and partnership at multiple levels. Various categories of agencies have to be orchestrated to function for a common cause.
It is expected that institutions of organized producers through FPOs would add value as well as adopt business model triggering higher level of growth and sustain the productivity and incomes of members.
1.3 Why this study?The Planning Department of GoAP had organized a series of meetings and discussions with all the stakeholders for over a year since February 2015 to come out with a strategy and policy for FPOs in the state of Andhra Pradesh (AP). Further, an exclusive conference for CEOs of agriculture related companies was organized under the chairmanship of the Chief Minister to focus on Public Private Partnership (PPP) for promotion of FPOs, on 18th of March 2016. The Chief Minister and the Chief Secretary steered these deliberations to elicit suggestions from more than 55 agri-industry leaders. The World Economic Forum and ICRISAT had organized this conference to seek a long-term engagement with private companies in promoting FPOs across the commodities in AP state. At the end of the meeting, the Chief Secretary of Andhra Pradesh clearly stressed the need for a comprehensive scoping study with a baseline on the proposed FPOs (1000) to be taken up by ICRISAT. Hence, this study was implemented by ICRISAT after intensive consultations with respective departments in the state.
Though several studies have so far reviewed performances of FPOs in India, most of them evaluated the status of farmer based institutions like cooperatives, mutually aided cooperative credit societies, associations under NGOs etc. Indeed, there is a paucity of literature and studies on FPOs in AP. Also, different implementation models are being adopted by different FPOs operational in various states.
The objectives of this scoping study are to:
a. Understand the status, initiatives and strategies for setting up of FPOs in Andhra Pradesh.
b. Examine the organizations, functions and constraints of existing (functional and proposed) FPOs.
c. Mapping potentials for setting up of FPOs across the state.
d. Based on the above, identify key issues and strategic options to move forward.
1.4 Pre-study planningThe line departments including Agriculture, Horticulture, Animal Husbandry, Fisheries and SERP have proposed FPO targets for the year 2016-17. However, there needs to be an understanding on how these estimates were made, so a preliminary meeting was set up with the line departments on the 1st and 2nd of April, 2016 to understand the background work carried out for setting up of FPOs by the respective departments. This interaction and discussions with officials was considered to be important before a format could be prepared for conducting a comprehensive scoping study of FPOs in AP by ICRISAT.
Key areas for the initial round of discussion with the line-department officials were:
• What is the basis for proposing FPOs by the respective department?
• Whether commodity wise market information collected/ available?
• Whether any preliminary format/questionnaire was used to collect basic information?

6
• How much SFAC guidelines/NABARD guidelines were useful to the department in this process?
• Who is responsible for facilitation of FPOs at the district level and state level?
• Whether any Standard Operating Procedures are being planned?
• How is the department planning to implement FPO formation/ management?
• Potential risks that are perceived at this stage either in formation/management?
The outcome of these preliminary discussions guided the ICRISAT team in formulating the objectives and focus on relevant data collection through a format from districts of AP. Different methods and formats were used by different departments to arrive at their proposed FPOs in the state, which are explained in the next section.
1.5 Consultations with the government departmentsThe study team had a structured consultations with all the concerned departments of the government of AP, during the first week of April 2016. It includes Agriculture, Horticulture, Animal Husbandry and Fisheries. The following points emerged from the discussions (also see Table 1.1):
Table 1.1 Summary of consultations with state line departments
S. no FPO Item Agriculture Animal Husbandry Horticulture Fisheries SERP
1 Total no of FPOs proposed
234 246 105 65 39
2 Basis for proposing FPOs
Questionnaire used
Questionnaire used
Questionnaire used
Mapping of clusters
Based on value proposition
3 Commodity information availability
Yes Yes Yes Yes Evolving
4 Whether prelim format used
Separate formats for existing and new FPOs
Format used Format used Format used Format used
5 SFAC/ NABARD guidelines followed?
Not followed Not followed NABARD for existing FPOs
Not followed Not followed
7 Any official guidelines to implement FPOs?
No guidelines No guidelines No guidelines Concept Note No guidelines
8 Expectation from FPO policy
To utilize existing Rythumithra Groups (RMG)
Clarity on converting existing cooperative institutions
Promotional funds in forming of FPOs
Standard operational procedures
Coordination between other line departments
9 Potential risks perceived
Market linkages and capacity building of FPOs
Capacity building of FPOs due to very few resource organizations
Market linkages, storage, and stabilization of FPOs
Inclusion of small and marginal farms need funding for capacity building FPOs
Market prices, collection and procurement of inputs/ outputs
Note: AGMARKFED was also consulted, however it was informed by the official that the agency is not currently involved in setting up of FPO. How-ever, it was informed that the agency would act as an apex organization to handhold FPOs for market linkage and capacity building.Further, organizations like Basix, Vrutti, WASSAN, etc. are co-opted as Resource Institutions for promotion of FPOs in Andhra Pradesh state.

7
a. The Government of Andhra Pradesh is planning to allocate Rs 3526 million for setting up and supporting the 1000 FPOs for first 3 years (Appendix 2.2).
b. The total number of FPOs proposed by various departments combined stand at 689.
c. The list of FPOs existing appear to have some overlap with the activities of two departments, for example Horticulture FPOs were highlighted as vegetable and fruit FPOs by the Agriculture department. While it is expected that there will be convergence of activities of all the departments as farmers might have multiple activities spread over across all sub-sectors of the primary sector. It is also expected that the activity/ commodity specific FPOs can be handled by respective departments.
d. Fisheries department adopted a scientific process in clustering farmers using latest technologies like GIS, which could be adopted by other departments.
e. Processes followed by each department appears to be commodity based, but the existing staff’s capability in handholding the formation and management of FPOs needs to be taken up on a priority basis right from the initial stage.
f. Funding clarity is expected by all the departments except agriculture, who expect the existing Rashtriya Krishi Vikas Yojana (RKVY) as a major source for FPO funding.
1.6 Report outlineThis report is broadly divided into seven chapters. Chapter 1 sets the stage, while Chapter 2 provides a literature review with experiences and lessons learnt over the years. Chapter 3 describes the methodology adopted in the study i.e. sampling framework and statistical tools used for this study. Also, current strategy followed by the state department in setting up the FPOs are discussed in Chapter 4. The salient findings emanating from the field survey and stakeholders consultation covering both proposed and functional FPOs were presented in Chapter 5. A mix of brief case studies of functional FPOs were also highlighted in Chapter 5. The extent of various commodities produced in the state, their consumption, extent of regulated markets coverage and marketable surplus of different commodities are summarized in Chapter 6. Based on the above, key issues and thereby possible options are listed out in Chapter 7 as a way forward.

8
Chapter 2. Literature ReviewIndian agriculture has come a long way since independence, with chronic food scarcity giving way to grain self-sufficiency. Currently, agriculture employs 48.9% of the workforce (NSSO 2011-12), while its share in the Gross Domestic Product (GDP) was 17.4% in 2014-15, at constant (2011-12) prices (Economic Survey 2016). Though, non-farm activities are becoming increasingly important, there is still a core truth in Theodore Schultz’ Nobel Prize lecture in the year of 1979: “Most of the world’s poor people earn their living from agriculture, so if we knew the economics of agriculture, we would know much of the economics of being poor”. The future of the Indian farmer depends on re-engineering the whole process of agriculture and its allied activities from input purchase, production, value addition and marketing, upgrading quality of farm produce while continuing to maintain their cost competitiveness. There are several constraints that holds back a rapid transformation of agricultural sector in India, which is evident from several scholarly studies (Chand et al. 2011; Birthal et al. 2011; Dev 2012; Swaminathan and Rengalakshmi 2016). These are: a) highly unequal distribution of ownership and operational holdings of land, b) predominance of small and marginal holdings, c) rampant poverty among households dependent on agriculture, d) institutional weaknesses, e) high transaction cost due to small marketable surplus and f) poor connectivity and access to markets.
2.1 Need for setting up of FPOsIn order to significantly improve the terms of smallholder farmers’ access to the market and strengthen their position in agri-value chains, it is gradually being realized that if federated; small farmers can easily bargain for better prices, both while buying inputs and selling their produce. This belief has led to the concept of establishing “Farmer Producer Organizations” (FPOs) in the country. Besides, in the backdrop of the previous experiences of the poor performance of traditional cooperatives in India, it was felt that there was a need to give more freedom to cooperatives to operate as business entities in a competitive market. This led to the amendment of Section 581 of the Companies Act, 1956 on the recommendations of Y K Alagh Committee. The Companies (Amendment) Act 2002 came into effect on 6th February 2003. With this, Producer Companies (PCs) can be registered under the provisions of part IX-A (section 581A to 581ZT)3, chapter one of the Companies Act, 1956. The objective of the said company can be production, harvesting, procurement, grading, pooling, handling, marketing, selling and/or export of primary produce of the members or import of goods or services for their benefit. Its membership can be 10 or more individual producers, or two or more producer institutions or a combination of both. It is deemed to be a private limited company but there is no limit on membership, which is voluntary and open. It is a limited liability company by share and not a public limited company (Singh and Singh 2013). All the registered companies under this provision shall have name ending with the words ‘Producer Company Limited’.
Also, small Farmers’ Organizations such as FPOs are expected to overcome the constraints of farmers imposed by the small size of their individual farms by leveraging the collective strength and bargaining power to access financial and non-financial inputs, services and technologies (Braverman et al. 1991; SFAC 2014); enhance incomes, reduce costs of input purchases along with transaction costs, create opportunities for involvement in value-addition including processing, distribution and marketing (Welsh 1997; Agarwal 2010). Furthermore, there is a growing realization that the farmer’s share in consumers’ price is still substantially low, if we wish to bring a transformation in agricultural sector to improve the livelihoods of smallholders, new institutional arrangement has to be made for interventions in post-harvest handling and marketing the produce from the farm gate till it reaches the consumer (Shepherd 2007). As a result, the focus of development has shifted from enhancement of production to market connectivity, which also resonates with the overarching strategy of Inclusive Market-Oriented Development (IMOD). It emphasizes on harnessing markets for smallholder farmers combined with research for development (ICRISAT 2011).
3. Until the amendment, the Act recognised only three types of companies, namely: a) Companies limited by shares (subdivided into public limited and private limited); b) Companies limited by guarantees; and c) Unlimited Companies. The amendment to the Act now adds a 4th variant viz. ‘Producer Companies’.

9
These institutional innovations should, a) create scale economies through horizontal co-ordination, aggregation and marketing of output and purchase of inputs, b) improve bargaining position, c) provide technical support in production, identifying potential buyers, prices, quantity and quality of commodities traded, d) reduce transaction costs in seeking information and organizing production and marketing, and; e) handle uncertainties and cushion risk in production and marketing (Trebbin 2014; Shah 2016).
2.2 Current status of FPOs IFAD (2004) opined that in rural areas, farmers’ organizations (FOs) are the nearest and often only institutions providing essential goods and services to the rural poor and helping them to break out from the poverty cycle. Also, FOs reduce the risk that individual farmers face during seasonal shocks. Globally, organization of primary production is diverse in terms of production systems, institutional arrangements, nature and levels of technologies adopted, extent of horizontal and vertical integration of various actors in the supply chain, levels of value addition and distribution of surplus generated. However, broadly there has been a transformation from co-operative forms of organization (which give much emphasis to distributional implication of benefits/surplus generated) to a combination of spirit of traditional co-operatives and competency and efficiency of companies (Trebbin 2014; Singh and Singh 2013).
2.2.1. Global experiencesKachule et al. (2005) studied the performance of National Smallholder Farmers’ Association of Malawi (NASFAM). Its 100,000 members are smallholder farmers with less than one hectare of land. NASFAM came into being in the year 1997 after a USAID-funded Smallholder Agribusiness Development Project (SADP) was implemented by Agricultural Cooperative Development International (ACDI/VOCA). NASFAM provides credit, extension and training, uses economies of scale to reduce transport costs and actively seeks external markets for export of produce. It works as a multi-functional, multi-sectoral organization. Its operations are divided between the commercial and development sectors, registered as a profit company and as an NGO. NASFAM is a complex evolution of the cooperative model and at grassroots level, the association has cooperative characteristics. Also, commercial and other entities have been created to handle functions that are typically circumscribed by the traditional cooperative structure, the commercial and business services functions.
Oromia Coffee Farmers Cooperation Union (OCFCU) in Ethiopia was founded in the year 1999 comprising 34 coffee cooperatives representing 22,503 smallholders. Besides substantial investment in physical infrastructure like storage and processing of coffee, the cooperative has utilized the premiums gained from fair trade and organic contracts to address social objectives such as setting up potable water projects and the building of schools and clinics (Poole and Frece 2010).
Citing an example of Rural Community-based Enterprises (RCE) based in Ghana, Donovan et al. (2008) argue that RCE act in a similar way to other forms of collective action to increase economic and social empowerment through scale by providing lower costs, increased bargaining power in the market, democratic decision making rights and access to political and legal arenas, and increased access to services. External players like donors or NGOs played significant role in promoting these enterprises. However, externally driven organizations have usually met with failure. At the same time, internally driven enterprises have suffered from lack of funds and inadequate capacity. A role exists for external actors in the development of RCEs, but the attention should be given to issues of dependence, governance and ownership for these partnerships to succeed in the long term.
From the year 2004-05, the International Center for Tropical Agriculture (CIAT), the Food and Agricultural Organization of the United Nations (FAO) and, the Agropyme project of Swisscontact and Catholic Relief Services (CRS) looked at strategies to facilitate the participation of smallholder producers in vegetable supply chains linked to local supermarkets. For this, three formal Producer Organizations (POs) in El Salvador and two in Honduras were investigated. COHORSIL is a farmer co-operative in Honduras that was founded in the year 1980 and traditionally focused on coffee production, processing and marketing. Faced with declining prices for coffee, the co-operative sought to diversify its activities. With Swiss funding, they

10
branched into the production and marketing of fresh vegetables. On fee basis, COHORSIL ensured that its members had access to seedlings produced in greenhouses, warehouse and packaging facilities, and marketing services. Hellin et al. (2007) found that despite significant investments of time and financial resources, existing producer organizations in both countries make up fewer than 5% of total horticultural producers in each country.
From cases of producers organizations in El Salvador and Honduras, Hellin et al. (2007) it was observed that the possible reasons for little progress of these organizations include limited business skills within existing producer organizations; organizational models which are too costly in terms of time and financial resources for linking smallholders to dynamic markets; and uncertainty about the benefits that smallholders can expect from the supermarket channel. In contrast, farmers in Mexico reported that there are no advantages to establish a farmer organization to sell maize grain. This is partly because the government fixes the grain price that farmers receive. In general, maize farmers have formed organizations for two reasons: to take advantage of subsidized extension advice together with an associated agriculture technical package; and to access and procure subsidized maize seed.
2.2.2 FPOs in IndiaIn the year 1995, then Chief Minister of Andhra Pradesh state, Sri N T Ramarao (NTR) got the Mutually Aided Cooperative Societies Act passed following the recommendations of the Brahma Prakash Committee, to allow a liberal cooperative law (Shah 2016), but could not succeed. As on 31st March 2016, there are 783 FPOs in India, out of which 510 are registered and promoted by Small Farmers Agribusiness Consortium (SFAC 2016). Though, few literatures differ in the total number and claim about 2000 farmer Producer Companies (FPCs) (Singh 2015). There has been primarily two major institutional mechanisms by which FPO4 formation is facilitated. The first one is through Small Farmers’ Agribusiness Consortium (SFAC) and the second one is facilitated by NABARD. SFAC, a society under DAC, is the designated agency of DAC to act as a single-window for technical support, training needs, research and knowledge management and to create linkages to investments, technology and markets (GoI 2013).
Also, NABARD has taken an initiative for supporting producer organizations, adopting a flexible approach to meet the needs of producers. A “Producers Organization Development Fund” (PODF) has been set up with an initial corpus of Rs 50 crore for this purpose. Any registered Producers Organization viz, Producers Company (as defined under Sec 581 A in part IXA of Company’s Act 1956), Producers Cooperatives, registered Farmer Federations, MACS (Mutually aided cooperative society), Industrial cooperative societies, other registered federations, PACS, etc. set up by producers are eligible under the fund. In fact, NABARD has set a target to set up about 2000 FPOs in India by the year 2015-16. Also, state-wise target is given in Appendix 2.3.
Singh and Singh (2013) has extensively reviewed the experiences of new generation co-operatives (NGCs) and Co-operative companies in selected developed and developing countries. The review based on experiences of Denmark, New Zealand, Australia, Sri Lanka, Philippines and India brings out important features of such institutional arrangements for organization of primary producers, viz. a) the major strategy in creating such institutional arrangements was to co-create value chains with joint stake companies supported with a well-developed business model and, b) they retain one member – one vote principle for major policy decisions. They link product delivery rights to producer member equity, raises capital through tradable equity shares among membership, enforces contractual delivery of produce by members, distributes returns based on patronage, goes for value addition through processing or marketing, and makes use of information efficiently throughout the vertical system.
4. Any group of farmers producers may be called as FPO, while this to be named as PCs, it should be registered under the above-mentioned Companies Act. However, for the convenience and easy understanding, these terms i.e. FPO, PC and PO have been used interchangeably to reflect upon the registered entities of farmers group.
11
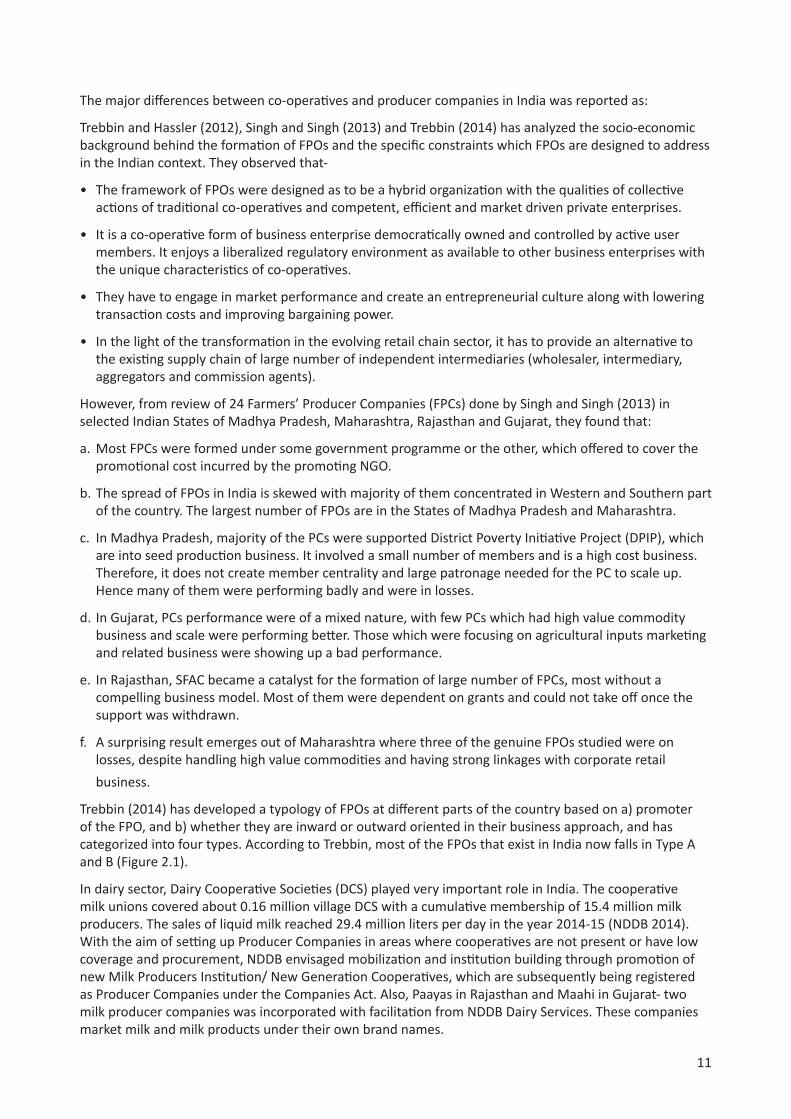
The major differences between co-operatives and producer companies in India was reported as:
Trebbin and Hassler (2012), Singh and Singh (2013) and Trebbin (2014) has analyzed the socio-economic background behind the formation of FPOs and the specific constraints which FPOs are designed to address in the Indian context. They observed that-
• The framework of FPOs were designed as to be a hybrid organization with the qualities of collective actions of traditional co-operatives and competent, efficient and market driven private enterprises.
• It is a co-operative form of business enterprise democratically owned and controlled by active user members. It enjoys a liberalized regulatory environment as available to other business enterprises with the unique characteristics of co-operatives.
• They have to engage in market performance and create an entrepreneurial culture along with lowering transaction costs and improving bargaining power.
• In the light of the transformation in the evolving retail chain sector, it has to provide an alternative to the existing supply chain of large number of independent intermediaries (wholesaler, intermediary, aggregators and commission agents).
However, from review of 24 Farmers’ Producer Companies (FPCs) done by Singh and Singh (2013) in selected Indian States of Madhya Pradesh, Maharashtra, Rajasthan and Gujarat, they found that:
a. Most FPCs were formed under some government programme or the other, which offered to cover the promotional cost incurred by the promoting NGO.
b. The spread of FPOs in India is skewed with majority of them concentrated in Western and Southern part of the country. The largest number of FPOs are in the States of Madhya Pradesh and Maharashtra.
c. In Madhya Pradesh, majority of the PCs were supported District Poverty Initiative Project (DPIP), which are into seed production business. It involved a small number of members and is a high cost business. Therefore, it does not create member centrality and large patronage needed for the PC to scale up. Hence many of them were performing badly and were in losses.
d. In Gujarat, PCs performance were of a mixed nature, with few PCs which had high value commodity business and scale were performing better. Those which were focusing on agricultural inputs marketing and related business were showing up a bad performance.
e. In Rajasthan, SFAC became a catalyst for the formation of large number of FPCs, most without a compelling business model. Most of them were dependent on grants and could not take off once the support was withdrawn.
f. A surprising result emerges out of Maharashtra where three of the genuine FPOs studied were on losses, despite handling high value commodities and having strong linkages with corporate retail business.
Trebbin (2014) has developed a typology of FPOs at different parts of the country based on a) promoter of the FPO, and b) whether they are inward or outward oriented in their business approach, and has categorized into four types. According to Trebbin, most of the FPOs that exist in India now falls in Type A and B (Figure 2.1).
In dairy sector, Dairy Cooperative Societies (DCS) played very important role in India. The cooperative milk unions covered about 0.16 million village DCS with a cumulative membership of 15.4 million milk producers. The sales of liquid milk reached 29.4 million liters per day in the year 2014-15 (NDDB 2014). With the aim of setting up Producer Companies in areas where cooperatives are not present or have low coverage and procurement, NDDB envisaged mobilization and institution building through promotion of new Milk Producers Institution/ New Generation Cooperatives, which are subsequently being registered as Producer Companies under the Companies Act. Also, Paayas in Rajasthan and Maahi in Gujarat- two milk producer companies was incorporated with facilitation from NDDB Dairy Services. These companies market milk and milk products under their own brand names.
12
2.3 Reasons for success and failure of FPOs The cooperative society in India was considered as an attractive mechanism for pooling the meager resources of the farmers for solving common problems relating to credit, supplies of inputs and marketing of agricultural produce. However, to a large extent, they have not been successful. In fact, across the developing world, it has been more of a failure than success (Ebrahim 2000). In fact, in India, the only exceptions to the failure have been sugar and milk co-operatives, and that too limited to a few states (Baviskar and Attwood 1991). Also, there are a few successful women’s farming groups in Andhra Pradesh and a farming co-operative (Gambhira) in Gujarat and in other countries of South Asia (Kumar 1990; Agarwal 2010). Collective action through cooperatives or any form of associations is important not only to be able to buy and sell at a better price but also to help small farmers adapt to new patterns and much greater levels of competition (Farina 2002). In India, the alternative ways of collective action include societies and trusts, cooperatives, Mutually Aided Co-operative Societies (MACS) (or self-reliant co-ops), private limited companies, public limited companies, and PCs. There could also be Mutual Benefit Trust (MBT) under the Trust Act.
The factors for success of any FPO are idiosyncratic as there is no one model or set of key success factors, but success depends on ‘organizational fit’. The ability of farmers to add value requires ‘upgrading’ skills, product development, business processes, and through investing in physical capital formation. In theory, the economic and social potential through the collectivisation of community-based organisations exists in several ways, like:
Table 2.1 Major differences between co-operatives and FPOs/PCs
Feature Co-operative Producer Company
Registration under Co-op societies Act Companies Act
Membership Open to any individual or co-operative
Only to producer members and their agencies
Professionals on Board Not provided Can be co-opted
Area of operation Restricted Throughout India
Relation with other entities Only transaction based Can form joint ventures and alliances
Shares Not tradable Tradable within membership only
Member stakes No linkage with no. of shares held Articles of association can provide for linking shares and delivery rights
Voting rights One person one vote, but RoC and government have veto power
One member one vote
Reserves Can be created if made profit Mandatory to create reserves
Profit sharing Limited dividend on capital Based on patronage but reserves must and limit on dividend
Role of government Significant Minimal
Disclosure and audit requirements Annual report to regulator Very strict as per the Companies Act
Administrative control Excessive None
Borrowing power Restricted Many options
Dispute settlement Through co-op system Through arbitration
Source: Kumar et al. (2007); Mondal (2009); and NABCONS (2011). Cited in Singh and Singh (2013)

13
• Economies of scale in transformation (including production, distribution, innovation, finance);
• Economies of scale in transaction costs (aggregation and transportation);
• Access to physical capital and external services (infrastructure, finance, business development and technical);
• Mutual trust/sense of belonging/consensus; and
• Social development and capacity building.
NABCONS (2011) points out that poor skills of professionals of the PCs, lack of vision and direction from Board of Directors, operational problems like low equity base due to low share value (share capital ranged from Rs 0.1 to 0.5 million across PCs), inability to attract capital or credit from outside, though some promoting agencies had routed grants to the PCs or managed credit through joint ventures, and most of the studied PCs had managed to obtain loans (investment and working capital); poor marketing and value addition expertise; and no or poor business plans led to failure of many of the PCs.
Poole and Frece (2010) found that though there are theoretical explanations of the failures of collective organization, the potential for exploiting production and managerial economies of scale, overcoming market entry barriers, reducing transaction costs and cultivating supply chain relations give fundamental reasons for collaborating. The path to maturity is usually long, and needs supportive investment through a range of planned and sequenced business services, with an exit strategy emplaced to ensure progress towards sustainability. And there is no ‘one size-fits all’, and no guarantee that individual successes can be up scaled and replicated.
Korten (1980) suggested three stages in the learning process, during which organisations first learn to be effective (upgrading skill and knowledge); then efficient (reducing the inputs need in relation to outputs/services delivered); and lastly to expand (growth to maturity). This he called the ‘learning process’
Figure 2.1. Typology of producer companies in India. Source: (Trebbin 2014).

14
approach. Regarding expansion, optimal organisation size for a particular context – of people, products, services, and environment – may vary, and the advantages and disadvantages of scale must be specifically considered. The ability to influence the value chain in a significant manner remains an elusive goal for the majority of FPOs.
In Mozambique, where 80% farmers are small holders and only 7.3% were members of any farmer organization in the year 2005, the membership in a farmers’ organization led to 50% increase in profits for small farmers from the crops handled by the organization (Bachke 2010). While the success of NASFAM in Ghana lies in the ability ‘to develop the commercial capacity of its members and to deliver programmes that enhance their productivity, strong and transparent institutional structure which keeps its commercial business separate from development and training programmes, consistent donor support from USAID (Prowse 2008).
From environment analysis for 10 Malawian smallholder association, Kachule et al. (2005) summarized different problems existing at different levels in such association as:
Singh and Singh (2013) citing the study by Esham and Usami (2007), argued that in Sri Lanka, most of the small farmer companies established to accelerate commercialization in non-plantation agriculture, failed to achieve expected objectives, due to various reasons like: (1) politicization of farmer companies; (2) lack of managerial and entrepreneurial skills due to poor recruitment of management staff; (3) lack of sound plans and poor management by incompetent board of directors without professional advice; (4) lack of proper mechanisms to monitor and evaluate; (5) mistrust between farmer company management and farmers, (6) farmer perception of the farmer company as a service provider; (7) awareness gap between the shareholders and the farmer company; and (8) restriction on share capital ownership.
Donovan et al. (2008) argues that in case of rural community-based enterprises (RCE) based in Ghana, external players like donors or NGOs play significant role in promoting these enterprises. However, externally driven organizations have usually met with failure. At the same time, internally driven enterprises have suffered from lack of funds and inadequate capacity. Therefore, the attention should be given to issues of dependence, governance and ownership for these partnerships to succeed in the long term.
Citing the success story of Oromia Coffee Farmers Cooperation Union (OCFCU) in Ethiopia, Poole and Frece (2010) explained that many structural and institutional transition helped the OCFCU to succeed. The managerial capacity with experienced and committed leadership and participatory dialogue between farmers and government officials greatly helped the union.
Nalini et al. (2015) conducted case study of Avirat Agro Business Producer Company Ltd, Amreli, one of the first FPOs in Gujarat. Although the promoting NGO was working in the region since 1980, after completion of watershed project, the watershed group was registered under the Producer Company Act in the year 2005, with 1600 farmers from 16 villages. The success in bargaining for lower input supply prices, the ability to pool produce to get higher price for outputs, and the innovative methods in training and information dissemination have resulted in significant benefits to the members in terms of enhancement of their incomes. The main challenge, however, appears to be the inability to access capital, which, to some extent, is undermining the advantages of collectivization. The case of Avirat points to a need for the FPOs to evolve a business model that can raise enough capital to maximize the benefits of collectivization. The partial success of Avirat indicates that aggregating smaller existing grassroots agricultural institutions like watershed committees into producer organizations might be beneficial for effective collective action.
Organizations that emerged as a result of federating from existing smaller groups offer ways to combine small base collectives with economies of scale (Bebbington 1996; Markelova et al. 2009; Agarwal 2010; Shelar 2012). The training need assessment and dissemination of required information are the other key ingredients for success of the FPOs. Periodic field visits and regular meetings create and nurture continuous flow of communication, thereby institutionalizes a participatory decision making process.
Moreover, Shah (2016) believes that neither the ultra-liberal Mutually Aided Cooperative Societies Act nor the Multi-State Cooperative Societies Act nor the Producer Company provision in the Companies

15
Act 1956 has over the past 10 years given birth to a single farmer producer organization of the quality and size of Amul or Bardoli Sugar Cooperative. He emphasize that many FPCs formed under the new law do not have the organizing logic like the value-addition model. Most were started to do what traders were doing anyways, but with greater presumed efficiency and transparency. These were formed under some government programme or the other, which offered to cover the promotional cost incurred by the promoting NGOs. He suggested at least four stages for success of FPCs: First, creating and communicating a compelling vision of a potentially successful enterprise with significant rewards to farmer-members; second, by creating (and registering) the member organization best designed to actualize the vision; third, by utilizing early success to institute rules/norms that reinforce patronage cohesiveness, governance effectiveness, and operating performance; and finally, at maturity, utilize the strength from enterprise growth to enhance member, patronage and domain centrality.
2.4 Review of national policy and process guidelines on FPOsIn the year 2002, the Government of India amended the Companies Act, 1956 by incorporating part IX A, based on the recommendations of the Y.K. Alagh Committee (Mondal 2010), to provide for producer companies controlled by primary producers which would function along the lines of corporate entities (Bhattacharjee 2010). According to the act, Producer Companies are to be registered with the Registrar of Companies as limited companies formed with the equity contribution by the members. The day-to-day operations are to be managed by hired professionals under the instructions of the Board of Directors elected by the General Body over a specified tenure (Mondal 2010). Also, promotion of member-based Farmer Producer Organizations (FPOs) was initially launched as a pilot programme during the year 2011-12, by the Department of Agriculture and Cooperation (DAC), Ministry of Agriculture, Government of India, in partnership with state governments. The Ministry began implementing this project through the Small Farmers Agribusiness Commission (SFAC).
Table 2.2 Problems at different levels of farmers’ association
Level Problems
Level 1. Internal management environment
· Weaknesses in grassroots group management and finances
· A low level of management skills among organization executives
Level 2. Immediate membership environment
· Ineffective democracy and organization
· Lack of membership commitment
· Poor farming production systems
· Low product quality
· Insufficient physical assets and infrastructure
Level 3. Proximate market chain environment
· Poor logistical infrastructure and communications
· Inefficiencies in supporting organisations
- Lack of timeliness in service,
- Poor quality of technical service & inexpert advice
- Failure of services
Level 4. Surrounding macro environment · Low and variable prices for products due to unfavourable demand (competition/ substitute products)
· High cost of capital (roi)
· Uncertainties in legal or political environment
Source: adapted from Kachule, Poole and Dorward (2005)

16
To give further fillip to the initiatives, the Government of India declared the year 2014 as the ‘Year of Farmer Producer Organization’. The Department of Agriculture and Cooperation, Government of India (GoI) has issued a set of guidelines to state governments, who in turn will spearhead the formation of FPOs (MoA 2013). Supply of inputs such as seed, fertilizer and machinery, market linkages, training & networking and financial and technical advice are also among the major activities of FPO. As such, the Centre wishes to homogenize methods of promotion for FPOs across states to provide ‘indicative costs’ and a ‘monitoring framework’. Thus, states have three options: they can either empanel Resource Institutions to help organize farmers, call upon the SFAC to empanel the latter or directly request the SFAC to promote FPOs in the state. In summary, states must take the initiative to advance the FPO project. According to SFAC, currently, there are 783 FPOs listed in India, many of them are not yet registered. As many as 156 FPOs are in Madhya Pradesh and at present records the highest, followed by Uttar Pradesh (104). The State of Andhra Pradesh has 5 FPOs.
NABARD has also created ‘Producers Organization Development Fund’ to comprehensively support the POs in different forms across the country. Any registered POs i.e. Producer Company, Producer Cooperatives, registered Farmers Federations, PACS, etc. are eligible to get assistance. NABARD provides financial support for both working capital and term loan requirements, capacity building and creating market linkages.
2.5 An overview of the current policy and operational guidelines for FPOs of Andhra Pradesh state Considering the plight of farmers in the state on account of declining farm profitability and rising risks in agriculture and allied sectors, the Government of Andhra Pradesh (GoAP) felt an urgent need to create appropriate ecosystem in the state to strengthen agriculture, fisheries, horticulture, dairy, and meat / livestock sectors. Finally, after several rounds of discussions with various stakeholders, the government with the help of ICRISAT developed the strategy document to facilitate the setting up of producer organizations in the state and brought out ‘Rythu Kosam: Andhra Pradesh Farmers Producers Organizations’ Promotion Policy- 2016, Operational Guidelines’ (GoAP 2016).
The Operational Guidelines discuss in details about the formation as well as operation of FPOs in the state of Andhra Pradesh. It is covered in 14 chapters explaining the guiding principle, guidelines for sustaining FPOs, institutional arrangements, role of government departments, FPO promoting NGOs, project support unit, synergies with existing institutions of producers, budgetary and financial aspects and organogram. The government through the policy guidelines sets an ambitious target of bringing together 1 million farmers through 1000 FPOs in the state across the primary sector (details given in appendix II).
The salient features of the guidelines are:
• It will be applicable for all the FPOs/ farmer producer companies (FPCs) either registered earlier under the Mutually Aided Cooperatives Societies (MACS) Act 1995 or Companies Act 2013 or any other, under central and state cooperative society laws.
• Typical FPOs/FPCs may have 500 to 1000 members, with exceptions for tribal regions
• Guiding principles envisage to establish FPOs/FPCS based on existing and emerging market opportunities, backed with robust business plan, scope of enhancing income through technology and knowledge infusion.
• FPOs will be producer-membership based, with single voting right to each family.
• Outside experts will comprise the advisory body.
• Various state departments will facilitate in formation and development of FPO/FPC.
• The state department will have Project Management Unit (PMU) who with the support of ICRISAT-led consortium of organizations will act as project incubation unit and develop specific strategies, action plan and targets for promoting FPOs in the state.

17
• Monitoring and evaluation of FPOs with quarterly reporting structure to PMU.
• At district level, Agriculture Technology Management Agency (ATMA) will provide all technical support and coordinate the capacity building of FPOs, while District Project Monitoring Unit (DPMU) chaired by Joint Collector will have monthly review of all the activities promoting FPOs/FPCs.
• DPMU will function as a “Single Window” for processing of all issues related to FPOs/FPCs.
• PMU and DPMU will identify the NGOs who can bring necessary professional expertise to promote FPOs (for community mobilization, capacity building, documentation, business plan development, developing market linkages, establishing MIS/ governance system, etc.).
• FPOs/FPCs will develop their micro-plan for its operation, estimate the demand of the products and have market assessment.
• Project Support Unit (PSU) led by ICRISAT and assisted by a network of group of technical institutions will provide strategic inputs to the PMU at state level in strengthening FPO agenda (technical guidance, ICT-application, business development, project management, selection criteria for NGOs and RIs, etc.). PSU will also organize workshop of FPOs and provide platform to exchange the experiences for cross-learning.
• Financial support to set up various infrastructures for FPOs will be given according to the guidelines of Ministry of Agriculture, Govt of India. Every FPO will get support for business activity, promotional activity, productivity enhancement purposes, etc. through pooled resources from different government programmes/ schemes
• Administrative cost of planning, monitoring and evaluation (Advisory board, PMU and DPMU) will be borne by the state government.
The operational guidelines for FPO promotion in Andhra Pradesh state is quite comprehensive and has touched upon most of the issues. It also entails the budgetary support to be given to each FPO for different kind of activities as well as related infrastructure development. However, there are some gaps in the current strategy, which are broadly discussed below:
• Such ambitious initiatives requires convergence of all the sectors- public/private/NGOs. But, the document doesn’t spell out clearly about bringing together the state line-department, NABARD, SERP, etc. to delineate the efforts to set up viable and sustainable FPO in each district. There is a great chance of duplicity of efforts in the same district and for same commodity groups.
• The current policy guidelines suggest top-heavy structure of FPOs and its monitoring system. There are several agencies like DPMU, ATMA, PSU, etc. entrusted to monthly/quarterly monitor the progress and operations of FPOs, which would ultimately bring unnecessary compliance burden on the FPOs. Rather the government department should attempt to bring transparent enabling environment, which may help communicate with the FPOs about the process and timeline to access the support benefits provided by the government.
• Roles of the NGOs or any other resource institutions promoting FPOs/FPCs are critical in this endeavor in providing hand-holding support in day-to-day operations. However, these FPOs/FPCs should be managed by a management professionals, who can steer the FPO to reach a scale and efficiency. After certain period, the promoting agency (NGO/RI) should exit from the system and FPO should aspire to be self-sustainable.
• Though, several producer companies and FPOs are functional in different states, but equally good number has failed to take off. Lack of technical and managerial capabilities with Resource institutions (POPIs) has been identified as one of the main reasons. This should also find place in the strategy document to develop capacity of the resource persons.

18
2.6 Critical lessons learnt and gapsThis section lists out the major issues that emanate from the review of literature of FPOs in India focusing on a) the purpose for which FPOs were formed, b) the process of FPO formation in different sectors and regions (details in Appendix 2.1), and c) the performance indicators of FPOs.
Success factors:
• A compelling vision of a potentially successful business model with significant rewards to farmer-members,Early success to institute rules/norms that reinforce patronage cohesiveness, governance effectiveness, and operating performance,Strong transparent institutional structure, which keeps its commercial and social objectives separate,External agency is must for initial hand holding in business development through capacity building, physical investments and creation of supply chain linkages;Harness local available human resources, train and empower them to reduce the costs of management as well as attrition,Complementary investments in public goods and physical infrastructure is essential to reduce costs and product losses,Agricultural production and rural marketing ‘thinking’ must be supported by ‘business thinking’ in respect of managerial capacities and organizational structures and development.
Weaknesses:
Internally,
• The poorest smallholders tend to be excluded from participation in and/or management of commercially oriented collective organizations,
• There are often mixed and sometimes conflicting objectives,
• Often there is a lack of startup finance, weak internal management capabilities, opaque governance and accountability,
• Lack of transparent policies and ICT tools and applications,
• Inefficient organizational capacity
External challenges include,
• High barriers to entry and asset threshold requirements in markets (demand pattern, preferences, standard, etc.)
• Inadequate transport and communications infrastructure,
• Unsupportive public policies and/or implementation and lack of government or political support, (eg, FPO can’t get license for fertilizers)
No one can tell what the price of a particular crop would be even with a gap of one day. Price uncertainty is a feature of the markets that farmers have to live day in and day out. When representatives of NCDEX told us about the possibility of taking a position to sell in September itself, we thought we will give this an experimental shot and we tool a position at Rs 3300. Today the prices are well below Rs 3000 and we were able avoid a loss of Rs 30,000 per 100 kg. This amount, which is a profit on the books of the company, which is owned by the farmers, can get benefited directly as a better price for soy or as lower rates for inputs in the next season – like wheat or chana.
Mr Souvik Dhar, CEO, Samruddhi Mahila Crop Producer Company Ltd – Bundi, Rajasthan.

19
In nutshell, from the preceding discussion, it may be concluded that the collectivization of farmers in the form of ‘Producer Company’ or FPOs has potential to boost the income and livelihood opportunities in myriad ways, provided that all the dots are understood and joined properly. There are several living examples, one such is given below, where a producer company led by women could be able to access new age marketing platform like NCDEX and were able to optimize the market risk for their produce (NCDEX 2016).
Table 2.3 Issues that emanate from the review of literature of FPOs
Purpose of FPO formation Process of FPO formation Performance indicators of FPOs
• reaping the benefits of economies of scale through aggregation inputs, output and various processes
• reduce the transaction costs in a significant way, improving profit margins and incomes of rural households
• effectively address the capital and credit constraints faced by small holders
• help small holders to manage risk and uncertainties through collective efforts in production, marketing and post-harvest value addition
• contributes to the provision of public goods in the society
Pre-Formation Stage
• Identification of uniform cluster
• Organization of Farmer Interest Groups and educate them about the activity and intended benefits
• Collection of share money
Formation Stage
• Membership drive and formalizing the management structure,
• FPO Incorporation- documentation and registration
• Capacity building of FPOs functionaries
Implementation of Business Plans
• Actual operation of production, value addition, marketing, etc.
• Regulatory approval for the activities (if needed), eg, selling of fertilisers or agro-chemicals
• Development of performance and impact indicators
• increased employment opportunities
• improved income levels
• enhancement of social status
• linkage effects of agriculture and non-agriculture sectors
• improvement in the performance of various institutions bringing more transparency and accountability
• development of social capital in the region
• improvement in health, education and overall well-being

20
Chapter 3. Methodology
3.1 Research designTo understand the scope of FPOs in Andhra Pradesh, the objectives outlined in the previous chapter were the basis to put in place a well-tailored research design. The methods to be followed in determining the scope of work involved extensive deliberations with the various departments of Andhra Pradesh government. We have followed a three step process for the entire study, as which is described below:
1. With the overall guidance from the Planning Department, the team conducted several rounds of discussions with various government departments involved in the primary sector and are planning to set up FPOs based on activities under their domain. We also had detailed discussions with the NABARD officials in the respective districts about the activities related to the FPOs. The data and information gathered from the discussions were used to devise a sampling framework for the study.
2. The second step was to gather information about the different categories (based on discussions with government departments and NABARD) of FPOs in the districts and to select the FPOs belonging to these categories for a detailed study. After the selection, the team visited the selected FPOs in different districts and conducted detailed interviews, field visits, formal and informal meetings and focus group discussions (FGDs) with individuals and groups of farmers, officials of the concerned departments, key functionaries of NABARD for the district, local body representatives and NGO functionaries to collect data and information based on a semi-structured questionnaire for collection of detailed data and information.
3. The third step was to collate the data and information gathered from the FPOs spread across the state in different districts, and analyse the data and information using qualitative and quantitative techniques along with geo-spatial analysis to draw meaningful conclusions about the objectives outlined for the study. The results of the analysis is then presented in the study report organized into six chapters.
In this study, both quantitative and qualitative methods were used to understand the scope of FPOs in Andhra Pradesh. Also, quantitative methods included analysis of data collected from secondary sources of the government departments, research institutes, reports and articles. Primary data collection was adopted through a formal scheduled survey from targeted stakeholders (FPOs). Also, collation and analysis of data was conducted with formal quantitative techniques and qualitative methods. Attempts were made to integrate the information collected and analysed by both the techniques to complement our understanding in this study. Unstructured interviews are involved in almost all case studies in which the subjects would be allowed to express themselves in their own words, hence generalizations would be difficult to make (Ritchie et al. 2003). The qualitative techniques included appreciative inquiry with FGDs with government functionaries. The outcomes of these discussions were useful in finalizing formats discussed later in this chapter.
3.2 Methods• Series of interactions with line departments paved the way for designing the suitable sampling
framework for the study. The step-by-step procedures used across sub-sectors actually brought out the commodity-based approach/stratification approach for this study.
• Primary data was collected from FPOs through survey schedule developed based on discussions with the line departments and on objectives envisaged.
• The present study used simple tabular analysis with appropriate measure of central tendencies for summarizing the scoping survey responses. Both quantitative and qualitative responses are used for summarizing the results by providing appropriate weights/scales as per the need.

21
• Diverse secondary sources of information regarding the cropped area, production, livestock population, storage facilities and rural market networks, etc. were used for deeper understanding and assessing the possibilities of setting up of FPOs across potential mandals in the state.
• Geographical Information Systems (GIS) tools were also applied for identifying the potential mandals across a range of commodities in a given district.
• Cropping area was the key indicator in determination of production estimates of commodities (mandal wise) in a district. Delineating pockets of production into a cluster encompassing different mandals in a district was attempted after analysing spatial data on acreage under different crops. Both primary and secondary commodities were suggested for FPO potentials. This enabled coverage of at least 70% of crop production from clusters in every district.
• Case study method is being used especially for highlighting the functional FPOs across sub-sectors.
• Recommendations and way forward was based on analysis of results and interpretation involved a thorough post ante analytical discussions by a panel of experts.
• Limitations for conducting the scoping study have been placed at the end of this chapter.
3.3 FPOs categorizationCategorization of FPOs was done before sampling of FPOs for the study. Also, the defining of sampling units was carefully undertaken keeping the study objectives in mind and involved a thorough scrutiny of data from both primary and secondary sources.
So far based on the available information in the state, the proposed number of FPOs in the state are falling short by 311 than the envisioned target of setting up 1000. The initial analysis also indicates that the proposed list of FPOs also may have some merger/convergence of activities or commodities across sub-sectors at selected locations. Most of the line departments have used ‘commodity-based approach’ while proposing the FPOs in the state. However, department’s capacity in handling the formation and management of FPOs needs to be taken-up on priority basis from the initial stage. This kind of effort brings harmony among the proposed FPOs in different sub-sectors. Enough ground work needs to be done on identification of sources of funds from initial set-up of FPOs till they reach maturity.
With this background, the proposed study was planned to cover both functional (currently registered and functioning) and proposed (not registered and yet to start functioning) FPOs for their deeper understanding about current status, capacity needs, constraints faced by them and ultimately identification of suitable policies for their strengthening and implementation in the state. It is worthy to study and cover both these categories of FPOs in the state for generating all-inclusive understanding of data and arrive at meaningful and practical recommendations in the present study. Therefore, a comprehensive study design has been adopted to cover both these categories and summarized in Figure 3.1.
Figure 3.1. Categorization of FPOs based on functionality and source.
FPO in AP
Functional Proposed
Agriculture 234
SFAC formed (5) NABARD formed (39) Horticulture 105
Animal Husbandry
Fisheries 65
SERP 39

22
As per secondary sources of information, there has been around 98 FPOs that are being registered formally and functioning in the state. They are formed based on two sources of funds: 1) SFAC and 2) PRODUCE fund under NABARD. A purposive random sampling method has been adopted to cover at least 1 to 2 functional FPOs (either most successful or failed ones) from each district in the state. A separate case study format has been prepared (Appendix 3.1) exclusively to cover this category. This format was pre-tested and standardized across cases to bring harmony among them for further comparison. It will be useful to comprehend the drivers behind the success/failure of each studied FPO in the state. This entire process will enlighten us to broadly understand the current situation as well as understand financial viability of these formal institutions in the state.
Similarly in case of proposed FPOs, the scoping baseline survey was planned to cover by sub-sector wise. The sub-sector wise sampling framework has been prepared for better representation of sample and coverage of survey sample units across all thirteen districts of the state. A separate five page baseline survey format (Appendix 3.2) has been designed to capture the information from proposed FPOs across commodities. The well-structured and pre-tested questionnaire was used to collect the information from the selected FPOs in each district. As highlighted in the previous sections, it would be herculean task to study all 689 proposed FPOs across commodities and districts. For bringing the cost and time efficiency, a sub-sample of sampling units covering all sub-sectors are planned. Therefore, a total of 10 proposed FPOs was surveyed in the present study to minimize the survey travel time and costs. The entire population has been divided in to three strata based on specialization of each sub-sector.
Strata 1: Agriculture, Horticulture and SERP commodities (grains, fruits, vegetables etc.)
Strata 2: Animal Husbandry commodities (dairy, sheep & goat, poultry and fodder etc.)
Strata 3: Fisheries commodities (fresh water, shrimp, marine, sea bass, mud crabs etc.)
3.4 Sampling framework Under each strata, a simple random procedure was followed to cover at least a ten percent of the total population. For strata 1, a district-mandal-crop-matrix was prepared to converge the proposed FPOs under each study district, mandal and selected crop/crops etc. based on source of funds (ie, NF/SAFC/NFSM/Horticulture/SERP). This summarized data matrix has been used for selecting the sub-sample for undertaking the baseline survey in case of both agriculture, horticulture and SERP proposed FPOs. For further details, the summary of data matrix has been furnished in Appendix 3.3.
A randomized sampling framework was prepared to cover strata 1 commodities using Appendix 3.4 information. Also, flexibility has been given to the survey team to alter the coverage of the FPOs based on the availability & cooperation from district officials. Enough care has also been taken in providing equal importance to all proposed FPOs under different funding sources. On the whole, about 49 proposed FPOs are planned to help cover under strata-1 in the scoping study. In majority of the situations, the survey responses were elicited from respective district agricultural officials (DAO) or NABARD team members or respective NGOs engaged in setting up or from CSR sponsoring agency. As anticipated earlier, in a given location of the mandal, the coverage/proposal of multiple crops are treated under only one FPO for better reporting purposes. The identified Strata-1 sampling framework is furnished in Table 3.1.
In case of Strata-2, similar procedure was followed and a sub-sample of units have been identified randomly under Animal Husbandry sub-sector. At least one proposed dairy FPO was targeted for all districts in the state. Based on the importance, the other types of FPOs were also covered in the respective districts. Overall, a total of 23 proposed FPOs were identified to cover 13 districts under the planned study. The details of sampling strategy are summarized in Table 3.2.
Similar sampling strategy also followed in case of strata-3 where the proposed FPOs under fisheries sub-sector was covered randomly. Also, care was taken to equally represent all types of proposed FPOs in this sub-sector. The sampling framework for coverage of fisheries sub-sector are furnished in Table 3.3.

23
Tabl
e 3.
1 Sa
mpl
ing
fram
e fo
r cov
erag
e of
pro
pose
d FP
Os i
n st
rata
-1
Dist
rict
Man
dal
AGRI
CULT
URE
sect
orHO
RTIC
ULT
URE
sect
or
SERP
Tota
l Co
vera
geSF
ACN
FSM
-Mill
ets
Horti
cultu
re c
rops
cov
ered
IGS
VRU
TTI
ALC
Anan
tapu
rGa
rladi
ne**
**M
illet
sRe
d gr
am,
Grou
ndnu
t2
Rapt
hadu
Grou
ndnu
t, Re
d gr
am, K
orra
Mill
ets
2Ch
ittoo
rRa
mak
uppa
mRi
ce, G
roun
dnut
Mill
ets
Vege
tabl
es3
Srik
alah
asth
iM
ango
1Ea
st
Goda
vari
Eles
war
amRi
ce, P
ulse
, Mai
ze, S
esam
eCa
shew
, Man
go, C
ocon
ut,
Bana
na2
Ram
pach
odav
aram
Rice
, Pul
se, M
aize
, Ses
ame
Cash
ew2
Gunt
urM
anga
lagi
riPu
lse, C
otton
, Jow
ar (s
orgh
um),
Mai
zeTu
rmer
ic, C
hilie
s2
Edla
padu
Pulse
, Cott
on, J
owar
(sor
ghum
), M
aize
Chili
es2
Kada
paVe
mpa
lliRi
ce, P
ulse
, Gro
undn
utBa
nana
2M
yduk
urRi
ce, P
ulse
, Gro
undn
ut1
Krish
naM
usun
uru
Rice
, Bla
ck g
ram
Bana
na,P
alm
oil,V
eget
able
s2
Myl
avar
amJa
smin
e, V
eget
able
s1
Kurn
ool
Dhon
eRi
ce, C
otton
, Mai
ze, B
enga
l gra
m, G
roun
dnut
, Re
d gr
am, B
lack
gra
m**
**M
illet
s2
Peap
alli/
Peap
ully
Rice
, Cott
on, M
aize
, Ben
gal g
ram
, Gro
undn
ut,
Red
gram
, Bla
ck g
ram
Oni
on, C
hili
2
Nel
lore
Ozil
liRi
ce, G
roun
dnut
, Bla
ck g
ram
, Gr
een
gram
, Veg
etab
le, L
ime
Man
go, S
apot
a2
Nai
dupe
taRi
ce, G
roun
dnut
, Bla
ck g
ram
, Gr
een
gram
, Veg
etab
le, L
ime
1
Prak
asam
Yerr
agon
dapa
lem
Beng
al g
ram
, Ric
e, C
hilie
s, V
eget
able
sM
ango
,Sap
ota,
Guav
a2
Nag
ulap
apad
uBe
ngal
gra
m, R
ice,
Chi
lies,
Veg
etab
les
1Sr
ikak
ulam
Seet
ham
peta
Rice
, Sug
arca
ne, M
aize
, Gre
en g
ram
, Bla
ck g
ram
, Fi
nger
mill
et**
Mill
ets
Amla
, Coc
onut
, Tam
arin
d,
Cash
ew, C
ocon
utCa
shew
3
Rana
stha
lam
Rice
, Sug
arca
ne, M
aize
, Gre
en g
ram
, Bla
ck g
ram
, ra
gi (fi
nger
mill
et)
1
Visa
khap
atna
mPa
deru
Rajm
a (R
ed K
idne
y Be
ans)
, Mill
ets,
Mai
zeM
illet
sM
edic
inal
Pla
nts
3G.
Mad
ugul
aM
edic
inal
Pla
nts,
Tur
mer
icTu
rmer
ic ,
coffe
e2
Vizia
naga
ram
Gum
ma
Laxm
ipur
amM
illet
sM
ango
, Sap
ota
Cash
ew3
Parv
athi
pura
mM
illet
s, R
ice,
Mai
zeCa
shew
2W
est G
odav
ari
Yela
man
chili
Rice
, Mai
ze, O
il pa
lm, B
lack
gra
mCo
conu
t2
Kovu
rru
Rice
, Mai
ze, O
il pa
lm, B
lack
gra
m1
Tota
l tar
gete
d 49
** In
dica
tes t
he d
omin
ance
of R
esou
rce
Insti
tutio
ns (R
I) in
thos
e re
spec
tive
dist
ricts
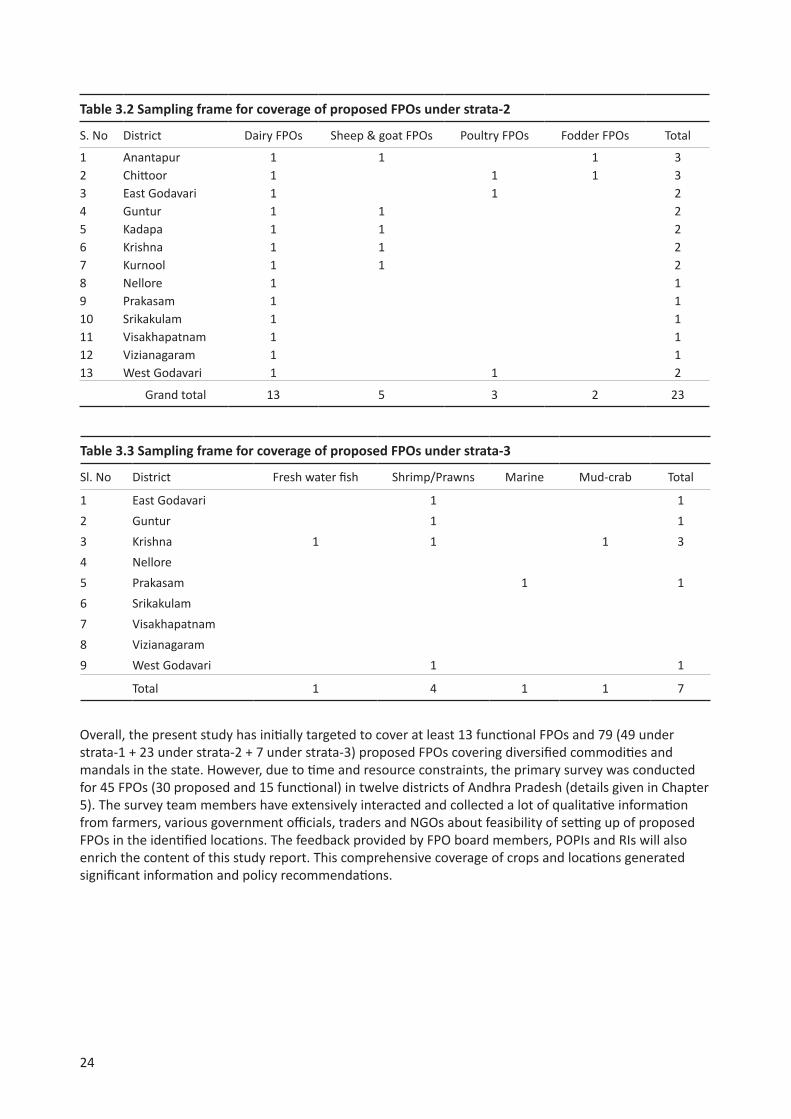
24
Table 3.2 Sampling frame for coverage of proposed FPOs under strata-2
S. No District Dairy FPOs Sheep & goat FPOs Poultry FPOs Fodder FPOs Total
1 Anantapur 1 1 1 32 Chittoor 1 1 1 33 East Godavari 1 1 24 Guntur 1 1 25 Kadapa 1 1 26 Krishna 1 1 27 Kurnool 1 1 28 Nellore 1 19 Prakasam 1 110 Srikakulam 1 111 Visakhapatnam 1 112 Vizianagaram 1 113 West Godavari 1 1 2
Grand total 13 5 3 2 23
Table 3.3 Sampling frame for coverage of proposed FPOs under strata-3
Sl. No District Fresh water fish Shrimp/Prawns Marine Mud-crab Total
1 East Godavari 1 12 Guntur 1 13 Krishna 1 1 1 34 Nellore5 Prakasam 1 16 Srikakulam7 Visakhapatnam8 Vizianagaram9 West Godavari 1 1
Total 1 4 1 1 7
Overall, the present study has initially targeted to cover at least 13 functional FPOs and 79 (49 under strata-1 + 23 under strata-2 + 7 under strata-3) proposed FPOs covering diversified commodities and mandals in the state. However, due to time and resource constraints, the primary survey was conducted for 45 FPOs (30 proposed and 15 functional) in twelve districts of Andhra Pradesh (details given in Chapter 5). The survey team members have extensively interacted and collected a lot of qualitative information from farmers, various government officials, traders and NGOs about feasibility of setting up of proposed FPOs in the identified locations. The feedback provided by FPO board members, POPIs and RIs will also enrich the content of this study report. This comprehensive coverage of crops and locations generated significant information and policy recommendations.

25
3.5 Data analysisSpatial analysis of production areas of commodity data was analyzed using GIS software. Analysis of secondary data sources by basic statistics for different commodity parameters were performed using MS Office Excel. Primary data obtained from survey questionnaires was subjected to quantitative analysis where ever possible, while qualitative data was presented during discussion of the results as specific examples. Also, case studies have been included to highlight the role played by FPOs in either identifying potential technological or management processes that can inspire all stakeholders.
3.6 Limitations of the study• The results generated from this study are based on representative random sample across various sub-
sectors. The findings can be scaled-up to the targeted mandals and districts only. They may be suitably modified when applied for the entire state.
• Time was a major factor that limited the survey time to revisit the FPOs during the deliberations, it is possible that this could have an influence on the responses recorded in the formats. For example, information relates to financial parameters and processes could be partial for analysing further.
• There were continuous drought years recently and information gathered on areas and production during a normal year could be different from the one collected during the drought period.
• Great care has been taken to minimize type 2 errors, which is failing to detect an effect that is present, however it is possible that there could be interesting learnings and even case studies from those FPOs that do not find a place in our research sample.
• It has been assumed that the secondary data sources available in public domain and those shared by the departments have been gathered with due diligence and scientific procedures.
• Some reference databases existing when accessed over internet might change due to technical or uncertainties over web protocols which are beyond the control of research team.

26
Chapter 4. Strategy of Andhra Pradesh State for FPOsAs highlighted in the Chapter 1, one of the major objectives of the present study was deeper understanding about current status of Farmers Producers Organizations (FPOs) in the state of Andhra Pradesh under different sub-sectors of primary sector. Specifically, to achieve ‘double digit growth’ in agriculture in the state, the government has initiated the ‘Primary Sector Mission’ (Rythu Kosam Mission) with massive outlay of investments over the next five years period (2015-2020) under consortium approach by bringing state, national and international partners on board. Also, interventions from both the supply and demand side are aimed at improving the livelihoods of the small and marginal farmers in the state. In order to provide better bargaining power and bring significant economic benefits to farmers in the state, there is an urgent need for setting up of farmer-membership-based institutions, which are well connected (to the technology, markets, credit and other infrastructure facilities), financially viable and can quickly adopt diverse business strategies. Both central and state governments are taking-up lot of initiatives to promote and strengthen ‘Farmers Producers Organizations (FPOs)’ as a strategy to enhance farmers’ welfare in the country. This structure not only provides technical know-how to farmers but also connects both input and outputs markets by completely negating the role of intermediaries. The formal networking of farmers also improves their capacity and empower them significantly. As per the recent ‘state FPO policy guidelines’, the government has envisioned to set-up 1000 FPOs to benefit at least one million farmers during the initial stages. With a series of deliberations with department of planning, most of the line departments have completed their meticulous planning in setting up of proposed FPOs across commodities in different districts. This initial secondary information was systematically collected from line departments, which was used as basis for this comprehensive scoping study in the state of Andhra Pradesh.
4.1 Functional FPO structure in Andhra Pradesh As discussed earlier, the functional FPOs were basically established by either Small Farmers Agribusiness Consortium (SFAC) or National Bank for Agricultural & Rural Development (NABARD) across different states in the country. The SFAC has implemented this project since the year 2011 in close collaborations with state governments, civil society and technical organizations as well as private sector companies. Also, by working across 25 states, the project has helped to mobilize approximately 0.695 million farmers in over 694 FPOs (428 registered and 266 under the process of registration), the majority of which have been incorporated as producer companies under the Companies Act, 1956. As many as five of them are registered in Andhra Pradesh as on 31-03-2016. The brief details of these FPOs are summarized in Table 4.1. All of them are registered as cooperatives and have identified the commercial crops as their coverage.
Table 4.1 List of FPOs set up by SFAC in Andhra Pradesh, 2016
FPO name Legal form of FPO FPO location Major crops covered
Sri Ramajanaya Agri-business centre
Cooperative Darsi, Prakasam Redgram, Cotton and Tobacco
Chinthala Cheruvu Neeti Viniyogadarula Sangam
Cooperative Polavaram, West Godavari Tobacco, Rice and Cotton
Thungabhadra Cooperative Cooperative Kodumur, Kurnool Rice, Groundnut and Carrot
Sri Seeta Ramanjaneya Rythu Vuapara Kendram
Cooperative Darsi, Prakasam Tur, Rice and Tobacco
Sri Srinivasa Agri-Business Centre Cooperative Darsi, Prakasam Tur, Cotton and Chilli dry
Source: http://sfacindia.com/PDFs/List-of-FPOidentified-by-SFAC/ListofFPOsintheStateofAndhraPradesh.pdf
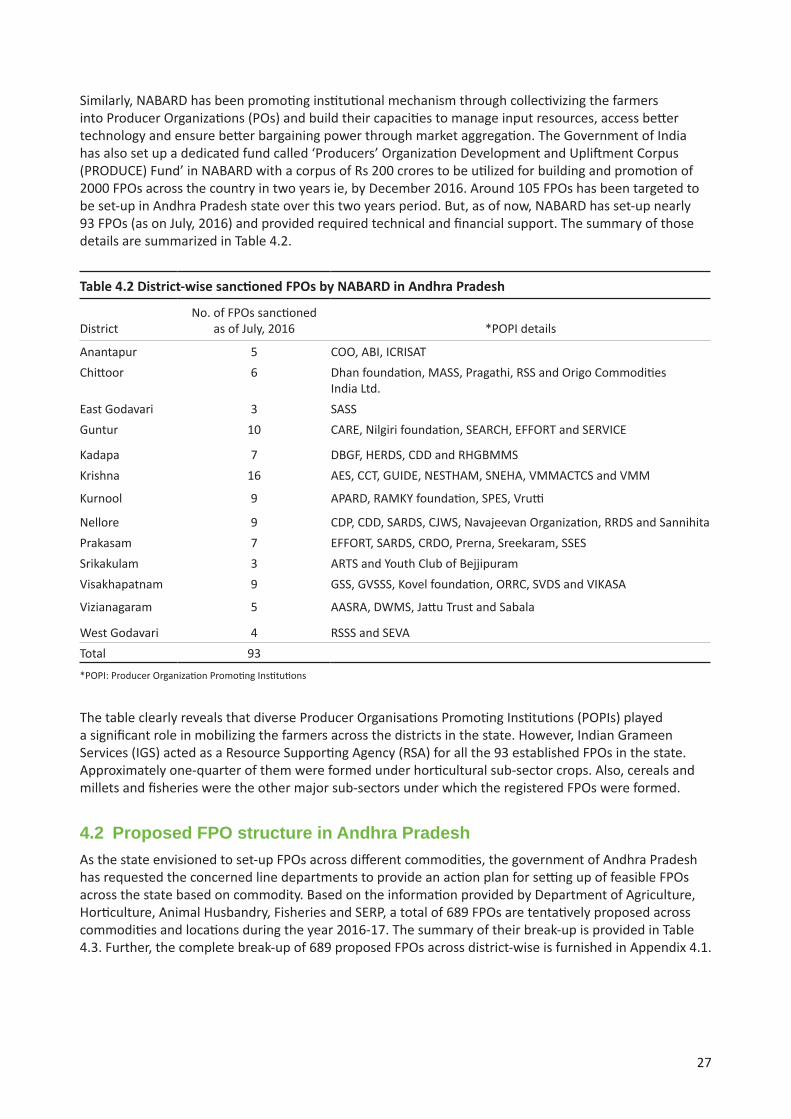
27
Similarly, NABARD has been promoting institutional mechanism through collectivizing the farmers into Producer Organizations (POs) and build their capacities to manage input resources, access better technology and ensure better bargaining power through market aggregation. The Government of India has also set up a dedicated fund called ‘Producers’ Organization Development and Upliftment Corpus (PRODUCE) Fund’ in NABARD with a corpus of Rs 200 crores to be utilized for building and promotion of 2000 FPOs across the country in two years ie, by December 2016. Around 105 FPOs has been targeted to be set-up in Andhra Pradesh state over this two years period. But, as of now, NABARD has set-up nearly 93 FPOs (as on July, 2016) and provided required technical and financial support. The summary of those details are summarized in Table 4.2.
Table 4.2 District-wise sanctioned FPOs by NABARD in Andhra Pradesh
District No. of FPOs sanctioned
as of July, 2016 *POPI details
Anantapur 5 COO, ABI, ICRISATChittoor 6 Dhan foundation, MASS, Pragathi, RSS and Origo Commodities
India Ltd. East Godavari 3 SASS Guntur 10 CARE, Nilgiri foundation, SEARCH, EFFORT and SERVICE
Kadapa 7 DBGF, HERDS, CDD and RHGBMMSKrishna 16 AES, CCT, GUIDE, NESTHAM, SNEHA, VMMACTCS and VMM
Kurnool 9 APARD, RAMKY foundation, SPES, Vrutti
Nellore 9 CDP, CDD, SARDS, CJWS, Navajeevan Organization, RRDS and Sannihita Prakasam 7 EFFORT, SARDS, CRDO, Prerna, Sreekaram, SSESSrikakulam 3 ARTS and Youth Club of BejjipuramVisakhapatnam 9 GSS, GVSSS, Kovel foundation, ORRC, SVDS and VIKASA
Vizianagaram 5 AASRA, DWMS, Jattu Trust and Sabala
West Godavari 4 RSSS and SEVATotal 93
*POPI: Producer Organization Promoting Institutions
The table clearly reveals that diverse Producer Organisations Promoting Institutions (POPIs) played a significant role in mobilizing the farmers across the districts in the state. However, Indian Grameen Services (IGS) acted as a Resource Supporting Agency (RSA) for all the 93 established FPOs in the state. Approximately one-quarter of them were formed under horticultural sub-sector crops. Also, cereals and millets and fisheries were the other major sub-sectors under which the registered FPOs were formed.
4.2 Proposed FPO structure in Andhra Pradesh As the state envisioned to set-up FPOs across different commodities, the government of Andhra Pradesh has requested the concerned line departments to provide an action plan for setting up of feasible FPOs across the state based on commodity. Based on the information provided by Department of Agriculture, Horticulture, Animal Husbandry, Fisheries and SERP, a total of 689 FPOs are tentatively proposed across commodities and locations during the year 2016-17. The summary of their break-up is provided in Table 4.3. Further, the complete break-up of 689 proposed FPOs across district-wise is furnished in Appendix 4.1.

28
4.2.1 AgricultureOverall, the Department of Agriculture proposes to undertake 234 FPOs in the state during the current financial year ie, 2016-17. This number has been attained after collecting basic information through structured questionnaires and repeated discussions held within the department. This entire exercise covered both the existing and newly proposed FPOs in the state. Also, existing fruits and vegetable FPOs are also taken into consideration. The proposed FPOs in case of agriculture sub-sector are going to be formulated and supported under three broad programs: 1) Natural Farming (NF/NPM); 2) Small-Farmers Agri-Business Consortium (SFAC); and 3) Millets revival program under National Food Security Mission (NFSM). The RKVY funds allocated to state and SFAC have been planned to be used for establishing and managing the FPOs during current financial year.
a. Natural Farming (NF/NPM): The Government of Andhra Pradesh is committed to create viable and sustainable farm livelihoods by promoting natural farming in 130 clusters covering 116 mandals in 80 divisions of 13 districts. Nearly 725 villages covering about 1,25,000 ha are initially targeted through creating awareness among Rythu Mitra groups, women self-help groups, NGOs etc. In the second phase, about 566 clusters covering nearly 0.5 million ha are being targeted for promoting non-pesticide crops cultivation. Overall, in the coming three years period, around 1 million farmers are going to be covered under this massive program5. The funds allocated under RKVY to the state has been earmarked to be utilized efficiently to cut-down the costs of cultivations and enrich the soil health status in the state. Under the first 130 clusters, about 131 Natural Farming FPOs are being proposed under different agricultural commodities covering 13 districts. The comprehensive details about NF/NPM FPOs by district are summarized in Table 4.4.
b. SFAC proposed FPOs: The Small-farmers Agri-Business Consortium (SFAC) in the state are planning to set-up about 56 FPOs covering both agricultural (4) and horticultural (8) crops in seven districts. The funds received through RKVY have been planned and committed to establish these FPOs in the state under Primary Sector Mission. The SFAC has identified three NGOs (IGS, Vrutti and ALC) as Resource Institutes (RIs) to establish these proposed FPOs in different districts. Most of these FPOs are in the formation stage (refer Table 4.5).
Millets revival program: Under comprehensive millets revival program supported by the National Food Security Mission (NFSM), about 41 millets cultivating (tribal (15) and rainfed (26)) mandals have been identified for setting up of about 47 FPOs in those locations. To strengthen millets production and increase the nutritional security in the tribal and rainfed mandals of the state, NFSM is encouraging to set-up these FPOs in the state. The district-wise coverage of these mandals are summarized in Table 4.6.
Overall, the entire approach seems to be a top-down approach rather than participatory planning from all the stake holders (bottoms-up approach). So, an element of inherent risk is involved in mobilizing large number of farmers for establishing FPOs in the selected locations and commodities. Also, strengthening of input and output market linkages as well as building capacities of FPOs in the planned time period is a cumbersome process especially as FPOs are envisioned to be profit making business entities.
5. Refer ‘Organic and In-organic Agricultural Methods’ report prepared by Department of Agriculture, Government of Andhra Pradesh for more details.
Table 4.3 Break-up of proposed FPOs across sub-sectors
Sub-sector Number of proposed FPOs
Agriculture 234Horticulture 105Animal Husbandry 246Fisheries 65SERP 39Total 689

29
Table 4.4 Break-up of NF/NPM proposed FPOs in the state by the department of agriculture
S. no DistrictNo. of
divisionsNo. of
mandalsNo. of
clustersNo. of
villagesNo. of FPOs Commodities coverage
1 Anantapur 6 8 10 53 10 Groundnut, red gram, foxtail millet (korra)
2 Chittoor 7 10 10 48 10 Rice, groundnut 3 East Godavari 5 10 10 67 10 Rice, pulse, maize, sesamum 4 Guntur 8 9 10 50 10 Pulses, cotton, jowar (sorghum),
maize5 Krishna 4 8 10 51 10 Rice, black gram6 Kurnool 4 6 10 53 11 Rice, cotton, maize, Bengal gram,
groundnut, red gram, black gram 7 Prakasam 5 10 10 50 10 Bengal gram, rice, chillies, vegetables
8 SPSR Nellore 6 8 10 54 10 Rice, groundnut, black gram, green gram, vegetables, lime
9 Srikakulam 6 9 10 77 10 Rice, sugarcane, maize, green gram, black gram and ragi (finger millet)
10 Visakhapatnam 9 10 10 71 10 Rajma (Red Kidney Beans), millets and maize
11 Vizianagaram 6 9 10 50 10 Millets, rice and maize12 West Godavari 6 10 10 51 10 Rice, maize, oil palm, black gram13 Kadapa 8 9 10 50 10 Rice, pulses, groundnut
Total 80 116 130 725 131
Source: Commissioner of Agricultural Office, Andhra Pradesh
Table 4.5 Proposed FPOs by SFAC under primary sector mission
CommodityProposed
no of FPOs
IGS proposed districts
(No. of FPOs)
Vrutti proposed districts
(No. of FPOs)
ALC proposed districts
(No. of FPOs)
No. of farmers to be
covered
Tomato 6 Chittoor (3) Chittoor (3) 6000Onion 6 Kurnool (3) Kurnool (3) 6000Chilly 5 Guntur(3),
Kurnool (2)5000
Banana 8 Kurnool (2) Kadapa(3), Anantapur (3)
8000
Rice 7 Kurnool (3) Kurnool (3) Srikakulam (1) 7000Maize 5 Kurnool (2),
Vizianagaram (3)5000
Cotton 9 Kurnool (3), Guntur (3)
Kurnool (3) 9000
Groundnut 6 Anantapur (3) Anantapur (3) 6000Cashew 1 Srikakulam (1) 1000Pineapple 1 Srikakulam (1) 1000Turmeric 1 Srikakulam (1) 1000Tamarind 1 Srikakulam (1) 1000Total 56 4 districts (30) 4 districts (21) 1 district (5) 56000
IGS: Indian Grameen Service VLRC: Vrutti Livelihood Resource Centre ALC: Access Livelihoods Consulting India Pvt Ltd.

30
4.2.2 HorticultureThe Department of Horticulture is quite active in setting up of FPOs since the year 2014. Between 2014-15 and 2015-16, nearly 39 FPOs have been proposed and registered with the support from NABARD’s PRODUCE fund. It is envisaged to promote and nurture about 105 FPOs over two year period under this grant. Also, as many as 66 FPOs are proposed to be set-up and registered during this financial year (2016-17). The Department of Horticulture also administered separate questionnaires to collate the existing FPOs as well as for proposed FPOs information from respective mandal horticultural officers. The department has also provided financial assistance in identifying appropriate clusters and training them with exposure visits through the RKVY funds. The summary of the registered FPOs across the state under the NABARD’s PRODUCE fund are tabulated in Table 4.7. However, the Department of Horticulture also provided the list of registered/proposed FPOs during the years 2014-15 and 2015-16 in terms of district and commodity wise and which have been supported by NABARD, these details are provided in Table 4.8.
Table 4.6 Selected mandals and proposed FPOs under millets revival program
District Type No. of mandals/ FPOs proposed
Anantapur Rainfed 20Chittoor Rainfed 6East Godavari Tribal 2Kurnool Rainfed 6Srikakulam Tribal 3Visakhapatnam Tribal 8Vizianagaram Tribal 2
Total 47
Table 4.7 District-wise status of FPOs under PRODUCE fund
S. No District No. of FPOs sanctioned FPOs registered Registration applied for
1 Anantapur 5 Nil -2 Chittoor 3 1 -3 East Godavari 3 Nil 34 Guntur 10 8 25 Kadapa 5 Nil -6 Krishna 14 10 57 Kurnool 8 3 -8 Nellore 7 Nil 29 Prakasam 5 Nil -10 Srikakulam 2 Nil -11 Visakhapatnam 8 Nil 112 Vizianagaram 5 Nil -13 West Godavari 4 4 -
Total 79* 26* 13*
* status as on 31-12-2015 Source: NABARD

31
Tabl
e 4.
8 Di
stric
t and
com
mod
ity-w
ise
FPO
s reg
iste
red/
prop
osed
with
NAB
ARD
durin
g th
e ye
ars 2
014-
15 a
nd 2
015-
16
S. N
o N
ame
of th
e Di
stric
tN
ame
of
POPI
No
of
FPO
Nam
e of
FPO
Man
dal
No
of
farm
ers
Com
mod
ities
1Ea
st G
odav
ari
SASS
2U
nder
Reg
istra
tion
Yele
swar
am
8688
Cash
ew, M
ango
, Coc
onut
& B
anan
a
2Gu
ntur
Nila
giri
Foun
datio
n 1
Man
gala
dhri
Agri
Prod
ucer
s Com
pany
Ko
llipa
ra, M
anag
algi
ri &
Tad
epal
li 50
0Tu
rmer
ic
Serv
ice
1Re
d Ch
ili fa
rmer
s pro
duce
rs c
ompa
nyM
acha
vara
m
60Ch
ili
Effor
t1
Spoo
rthi
Chi
lly P
rodu
cers
Com
pany
Eddl
apad
u 50
0Ch
ili
Nila
giri
Foun
datio
n1
Scha
met
ha P
rodu
cers
Com
pany
Ltd
Man
gala
giri
85Ch
ili a
nd tu
rmer
ic
SEAR
CH1
To b
e re
gist
ered
Ba
pata
lla65
Flor
icul
ture
3Kr
ishna
Nes
tham
1Sr
i Vig
nesw
ara
farm
ers P
rodu
cers
O
rgan
izatio
nTh
otal
aval
luru
25
0Ba
nana
1An
kam
mat
halli
farm
ers P
rodu
cers
O
rgan
izatio
nM
opid
evi
175
Vege
tabl
es
1Su
rya
Sai F
arm
ers P
rodu
cers
Org
aniza
tion
Mus
unur
u27
5Ba
nana
& O
il pa
lm
1Ba
ji Ba
ba fa
rmer
s Pro
duce
rs O
rgan
izatio
nN
adig
ama
250
Chi
li
1Ko
dur f
arm
ers P
rodu
cers
Org
aniza
tion
G. K
ondu
r22
5M
ango
CCT
1N
.G.R
anga
Far
mer
s Pro
duce
rs O
rgan
izatio
nG.
Kon
dur
200
Vege
tabl
es
1
Sri V
eera
njan
eya
Farm
ers P
rodu
cer
Org
aniza
tion
Myl
avar
am17
5Ja
smin
e
1
Chin
a O
gira
la fa
rmer
s Pro
duce
rs C
ompa
nyVu
yyur
u20
0Ve
geta
bles
1
M
usun
uru
52ve
geta
bles
4Ku
rnoo
lAP
ARD
1
Ponn
akka
l60
Vege
tabl
es
Vrutti
1
Pe
apal
li 10
1O
nion
, Chi
li
SPES
1
Aspa
ri82
Oni
on
5N
ello
reN
avaj
eeva
n O
rgan
izatio
n1
Ve
nkat
agiri
, Dak
kili,
Bal
ayap
alli,
Gu
duru
& C
hilli
kur
49Ve
geta
bles
CDP
1
Dora
varis
atra
m
45 M
ango
/ Sa
pota
Sann
ihita
1
Ozil
li 51
Man
go /
Sapo
ta
KPL
MAC
TS1
Ko
vuru
52Ja
smin
e
RRDS
1
Sidh
apur
60Ac
id li
me
KPL
MA C
TS1
In
duk u
rpet
a &
Tho
ta p
alli
gudu
r 58
Vege
tabl
es
Conti
nued
.

32
Tabl
e 4.
8 Co
ntinu
ed.
S. N
o N
ame
of th
e Di
stric
tN
ame
of
POPI
No
of
FPO
Nam
e of
FPO
Man
dal
No
of
farm
ers
Com
mod
ities
6Pr
akas
amSS
ES1
Pu
llala
cher
uvu,
Dor
nala
and
Ye
rrag
onda
pale
m
52M
ango
/Sap
ota/
Guav
a
Sree
kara
m1
Ta
rlupa
du, K
onak
ana
Mitt
ala
& D
onak
onda
54
Chili
Prer
na1
Cu
mbu
m
52Ch
ili
7Vi
sakh
apat
nam
Kove
l Fou
ndati
on
1D.
Gond
uru
Girij
ana
Ryth
u Se
va F
arm
er
Prod
ucer
Com
pany
Ltd.
Pade
ru50
0M
edic
inal
Pla
nts
1Hu
kum
peta
Giri
jana
Mah
ila R
ythu
Sev
a Fa
rmer
Pro
duce
r Com
pany
Ltd
Huku
mpe
ta60
0M
edic
inal
Pla
nts
1M
.Nitt
aputt
u Gi
rijan
a Ry
thu
Girij
ana
Ryth
u Se
va F
arm
er P
rodu
cer C
ompa
ny Lt
d.
G. M
adug
ula
500
Med
icin
al P
lant
s
VIKA
SA1
Du
mbr
igud
a10
00M
ango
GSS
1Va
raha
Coc
onut
farm
ers P
rodu
cer
Org
aniza
tion(
VCFP
O)
S. R
ayav
aram
50
0Co
conu
t
Org
anisa
tion
for R
ural
Re
-con
stru
ction
(ORR
C)1
Gm
adug
ula
150
Tur
mer
ic
8Vi
ziana
gara
m
Jatt
u Tr
ust
1De
sath
alli
Arati
Utta
path
i Dar
ula
Seva
Sa
ngam
Ga
rugu
billi
Man
dal
59 B
anan
a
1
Gum
mal
axm
ipur
am
63M
ango
and
Sap
ota
AASR
A1
Pa
chip
enta
58
Man
go
DMW
S1
Ba
dang
i 59
Vege
tabl
es
1
Vizia
naga
ram
Coc
onut
Pro
duce
rs
Fede
ratio
n Pu
sapa
tireg
a57
Coco
nut
1
Sri R
ama
Ryth
u M
itra
Sang
amN
ellim
arla
56Ve
geta
bles
1
Sree
Mitr
a Ry
thu
Saha
kara
San
gam
Salu
ru57
Bana
na
1
Giri
Jyot
hi K
urag
ayal
a U
ttapa
thi D
arul
a Se
va S
anga
mKu
rupa
m58
Vege
tabl
es
1
Sri C
hinn
amm
atha
lli K
urag
ayal
a U
ttapa
thi
Daru
la S
ocie
ty R
amba
drap
uram
Ram
badr
apur
am62
Vege
tabl
es
1
Ryth
u N
esta
m M
amid
i Utta
path
i Dar
ula
Soci
ety
Akul
akatt
aBa
dang
i53
Man
go
Conti
nued
.

33
Tabl
e 4.
8 Co
ntinu
ed.
S. N
o N
ame
of th
e Di
stric
tN
ame
of
POPI
No
of
FPO
Nam
e of
FPO
Man
dal
No
of
farm
ers
Com
mod
ities
1
Ryth
u M
itra
Kura
gaya
la U
ttapa
thi D
arul
a So
ciet
y Ka
lliko
taKo
mar
ada
53Ve
geta
bles
1
Prag
athi
Veg
etab
le P
rodu
cers
Mut
ually
Ai
ded
Coop
erati
ve T
hrift
& C
redi
t Soc
iety
Lt
d.Ra
mba
drap
uram
57Ve
geta
bles
1
Swam
i Ayy
appa
Ryt
hu M
itra
Sang
am
Vepa
da55
Vege
tabl
es
9W
est G
odav
ari
Rahu
l Soc
ial S
ervi
ce
Soci
ety
1
Yela
man
chal
li 48
Coco
nut
SEVA
1Ve
nkat
esw
ara
vege
tabl
e gr
ower
s mut
ually
ai
ded
coop
erati
ve so
ciet
y ltd
. Dw
arak
a Da
war
akati
rum
ala
15Ve
geta
bles
1
Jeel
umill
i26
Cash
ew
10Ka
dapa
RHGB
MM
S1
Sai S
anga
mes
war
a Ho
rticu
lture
farm
er
prod
uces
Mut
ually
aid
ed c
oope
rativ
e so
ciet
yVe
mpa
lli10
0Ba
nana
11Ch
ittoo
r
Prag
athi
1
KVB
Pur a
m, Y
erpe
du a
nd S
rikal
ahas
thi
42M
ango
1
Gudi
pala
Man
dala
Vay
alag
a Ry
thul
a Sa
mak
hya
Gudi
pala
39
7Ve
geta
bles
1
P ala
man
er M
anda
la V
ayal
aga
Ryth
ula
Sam
akhy
aPa
lam
aner
38
5Ve
geta
bles
1
Y
V P a
lem
47M
ango
1
V a
yalp
adu
48Ve
geta
bles
1
Pung
anur
Man
dala
Vay
alag
a Ry
thul
a Sa
mak
hya
Pung
anur
75
0Ve
geta
bles
12Sr
ikak
ulam
ARTS
3
See t
ham
pet a
nd V
eera
ghatt
am
5056
Amla
, Coc
onut
Tam
arin
d an
d Ca
shew
T o
tal
60
2332
7
Sour
ce: D
epar
tmen
t of H
ortic
ultu
re, 2
016.

34
4.2.3 Animal husbandryThe Department of Animal Husbandry has followed a strategic approach for identifying potential FPOs across the state under different thrust areas like dairy, sheep and goat rearing, poultry and fodder sources. To uplift the socio-economic status of the rural farming communities, the department has initially identified the Farmer Interest Groups (FIG) and has been providing the technical inputs, infrastructure facilities and also providing market linkages. They have conducted village-wise census to collect information on different aspects like total livestock population, types of breeds, existing cropping patterns, extent of availability of crop residues/agro-industrial by-products and ultimately on local consumption demand of animals products etc. By keeping in view the ongoing broad range of interventions across state, the department has proposed around 246 FPOs in this sub-sector. As many as 176 FPOs are proposed under dairy sector, 55 FPOs under sheep and goat sector, about 10 FPOs in poultry sector, and 5 FPOs in case of feed and fodder sector. More than 0.12 million farmers are planned to be directly linked with these 176 proposed FPOs under dairy sector in the state. The sector-wise break-up of FPOs and coverage of farmers details are tabulated in Table 4.9.
Table 4.9 District-wise proposed FPOs in livestock sector
DistrictDairy FPO
No. Farmers
Sheep & Goat FPO
No. Farmers
Poultry FPO
No. of Farmers
Fodder FPO
No. of Farmers
Total Farmers
Anantapur 13 6425 11 5963 0 0 2 214 12602Chittoor 12 6258 2 1025 2 981 2 261 8525Kadapa 15 7462 6 3002 0 0 0 0 10464East Godavari 38 18950 0 0 3 1475 0 0 20425Guntur 9 4462 6 2958 1 402 0 0 7822Krishna 19 9462 7 3468 1 458 1 52 13440Kurnool 18 9682 11 5896 0 0 0 0 15578Nellore 5 2486 2 963 0 0 0 0 3449Prakasam 12 5998 2 965 0 0 0 0 6963Srikakulam 8 4025 2 952 0 0 0 0 4977Visakhapatnam 6 3010 2 905 1 425 0 0 4340Vizianagaram 6 3120 2 920 0 0 0 0 4040West Godavari 15 7230 2 948 2 918 0 0 9096
Total 176 88570 55 27965 10 4659 5 527 121721
Source: Department of Animal Husbandry
The Animal Husbandry department has a plan to convert existing cooperative societies into FPOs, specifically in case of dairy sector. However, the milk cooperatives are successful in the districts of Vishakhapatnam, Krishna and Chittoor. Therefore, the department is anticipating ample space and potential to further strengthen, replicate these models in the remaining ten districts of the state. At this stage, the department strongly believes in activities like fresh milk aggregation from small and marginal producers, bulk cooling and its re-distribution to local consumers. They are not attempting any value addition processes/diversification of products through FPOs at this juncture. Also, capacity building of FPOs is identified as a herculean task as very few resource organizations are available or have existed in this area. Overall, the department is planning to adapt the demand-driven approach to set-up the proposed FPOs in selected locations of the state.

35
4.2.4 FisheriesThe Department of Fisheries is in advanced stage of preparation of ‘concept note on proposed FPOs’ in the state when compared with other sub-sectors. The marine and inland capture fisheries is a traditional occupation practiced by a particular section of people in the society. Both the production and productivity of these cultures are highly subjected to natural conditions. The forward linkage of marketing and export is very critical in case of fisheries because of its highly perishable nature and consumer-centric nature. Overall, the department aims to minimize/reduce these gaps through setting up of proposed FPOs across state. Recently, the department also introduced the concept of ‘zonation of aquaculture’ ie, cluster approach to aqua farming (identified nearly 69 clusters) and disease surveillance mechanisms (11 teams are constituted) in shrimp culture for adopting best management practices in aquaculture. Selection of quality seed for stocking and effective disease management are two prime aquaculture activities to be undertaken collectively under cluster approach among farmers. The department also perceives that the concept of FPOs has not yet percolated down to field functionaries i.e., up to farmers and among other stakeholders level. There is a need to give clarity on the roles to be performed by various stakeholders in establishment and monitoring of the proposed FPOs. After repeated deliberations among district officials and meticulous planning, the department has proposed to set-up about 65 FPOs in the state among different areas. The break-up of the total proposed FPOs in case of fisheries department are summarized in Table 4.10.
Table 4.10 Proposed FPOs under fisheries department
S. No DistrictFresh water
FishShrimp /
prawn Marine Marketing SeabassMud crab Total
1 East Godavari 1 11 1 0 0 0 132 Guntur 2 4 1 0 0 1 83 Krishna 4 10 3 0 1 2 204 Nellore 0 3 0 0 0 0 35 Prakasam 1 3 3 0 0 0 76 Srikakulam 0 1 0 0 0 0 17 Visakhapatnam 0 1 2 0 0 0 38 Vizianagaram 0 0 0 1 0 0 19 West Godavari 3 6 0 0 0 0 9 Total 11 39 10 1 1 3 65
Source: Department of Fisheries
Overall, the total number of fishers/aqua farmers to be organized in the state are 90,853 belonging to 578 villages in 9 coastal districts. Thus, each FPO will be having approximately 1,000 to 1,500 members. Tentatively, about 32% of total fish/prawn/shrimp production in the state is to be handled by these proposed FPOs. On the whole, the department has given good thought on how to strengthen both forward and backward linkages as well as identification of major constraints in case of proposed FPOs. A scientific approach has been undertaken by department in mapping various clusters, catchment areas of inland fisheries and identification of coastal marine village lands using APSAC (Andhra Pradesh Space Application Centre) maps. The Fisheries department is already an evolved industry and has established a network of large farmers in the state. However, bringing small and marginal farmers appears to have been held behind , wherein huge potential exists to organize them under proposed FPOs. A total financial outlay of Rs 94.7 million is also estimated to set-up these proposed 65 FPOs in the state. The expected outcomes through setting up these FPOs are discussed in their concept note.

36
4.2.5 Society for Elimination of Rural Poverty (SERP)SERP is also planning to set-up FPOs in the state for enhancing the livelihood of small and marginal farmers. SERP has a target of setting up about 79 FPOs broadly covering different sectors. However, around 39 FPOs from the list are being planned to be formed under agriculture and allied activities. The society also has plans to form FPOs based on their value propositions and the three fold agenda in formation of FPOs are: a) increase incomes, b) reduce costs, and c) enhance productivity gains. A preliminary information regarding crop production, value of output, farm income etc. were collected and analyzed to arrive at the sizable number of proposed FPOs in the state. They are initially identifying the Farmers’ Interested Groups (FIGs) and expanding them to constitute the FPOs across various locations. SERP emphasize on the ‘value proposition’ and it needs to be clearly communicated to farmers through field demonstrations and technology interventions. The society has a clear objective of ‘increasing the farm income by 50%’ during the span of next five years’ time period in the targeted locations. The society has received funds from the World Bank to achieve this objective in the state. SERP also perceives that lack of coordination among stakeholders and line departments are the biggest concern in achieving this common goal. Also, duplication of activities, commodities and interventions are its limitations. The details about proposed no. of FPOs by district and commodity in the state are furnished in Table 4.11. Thus, a total of nearly 86,000 farmers are being directly targeted through SERP interventions in the state.
Table 4.11 SERP proposed FPOs in Andhra Pradesh
FPOs Proposed Commodity/Value chain Name of the district Mandal No of farmers
1 Red gram + Groundnut Anantapur Tanakal 2000Red gram + Groundnut Anantapur Nallacheruvu 1200
1 Red gram + Groundnut Anantapur Singanamala 2000Red gram + Groundnut Anantapur Garladinee 1200
1 Rice + Vegetables East Godavari Rowthulapudi 1200Rice + Vegetables East Godavari Kotananduru 1000
1 Cashew East Godavari Y Ramavaram 1200Cashew East Godavari Gangavaram 1200Cashew East Godavari Maradumilli 1400
1 Cashew East Godavari Addateegala 20001 Cashew East Godavari Rampachodavaram 32001 Cashew East Godavari Rajavommangi 20001 Cashew East Godavari Devipatnam 8001 Chilies Guntur Amaravathi 1000
Chilies Guntur Krosuru 10001 Chilies Guntur Kakamanu 600
Chilies Guntur Pedanandipadu 6001 Bengal gram + Chilies Kadapa Mylavaram 800
Bengal gram + Chilies Kadapa Jammalamadugu 8001 Red gram + Groundnut Kadapa Galiveedu 800
Red gram + Groundnut Kadapa Chakrayapet 8001 Rice+ Black gram Krishna A Konduru 600
Rice+ Black gram Krishna Gampalagudem 10001 Chilies + Vegetables Krishna Veerullapadu 1000
Chilies + Vegetables Krishna G. Konduru 8001 Red gram Kurnool Veldurthi 1800
Red gram Kurnool Bethamcherla 1400Continued.

37
Table 4.11 Continued.
FPOs Proposed Commodity/Value chain Name of the district Mandal No of farmers
1 Red gram Kurnool Athmakur 1000Red gram Kurnool Kothapalle 1000
1 Rice + Black gram Nellore Sydapuram 1400Rice + Black gram Nellore Balayapalle 1600
1 Rice + Black gram Nellore Kaluvoya 1000Rice + Black gram Nellore Podalakuru 1400
1 Red gram + Black gram Prakasam Kanigiri 1400Red gram + Black gram Prakasam Hanumanthunipadu 1000
1 Rice + Red gram Prakasam Addanki 1000Rice + Red gram Prakasam Maddipadu 1000
1 Cashew Srikakulam Seethampeta 26001 Cashew Srikakulam Bhamini 1000
Cashew Srikakulam Kothuru 14001 Cashew Srikakulam Meliaputti 1200
Cashew Srikakulam Mandasa 24001 Cashew Srikakulam Hiramandalam 800
Cashew Srikakulam Pathapatnam 10001 Cashew Srikakulam Vajrapakothur 12001 Cashew Visakhapatnam Golugonda 2000
Cashew Visakhapatnam Narsipatnam 8001 Turmeric + coffee Visakhapatnam Gangaraju Madugula 18001 Vegetables Visakhapatnam Dumbriguda 1000
Vegetables Visakhapatnam Araku Valley 10001 Turmeric + coffee Visakhapatnam Chinthapalli 14001 Cashew Vizianagaram Merakamudidam 14001 Vegetables Vizianagaram Ramabhadrapuram 12001 Cashew Vizianagaram Gummalakshmipuram 22001 Cashew Vizianagaram Kurupam 24001 Cashew Vizianagaram Salur 22001 Cashew Vizianagaram Parvathipuram 1800
Cashew Vizianagaram Makkuva 12001 Rice + Black gram West Godavari Dwaraka Tirumala 1000
Rice + Black gram West Godavari Nallajerla 10001 Vegetables + rice West Godavari Gopalapuram 1000
Vegetables + rice West Godavari Thallapudi 8001 Vegetables Chittoor Kuppam 1600
Vegetables Chittoor Gudipalli 12001 Vegetables Chittoor Ramakuppam 1200
Vegetables Chittoor Santhipuram 160039 Total 86600

38
Chapter 5. Status of Existing FPOs in Andhra Pradesh StateAs highlighted in Chapter 4, the present scoping study covers both proposed and functional FPOs. These have been visited and interviewed by the ICRISAT team during May-August, 2016 across the state. The primary survey covered 45 FPOs (30 proposed and 15 functional) in twelve districts of Andhra Pradesh. As highlighted in the earlier sections, both case study approach and administration of questionnaires were used to collect the primary data for the selected FPOs. Both secondary sources of information and primary data collected at FPO level were used for summarizing the results in this Chapter. The brief details about the coverage of whole baseline survey was summarized in Table 5.1.
For the quick study, 39 mandals have been covered randomly across twelve districts of the state. Among the total (45) FPOs covered in the study, agriculture occupied the highest number (16), followed by horticulture (15), fisheries (8) and animal husbandry (6) sub-sectors. About two-third of the total sample consisted of proposed FPOs, while the remaining were functional FPOs to help extract required information from diverse sub-sectors. The collected information from the survey was tabulated systematically and treated with tabular analysis. The findings emanating from the survey were discussed in two separate sub-headings (proposed and functional FPOs) for better brevity of the results and deeper understanding about FPOs functionalities.
5.1 Insights from scoping study of existing FPOs (proposed)The insights generated from 30 proposed FPOs are summarized and discussed in detail in the following sub-sections:
5.1.1 Nature and organizational structure The nature and organizational structure of proposed FPOs are summarized briefly in Table 5.2. Nearly one-third of proposed FPOs covered under the study belonged to agriculture sub-sector. It was followed by horticulture (30%), fisheries (20%) and animal husbandry sub-sectors (17%). Almost half of the total sample FPOs proposed (some are even at very nascent stage, i.e. planning stage) are facilitated by Government organizations, mostly department of agriculture/ horticulture/ animal husbandry/ fisheries. Another 43% are supported by Non-Governmental Organizations (NGOs)/ charity foundations existing in various mandals/villages. About 6.7% of the total FPOs are also encouraged by Multi-Aided Cooperative Societies (MACS).
Table 5.1 Coverage of primary survey in the study
S. no District
No. of mandals covered
No. of FPOs interviewed FPO belongs to sub-sector
Proposed Functional Total Agriculture Horticulture AH Fisheries
1 Krishna 5 1 4 5 1 2 0 22 Guntur 3 5 1 6 4 0 1 13 Kadapa 4 3 1 4 1 1 1 14 Kurnool 3 2 1 3 2 0 1 05 Prakasam 2 1 1 2 1 0 1 06 East Godavari 5 5 1 6 0 3 0 37 West Godavari 3 4 1 5 5 0 0 08 Visakhapatnam 5 5 0 5 0 3 1 19 Chittoor 3 3 0 3 0 2 1 010 Nellore 3 0 3 3 0 3 0 011 Vizianagaram 2 0 2 2 2 0 0 012 Srikakulam 1 1 0 1 0 1 0 0
Total 39 30 15 45 16 15 6 8
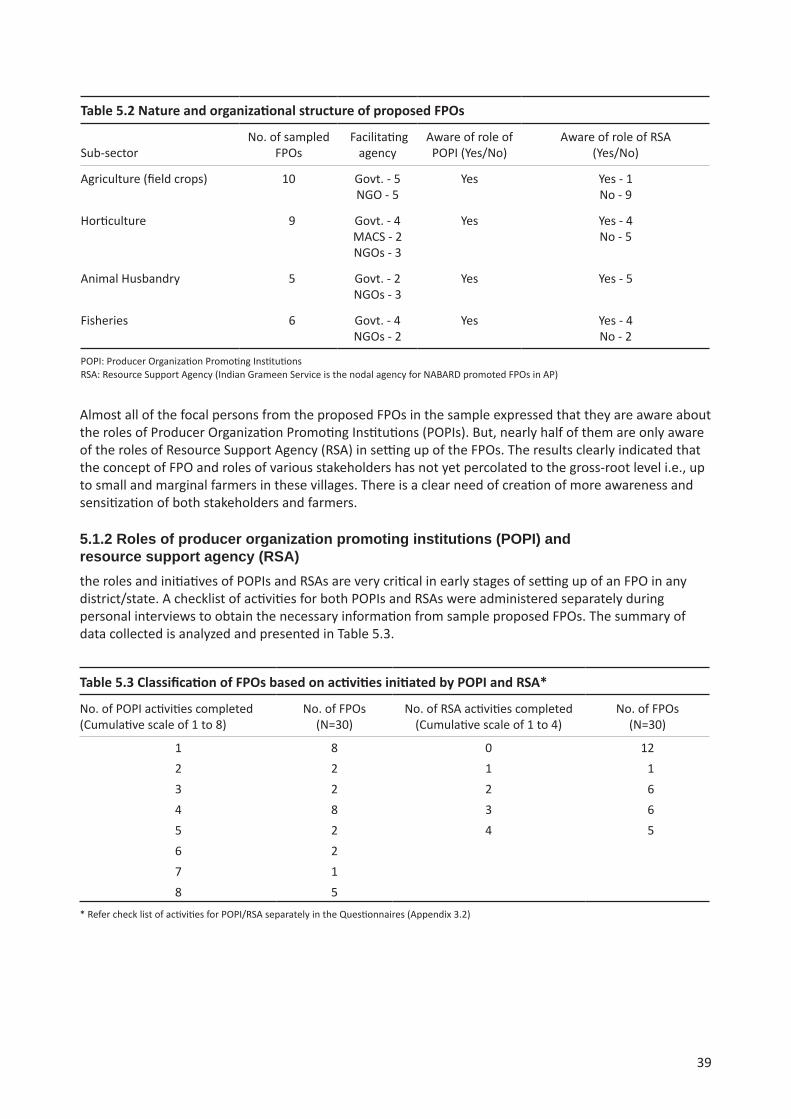
39
Almost all of the focal persons from the proposed FPOs in the sample expressed that they are aware about the roles of Producer Organization Promoting Institutions (POPIs). But, nearly half of them are only aware of the roles of Resource Support Agency (RSA) in setting up of the FPOs. The results clearly indicated that the concept of FPO and roles of various stakeholders has not yet percolated to the gross-root level i.e., up to small and marginal farmers in these villages. There is a clear need of creation of more awareness and sensitization of both stakeholders and farmers.
5.1.2 Roles of producer organization promoting institutions (POPI) and resource support agency (RSA) the roles and initiatives of POPIs and RSAs are very critical in early stages of setting up of an FPO in any district/state. A checklist of activities for both POPIs and RSAs were administered separately during personal interviews to obtain the necessary information from sample proposed FPOs. The summary of data collected is analyzed and presented in Table 5.3.
Table 5.2 Nature and organizational structure of proposed FPOs
Sub-sectorNo. of sampled
FPOs Facilitating
agencyAware of role of POPI (Yes/No)
Aware of role of RSA (Yes/No)
Agriculture (field crops) 10 Govt. - 5NGO - 5
Yes Yes - 1No - 9
Horticulture 9 Govt. - 4MACS - 2NGOs - 3
Yes Yes - 4 No - 5
Animal Husbandry 5 Govt. - 2NGOs - 3
Yes Yes - 5
Fisheries 6 Govt. - 4NGOs - 2
Yes Yes - 4No - 2
POPI: Producer Organization Promoting Institutions RSA: Resource Support Agency (Indian Grameen Service is the nodal agency for NABARD promoted FPOs in AP)
Table 5.3 Classification of FPOs based on activities initiated by POPI and RSA*
No. of POPI activities completed (Cumulative scale of 1 to 8)
No. of FPOs (N=30)
No. of RSA activities completed (Cumulative scale of 1 to 4)
No. of FPOs (N=30)
1 8 0 122 2 1 13 2 2 64 8 3 65 2 4 56 27 18 5
* Refer check list of activities for POPI/RSA separately in the Questionnaires (Appendix 3.2)

40
Based on no. of activities initiated, a simple cumulative scale was developed across POPI and RSA listed activities and correspondingly proposed FPOs were classified against them. Only five each of the proposed FPOs have initiated both the check listed POPI and RSA activities elicited in the questionnaire out of the total sample (N=30) interviewed. About 26.7% of total FPOs are still in the initial stages (Cumulative of scale -1) of POPI activities due to various reasons. Nearly 40% of sample FPOs are not even initiated (Cumulative scale - 0) the RSA activities in the respective FPOs. These findings clearly reveal that many of proposed FPOs are in very nascent stage.
5.1.3 Stage of FPO formationThe sample FPOs were categorized based on ‘stage of FPO formation’ across study districts. The surall, nearly half (46.7%) of the sample proposed FPOs have just initiated the process of setting up and rmmarized information provided in Table 5.4 visualizes their stages of formation across sub-sectors. Oveegistration formalities. Another 33.3% of sample proposed FPOs have ‘just identified’ the sectors or crop groups to move forward. About 16.7% of those have ‘just completed the registration process but not functioning’. Only one out of the 30 proposed sample FPOs is existing but not yet registered. The categorization slightly varies from sub-sector to sub-sector. However, majority of them either have just identified the area to form the FPO or ‘initiated the process’ category. It is a long way to move forward and complete the registration formalities and kick-start. Many of the focal persons expressed that the ‘registration of FPO’ takes a minimum of six-twelve months time. It costs a minimum of Rs 50,000 towards registration of each FPO. Many of them have also opined that they do not have sufficient funds to move further.
Table 5.4 Stages of FPO formation
Sub-sector Stages of formationNo. of FPOs
(n=30)
Agriculture (10) Registered but not functional
Exist but not registered
Initiated process of group formation
Just identified
1126
Horticulture (9) Registered but not functional
Exist but not registered
Initiated process of group formation
Just identified
2043
Animal Husbandry (5) Registered but not functional
Exist but not registered
Initiated process of group formation
Just identified
0041
Fisheries (6) Registered but not functional
Exist but not registered
Initiated process of group formation
Just identified
204
0

41
5.1.4 Membership pattern and share contribution It would be interesting to elicit and understand the target membership pattern and decisions about unit share values from proposed FPOs across sub-sectors. The details are summarized and furnished in Table 5.5.
A majority (50%) of FPOs are having the proposed membership range between 51 and 500 across sub-sectors. Only 13.3% of proposed FPOs also indicated that they targeted membership range beyond 500 per FPO. Around 30% of the sample FPOs also expressed that their target membership range will be less than 50. Most of these FPOs proposed under Natural Farming (NF/NPM) belongs to agricultural sub-sector. The unit share values varied from sub-sector to sub-sector and from proposed FPO to FPO. Majority of them started with Rs 10 or multiples of it. Few of those also started with Rs 100 or multiples of it.
Table 5.5 Target membership pattern and unit share values
Sub-sector Average membership range No. of FPOs (n=30) Unit share value range (Rs)
Agriculture (10) < 50
51-500
>500
5
4
1
100
10-2500
1000Horticulture (9) < 50
51-500
>500
NA
1
3
3
2
NA
100
50-1000
NAAnimal Husbandry (5) < 50
51-500
>500
0
5
0
-
10-1500
-Fisheries (6) < 50
51-500
>500
3
3
0
1500
10-1000
-
NA: Not yet decided
5.1.5 Composition of FPO membersComposition of FPO members is the key for taking appropriate decisions to move forward and also for long-term sustainability of operations. The basic characteristic of each FPO are elicited and the information is furnished in Table 5.6.
Table 5.6 Nature and composition of FPO members
Share of small & marginal farmers in total membership of the FPO
No. of sample FPOs (n=30)
100% 15Between 80-99% 3Between 50-79% 6Less than 50% 4Other type 2
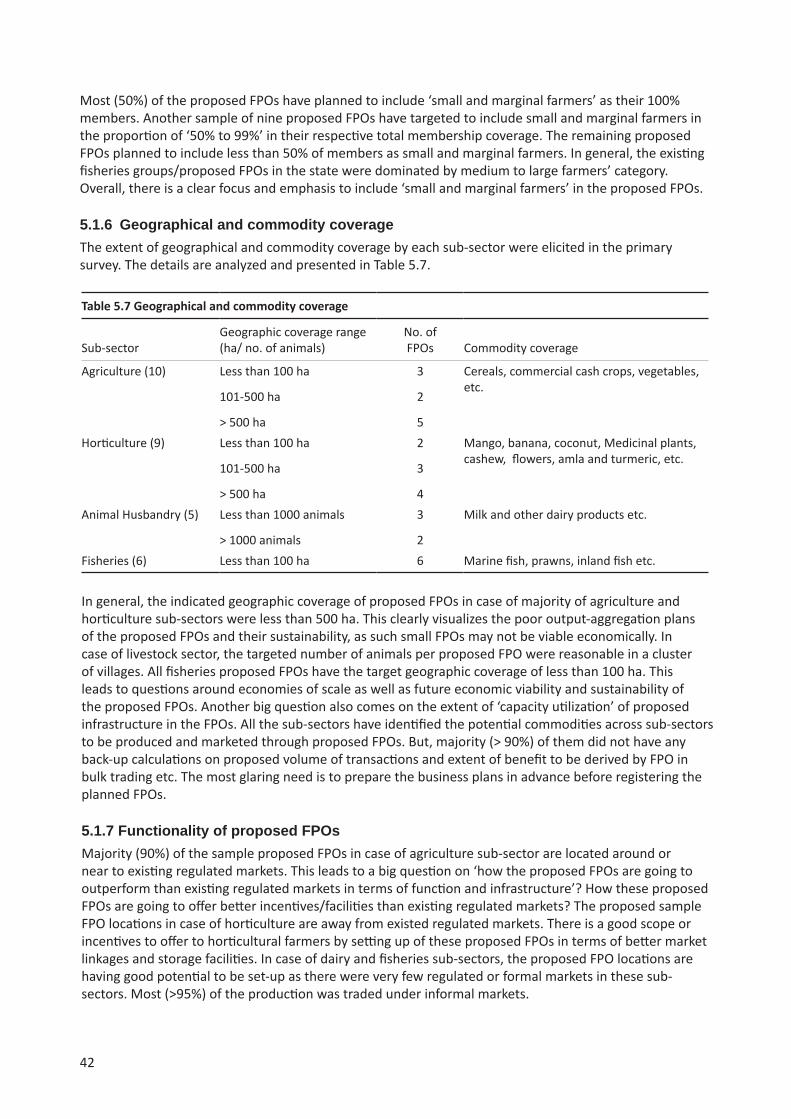
42
Most (50%) of the proposed FPOs have planned to include ‘small and marginal farmers’ as their 100% members. Another sample of nine proposed FPOs have targeted to include small and marginal farmers in the proportion of ‘50% to 99%’ in their respective total membership coverage. The remaining proposed FPOs planned to include less than 50% of members as small and marginal farmers. In general, the existing fisheries groups/proposed FPOs in the state were dominated by medium to large farmers’ category. Overall, there is a clear focus and emphasis to include ‘small and marginal farmers’ in the proposed FPOs.
5.1.6 Geographical and commodity coverage The extent of geographical and commodity coverage by each sub-sector were elicited in the primary survey. The details are analyzed and presented in Table 5.7.
Table 5.7 Geographical and commodity coverage
Sub-sectorGeographic coverage range (ha/ no. of animals)
No. of FPOs Commodity coverage
Agriculture (10) Less than 100 ha
101-500 ha
> 500 ha
3
2
5
Cereals, commercial cash crops, vegetables, etc.
Horticulture (9) Less than 100 ha
101-500 ha
> 500 ha
2
3
4
Mango, banana, coconut, Medicinal plants, cashew, flowers, amla and turmeric, etc.
Animal Husbandry (5) Less than 1000 animals
> 1000 animals
3
2
Milk and other dairy products etc.
Fisheries (6) Less than 100 ha 6 Marine fish, prawns, inland fish etc.
In general, the indicated geographic coverage of proposed FPOs in case of majority of agriculture and horticulture sub-sectors were less than 500 ha. This clearly visualizes the poor output-aggregation plans of the proposed FPOs and their sustainability, as such small FPOs may not be viable economically. In case of livestock sector, the targeted number of animals per proposed FPO were reasonable in a cluster of villages. All fisheries proposed FPOs have the target geographic coverage of less than 100 ha. This leads to questions around economies of scale as well as future economic viability and sustainability of the proposed FPOs. Another big question also comes on the extent of ‘capacity utilization’ of proposed infrastructure in the FPOs. All the sub-sectors have identified the potential commodities across sub-sectors to be produced and marketed through proposed FPOs. But, majority (> 90%) of them did not have any back-up calculations on proposed volume of transactions and extent of benefit to be derived by FPO in bulk trading etc. The most glaring need is to prepare the business plans in advance before registering the planned FPOs.
5.1.7 Functionality of proposed FPOs Majority (90%) of the sample proposed FPOs in case of agriculture sub-sector are located around or near to existing regulated markets. This leads to a big question on ‘how the proposed FPOs are going to outperform than existing regulated markets in terms of function and infrastructure’? How these proposed FPOs are going to offer better incentives/facilities than existing regulated markets? The proposed sample FPO locations in case of horticulture are away from existed regulated markets. There is a good scope or incentives to offer to horticultural farmers by setting up of these proposed FPOs in terms of better market linkages and storage facilities. In case of dairy and fisheries sub-sectors, the proposed FPO locations are having good potential to be set-up as there were very few regulated or formal markets in these sub-sectors. Most (>95%) of the production was traded under informal markets.

43
5.1.8 Sources and flow of financeIn general, setting up of or nurturing of FPO is a capital intensive process. Awareness regarding the mobilization of needed capital is an important step in formation of an FPO. Utilization of sufficient financial resources through various on-going government schemes is critical in early stages of FPO. About 60% of total sample FPOs focal persons do not have awareness about these opportunities. Only the remaining (40%) of them opined that they have reasonable awareness about these financial opportunities. To overcome these issues, the state government has highlighted in session 12 of its guidelines about various financial provisions created for FPOs. In general, the cost of registration is hovering around 50,000 per FPO. It become a huge burden on the farmer groups. If the FPO is engaged in selling raw produce, it will not attract any taxes. However, if the produce is processed and branded, it will attract commercial taxes between 5 to 14%.
5.1.9 Creation of infrastructure facilities Creation of basic infrastructure facilities like storage space, grading facilities, scientific post-harvest handling, transportation vehicles etc. are, in general, major attractions for mobilizing the new members in the FPO. But, creation of these facilities required sufficient capital and strong business model to move forward. Only 30 % of the total proposed sample FPOs have started at least some of these services to offer to their members. The most interesting issue is, majority of these FPOs belong to either horticulture or fisheries sub-sectors. The remaining 70% of FPOs did not even create any of these facilities. These findings clearly indicate that majority of the sample FPOs are in their nascent stage and there is a long way to go. To overcome these issues, the state government has highlighted in session 12 of its guidelines about various financial provisions created to FPOs.
5.1.10 Farmers’ training and awareness creation Conduct of farmers’ training and awareness creation programs are critical in the initial stages of FPO set-up to mobilize large number of farmers as its member. Necessary field trips for exposure to new technology, value addition opportunities and visit to functional FPOs are mandatory to instill confidence among farmers about scope of FPOs and its formation. About 90% of the proposed FPOs under study have initiated such activities. The remaining 10% of FPOs are yet to organize for their members.
5.1.11 Estimation of anticipated costs and revenues Estimation of anticipated costs and revenues is an important step in preparation of a business proposal for any proposed FPO. The step clearly visualizes the anticipated investments to be made in setting up of an FPO and corresponding streams of revenue to be generated by various activities. Both backward and forward linkages also need to be identified while preparing the business plan. Similarly, various strategies for value addition opportunities and marketing needs to be sorted out. Ultimately, the volume of products to be handled and respective economies of scale also need to be worked out. This entire exercise will bring out the anticipated costs and revenues of a proposed FPO. It also identifies future evolution of strategies over a period of time. Only 36.6% of the total proposed FPOs have carried out this important and critical exercise. Nearly two-thirds of the sample are yet to develop their business plans. The state guidelines have provided the detailed item-wise anticipated costs for establishing a FPO in its guidelines (section 12). However, the anticipated benefit estimations vary from FPO to FPO.
5.1.12 Major constraints and limitationsThere are several constraints and limitations expressed by focal persons and POPIs in setting up of FPO across four sub-sectors. They are summarized and presented in Table 5.8.

44
5.1.13 Sustainability and risk mitigation plans Development of risk mitigation plans is inevitable for long-term sustainability of FPO in any sub-sector. Also, anticipation of major risks and corresponding mitigation plans always insulate the FPO from both external and internal shocks. Being well prepared to diverse risks will always minimize the income fluctuations and provide some cushion to an FPO and its members. Only 26.6% of total sample proposed FPOs has given some thought about these issues and the remaining are not even aware of these measures.
Table 5.8 Major constraints in setting up of the FPO
Sub-sector Major constraints
Agriculture · Need of financial support for establishment of FPO due to high costs of registration
· Lack of vision with respect to value proposition for the households
· Low awareness and limited interest of farmers about FPOs
· Inevitable role of middlemen still in many marketing functions in case of various products/crops
· Paucity of experts for technical guidance especially in case of Natural Farming (NF/NPM)
· Problems around certification of organic products, market linkages, market premium and organic brand creation etc.
· Lack of credible proof of concepts for addressing the problems of low yields, and pests and disease management
· Lack of hands-on experience and provision of infrastructure in case of value-addition opportunities
Horticulture · Lack of infrastructure facilities and working capital support
· High incidence of tenancy, low formal credit facility and low investment capacity – especially in case of East Godavari, Vizianagaram and Srikakulam districts
· Lack of storage, packaging and grading facilities and value addition opportunities
· High price fluctuations and lack of control over them
· Most of the un-regulated markets are dominated by middlemen
· FPO registration is a time taking process and expensiveAnimal Husbandry · Lack of sufficient fodder and medical facilities for animals
· Better infrastructure facilities like cold storages and milk processing units are needed
· Low milk yields and shorter lactation periods
· Lack of interest towards FPOs
· Poor credit facilities and water scarcity issues Fisheries · Dominant role of middlemen in post-harvest handling and marketing
· Lack of cold storage facilities
· Non-availability of quality seedlings
· No formal credit and insurance facilities
· High price fluctuations and lack of regulation measures
· Poor backward market linkages and spurious inputs dominate the market

45
The above sections highlighted the realities about various dimensions of proposed FPOs across the sub-sectors in the state. A strategic plan and thinking is required before identification of an FPO in a given location/mandal/district. Enough home work is required for identification of potential commodities in a given location. It is always ambitious to start an FPO for a single commodity. However, we need to keep in mind the issues like volume of commodity aggregation, its seasonality, perishability, economies of scale, extent of capacity utilization of facilities created at FPO, marketing infrastructure and revenue flow round the year on sustainable basis etc. Additionally, sufficient planning should be done about both backward and forward linkages, risk mitigation plans and long-term sustainability issues, etc. SFAC6 has prepared a detailed manual highlighting the guidelines to set-up an FPO, assessment of capital requirements and how to assess the financial viability of the business of producer companies etc. In this gamut, NABARD has to play a critical role to foresee all these aspects before the four sub-sectors identify the potential FPOs.
5.2 Insights from functional FPOsOn the other dimension, it would be always interesting to understand how the functional FPOs are working across sub-sectors and the lessons learnt over the time and across districts. As indicated earlier, the primary survey was conducted under which 15 functional FPOs located in 15 mandals and nine districts of the state were personally interviewed and various information were collected about its operation, structure, coverage, governance, etc. Also, majority (8) of them were from horticulture sub-sector followed by agriculture (4), fisheries (2) and animal husbandry (1) sub-sector. The brief insights from 5-6 functional FPOs are summarized below and given in Table 5.9 to 5.14. Other functional/registered FPOs couldn’t provide the detailed information due to their fragmented or initial stages of operations. (Due to asymmetry in information from rest of the FPOs, only 6 FPOs are covered here in details, while remaining are covered in case study.) Also, brief snapshots of some of these FPOs are given in the later part of the section in the form of case study.
• All the sample functional FPOs in the sample are facilitated either by NGOs/multi-aided cooperative societies/charity foundation etc. (Table 5.9).
• Non-Governmental Organizations (NGOs) acted as the Producers’ Organization Promoting Institution (POPI) for almost all the functional FPOs under study (Table 5.9). In few cases, NABARD itself acted as a POPI (under PRODUCE Fund) and promoted them.
• NABARD and Indian Grameen Service (IGS) acted as a Resource Support Agencies (RSA) in majority of them. However, few FPOs are still not aware about the role of RSA.
• Majority (73.3%) of them were registered in the year 2015 under Companies Act. The remaining were registered between the year 2013 and 2014 (Table 5.9).
• The minimum membership size observed was 58 and the maximum identified as 1,671. But, majority of FPOs were having membership ranging between 200 and 500. The minimum membership fee paid was Rs 10, while the maximum reported were Rs 2000 (Table 5.10).
• The extent of mobilization of capital ranged between Rs 1 to 4 millions for two-third of sample functional FPOs. Approximately, one-third of sample FPOs are still waiting for financial assistance from NABARD (see Table 5.10).
• Only four FPOs out of fifteen were able to show the business plans for the financial year 2015-16. The remaining FPOs have not kept their financial records up to date (Table 5.10).
• These functional FPOs were able to create some/minimum infrastructure facilities for the benefit of their members. The remaining FPOs are yet to establish the facilities for their members (see Table 5.11).
• None of the sample functional FPOs are currently using any ICT applications to communicate with their members regarding farm inputs, technologies and market linkages information, etc.
6. Refer at http://www.sfacindia.com/PDFs/FPOPolicyProcessGuidelinesApril2013.pdf
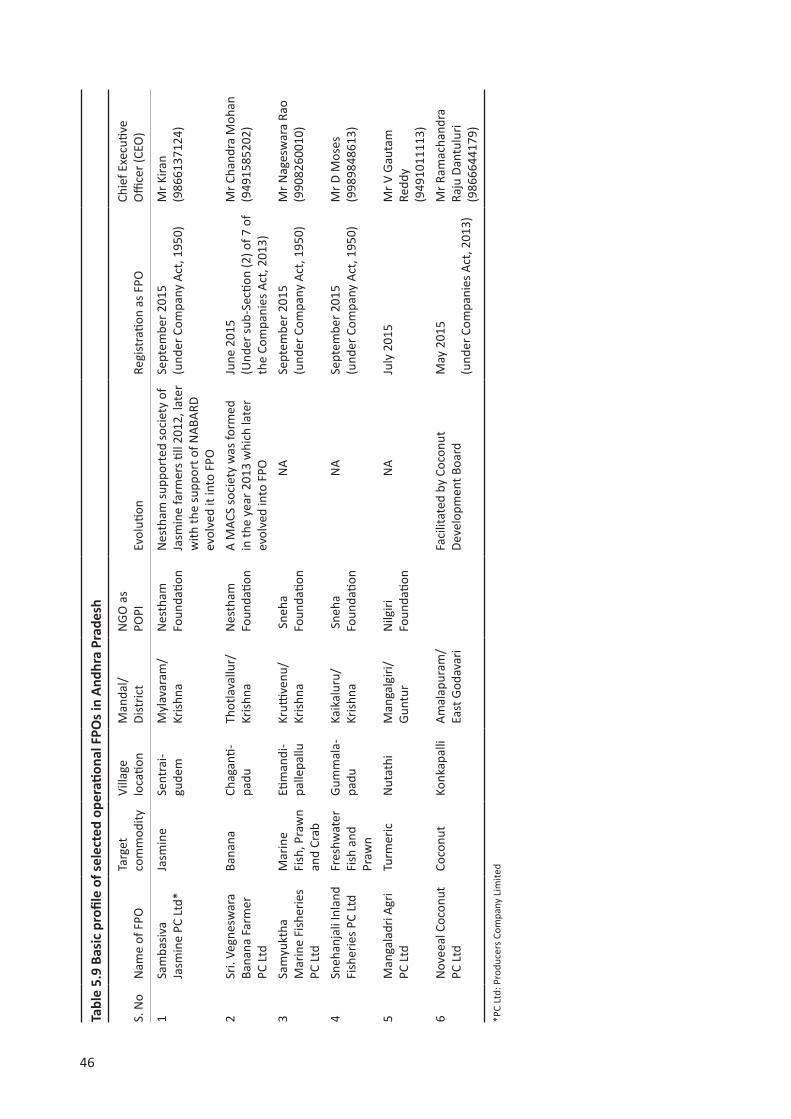
46
Tabl
e 5.
9 Ba
sic
profi
le o
f sel
ecte
d op
erati
onal
FPO
s in
Andh
ra P
rade
sh
S. N
oN
ame
of F
PO
Targ
et
com
mod
ityVi
llage
lo
catio
nM
anda
l/ Di
stric
tN
GO a
s PO
PIEv
oluti
onRe
gist
ratio
n as
FPO
Chie
f Exe
cutiv
e O
ffice
r (CE
O)
1Sa
mba
siva
Jasm
ine
PC Lt
d*Ja
smin
eSe
ntra
i- gu
dem
Myl
avar
am/
Krish
naN
esth
am
Foun
datio
nN
esth
am su
ppor
ted
soci
ety
of
Jasm
ine
farm
ers ti
ll 20
12, l
ater
w
ith th
e su
ppor
t of N
ABAR
D ev
olve
d it
into
FPO
Sept
embe
r 201
5
(und
er C
ompa
ny A
ct, 1
950)
Mr K
iran
(986
6137
124)
2Sr
i. Ve
gnes
war
a Ba
nana
Far
mer
PC
Ltd
Bana
naCh
agan
ti-
padu
Thot
lava
llur/
Kr
ishna
Nes
tham
Fo
unda
tion
A M
ACS
soci
ety
was
form
ed
in th
e ye
ar 2
013
whi
ch la
ter
evol
ved
into
FPO
June
201
5
(Und
er su
b-Se
ction
(2) o
f 7 o
f th
e Co
mpa
nies
Act
, 201
3)
Mr C
hand
ra M
ohan
(9
4915
8520
2)
3Sa
myu
ktha
M
arin
e Fi
sher
ies
PC Lt
d
Mar
ine
Fish
, Pra
wn
and
Crab
Etim
andi
-pa
llepa
lluKr
uttive
nu/
Krish
na S
neha
Fo
unda
tion
NA
Sept
embe
r 201
5
(und
er C
ompa
ny A
ct, 1
950)
Mr N
ages
war
a Ra
o (9
9082
6001
0)
4Sn
ehan
jali
Inla
nd
Fish
erie
s PC
Ltd
Fres
hwat
er
Fish
and
Pr
awn
Gum
mal
a-
padu
Kaik
alur
u/
Krish
na S
neha
Fo
unda
tion
NA
Sept
embe
r 201
5
(und
er C
ompa
ny A
ct, 1
950)
Mr D
Mos
es
(998
9848
613)
5M
anga
ladr
i Agr
i PC
Ltd
Turm
eric
Nut
athi
Man
galg
iri/
Gunt
urN
ilgiri
Fo
unda
tion
NA
July
201
5M
r V G
auta
m
Redd
y (9
4910
1111
3)6
Nov
eeal
Coc
onut
PC
Ltd
Coco
nut
Konk
apal
liAm
alap
uram
/ Ea
st G
odav
ari
Faci
litat
ed b
y Co
conu
t De
velo
pmen
t Boa
rdM
ay 2
015
(und
er C
ompa
nies
Act
, 201
3)
Mr R
amac
hand
ra
Raju
Dan
tulu
ri (9
8666
4417
9)
*PC
Ltd:
Pro
duce
rs C
ompa
ny L
imite
d
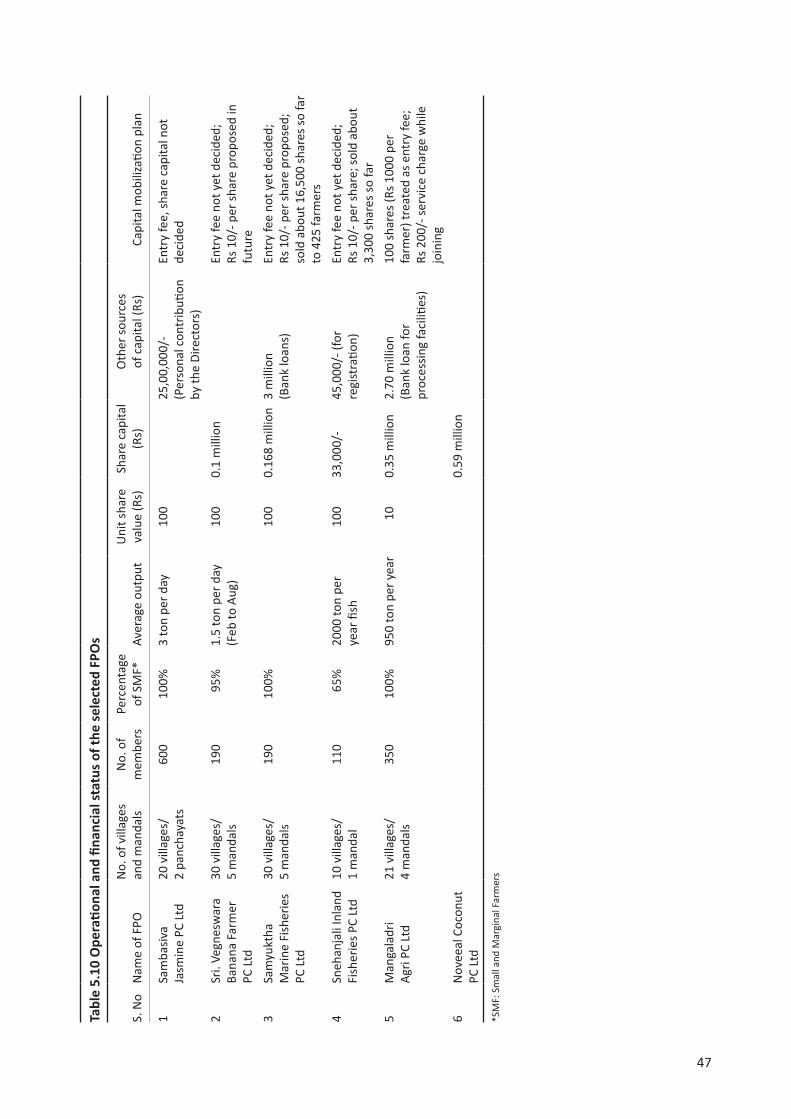
47
Tabl
e 5.
10 O
pera
tiona
l and
fina
ncia
l sta
tus o
f the
sele
cted
FPO
s
S. N
oN
ame
of F
PON
o. o
f vill
ages
an
d m
anda
lsN
o. o
f m
embe
rsPe
rcen
tage
of
SM
F*Av
erag
e ou
tput
Uni
t sha
re
valu
e (R
s)Sh
are
capi
tal
(Rs)
Oth
er so
urce
s of
cap
ital (
Rs)
Capi
tal m
obili
zatio
n pl
an
1Sa
mba
siva
Jasm
ine
PC Lt
d20
vill
ages
/
2 pa
ncha
yats
600
100%
3 to
n pe
r day
100
25,0
0,00
0/-
(Per
sona
l con
trib
ution
by
the
Dire
ctor
s)
Entr
y fe
e, sh
are
capi
tal n
ot
deci
ded
2Sr
i. Ve
gnes
war
a Ba
nana
Far
mer
PC
Ltd
30 v
illag
es/
5
man
dals
190
95%
1.5
ton
per d
ay
(Feb
to A
ug)
100
0.1
mill
ion
Entr
y fe
e no
t yet
dec
ided
; Rs
10/
- per
shar
e pr
opos
ed in
fu
ture
3Sa
myu
ktha
M
arin
e Fi
sher
ies
PC Lt
d
30 v
illag
es/
5
man
dals
190
100%
100
0.16
8 m
illio
n3
mill
ion
(Ban
k lo
ans)
Entr
y fe
e no
t yet
dec
ided
; Rs
10/
- per
shar
e pr
opos
ed;
sold
abo
ut 1
6,50
0 sh
ares
so fa
r to
425
farm
ers
4Sn
ehan
jali
Inla
nd
Fish
erie
s PC
Ltd
10 v
illag
es/
1 m
anda
l11
0 6
5%20
00 to
n pe
r ye
ar fi
sh10
033
,000
/-45
,000
/- (f
or
regi
stra
tion)
Entr
y fe
e no
t yet
dec
ided
; Rs
10/
- per
shar
e; so
ld a
bout
3,
300
shar
es so
far
5M
anga
ladr
i Ag
ri PC
Ltd
21 v
illag
es/
4
man
dals
350
100%
950
ton
per y
ear
10
0.35
mill
ion
2.70
mill
ion
(Ban
k lo
an fo
r pr
oces
sing
faci
lities
)
100
shar
es (R
s 100
0 pe
r fa
rmer
) tre
ated
as e
ntry
fee;
Rs
200
/- se
rvic
e ch
arge
whi
le
join
ing
6N
ovee
al C
ocon
ut
PC Lt
d0.
59 m
illio
n
*SM
F: S
mal
l and
Mar
gina
l Far
mer
s

48
Tabl
e 5.
11 P
rodu
ctivi
ty e
nhan
cing
/ pr
omoti
onal
stra
tegi
es o
f the
sele
cted
FPO
s
S. N
oN
ame
of F
POIn
put m
obili
zatio
n pl
anO
utpu
t agg
rega
tion
plan
Prom
otion
al st
rate
gyIn
fras
truc
ture
s & m
anpo
wer
1Sa
mba
siva
Jasm
ine
PC Lt
d
Onl
y ex
tens
ion
serv
ice
are
initi
ated
. N
o ac
tivity
rega
rdin
g in
puts
m
arke
ting
initi
ated
.
Bulk
ing
and
aggr
egati
ng o
f 3 to
n pe
r day
; onl
y ba
ggin
g an
d w
ater
ing
serv
ices
are
pro
vide
d.
Flow
er p
rodu
ction
enh
ance
men
t sp
rays
with
the
help
from
ex
perie
nced
farm
ers
Offi
ce sp
ace,
Gra
ding
faci
lities
, Tr
ansp
ort v
ehic
le (1
), Su
ppor
ting
staff
s & la
bour
s (30
)
2Sr
i. Ve
gnes
war
a Ba
nana
Far
mer
PC
Ltd
Bulk
ferti
lizer
pur
chas
e is
done
th
roug
h M
ACS,
ear
lier f
orm
ed.
No
tissu
e cu
lture
var
ietie
s av
aila
ble.
Mar
ket y
ard
tem
pora
rily
avai
labl
e,
new
one
is b
eing
cre
ated
with
su
ppor
t of 1
.2 m
illio
n gr
ant f
rom
N
ABAR
D an
d De
part
men
t of
horti
cultu
re.
Plan
ning
to c
onst
ruct
ripe
ning
ch
ambe
rs to
get
into
reta
il m
arke
ts.
Enco
urag
ing
farm
ers d
ue to
the
good
pric
e pa
id fo
r bun
ches
Offi
ce sp
ace,
Tra
nspo
rt v
ehic
le (1
), Su
ppor
ting
staff
s & la
bour
s (10
)
3Sa
myu
ktha
M
arin
e Fi
sher
ies
PC Lt
d
Loan
ing
deve
lope
d to
hel
p th
e m
embe
rs th
roug
h Ba
nks,
pr
ovid
ing
tray
s, c
ool b
oxes
, N
ets,
Wan
t to
esta
blish
N
et B
anks
(net
s bus
ines
s)
Aggr
egati
on o
f all
fishe
s, g
radi
ng
at c
olle
ction
cen
tre,
usin
g ic
e an
d co
ld st
orag
e. P
lann
ing
a Fi
sh p
latfo
rm w
hich
wou
ld h
elp
in a
ggre
gatin
g al
l the
fish
from
co
llecti
on c
entr
es (3
pre
sent
ly
existi
ng, 5
pla
nned
)
Enco
urag
ing
farm
ers t
o ta
ke u
p sc
hem
es o
f fish
erie
s; T
rain
ing
prog
ram
mes
thro
ugh
NAB
ARDs
; M
icro
Ent
repr
eneu
r Dev
elop
men
t Pr
ojec
t (M
EDPs
)
Offi
ce sp
ace,
Col
lecti
on c
entr
e,
Supp
ortin
g st
aff (2
)
4Sn
ehan
jali
Inla
nd
Fish
erie
s PC
Ltd
Seed
and
feed
mat
eria
l pr
ocur
emen
t of 3
500
ton;
Go
dow
n ne
eded
Who
lesa
le to
mar
kets
at
Akuv
eedu
or E
luru
; Ret
ail s
hops
in
Vija
yaw
ada,
Hyd
erab
ad
Feed
qua
lity
testi
ng c
entr
e at
Ka
ikal
uru;
Mar
ket s
urve
y fo
r re
tail
mar
ketin
g at
Vija
yaw
ada
Offi
ce sp
ace,
Sup
porti
ng st
aff (1
)
5M
anga
ladr
i Ag
ri PC
Ltd
Low
yie
ldin
g cu
rcum
in v
arie
ties
have
bee
n re
plac
ed w
ith n
ew
seed
var
iety
from
Ero
de.
Com
post
, org
anic
inpu
ts a
bout
0.
5 m
illio
n ru
pees
of o
rgan
ic
ferti
lizer
s thr
ough
lice
nsed
fe
rtiliz
er, s
eed
wer
e ta
ken
by F
PO
Orig
inal
ly it
took
20
days
for
proc
essin
g in
volv
ed fo
r tur
mer
ic
and
this
was
redu
ced
to 1
0 to
12
days
thro
ugh
proc
essin
g by
bo
ilers
and
pol
ishin
g.
Dugg
irala
is th
e bi
gges
t mar
ket t
hat
can
take
any
am
ount
s of p
rodu
ce.
Mar
ketin
g lic
ense
take
n al
read
y
Fund
ing
to b
e so
ught
from
N
ABAR
D, C
haita
nya
Gram
een
bank
; Sup
ply
to e
xpor
ter
like
ITC
Ltd.
Offi
ce sp
ace,
Gra
ding
faci
lities
, Pr
oces
sing
faci
lities
(3 b
oile
rs,
1 po
lishi
ng m
achi
ne),
Godo
wns
(2
0 to
n), V
ehic
les (
5), S
uppo
rting
st
affs (
20)
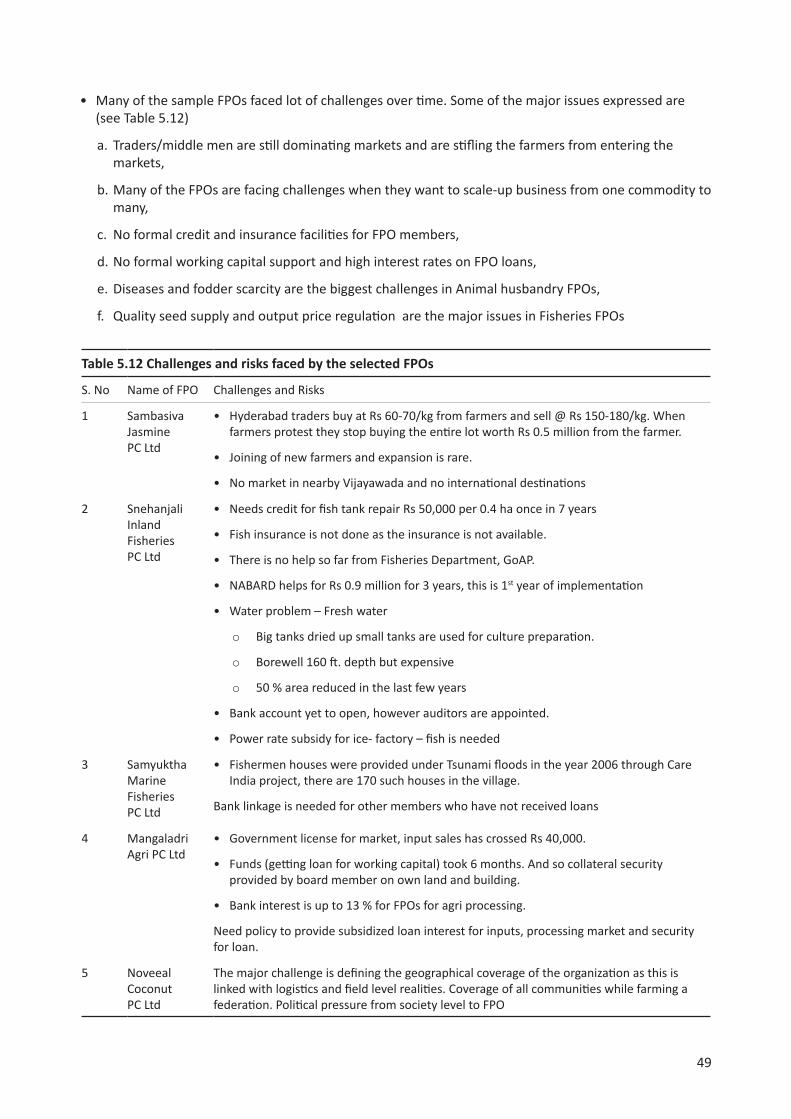
49
• Many of the sample FPOs faced lot of challenges over time. Some of the major issues expressed are (see Table 5.12)
a. Traders/middle men are still dominating markets and are stifling the farmers from entering the markets,
b. Many of the FPOs are facing challenges when they want to scale-up business from one commodity to many,
c. No formal credit and insurance facilities for FPO members,
d. No formal working capital support and high interest rates on FPO loans,
e. Diseases and fodder scarcity are the biggest challenges in Animal husbandry FPOs,
f. Quality seed supply and output price regulation are the major issues in Fisheries FPOs
Table 5.12 Challenges and risks faced by the selected FPOs
S. No Name of FPO Challenges and Risks
1 Sambasiva Jasmine PC Ltd
• Hyderabad traders buy at Rs 60-70/kg from farmers and sell @ Rs 150-180/kg. When farmers protest they stop buying the entire lot worth Rs 0.5 million from the farmer.
• Joining of new farmers and expansion is rare.
• No market in nearby Vijayawada and no international destinations
2 Snehanjali Inland Fisheries PC Ltd
• Needs credit for fish tank repair Rs 50,000 per 0.4 ha once in 7 years
• Fish insurance is not done as the insurance is not available.
• There is no help so far from Fisheries Department, GoAP.
• NABARD helps for Rs 0.9 million for 3 years, this is 1st year of implementation
• Water problem – Fresh water
o Big tanks dried up small tanks are used for culture preparation.
o Borewell 160 ft. depth but expensive
o 50 % area reduced in the last few years
• Bank account yet to open, however auditors are appointed.
• Power rate subsidy for ice- factory – fish is needed
3 Samyuktha Marine Fisheries PC Ltd
• Fishermen houses were provided under Tsunami floods in the year 2006 through Care India project, there are 170 such houses in the village.
Bank linkage is needed for other members who have not received loans
4 Mangaladri Agri PC Ltd
• Government license for market, input sales has crossed Rs 40,000.
• Funds (getting loan for working capital) took 6 months. And so collateral security provided by board member on own land and building.
• Bank interest is up to 13 % for FPOs for agri processing.
Need policy to provide subsidized loan interest for inputs, processing market and security for loan.
5 Noveeal Coconut PC Ltd
The major challenge is defining the geographical coverage of the organization as this is linked with logistics and field level realities. Coverage of all communities while farming a federation. Political pressure from society level to FPO
50
• Creating more awareness and convincing all community of farmers was still challenging in many cases.
• All the selected functional FPOs’ focal persons were asked to provide the major lessons learnt in establishing an FPO across sub-sectors. The major lessons learnt are summarized below:
a. Registration of FPOs is costly and a cumbersome process.
b. Provision of quality inputs, creation of cold storage facilities, value addition opportunities, transportation vehicles and post-harvest handling facilities etc. were difficult without much working capital investment and support from Government.
c. Diversification of business opportunities and creation of membership incentives is critical for long-term sustainability of FPO.
d. Provision of formal credit access and insurance was mandatory to all FPO members.
e. Efficient capacity utilization of facilities created throughout the year is compulsory to bring economic-viability of the FPO.
f. Insulation of FPOs from market and price risks is necessary to protect the livelihoods of farmers.
Moreover, when the members of the functional FPOs were enquired about the benefits derived from the setting up of the FPOs, they narrated the tangible benefits as given in Table 5.13.
Table 5.13 Effectiveness of FPO on small and marginal producers
Name of FPO Issues resolved with help of FPO
Sri. Vegneswara Banana Farmer PC Ltd
Farmer Opinion: Initially Rate of Banana Bunch 100/- now with the help of FPO it increased to 325/-
Mangaladri Agri PC Ltd • Price of turmeric in Duggirala went low due to poor variety of seed and were changed and price increased to Rs 1500/ton).
• Better technology adoption for boiler and polishing
• Drying time reduced to 12 hours from 24 hours.
• Due to new technology, boiling time reduced to 10-12 days from 20 days
Noveeal Coconut PC Ltd • The per capita income of the farmer for this year is Rs 37050/ha from coconut cultivation
• Majority of the farmers were convinced to join in the form of fertilizer subsidy
• 20-30% rise in the coconut price was observed during this year.
• The producer share in consumer price has improved to 40-50% from earlier 25-30%. This year, with proper linkages and organization, is planning to improve the share.
• Formation of FPO has created an additional 200 workdays of employment to the members
5.3 Case studies on some functional FPOs Brief case studies were prepared and reported based on successful functional FPOs for better understanding about their functionality to researchers, academicians and policy makers etc. Eight cases across different sub-sectors are summarized below:
A detailed analysis of selected FPOs which are functional in different parts of Andhra Pradesh revealed the following:
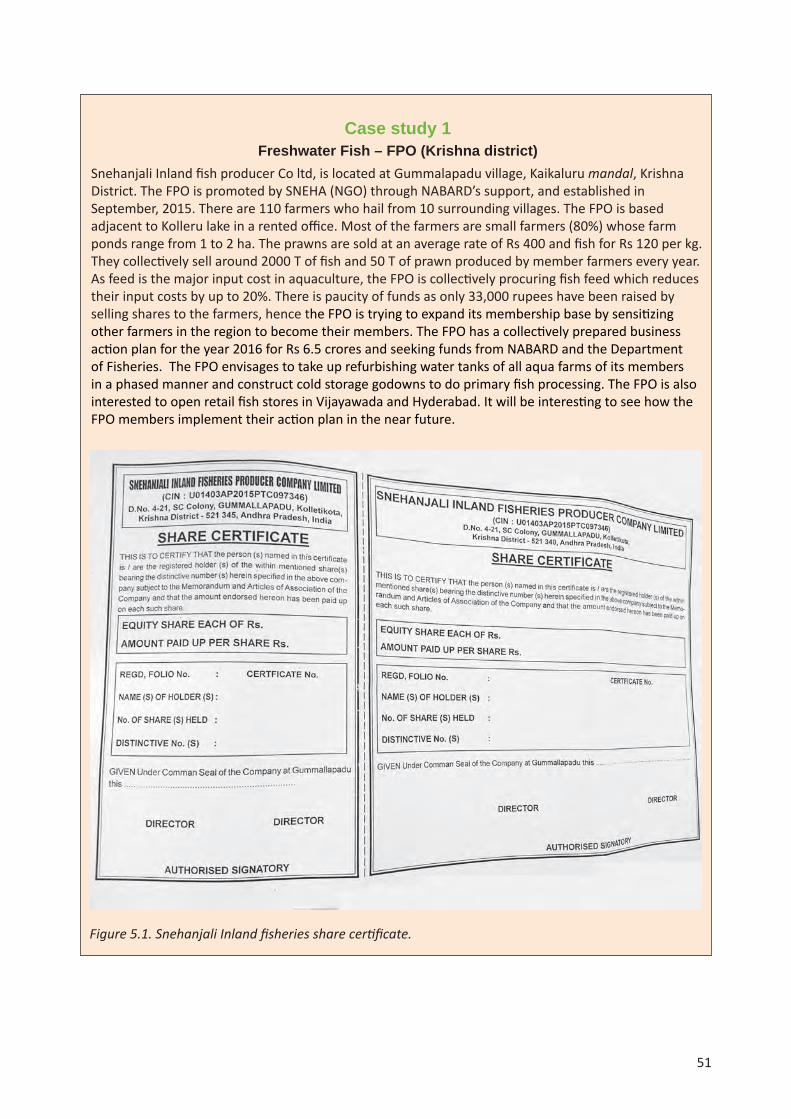
51
Case study 1Freshwater Fish – FPO (Krishna district)
Snehanjali Inland fish producer Co ltd, is located at Gummalapadu village, Kaikaluru mandal, Krishna District. The FPO is promoted by SNEHA (NGO) through NABARD’s support, and established in September, 2015. There are 110 farmers who hail from 10 surrounding villages. The FPO is based adjacent to Kolleru lake in a rented office. Most of the farmers are small farmers (80%) whose farm ponds range from 1 to 2 ha. The prawns are sold at an average rate of Rs 400 and fish for Rs 120 per kg. They collectively sell around 2000 T of fish and 50 T of prawn produced by member farmers every year. As feed is the major input cost in aquaculture, the FPO is collectively procuring fish feed which reduces their input costs by up to 20%. There is paucity of funds as only 33,000 rupees have been raised by selling shares to the farmers, hence the FPO is trying to expand its membership base by sensitizing other farmers in the region to become their members. The FPO has a collectively prepared business action plan for the year 2016 for Rs 6.5 crores and seeking funds from NABARD and the Department of Fisheries. The FPO envisages to take up refurbishing water tanks of all aqua farms of its members in a phased manner and construct cold storage godowns to do primary fish processing. The FPO is also interested to open retail fish stores in Vijayawada and Hyderabad. It will be interesting to see how the FPO members implement their action plan in the near future.
Figure 5.1. Snehanjali Inland fisheries share certificate.

52
Case study 2Banana FPO (Krishna district)
Sri Vigneshwara Banana FPO is located at Chagantipadu village, Thotlavallurumandal, Krishna district. This FPO was functioning as a mutually aided credit society for the last 3 years and formally registered as a company in July 2015 with 190 active members. Also, Nestham (NGO) has been hand holding the FPO with an initial share capital of Rs 0.1 million. Farmers from 30 surrounding villages encompassing 5 mandals converge to sell their banana fruit bunches on every Monday and Thursday during the week. The turnover of the FPO was 9.6 million last year earning a profit of Rs 0.55 million by charging 6% levy on banana sales. Farmers get the services of uniform costs of servicing of harvesting banana through engagement of labourers by the FPO at a predetermined rate and at right time. One major service rendered through this collective aggregation model is the cutting down of the transport cost of bringing the harvested banana to the market. This is being done by the FPO owned Mahindra van which is a unique strategy by the FPO that benefited the member farmers. The cost of labor charges and transport directly benefits FPO members in addition to the higher price secured from the traders who now come to this new market for buying bananas. A member farmer, Shri S Nagireddy says, “If I sell banana bunch to local trader at the farm gate, I used to get Rs 150 per bunch, here in FPO, I get Rs 325 per bunch and is more than double the previous amount. Also, being a part of the FPO fetched me 100% more”. The abuse of intermediaries in differential pricing has dramatically reduced for farmers participating in this FPO where grading and pricing was held with transparency. This is attracting new banana farmers from other places. The FPO started constructing a market yard and a building (3600 sft) in the village through support from Horticulture department and NABARD (Rs 1.2 million). The FPO looks to diversify its portfolio of working on other days of the week (presently market auctions are held 2 days per week). There are plans to introduce auctioning of vegetables on commission basis in the new market yard. It will be interesting to review the progress of this FPO in the coming months after the start of the new market yard.
Figure 5.2. Interviewing the banana growers at Changantipadu FPO.
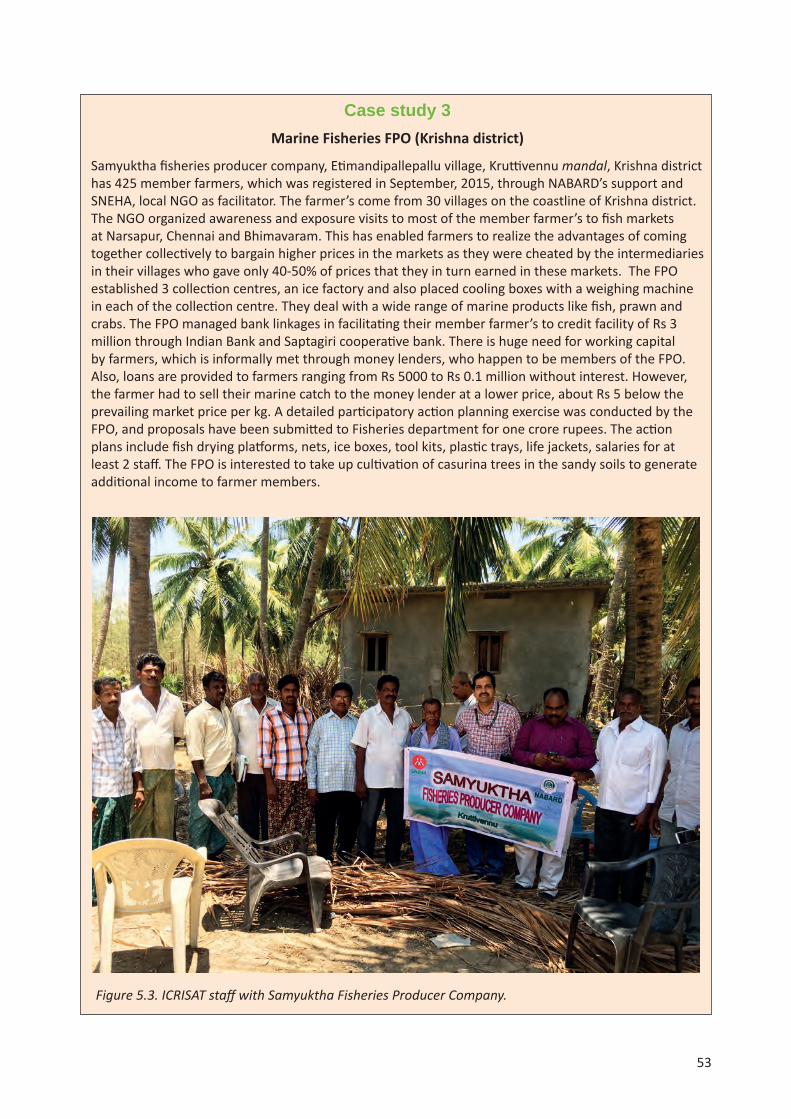
53
Case study 3Marine Fisheries FPO (Krishna district)
Samyuktha fisheries producer company, Etimandipallepallu village, Kruttivennu mandal, Krishna district has 425 member farmers, which was registered in September, 2015, through NABARD’s support and SNEHA, local NGO as facilitator. The farmer’s come from 30 villages on the coastline of Krishna district. The NGO organized awareness and exposure visits to most of the member farmer’s to fish markets at Narsapur, Chennai and Bhimavaram. This has enabled farmers to realize the advantages of coming together collectively to bargain higher prices in the markets as they were cheated by the intermediaries in their villages who gave only 40-50% of prices that they in turn earned in these markets. The FPO established 3 collection centres, an ice factory and also placed cooling boxes with a weighing machine in each of the collection centre. They deal with a wide range of marine products like fish, prawn and crabs. The FPO managed bank linkages in facilitating their member farmer’s to credit facility of Rs 3 million through Indian Bank and Saptagiri cooperative bank. There is huge need for working capital by farmers, which is informally met through money lenders, who happen to be members of the FPO. Also, loans are provided to farmers ranging from Rs 5000 to Rs 0.1 million without interest. However, the farmer had to sell their marine catch to the money lender at a lower price, about Rs 5 below the prevailing market price per kg. A detailed participatory action planning exercise was conducted by the FPO, and proposals have been submitted to Fisheries department for one crore rupees. The action plans include fish drying platforms, nets, ice boxes, tool kits, plastic trays, life jackets, salaries for at least 2 staff. The FPO is interested to take up cultivation of casurina trees in the sandy soils to generate additional income to farmer members.
Figure 5.3. ICRISAT staff with Samyuktha Fisheries Producer Company.

54
Case study 4Jasmine FPO (Krishna district)
Sambasiva Jasmine Producer Company Ltd, formerly Vigneswara MACS society is located at Sentraigudem, Mylavaram mandal, Krishna district, AP. The FPO was registered in September 2015 with over 600 member farmers from two revenue panchayat’s and encompassing 20 hamlets. A share capital of Rs 2.5 million is invested by the 5 directors of the FPO personally. The FPO is active during the jasmine season from February to August every year. Jasmine crop is perennial (up to 7 years) but grown only in small pockets of <0.4 ha by each member as most of them have other sources of income like mango orchards. The market opens every day early in the morning at the village temple premises, where weighing, bagging, labeling is done by hired staff by the FPO. Also, watering of the packaged flowers is a critical activity to keep the flowers fresh during their transport to Hyderabad’s Guddimalkapur market through their own vans (4). Due to high perishability of flowers, the farmers are vulnerable to price fluctuations in Hyderabad. The Directors are concerned about the growing apathy in Hyderabad market towards them as they are farmers based out of Andhra Pradesh. Moreover, the commission agents do not follow a set standard while determining flower prices. This makes them ponder if it was possible to have a market at nearby city like Vijayawada. Presently there are plans to build a shed to undertake operations during rains. At present the remuneration to the member farmers is higher than that of the outside traders. However, it will be challenging to see how this FPO runs in the long run with investments controlled by few directors.
Figure 5.4 Jasmine Producers Organization in Krishna district.

55
Case study 5Chethana Groundnut Producer Company Ltd (Prakasam district)
Chethana groundnut Producer Company Ltd is located at Kothapatnam village (under Kothapatnam mandal), about 17 km from Ongole, Prakasam district. The company has been registered in February 2016 under Companies Act, 2013, with the financial support of NABARD. An NGO named Effort Foundation is providing technical support to the producer members. Currently, the company has 65 members who have contributed share capital of Rs 500 each. Groundnut is the main crop in the mandal and many farmers grow two groundnut crops in a year. Currently it is operating in only one village, but plans to expand to 500 groundnut growers in 6 surrounding villages. The NGO has given demonstration on IPM in the village and has collected and sent across 250 soil samples for soil testing to the state department. Though, the company has its own rented office and also rented in some space for input and output marketing, the actual operation has not yet started. Moreover, the supporting agency is also not very clear about the scaling up strategies and future plan of value added services for the company. Therefore, producer-members are reluctant in participating in any meetings or discussion.
Figure 5.5. Mechanical threshing of groundnut by the farmers of groundnut FPO in Prakasam.
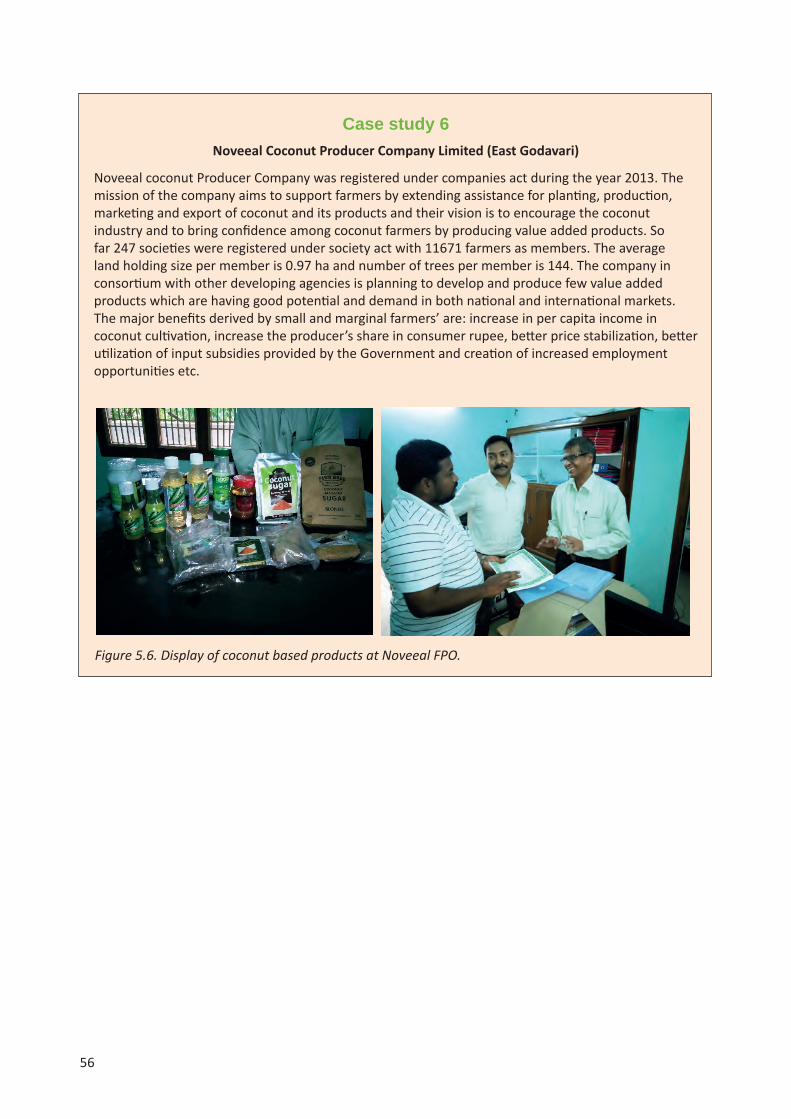
56
Case study 6Noveeal Coconut Producer Company Limited (East Godavari)
Noveeal coconut Producer Company was registered under companies act during the year 2013. The mission of the company aims to support farmers by extending assistance for planting, production, marketing and export of coconut and its products and their vision is to encourage the coconut industry and to bring confidence among coconut farmers by producing value added products. So far 247 societies were registered under society act with 11671 farmers as members. The average land holding size per member is 0.97 ha and number of trees per member is 144. The company in consortium with other developing agencies is planning to develop and produce few value added products which are having good potential and demand in both national and international markets. The major benefits derived by small and marginal farmers’ are: increase in per capita income in coconut cultivation, increase the producer’s share in consumer rupee, better price stabilization, better utilization of input subsidies provided by the Government and creation of increased employment opportunities etc.
Figure 5.6. Display of coconut based products at Noveeal FPO.

57
Case study 7Paddy Farmers Seed Cooperative Society (West Godavari)
Sri. Seetharamanjaneya Farmers Seed Cooperative Society Ltd, established in the year 2014 (Registration No: WR 564) with the assistance from AP state government and technical support from Rice Research Station, Marteru, West Godavari. After state bifurcation, farmers of the district anticipated the shortfall of rice seed and set-up this FPO with support from ATMA. Also, seeds of major varieties of rice like MTU 1010 and MTU 1064 are multiplied and supplied to farmers at a competitive price and quality. Inorder to market the seed, word of mouth, display boards have been established at many villages and germination guarantee etc. were created and has increased interest among rice growers in the district. But, the society is currently looking for financial support to further strengthen seed production facilities in the society.
Figure 5.7. Details of board members in seed FPO in West Godavari.

58
Case study 8Dairy FPO (Kurnool district) (proposed & supported by AH department)
The Animal Husbandry department is promoting one dairy FPO (proposed) in Nandyal mandal (around Ryatunagaram village). The Assistant Veterinary surgeon is leading the process and there is a plan to group 20 milk producer-farmers in each of 20 surrounding villages. Every expected member household have 5-6 graded Murrah buffalo, who are currently selling their milk in the Nandyal market @Rs 38/liter. The discussions with villagers revealed the potential for formation of FPO focusing on dairy and the benefits to farmers through enhanced income levels. However, they had lot of apprehensions about the size of the organization and the sustainability of group cohesion. The FPO formation is still at very nascent stage, as group formation has not yet taken place. The villagers are also not clear about the potential benefits coming through the FPO. Although, potential areas of intervention existing are- bulk purchase of feed and fodders, collective silage making, manufacturing of livestock feed at small scale, value addition in milk and milk products, etc. Therefore, lot of background work on creating awareness, bringing clarity on the process of formation of organization and clear guidelines on formation of FPOs are required to address initial glitches. The department also needs to identify the local resource organization who can continuously work with the milk producers.
Figure 5.8. Interactions with milk producers at dairy FPO in Kurnool.

59
Case study 9Pulses & Millets FPO (Kurnool district)
Since the year 2013, the Reliance Foundation is working in this mandal, and improving livelihood of the rural population by intervention in the area of land development, soil fertility management, water harvesting and health and nutrition. The foundation has formed Village Farmers’ Association (VFA) in 16 villages spread in 3 mandals of the district. The foundation is in advanced stage of registering an FPO based on pulses and millets, by bringing together 13 VFAs falling under the Gajiwanga watershed, on a single platform. The region faces problem of salinity, water shortage and non-availability of clean and safe drinking water. The primary source of livelihood is agriculture coupled with rearing small ruminants like goats and sheep. The interventions started with organizing farmers to create awareness and give training about soil and water conservation measures. The major crop grown during kharif season is mainly cotton (80%) and groundnut (20%). During rabi season, red gram, bengal gram, ajwain and jowar (sorghum) is grown. They also grow fox tail millet for personal consumption. The collective action started with interventions in soil and water conservation, organic farming, and nutrition gardens to improve the nutritional status by promoting dietary diversity. Currently, there are 1330 members in 13 VFAs and together, mobilized an initial seed capital of ₹ 2.6 million by equal contribution (Rs 2000 each) from the members. Each VFA has its own office space in the village. After registration of FPO, the group is planning to purchase agricultural inputs in bulk and market the produce collectively.
Figure 5.9. Pulses and millets FPO supported by Reliance Foundation.

60
Case study 10Bethamacherala Progressive Farmers Producer Company Ltd (Kurnool district)
With the technical support of Vrutti Livelihood Resource Centre, legume-based FPO is in the process of formation in Bethamcherla mandal, about 53 km from district headquarter Kurnool in Andhra Pradesh. The mobilization of farmers and group formation for the Bethamcherla Progressive Farmers’ Producer Company Ltd. (BPFPC) started in March 2015, with the support of NABARD and Vrutti as POPI. The company has 700 group members from five surrounding villages in the radius of 12-15 km and only 70 members have contributed Rs 1000/- each as share capital. In the mandal, most of the farmers are growing pigeon pea as main crop, and some farmers are also growing foxtail crop, mixed with pigeonpea. Therefore, the group targets to handle only pigeonpea. Although, till now, the group formation and mobilization of households to join and contribute in the company has taken place, actual activities related to collective production, procurement, marketing or capacity building for different operations has not taken place. The company is expected to be registered in a couple of months.
Figure 5.10. Bank account details of BPFPC.

61
Case study 11Turmeric FPO (Guntur district)
Mangalagiri Agricultural Producers’ Company Limited, located at Mangalagiri, Guntur district is promoted by Nilgiri Foundation, NGO. This FPO was registered in July, 2015 with 350 turmeric producing small farmers from 21 villages. These farmers collectively hold about 380 ha of land and are producing 950 tons of turmeric annually. Under normal conditions, it takes around 20 days to process turmeric after harvesting. Shri Raghuram Reddy, chairman of Nilgiri foundation introduced a novel turmeric processing system, which brings down the processing time from 20 days to 10 days. So he introduced this technology to the farmers’ groups and convinced them through awareness and sensitization programmes. Also, Nilgiri foundation organized exposure visits to Erode, Tamil nadu to witness latest turmeric processing systems for some farmers. When the farmers were convinced about the enhanced quality of curcumin in processed turmeric, they were willing to adopt the technology as they believed it fetched higher price. The FPO purchased three boilers and one polishing machine that were run by employing contract laborers during the harvest season. Inputs like seed material, organic fertilizers required for crop production are procured by the FPO for their members through a retail outlet in Nutathi village. The operations have been professionally run by its CEO, Mr. Gautam Reddy. Marketing of turmeric at Duggirala market is done exclusively by FPO. The FPO has taken all the required licenses as a retail supplier of inputs and marketing agent in Duggirala market. Turmeric is a commercial crop with high input costs to the tune of Rs 123,500 to 148,200 per ha and FPO farmers benefit directly by reducing their seed and fertilizer costs by up to 15%. Further farmers benefit to the extent of 10% by their collective marketing in Duggirala market. The FPOs initiative to reduce input costs, processing times and market linkage appears to impact the livelihoods of small farmers’ with increased profit from turmeric cultivation. Now the FPO is planning to do commercial production of turmeric powder with high curcumin as present markets are not using grading systems which contains turmeric of high curcumin content but following traditional ways like size of the rhizome. However, the directors of the FPO pooled up their personal collateral to purchase boilers and polishing machine’s for the FPO and are looking for credit support from the local banks, with low-interest rates.
Figure 5.11. Usage of modern technology in turmeric processing in Guntur.
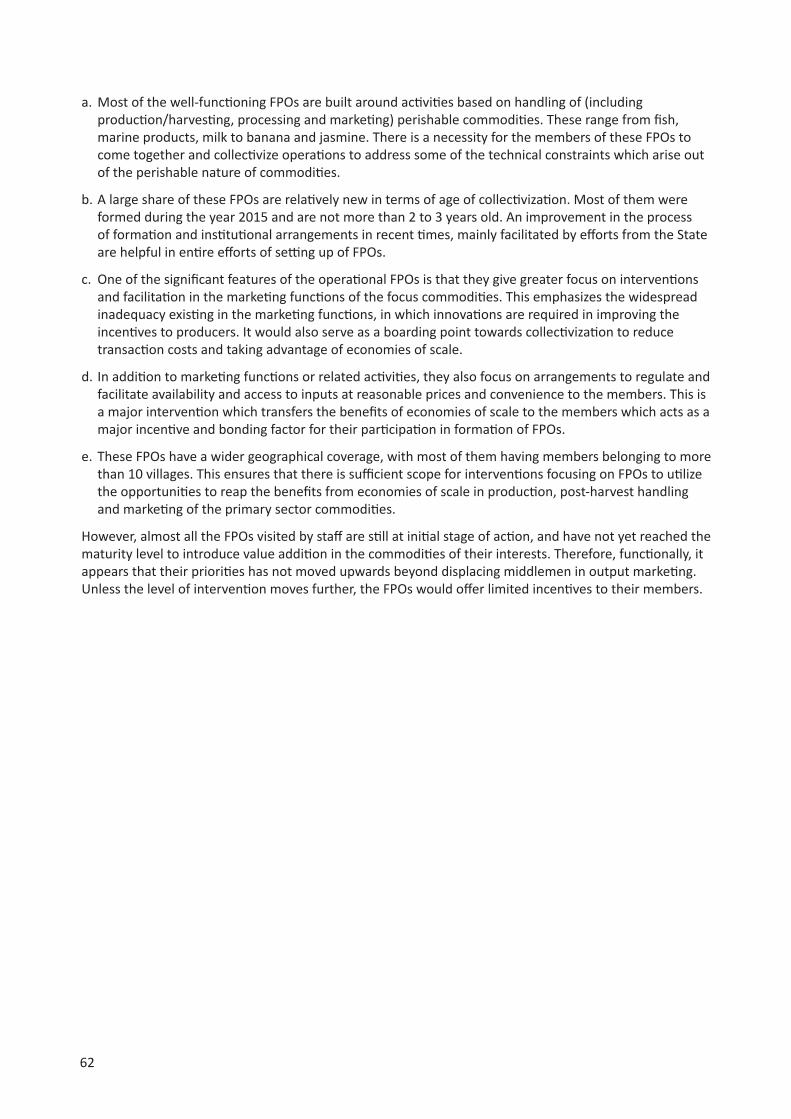
62
a. Most of the well-functioning FPOs are built around activities based on handling of (including production/harvesting, processing and marketing) perishable commodities. These range from fish, marine products, milk to banana and jasmine. There is a necessity for the members of these FPOs to come together and collectivize operations to address some of the technical constraints which arise out of the perishable nature of commodities.
b. A large share of these FPOs are relatively new in terms of age of collectivization. Most of them were formed during the year 2015 and are not more than 2 to 3 years old. An improvement in the process of formation and institutional arrangements in recent times, mainly facilitated by efforts from the State are helpful in entire efforts of setting up of FPOs.
c. One of the significant features of the operational FPOs is that they give greater focus on interventions and facilitation in the marketing functions of the focus commodities. This emphasizes the widespread inadequacy existing in the marketing functions, in which innovations are required in improving the incentives to producers. It would also serve as a boarding point towards collectivization to reduce transaction costs and taking advantage of economies of scale.
d. In addition to marketing functions or related activities, they also focus on arrangements to regulate and facilitate availability and access to inputs at reasonable prices and convenience to the members. This is a major intervention which transfers the benefits of economies of scale to the members which acts as a major incentive and bonding factor for their participation in formation of FPOs.
e. These FPOs have a wider geographical coverage, with most of them having members belonging to more than 10 villages. This ensures that there is sufficient scope for interventions focusing on FPOs to utilize the opportunities to reap the benefits from economies of scale in production, post-harvest handling and marketing of the primary sector commodities.
However, almost all the FPOs visited by staff are still at initial stage of action, and have not yet reached the maturity level to introduce value addition in the commodities of their interests. Therefore, functionally, it appears that their priorities has not moved upwards beyond displacing middlemen in output marketing. Unless the level of intervention moves further, the FPOs would offer limited incentives to their members.

63
Chapter 6. Mapping Potentials for FPOs in Andhra PradeshOne of the most important tasks in understanding the feasibility of setting up a FPO is determining the size of the market. As there is considerable cost involved in the establishment of FPOs, initial returns should be enough to meet at least the startup costs and working capital expenses. The first step in determining the ‘market size’ of an agricultural product is to measure the production, consumption pattern and marketed surplus in the region where business is planned for establishment. These parameters help in identifying the region as surplus or deficit sites. Moreover, surplus/deficit regions will help identify opportunities for intra or interstate/country export-import and trade. This chapter systematically maps out appropriate locations and commodities, based on secondary sources of information at mandal/district and state level; it also emphasizes on current market aggregation patterns across different commodities, quantum of marketable surplus of different commodities across regions and finally identifying enabling environments (such as cold storage facilities, grading/sorting facilities etc.) across commodities.
6.1 Mapping of potential commodities and regionsWith increasing market opportunities, there is a need to identify the appropriate location of production zones and the market size of a commodity. The state of Andhra Pradesh has 13 districts of different geographical spread and populations (Figure 6.1). These districts are also divided into two distinct agro-climatic regions- Rayalaseema region and Coastal region, which makes a very interesting combinations for production of cereals, pulses, fruits and vegetables, livestock, poultry and fisheries. Accordingly, in the study, an attempt has been made to identify the right potential location with reasonable crop area combinations. Also, GIS (Geographic Information Systems) presents a system of acquiring and generating high resolution images of crop area combination maps which enables to gauge the market potential under a given situation. This chapter presents mandal level maps of major agricultural commodities with an intention to strategize potential crop area combinations which are necessary for locating FPOs.
Figure 6.1. Geographical area and population of all the districts in Andhra Pradesh state.(Source: http://www.ap.gov.in/about-ap/districts/)

64
Apart from cropped area statistics, which gives a rapid appraisal of market potential, few other parameters like marketed surplus, per capita consumption of major produce, export market, etc. was also considered for better elicitation of market opportunities. The marketed surplus refers to the part which is actually made available to the market. This chapter makes an attempt to identify the export potential of major commodities.
Considering the importance of the region and its influence on marketed surplus, thirty major crops across 657 mandals (7 mandals that are included after bifurcation were not included in the study as the data is not available for the period 2013-14) were mapped using geospatial tools to visually understand the key potential crop area mix within the each district and across the state.
6.2 Identifying crop and crop combinations for FPOsThe top-down approach was followed for determining the right combination of crop area combinations in a given district and finally at the state level. As a first step, district level information was analyzed to identify potential commodities in the state. The second step is to identify the potential mandals under each commodity. This mapping process could pave the way for identifying the potential mandals by each commodity/group of commodities in a given district. For every district, all the crops have been categorized in two groups- major crops having cropped area more than 5000 ha, and minor crops having acreage between 3000 to 5000 ha (Table 6.1).
Further, clusters of mandals, to qualify for an FPO, are identified on the following criteria:
a. Since the production and productivity information for the crops at mandal levels are not available, crop area for the year 2013-14 (latest available) was considered.
b. Minimum area under single crop in any mandal considered as 3000 hectares for major (cereal) crops and 1000 hectares for high value/ commercial/pulse crops.
c. Geographical proximity of the mandals in a single cluster was given priority so as to keep lower transaction cost for aggregation.
Table 6.1 District-wise importance of different crops in Andhra Pradesh state
DistrictMajor crops with coverage > 5000 ha
Minor crops with coverage between 3000-5000 ha
Anantapur Groundnut, Bengal gram, Cotton, Rice, Fresh and dry fruits
Jowar (sorghum), maize, fresh and dry fruits
Chittoor Groundnut, Rice Fresh and dry fruitsEast Godavari Rice, Fresh and dry fruits Maize, green gram, vegetables Guntur Rice, Maize, Blackgram, Cotton Red gram, ChiliesKadapa Fresh and dry fruits, groundnut, Bengal gram VegetablesKrishna Rice, blackgram, cotton Maize, Fresh and dry fruitsKurnool Rice, Jowar (sorghum), maize, red gram,
groundnut, bengal gram, cottonNellore Rice Fresh and dry fruitsPrakasam Rice, red gram, bengal gram, cotton Fresh and dry fruits, groundnutSrikakulam Rice Maize, Fresh and dry fruitsVisakhapatnam Rice Fresh and dry fruits, bengal gramVizianagaram Rice, Fresh and dry fruits Maize, Fresh and dry fruits, cottonWest Godavari Rice, Maize, Fresh and dry fruits Green gram, Fresh and dry fruits, cotton

65
d. A cluster of 4-5 mandals should have crop area of minimum 10,000 ha (in case of high value, cash crops or pulses) and maximum of about 100,000 ha (in case of major cereal crops).
e. The individual cluster of mandals may have one major driving commodity, on top of which other commodities may be added, as the FPOs mature over time or as demands arise.
6.2.1 Anantapur districtThe Anantapur district has 63 mandals. The major crops grown in the district are groundnut (65.84%), bengal gram (7.76%), red gram (4.51%), rice (3.65%) and fresh and dry fruits (3.53%). All together they are occupying nearly 80.78% of the total gross cropped area. The top three mandals under groundnut cultivation in the district are Kalyanadurg, Kanaganapalli and Kambadur. The major mandals under red gram cultivation in the district were Roddam, Madkasir and Atmakur. Other pulses (predominantly bengal gram) were grown under mandals of Vidanapanakal, Kanekal and Vajrakarur. The potential mandals for ‘fresh and dry fruits’ were Putluru, Yelannuru, Peddapaparru, Garladine and Tadipatri. Also, rice is the major irrigated crop grown, except in Kanekal mandal (6496 ha), the area under rice in all other mandals is less than 1000 ha. Total minor millets occupies very insignificant cropped area (0.08%) and was grown in Anantapur division (77%) and remaining (23%) in Kalyanadurgam division. The dominant mandals under the crop are Yadiki, Tadapatri, Putlur and Beluguppa constituting 68% of total cropped area. Table 6.2 and Figure 6.2 summarizes potential crop area combination for the Anantapur district. The table highlights dominant mandals for forming a crop specific cluster in the district. Also, clusters are identified purely based on close geographical proximity between the mandals. Table 6.2 shows that a total of 12 clusters can be formed in the district with groundnut, bengal gram and fruits as major commodities.
Table 6.2 Potential clusters for crop-based FPOs in Anantapur district
CropNumber of
ClustersMandals (12 crops-based clusters)
Area (ha)
Groundnut 9 1. Brahmasamudram, Settur, Kundurpi, Gummagatta, Kalyandurg, Belugappa
112685
2. Rayadurg, Uravakonda, Kanekal, D.Hirchal, Bommanahal, Vidapanakal
68255
3. Kudair, Atmakur, Anantapur, Garladinne, Raptadu 711264. Vajrakarur, Pamidi, Guntakal, Gooty, Peddapappur, Yadiki, 811915. Singanamala, Putlur, Bukkarayasamudram, Narpala, Tadimarri,
Bathalapalle58431
6. Kanaganapalle, Ramagiri, Dharmavaram, Chenne Kothapalle 795297. Mudigubba, Talupula, Gandlapenta, Nambulapulikunta, Kadiri,
Bukkapatnam61127
8. Amadagur, Tanakal, Nallacheruvu, Obuladevaracheruvu, Nallamada, Gorantla
63328
9. Agali, Gudibanda, Rolla, Madakasira, Roddam, Puttaparthi, Penukonda
68747
Bengal gram
2 10. Belguppa, Vidanapanakal, Kanekal, Vajrakarur, Uravakonda, Bommanahal
54385
11. Yellanur, Putlur, Peddapappur, Tadipatri 21806
Fresh and dry fruits
1 12. Narpal, Putlur, Yelannuru, Peddapaparru, Tadipatri 16343

66
Figure 6.2. Area under major crops, Anantapur district.
6.2.2 Chittoor districtThere are 66 mandals in Chittoor district.In Chitoor, groundnut is the major crop grown in the district and is covering 37.18% of the gross cropped area (GCA). The potential mandals for groundnut cultivation are Thamballapalle, Pedda Thippasamudram and Mulakalacheruvu. Rice occupies nearly 11.95% of gross cropped area in the district. The top three mandals under rice cultivation in the district were Srikalahasthi, Thotambedu and Yerpedu. In the district, fresh and dry fruits are having a share of 18.12% in GCA. Mango ranks first and covers 88.12% of the total cropped area under fruits. The major mandals identified for mango cultivation are Bangarupalem, Pulicherla and Irala. The total vegetables together have a share of 5.25% in total cropped area (tomato alone occupies 62.1% of total vegetable cropped area). Pedda Thippasamudram, Mulakalacheruvu and Ramakuppam are major mandals for vegetables cultivation in the district. The Table 6.3 and Figure 6.3 summarizes that a total of 8 clusters can be formed in the district with groundnut as a major crop. Larger clusters can be further divided based upon the geographical and socio-economic condition prevailing. Even though groundnut is a major crop spread across the mandal, more scope exists for fresh and dry fruits followed by groundnut. The mandals bordering Nellore have high potential for rice markets/FPOs (north-west and south-west) in the district. To be precise, the central part of the district and mandals bordering Karnataka have very high potential for establishing an FPO.
6.2.3 East Godavari districtThere are 64 mandals in the district and the major crops grown are rice, green gram, black gram, fresh fruits, coconut and vegetables which occupy nearly 85.11% of the total cropped area and, rice alone occupies 57.63 % of total cropped area in the district. The top three mandals under rice cultivation in the district are Samalakota, Kajuluru and Ramachandrapuram. Green gram and black gram have a combined share of 5.52% in GCA. The potential mandals identified for these crops are Thotangi, Korukonda, Prathipadu and Kotananduru. Apart from the above, fresh and dry fruits occupy 11.43% of gross cropped

67
Table 6.3 Potential clusters for crop-based FPOs in Chittoor district
CropNumber
of ClustersMandals (8 crops-based clusters)
Area (ha)
Groundnut 4 1. Pedda Thippasamudram, Mulakalacheruvu, Thamballapalle, Peddamandyam, B.Kothakota, Kurabalakota
40861
2. Kambhamvaripalle, Pileru, Kalakada, Kalikiri, Rompicherla, Yerravaripalem 199283. Baireddipalle, Venkatagiri Kota, Santhipuram, Ramakuppam, Kuppam 157314. Peddapanjani, Gangavaram, Palamaner, Bangarupalem, Thavanampalle 14787
Rice 1 5. Srikalahasti, Yerpedu, Thottambedu, Buchinaidukandriga, Varadaiahpalem 25578Fresh and dry fruits
2 6. Bangarupalem, Yadamari, Thavanampalle, Palamaner, Gangavaram 108017. Irla, Putalapattu, Pakala, Sodam, Somala, Thavanampalle, Chandragiri 18015
Ragi (Finger millet)
1 8. Gudipalle and Kuppam 6133
Figure 6.3. Area under major corps, Chittoor district.
area. Mango occupies nearly 24% of the total cropped area under fruits followed by banana (19%). The major mandals under the fruits are Rajanagaram, Atreyapuram and Thondangi. The total vegetables occupy 3.16% of the gross cropped area (tapioca occupies 19.68% under vegetables area). Peddapuram, Jaggampeta, Rangampeta and Gangavaram are major mandals for vegetables cultivation and coconut is grown predominantly in Mamidikudurru, Ainavilli, I.Polavaram, P.Ganavaram, Malkipuram and Ambajipeta. It has a share of 7.36% in the total GCA of the district. Table 6.4 and Figure 6.4 summarizes that a total of 10 clusters can be formed in the district with rice as a major crop. There is a huge scope of forming FPOs on fresh and dry fruits along with coconut. There is a large scope for black gram crop to be promoted in two mandals. The central part of the district along with mandals towards West Godavari and sea coast have high market potential. The mandals like Gangavaram, Rampachodavaram and Addategala under tribal region has potential for cashew, mango and tapioca markets.

68
Figure 6.4. Area under major crops, East Godavari district.

69
Table 6.4 Potential clusters for crop-based FPOs in East Godavari district
CropNumber
of ClustersMandals (10 crops-based clusters) Area (ha)
Rice 5 1. Bicavolu, Samalakota, Pedapudi, Peddapuram, Rajanagaram, Pithapuram
76143
2. Mandapeta, Alamuru, Ravulapalem, Kapileswarapuram, Kothapeta 470553. Kajuluru, Pamarru, Karapa, Thallarevu, Ramachandrapuram 698324. Kothapalli, Pithapuram, Gollaprolu, Thondangi, Kakinada (Rural) 435255. Allavaram, Amalapuram, Uppalaguptam, Mamidikuduru,
P_Gannavaram, Razole38408
Fresh and dry fruits
3 6. Rajanagaram, Korukonda, Rangampeta, Gandepalle 156107. Thodangi, Tuni, Kotananduru, Rowthulapudi, Sankhavaram 158038. Ainevelli, Kothapeta, P.Gannavaram, Ambhajipeta 10442
Coconut 2 9. Mamidikuduru, Razole, Malikipuram, Allavaram, Sakhinetipalle 1556710. Ainavilli, P.Gannavaram, Malikipuram, Ambajipeta, Amalapuram 16669
6.2.4 Guntur districtGuntur district has 57 mandals. The major crops grown in the district are rice (38.03%), cotton (22.39%), maize (10.09%), green gram (3.48%), black gram (4.28%), chilies (7.51%), fresh fruits (1.60%) and vegetables (1.51%). All major crops together occupy 88.90% of the total gross cropped area in the district. Major mandals under rice cultivation in the district are Bapatla, Nekarikallu, Rompicherla and Ponnur. Maize is predominantly grown in Duggirala, Vemuru, Kolluru, Bhattiprolu and Ponnuru mandals. Peddakakani, Amruthaluru Bapatla and Chebrolu mandals are potential mandals for green gram cultivation. Other mandals including Repalle, Ponnuru, Nagaram and Amruthalur mandals are also well known for black gram cultivation in the district. The presence of fruit cultivation is higher in case of Kollipara, Kolluru, Thulluru and Duggirala mandals. Mangalagiri, Tadepalli, Chebrolu and Kolluru are major mandals for vegetable cultivation. The jowar (sorghum) crop (post-rainy) occupies 1.57% of the total gross cropped area and is predominantly grown in Tenali division (Tenali, Kollipara, Dugirrala and Tsunduru) of the district. Chilies are grown largely in Sattanepalli, Veldurthi, Medikonduru and Machavaram mandals. For cotton crop, Veldurthi, Amaravathi, Durgi and Tadikonda are traditional growing areas in the district. The Table 6.5 and Figure 6.5 summarizes that a total of 18 clusters can be formed in the district with different crops as driving commodities in combination with other crops being grown in the clusters. The mandals falling under eastern part of the district have more potential for establishment of FPOs under irrigated crops while western part of the district which is predominantly rainfed area for cotton and chilly cultivation. The North-eastern part of the district is known for condiments like turmeric.
6.2.5 Kadapa districtKadapa district has 51 mandals. The major crops grown in the district are bengal gram (26.40%), groundnut (15.19%), sunflower (11.68%), rice (7.23%), jowar (sorghum) (3.75%), red gram (2.44%), fresh fruits (13.59%), and vegetables (3.37%), occupying 83.80% of the total gross cropped area. The major mandals under rice cultivation in the district are Brahmamgarimatam, Chapad, Sidhout and Pendlimarri. Jowar (sorghum) is predominantly grown in Chapad Muddanur, Rajupalem and Kondapur. Ramapuram, Galiveedu, Sambepalli are potential red gram cultivating mandals in the district. Pedamudium, Rajupalem, Simhadripuram and Veerapunayunipalem mandals are major mandals for Bengal gram cultivation. Lingala, Kodur, Simhadripuram and Obuluvaripalle mandals are dominated with fruits cultivation. Veerapunayunipalle, Galiveedu, Chakrayapet, Sambepalle are major mandals for groundnut cultivation. Table 6.6 and Figure 6.6 summarizes that a total of 8 clusters can be formed in the district with Bengal gram as a major crop followed by groundnut and fresh fruits.

70
Table 6.5 Potential clusters for crop-based FPOs in Guntur district
CropNumber of
ClustersMandals (18 crop-based clusters)
Area (ha)
Rice 6 1. Kollipara, Tenali, Chebrolu, Pedakakani, Duggirala 352622. Amruthalur, Ponnur, Bapatla, Karlapalem, Kakumanu, Tsundur 699893. Nizampatnam, Nagaram, Pittalavanipalem, Cherukupalle, Repalle,
Bhattiprolu46871
4. Narasaraopeta, Muppalla, Sattenapalle, Rajupalem, Nakarikallu 447335. Nuzendla, Vinukonda, Ipuru, Bollapalle, Rompicherla 368776. Rentachintala, Gurazala, Karempudi, Piduguralla 36748
Maize 2 7. Dugiralla, Tenali, Vemuru, Kollur, Bhattiprolu 307808. Ponnur, Kakumanu, Vatticherukuru 14079
Pulses (Green gram, Black gram)
2 9. Amruthalur, Ponnur, Cherukupalle, Pittalavanipalem, Tsundur, Chebrolu, Kakumanu
29084
10. Baptla, Karlapalem, Nagaram, Rapalle, Nizampatnam 20706Chilies 3 11. Sattenapalle, Medikonduru, Pedakurapadu, Tadikonda, Krosuru 14315
12. Veladurthi, Macherla, Durgi, Rentachintala, Gurazala 1462713. Machavaram, Piduguralla, Karempudi 8394
Cotton 5 14. Chilakaluripet, Nadendla, Edlapadu, Prathipadu, Pedanandipadu, Narasaraopeta
40713
15. Veladurthi, Durgi, Macherla, Rentachintala, Gurazala 3849916. Achampeta, Amaravathi, Tadikonda, Thullur, Pedakurapadu, Krosuru 4559917. Sattenapalle, Medikonduru, Prathipadu, Phirangipuram, Edlapadu 3284718. Dachepalle, Machavaram, Bellamkonda, Rajupalem, Piduguralla 23574
Table 6.6 Potential clusters for crop-based FPOs in Kadapa district
CropNumber of Clusters
Mandals (8 crops-based clusters)
Area (ha)
Pulses (mainly Bengal gram)
3 1. Lingala , Simhadripuram, Thandur, Pulivendula, Vemula, Vempalle 34945
2. Veerapunayunipalle, Kamalapuram, Yerraguntla, Muddanur, Proddutur 30387
3. Kondapuram, Jammalamadugu, Mylavaram, Peddamudium, Rajupalem 45440
Cotton 1 4. Vemula, Vempalle, Veerapunayunipalle 12214Groundnut 2 5. Vemula, Vempalle, Veerapunayunipalle, Thandur, Lingala 16169
6. Chakrayapet, Galiveedu, Chinnamandem, Rayachoti, Lakkireddipalle, Sambepalle 23855
Fresh Fruits 2 7. Lingala , Simhadripuram, Thandur, Pulivendula, Vemula 177528. Kodur, Obulavaripalle, Chitvel, Pullampeta 14038

71
Figu
re 6
.5. A
rea
unde
r maj
or c
rops
, Gun
tur d
istric
t.

72
Figu
re 6
.6. A
rea
unde
r maj
or c
rops
, Kad
apa
dist
rict.

73
6.2.6 Krishna districtThe district consists of 50 mandals and the major crops grown in the district are rice (49.87%), black gram (13.10%), cotton (8.14%), maize (4.51%), chilies (1.47%), fresh fruits (9.66%), and aromatic flowers (0.05%). All these crops together occupy nearly about 86.81% of the total gross cropped area of the district. Major mandals under rice cultivation in the district are Mudinepalle, Pedana, Guduru, and Machilipatnam. Maize is predominantly grown in Musunuru, Nuzvid, Chatrai and Veerullpadu. The mandals Movva, Pamarru, Gudlavalleru and Peddaparupudi are potential mandals for black gram cultivation. Chilies are dominant in Vatsavai, Gampalagudem, Penuganchipolu and Chandarlapadu mandals. Fresh fruits are majorly grown in Agiripalle, Vissanapeta, Nuzivid and Reddygudem mandals. Mango occupies almost 82% of cropped area under fresh fruits. Aromatic flowers are specifically grown in Mylavaram mandal and jasmine is the predominant produce occupying almost 83% of aromatic flowers area. Cotton is majorly grown in Chandarlapadu, Veerulapadu, Vatsavi and Kanchikacherla mandals. The crop-wise potential areas are summarized in Table 6.7 and Figure 6.7. Just like Kadapa district, Krishna district also has ample opportunities for setting up of single or multi-commodity FPOs in the district. Table 6.7 summarizes that a total of 17 clusters can be formed in the district based on dominant crops in different clusters. Large scope exists for multi-commodity FPOs, which can be established with strong intra/inter linkages between the villages in a mandal.
6.2.7 Kurnool districtThere are 54 mandals in this district and the major crops grown in the district are cotton (20.37%), groundnut (16.75%), rice (12.46%), jowar (sorghum) (6.01%), maize (5.18%), red gram (4.32%), other pulses predominantly bengal gram (20.10%), chilies (1.55%), vegetables (2.61%) and onions (1.71%).
Table 6.7 Potential clusters for crop-based FPOs in Krishna district
CropNumber of
ClustersMandals (17 crops-based clusters)
Area (ha)
Rice 8 1. Bantumilli, Kruthivennu, Kalidindi, Pedana, Mudinepalli 706502. Nagayalanka, Koduru, Avanigadda, Mopidevi, Challapalli 422903. Machilipatnam, Guduru, Ghantasala, Challapalli 527944. Movva, Pamidimukkala, Pamarru, Gudlavalleru, Gudivada, Pedaparupudi,
Nandivada66081
5. Thotlavalluru, Vuyyuru, Kankipadu, Penamaluru, Unguturu, Bapulapadu 403956. Gannavaram, Vijayawada (Rural), G.Konduru, Mylavaram 230867. Reddigudem, A.Konduru, Chatrai, Vissannapet, Tiruvuru, Gampalagudem 307678. Jaggayyapeta, Penuganchiprolu, Nandigama, Chandralapadu, Vatsavai 19152
Maize 1 9. Chatrai, Musunuru, Nuzvid 10785Black gram and Green gram
3 10. Nagayalanka, Koduru, Mopidevi, Challapalli, Ghantasala 1992611. Pedaparupudi, Gudivada, Nandivada, Unguturu, Bapulapadu 3027412. Movva, Pamarru, Gudlavalleru, Pamidimukkala, Thotlavalluru, Vuyyuru 41679
Chilies 1* 13. Vatsavai, Penuganchiprolu, Nandigama 4922Fresh Fruits 1* 14. Reddigudem, Nuzvid, Musunuru 4894Cotton 3 15. Jaggayyapeta, Vatsavai, Penuganchiprolu, Nandigama 14696
16. Chandralapadu, Kanchikacherla, Veerullapadu, G.Konduru 2477917. Mylavaram, A.Konduru, Gampalagudem, Tiruvuru 15130
* Chilies and fruits being high value crops, FPO may be set up even with smaller area, as other nearby mandals don’t grow the same crops.

74
Figu
re 6
.7.
Area
und
er m
ajor
cro
ps, K
rishn
a di
stric
t.

75
All these crops together occupy about 91.09% of the total gross cropped area in the district. The major mandals for rice cultivation in the district are Bandi Atmakuru, Sirvel, Nandyal, and Velgode. Jowar (sorghum) is predominantly grown in Banaganapalle, Panyam, Nandyal and Chagalamarri mandals and maize has intensive cultivation in Pamulapadu, Nandikotkuru, Atmakur and Jupadu Bungalow mandals. Also, red gram is also preferred in Bethamcherla, Veldhurthi, Peapally and Dhone mandals. The mandals Uyyalawada, Chippagiri, Sanjamala and Koilkuntla are traditional bengal gram cultivating mandals. Chilies have high potential in case of Halaharvi, Peda Kadabur, Chippagiri and Kowthalam mandals and onion is majorly grown in Kurnool, C.Belegal, Gonegandla and Pattikonda mandals. Mainly, vegetables cultivation has been adopted in case of Kurnool, C.Belegal, Aspari and Kodumur mandals. Groundnut is the preferred rainfed crop grown in Devanakonda, Krishnagiri, Dhone and Tugalli mandal. Table 6.8 and Figure 6.8 summarizes that a total of 19 clusters can be formed in the district with Bengal gram as a major crop followed by groundnut and rice. In Kurnool district, there is a good spread of crops across the mandals and potential scope exists for setting up of multi-commodity FPOs in the district. The eastern part of Kurnool exhibits very high potential for setting up of FPOs when compared with other regions.
6.2.8 Nellore districtThere are 47 mandals in the district and mostly dominated by rice crop. The major crops grown in the district are rice (60.1%), black gram (3.05%), fresh fruits and dry fruits (9.07%) and groundnut (4.02%). All major crops together occupy about 76.24% of the total gross cropped area in the district. The potential mandals for rice cultivation in the district are Chittamur, Allur, Vidavallur and Venkatachalam. Black gram is a predominantly grown crop in Vinjamur, Kondapuram, Kaligiri and Podalakur mandals and green gram also preferred in case of Kaligiri, Podalakur, Vinjamur and Indkurpet mandals. Fresh and dry fruits are intensively cultivated in Podalakur, Sydapuram, Gudur and Rapur mandals. The mandals Vidavalur, Dakili, Kavali and Muthukur are predominant groundnut cultivating mandals. Table 6.9 and Figure 6.9 summarize that a total of 8 clusters can be formed in the district with rice as a major followed by fresh and dry fruits.
6.2.9 Prakasam districtIt is geographically a large district, consisting of 56 mandals. The major crops grown in the district are rice (20.11%), bajra (pearlmillet) (3.76%), maize (3.35%), red gram (7.78%), bengal gram (10.08%), chili (4.08%), fresh and dry Fruits (3.98%) and cotton (12.24%). All these major crops together occupy nearly about 65.42% of the total gross cropped area in the district. The major mandals for rice cultivation in the district are Darsi, Tripuranthakam, Mundlamuru, Karamchedu and Thallur. Bajra is predominantly grown in Komarollu, Bestavaripeta, Konakanimitla, Velligandla and Kanigiri mandals and maize is intensively cultivated in Martur, Bestavaripeta, Chirala and Ardhaveedu mandals. Redgram is preferred crop in Podili, Kanigiri, Donakonda, Konakanimitla, Kurichedu and Veligandla mandals. The mandals Dornala, Yerragondapalem, Markapur and Inkollu are potential mandals for chilies cultivation in the district. Bengal gram is the traditional post-rainy season crop grown in Nagullupalapadu, Gidalluru, Komarollu, Ongole and Parchur mandals. Ulavapadu, Yerragondapalem, Gudluru and Peddacherlo Palle known for cultivation of fresh and dry fruit crops. The details about crop-wise potential mandals are summarized in Table 6.10 and Figure 6.10. Table shows that a total of 19 clusters can be formed in the district with rice as a major followed by bengal gram and cotton. The highest number of clusters can be formed with cotton and other major crops like rice, bengal gram, chilies and fresh and dry fruits have equal opportunities and bajra can be formed in two clusters. The central part of the district is having high potential for establishment of multi-commodity FPOs in the district.
6.2.10 Srikakulam districtThe district has 37 mandals and the major crops grown in the district are rice (49.09%), black gram (10.34%), fresh and dry fruits (8.93%), green gram (7.93%), groundnut (3.87%), maize (2.6%) and coconut
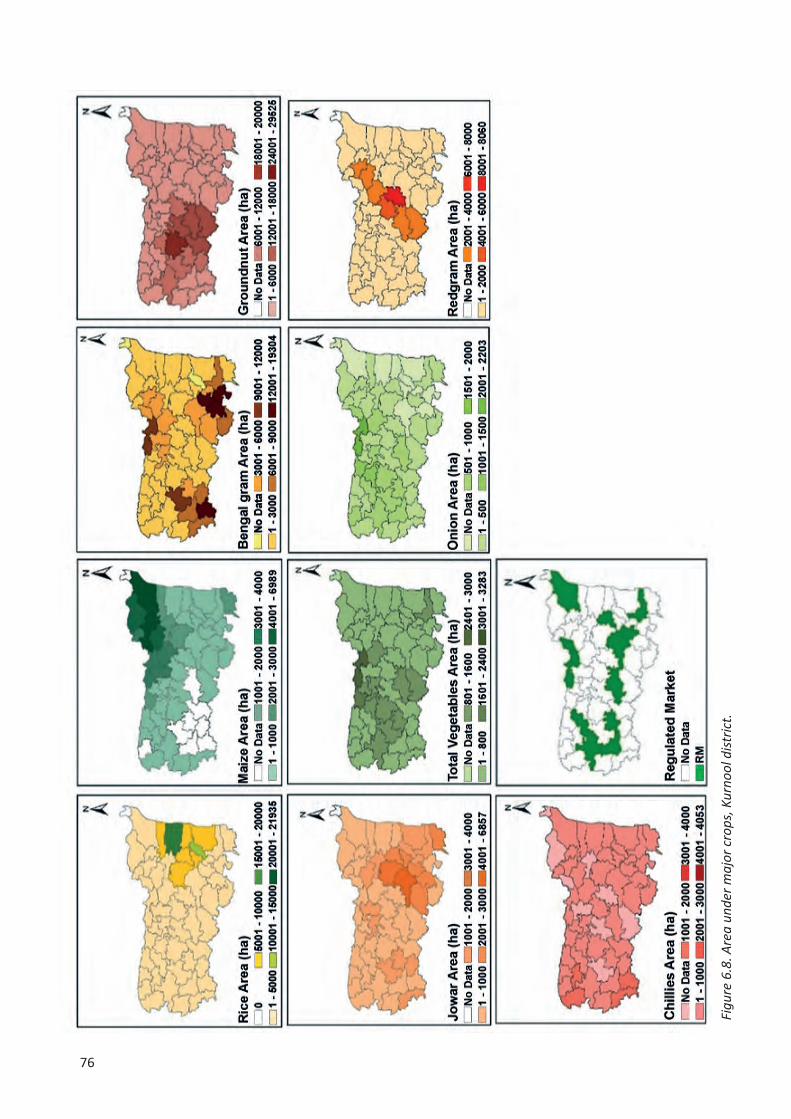
76
Figu
re 6
.8. A
rea
unde
r maj
or c
rops
, Kur
nool
dist
rict.
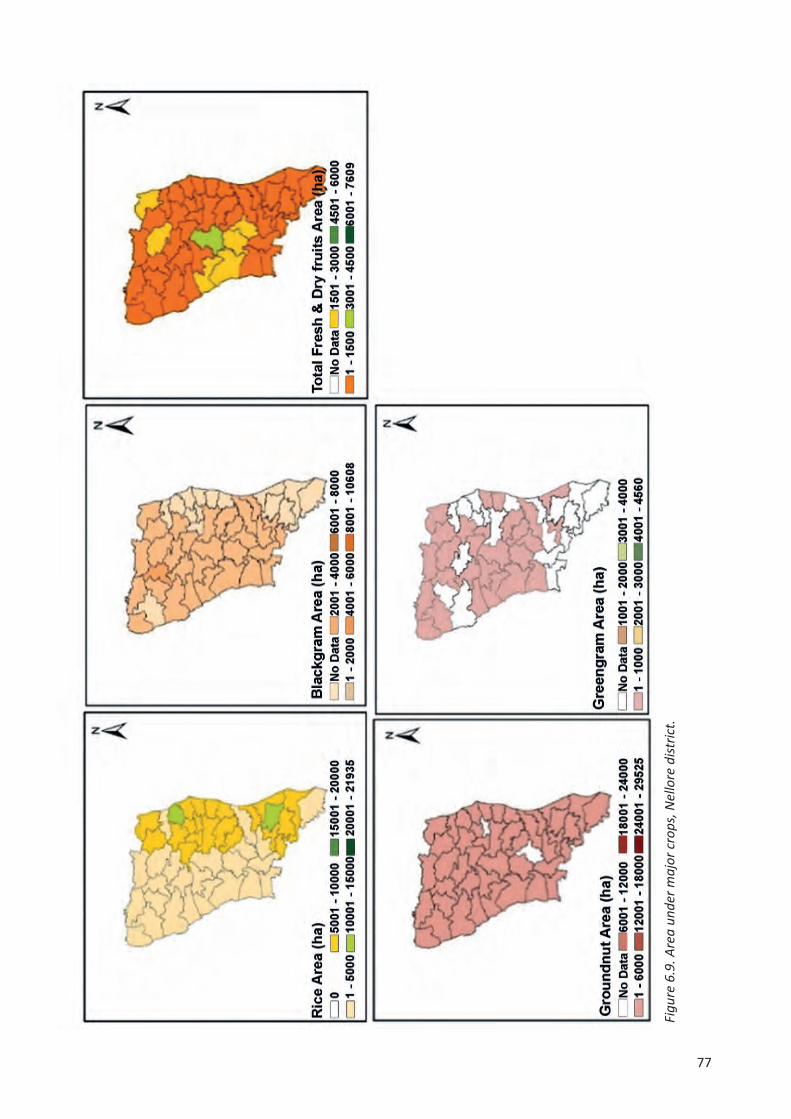
77
Figu
re 6
.9. A
rea
unde
r maj
or c
rops
, Nel
lore
dist
rict.
78
Figu
re 6
.10.
Are
a un
der m
ajor
cro
ps, P
raka
sam
dist
rict.

79
Table 6.8 Potential clusters for crop-based FPOs in Kurnool district
Crop No. of Clusters Mandals (19 crops-based clusters) Area (ha)
Rice 3 1. Atmakur, Bandi Atmakur, Velgodu, Pamulapadu 303102. Rudravaram, Sirvel, Gospadu, Mahanandi, Allagadda, Chagalamarri 359503. Nandyala, Banaganapalle, Panyam, Gadivemula 22230
Jowar (sorghum)
2 4. Banaganapalle, Panyam, Nandyala, Gospadu, Sirvel 182405. Owk, Sanjamala, Koilkuntla, Dornipadu, Allagadda 10726
Maize 2 6. Pamulapadu, Atmakur, Kothapalle, Jupadu Bungalow, Pagidyala 210797. Nandikotkur, Midthur, Orvakal, Kallur, Kurnool 16508
Red gram 2 8. Bethamcherla, Veldurthi, Peapally, Dhone 186649. Jupadu Bungalow, Midthur, Orvakal 7420
Bengal gram 5 10. Uyyalawada, Koilkuntla, Dornipadu, Allagadda, Chagalamarri 4371611. Sanjamala, Kolimigundla, Owk, Banaganapalle 3046912. Orvakal, Midthur, Jupadu Bungalow, Panyam, Nandikotkur 2217813. Kurnool, Kallur, Gudur, Kodumur 2044014. Maddikera East, Chippagiri, Pattikonda, Aspari, Alur, Halaharvi 54884
Groundnut 4 15. Adoni, Kowthalam, Kosigi, Peddakadubur, Yemmiganur 2441016. Aspari, Pattikonda, Tuggali, Devanakonda, Maddikera East 5821717. Nandavaram, C.Belagal, Gonegandla, Kodumur, Gudur 1579418. Dhone, Krishnagiri, Peapally, Veldurthi 52639
Castor 1 19. Devanakonda, Dhone, Gonegandla, Krishnagiri, Veldurthi 12129
Table 6.9 Potential clusters for crop-based FPOs in Nellore district
CropNumber of
ClustersMandals (8 crops-based clusters)
Area (ha)
Rice 6 1. Allur, Dagadarthi, Bogole, Jaladanki, Kavali 36551
2. Vidavalur, Kodavalur, Butchireddypalem, Kovur, Indukurpet, Thotapalligudur
46238
3. Venkatachalam, Muthukur, Manubolu, Chillakur, Kota 34672
4. Vakadu, Chittamur, Sullurpeta, Tada, Doravarisatram 37883
5. Pellakur, Naidupeta, Ojili 14941
6. Nellore, Podalakur, Chejerla, Atmakur, Sangam 24871
Pulses (Blackgram, greengram, Bengal gram)
1 7. Kondapuram, Kaligiri, Duttalur, Vinjamur, Atmakur 13753
Fresh and Dry Fruits 1 8. Podalakur, Sydapuram, Rapur, Kaluvoya, Chejerla 11115
(3.5%). All these major crops together occupy nearly 86.25% of the total gross cropped area in the district. The potential mandals for each identified crop are summarized. The summary of those detail furnished in Table 6.11 and Figure 6.11. Table shows that a total of 16 clusters can be formed in the district with rice as a major followed by pulses like black gram and green gram. There is potential for fresh and dry fruits as well.

80
Table 6.10 Potential clusters for crop-based FPOs in Prakasam district
CropNumber of
ClustersMandals (19 crops-based clusters)
Area (ha)
Rice 4 1. Kurichedu, Tripuranthakam 139412. Karamchedu, Chirala, Parchur, Chinaganjam, 21897
3. Santhamaguluru, Ballikuruva, Addanki, Martur, Janakavarampanguluru 25211
4. Darsi, Mundlamuru, Thallur 27747Bajra 1 5. Bestavaripeta, Komarolu, Chadrasekarapuram, Veligandla 12063Red gram+ Black gram
3 6. Chadrasekarapuram, Veligandla, Hanumanthunipadu, Bestavaripeta 100357. Kanigiri, Pamur, Pedacherlopalle 118388. Darsi, Kurichedu, Donakonda, Konakanamitla 13851
Chilies 2 9. Yerragondapalem, Tripuranthakam, Peda Araveedu, Pullalacheruvu, Donakonda
7260
10. Dornala, Ardhaveedu, Markapur 5831Bengal gram
3 11. Bestavaripeta, Racherla, Komarolu, Cumbum, Giddaluru 1567512. Naguluppalapadu, Ongole, Kothapatnam, Maddipadu, Korisapadu 1861513. Parchur, Karamchedu, Chinaganjam, Inkollu, Janakavarampanguluru 12073
Fresh & Dry Fruits
1 14. Ulavapadu, Gudluru 5317
Cotton 5 15. Ardhaveedu, Dornala, Markapur 832716. Gudluru, Racherla, Komarolu, Bestavaripeta, 935917. Donakonda, Konakanamitla, Darsi, Kurichedu 1146118. Mundlamuru, Addanki 617119. Yeddanapudi, Inkollu 11169
Table 6.11 Potential clusters for crop-based FPOs in Srikakulam district
CropNumber of
ClustersMandals (16 crops-based clusters)
Area (ha)
Rice 7 1. Ganguvarisigadam, Rajam, Ponduru, Santhakaviti, Amudalavalasa, Burja 273082. Gara, Srikakulam, Polaki, Narsannapeta, Jalumuru, Sarbujjili 42520
3. Regidiamudalavalasa, Vangara, Veeraghattam, Palakonda 23250
4. Bhamini, Kotturu, Hiramandalam, Pathapatnam 207315. Kotabommali, Santhabommali, Tekkali, Saravakota, Meliaputti 361386. Nandigam, Vajrapukotturu, Palasa, Mandasa 236007. Sompeta, Kanchili, Ichchapuram 15394
Maize 1* 8. Ganguvarisigadam, Laveru, Rajam 8540Blackgram+ Green gram
5 9. Ganguvarisigadam, Ponduru, Rajam, Santhakaviti 10471
10. Amudalavalasa, Burja, Srikakulam, Gara, Sarbujjili 1284711. Regidiamudalavalasa, Vangara, Veeraghattam, Palakonda 12054
12. Narsannapeta, Polaki, Kotabommali, Jalumuru, Saravakota 1557013. Santhabommali, Tekkali, Meliaputti, Nandigam, Vajrapukotturu 10606
Fresh and Dry Fruits
2* 14. Mandasa, Palasa, Vajrapukotturu 887015. Ranastalam, Laveru 5686
Groundnut 1* 16. Ganguvarisigadam, Ponduru, Rajam, Santhakaviti 7997
*Though these clusters have less area under respective crops, but being this an important crop for the clusters may be promoted as FPO.

81
Figu
re 6
.11.
Are
a un
der m
ajor
cro
ps, S
rikak
ulam
.

82
6.2.11 Vizianagaram districtThe district has 34 mandals and the major crops grown in the district are rice (33.42%), maize (8.31%), green gram (3.97%), black gram (4.9%), fresh and dry fruits (19.28%), cotton (4.2%) and sesemum (6.12%). All these major crops together occupy nearly 80.29% of the total gross cropped area in the district. The crop specific potential mandals are identified for setting up of single or multi-commodity FPOs in the district. The corresponding promising crops also highlighted against the potential mandals in the district. The summary of these details are presented in Table 6.12 and Figure 6.12. Table shows that a total of 16 clusters can be formed in the district with rice as a major followed by fresh and dry fruits and maize. The highest number of clusters can be formed with fresh and dry fruits and northern part of the district has good potential.
Table 6.12 Potential clusters for crop-based FPOs in Vizianagaram district
CropNumber of
ClustersMandals (16 crops-based clusters)
Area (ha)
Rice 4 1. Garugubilli, Jiyyamma Valasa, Komarada, Kurupam, Parvathipuram 28039
2. Makkuva, Seethanagaram, Balajipeta, Bobbili, Therlam 28099
3. Mentada, Dattirajeru, Gajapathinagaram, Bondapalle 15234
4. Lakkavarapukota, Vepada, Srungavarapukota, Jami, Gantyada 22546
Maize 2 5. Cheepurupalle, Pusapatirega, Gurla, Nellimarla, Denkada, Garividi 16577
*6. Salur, Pachipenta, Makkuva 7016
Black gram+ Green gram
2 7. Srungavarapukota, Gantyada, Vepada, Jami, Lakkavarapukota, Bondapalle
11125
*8. Balajipeta, Seethanagaram, Parvathipuram, Garugubilli 6974
Fresh and Dry Fruits
6 *9. Bhoghapuram, Denkada, Pusapatirega, Vizianagaram, Nellimarla 8784
*10. Garugubilli, Jiyyamma Valasa, Komarada, Kurupam, Gummalakshmipuram
9082
*11. Parvathipuram, Bobbili, Badangi, Makkuva, Ramabhadrapuram 8522
12. Gurla, Cheepurupalle, Garividi, Gajapathinagaram, Dattirajeru 11651
13. Kothavalasa, Lakkavarapukota, Vepada, Srungavarapukota, Jami, Gantyada
14705
*14. Merakamudidam, Therlam, 8626
Cotton 1 *15. Salur, Ramabhadrapuram, Pachipenta 7741
Sesame 1 *16. Jiyyamma Valasa, Garugubilli, Parvathipuram, 6347
*Though these clusters have less area under respective crops, but being this an important crop for the clusters may be promoted as FPO.
6.2.12 Visakhapatnam districtThe district has 43 mandals and the major crops grown in the district are rice (29.05%), ragi (finger millet) (5.82%) and fresh and dry fruits (13.67%). All these major crops together contribute about 48.54% of the total gross cropped area in the district. The crop-wise potential mandals are identified and summarized in Table 6.13 and Figure 6.13. shows that a total of 9 clusters can be formed in the district with rice as a major followed by fresh and dry fruits. North-West part of the district is having potential for rice and ragi (finger millet) while south-west part is for fresh fruits.
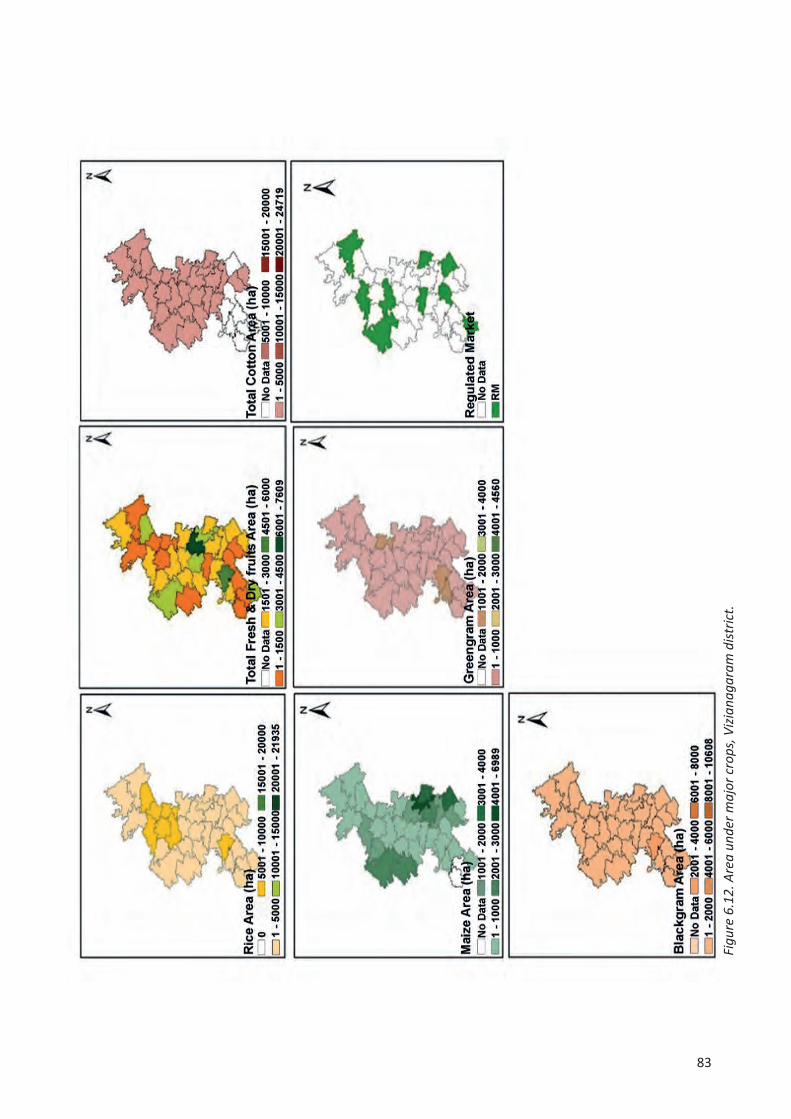
83
Figu
re 6
.12.
Are
a un
der m
ajor
cro
ps, V
izian
agar
am d
istric
t.
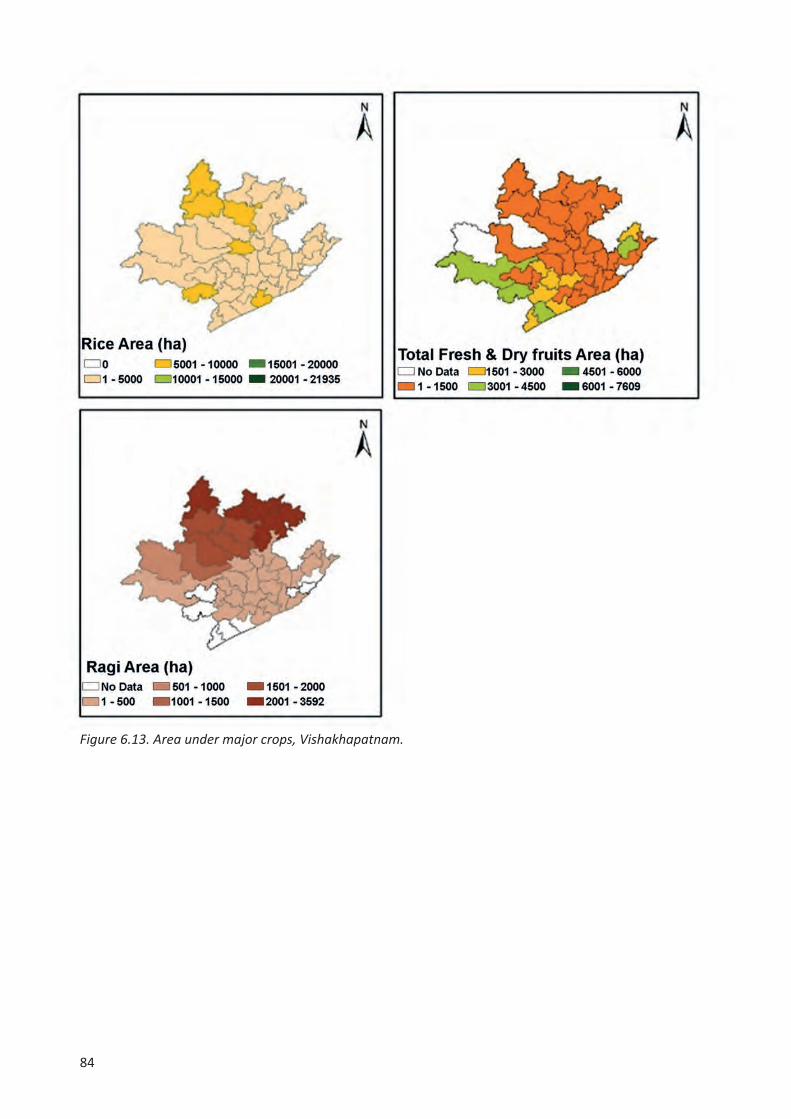
84
Figure 6.13. Area under major crops, Vishakhapatnam.

85
Table 6.13 Potential clusters for crop-based FPOs in Visakhapatnam district
CropNumber of
ClustersMandals (9 crops-based clusters)
Area (ha)
Rice 5 1. Aruku Valley, Dumbriguda, Hukumpeta, Paderu 18283
2. Munchingiputtu, Pedabayalu 10569*3. Nathavaram, Narsipatnam 93564. Payakaraopeta, Nakkapalli, S.Rayavaram, Rambilli 150085. Devarapalle, Cheedikada, Butchayyapeta, Chodavaram, Anakapalli, 13243
Fresh and Dry Fruits
3 6. Payakaraopeta, Nakkapalli, Kotauratla, Nathavaram 11826*7. Golugonda, Narsipatnam, Makavarapalem, Rolugunta, Butchayyapeta 8989*8. Koyyuru 4332
Ragi (Finger millet)
1 9. Aruku Valley, Ananthagiri, Dumbriguda, Hukumpeta, Paderu 12118
*Though these clusters have less area under respective crops, but this is an important crop for the clusters and may be promoted as FPO.
6.2.13 West Godavari districts
The district has 48 mandals and the major crops grown in the district are rice (59.22%), maize (7.99%), coconut (3.21%) and fresh and dry fruits (7.01%). All these crops together contribute about 77.44% of the total gross cropped area in the district. The crop-wise potential mandals are summarized and furnished in Table 6.14 and Figure 6.14. Table shows that a total of 14 clusters can be formed in the district with rice as a major crop followed by maize and fresh and dry fruits.
Table 6.14 Potential clusters for crop-based FPOs in West Godavari district
CropNumber of
ClustersMandals (14 crops-based clusters)
Area (ha)
Rice 6 1. Pedapadu, Eluru, Denduluru, Pedavegi, Bhimadole 408692. Unguturu, Undi, Akividu, Ganapavaram, Pentapadu 802763. Kovvuru, Nidadavole, Devarapalle, Gopalapuram, Tadepalligudem 484254. Poduru, Achanta, Penugonda, Iragavaram, Attili, Penumantra 694215. Narasapuram, Mogalthur, Bhimavaram, Veeravasaram, Palakol 530926. Peravali, Tanuku, Undrajavaram, Nidadavole, Chagallu 45553
Maize 2 7. Chintalapudi, Pedavegi 12613*8. Dwaraka Tirumala, Nallajerla, Unguturu, Tadepalligudem 8318
Fresh and Dry Fruits
3 9. Jangareddigudem, Dwaraka Tirumala, Nallajerla 11856*10. Chintalapudi 5678*11. Peravali, Undrajavaram, 6355
Coconut 3 *12. Pedavegi, Dwaraka Tirumala, Denduluru 6142*13. Elamanchili, Achanta 3760*14. Chagallu, Devarapalle, Nidadavole 3117
*Though these clusters have less area under respective crops, but being this an important crop for the clusters may be promoted as FPO.
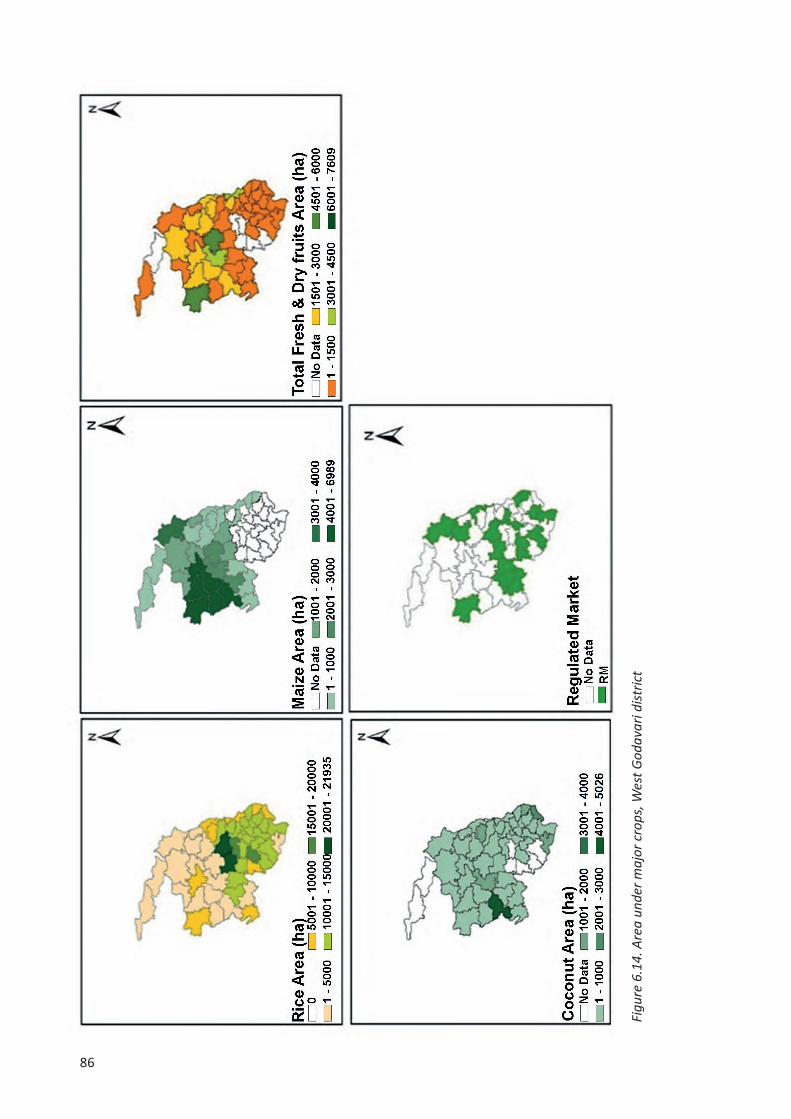
86
Figu
re 6
.14.
Are
a un
der m
ajor
cro
ps, W
est G
odav
ari d
istric
t

87
Table 6.15 Distribution of possible FPOs based on agricultural commodities across districts of AP state
Main Crops
13 districts of Andhra Pradesh state
TotalATP CHT EG GNT KDP KSN KRL NLR PKM SKL VST VZN WG
Rice 1 5 6 8 3 6 4 7 5 4 6 55Fruits- Fresh & Dry
1 2 3 2 1 1 1 2 3 6 3 25
Groundnut 9 4 2 4 1 20Cotton 5 1 3 5 1 15Bengal gram 2 3 5 3 13Pulses (GG+ BlG)
2 3 5 2 12
Maize 2 1 2 1 2 2 10Chilies 3 1 2 6Coconut 2 3 5Pulses (RG+ BlG)
3 3
Red gram 2 2Jowar (sorghum)
2 2
Ragi 1 1 2Pulses (BlG+ BnG)
1 1
Bajra 1 1Castor 1 1Sesemum 1 1District Total 12 8 10 18 8 17 19 8 19 16 9 16 14 174
ATP: Anantapur; CHT: Chittoor; EGD: East Godavari; GNT: Guntur; KDP: Kadapa; KSN: Krishna; KRL: Kurnool; NLR: Nellore; PKM: Prakasam; SKL: Srikakulam; VST: Vishakhapatnam; VZN: Vizianagaram; WGD: West GodavariBlG: Black gram; GG: Green gram; RG; Red gram; BnG: Bengal gram; *including Green gram.
From the preceding discussions, around 174 potential clusters of different agricultural commodities appear to be a good number to start with for setting up of FPOs in Andhra Pradesh state. It must be kept in mind that to convert the clusters into successful and sustainable business case, there should be sufficient marketable surplus and basic minimum infrastructure should be in the place to connect to the buyers of the produce. In a nutshell, these potential FPOs are spread across different districts with driving commodity given in Table 6.15. According to this, rice and fruits- fresh and dry are emerging as the most powerful engines for FPOs to be driven in the state. Being a large area under these crops, 55 FPOs are being suggested for rice-based, 25 FPOs for fruits, 15-20 FPOs each for cotton and groundnut, 10-13 FPOs each for bengal gram and maize. Besides, there are good scope for 12 FPOs for black gram and greengram together, 2-3 FPOs for red gram and red gram with black gram. Similarly, crops like chilies and coconut has potential to be aggregated in 5-6 clusters. Further, there is some scope to set up a couple of FPOs for crops like jowar (sorghum), bajra, ragi (finger millet), sesame, castor, etc. Moreover, in the medium to long term, full year operations of these FPOs may be required for providing gainful employment to all the members. This may need to intervene in the cropping pattern with high value crops under protected condition and/or application of more innovative modern technologies and practices. It should also be kept in mind that rice-based FPOs may face serious challenge in upgrading the value chain due to its limited scope of value addition, and may have prevailing problems of any regular commodities.

88
6.3 Potentials of livestock sector in AP StateSimilar exercise was also carried out in case of different sub-sectors of livestock with available secondary sources of information for identification of potential clusters across different districts in the state. Mandal-level livestock population was considered for mapping the spread of livestock. The non-availability of production data at mandal level is again a major limitation of the study. The top three districts for each livestock population type was highlighted and presented in Table 6.16. The spatial distribution of different types of livestock exhibits good potential in setting up FPOs for cow milk and milk products in Chittoor, Kurnool, Srikakulam, Vishakhapatnam and Vizianagaram districts. In East Godavari, Guntur, Kadapa, Krishna, Nellore, Prakasam and West Godavari districts FPOs for buffalo milk can be established. Similarly, for small ruminants like sheep and goat, the efforts may be made in Chittoor, Kadapa, Kurnool, Nellore and Prakasam districts. For setting up of dairy FPOs, the presence of existing system needs to be properly evaluated to better understand the value proposition to be offered to the milk producers in the region. For example, Visakha Dairy is having procurement operations covering Costal Andhra districts of Visakhapatnam, Vizianagaram, Srikakulam, East and West Godavari Districts and procuring about 0.7 million liters of milk per day from 2,60,699 milk producers thru 3734 collection centers. Similarly, several dairy companies are procuring milk through dairy co-operatives in these districts.
Table 6.16 Percentage distribution of different livestock across the districts in AP state
District Cattle Buffalo Sheep Goat
Anantapur 2.33 0.89 4.94 2.62Chittoor 21.60 1.22 10.56 10.05East Godavari 7.36 11.56 2.63 5.27Guntur 2.49 14.42 5.07 4.95Kadapa 6.78 14.32 24.83 22.55Krishna 1.84 10.33 4.35 3.57Kurnool 9.53 6.00 12.74 11.88Nellore 2.68 9.20 8.88 8.35Prakasam 1.78 14.61 11.96 9.72Srikakulam 18.28 1.81 4.66 4.89Visakhapatnam 12.01 4.60 2.15 7.75Vizianagaram 9.00 1.88 3.50 3.96West Godavari 4.34 9.17 3.73 4.46Andhra Pradesh 100.00
(41,98,718)100.00
(66,41,092)100.00
(1,17,57,415)100.00
(41,81,200)Figures within parentheses are the total numbers of livestock heads in the state under respective categorySource: Census-Department of Animal Husbandry- AP
6.3.1 Potential clusters for cattle-based FPOs Figure 6.15 shows that there was a very good spread of cattle population across the mandals of Vishakhapatnam and Srikakulam districts. The spread of cattle is also good in case of Chittoor and it is localized with a few cluster of mandals in Kurnool district.

89
Figure 6.15. Geospatial spread of cattle population in the state.
Figure 6.16. Geospatial spread of buffalo population in the state.
6.3.2 Potential clusters for buffaloes-based FPOs Buffalo is more widely distributed among several mandals across many districts. The figure 6.16 shows that Kadapa, Prakasam and parts of Guntur, West Godavari and East Godavari are having higher number of buffalo population. However, the spread of buffalo population is more evident in Kadapa district. This offers ample opportunity to bring all the milk producers together and facilitate them in aggregating their produce and add value at their doorsteps.
6.3.3 Potential clusters for sheep and goats-based FPOs Also, Figure 6.17 and 6.18 show that Kadapa district is having highest population of sheep in the state. The spread of sheep population also observed intensively in case of Kurnool and Prakasam districts. These three districts are indicating good potential for setting up of meat based FPOs in the state. Moreover, goat is widely distributed across several districts in coastal region also.
Figure 6.17. Spread of sheep population in A.P. Figure 6.18. Spread of goat population in A.P.

90
Table 6.17 Summary of district-wise potential mandals by livestock type
District Cattle Buffalo Sheep Goat
Anantapur Brahmasamadrum Bukkarayasamudram Bukkarayasamudram KanaganipalliGorantla Gorantla Kanaganipalli MadakasirMadakasir Peddapappuru Puttaparthi NallalacheruvuParigi Tadipatri Settur PuttaparthiPuttaparthi Yellanur Tadimarri Tanakal
Chittoor Bangarupalem Buchinaidu kandriga B.kothakota ChandragiriGangadharanellore K.v.b.puram Kambhamvaripalle KambhamvaripalleKuppam Satyavedu Pedda thippasamudram PeddamandyamMadanapalle Srikalahasti Peddamandyam SatyaveduVenkatagirikota Varadaiahpalem Thamballapalle Vedurukuppam
East Godavari Addateegala Biccavolu Addateegala DevipatnamRajavommangi Kapileswarapuram Rajavommangi RampachodavaramRampachodavaram Pithapuram Rampachodavaram ThondangiThondangi Rajanagaram Thondangi TuniY. Ramavaram Thondangi Y. Ramavaram Y. Ramavaram
Guntur Bellamkonda Nagaram Atchampet AtchampetBollapalle Nekarikallu Bollapalle BellamkondaMachavaram Nuzendla Macherla BollapalleMacherla Repalle Nuzendla MacherlaVeldurthi Rompicherla Veldurthi Veldurthi
Kadapa Chakrayapet Badvel Muddanur ChakrayapetGaliveedu Chapad Mylavaram GaliveeduLakkireddipalle Porumamilla Rayachoti RajampetSambepalle Proddatur Sambepalle T sundupalleT sundupalle S.mydukur T sundupalle Vempalle
Krishna Chatrai Agiripalli Agiripalli A konduruGampalagudem Chatrai Jaggaiahpet AgiripalliJaggaiahpet Gudlavalleru Machilipatnam ChatraiMusunuru Musunuru Musunuru MusunuruVatsavai Nuzvid Nuzvid Nuzvid
Kurnool Adoni Allagadda Kolimigundla BanaganapalleDevanakonda Banaganapalle Krishnagiri BethamcherlaDhone Owk Peapally OwkKowthalam Peapally Veldurthi PeapallyPeapally Rudravaram Yemmiganur Veldurthi
Nellore Chillakur Kaligiri Doravarisatram PodalakurDakkili Kavali Podalakur RapurDoravarisatram Marripadu Rapur SydapuramRapur Podalakur Seetharamapuram UdayagiriVakadu Varikuntapadu Varikuntapadu Varikuntapadu
Continued.
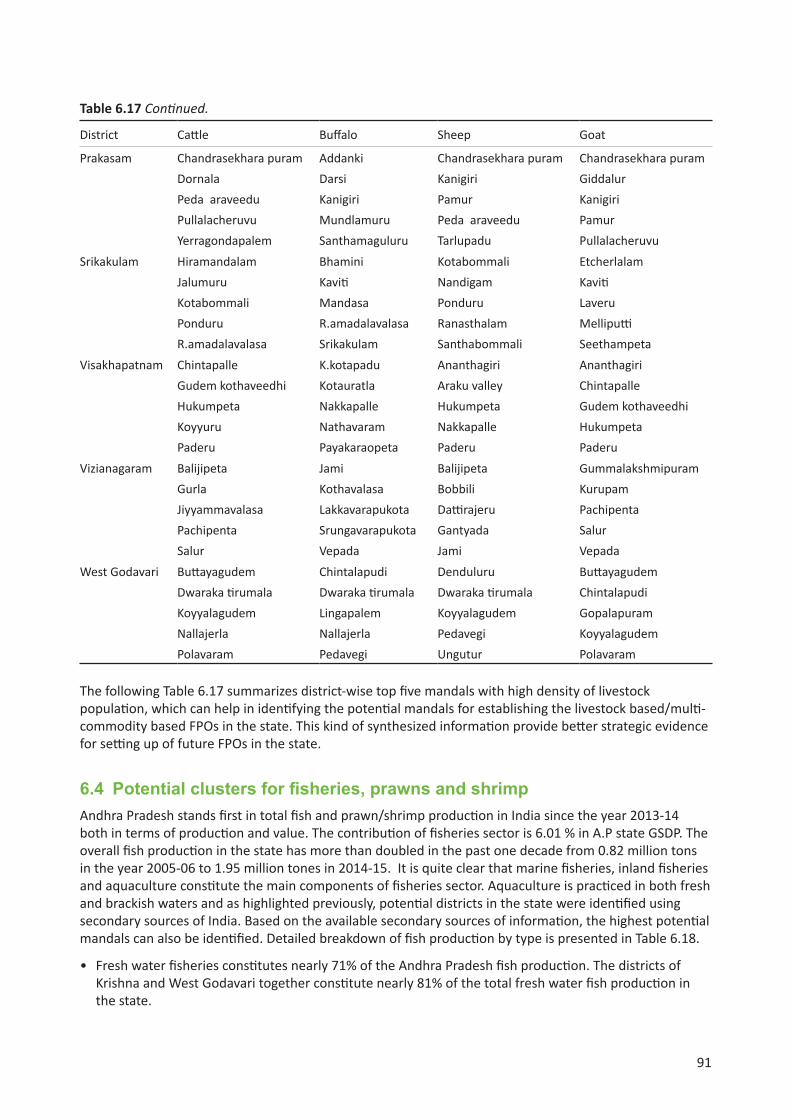
91
Table 6.17 Continued.
District Cattle Buffalo Sheep Goat
Prakasam Chandrasekhara puram Addanki Chandrasekhara puram Chandrasekhara puramDornala Darsi Kanigiri GiddalurPeda araveedu Kanigiri Pamur KanigiriPullalacheruvu Mundlamuru Peda araveedu PamurYerragondapalem Santhamaguluru Tarlupadu Pullalacheruvu
Srikakulam Hiramandalam Bhamini Kotabommali EtcherlalamJalumuru Kaviti Nandigam KavitiKotabommali Mandasa Ponduru LaveruPonduru R.amadalavalasa Ranasthalam MelliputtiR.amadalavalasa Srikakulam Santhabommali Seethampeta
Visakhapatnam Chintapalle K.kotapadu Ananthagiri AnanthagiriGudem kothaveedhi Kotauratla Araku valley ChintapalleHukumpeta Nakkapalle Hukumpeta Gudem kothaveedhiKoyyuru Nathavaram Nakkapalle HukumpetaPaderu Payakaraopeta Paderu Paderu
Vizianagaram Balijipeta Jami Balijipeta GummalakshmipuramGurla Kothavalasa Bobbili KurupamJiyyammavalasa Lakkavarapukota Dattirajeru PachipentaPachipenta Srungavarapukota Gantyada SalurSalur Vepada Jami Vepada
West Godavari Buttayagudem Chintalapudi Denduluru ButtayagudemDwaraka tirumala Dwaraka tirumala Dwaraka tirumala ChintalapudiKoyyalagudem Lingapalem Koyyalagudem GopalapuramNallajerla Nallajerla Pedavegi KoyyalagudemPolavaram Pedavegi Ungutur Polavaram
The following Table 6.17 summarizes district-wise top five mandals with high density of livestock population, which can help in identifying the potential mandals for establishing the livestock based/multi-commodity based FPOs in the state. This kind of synthesized information provide better strategic evidence for setting up of future FPOs in the state.
6.4 Potential clusters for fisheries, prawns and shrimp Andhra Pradesh stands first in total fish and prawn/shrimp production in India since the year 2013-14 both in terms of production and value. The contribution of fisheries sector is 6.01 % in A.P state GSDP. The overall fish production in the state has more than doubled in the past one decade from 0.82 million tons in the year 2005-06 to 1.95 million tones in 2014-15. It is quite clear that marine fisheries, inland fisheries and aquaculture constitute the main components of fisheries sector. Aquaculture is practiced in both fresh and brackish waters and as highlighted previously, potential districts in the state were identified using secondary sources of India. Based on the available secondary sources of information, the highest potential mandals can also be identified. Detailed breakdown of fish production by type is presented in Table 6.18.
• Fresh water fisheries constitutes nearly 71% of the Andhra Pradesh fish production. The districts of Krishna and West Godavari together constitute nearly 81% of the total fresh water fish production in the state.
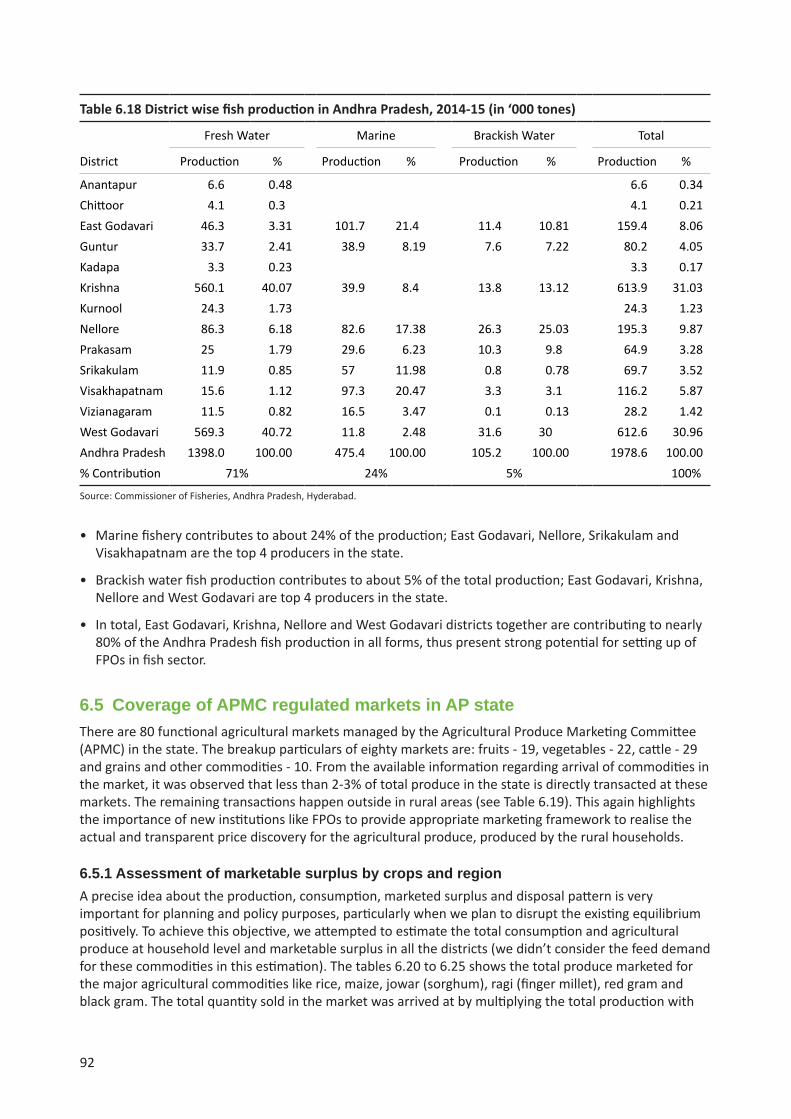
92
Table 6.18 District wise fish production in Andhra Pradesh, 2014-15 (in ‘000 tones)
District
Fresh Water Marine Brackish Water Total
Production % Production % Production % Production %
Anantapur 6.6 0.48 6.6 0.34Chittoor 4.1 0.3 4.1 0.21East Godavari 46.3 3.31 101.7 21.4 11.4 10.81 159.4 8.06Guntur 33.7 2.41 38.9 8.19 7.6 7.22 80.2 4.05Kadapa 3.3 0.23 3.3 0.17Krishna 560.1 40.07 39.9 8.4 13.8 13.12 613.9 31.03Kurnool 24.3 1.73 24.3 1.23Nellore 86.3 6.18 82.6 17.38 26.3 25.03 195.3 9.87Prakasam 25 1.79 29.6 6.23 10.3 9.8 64.9 3.28Srikakulam 11.9 0.85 57 11.98 0.8 0.78 69.7 3.52Visakhapatnam 15.6 1.12 97.3 20.47 3.3 3.1 116.2 5.87Vizianagaram 11.5 0.82 16.5 3.47 0.1 0.13 28.2 1.42West Godavari 569.3 40.72 11.8 2.48 31.6 30 612.6 30.96Andhra Pradesh 1398.0 100.00 475.4 100.00 105.2 100.00 1978.6 100.00% Contribution 71% 24% 5% 100%
Source: Commissioner of Fisheries, Andhra Pradesh, Hyderabad.
• Marine fishery contributes to about 24% of the production; East Godavari, Nellore, Srikakulam and Visakhapatnam are the top 4 producers in the state.
• Brackish water fish production contributes to about 5% of the total production; East Godavari, Krishna, Nellore and West Godavari are top 4 producers in the state.
• In total, East Godavari, Krishna, Nellore and West Godavari districts together are contributing to nearly 80% of the Andhra Pradesh fish production in all forms, thus present strong potential for setting up of FPOs in fish sector.
6.5 Coverage of APMC regulated markets in AP stateThere are 80 functional agricultural markets managed by the Agricultural Produce Marketing Committee (APMC) in the state. The breakup particulars of eighty markets are: fruits - 19, vegetables - 22, cattle - 29 and grains and other commodities - 10. From the available information regarding arrival of commodities in the market, it was observed that less than 2-3% of total produce in the state is directly transacted at these markets. The remaining transactions happen outside in rural areas (see Table 6.19). This again highlights the importance of new institutions like FPOs to provide appropriate marketing framework to realise the actual and transparent price discovery for the agricultural produce, produced by the rural households.
6.5.1 Assessment of marketable surplus by crops and region A precise idea about the production, consumption, marketed surplus and disposal pattern is very important for planning and policy purposes, particularly when we plan to disrupt the existing equilibrium positively. To achieve this objective, we attempted to estimate the total consumption and agricultural produce at household level and marketable surplus in all the districts (we didn’t consider the feed demand for these commodities in this estimation). The tables 6.20 to 6.25 shows the total produce marketed for the major agricultural commodities like rice, maize, jowar (sorghum), ragi (finger millet), red gram and black gram. The total quantity sold in the market was arrived at by multiplying the total production with

93
Table 6.19 Transaction of major agricultural produce at regulated markets in AP state in 2014 (values in ‘000 Tons)
District Mango Coconut* Rice Cotton Groundnut Bengal gram Banana Tomato Lemon
Anantapur 0.002 0.017Chittoor 0.98 0.13 1.608Kadapa 0.003 0.007 0.016 0.023 0.000East Godavari 41.33 15,424 5.33 9.898Guntur 0.022 0.042 0.001Krishna 0.33 1.00 0.021 0.008 0.039Kurnool 0.14 0.71 0.72 0.14 0.034 0.021SP.S Nellore 0.04 0.84 0.01 0.03 0.010 0.009 0.267Prakasam 0.001 0.002Srikakulam 0.01 1,575 7.08 0.03 0.032Visakhapatnam 0.001 0.011 0.016 0.28Vizianagaram 0.09 8,000 0.20 0.24 0.008 0.008 0.90 0.003West Godavari 2,797 0.20 0.30 0.88 0.005Grand total 43 27,796 15 1 1 0 12 2 0.27AP total production 2018 16,10,007 7993 2188 881 648 1888 889 191% share of regulated market to total production
2.12 1.73 0.19 0.06 0.09 0.03 0.64 0.19 0.14
Average price (Rs per kg)
9.8 5.3 14.48 40.1 37.52 31.66 13.55 8.22 12.48
Source: http://market.ap.nic.in/repyearly.jsp; *values in ‘000 number
average marketed surplus ratio. As the district wise information for marketed surplus ratio (MSR) was not available, state averages published by MoAC, India were taken as proxy for these crops. Considering the average per capita consumption (from NSSO 68th round), total consumption at household was estimated. Finally, it gave the surplus produce to be available for marketing.
From Table 6.20, it can be observed that in all the districts in the year 2013-14, the marketed surplus of rice was much higher than household need. In some cases, although the total production of rice fell short, farmers sold significant quantity of rice in the market. This reflects the concerns of deciding the number of FPOs merely on the basis of acreage or total production may not be factually correct. We should also take into account the household consumption requirement. In case of maize, which is mainly cultivated for market, difference between estimated marketable surplus and marketed surplus was insignificant (Table 6.21). With the poultry industry booming and emerging with an annual growth rate of 12-15% every year, there exists a huge scope for maize market vis-à-vis functional FPOs. Even though, maize is a major source of dietary energy in poultry nutrition, sorghum is frequently substituted for corn in poultry rations. With egg production highest in East and West Godavari and poultry meat production highest in Krishna and Chittoor districts, sorghum area like Kurnool, Anantapur and Guntur can cater the needs of these districts with their surplus production (Table 6.22). For ragi (finger millet), Vishakhapatnam and Chittoor districts show some promise, as these districts are producing good quantity of marketed surplus (Table 6.23). In case of red gram (arhar/tur), situation is grim. The total production in all these districts are not sufficient to meet their household consumption demand, but due to higher market price, farmers resort to bring the produce to the market (Table 6.24). In case of black gram, the data shows that in most of the districts production is meeting the requirement of consumption (Table 6.25). As per the consumption only, surplus districts are Visakhapatnam, Vizianagaram and Prakasam. The surplus districts can effectively identify their markets and establish functional FPOs.

94
Tabl
e 6.
20 D
istr
ict-w
ise
mar
kete
d an
d m
arke
tabl
e su
rplu
s of r
ice
in A
P St
ate
Dist
rict
Area
(‘0
00 h
a)Pr
oduc
tion
(‘000
tons
)Yi
eld
(t/h
a)Po
pula
tion
2011
cen
sus
Per c
apita
HH
Cons
umpti
on
of R
ice
in a
ll fo
rms w
ith
PDS
Rice
(k
g/m
onth
)
Per c
apita
HH
Cons
umpti
on o
f Ri
ce w
ithou
t PD
S Ri
ce
(kg/
mon
th)
Tota
l Co
nsum
ption
w
ithou
t PDS
ric
e (’0
00 to
ns/
annu
m)
Mar
kete
d Su
rplu
s Ra
tio*
(%)
Mar
ket P
oten
tial
Surp
lus P
rodu
ce a
fter
HH c
onsu
mpti
on –
with
out
PDS
Rice
(‘0
00 to
ns/a
nnum
)
Estim
ated
M
arke
ted
Surp
lus
(‘000
tons
/ann
um)
Srik
akul
am20
3.14
355.
271.
7527
0311
410
.59
7.21
233.
8787
.86
121.
6331
2.14
Vizia
naga
ram
116.
7829
0.33
2.49
2344
474
11.2
77.
6421
4.94
87.8
675
.84
255.
08Vi
sakh
apat
nam
105.
4018
4.66
1.75
4290
589
9.71
7.18
369.
6887
.86
-185
.23
162.
24Ea
st G
odav
ari
404.
6812
44.7
13.
0852
8582
49.
556.
943
7.67
87.8
680
8.75
1093
.60
Wes
t God
avar
i42
0.62
1342
.34
3.19
3995
742
10.3
97.
6336
5.85
87.8
697
5.92
1179
.38
Krish
na36
3.32
1175
.52
3.24
4517
398
9.73
7.33
397.
3587
.86
779.
8110
32.8
1Gu
ntur
328.
1710
96.0
03.
3448
8781
39.
807.
1341
8.20
87.8
667
7.88
962.
95Pr
akas
am13
8.60
532.
273.
8433
9744
811
.26
8.2
334.
3187
.86
197.
8346
7.65
Nel
lore
224.
8991
1.11
4.05
2963
557
11.0
18.
0628
6.64
87.8
662
4.18
800.
50Ka
dapa
62.7
117
8.29
2.84
2882
469
11.5
88.
3428
8.48
87.8
6-1
10.3
815
6.64
Kurn
ool
124.
8945
8.40
3.67
4053
463
8.82
5.94
288.
9387
.86
169.
4340
2.75
Anan
tapu
r40
.40
87.9
42.
1840
8114
88.
645.
5126
9.85
87.8
6-1
81.7
877
.26
Chitt
oor
49.8
616
9.02
3.39
4174
064
9.8
6.62
331.
5987
.86
-162
.56
148.
50*
Stat
e Av
erag
e; S
ourc
e: A
gric
ultu
ral S
tatis
tics a
t a G
lanc
e 20
14

95
Tabl
e 6.
21 D
istr
ict-w
ise
mar
kete
d an
d m
arke
tabl
e su
rplu
s of m
aize
in A
P St
ate
Dist
rict
Area
(‘0
00 h
a)Pr
oduc
tion
(‘000
tons
)Yi
eld
(t/h
a)
Popu
latio
n
Tota
l Con
sum
ption
@
9%
of p
rodu
ction
(‘0
00 to
ns/a
nnum
)
Mar
kete
d Su
rplu
s Rati
o*
(%)
Mar
ket P
oten
tial
Surp
lus P
rodu
ce a
fter H
H co
nsum
ption
(‘0
00 to
ns /
annu
m)
Mar
kete
d Su
rplu
s (‘0
00 to
ns /a
nnum
)
Anan
tapu
r34
.86
111.
203.
1940
8114
810
.01
90.7
110
1.19
100.
87Ch
ittoo
r3.
2117
.40
5.42
4174
064
1.57
90.7
115
.83
15.7
8Ea
st G
odav
ari
11.2
093
.77
8.37
5285
824
8.44
90.7
185
.33
85.0
6Gu
ntur
87.0
764
8.24
7.45
4887
813
58.3
490
.71
589.
9058
8.02
Kada
pa5.
4937
0.66
6.75
2882
469
3.34
90.7
133
.73
33.6
2Kr
ishna
32.8
822
7.52
6.92
4517
398
20.4
890
.71
207.
0420
6.38
Kurn
ool
51.8
831
0.13
5.98
4053
463
27.9
190
.71
282.
2228
1.32
Nel
lore
1.92
13.0
66.
8129
6355
71.
1890
.71
11.8
911
.85
Prak
asam
23.1
117
4.36
7.54
3397
448
15.6
990
.71
158.
6715
8.16
Srik
akul
am10
.74
55.3
95.
1627
0311
44.
9990
.71
50.4
150
.25
Visa
khap
atna
m7.
2417
.12
2.37
4290
589
1.54
90.7
115
.58
15.5
3Vi
ziana
gara
m28
.67
126.
554.
4123
4447
411
.39
90.7
111
5.16
114.
79W
est G
odav
ari
53.8
738
1.73
7.09
3995
742
34.3
690
.71
347.
3834
6.27
Sour
ce: A
gric
ultu
ral S
tatis
tics a
t a G
lanc
e 20
14
Tota
l mai
ze p
rodu
ction
in In
dia
coul
d be
aro
und
20.5
3 M
MT
in th
e ye
ar 2
015-
16 a
gain
st o
ur y
early
to
tal d
eman
d of
19.
36 M
MT.
Cons
umpti
on b
reak
-up
for 2
015-
16*
(figu
res i
n M
MT)
Item
Cons
umpti
onPe
rcen
t Po
ultr
y &
Catt
le fe
ed11
.33
62%
Star
tch
and
Brew
ery
4.63
25%
Hum
an C
onsu
mpti
on1.
669%
Seed
0.23
1%Sh
orta
ge a
nd W
aste
age
0.5
3%To
tal
18.3
510
0%*
Sour
ce: M
aize
Mon
thly
Res
earc
h Re
port
201
5, A
GRIW
ATCH

96
Tabl
e 6.
22 D
istr
ict-w
ise
mar
kete
d an
d m
arke
tabl
e su
rplu
s of j
owar
(sor
ghum
) in
AP S
tate
Dist
rict
Area
(‘0
00 h
a)Pr
oduc
tion
(‘000
tons
)Yi
eld
(t/h
a)
Popu
latio
n
Per c
apita
HH
cons
umpti
on o
f Jo
war
(sor
ghum
) (k
g/m
onth
)
Tota
l Co
nsum
ption
(‘0
00 to
ns/
annu
m)
Mar
kete
d Su
rplu
s Rati
o*
(%)
Mar
ket P
oten
tial
Surp
lus P
rodu
ce a
fter H
H co
nsum
ption
(‘0
00 to
ns/ a
nnum
) M
arke
ted
Surp
lus
(‘000
tons
/ ann
um)
Anan
tapu
r21
.09
12.8
90.
6140
8114
80.
3919
.10
51.8
8-6
.21
6.68
5Ch
ittoo
r0.
010.
010.
8341
7406
40.
010.
5051
.88
-0.4
90.
005
East
God
avar
i2.
091.
620.
7852
8582
40
0.00
51.8
81.
620.
841
Gunt
ur13
.76
82.3
95.
9948
8781
30
0.00
51.8
882
.39
42.7
41Ka
dapa
0.13
0.34
2.65
2882
469
0.23
7.96
51.8
8-7
.61
0.17
7Kr
ishna
0.15
0.90
5.88
4517
398
00
51.8
80.
900.
467
Kurn
ool
60.2
612
3.53
2.05
4053
463
1.6
77.8
351
.88
45.7
064
.087
Nel
lore
1.21
5.54
4.59
2963
557
00
51.8
85.
542.
873
Prak
asam
8.32
17.4
82.
1033
9744
80.
010.
4151
.88
17.0
79.
07Sr
ikak
ulam
0.06
0.17
2.75
2703
114
00
51.8
80.
170.
086
Visa
khap
atna
m0.
400.
611.
5342
9058
90
051
.88
0.61
0.31
6Vi
ziana
gara
m0.
130.
211.
6123
4447
40
051
.88
0.21
0.10
8W
est G
odav
ari
0.18
0.64
3.57
3995
742
00
51.8
80.
640.
332
* St
ate
Aver
age;
Sou
rce:
Agr
icul
tura
l Sta
tistic
s at a
Gla
nce
2014

97
Tabl
e 6.
23 D
istr
ict-w
ise
mar
kete
d an
d m
arke
tabl
e su
rplu
s of r
agi (
finge
r mill
et) i
n AP
Sta
te
Dist
rict
Area
(‘0
00 h
a)Pr
oduc
tion
(‘000
tons
) Yi
eld
(t/h
a)
Popu
latio
n
Per c
apita
Co
nsum
ption
of r
agi
(fing
er m
illet
) (k
g/m
onth
)
Tota
l Co
nsum
ption
(‘0
00 to
ns/a
nnum
)
Mar
kete
d Su
rplu
s Rati
o*
(%)
Mar
ket P
oten
tial
Surp
lus P
rodu
ce
after
HH
cons
umpti
on
(‘000
tons
/ ann
um)
Mar
kete
d Su
rplu
s (‘0
00 to
ns/
annu
m)
Anan
tapu
r2.
884.
631.
6140
8114
80.
7637
.22
67.3
9-3
2.60
4.25
5Ch
ittoo
r8.
6511
.65
1.35
4174
064
0.66
33.0
667
.39
-21.
4110
.719
East
God
avar
i0.
410.
400.
9652
8582
40.
031.
9067
.39
-1.5
10.
364
Gunt
ur0.
330.
471.
4348
8781
30.
031.
7667
.39
-1.3
00.
428
Kada
pa1.
241.
531.
2328
8246
90.
3712
.80
67.3
9-1
1.27
1.40
4Kr
ishna
00
045
1739
80.
010.
5467
.39
-0.5
40
Kurn
ool
00
040
5346
30.
010.
4967
.39
-0.4
90
Nel
lore
0.09
96.0
01.
0229
6355
70.
13.
5667
.39
-3.4
60.
088
Prak
asam
1.11
1.76
1.59
3397
448
0.02
0.82
67.3
90.
951.
619
Srik
akul
am1.
041.
321.
2627
0311
40.
3912
.65
67.3
9-1
1.33
0.83
5Vi
sakh
apat
nam
21.1
220
.34
0.96
4290
589
0.1
5.15
67.3
915
.19
18.7
12Vi
ziana
gara
m2.
212.
561.
1623
4447
40.
051.
4167
.39
1.16
2.35
7W
est G
odav
ari
00
039
9574
20
0.00
67.3
90.
000
* St
ate
Aver
age;
Sou
rce:
Agr
icul
tura
l Sta
tistic
s at a
Gla
nce
2014

98
Tabl
e 6.
24 D
istr
ict-w
ise
mar
kete
d an
d m
arke
tabl
e su
rplu
s of r
ed g
ram
in A
P St
ate
Dist
rict
Area
(‘0
00 h
a)Pr
oduc
tion
(‘000
tons
)Yi
eld
(t/h
a)
Popu
latio
n
Per c
apita
Co
nsum
ption
of
red
gram
(kg/
mon
th)
Tota
l Con
sum
ption
(‘0
00 to
ns/a
nnum
)M
arke
ted
Surp
lus
Ratio
* (%
)
Mar
ket P
oten
tial
Surp
lus P
rodu
ce a
fter H
H co
nsum
ption
(‘0
00 to
ns/a
nnum
) M
arke
ted
Surp
lus
(‘000
tons
/ ann
um)
Srik
akul
am0.
660.
550.
834
2703
114
0.4
12.9
896
.34
-12.
426
0.53
Anan
tapu
r37
.56
4.85
0.12
940
8114
80.
4120
.08
96.3
4-1
5.23
44.
67Ch
ittoo
r6.
841.
670.
244
4174
064
0.47
23.5
496
.34
-21.
873
1.61
East
God
avar
i2.
221.
850.
835
5285
824
0.31
19.6
696
.34
-17.
809
1.79
Gunt
ur9.
0514
.11
1.55
848
8781
30.
4425
.81
96.3
4-1
1.70
213
.59
Kada
pa2.
390.
360.
152
2882
469
0.6
20.7
596
.34
-20.
390.
35Kr
ishna
0.61
0.40
0.66
445
1739
80.
4323
.31
96.3
4-2
2.90
70.
39Ku
rnoo
l43
.73
18.6
70.
427
4053
463
0.59
28.7
096
.34
-10.
027
17.9
9N
ello
re0.
560.
470.
835
2963
557
0.51
18.1
496
.34
-17.
670.
45Pr
akas
am43
.13
30.9
70.
718
3397
448
0.56
22.8
396
.34
8.13
829
.84
Visa
khap
atna
m1.
970.
370.
185
4290
589
0.37
19.0
596
.34
-18.
685
0.35
Vizia
naga
ram
1.09
0.91
0.83
423
4447
40.
38.
4496
.34
-7.5
280.
88W
est G
odav
ari
0.73
0.61
0.83
539
9574
20.
4823
.02
96.3
4-2
2.40
60.
59*
Stat
e Av
erag
e; S
ourc
e: A
gric
ultu
ral S
tatis
tics a
t a G
lanc
e 20
14
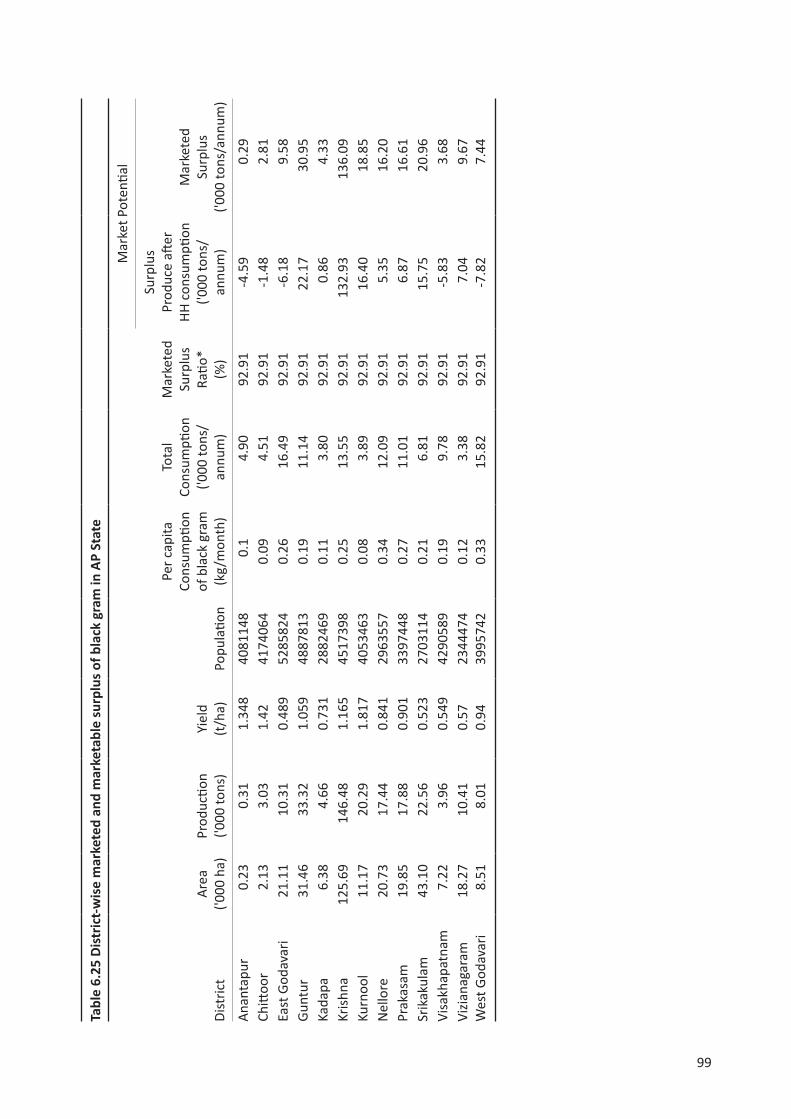
99
Tabl
e 6.
25 D
istr
ict-w
ise
mar
kete
d an
d m
arke
tabl
e su
rplu
s of b
lack
gra
m in
AP
Stat
e
Dist
rict
Area
('0
00 h
a)Pr
oduc
tion
('000
tons
)Yi
eld
(t/h
a)
Popu
latio
n
Per c
apita
Co
nsum
ption
of
bla
ck g
ram
(k
g/m
onth
)
Tota
l Co
nsum
ption
('0
00 to
ns/
annu
m)
Mar
kete
d Su
rplu
s Ra
tio*
(%)
Mar
ket P
oten
tial
Surp
lus
Prod
uce
after
HH
con
sum
ption
('0
00 to
ns/
annu
m)
Mar
kete
d Su
rplu
s ('0
00 to
ns/a
nnum
)
Anan
tapu
r0.
230.
311.
348
4081
148
0.1
4.90
92.9
1-4
.59
0.29
Chitt
oor
2.13
3.03
1.42
4174
064
0.09
4.51
92.9
1-1
.48
2.81
East
God
avar
i21
.11
10.3
10.
489
5285
824
0.26
16.4
992
.91
-6.1
89.
58Gu
ntur
31.4
633
.32
1.05
948
8781
30.
1911
.14
92.9
122
.17
30.9
5Ka
dapa
6.38
4.66
0.73
128
8246
90.
113.
8092
.91
0.86
4.33
Krish
na12
5.69
146.
481.
165
4517
398
0.25
13.5
592
.91
132.
9313
6.09
Kurn
ool
11.1
720
.29
1.81
740
5346
30.
083.
8992
.91
16.4
018
.85
Nel
lore
20.7
317
.44
0.84
129
6355
70.
3412
.09
92.9
15.
3516
.20
Prak
asam
19.8
517
.88
0.90
133
9744
80.
2711
.01
92.9
16.
8716
.61
Srik
akul
am43
.10
22.5
60.
523
2703
114
0.21
6.81
92.9
115
.75
20.9
6Vi
sakh
apat
nam
7.22
3.96
0.54
942
9058
90.
199.
7892
.91
-5.8
33.
68Vi
ziana
gara
m18
.27
10.4
10.
5723
4447
40.
123.
3892
.91
7.04
9.67
Wes
t God
avar
i8.
518.
010.
9439
9574
20.
3315
.82
92.9
1-7
.82
7.44

100
6.6 Summary and way forwardFrom the preceding discussion, it is quite clear that there should be evidence based strategic approach to identify the potential clusters for setting up commodity based FPOs. Following points emerged from the discussion:
• The crop area combination analysis suggests that there are a lot of options for convergence of multiple commodity FPOs rather than a single commodity FPO.
• In some mandals, there is huge area under single crop, but no production in any of the nearby mandals. Such mandals should be encouraged for that commodity and there is a need to develop some niche market for the product through setting up FPOs.
• Rice is the dominant crop across several mandals in the state. However, being staple commodity, care must be taken to critically examine the marketable surplus being generated in the clusters. Rice seed FPOs/societies can be promoted with strong convergence with state and central research institutes.
• It also appeared that few clusters of mandals have unique combination of different agricultural commodities. In such cases, zoning at district levels should be done and then the strength of each zone should see on granular level to identify the potentials.
• Cattle-sheep-goat combination in livestock sector can provide a financially viable mechanism among selected mandals rather than laying focus on a single commodity.
• The FPOs can also be used as a technology transferring/capacity building hubs across line departments with effective engagement of all stakeholders such as line functionaries, SAUs, KVKs and ICAR institutes.
• The data analysis clearly conclude that transaction at regulated markets is very minimal (less than 2%). So, there is a need for strengthening the existing regulated markets and their functionaries.
• Even though Andhra Pradesh tops in production of many agri and livestock products, the export share from Andhra Pradesh is very minimal when compared to other states. The Government should take appropriate policy measures to promote export share on priority basis.
• Though, Andhra Pradesh state has improved the rural infrastructure in a big way in terms of storage and warehousing facilities (details given in Appendix), however specific enabling environment suiting to the region needs to be created especially for promotion of export orient/value added FPOs.
• Spatial-temporal market linkages needs to be established between the districts and at the state level to take price advantage and enhance goods movement from surplus to deficit areas.
• E-marketing platform along with e-Mapping across the mandals for similar commodity market is required for building confidence among the producers and buyers.

101
Chapter 7. Issues and OptionsThis chapter distills out key issues from earlier chapters, based on elaborated literature review on FPOs, identifying the current area and production level, consumption and marketed/ marketable surplus across the state, analysis of functional FPOs and recent guidelines issued by the government of Andhra Pradesh. It also identifies the need for transformation in the rural economy of the Andhra Pradesh to meet the new challenges and improve the rural livelihoods; specifically for farmer producers. Although, it needs a paradigm shift in whole gamut of activities from input marketing, production, post-production handling, and value addition through economic access to inputs and services delivery system, easy access to output markets, better price discovery and efficient link to consumer markets. For this scoping study on FPOs in Andhra Pradesh state, the ICRISAT team focused on selected 15 functional and proposed FPOs. Interestingly, the number of FPOs targeted in the first quarter of the financial year (2016-17) were 27 and against it, already 34 were established by June 2016 (GoAP 2016). Based on consultations with various stakeholders, analyzing secondary data sources, and our own primary data from the field, the following issues have been identified and possible options are proposed.
7.1 Key issues and options
7.1.1 Lack of convergence of government agenciesSuch ambitious initiatives require convergence of all the sectors- public/private/NGOs. However, there is undirected zeal and exuberance among line-department, NABARD, SERP, SFAC, private groups, etc. to create and set up FPOs in each district. This may mar the long-term sustainability or whole effort of creating value for the rural population. There is high probability of duplicity of efforts in the same district and for same commodity groups. It is possible that each agency is not completely aware of the efforts by other agencies in the same geographical region. Consequent upon this, there are chances of several FPOs with small groups forming, which may find difficult to get the economy of scale or provide significant and expected return to the members.
Options: There is need to create one regulatory platform where the area of operations can be delineated on the basis of potentiality of the commodities/ services, and core competency of the agencies. The agency can bring the information in the public domain so that everyone can have full knowledge about the risks and opportunity to initiate similar process. The agency may also plan to have next wave of FPO formation, once first wave gets some success in any region. A Project Support Unit (PSU) can perform this role of regulating FPOs in AP at state level to strategize innovations, while having Project Management Units (PMUs) at state and district level through all line department staff (Operational Guidelines, GoAP section 6 and 10). Practically this can be achieved at the district level management units to involve resource organizations specific to commodity to work rather in consultation with all departments.
7.1.2 Untapped social capital/community resourcesDuring the study, it was evident that many proposed FPOs are toiling to bring rural households together to make a cohesive group. In the process, lot of apprehensions and skepticism among the participants can be a major hindrance for the sustainability of FPOs. Although, the state of Andhra Pradesh has very good natural strength of community level associations, like SHGs, JLGs, Co-operatives, MACS, Rythu Mithra groups etc., it has been observed that streamlining the existing social capital and leveraging existing networks is largely neglected.
Options: The promoting agencies should first attempt to bring these groups together to form the FPO. It would be easier to communicate with them due to their past experiences of working together as a network. Also, local NGOs can play a critical role for the social mobilization activities and need to be empaneled at both state and district levels by the PMU/ line departments/SERP (Operational Guidelines, GoAP, section 8). However, while dealing with formation of FPOs, the NGOs should be selective in re-grouping the existing community resources by identifying the local produce and mobilize only those interested in participating as producer members through a business model.

102
7.1.3 Lack of business planningFPOs is considered to be a business entity, in which energy for growth should come from within. For this, every FPO needs to have business plan. Though, several FPOs are functional and many more are in pipeline to get registered, but most of them lack robust business plan. Currently, most of the functional FPOs are merely tapping the space of traders/ middlemen. In the long run, this can have its own limitation if there is no value addition to the aggregation model. Even though SFAC suggests to submit detailed draft report after 24 months of establishment of FPO, it is proposed to conduct a detailed draft prior to establishment. This minimizes the risk of formation of non-functional FPO. A stock of resources and their interaction with humans has to be well understood and documented before registering an FPO for saving valuable time and money.
Options: The business plan entails identifying the opportunity, which can have long-term growth prospects and create value to its participants. Therefore, the resource organization should provide such expertise (with skills, abilities and knowledge) who can visualize the opportunities with the given local resources available. The business plan should include the details about products (or services) and strategy, marketing plan, operating plan, financial plan and the management team. This will guide the activities of FPOs in right direction (Operational Guidelines, GoAP, section 8). This is vital for the success of FPOs as it can form the basis for taking up activities to increase income. Also, an expert team has to be created to understand the ‘inventory of resources’ and identify the marketable options in each district for major commodities with in the district and across the state. A detailed process map for end-to-end business (production to consumption) has to be drawn with focus on man, machine, material, methods and environment and mapped with inventory of resources for effective business plan and risk mitigation strategies.
7.1.4 Limited knowledge base of resource institutionsTo a large extent, the functional FPOs are promoted by a local NGO, as resource organization, with the support of agencies like state department(s)/ SFAC/ NABARD/ on its own. In many cases, these NGOs were executing different kinds of projects in the region, which helped them in winning the confidence of the rural populace. This is right pre-requisite for setting up new institutions like FPOs. However, in its new role, many NGOs’ personnel lack the in-depth knowledge of the products to be handled or the strategies to be followed. Going forward, FPO activities require linking the farmers to consumers, while those resource institutions (RIs) erstwhile were providing different kinds of services earlier.
Options: The limitations of knowledge and skills of the resource institutions is one of the biggest roadblocks in the success of FPOs. However, this can be overcome by proper skilling of the RIs’ staffs according to their needs with respect to particular FPOs. While this is critical for implementation of FPO policy, the RIs capacities have to be built for the NGOs to perform better in hand holding FPOs.
7.1.5. What next dilemmaMajority of the newly formed FPOs are struggling with the dilemma of ‘what next’. Even though, SFAC has prepared and published 36 months plan and guidelines, this has not yet reached to the local implementation authorities (mandal level AOs/HOs). Local authorities with their best approach were able to form small group with 10-20 farmers but still looking for a way forward.
Options: An external agency may be engaged for providing necessary training and logistics and closely monitor functional growth of FPO with real time dashboard. Also, proper escalating mechanism needs to be established for addressing the shortfall/issues.
7.1.6 Traders become FPOs key functionariesLarge number of functional FPOs have been initiated by primary level trader or a commission agent. These persons are primarily a farmer also cultivating the same commodity. Though, they have better understanding of the commodity as well as market, but the whole purpose of FPOs is getting defeated, as they have more power in managing the FPOs functions without contributing equally to the volume of transactions. They also have their vested interests and therefore, become prone to financial and managerial manipulations.

103
Options: For creating member-organization design for FPO, there should be rules/norms that reinforce patronage cohesiveness. For example, compulsory contribution (products/ services) by each member on regular basis, retaining 5% of transacted volume from each member for creating capital base, etc. The operational guidelines for FPO needs to address and bring more transparency. Also, PMU at state and district level to monitor and evaluate regularly though performance indicators.
7.1.7 Few executive members handle all responsibilitiesIn several functional FPOs, the trader turned FPO executive committee member or secretary, handles the responsibilities of aggregating, registering farmers, writing books of accounts, contacting the buyers, arranging transportation, negotiating prices. These activities have to be handled in a professional manner, but this can impact the functioning of the FPO and its performance. Being new and first time handlers, the executive committee members fall short in their capacities to manage books maintenance, establishing proper system in place, hiring or operating specific location for a commodity handling.
Options: This can become a major impediment when functioning of FPO is not in a professional manner. The role played by skill development and management institutes can enhance governance of FPO. Also, capacity building of farmer members is pivotal for engaging business activities of FPOs. The role played by PMU and the support provided by PSU will be useful when implementing the policy guidelines. There should be hand holding to identify competent staff and train them for managing FPO. The FPO requirements of infrastructure facilities for value addition of commodities, skill improvement in handling of new technology, methods and process are dependent upon a formal system of financial linkage with loan providers like NABARD, local banks, etc.
7.1.8 Market identification and price discoveryThe functional FPOs are yet to find a formal or contract arrangements for regular marketing for their commodities. None of the perishable commodity-based FPOs have proper storage facilities. Owing to aggregation of a commodity, its bulk size and then managing to get a dedicated transport vans, functional FPOs are able to avoid local middle man and directly negotiate with the bulk purchaser in a nearby major city. But this has reduced only at two levels: (1) middle man at farm gate price and (2) middle man at the local market. The local farmer producers have surely felt that these FPOs have enabled them to earn 15-25% more in the price discovery. Hence, local farmer producers willingly participate. On the other hand, the bulk traders based in major cities (Hyderabad, Vijayawada, and Vishakhapatnam) will not disclose the price unless the commodity arrives at their door step. Their negotiations are always 30-40% lower than the market sale price. Many a times, these big traders also act on cartel, which traps the FPOs and are forced to sell at the big trader quoted price. While the big traders make money and they don’t share this with the FPOs. This is true, in case of fish, both marine and fresh water.
Options: Also, FPOs should be linked through modern electronic markets/ commodity exchange platforms. An enabling atmosphere to utilize digital tools of ICT integrated (weather, markets, insurance) systems. Active role should be played by APMARKFED, marketing department along with the PMU. Also, organizations like ICRISAT/ ICAR/ State Agricultural Universities (SAUs) technical back stopping might be critical in better price discovery of commodities and market identification for FPOs.
7.1.9 Missing primary level processingVery few FPOs have realized the importance of doing primary level processing of the commodity. Although, this is realized over time that the processed commodity fetches better price in the market. There is disconnect in the transfer of technology and up gradation in taking up processing at FPO level due to failure of extension activities by the line departments. Moreover, it is expected that after certain maturity and consolidation among many FPOs (as happens in most of the industry in an economy), the successful FPOs might move upward in the value chain and adopt the value addition before marketing the commodities. This would be differentiating factors for all the FPOs in the long run to produce finished products and bring closer to ultimate consumers.

104
Options: Enabling technological innovations through primary processing will give the FPOs the leading edge and the unique selling point for their produce. This requires transfer of technology from established institutions and resource organizations. Also, knowledge and infrastructure plays an important role and hence it is critical for both knowledge institutions and financial institutions to come together under PSU/ PMU with commodity based processing plans.
7.1.10 Lack of forward and backward integrationMost of the FPOs are in the infant stages of formation and have not realized the benefits from aggregation of agricultural inputs like seeds, agro-chemicals, farm machinery, etc. The same is the case of output markets for their products. There is a lacuna in identifying honest brokership through forward and backward linkages as NGOs do not have adequate awareness and logistics to undertake such an important function.
Options: Part of the issues of integration would get resolved if the FPO has systematic estimate of the opportunity and develop the business plan. It is critical to have forward and backward linkages to be established by facilitating institutes.
7.1.11 Export potentialThe State of AP tops in the production of many agricultural produce but the per se exported quantity is very minimal. There is an untapped potential for export for many of the products which can be harnessed through ‘natural farming’. But the current scenario is, majority of the farmer groups formed under natural farming/ZBNF (Zero Budget Natural Farming) group are testing the practice in a small pockets of their total cropped area. The fear of loss of yield and lack of market are the major constraints, what the farmers perceive. Again the concept of ZBNF was promoted as to meet the demand from AP urban market.
Options: An expert panel needs to be formed to understand the constraints in export marketing and translate the same to export oriented production. Later necessary awareness and promotions activities has to be planned through agencies like APEDA and MPEDA etc., for building export oriented production environment.
7.1.12 Trade deficit and surplus marketsConsumption and marketed surplus ratio analysis showed that many of the districts are either trade surplus or trade deficit. There is clear opportunity to capture the price advantage if the spatial and temporal variation was integrated. Example, the tomato price in West Godavari market yards is three times of Mulakalacheru market (in Chittoor district) yard price on same day.
Options: Especially for fresh fruits and vegetables where the prices show seasonal fluctuations, FPOs’ need to be integrated with existing market yards for timely update on prices.
7.1.13 Limited access to creditMany FPOs have experienced in their early stages lack of access to low interest credit. This has constrained them in building minimal infrastructure like ware house, cold storage or even purchasing own goods transport vehicle. The local banks are charging 13% interest for the loans. This has become a huge burden on the FPOs funds. The basic concept of FPO, among farmers, is known as a ‘substitute for middlemen’ and this wrong notion especially among small and marginal farmers and makes them fear about their financial needs (both production and personal needs). As the agriculture production marketing and farmer livelihood was built on ‘credit market’ this needs to be addressed and all misconceptions regarding FPOs needs to be cleared
Options: This is probably the most important issue which surpasses and caters to most of the needs for sustaining FPO in the long-term. While organizations that build capacities of FPOs to prepare business plans are important, it is vital that bank linkages are handled professionally without bias at district and mandal levels. Also, local groups like SHGs can be strengthened to cater the financial needs of the farmers.
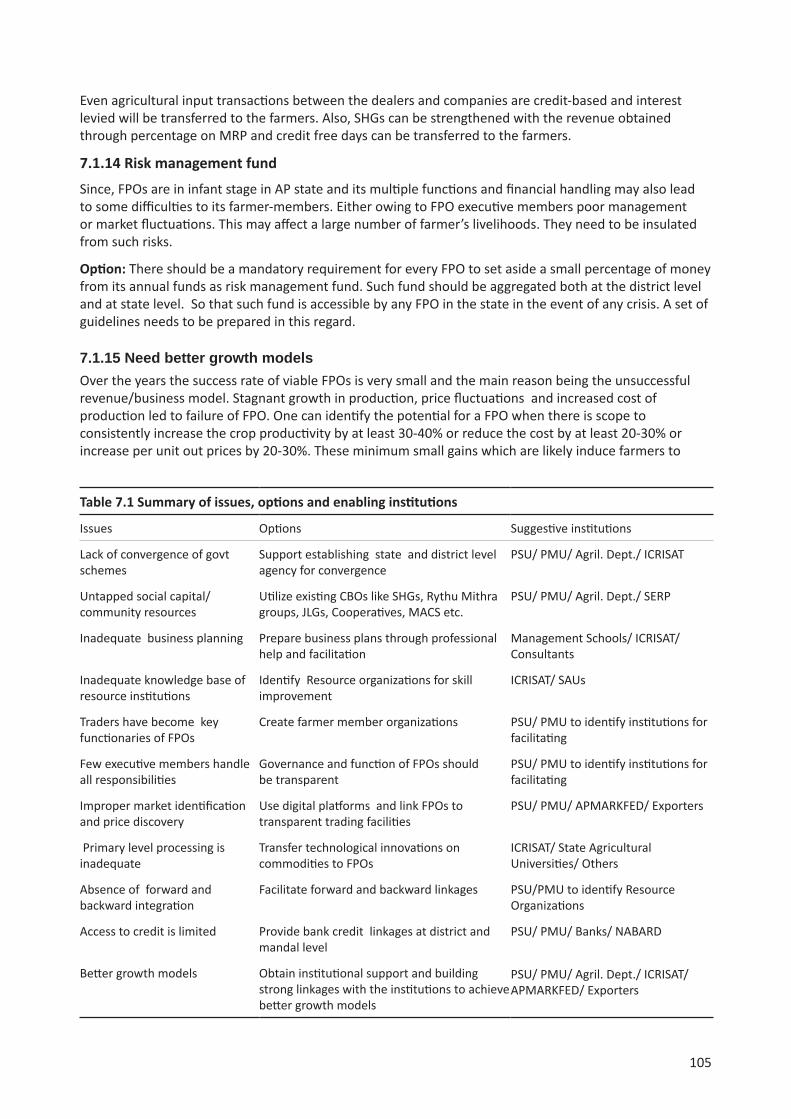
105
Table 7.1 Summary of issues, options and enabling institutions
Issues Options Suggestive institutions
Lack of convergence of govt schemes
Support establishing state and district level agency for convergence
PSU/ PMU/ Agril. Dept./ ICRISAT
Untapped social capital/ community resources
Utilize existing CBOs like SHGs, Rythu Mithra groups, JLGs, Cooperatives, MACS etc.
PSU/ PMU/ Agril. Dept./ SERP
Inadequate business planning Prepare business plans through professional help and facilitation
Management Schools/ ICRISAT/ Consultants
Inadequate knowledge base of resource institutions
Identify Resource organizations for skill improvement
ICRISAT/ SAUs
Traders have become key functionaries of FPOs
Create farmer member organizations PSU/ PMU to identify institutions for facilitating
Few executive members handle all responsibilities
Governance and function of FPOs should be transparent
PSU/ PMU to identify institutions for facilitating
Improper market identification and price discovery
Use digital platforms and link FPOs to transparent trading facilities
PSU/ PMU/ APMARKFED/ Exporters
Primary level processing is inadequate
Transfer technological innovations on commodities to FPOs
ICRISAT/ State Agricultural Universities/ Others
Absence of forward and backward integration
Facilitate forward and backward linkages PSU/PMU to identify Resource Organizations
Access to credit is limited Provide bank credit linkages at district and mandal level
PSU/ PMU/ Banks/ NABARD
Better growth models Obtain institutional support and building strong linkages with the institutions to achieve better growth models
PSU/ PMU/ Agril. Dept./ ICRISAT/ APMARKFED/ Exporters
Even agricultural input transactions between the dealers and companies are credit-based and interest levied will be transferred to the farmers. Also, SHGs can be strengthened with the revenue obtained through percentage on MRP and credit free days can be transferred to the farmers.
7.1.14 Risk management fund
Since, FPOs are in infant stage in AP state and its multiple functions and financial handling may also lead to some difficulties to its farmer-members. Either owing to FPO executive members poor management or market fluctuations. This may affect a large number of farmer’s livelihoods. They need to be insulated from such risks.
Option: There should be a mandatory requirement for every FPO to set aside a small percentage of money from its annual funds as risk management fund. Such fund should be aggregated both at the district level and at state level. So that such fund is accessible by any FPO in the state in the event of any crisis. A set of guidelines needs to be prepared in this regard.
7.1.15 Need better growth modelsOver the years the success rate of viable FPOs is very small and the main reason being the unsuccessful revenue/business model. Stagnant growth in production, price fluctuations and increased cost of production led to failure of FPO. One can identify the potential for a FPO when there is scope to consistently increase the crop productivity by at least 30-40% or reduce the cost by at least 20-30% or increase per unit out prices by 20-30%. These minimum small gains which are likely induce farmers to

106
come together even though there is a cost to collective action for each farmer. Any combination of these benefits will increase the attractiveness of small and marginal farmers to come forward. All these issues will determine the success of a FPO in a given location and its sustainability in long-run.
Option: To date most of the FPO concentrated on aggregation of products and less on institutional support. At every stage and at each process, business/revenue model requires an institutional support that too in a continuous and sustainable manner. Convergence between various public private and NGO’s and help to achieve at least a growth of 10-20% and also long run sustainability. It is expected that institutional support from research agencies, financial institutions , tie-ups with market agencies etc, can help the FPO a desired growth rate of 10-20% and only if supported with enabling environment and policy support.
ReferencesAgarwal B. 2010. Rethinking agricultural production collectivities. Economic and Political Weekly, 45(9):64-78.
Bachke ME. 2010. Are farmers’ organizations a good tool to improve small-scale farmers’ welfare? Unpublished report. Department of Economics and Resource Management, University of Life Sciences, Norway.
Bhattacharjee S. 2010. Experience of producer organizations: A case of five producer companies. Financing Agriculture, 42(7):12-21.
Birthal PS, Joshi PK, and Narayanan AV. 2011. Agricultural diversification in India: Trends, contribution to growth and small farmer participation, ICRISAT, mimeo.
Braverman A, Guasch JL, Huppi M and Pohlmeier L. 1991. Promoting rural cooperatives in developing countries: the case of sub-Saharan Africa. World Bank discussion papers (USA). Washington, D.C., World Bank.
Chamala S. 1990. Establishing a group: A participative action model. Brisbane: Australian Academic Press. P 13-38.
Chand R, Prasanna PAL and Aruna S. 2011. Farm size and productivity: Understanding the strengths of smallholders and improving their livelihoods. Economic and Political Weekly, 46(26,27): 5-11.
Commons JR. 1934. Institutional economics: Its place in political economy. New York, Macmillan.
Dev MS. 2012. Small farmers in India: challenges and opportunities, Indira Gandhi Institute of Development Research, Mumbai. Available at http://www.igidr.ac.in/pdf/publication/WP-2012-014.pdf
Donovan J and Poole ND. 2008. Linking smallholders to markets for non-traditional agricultural exports: a review of experiences in the Caribbean Basin. Inputs for strategy formulation by ‘EU-ACP All Agricultural Commodities Programme’. AAACP Paper Series. No. 2. Rome.
Government of Andhra Pradesh. 2014. A strategy paper for mission on primary sector. Agricultural transformation in Andhra Pradesh: Equitable, scientific, prosperous and climate smart. Part of Swarnandhra Vision 2029. Hyderabad. Document released by the Chief Minister on 06 October 2014 in a farmers rally held at Ananthapur.
Government of Andhra Pradesh. 2015. Achieving double digit inclusive growth - A rolling plan 2015-16. Accessed at http://apvision.ap.gov.in/pdf/Double%20Digit%20Growth%20Ready%20Reckoner%202015-16.pdf
Government of Andhra Pradesh. 2016. Rythu kosam: Andhra Pradesh farmers producers organizations’ promotion policy - 2016 Operational guidelines, Hyderabad.
Government of Andhra Pradesh. 2016. Andhra Pradesh farmers producers organisation promotion policy –2016: Operational guidelines. Vijayawada. Document released by the Chief Minister on 06th August 2016 in a farmers rally held at Ananthapur.
Government of India. 2013. Policy and process guidelines for farmer producer organizations. Department of Agriculture and Co-operation, Ministry of Agriculture.
Government of India. 2016. Economic Survey 2015-16.
Government of India. 2016. Agricultural statistics at a glance. Directorate of Economics and Statistics, Ministry of Agriculture and Cooperation.

107
Government of India. 2015. Raising agricultural productivity and making farming remunerative for farmers: An occasional paper, NITI Aayog, 16 December 2015 available at http://niti.gov.in/writereaddata/files/Raising%20Agricultural%20Productivity%20and%20Making%20Farming%20Remunerative%20for%20Farmers_0.pdf as on 03/06/2016
Guarte JM, and Barrios EB. 2006. Estimation under purposive sampling. Communications in Statistics-Simulation and Computation, 35(2):277-284.
Hellin J, Lundy M and Meijer M. 2007. Farmer organisation and market access. LEISA Magazine, 23 (1):2.
International Crops Research Institute for the Semi-Arid Tropics. 2011. Inclusive market oriented development (IMOD). ICRISAT, Patancheru, India.
International Fund for Agricultural Development. 2004. IFAD Recommendations for eliminating rural poverty and achieving food security, 36th World Farmers’ Congress, 29th May- 4th June 2004, Washington DC.
Kachule R, Poole ND and Dorward A. 2005. Farmer organizations in Malawi: the organisation study. Final report for ‘Farmer organizations for market access’, DFID crop post harvest research programme (R2875).
Korten DC. 1980. Community organisation and rural development: a learning process approach. Public Administration Review 40(5): 480-511.
Marsland N, Wilson I, Abeyasekera S, and Kleih U. 2001. Combining quantitative and qualitative survey methods, socio economic methodologies for Natural Resource Research. Best practice guidelines, Chatham, UK: Natural Resource Institute.
Ministry of Agriculture. 2013. Policy and process guidelines for farmer producer organizations. Department of Agriculture and Cooperation, Government of India.
Mondal A. 2010. Farmers’ producer company (FPC) concept, practices and learning: A case from action for social advancement. Financing Agriculture, 42(7):29-33.
National Bank for Agriculture and Rural Development. 2015. NABARD Scheme for FPO formation. New Delhi.
Nalini B, Turaga RMR and Bhamoriya V. 2015. Farmer producer organizations as farmer collectives: A case study from India. Unpublished report, Indian Institute of Management, Ahmedabad. Visited on 15 June 2016 at http://www.iimahd.ernet.in/assets/snippets/workingpaperpdf/10539809132015-01-05.pdf
National Commodity and Derivatives Exchange. 2016. Connecting farmers to markets, NCDEX- FPO Update, November.
National Commission for Enterprises in the Unorganized Sector. 2008. A special programme for marginal and small farmers. Accessed at http://nceuis.nic.in/Special_Programme_for_Marginal_and_Small_Farmers.pdf
National Dairy Development Board. 2014. Annual report 2013-2014. Visited on 26 November 2016 at http://www.nddb.org/sites/ default/files/pdfs/nddb-annual-report-2013-2014.pdf
Poole N and Frece A. 2010. A review of existing organizational forms of smallholder farmers’ associations and their contractual relationships with other market participants in the East and Southern African ACP region. AAACP Paper Series No. 11, Food and Agricultural Organization.
Prowse M. 2008. Making contract farming work with cooperatives: Producer organizations and poverty reduction. Capacity.org.
Ritchie J, Spencer L, and O’Connor W. 2003. Carrying out qualitative analysis. Qualitative research practice: A guide for social science students and researchers: 219-262.
Schultz TW and Lewis A. 1979. The Economics of Being Poor. The Prize Lecture to the memory of Alfred Nobel, December 8. Accessed on 12 June 2016 from http://www.nobelprize.org/nobel_prizes/economic-sciences/laureates/1979/schultz-lecture.html#not
Small Farmers Agribusiness Consortium. 2014. Krishi sutra 2: Success stories of farmer producer organisations. Small farmers agribusiness consortium, New Delhi. Accessed at http://sfacindia.com/PDFs/Krishi-Sutra(Version2).pdf
Shah T. 2016. Farmer producer companies fermenting new wine for new bottles. Economic and Political Weekly, 51(8):15-20.
108
Sharma AK. 2015. Transformation in Indian agriculture, allied sectors, and rural India: Is there less krishi in bharat?, NCAER, New Delhi.
Shepherd A. 2007. Approaches to linking producers to markets: A review of experiences to date, Accessed on 12 June 2016 from ftp://ftp.fao.org/docrep/fao/010/a1123e/a1123e00.pdf
Singh S. 2015. Promotion of milk producer companies: Experience of NDS, presentation in workshop on producer companies organized by National Dairy Development Board, Anand, Gujarat, 8 October
Singh S and Singh T. 2013. Producer companies in India: A study of organization and performance, Publication No. 246, Centre for Management in Agriculture, Indian Institute Management, Ahmedabad.
Swaminathan MS and Rengalakshmi R. 2016. Impact of extreme weather events in Indian agriculture: Enhancing the coping capacity of farm families. Mausam, 67(1).
Trebbin A. 2014. Linking small farmers to modern retail through producer organizations – Experiences with producer companies in India. Food Policy, 45:35-44.
Trebbin A and Hassler M. 2012. Farmers’ producer companies in India: a new concept for collective action?. Environment and Planning A,44(2):411-427.
UNDP. 2014. Financing for FPOs, Policy paper. UNDP and Access Development Services.
Welsh R. 1997. Vertical coordination, producer response, and the locus of control over agricultural production decisions. Rural Sociology, 62(4):491-507.

109
Appendixes
Appendix 2.1 Process involved in establishing FPOsThe entire process of formation for an FPO may take two to three years, and comprises the pre-formation stage, the FPO formation stage and the implementation and phase-out stage. A brief overview of each stage, adapted from the Ministry of Agriculture Policy and Process Guidelines for FPOs, is detailed below:
1. Pre-Formation Stage: The Pre-Formation Stage itself comprises three distinct sub-stages and takes a total of 18 months to complete.
a. Identification: After the project cluster is identified, the Resource Institution analyses how feasible an FPO would be in that area. This includes perusing databases of farmers in the region and conducting a hypothetical break-even analysis for the FPO that is to be formed.
b. Organization of Farmer Interest Groups (FIGs): Farmers in the region are organized into FIGs, each consisting of 15-20 farmers. The Resource Institution educates these groups in scientific farming techniques and practices.
c. Collection of share money: Resource Institutions help draft a business plan for the FPO and share it with members of FIGs. They also compile a database of participants in the FPO. Finally, they collect money for the purchase of shares of the FPO from the farmers.
2. FPO Formation Stage: This stage comprises two distinct sub-stages as well.
a. FPO Formation: It is at this stage that members of FIGs decide whether they want to be part of the FPO or not. Other procedures that must be completed during this stage include obtaining a Permanent Account Number (PAN) for the FPO, electing the Board of Directors (BoD) and further training for the future members.
b. FPO Incorporation: The FPO is formally established during this stage; official outlets are opened, farmers are awarded share certificates, and the General Body Meeting is conducted along with due diligence by a registered Chartered Accountant.
3. Implementation of Business Plans and Phase-out:
a. Implementation of Business Plan: The Ministry of Agriculture calls for 25% of the activities detailed in the Business Plan (drafted previously) to be implemented during this stage. Regulatory approval for the activities performed by the FPO must also be sought and received during this stage.
b. Phase-out: After an agreement of long term cooperation is executed between the FPO and the Resource Institution, the latter finally exits the project, provided that auditors certify that the finances of the former are satisfactory.

110
Appendix 2.2 Budget estimate for setting up 1000 FPOs in AP state
S. No Sectors FPOs Farmers Commodities
Budget Requirement for formation and nurturing for 3 years @ ₹3.53 million / FPO as per national policy
1 Agriculture 314 3,73,039 Maize, Millets, Oil Seeds and Pulses
₹ 1107.17million
2 Horticulture 345 2,74,153 Fruits, Vegetables, Spices and Flowers
₹ 1216.47 million
3 Animal Husbandry
238 2,45,000 Milk, Meat, Egg, Backyard Poultry and Fodder
₹ 839.19 million
4 Fisheries 103 1,07,808 Fish, Prawn, Crab and Shrimp
₹ 363.18 million
Total 1,000 10,00,000 ₹ 3526 million
Source: GoAP (2016)
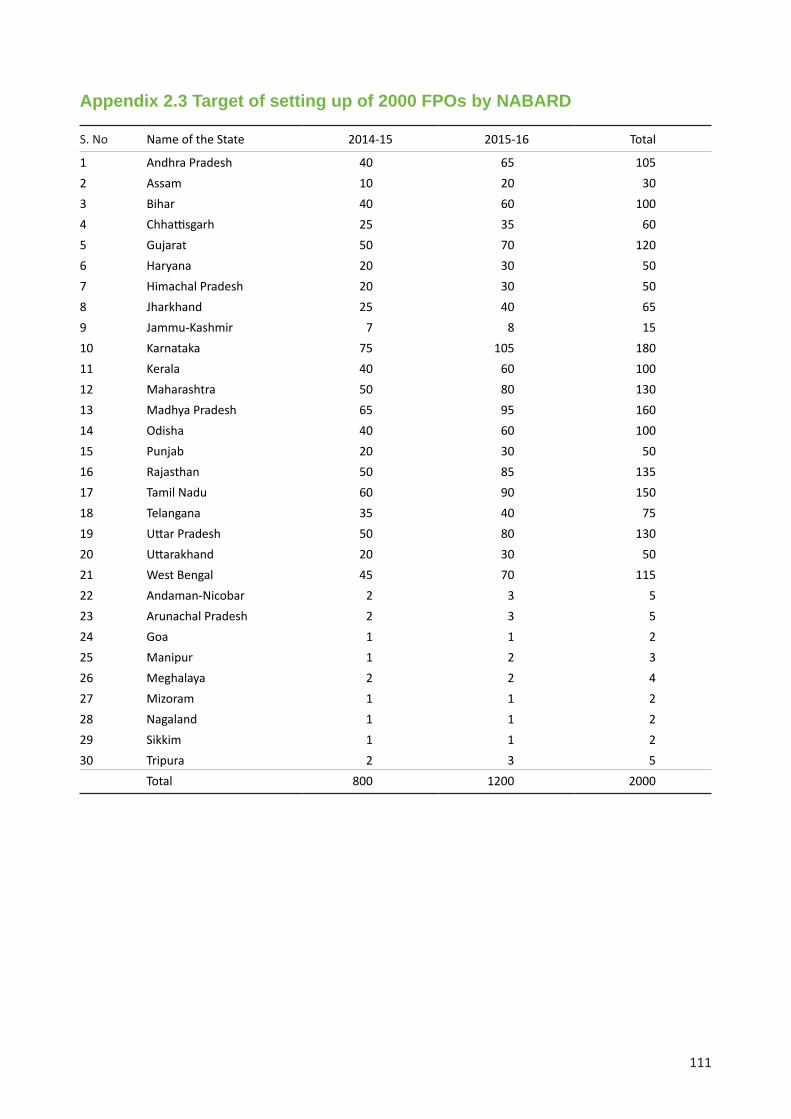
111
Appendix 2.3 Target of setting up of 2000 FPOs by NABARD
S. No Name of the State 2014-15 2015-16 Total
1 Andhra Pradesh 40 65 1052 Assam 10 20 303 Bihar 40 60 1004 Chhattisgarh 25 35 605 Gujarat 50 70 1206 Haryana 20 30 507 Himachal Pradesh 20 30 508 Jharkhand 25 40 659 Jammu-Kashmir 7 8 1510 Karnataka 75 105 18011 Kerala 40 60 10012 Maharashtra 50 80 13013 Madhya Pradesh 65 95 16014 Odisha 40 60 10015 Punjab 20 30 5016 Rajasthan 50 85 13517 Tamil Nadu 60 90 15018 Telangana 35 40 7519 Uttar Pradesh 50 80 13020 Uttarakhand 20 30 5021 West Bengal 45 70 11522 Andaman-Nicobar 2 3 523 Arunachal Pradesh 2 3 524 Goa 1 1 225 Manipur 1 2 326 Meghalaya 2 2 427 Mizoram 1 1 228 Nagaland 1 1 229 Sikkim 1 1 230 Tripura 2 3 5
Total 800 1200 2000
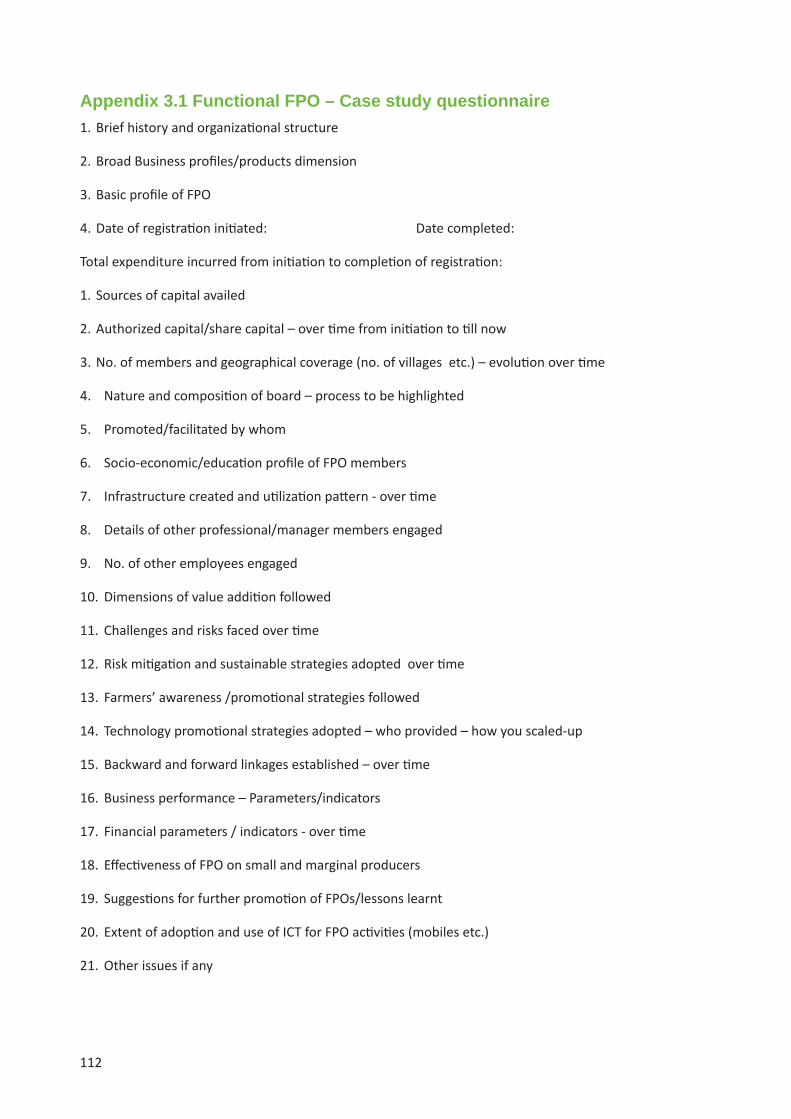
112
Appendix 3.1 Functional FPO – Case study questionnaire 1. Brief history and organizational structure
2. Broad Business profiles/products dimension
3. Basic profile of FPO
4. Date of registration initiated: Date completed:
Total expenditure incurred from initiation to completion of registration:
1. Sources of capital availed
2. Authorized capital/share capital – over time from initiation to till now
3. No. of members and geographical coverage (no. of villages etc.) – evolution over time
4. Nature and composition of board – process to be highlighted
5. Promoted/facilitated by whom
6. Socio-economic/education profile of FPO members
7. Infrastructure created and utilization pattern - over time
8. Details of other professional/manager members engaged
9. No. of other employees engaged
10. Dimensions of value addition followed
11. Challenges and risks faced over time
12. Risk mitigation and sustainable strategies adopted over time
13. Farmers’ awareness /promotional strategies followed
14. Technology promotional strategies adopted – who provided – how you scaled-up
15. Backward and forward linkages established – over time
16. Business performance – Parameters/indicators
17. Financial parameters / indicators - over time
18. Effectiveness of FPO on small and marginal producers
19. Suggestions for further promotion of FPOs/lessons learnt
20. Extent of adoption and use of ICT for FPO activities (mobiles etc.)
21. Other issues if any
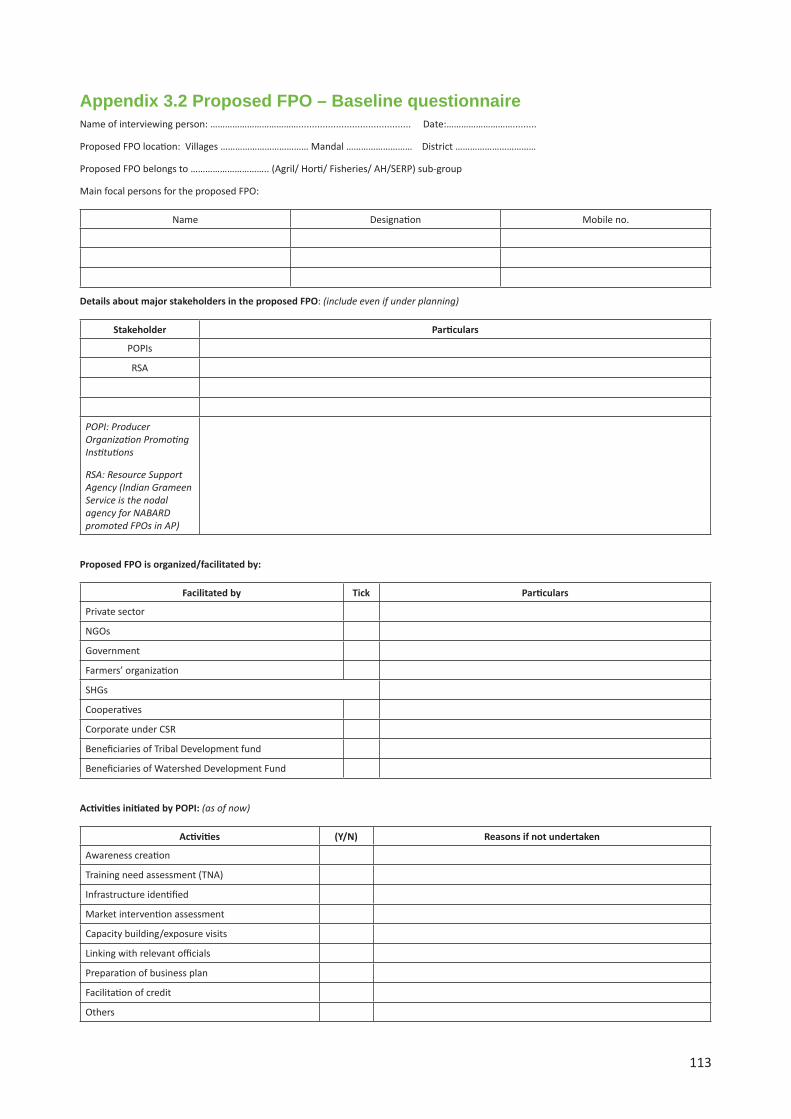
113
Appendix 3.2 Proposed FPO – Baseline questionnaireName of interviewing person: ……………………………….......................................... Date:……………………….........
Proposed FPO location: Villages ……………………………… Mandal ……………………… District ……………………………
Proposed FPO belongs to ………………………….. (Agril/ Horti/ Fisheries/ AH/SERP) sub-group
Main focal persons for the proposed FPO:
Name Designation Mobile no.
Details about major stakeholders in the proposed FPO: (include even if under planning)
Stakeholder Particulars
POPIs
RSA
POPI: Producer Organization Promoting Institutions
RSA: Resource Support Agency (Indian Grameen Service is the nodal agency for NABARD promoted FPOs in AP)
Proposed FPO is organized/facilitated by:
Facilitated by Tick Particulars
Private sector
NGOs
Government
Farmers’ organization
SHGs
Cooperatives
Corporate under CSR
Beneficiaries of Tribal Development fund
Beneficiaries of Watershed Development Fund
Activities initiated by POPI: (as of now)
Activities (Y/N) Reasons if not undertaken
Awareness creation
Training need assessment (TNA)
Infrastructure identified
Market intervention assessment
Capacity building/exposure visits
Linking with relevant officials
Preparation of business plan
Facilitation of credit
Others
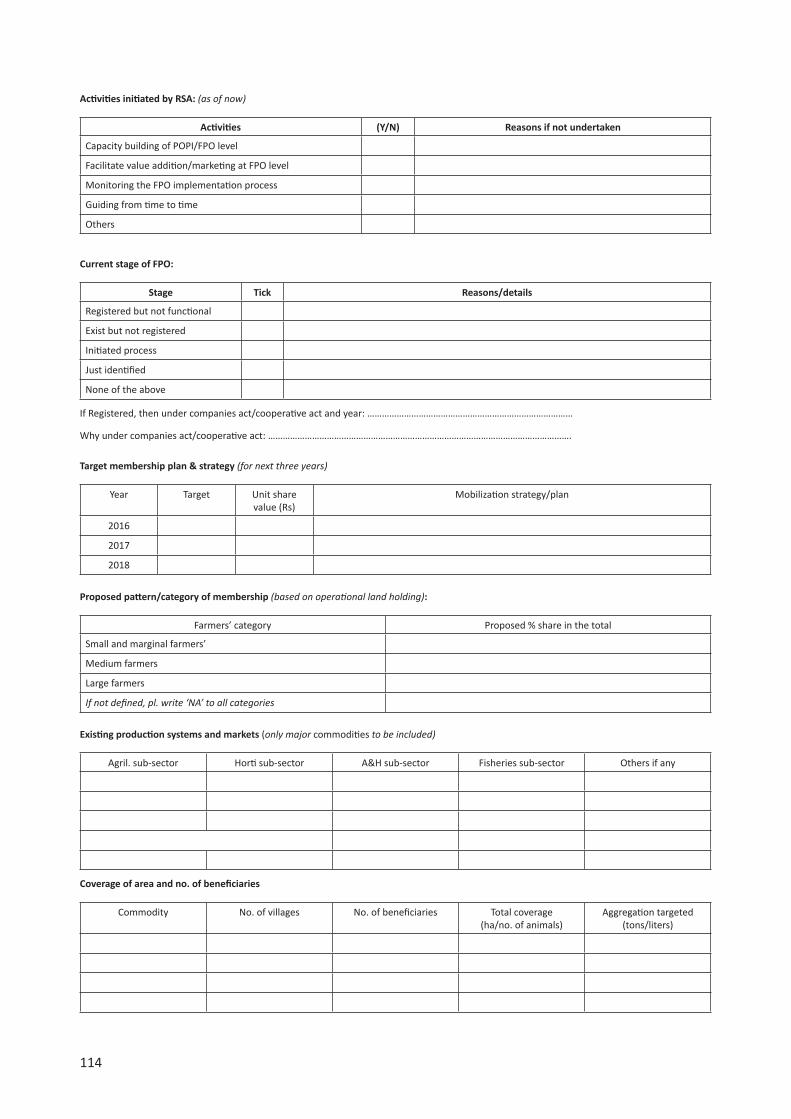
114
Activities initiated by RSA: (as of now)
Activities (Y/N) Reasons if not undertaken
Capacity building of POPI/FPO level
Facilitate value addition/marketing at FPO level
Monitoring the FPO implementation process
Guiding from time to time
Others
Current stage of FPO:
Stage Tick Reasons/details
Registered but not functional
Exist but not registered
Initiated process
Just identified
None of the above
If Registered, then under companies act/cooperative act and year: …………………………………………………………………………
Why under companies act/cooperative act: …………………………………………………………………………………………………………….
Target membership plan & strategy (for next three years)
Year Target Unit share value (Rs)
Mobilization strategy/plan
2016
2017
2018
Proposed pattern/category of membership (based on operational land holding):
Farmers’ category Proposed % share in the total
Small and marginal farmers’
Medium farmers
Large farmers
If not defined, pl. write ‘NA’ to all categories
Existing production systems and markets (only major commodities to be included)
Agril. sub-sector Horti sub-sector A&H sub-sector Fisheries sub-sector Others if any
Coverage of area and no. of beneficiaries
Commodity No. of villages No. of beneficiaries Total coverage (ha/no. of animals)
Aggregation targeted (tons/liters)

115
Major regulated/un-regulated markets exists
Major regulated markets Major un-regulated markets
1. 1.
2. 2.
3. 3.
Sources/mobilization plan of capital
Source Aware/NAIf availed, amount
(Rs lakhs) Reasons if not availed
Initial seed capital
Share capital
Working capital
Equity grant
Credit Guarantee Fund
Awareness creation fund
Capacity building fund
Technical support fund
Others if any
Available infrastructure
Facility Y/N Details (approximate units)
Office space
Grading facilities
Processing facilities
Drying plat forms
Storage structures
Cold storage facilities /cooling chambers
Vehicles /transportation
Supporting staff
Others
Productivity enhancing/technology promotional activities/strategies
Type of technology Promotional strategy Stakeholders involved
Backward and forward linkages planned (describe crisply)
Inputs mobilization plan (like seeds, fertilizers, credit, insurance, extension service etc.)
Output aggregation plan (Bulking of small marketable surplus, grading, processing,
storage and linking to buyers etc.)

116
Commodity-wise value addition opportunities/plan
Commodity Opportunities Initiatives
Farmers’ awareness/promotional strategies/trainings & capacity building
Item No. Item No.
No. of awareness programs organized so far
No. of training/capacity building activities organized so far
Awareness programs planning to organize during rest of 2016
Capacity building activities planning to organize during rest of 2016
Anticipated cost & revenues (at least for two years in Rs lakhs)
Item/sources
2016 2017
Costs Revenues Costs Revenues
Problems/constraints faced
Problems/constraints faced Overcome mechanism
Anticipated risks and mitigation/sustainable strategies
Anticipated risks Mitigation/sustainable strategies
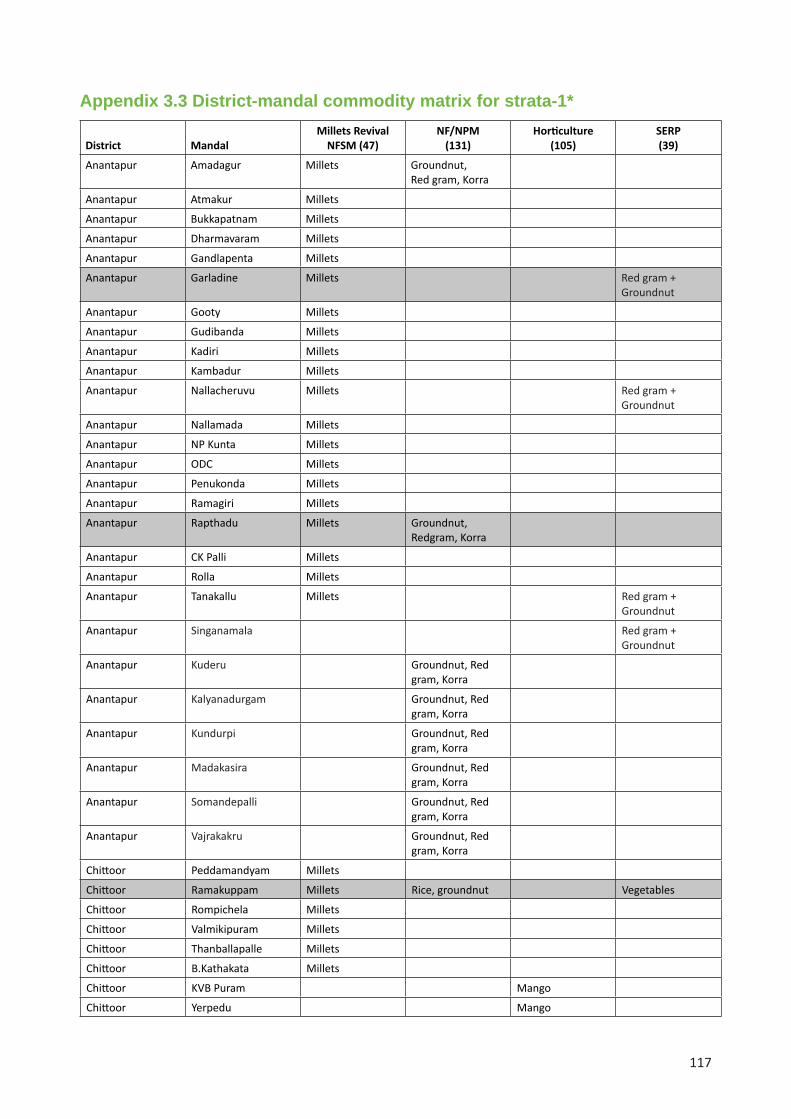
117
Appendix 3.3 District-mandal commodity matrix for strata-1*
District MandalMillets Revival
NFSM (47)NF/NPM
(131)Horticulture
(105)SERP (39)
Anantapur Amadagur Millets Groundnut, Red gram, Korra
Anantapur Atmakur Millets
Anantapur Bukkapatnam Millets
Anantapur Dharmavaram Millets
Anantapur Gandlapenta Millets
Anantapur Garladine Millets Red gram + Groundnut
Anantapur Gooty Millets
Anantapur Gudibanda Millets
Anantapur Kadiri Millets
Anantapur Kambadur Millets
Anantapur Nallacheruvu Millets Red gram + Groundnut
Anantapur Nallamada Millets
Anantapur NP Kunta Millets
Anantapur ODC Millets
Anantapur Penukonda Millets
Anantapur Ramagiri Millets
Anantapur Rapthadu Millets Groundnut, Redgram, Korra
Anantapur CK Palli Millets
Anantapur Rolla Millets
Anantapur Tanakallu Millets Red gram + Groundnut
Anantapur Singanamala Red gram + Groundnut
Anantapur Kuderu Groundnut, Red gram, Korra
Anantapur Kalyanadurgam Groundnut, Red gram, Korra
Anantapur Kundurpi Groundnut, Red gram, Korra
Anantapur Madakasira Groundnut, Red gram, Korra
Anantapur Somandepalli Groundnut, Red gram, Korra
Anantapur Vajrakakru Groundnut, Red gram, Korra
Chittoor Peddamandyam Millets
Chittoor Ramakuppam Millets Rice, groundnut Vegetables
Chittoor Rompichela Millets
Chittoor Valmikipuram Millets
Chittoor Thanballapalle Millets
Chittoor B.Kathakata Millets
Chittoor KVB Puram Mango
Chittoor Yerpedu Mango

118
District MandalMillets Revival
NFSM (47)NF/NPM
(131)Horticulture
(105)SERP (39)
Chittoor Srikalahasthi Mango
Chittoor Gudipala Rice, groundnut Vegetables Vegetables
Chittoor Palamaner Vegetables
Chittoor YV Palem Mango
Chittoor Vayalpadu Rice, groundnut Vegetables
Chittoor Punganu Vegetables
Chittoor Kuppam Vegetables
Chittoor Santhipuram
Chittoor Madanapalli Rice, groundnut
Chittoor Nagari Rice, groundnut
Chittoor Baireddipalli Rice, groundnut
Chittoor Narayanavanam Rice, groundnut
Chittoor RC Puram Rice, groundnut
Chittoor Nagalapuram Rice, groundnut
Chittoor Thotambedu Rice, groundnut
Chittoor Vayalapadu Rice, groundnut
Kurnool Banaganapalli Millets
Kurnool Bethamcherla Millets Red gram
Kurnool Dhone Millets Rice, cotton, maize, bengal gram, Groundnut, red gram, black gram
Kurnool Gonegandla Millets
Kurnool Adoni Millets
Kurnool Pathikonda Millets
Kurnool Punnakkal Vegetables
Kurnool Peapalli/Peapully Rice, Cotton, Maize, Bengal gram, groundnut, Red gram, Black gram
Onion, Chili
Kurnool Aspari Onion
Kurnool Veldurthi Red gram
Kurnool Athmakur Red gram
Kurnool Kothapalle Red gram
Kurnool Guduru Rice, cotton, maize, bengal gram, groundnut, red gram, black gram
Kurnool Kalluru Rice, cotton, maize, bengal gram, groundnut, red gram, black gram
Kurnool Midthuru Rice, cotton, maize, bengal gram, groundnut, red gram, black gram
Kurnool Panyam Rice, cotton, maize, bengal gram, groundnut, red gram, black gram

119
District MandalMillets Revival
NFSM (47)NF/NPM
(131)Horticulture
(105)SERP (39)
Visakhapatnam Paderu Millets Red kidney beans, millets, maize
Medicinal Plants
Visakhapatnam Ananthagiri Millets
Visakhapatnam Dumriguda Millets Mango Vegetables
Visakhapatnam Hukumpeta Millets Rajma (Red Kidney Beans), millets, maize
Medicinal Plants
Visakhapatnam Pedabayalu Millets
Visakhapatnam Araku Millets Vegetables
Visakhapatnam Koyyur Millets
Visakhapatnam Chinthapalli Millets Rajma (Red Kidney Beans), Millets, maize
Turmeric + coffee
Visakhapatnam G. Madugula Medicinal Plants, Turmeric
Turmeric + coffee
Visakhapatnam S. Rayavaram Coconut
Visakhapatnam Golugonda Cashew
Visakhapatnam Narsipatnam Cashew
Visakhapatnam Anakapalle Rajma (Red Kidney Beans), Millets, Maize
Visakhapatnam Padmanabham Rajma (Red Kidney Beans), Millets, Maize
Visakhapatnam Cheedikada Rajma (Red Kidney Beans), Millets, Maize
Visakhapatnam Chodavaram Rajma (Red Kidney Beans), Millets, Maize
Visakhapatnam Madgula Rajma (Red Kidney Beans), Millets, Maize
Visakhapatnam Makavarapalem Rajma (Red Kidney Beans), Millets, Maize
Visakhapatnam Yalamanchili Rajma (Red Kidney Beans), Millets, Maize
Vizianagaram Gumma Laxmipuram Millets Mango, Sapota Cashew
Vizianagaram Garugubilli Millets, Rice, Maize Banana
Vizianagaram Pachipenta Mango
Vizianagaram Badangi Vegetables
Vizianagaram Pusapatirega Millets, Rice, Maize Coconut
Vizianagaram Nellimarla Vegetables
Vizianagaram Saluru Banana Cashew
Vizianagaram Kurupam Millets, Rice, Maize Vegetables Cashew
Vizianagaram Ramabadrapuram Vegetables Vegetables
Vizianagaram Badangi Mango

120
District MandalMillets Revival
NFSM (47)NF/NPM
(131)Horticulture
(105)SERP (39)
Vizianagaram Komarada Vegetables
Vizianagaram Vepada Millets, Rice, Maize Vegetables
Vizianagaram Kurupam Millets
Vizianagaram Merakamudidam Cashew
Vizianagaram Parvathipuram Millets, Rice, Maize Cashew
Vizianagaram Makkuva Cashew
Vizianagaram Bobilli Millets, Rice, Maize
Vizianagaram Bondapalli Millets, Rice, Maize
Vizianagaram Mentada Millets, Rice, Maize
Vizianagaram Denkada Millets, Rice, Maize
Srikakulam Seethampeta Millets Rice, Sugarcane, Maize, Green gram, Black gram, ragi (finger millet)
Amla, Coconut, Tamarind, Cashew, Coconut
Cashew
Srikakulam Veeragattam Millets Rice, Sugarcane, Maize, Green gram, Black gram, ragi (finger millet)
Amla, Coconut, Tamarind, Cashew
Srikakulam Kotthur Millets Rice, Sugarcane, Maize, Green gram, Black gram, ragi (finger millet)
Cashew
Srikakulam Bhamini Cashew
Srikakulam Meliaputti Cashew
Srikakulam Mandasa Cashew
Srikakulam Hiramandalam Cashew
Srikakulam Pathapatnam Cashew
Srikakulam Vajrapakothuru Cashew
Srikakulam Sarvakota Rice, Sugarcane, Maize, Green gram, Blackgram, ragi (finger millet)
Srikakulam Ponduru Rice, Sugarcane, Maize, Green gram, Black gram, ragi (finger millet)
Srikakulam Ranasthalam Rice, Sugarcane, Maize, Green gram, Black gram, ragi (finger millet)
Srikakulam Etcherla Rice, Sugarcane, Maize, Green gram, Black gram, ragi (finger millet)
Srikakulam Gara Rice, Sugarcane, Maize, Green gram, Black gram, ragi (finger millet)
Srikakulam Tekkali Rice, Sugarcane, Maize, Green gram, Black gram, ragi (finger millet)

121
District MandalMillets Revival
NFSM (47)NF/NPM
(131)Horticulture
(105)SERP (39)
East Godavari Maredumilli Millets Cashew
East Godavari Devipatnam Millets Cashew
East Godavari Eleswaram Rice, pulse, Maize, Sesame
Cashew, Mango, Coconut, Banana
East Godavari Rowthulapudi Rice + Vegetables
East Godavari Kotananduru Rice + Vegetables
East Godavari Y Ramavaram Rice, Pulse, Maize, Sesame
Cashew
East Godavari Gangavaram Rice, Pulse, Maize, Sesame
Cashew
East Godavari Addateegala Cashew
East Godavari Rampachodavaram Rice, Pulse, Maize, Sesame
Cashew
East Godavari Rajavommangi Cashew
East Godavari Prathipadu Rice, Pulse, Maize, Sesame
East Godavari Gokavaram Rice, Pulse, Maize, Sesame
East Godavari Korulonda Rice, Pulse, Maize, Sesame
East Godavari Shankavaram Rice, Pulse, Maize, Sesame
East Godavari Thotangi Rice, Pulse, Maize, Sesame
East Godavari Tuni Rice, Pulse, Maize, Sesame
Kadapa Vempalli Rice, Pulse, groundnut
Banana
Kadapa Mylavaram Bengal gram + Chillies
Kadapa Jammalamadugu Bengal gram + Chillies
Kadapa Galiveedu Red gram + Groundnut
Kadapa Chakrayapet Red gram + Groundnut
Kadapa Pendamilli Rice, Pulse, Groundnut
Kadapa Rly Koduru Rice, Pulse, Groundnut
Kadapa L.R.Palli Rice, Pulse, Groundnut
Kadapa Mydukur Rice, Pulse, Groundnut
Kadapa Kalasapadu Rice, Pulse, Groundnut
Kadapa Ksinayana s.a.k.n Rice, Pulse, Groundnut
Kadapa Vontimitta Rice, Pulse, Groundnut
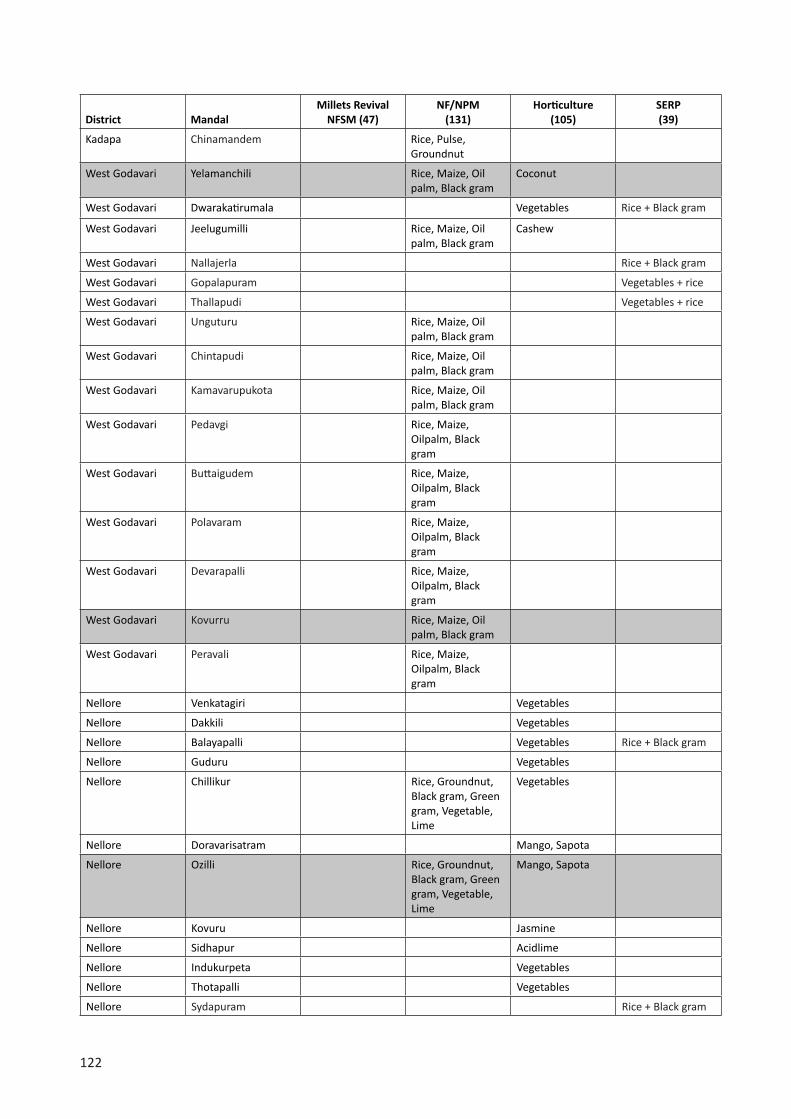
122
District MandalMillets Revival
NFSM (47)NF/NPM
(131)Horticulture
(105)SERP (39)
Kadapa Chinamandem Rice, Pulse, Groundnut
West Godavari Yelamanchili Rice, Maize, Oil palm, Black gram
Coconut
West Godavari Dwarakatirumala Vegetables Rice + Black gram
West Godavari Jeelugumilli Rice, Maize, Oil palm, Black gram
Cashew
West Godavari Nallajerla Rice + Black gram
West Godavari Gopalapuram Vegetables + rice
West Godavari Thallapudi Vegetables + rice
West Godavari Unguturu Rice, Maize, Oil palm, Black gram
West Godavari Chintapudi Rice, Maize, Oil palm, Black gram
West Godavari Kamavarupukota Rice, Maize, Oil palm, Black gram
West Godavari Pedavgi Rice, Maize, Oilpalm, Black gram
West Godavari Buttaigudem Rice, Maize, Oilpalm, Black gram
West Godavari Polavaram Rice, Maize, Oilpalm, Black gram
West Godavari Devarapalli Rice, Maize, Oilpalm, Black gram
West Godavari Kovurru Rice, Maize, Oil palm, Black gram
West Godavari Peravali Rice, Maize, Oilpalm, Black gram
Nellore Venkatagiri Vegetables
Nellore Dakkili Vegetables
Nellore Balayapalli Vegetables Rice + Black gram
Nellore Guduru Vegetables
Nellore Chillikur Rice, Groundnut, Black gram, Green gram, Vegetable, Lime
Vegetables
Nellore Doravarisatram Mango, Sapota
Nellore Ozilli Rice, Groundnut, Black gram, Green gram, Vegetable, Lime
Mango, Sapota
Nellore Kovuru Jasmine
Nellore Sidhapur Acidlime
Nellore Indukurpeta Vegetables
Nellore Thotapalli Vegetables
Nellore Sydapuram Rice + Black gram

123
District MandalMillets Revival
NFSM (47)NF/NPM
(131)Horticulture
(105)SERP (39)
Nellore Kaluvoya Rice + Black gram
Nellore Podalakuru Rice + Black gram
Nellore Dagadarti Rice, Groundnut, Blackgram, Greengram, Vegetable, Lime
Nellore Kavali Rice, Groundnut, Blackgram, Greengram, Vegetable, Lime
Nellore Naidupeta Rice, Groundnut, Blackgram, Greengram, Vegetable, Lime
Nellore Rapur Rice, Groundnut, Black gram, Green gram, Vegetable, Lime
Nellore D.V.Satram Rice, Groundnut, Black gram, Green gram, Vegetable, Lime
Nellore Dakkili Rice, Groundnut, Black gram, Green gram, Vegetable, Lime
Prakasam Pullacheruvu Mango, Sapota, Guava
Prakasam Dornala Bengal gram, Rice, Chillies, Vegetables
Mango, Sapota, Guava
Prakasam Yerragondapalem Bengal gram, Rice, Chillies, Vegetables
Mango, Sapota, Guava
Prakasam Tarlupadu Chilli
Prakasam Konakana Chilli
Prakasam Mittala Chilli
Prakasam Donakonda Chilli
Prakasam Cumbum Chilli
Prakasam Kanigiri Red gram + Black gram
Prakasam Hanumanthunipadu Red gram + Black gram
Prakasam Addanki Rice + Red gram
Prakasam Maddipadu Rice + Red gram
Prakasam Korisapadu Bengal gram, Rice, Chillies, Vegetables
Prakasam Mundlamur Bengal gram, Rice, Chillies, Vegetables
Prakasam Nagulapapadu Bengal gram, Rice, Chillies, Vegetables
Prakasam Ballikuruva Bengal gram, Rice, Chillies, Vegetables

124
District MandalMillets Revival
NFSM (47)NF/NPM
(131)Horticulture
(105)SERP (39)
Prakasam Martur Bengal gram, Rice, Chillies, Vegetables
Prakasam Yaddanapudi Bengal gram, Rice, Chillies, Vegetables
Prakasam Santamaguluru Bengal gram, Rice, Chillies, Vegetables
Prakasam Kothapatnam Bengal gram, Rice, Chillies, Vegetables
Guntur Kollipra Pulse, Cotton, Jowar (sorghum), Maize
Turmeric
Guntur Mangalagiri Pulse, Cotton, Jowar (sorghum), Maize
Turmeric, Chilli
Guntur Tadepalli Turmeric
Guntur Machavaram Chilli
Guntur Edlapadu Pulse, Cotton, Jowar (sorghum), Maize
Chilli
Guntur Bapatla Floriculture
Guntur Amaravathi Chillies
Guntur Krosuru Chillies
Guntur Kakamanu Chillies
Guntur Pedanandipadu Chillies
Guntur PV Palem Pulse, Cotton, Jowar (sorghum), Maize
Guntur Bellamkonda Pulse, Cotton, Jowar (sorghum), Maize
Guntur Rajupalem Pulse, Cotton, Jowar (sorghum), Maize
Guntur Dachepalli Pulse, Cotton, Jowar (sorghum), Maize
Guntur Bhattiprolu Pulse, Cotton, Jowar (sorghum), Maize
Guntur Bollapally Pulse, Cotton, Jowar (sorghum), Maize
Krishna Thotalvalluru Banana
Krishna Mopidevi Vegetables
Krishna Musunuru Rice, Black gram Banana, Palmoil, Vegetables
Krishna Nandigama Chilli
Krishna G.Konduru Mango, Vegetables Chillies + Vegetables
Krishna Mylavaram Jasmine, Vegetables

125
District MandalMillets Revival
NFSM (47)NF/NPM
(131)Horticulture
(105)SERP (39)
Krishna Vuyyuru Vegetables
Krishna A Konduru Rice+ Black gram
Krishna Gampalagudem Rice+ Black gram
Krishna Veerullapadu Chillies + Vegetables
Krishna Nagayalanka Rice, Black gram
Krishna Machilipatnam Rice, Black gram
Krishna Agiripalli Rice, Black gram
Krishna Bapulapadu Rice, Black gram
Krishna Nizuvidu Rice, Black gram
Krishna Chatrai Rice, Black gram
Krishna Reddygudem Rice, Black gram
* SFAC proposed FPOs were not mapped as they were identified at district level only Note: Ash color highlighted mandals were considered in the baseline survey

126
Dist
rict
Agric
ultu
re
Anim
al H
usba
ndry
Fish
erie
sHo
rticu
lture
SERP
NF/
NPM
SFAC
Mill
ets R
eviv
al
IGC
VRU
TTI
ALC
Trib
alRa
infe
dDa
iry
FPO
Shee
p &
Go
atPo
ultr
y FP
OFo
dder
FP
OFW
Fish
Shrim
p/pr
awn
Mar
ine
Mar
ketin
gSe
a ba
ssM
ud c
rab
Agri
com
mod
ities
Anan
tapu
r10
36
2013
110
2
2
Chitt
oor
103
3
6
122
22
2
Kada
pa10
3
15
60
0
2
E ast
God
avar
i10
2
38
03
01
111
00
0
6
Gunt
ur10
6
9
61
02
41
00
1
2
K rish
na10
19
71
14
103
01
2
2
Kurn
ool
1115
9
6
1811
00
2
Nel
lore
10
52
00
03
00
00
2
Prak
asam
10
122
00
13
30
00
2
Srik
akul
am10
53
8
20
00
10
00
0
5
Visa
khap
atna
m10
8
6
21
00
12
00
0
4
Vizia
naga
ram
103
2
62
00
00
01
00
6
Wes
t God
avar
i10
15
22
03
60
00
0
2
Tota
l13
130
215
1532
176
5510
511
3910
11
310
539
Gra
nd T
otal
234
246
6510
539
App
endi
x 4.
1 D
istr
ict-w
ise
prop
osed
FPO
s by
sub
-sec
tor i
n A
P St
ate

127
Appendix 5.1 Activities initiated by POPIsS. No Commodity Activities Y/N Reasons if not undertaken/ what were undertaken
1 Banana Awareness creation Y Kalajatha,
Training need assessment (TNA) Y Fertilizer, crop improvement & management
Infrastructure identified Y 4 Van, Weighing machines 10, Gunny bags @ 200 per day, collection centre at temple, requested area within premises to construct sheds
Market intervention assessment Y
Capacity building/exposure visits Y Tamil Nadu
Linking with relevant officials Y
Preparation of business plan Y
Facilitation of credit Y
2 Jasmine Awareness creation Y Kalajatha,
Training need assessment (TNA) Y Fertilizer, crop improvement & management
Infrastructure identified Y 4 Van, Weighing machines 10, Gunny bags @ 200 per day, collection centre at temple, requested area within premises to construct sheds
Market intervention assessment Y
Capacity building/exposure visits Y Tamil Nadu
Linking with relevant officials Y
Preparation of business plan Y
Facilitation of credit N No formal credit from banks
Others Y Personal investments from directors
3 Turmeric Awareness creation Y
Training need assessment (TNA) Y
Infrastructure identified Y
Market intervention assessment Y
Capacity building/exposure visits Y
Linking with relevant officials Y
Preparation of business plan Y
Facilitation of credit Y
4 Inland Fish Awareness creation Y Village level awareness programmes, Skits, Meetings, Gramsabha
Training need assessment (TNA) Y Need based analysis, market linkages, skill upgradation, technical inputs
Infrastructure identified Y Rented office
Market intervention assessment Y Near Akuveedu, Kaikaluru, Kalidindi
Capacity building/exposure visits Y Not yet
Linking with relevant officials Y NABARD, FDO Fisheries Mr. Sudhakar Nayak, Bankers interation
Preparation of business plan Y Proposal submitted to fisheries department
Facilitation of credit Y Trying through local banks
5 Marine Fish Awareness creation Y on fish grading systems, marketing,
Training need assessment (TNA) Y Cooling boxes, thermocoal boxes, weighing machine, farmers two wheelers
Infrastructure identified Y Collection centre,
Market intervention assessment Y Near Narsapur or bhimavaram
Capacity building/exposure visits Y Akuveedu, bhimavaram, machlipatnam, kakinada and Chennai market scans
Linking with relevant officials Y NABARD, FDO Fisheries Mr. Pothuraju
Preparation of business plan Y Proposal submitted to fisheries department for
Facilitation of credit Y

128
Appendix 5.2 Activities initiated by RSAS. No Commodity Activities Y/N Reasons if not undertaken/ what were undertaken
1 Banana Capacity building of POPI/FPO level Y Share capital, marketing, value addition training
Facilitate value addition/marketing at FPO level Y
Monitoring the FPO implementation process N Never visited FPO
Guiding from time to time N Not in field
Others
2 Jasmine Capacity building of POPI/FPO level Y Share capital, marketing, value addition
Facilitate value addition/marketing at FPO level Y
Monitoring the FPO implementation process N Never visited FPO
Guiding from time to time N Not in field
Others
3 Turmeric Capacity building of POPI/FPO level Y
Facilitate value addition/marketing at FPO level N Don’t know?
Monitoring the FPO implementation process N
Guiding from time to time N
4 Inland Fish Capacity building of POPI/FPO level Y Share capital, marketing, value addition
Facilitate value addition/marketing at FPO level Y
Monitoring the FPO implementation process N Never visited FPO
Guiding from time to time N Not in field
5 Marine Fish Capacity building of POPI/FPO level Y
Facilitate value addition/marketing at FPO level Y
Monitoring the FPO implementation process N Never visited FPO
Guiding from time to time N Not in field

129
Appendix 6.1 Functional & proposed FPOs in Andhra Pradesh
S. No District Mandal Functional FPOs Proposed FPOs Commodity
1 East Godavari Amalapuram NOVEEAL COCONUT PRODUCER COMPANY LIMITED AMALAPURAM
Coconut
2 East Godavari Kapileshwarapuram (Name not finalized) Vegetables
3 East Godavari Kothakota (Name not finalized) Banana, Vegetables
4 East Godavari Sakkinetipalli BS Murthy AFWS Fisheries
5 East Godavari Razole Sri Lakshmi Pathi AFWS Fisheries
6 East Godavari Sakkinetipalli Sri Satyanarayan AFWS Fisheries
7 Guntur Mangalagiri Mangaladri Agri producer company
Turmeric
8 Guntur Machavaram Red Chilli Farmer’s PC Red chilli
9 Guntur Repalle Gangaputra Fisheries PC Inland fishes, prawn
10 Guntur Mangalagiri Sehamitha Producers C Organic cotton, chillies
11 Guntur Machavaram Srinidhi Milk Producers C Fresh Milk
12 Krishna Kruttivennu Samyuktha Fisheries FPO Marine fishes
13 Krishna Kaikalur Snehanjali inland fisheries Inland fishes, prawn
14 Krishna Thotavalleru Vigneswars Banana Banana
15 Krishna Mylavaram Sambasiva Jasmine Jasmine
16 Krishna Vijayawada rural Navyandhra Organic Producer’s company
Natural organic farming
17 Kadapa Rayachoti (Name not finalized) Organic Farming
18 Kadapa Mydukur Health Education & Rural Development Society
Animal Husbandry (sheep, goat)
19 Kadapa B Matam Chainchaigaripalli Macha Sahakara Sangham
Fisheries
20 Kadapa Vempalle Sri Sai Sangameshwara Horticulture Farmers Producers Mutually aided Cooperative Society
Horticulture (banana)
21 Kurnool Betamcherla Bethamcherla Progressive Farmers Producers Company Ltd
Redgram; Foxtail Millet
22 Kurnool Nandyal Dairy FPO Dairy
23 Kurnool Alur Reliance Foundation Multiple Commodities
24 Prakasam Kanigiri Dairy FPO Dairy
25 Prakasam Kothapatnam Chethana Groundnut Producer Company Limited
Groundnut
26 Visakhapatnam V Madugula Proposed Fisheries
27 Visakhapatnam Cheedikada Seethamma Milk Producers Company Ltd
Animal Husbandry
28 Visakhapatnam S Rayavaram Gurajada Coconut farmers producer Company Ltd
Coconut
29 Visakhapatnam Paderu D Gonduru Girijan Farmer Producer Company Ltd, Paderu
Medicinal plants
30 Visakhapatnam Araku valley
Sabari Farmer Producer Company Ltd
Multi commodity (Mango, sapota, Turmeric, Amla, pulses)
31 Visakhapatnam Subavaram Susag Millet Producers Company Ltd (Recently registered)
Pulses

130
S. No District Mandal Functional FPOs Proposed FPOs Commodity
32 West Godavari Chagallu Sri Seetharamanjaneya Seed Society
Rice Seed
33 West Godavari Kovurru Sri Venkateshwara Farmer Seed Society
Rice Seed
34 West Godavari Dharmavaram Society Natural Farming
35 West Godavari Chinatalapudi Viswa Mitra FPO, Natural Farming (Multicommodity)
36 West Godavari Sri Anjaneya FPO
37 West Godavari KAMAVARAPUKOTA Kamadenuvu FPO, Palm oil (Natural farming)
38 West Godavari Laxmi Sai FPO Natural Farming (multi Commodity)
Appendix 6.2 Number of godowns and capacity
S. No Ware house
Andhra Pradesh
Number Capacity in (MMT)
1 Godowns existing up to 2004 591 0.374
2 Godowns existing between the period 2004-2009 289 0.238
3 Godowns existing between the period 2009-2016 60 0.169
4 Godowns under Progress in RDF 33 0.063
Total 1060 0.848
Source: http://market.ap.nic.in/department-activities.html
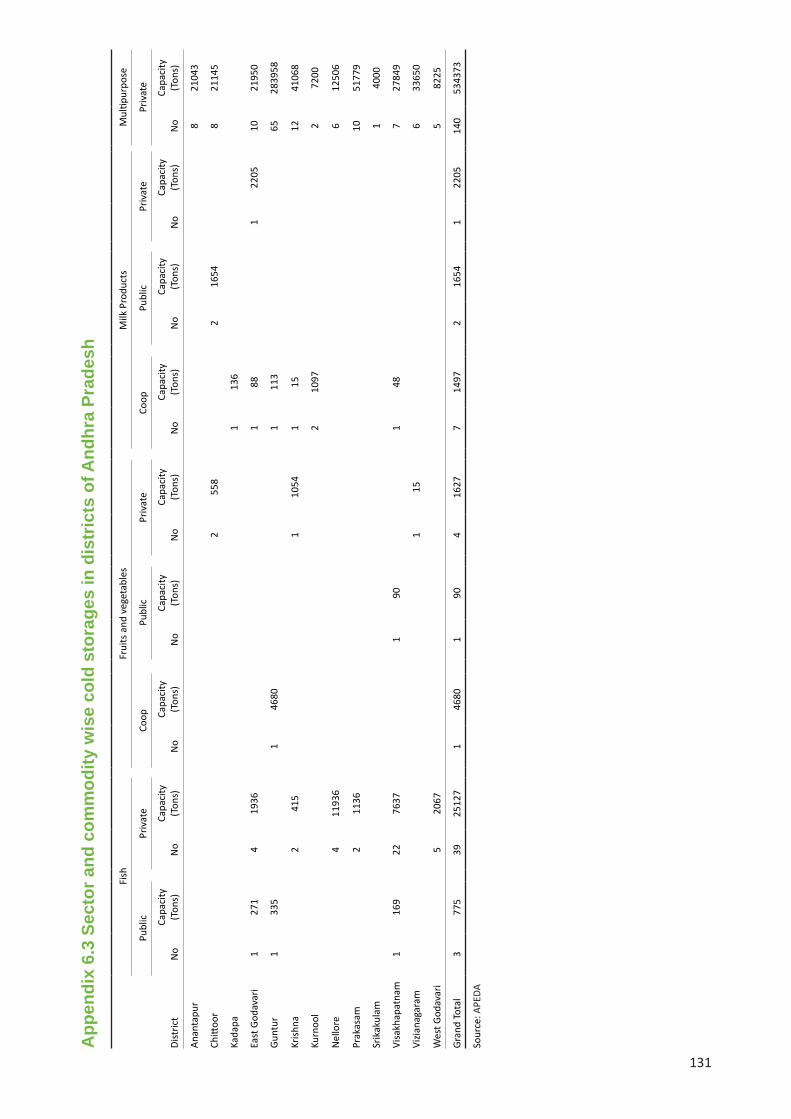
131
App
endi
x 6.
3 Se
ctor
and
com
mod
ity w
ise
cold
sto
rage
s in
dis
tric
ts o
f And
hra
Prad
esh
Dist
rict
Fish
Frui
ts a
nd v
eget
able
sM
ilk P
rodu
cts
Mul
tipur
pose
Publ
icPr
ivat
eCo
opPu
blic
Priv
ate
Coop
Publ
icPr
ivat
ePr
ivat
e
No
Capa
city
(T
ons)
No
Capa
city
(T
ons)
No
Capa
city
(T
ons)
No
Capa
city
(T
ons)
No
Capa
city
(T
ons)
No
Capa
city
(T
ons)
No
Capa
city
(T
ons)
No
Capa
city
(T
ons)
No
Capa
city
(T
ons)
Anan
tapu
r
821
043
Chitt
oor
2
558
216
54
8
2114
5
Kada
pa
113
6
East
God
avar
i1
271
419
36
1
88
1
2205
1021
950
Gunt
ur1
335
1
4680
111
3
65
2839
58
Krish
na2
415
110
541
15
12
4106
8
Kurn
ool
2
1097
272
00
Nel
lore
411
936
612
506
Prak
asam
211
36
10
5177
9
Srik
akul
am
1
4000
Visa
khap
atna
m1
169
2276
37
1
90
1
48
7
2784
9
Vizia
naga
ram
115
633
650
Wes
t God
avar
i5
2067
582
25
Gran
d To
tal
377
539
2512
71
4680
190
416
277
1497
216
541
2205
140
5343
73
Sour
ce: A
PEDA

132
Nam
e of
the
Stat
e
Cold
Sto
rage
Chill
ed S
tora
geDr
y Fi
sh S
tora
geO
ther
Sto
rage
sTo
tal
No
Capa
city
(T
ons/
Day
)N
oCa
paci
ty
(Ton
s / D
ay)
No
Capa
city
(T
ons /
Day
)N
oCa
paci
ty
(Ton
s / D
ay)
No
Capa
city
(T
ons /
Day
)
Andh
ra P
rade
sh63
24,8
05.0
01
50.0
011
3,91
2.00
00.
0075
28,7
67.0
0
Goa
124,
326.
500
0.00
192
0.00
120
0.00
145,
446.
50
Guja
rat
101
46,4
57.8
03
1,32
2.80
151,
419.
003
59.0
012
249
,258
.60
Guw
ahati
00.
000
0.00
00.
000
0.00
00.
00
Karn
atak
a21
8,36
8.70
00.
008
2,10
5.00
186,
564.
0047
17,0
37.7
0
Kera
la14
962
,370
.50
186
1.00
219
.00
577
1.00
157
64,0
21.5
0
Kolk
ata
395,
689.
000
0.00
91,
040.
001
60.0
049
6,78
9.00
Mah
aras
htra
4831
,623
.30
00.
006
691.
000
0.00
5432
,314
.30
New
Del
hi0
0.00
00.
000
0.00
00.
000
0.00
Odi
sha
2311
,019
.00
177,
038.
000
0.00
00.
0040
18,0
57.0
0
Tam
il N
adu
41
16,2
29.4
0 7
2089
.00
5 19
00.0
0 7
812.
0060
21,0
30.4
0
Tota
l49
721
0,88
9.20
2911
,360
.80
5712
,006
.00
358,
466.
0061
824
2,72
2.00
Sour
ce: M
PEDA
App
endi
x 6.
4 D
etai
ls o
f sto
rage
faci
litie
s av
aila
ble
incl
udin
g in
And
hra
Prad
esh
as re
port
ed b
y th
e M
arin
e Pr
oduc
ts E
xpor
t Dev
elop
men
t Aut
horit
y

133
Appendix 6.5 District wise warehouses and capacity (Tons)
District
Owned Hired Investor Total
Number Capacity Number Capacity Number Capacity Number Capacity
Anantapur 3 16175 3 16175
Chittoor 2 7950 2 7950
East Godavari 6 95100 2 40000 9 70000 17 205100
Guntur 8 117880 8 117880
Kadapa 3 34300 1 10000 4 44300
Krishna 2 19450 3 45000 5 64450
Kurnool 3 27200 1 2845 1 10000 5 40045
Nellore 5 68900 1 2000 6 70900
Prakasam 3 150930 3 150930
Srikakulam 3 36300 3 55935 2 35000 8 127235
Visakhapatnam 0 0
Vizianagaram 1 11800 4 14983 5 60000 10 86783
West Godavari 4 53375 1 5000 8 155000 13 213375
Grand Total 43 639360 12 120763 29 385000 84 1145123
Source: APSWC
S. No District LocationNo. of
godowns
Capacity of each godown
(Tons)
Total Capacity
(Tons)
1 Guntur Guntur 3 1000 30002 Kadapa Kadapa 6 1000 60003 Krishna Moturu 1 1000 10004 Krishna Vijayawada 8 1000 80005 Krishna Vijayawada 2 1500 30006 Kurnool Nandyala 2 1000 20007 Nellore Nellore 3 1000 30008 Prakasam Chirala 2 1000 2000 27 28,000
Appendix 6.6 Number of godowns and capacity under AP Markfed

134
DistrictVeterinary Poly Clinic
Super Specialty
Veterinary Hospitals
Veterinary Hospitals
Veterinary Dispensaries
Mobile Veterinary
Clinics
Rural Livestock
Units TotalAnantapur 1 16 110 3 61 191Chittoor 1 15 135 2 171 324East Godavari 1 15 151 1 76 244Guntur 1 16 126 2 141 286Kadapa 1 1 12 102 2 131 249Krishna 1 1 17 114 1 190 324Kurnool 1 15 121 2 205 344Nellore 1 15 101 1 100 218Prakasam 1 8 119 3 103 234Srikakulam 1 13 83 2 99 198Visakhapatnam 16 87 3 62 168Vizianagaram 1 11 69 2 74 157West Godavari 1 11 102 1 92 207Andhra Pradesh 12 2 180 1420 25 1505 3144
Appendix 6.7 Animal husbandry facilities available district-wise
S. No DISTRICT LOCATION OF RECOGNISED SLAUGHTER HOUSES
1 Anantapur Anantapur, Gooty, Guntakal, Kadiri, Dharmavaram, Rayadurg
2 Chittoor V.Kota, Palamner, Kuppam, Madanapalli, Punganur, Pakala, Puttur, Srikalahasti
3 East Godavari Kakinada, Jaggampet, Peddapuram, Pithapuram, Samalkota, Rajahmundry, Ramachandrapuram, Draksharama, Anaparthy, Alamuru, Mandapeta,
Gokavaram, Amalapuram
4 Guntur Guntur, Chilakaluripet, Narasaraopet, Mangalagiri
5 Kadapa Kadapa, Pulivendula
6 Krishna Machilipatnam, Pedana, Jaggaiahpet, Gudivada, Vizayawada, Vuyyuru, Nuzvidu
7 Kurnool Kurnool, Kodumur, Nandikotkur, Dhone, Bethamcherla, Gudur, Adoni, Yemmiganur, Alur, Pathikonda, Kosigi, Kowthalam, Maddikera,
Nandyal,Banaganapalli, Sunnipenta, Atmakur, Allagadda
8 Nellore Nellore, Gudur, Kavali, Venkatagiri, Chennur
9 Prakasam Ongole, Chirala
10 Srikakulam Srikakulam
11 Visakhapatnam Chinagadili, Anakapalli, Bheemunipatnam, Elamanchili
12 Vizianagaram Vizianagaram, S.Kota, Bobbili, Parvathipuram, Salur
13 West Godavari Eluru, Vangayagudem, Tadepalligudem, Velpuru, Penugonda, Narasapuram, Palcole, Bhimavaram, Nidaavole, Tanuku.
Appendix 6.8 District wise slaughter houses available
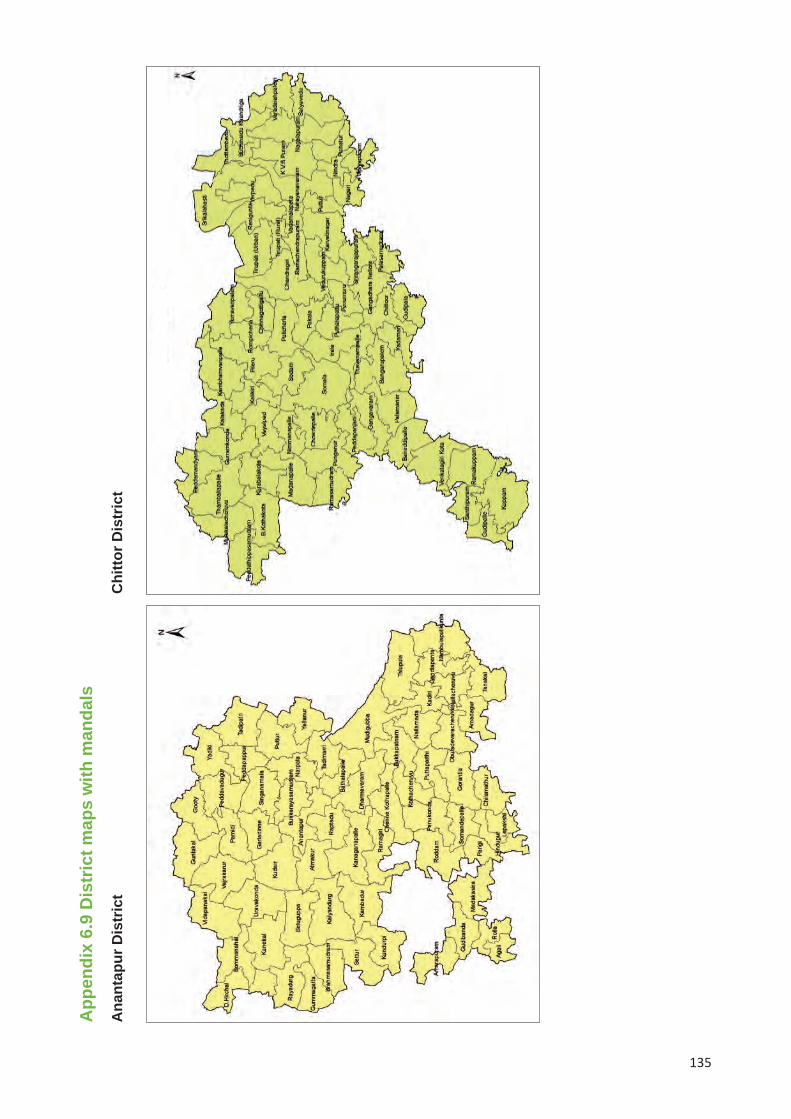
135
App
endi
x 6.
9 D
istr
ict m
aps
with
man
dals
Ana
ntap
ur D
istr
ict
Chi
ttor D
istr
ict

East
God
avar
i Dis
tric
tK
urno
ol D
istr
ict
136
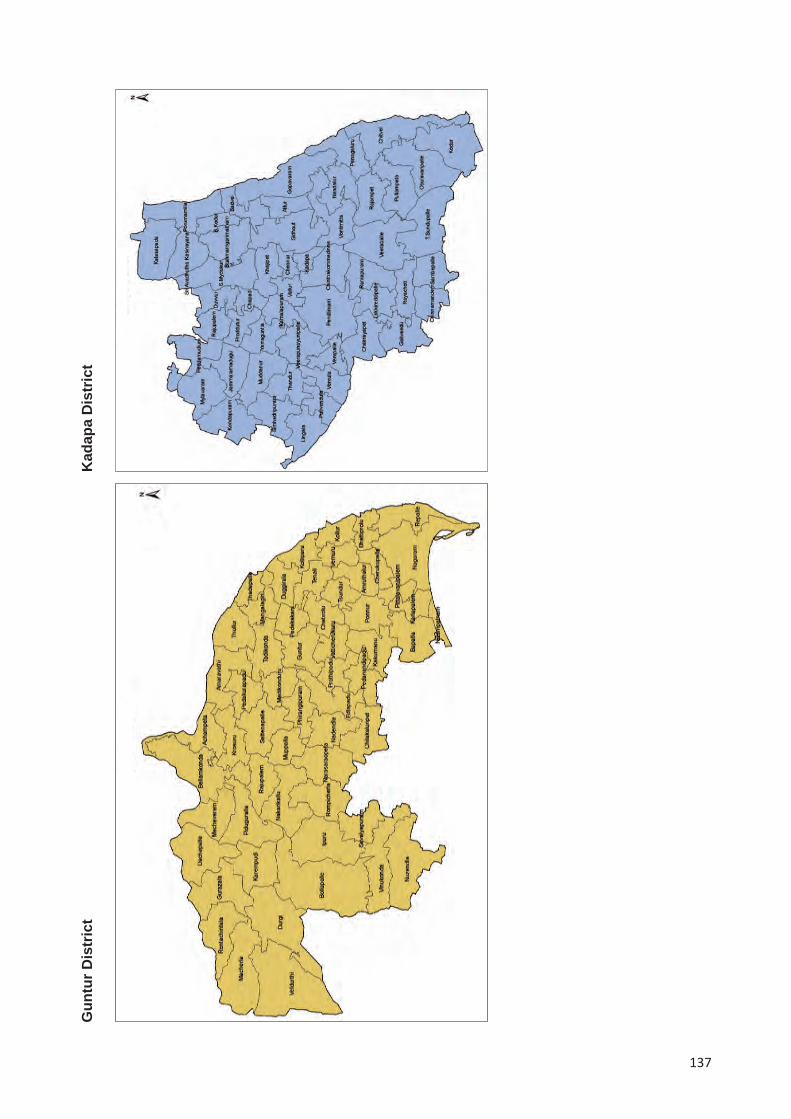
137
Gun
tur D
istr
ict
Kad
apa
Dis
tric
t

138
Kris
hna
Dis
tric
tN
ello
re D
istr
ict

139
Srik
akul
am D
istr
ict
Prak
asam
Dis
tric
t
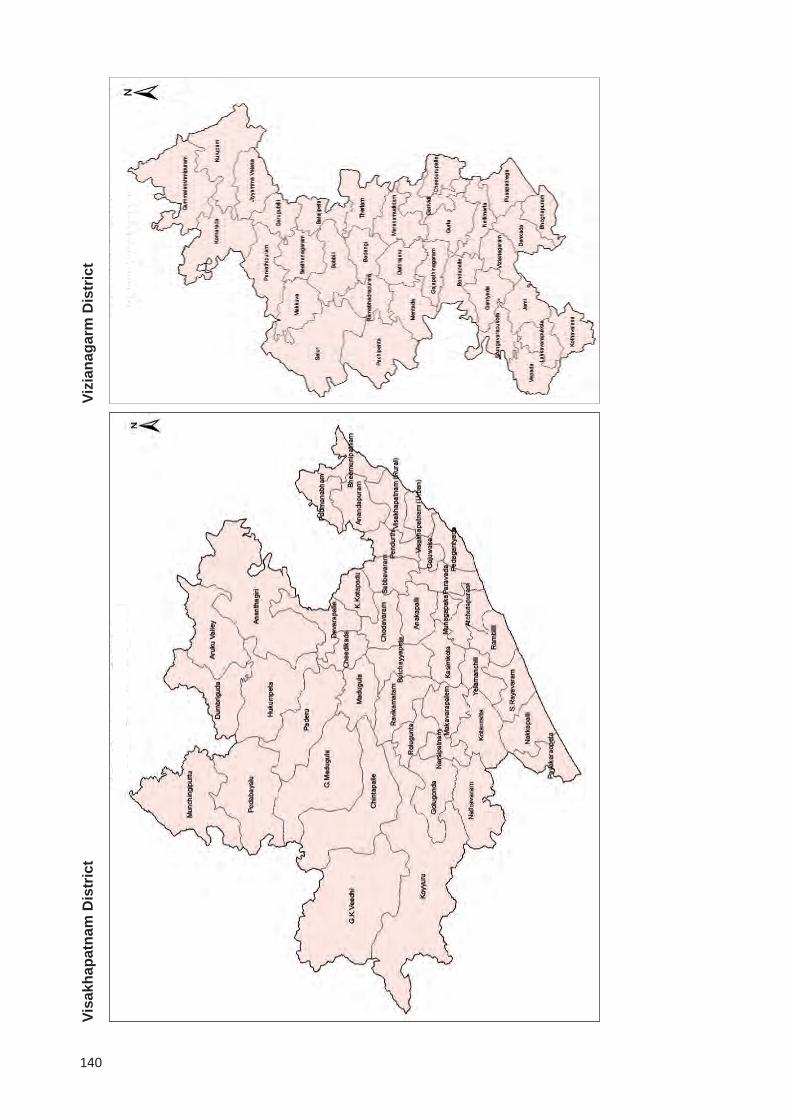
140
Vizi
anag
arm
Dis
tric
tVi
sakh
apat
nam
Dis
tric
t

141
West Godavari District


Farmer Producer Organization In Andhra Pradesh: A Scoping Study
ISBN 978-92-9066-592-2
ICRISAT-India (Headquarters)Patancheru, Telangana, [email protected]
ICRISAT-India Liaison OfficeNew Delhi, India
ICRISAT-NigeriaKano, [email protected]
ICRISAT-MalawiLilongwe, [email protected], [email protected]
ICRISAT-NigerNiamey, [email protected]
ICRISAT-EthiopiaAddis Ababa, [email protected]
ICRISAT works in agricultural research for development across the drylands of Africa and Asia, making farming profitable for smallholder farmers while reducing malnutrition and environmental degradation.
We work across the entire value chain from developing new varieties to agri-business and linking farmers to markets.
ICRISAT appreciates the support of CGIAR investors to help overcome poverty, malnutrition and environmental degradation in the harshest dryland regions of the world. See http://www.icrisat.org/icrisat-donors.htm for full list of donors.
About ICRISAT: www.icrisat.org ICRISAT’s scientific information: EXPLOREit.icrisat.org
We believe all people have a right to nutritious food and a better livelihood.
ICRISAT-Mali (Regional hub WCA)Bamako, [email protected]
ICRISAT-ZimbabweBulawayo, [email protected]
ICRISAT-Kenya (Regional hub ESA)Nairobi, [email protected]
/ICRISAT /ICRISAT /ICRISATco/company/ ICRISAT
/PHOTOS/ ICRISATIMAGES /ICRISATSMCO
01-2017
Rythu Kosam Project
Research Report IDC-16ICRISAT Development Center
DC ICRISAT DEVELOPMENT CENTER