lampiran a hasil pemeriksaan standarisasi …repository.wima.ac.id/656/7/lampiran.pdfhasil...
TRANSCRIPT
112
112
LAMPIRAN A
HASIL PEMERIKSAAN STANDARISASI PARAMETRIK EKSTRAK ROSELLA
A. PEMERIKSAAN ORGANOLEPTIS EKSTRAK ROSELLA
B. HASIL PENENTUAN pH EKSTRAK ROSELLA
C. HASIL PENENTUAN KADAR SARI LARUT AIR EKSTRAK
ROSELLA
Replikasi Berat cawan(g)
Berat ekstrak
(g)
Berat konstan % kadar
1 81,1772 5,0039 81,1563 95,89 2 76,2100 5,0038 76,1816 97,44 3 79,3394 5,0015 79,2535 98,96
X ± SD 97,43±1,53
Contoh perhitungan standarisasi kadar sari larut air :
Berat cawan sesudah dipanaskan = 81,1563
Berat cawan kosong = 80,1966
Pemeriksaan Ekstrak Rosella Bentuk Serbuk Warna Merah
Bau Khas rosella Rasa Asam
Replikasi Ekstrak Rosella I 3,21 II 3,22 III 3,21
X ± SD 3,21±0,005
113
113
Berat ekstrak = 5,0039/5
= 1,0078
% kadar = berat pemanasan terakhir – berat cawan kosong x 100%
Berat ekstrak/5
% kadar = (81,1563 – 80,1966) x100%
1,0078
= 95,89%
D. HASIL PENENTUAN KADAR SARI LARUT ETANOL EKSTRAK
ROSELLA
Replikasi Berat cawan(g)
Berat ekstrak
(g)
Berat konstan
% kadar
1 57,8016 5,0026 57,7713 29,25 2 41,3881 5,0034 41,3819 29,73 3 72,9216 5,0015 72,6671 29,72
X ± SD 29,57±0,27
Contoh perhitungan standarisasi kadar sari larut etanol :
Berat cawan sesudah dipanaskan = 57,7713
Berat cawan kosong = 57,4786
Berat ekstrak = 5,0026/5
= 1,00052
% kadar = berat pemanasan terakhir – berat cawan kosong x 100%
Berat ekstrak/5
% kadar = (57,7713 – 57,4786) x100%
1,00052
= 29,25%
114
114
LAMPIRAN B
HASIL PEMERIKSAAN STANDARISASI NON PARAMETRIK EKSTRAK ROSELLA
A. HASIL PENENTUAN KADAR ABU TOTAL EKSTRAK ROSELLA
Rep Berat krus (g)
Berat ekstrak
(g)
Berat krus+abu konstan (g)
% kadar
I 36,3608 2,5042 36,4647 4,14
II 35,1912 2,5102 35,2952 4,14 III 23,3239 2,5042 23,4260 4,08
X ± SD 4,12±0,01
Contoh Perhitungan standarisasi kadar abu total :
% kadar = berat abu konstan – berat kurs x 100%
Berat ekstrak
% kadar = 36,4647 – 36,3608 x 100%
2,5042
= 4,14
B. HASIL PENETAPAN KADAR ABU TIDAK LARUT ASAM
EKSTRAK ROSELLA
Replikasi
Berat krus (g)
Berat krus+abu konstan (g)
Berat abu+HCl konstan (g)
% kadar
I 23,4802 36,2526 22,2886 9,32 II 24,8618 34,3136 23,8586 10,61
III 23,4920 36,2626 23,32324 9,15 X ± SD 9,69±0,79

115
115
Contoh Perhitungan standarisasi kadar abu tidak larut asam:
% kadar = berat abu setelah penambahan HCl x 100%
Berat abu total – berat kurs
% kadar = 22,2886 – 23,4802 x 100%
36, 2526 – 23,4802
= 9,32%
C. HASIL PENETAPAN KADAR ABU LARUT AIR EKSTRAK
ROSELLA
Contoh Perhitungan standarisasi kadar abu larut air :
% kadar = berat abu setelah penambahan Aquadest x 100% Berat abu total – berat kurs % kadar = 23,4740 – 22,2703 x 100%
36,2731 – 22,2705
= 8,59%
D. HASIL PENENTUAN KADAR AIR
Rep
Berat cawan (g)
Berat cawan+eks
trak
Berat cawan+ekstrak
konstan (g)
% kadar
1 75,7586 85,7628 85,7560 0,06 2 68,5794 78,6104 78,6010 0,09 3 63,5846 73,5865 73,5668 0,19
x ± SD 0,11±0,07
Replikasi
Berat krus (g)
Berat krus+abu
konstan (g)
Berat abu+ aquadest (g)
% kadar
I 22,2703 36,2731 23,4740 8,59 II 23,8038 34,5341 22,8239 9,13 III 23,2801 34,2659 24,2015 8,39
X ± SD 8,70±0,38
116
116
Contoh Perhitungan standarisasi kadar air :
% kadar = berat ekstrak – berat ekstrak konstan x 100%
Berat ekstrak
% kadar = 10,0042 – 9,9974 x 100%
10,0042
= 0,06%
E. HASIL PENENTUAN SUSUT PENGERINGAN
Replikasi Ekstrak kering rosella I 4,00 II 4,10 III 4,17
x ± SD 4,09±0,08

117
117
LAMPIRAN C
HASIL ANOVA SATU ARAH UJI MUTU FISIK PENYALUT
A. VISKOSITAS
ANOVA
viskositas penyalut
Sum of Squares df
Mean Square F Sig.
Between Groups 162.887 3 54.296 249.635 .000 Within Groups 1.740 8 .217 Total 164.627 11
Multiple Comparisons
Tukey HSD
(I) formula (J) formula
Mean Difference
(I-J) Std. Error Sig.
95% Confidence Interval
Lower Bound Upper Bound
Formula A
Formula B .50000 .38079 .580 -.7194 1.7194
Formula c -.76667 .38079 .260 -1.9861 .4528
Formula D -8.53333* .38079 .000 -9.7528 -7.3139 Formula B
Formula A -.50000 .38079 .580 -1.7194 .7194 Formula c -1.26667* .38079 .042 -2.4861 -.0472 Formula D -9.03333* .38079 .000 -10.2528 -7.8139
Formula c
Formula A .76667 .38079 .260 -.4528 1.9861 Formula B 1.26667* .38079 .042 .0472 2.4861 Formula D -7.76667* .38079 .000 -8.9861 -6.5472
Formula D
Formula A 8.53333* .38079 .000 7.3139 9.7528 Formula B 9.03333* .38079 .000 7.8139 10.2528 Formula c 7.76667* .38079 .000 6.5472 8.9861
*. The mean difference is significant at the 0.05 level.
118
118
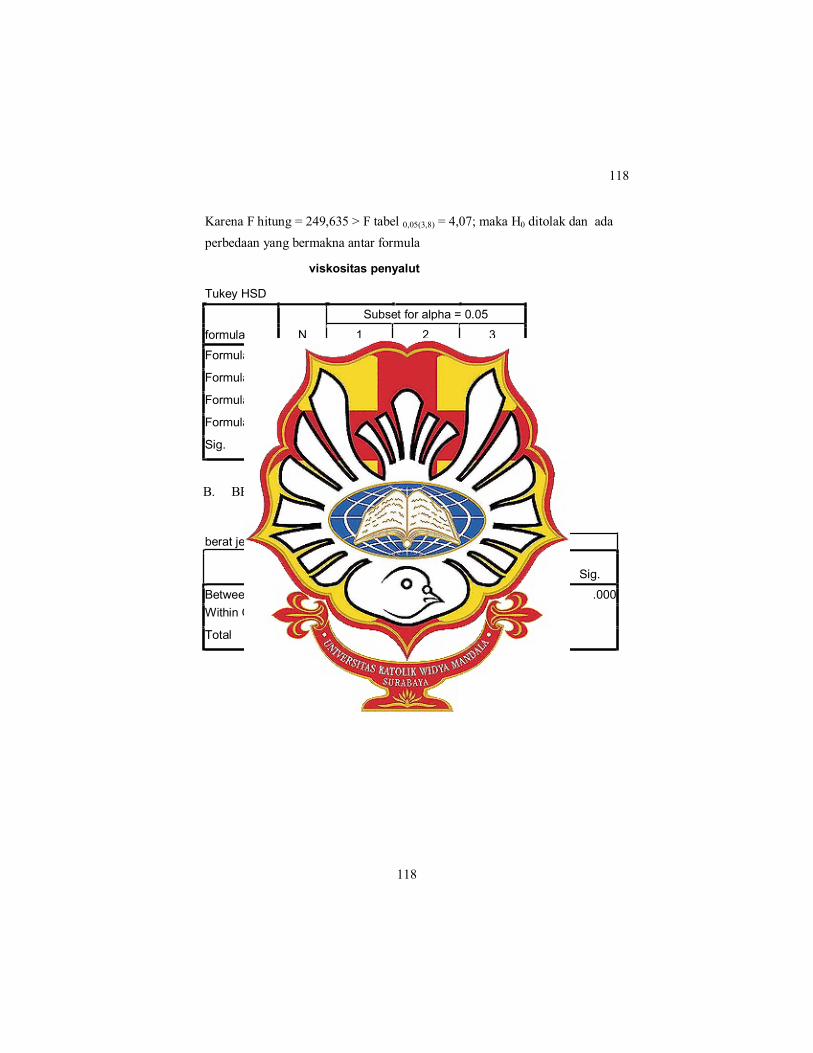
Karena F hitung = 249,635 > F tabel 0,05(3,8) = 4,07; maka H0 ditolak dan ada perbedaan yang bermakna antar formula
viskositas penyalut
Tukey HSD
formula N
Subset for alpha = 0.05
1 2 3
Formula B 3 24.1333 Formula A 3 24.6333 24.6333 Formula c 3 25.4000 Formula D 3 33.1667 Sig. .580 .260 1.000
B. BERAT JENIS
ANOVA berat jenis
Sum of Squares df
Mean Square F Sig.
Between Groups .003 3 .001 1.209E3 .000 Within Groups .000 8 .000 Total .003 11

119
119
Multiple Comparisons
berat jenis
Tukey HSD
(I) formula
(J) formula
Mean Difference
(I-J) Std. Error Sig.
95% Confidence Interval
Lower Bound
Upper Bound
formula A formula B -.0202000* .0007157 .000 -.022492 -.017908
formula C .0005000 .0007157 .895 -.001792 .002792
formula D .0228667* .0007157 .000 .020575 .025159 formula B formula A .0202000* .0007157 .000 .017908 .022492
formula C .0207000* .0007157 .000 .018408 .022992 formula D .0430667* .0007157 .000 .040775 .045359
formula C formula A -.0005000 .0007157 .895 -.002792 .001792 formula B -.0207000* .0007157 .000 -.022992 -.018408 formula D .0223667* .0007157 .000 .020075 .024659
formula D formula A -.0228667* .0007157 .000 -.025159 -.020575 formula B -.0430667* .0007157 .000 -.045359 -.040775 formula C -.0223667* .0007157 .000 -.024659 -.020075
*. The mean difference is significant at the 0.05 level. Karena F hitung = 0,0012 < F tabel 0,05(3,8) = 4,07; maka H0 diterima dan tidak ada perbedaan yang bermakna antar formula

120
120
berat jenis Tukey HSD
formula N
Subset for alpha = 0.05
1 2 3
formula D 3 1.011433E0 formula C 3 1.033800E0 formula A 3 1.034300E0 formula B 3 1.054500E0 Sig. 1.000 .895 1.000
Means for groups in homogeneous subsets are displayed.
C. UJI pH LARUTAN PENYALUT
NOVA
pH
Sum of
Squares df
Mean
Square F Sig.
Between Groups .091 3 .030 23.242 .000
Within Groups .010 8 .001
Total .102 11
121
121
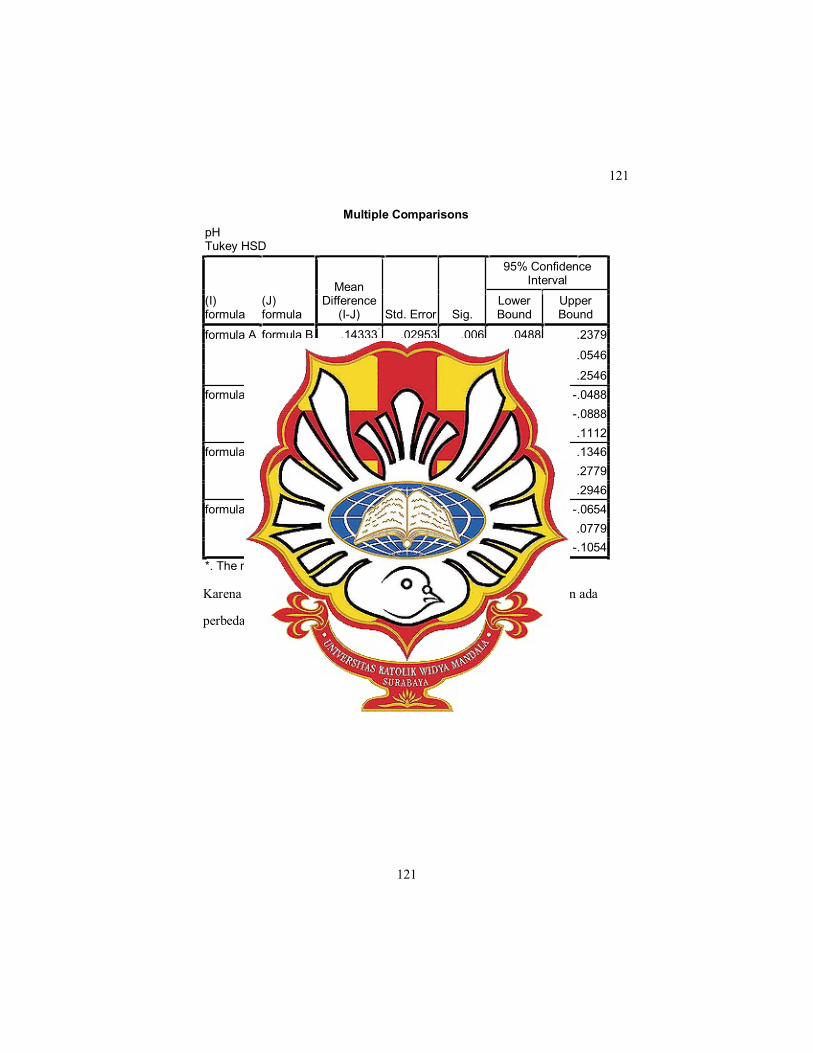
Multiple Comparisons pH Tukey HSD
(I) formula
(J) formula
Mean Difference
(I-J) Std. Error Sig.
95% Confidence Interval
Lower Bound
Upper Bound
formula A formula B .14333* .02953 .006 .0488 .2379
formula C -.04000 .02953 .558 -.1346 .0546
formula D .16000* .02953 .003 .0654 .2546 formula B formula A -.14333* .02953 .006 -.2379 -.0488
formula C -.18333* .02953 .001 -.2779 -.0888 formula D .01667 .02953 .940 -.0779 .1112
formula C formula A .04000 .02953 .558 -.0546 .1346 formula B .18333* .02953 .001 .0888 .2779 formula D .20000* .02953 .001 .1054 .2946
formula D formula A -.16000* .02953 .003 -.2546 -.0654 formula B -.01667 .02953 .940 -.1112 .0779 formula C -.20000* .02953 .001 -.2946 -.1054
*. The mean difference is significant at the 0.05 level.
Karena F hitung = 23,242 >F tabel 0,05(3,8) = 4,07; maka H0 ditolak dan ada
perbedaan yang bermakna antar formula
122
122
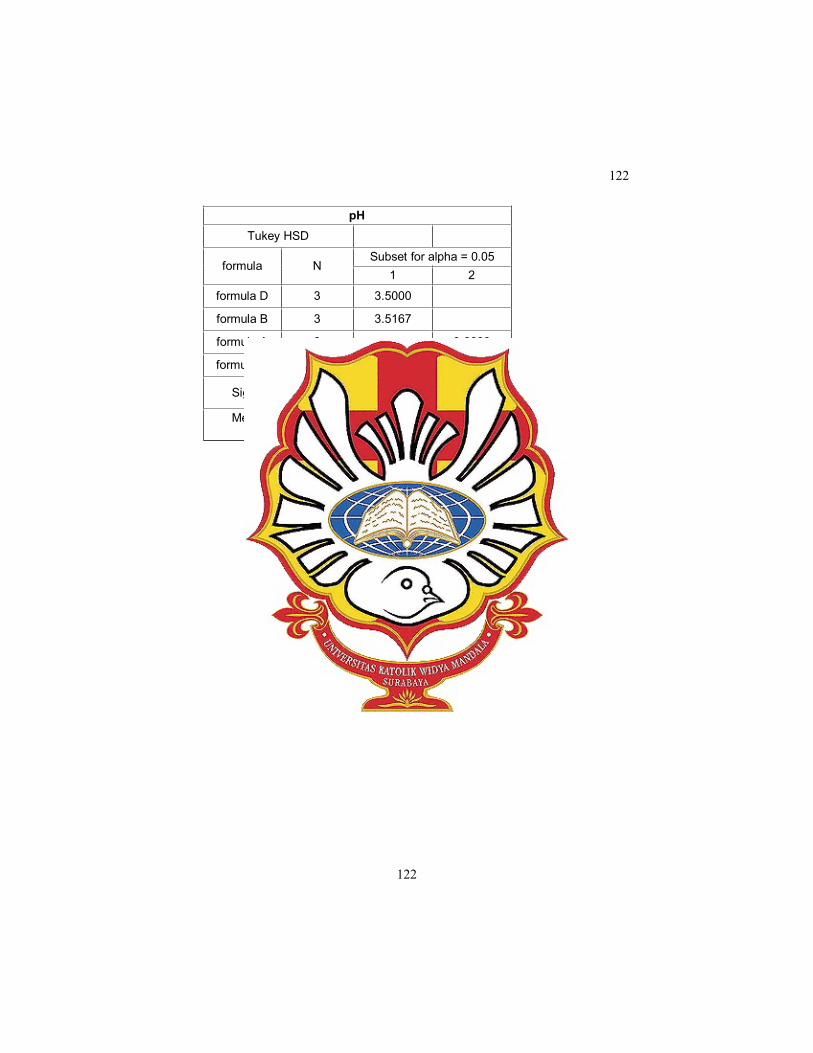
pH
Tukey HSD
formula N Subset for alpha = 0.05
1 2
formula D 3 3.5000 formula B 3 3.5167 formula A 3 3.6600
formula C 3 3.7000
Sig. .940 .55 8
Means for groups in homogeneous subsets are displayed.
123
123
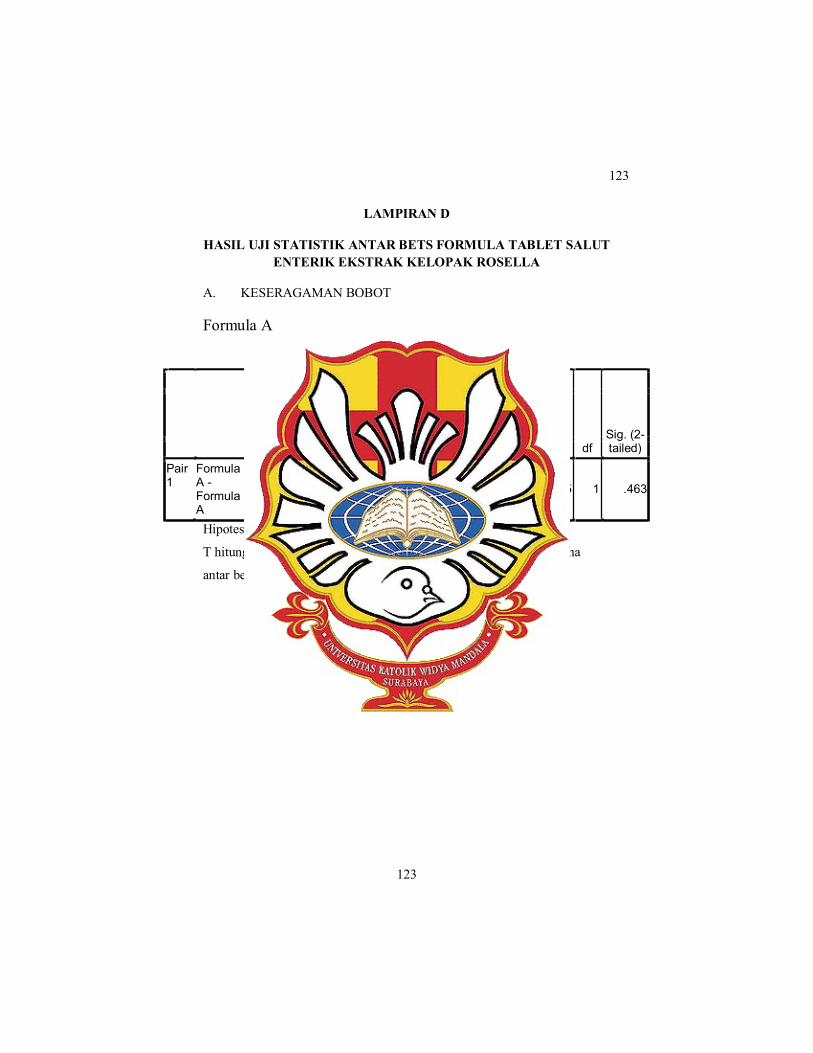
LAMPIRAN D
HASIL UJI STATISTIK ANTAR BETS FORMULA TABLET SALUT ENTERIK EKSTRAK KELOPAK ROSELLA
A. KESERAGAMAN BOBOT
Formula A
Paired Samples Test Paired Differences
t df Sig. (2-tailed)
Mean Std.
Deviation
Std. Error Mean
95% Confidence Interval of the
Difference
Lower Upper
Pair 1
Formula A - Formula A
.09000 .11314 .08000 -.92650 1.10650 1.125 1 .463
Hipotesa pengujian :
T hitung < T tabel (0,05) sehingga tidak ada perbedaan yang bermakna
antar bets.
124
124
Formula B
Paired Samples Test Paired Differences
t df Sig. (2-tailed)
Mean Std.
Deviation
Std. Error Mean
95% Confidence Interval of the
Difference Lower Upper
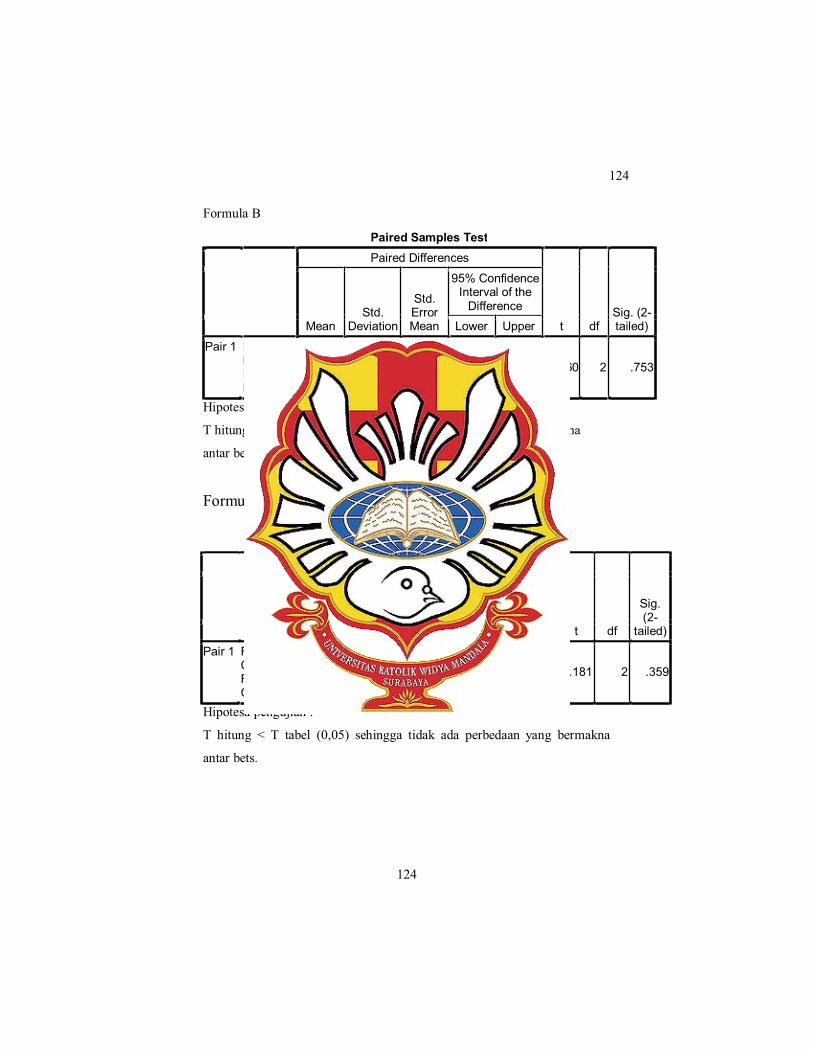
Pair 1 Formula B - Formula B
-.01667 .08021 .04631 -.21591 .18258 -.360 2 .753
Hipotesa pengujian :
T hitung < T tabel (0,05) sehingga tidak ada perbedaan yang bermakna
antar bets.
Formula C
Hipotesa pengujian :
T hitung < T tabel (0,05) sehingga tidak ada perbedaan yang bermakna
antar bets.
Paired Samples Test Paired Differences
t df
Sig. (2-
tailed)
Mean Std.
Deviation
Std. Error Mean
95% Confidence Interval of the
Difference
Lower Upper
Pair 1 Formula C - Formula C
.06333 .09292 .05364 -.16748 .29415 1.181 2 .359
125
125
Formula D Paired Samples Test
Paired Differences
t df Sig. (2-tailed)
Mean Std.
Deviation
Std. Error Mean
95% Confidence Interval of the
Difference
Lower Upper
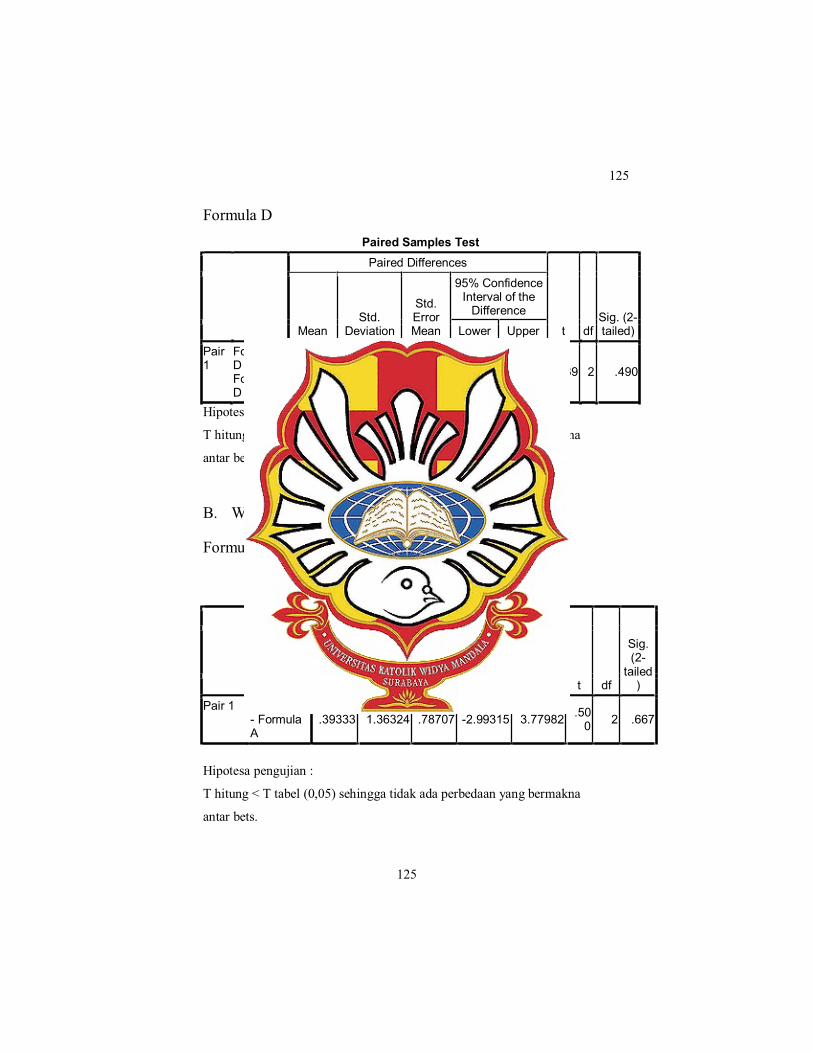
Pair 1
Formula D - Formula D
.02667 .05508 .03180 -.11015 .16348 .839 2 .490
Hipotesa pengujian :
T hitung < T tabel (0,05) sehingga tidak ada perbedaan yang bermakna
antar bets.
B. WAKTU HANCUR
Formula A
Hipotesa pengujian :
T hitung < T tabel (0,05) sehingga tidak ada perbedaan yang bermakna
antar bets.
paired Samples Test Paired Differences
t df
Sig. (2-
tailed)
Mean Std.
Deviation
Std. Error Mean
95% Confidence Interval of the
Difference
Lower Upper
Pair 1 Formula A - Formula A
.39333 1.36324 .78707 -2.99315 3.77982 .500 2 .667
126
126
Formula B
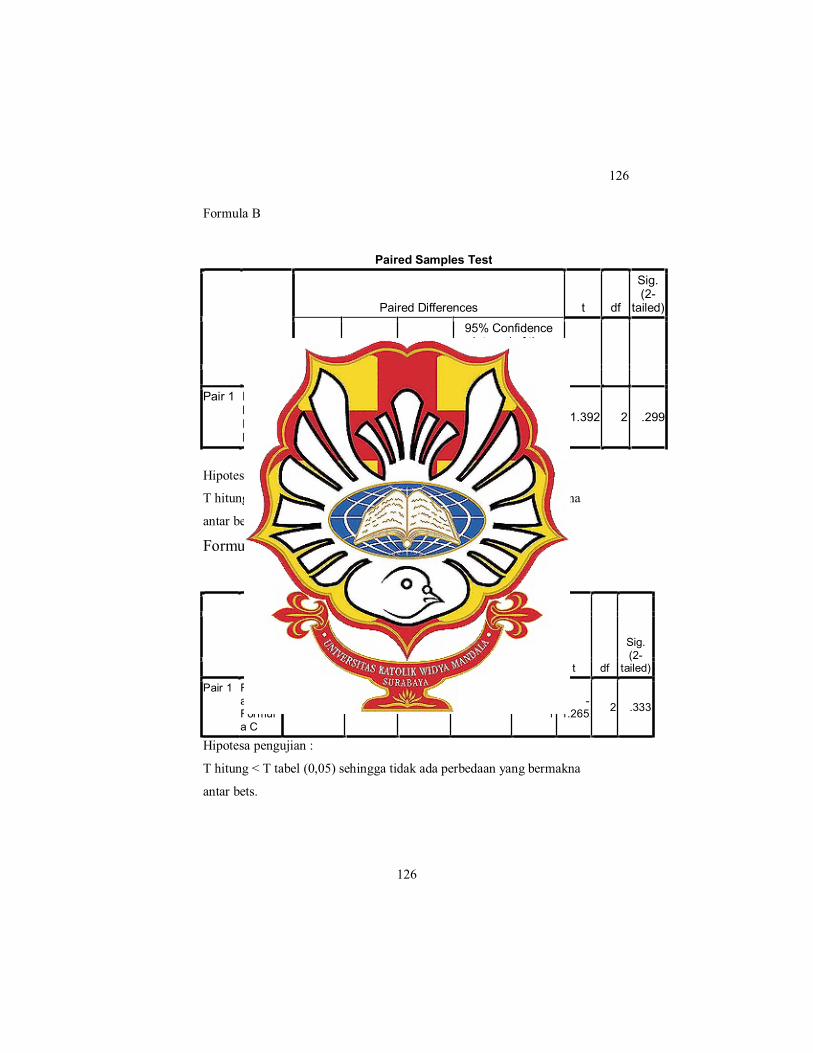
Hipotesa pengujian :
T hitung < T tabel (0,05) sehingga tidak ada perbedaan yang bermakna
antar bets.
Formula C
Hipotesa pengujian :
T hitung < T tabel (0,05) sehingga tidak ada perbedaan yang bermakna
antar bets.
Paired Samples Test
Paired Differences t df
Sig. (2-
tailed)
Mean Std.
Deviation Std. Error
Mean
95% Confidence Interval of the
Difference
Lower Upper
Pair 1 Formula B - Formula B
1.51000 1.87904 1.08487 -3.15780 6.17780 1.392 2 .299
Paired Samples Test
Paired Differences
t df
Sig. (2-
tailed)
Mean Std.
Deviation Std. Error
Mean
95% Confidence Interval of the
Difference
Lower Upper
Pair 1 Formula C - Formula C
-3.71333 5.08235 2.93429 -16.33858 8.91191
-1.265 2 .333
127
127
Formula D
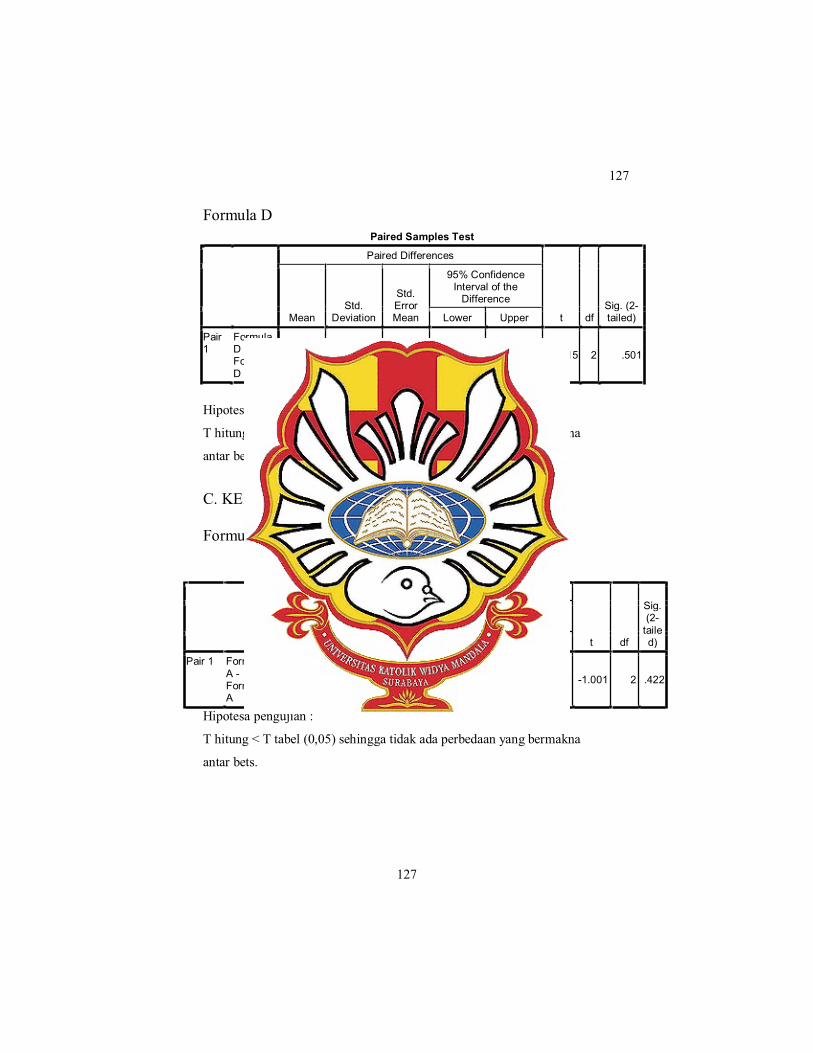
Hipotesa pengujian :
T hitung < T tabel (0,05) sehingga tidak ada perbedaan yang bermakna
antar bets.
C. KEKERASAN Formula A
Hipotesa pengujian :
T hitung < T tabel (0,05) sehingga tidak ada perbedaan yang bermakna
antar bets.
Paired Samples Test
Paired Differences
t df Sig. (2-tailed)
Mean Std.
Deviation
Std. Error Mean
95% Confidence Interval of the
Difference
Lower Upper
Pair 1
Formula D - Formula D
2.44667 5.19933 3.00183 -10.46919 15.36252 .815 2 .501
Paired Samples Test
Paired Differences
t df
Sig. (2-
tailed)
Mean Std.
Deviation Std. Error
Mean
95% Confidence Interval of the Difference
Lower Upper
Pair 1 Formula A - Formula A
-1.01620E2 175.88976 101.55000 -538.55439 335.31439 -1.001 2 .422

128
128
Formula B
Hipotesa pengujian :
T hitung < T tabel (0,05) sehingga tidak ada perbedaan yang bermakna antar bets
Hipotesa pengujian :
T hitung < T tabel (0,05) sehingga tidak ada perbedaan yang bermakna antar bets
Paired Samples Test
Paired Differences
t df
Sig. (2-
tailed)
Mean Std.
Deviation
Std. Error Mean
95% Confidence Interval of the
Difference
Lower Upper
Pair 1 Formula B - Formula B
.12333 .17926 .10349 -.32197 .56863 1.192 2 .356
Formula C Paired Samples Test
Paired Differences
t df
Sig. (2-
tailed)
Mean Std.
Deviation
Std. Error Mean
95% Confidence Interval of the
Difference
Lower Upper
Pair 1 Formula C - Formula C
-.39333 .78647 .45407 -2.34703 1.56036 -.866 2 .478
129
129
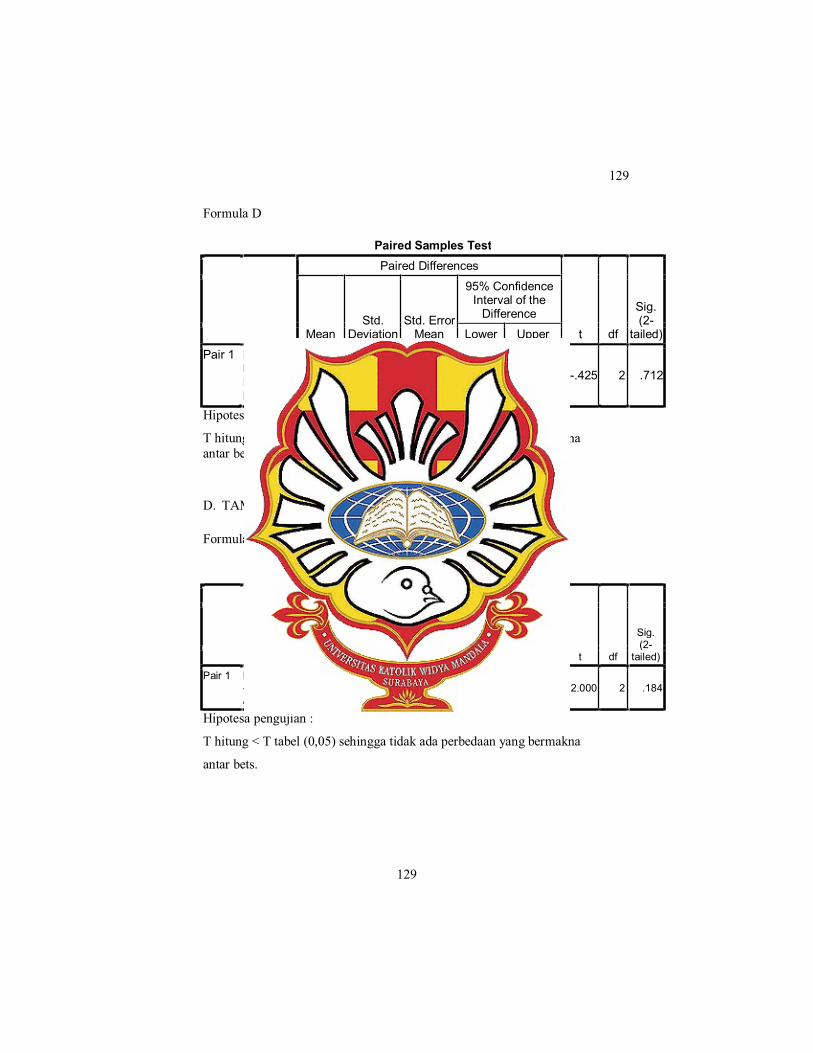
Formula D
Paired Samples Test Paired Differences
t df
Sig. (2-
tailed)
Mean Std.
Deviation Std. Error
Mean
95% Confidence Interval of the
Difference
Lower Upper
Pair 1 Formula D - Formula D
-.06000 .24434 .14107 -.66696 .54696 -.425 2 .712
Hipotesa pengujian :
T hitung < T tabel (0,05) sehingga tidak ada perbedaan yang bermakna antar bets
D. TAMPILAN VISUAL Formula A
Hipotesa pengujian :
T hitung < T tabel (0,05) sehingga tidak ada perbedaan yang bermakna
antar bets.
Paired Samples Test
Paired Differences
t df
Sig. (2-
tailed)
Mean Std.
Deviation Std. Error
Mean
95% Confidence Interval of the
Difference
Lower Upper
Pair 1 Formula A - Formula A
.66667 .57735 .33333 -.76755 2.10088 2.000 2 .184

130
130
Formula B
Hipotesa pengujian :
T hitung < T tabel (0,05) sehingga tidak ada perbedaan yang bermakna antar beta
Hipotesa pengujian :
T hitung < T tabel (0,05) sehingga tidak ada perbedaan yang bermakna antar bets
Formula C Paired Samples Test
Paired Differences
t df
Sig. (2-
tailed)
Mean Std.
Deviation Std. Error
Mean
95% Confidence Interval of the
Difference
Lower Upper
Pair 1 Formula C - Formula C
-.66667 .57735 .33333 -2.10088 .76755 -2.000 2 .184
Paired Samples Test
Paired Differences
t df
Sig. (2-
tailed)
Mean Std.
Deviation Std. Error
Mean
95% Confidence Interval of the
Difference
Lower Upper
Pair 1 Formula B - Formula B
.33333 .57735 .33333 -1.10088 1.76755 1.000 2 .423
131
131
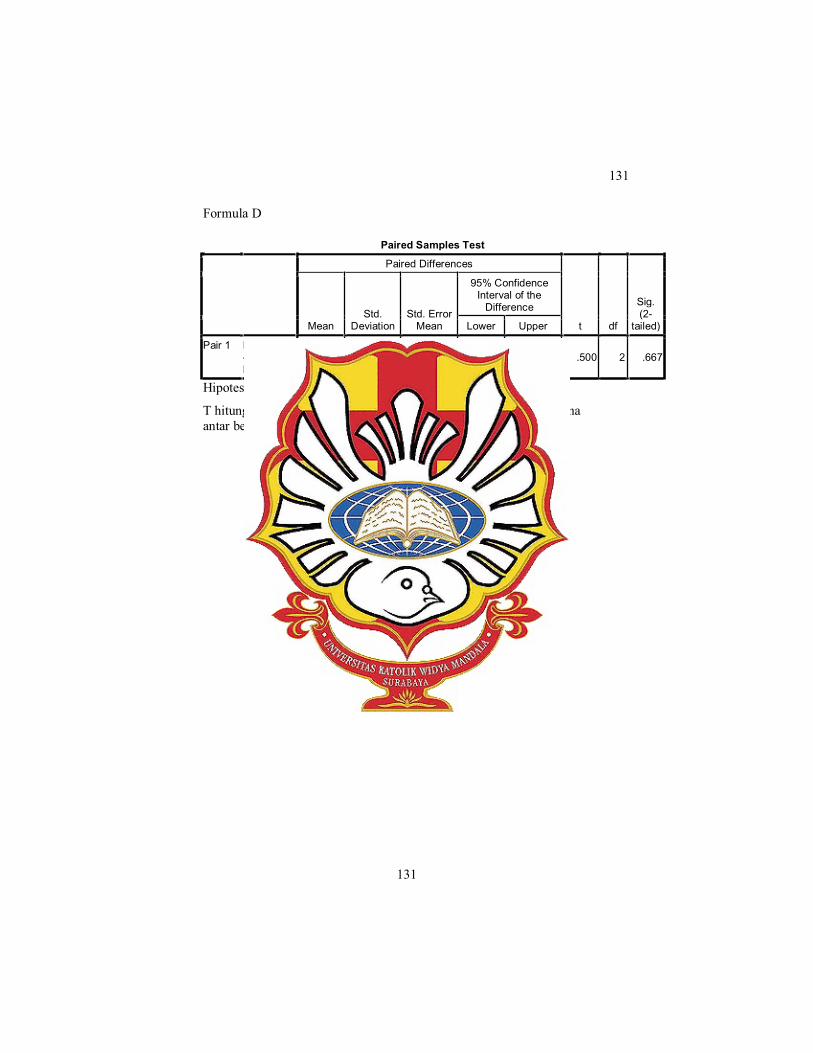
Formula D
Paired Samples Test
Paired Differences
t df
Sig. (2-
tailed)
Mean Std.
Deviation Std. Error
Mean
95% Confidence Interval of the
Difference
Lower Upper
Pair 1 Formula D - Formula D
.33333 1.15470 .66667 -2.53510 3.20177 .500 2 .667
Hipotesa pengujian :
T hitung < T tabel (0,05) sehingga tidak ada perbedaan yang bermakna antar bets

132
132
LAMPIRAN E
HASIL ANOVA SATU ARAH UJI TABLET SALUT ENTERIK EKSTRAK KELOPAK BUNGA ROSELLA
A. KESERAGAMAN BOBOT
ANOVA keseragaman bobot
Sum of Squares df Mean Square F Sig.
Between Groups .028 3 .009 2.718 .179 Within Groups .014 4 .003 Total .042 7
Tukey HSD
(I) formula (J) formula
Mean Difference
(I-J) Std.
Error Sig.
95% Confidence Interval
Lower Bound Upper Bound
Formula A Formula B .16500 .05884 .149 -.0745 .4045
Formula C .07500 .05884 .621 -.1645 .3145
Fotmula D .10500 .05884 .395 -.1345 .3445
Formula B Formula A -.16500 .05884 .149 -.4045 .0745
Formula C -.09000 .05884 .500 -.3295 .1495
Fotmula D -.06000 .05884 .749 -.2995 .1795
Formula C Formula A -.07500 .05884 .621 -.3145 .1645
Formula B .09000 .05884 .500 -.1495 .3295
Fotmula D .03000 .05884 .952 -.2095 .2695
Fotmula D Formula A -.10500 .05884 .395 -.3445 .1345
Formula B .06000 .05884 .749 -.1795 .2995
Formula C -.03000 .05884 .952 -.2695 .2095
Karena F hitung = 2,718 < F tabel 0,05(3,4) = 6,59; maka H0 diterima dan tidak
ada perbedaan yang bermakna antar formula.
133
133
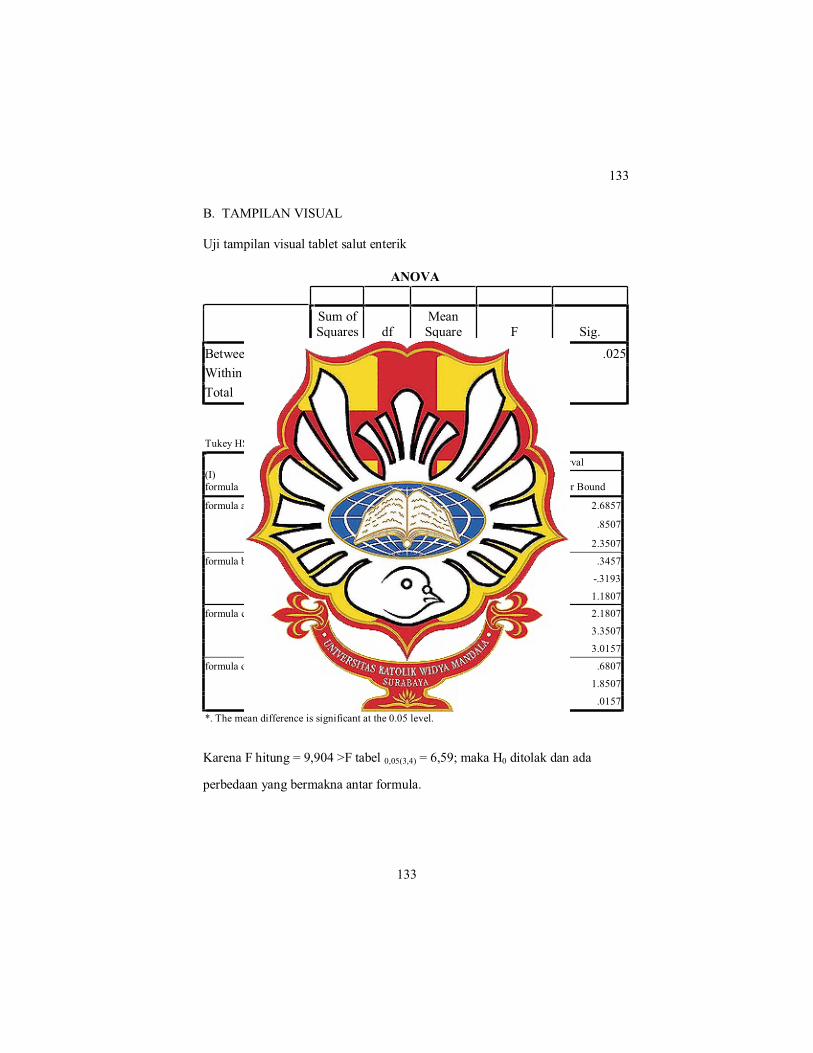
B. TAMPILAN VISUAL
Uji tampilan visual tablet salut enterik
ANOVA
Sum of Squares df
Mean Square F Sig.
Between Groups 4.119 3 1.373 9.904 .025 Within Groups .554 4 .139 Total 4.673 7 Tukey HSD
(I) formula
(J) formula
Mean Differenc
e (I-J) Std. Error Sig.
95% Confidence Interval
Lower Bound Upper Bound
formula a formula b 1.17000 .37232 .109 -.3457 2.6857
formula c -.66500 .37232 .395 -2.1807 .8507
formula d .83500 .37232 .255 -.6807 2.3507
formula b formula a -1.17000 .37232 .109 -2.6857 .3457
formula c -1.83500* .37232 .026 -3.3507 -.3193
formula d -.33500 .37232 .807 -1.8507 1.1807 formula c formula a .66500 .37232 .395 -.8507 2.1807
formula b 1.83500* .37232 .026 .3193 3.3507
formula d 1.50000 .37232 .052 -.0157 3.0157
formula d formula a -.83500 .37232 .255 -2.3507 .6807
formula b .33500 .37232 .807 -1.1807 1.8507
formula c -1.50000 .37232 .052 -3.0157 .0157 *. The mean difference is significant at the 0.05 level.
Karena F hitung = 9,904 >F tabel 0,05(3,4) = 6,59; maka H0 ditolak dan ada
perbedaan yang bermakna antar formula.

134
134
C. KEKERASAN
ANOVA
Sum of Squares df Mean Square F Sig.
Between Groups 1.430 3 .477 88.045 .000 Within Groups .022 4 .005 Total 1.451 7
Tukey HSD
formula N Subset for alpha = 0.05
1 2
formula b 2 97.1650 formula d 2 97.5000 97.5000 formula a 2 98.3350 98.3350 formula c 2 99.0000 Sig. .109 .052 Means for groups in homogeneous subsets are displayed.
135
135
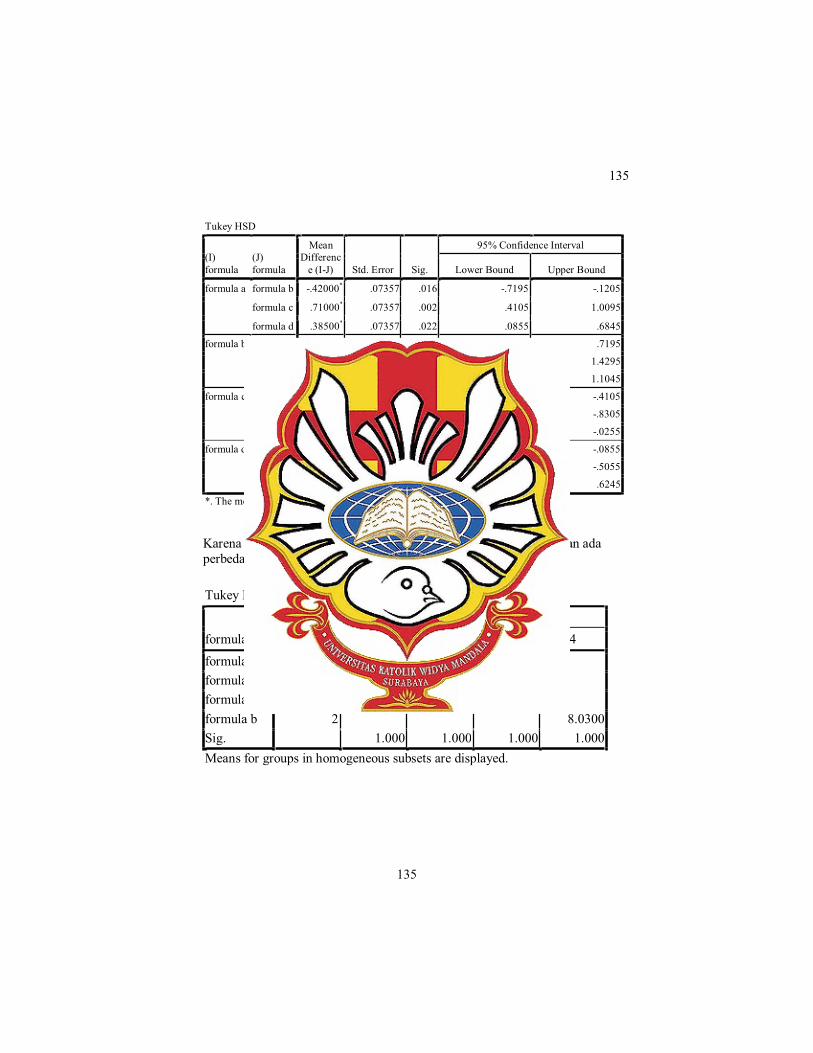
Tukey HSD
(I) formula
(J) formula
Mean Differenc
e (I-J) Std. Error Sig.
95% Confidence Interval
Lower Bound Upper Bound
formula a formula b -.42000* .07357 .016 -.7195 -.1205
formula c .71000* .07357 .002 .4105 1.0095
formula d .38500* .07357 .022 .0855 .6845
formula b formula a .42000* .07357 .016 .1205 .7195
formula c 1.13000* .07357 .000 .8305 1.4295
formula d .80500* .07357 .001 .5055 1.1045
formula c formula a -.71000* .07357 .002 -1.0095 -.4105
formula b -1.13000* .07357 .000 -1.4295 -.8305
formula d -.32500* .07357 .038 -.6245 -.0255
formula d formula a -.38500* .07357 .022 -.6845 -.0855
formula b -.80500* .07357 .001 -1.1045 -.5055
formula c .32500* .07357 .038 .0255 .6245 *. The mean difference is significant at the 0.05 level.
Karena F hitung = 88,045 > F tabel 0,05(3,7) = 4,35; maka H0 ditolak dan ada perbedaan yang bermakna antar formula Tukey HSD
formula N
Subset for alpha = 0.05
1 2 3 4
formula c 2 6.9000 formula d 2 7.2250 formula a 2 7.6100 formula b 2 8.0300 Sig. 1.000 1.000 1.000 1.000 Means for groups in homogeneous subsets are displayed.
136
136
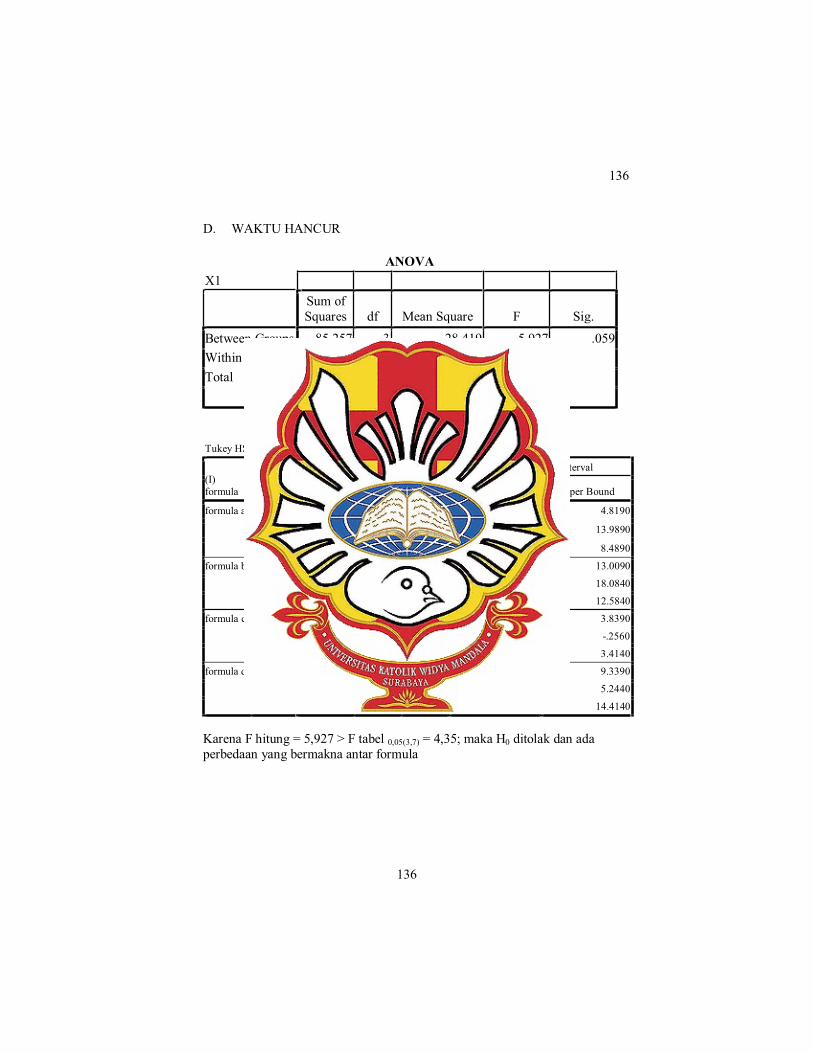
D. WAKTU HANCUR
ANOVA X1
Sum of Squares df Mean Square F Sig.
Between Groups 85.257 3 28.419 5.927 .059 Within Groups 19.179 4 4.795 Total 104.436 7 Tukey HSD
(I) formula
(J) formula
Mean Difference
(I-J) Std. Error Sig.
95% Confidence Interval
Lower Bound Upper Bound
formula a formula b -4.09500 2.18971 .365 -13.0090 4.8190
formula c 5.07500 2.18971 .237 -3.8390 13.9890
formula d -.42500 2.18971 .997 -9.3390 8.4890
formula b formula a 4.09500 2.18971 .365 -4.8190 13.0090
formula c 9.17000* 2.18971 .046 .2560 18.0840
formula d 3.67000 2.18971 .438 -5.2440 12.5840
formula c formula a -5.07500 2.18971 .237 -13.9890 3.8390
formula b -9.17000* 2.18971 .046 -18.0840 -.2560
formula d -5.50000 2.18971 .197 -14.4140 3.4140
formula d formula a .42500 2.18971 .997 -8.4890 9.3390
formula b -3.67000 2.18971 .438 -12.5840 5.2440
formula c 5.50000 2.18971 .197 -3.4140 14.4140 Karena F hitung = 5,927 > F tabel 0,05(3,7) = 4,35; maka H0 ditolak dan ada perbedaan yang bermakna antar formula
137
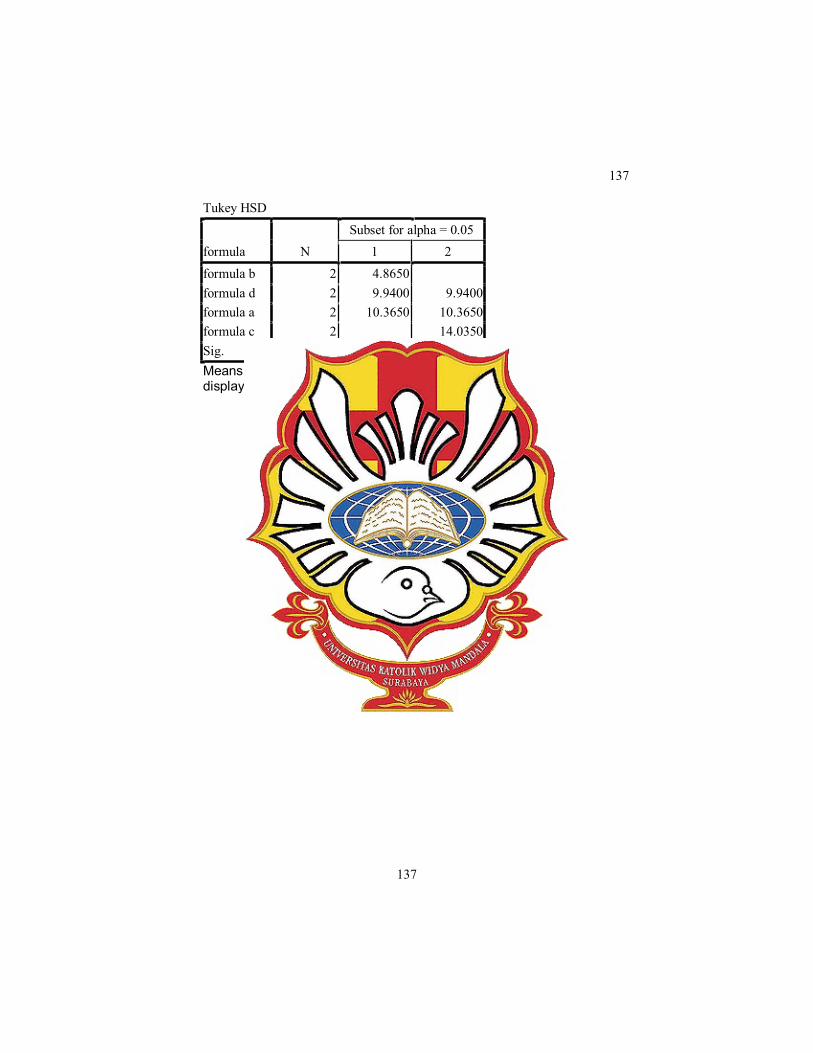
137
Tukey HSD
formula N Subset for alpha = 0.05
1 2
formula b 2 4.8650 formula d 2 9.9400 9.9400 formula a 2 10.3650 10.3650 formula c 2 14.0350 Sig. .197 .365 Means for groups in homogeneous subsets are displayed.

139
LA
MPI
RA
N F
HA
SIL
AN
OV
A S
AT
U A
RA
H U
JI W
AK
TU
HA
NC
UR
PA
DA
PR
OG
RA
M D
ESI
GN
EX
PER
T
R
espo
nse
1 w
aktu
han
cur
A
NO
VA
for
sele
cted
fact
oria
l mod
el
A
naly
sis
of v
aria
nce
tabl
e [P
artia
l sum
of s
quar
es -
Typ
e II
I]
Sum
of
M
ean
F p-
valu
e
Sour
ce
Squa
res
df
Squa
re
Val
ue
Prob
> F
Mod
el10
9.95
3
36.6
5 20
4.16
<
0.00
01
sign
ifica
nt
A
-HPM
CP
84.1
1 1
84.1
1 46
8.52
<
0.0
001
B
-Glis
erol
14
.42
1 14
.42
80.3
1 0.
0009
AB1
1.42
1
11.4
2 63
.64
0.00
13
Pu
re E
rror
0.
72
4 0.
18
C
or T
otal
11
0.67
7
Th
e M
odel
F-v
alue
of 2
04.1
6 im
plie
s the
mod
el is
sign
ifica
nt.
Ther
e is
onl
y
a 0.
01%
cha
nce
that
a "
Mod
el F
-Val
ue" t
his l
arge
cou
ld o
ccur
due
to n
oise
.
Val
ues o
f "Pr
ob >
F" l
ess t
han
0.05
00 in
dica
te m
odel
term
s are
sign
ifica
nt.
In th
is c
ase
A, B
, AB
are
sign
ifica
nt m
odel
term
s.
V
alue
s gre
ater
than
0.1
000
indi
cate
the
mod
el te
rms a
re n
ot si
gnifi
cant
.
If
ther
e ar
e m
any
insi
gnifi
cant
mod
el te
rms (
not c
ount
ing
thos
e re
quire
d to
supp
ort h
iera
rchy
),
m
odel
redu
ctio
n m
ay im
prov
e yo
ur m
odel
.
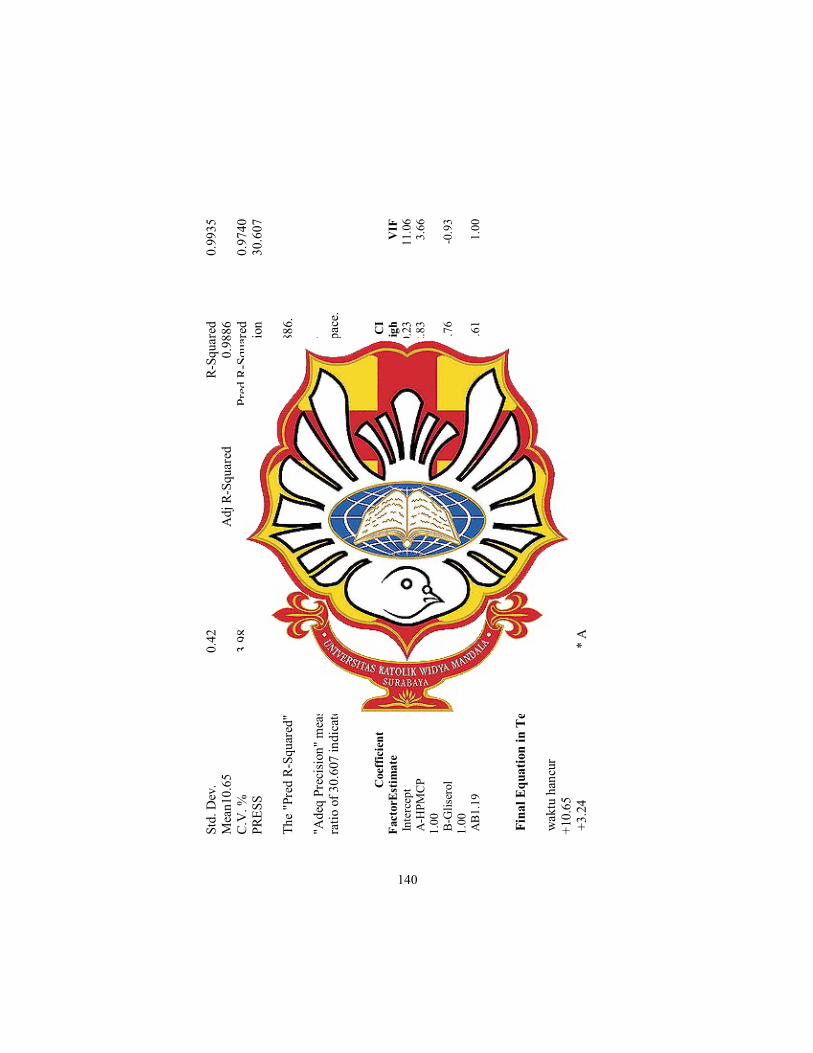
140
St
d. D
ev.
0.42
R-Sq
uare
d 0.
9935
Mea
n10.
65
A
dj R
-Squ
ared
0.
9886
C.V
. %
3.98
Pred
R-S
quar
ed
0.97
40
PR
ESS
2.87
Ade
q Pr
ecis
ion
30.6
07
Th
e "P
red
R-Sq
uare
d" o
f 0.9
740
is in
reas
onab
le a
gree
men
t with
the
"Adj
R-S
quar
ed" o
f 0.9
886.
"Ade
q Pr
ecis
ion"
mea
sure
s the
sign
al to
noi
se ra
tio.
A ra
tio g
reat
er th
an 4
is d
esira
ble.
You
r
ratio
of 3
0.60
7 in
dica
tes a
n ad
equa
te si
gnal
. Th
is m
odel
can
be
used
to n
avig
ate
the
desi
gn sp
ace.
C
oeff
icie
nt
St
anda
rd
95%
CI
95%
CI
Fa
ctor
Estim
ate
df
Erro
r Lo
w
Hig
h V
IF
In
terc
ept
10.6
5 1
0.15
10
.23
11.0
6
A-H
PMC
P 3.
24
1 0.
15
2.83
3.
66
1.00
B-G
liser
ol
-1.3
4 1
0.15
-1
.76
-0.9
3
1.00
AB1
.19
1 0.
15
0.78
1.
61
1.00
Fin
al E
quat
ion
in T
erm
s of C
oded
Fac
tors
:
wak
tu h
ancu
r =
+10.
65
+
3.24
*
A

141
-
1.34
*
B
+
1.19
*
A *
B
F
inal
Equ
atio
n in
Ter
ms o
f Act
ual F
acto
rs:
w
aktu
han
cur
=
+1
0.64
500
+3
.242
50
* H
PMC
P
-1.3
4250
*
Glis
erol
+1.1
9500
*
HPM
CP
* G
liser
ol
T
he D
iagn
ostic
s Cas
e St
atis
tics R
epor
t has
bee
n m
oved
to th
e D
iagn
ostic
s Nod
e.
In
the
Dia
gnos
tics N
ode,
Sel
ect C
ase
Stat
istic
s fro
m th
e V
iew
Men
u.
Pr
ocee
d to
Dia
gnos
tic P
lots
(the
nex
t ico
n in
pro
gres
sion
). B
e su
re to
look
at t
he:
1) N
orm
al p
roba
bilit
y pl
ot o
f the
stud
entiz
ed re
sidu
als t
o ch
eck
for n
orm
ality
of r
esid
uals
.
2)
Stu
dent
ized
resi
dual
s ver
sus p
redi
cted
val
ues t
o ch
eck
for c
onst
ant e
rror
.
3)
Ext
erna
lly S
tude
ntiz
ed R
esid
uals
to lo
ok fo
r out
liers
, i.e
., in
fluen
tial v
alue
s.
4)
Box
-Cox
plo
t for
pow
er tr
ansf
orm
atio
ns.
If
all t
he m
odel
stat
istic
s and
dia
gnos
tic p
lots
are
OK
, fin
ish u
p w
ith th
e M
odel
Gra
phs i
con.

142
LA
MPI
RA
N G
HA
SIL
AN
OV
A S
AT
U A
RA
H U
JI K
EKE
RA
SAN
PA
DA
PR
OG
RA
M D
ESI
GN
EX
PER
T
R
espo
nse
2 ke
kera
san
A
NO
VA
for
sele
cted
fact
oria
l mod
el
A
naly
sis o
f var
ianc
e ta
ble
[Par
tial s
um o
f squ
ares
- Ty
pe II
I]
Sum
of
M
ean
F p-
valu
e
Sour
ce
Squa
res
df
Squa
re
Val
ue
Prob
> F
Mod
el1.
43
3 0.
48
88.0
5 0.
0004
si
gnifi
cant
A-H
PMCP
0.
28
1 0.
28
51.2
7 0.
0020
B-G
liser
ol
1.15
1
1.15
21
2.03
0.
0001
AB4
.512
E-00
3 1
4.51
2E-0
03
0.83
0.
4129
Pure
Err
or
0.02
2 4
5.41
2E-0
03
C
or T
otal
1.
45
7
The
Mod
el F
-val
ue o
f 88.
05 im
plie
s the
mod
el is
sign
ifica
nt.
Ther
e is
onl
y
a 0.
04%
cha
nce
that
a "
Mod
el F
-Val
ue" t
his l
arge
cou
ld o
ccur
due
to n
oise
.
Val
ues o
f "Pr
ob >
F" l
ess t
han
0.05
00 in
dica
te m
odel
term
s are
sign
ifica
nt.
In th
is c
ase
A, B
are
sign
ifica
nt m
odel
term
s.
V
alue
s gre
ater
than
0.1
000
indi
cate
the
mod
el te
rms a
re n
ot si
gnifi
cant
.
If
ther
e ar
e m
any
insi
gnifi
cant
mod
el te
rms (
not c
ount
ing
thos
e re
quire
d to
supp
ort h
iera
rchy
),
m
odel
redu
ctio
n m
ay im
prov
e yo
ur m
odel
.
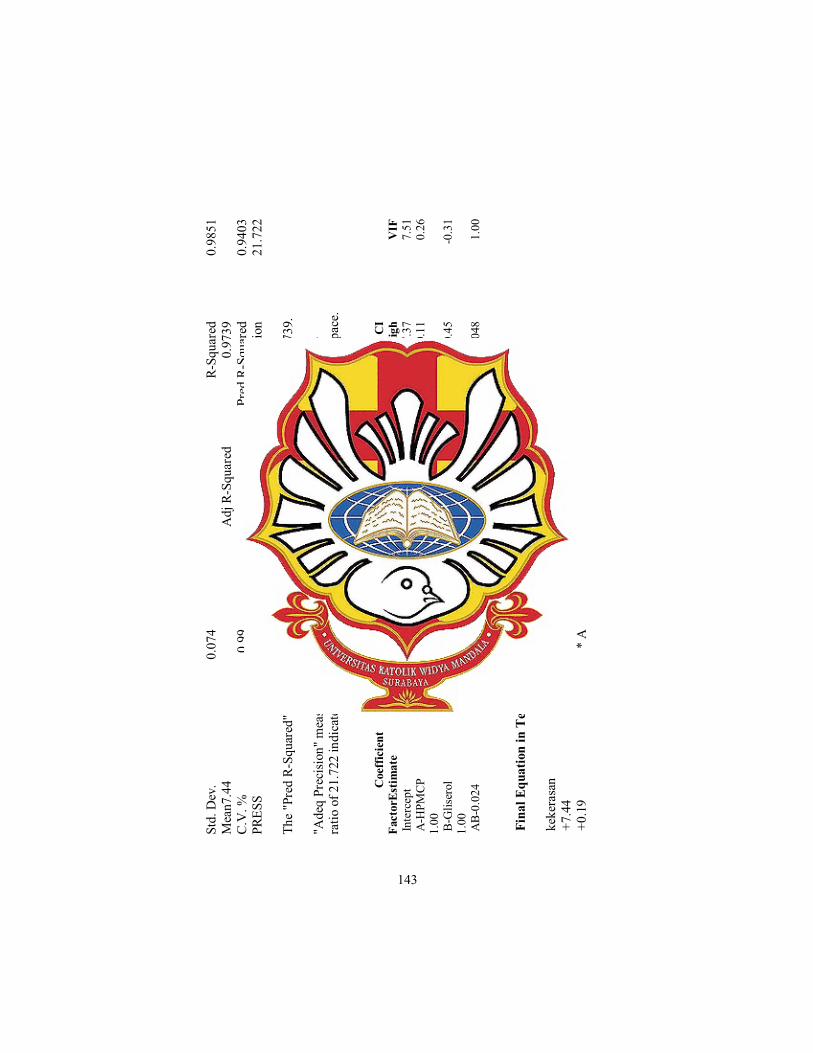
143
St
d. D
ev.
0.07
4
R-Sq
uare
d 0.
9851
Mea
n7.4
4
Adj
R-S
quar
ed
0.97
39
C
.V. %
0.
99
Pr
ed R
-Squ
ared
0.
9403
PRES
S 0.
087
A
deq
Prec
isio
n 21
.722
The
"Pre
d R-
Squa
red"
of 0
.940
3 is
in re
ason
able
agr
eem
ent w
ith th
e "A
dj R
-Squ
ared
" of 0
.973
9.
"A
deq
Prec
isio
n" m
easu
res t
he si
gnal
to n
oise
ratio
. A
ratio
gre
ater
than
4 is
des
irabl
e. Y
our
ra
tio o
f 21.
722
indi
cate
s an
adeq
uate
sign
al.
This
mod
el c
an b
e us
ed to
nav
igat
e th
e de
sign
spac
e.
Coe
ffic
ient
Stan
dard
95
% C
I 95
% C
I
Fact
orEs
timat
e df
Er
ror
Low
H
igh
VIF
Inte
rcep
t 7.
44
1 0.
026
7.37
7.
51
A
-HPM
CP
0.19
1
0.02
6 0.
11
0.26
1.
00
B
-Glis
erol
-0
.38
1 0.
026
-0.4
5 -0
.31
1.
00
A
B-0.
024
1 0.
026
-0.0
96
0.04
8 1.
00
F
inal
Equ
atio
n in
Ter
ms o
f Cod
ed F
acto
rs:
k
eker
asan
=
+7.
44
+
0.19
*
A

144
-
0.38
*
B
-0
.024
*
A *
B
F
inal
Equ
atio
n in
Ter
ms o
f Act
ual F
acto
rs:
k
eker
asan
=
+7.4
4125
+0.1
8625
*
HPM
CP
-0
.378
75
* G
liser
ol
-0
.023
750
* H
PMC
P *
Glis
erol
The
Dia
gnos
tics C
ase
Stat
istic
s Rep
ort h
as b
een
mov
ed to
the
Dia
gnos
tics N
ode.
In th
e D
iagn
ostic
s Nod
e, S
elec
t Cas
e St
atis
tics f
rom
the
Vie
w M
enu.
Proc
eed
to D
iagn
ostic
Plo
ts (t
he n
ext i
con
in p
rogr
essi
on).
Be
sure
to lo
ok a
t the
:
1)
Nor
mal
pro
babi
lity
plot
of t
he st
uden
tized
resi
dual
s to
chec
k fo
r nor
mal
ity o
f res
idua
ls.
2) S
tude
ntiz
ed re
sidu
als v
ersu
s pre
dict
ed v
alue
s to
chec
k fo
r con
stan
t err
or.
3) E
xter
nally
Stu
dent
ized
Res
idua
ls to
look
for o
utlie
rs, i
.e.,
influ
entia
l val
ues.
4) B
ox-C
ox p
lot f
or p
ower
tran
sfor
mat
ions
.
If al
l the
mod
el st
atis
tics a
nd d
iagn
ostic
plo
ts a
re O
K, f
inish
up
with
the
Mod
el G
raph
s ico
n.
Ano
va R
espo
n K
eser
agam
an B
obot
Pro
gram
Des
ign
Expe
rt
145
LA
MPI
RA
N H
HA
SIL
AN
OV
A S
AT
U A
RA
H U
JI K
ESE
RA
GA
MA
N B
OB
OT
PA
DA
PR
OG
RA
M D
ESI
GN
EX
PER
T
R
espo
nse
3 ke
sera
gam
an b
obot
AN
OV
A fo
r se
lect
ed fa
ctor
ial m
odel
Ana
lysis
of v
aria
nce
tabl
e [P
artia
l sum
of s
quar
es -
Type
III]
Su
m o
f
Mea
n F
p-va
lue
So
urce
Sq
uare
s df
Sq
uare
V
alue
Pr
ob >
F
M
odel
0.02
8 3
9.41
2E-0
03
2.72
0.
1792
no
t sig
nific
ant
A
-HPM
CP
0.01
9 1
0.01
9 5.
49
0.07
91
B
-Glis
erol
1.
125E
-004
1
1.12
5E-0
04
0.03
2 0.
8657
AB9
.113
E-00
3 1
9.11
3E-0
03
2.63
0.
1801
Pure
Err
or
0.01
4 4
3.46
3E-0
03
C
or T
otal
0.
042
7
The
"Mod
el F
-val
ue"
of 2
.72
impl
ies t
he m
odel
is n
ot si
gnifi
cant
rela
tive
to th
e no
ise.
The
re is
a
17
.92
% c
hanc
e th
at a
"M
odel
F-v
alue
" th
is la
rge
coul
d oc
cur d
ue to
noi
se.
V
alue
s of "
Prob
> F
" les
s tha
n 0.
0500
indi
cate
mod
el te
rms a
re si
gnifi
cant
.
In
this
cas
e th
ere
are
no si
gnifi
cant
mod
el te
rms.
Val
ues g
reat
er th
an 0
.100
0 in
dica
te th
e m
odel
term
s are
not
sign
ifica
nt.
If th
ere
are
man
y in
sign
ifica
nt m
odel
term
s (no
t cou
ntin
g th
ose
requ
ired
to su
ppor
t hie
rarc
hy),
mod
el re
duct
ion
may
impr
ove
your
mod
el.

146
St
d. D
ev.
0.05
9
R-Sq
uare
d 0.
6709
Mea
n312
.15
A
dj R
-Squ
ared
0.
4241
C.V
. %
0.01
9
Pred
R-S
quar
ed
-0.3
163
PR
ESS
0.05
5
Ade
q Pr
ecis
ion
3.96
6
A n
egat
ive
"Pre
d R-
Squa
red"
impl
ies t
hat t
he o
vera
ll m
ean
is a
bette
r pre
dict
or o
f you
r
resp
onse
than
the
curr
ent m
odel
.
"Ade
q Pr
ecis
ion"
mea
sure
s the
sign
al to
noi
se ra
tio.
A ra
tio o
f 3.9
7 in
dica
tes a
n in
adeq
uate
sign
al a
nd w
e sh
ould
not
use
this
mod
el to
nav
igat
e th
e de
sign
spac
e.
Coe
ffic
ient
Stan
dard
95
% C
I 95
% C
I
Fact
orEs
timat
e df
Er
ror
Low
H
igh
VIF
Inte
rcep
t 31
2.15
1
0.02
1 31
2.09
31
2.21
A-H
PMC
P -0
.049
1
0.02
1 -0
.11
9.01
2E-0
03
1.00
B-G
liser
ol
-3.7
50E-
003
1 0.
021
-0.0
62
0.05
4
1.00
AB0
.034
1
0.02
1 -0
.024
0.
092
1.00
Fin
al E
quat
ion
in T
erm
s of C
oded
Fac
tors
:
kes
erag
aman
bob
ot
=
+3
12.1
5
-0.0
49
* A

147
-3
.750
E-00
3 *
B
+0
.034
*
A *
B
F
inal
Equ
atio
n in
Ter
ms o
f Act
ual F
acto
rs:
k
eser
agam
an b
obot
=
+312
.148
75
-0
.048
750
* H
PMC
P
-3.7
5000
E-00
3 *
Glis
erol
+0.0
3375
0 *
HPM
CP
* G
liser
ol
T
he D
iagn
ostic
s Cas
e St
atis
tics R
epor
t has
bee
n m
oved
to th
e D
iagn
ostic
s Nod
e.
In
the
Dia
gnos
tics N
ode,
Sel
ect C
ase
Stat
istic
s fro
m th
e V
iew
Men
u.
Pr
ocee
d to
Dia
gnos
tic P
lots
(the
nex
t ico
n in
pro
gres
sion
). B
e su
re to
look
at t
he:
1) N
orm
al p
roba
bilit
y pl
ot o
f the
stud
entiz
ed re
sidu
als t
o ch
eck
for n
orm
ality
of r
esid
uals
.
2)
Stu
dent
ized
resi
dual
s ver
sus p
redi
cted
val
ues t
o ch
eck
for c
onst
ant e
rror
.
3)
Ext
erna
lly S
tude
ntiz
ed R
esid
uals
to lo
ok fo
r out
liers
, i.e
., in
fluen
tial v
alue
s.
4)
Box
-Cox
plo
t for
pow
er tr
ansf
orm
atio
ns.
If
all t
he m
odel
stat
istic
s and
dia
gnos
tic p
lots
are
OK
, fin
ish u
p w
ith th
e M
odel
Gra
phs i
con.
148
LA
MPI
RA
N I
HA
SIL
AN
OV
A S
AT
U A
RA
H U
JI T
AM
PIL
AN
VIS
UA
L P
AD
A P
RO
GR
AM
DE
SIG
N E
XPE
RT
R
espo
nse
4 vi
sual
AN
OV
A fo
r se
lect
ed fa
ctor
ial m
odel
Ana
lysis
of v
aria
nce
tabl
e [P
artia
l sum
of s
quar
es -
Type
III]
Su
m o
f
Mea
n F
p-va
lue
So
urce
Sq
uare
s df
Sq
uare
V
alue
Pr
ob >
F
M
odel
4.12
3
1.37
9.
90
0.02
53
sign
ifica
nt
A
-HPM
CP
3.56
1
3.56
25
.71
0.00
71
B
-Glis
erol
0.
50
1 0.
50
3.61
0.
1304
AB0
.054
1
0.05
4 0.
39
0.56
48
Pu
re E
rror
0.
55
4 0.
14
C
or T
otal
4.
67
7
The
Mod
el F
-val
ue o
f 9.9
0 im
plie
s the
mod
el is
sign
ifica
nt.
Ther
e is
onl
y
a 2.
53%
cha
nce
that
a "
Mod
el F
-Val
ue" t
his l
arge
cou
ld o
ccur
due
to n
oise
.
Val
ues o
f "Pr
ob >
F" l
ess t
han
0.05
00 in
dica
te m
odel
term
s are
sign
ifica
nt.
In th
is c
ase
A a
re si
gnifi
cant
mod
el te
rms.
Val
ues g
reat
er th
an 0
.100
0 in
dica
te th
e m
odel
term
s are
not
sign
ifica
nt.
If th
ere
are
man
y in
sign
ifica
nt m
odel
term
s (no
t cou
ntin
g th
ose
requ
ired
to su
ppor
t hie
rarc
hy),
mod
el re
duct
ion
may
impr
ove
your
mod
el.

149
St
d. D
ev.
0.37
R-Sq
uare
d 0.
8813
Mea
n98.
00
A
dj R
-Squ
ared
0.
7924
C.V
. %
0.38
Pred
R-S
quar
ed
0.52
54
PR
ESS
2.22
Ade
q Pr
ecis
ion
6.97
0
The
"Pre
d R-
Squa
red"
of 0
.525
4 is
not
as c
lose
to th
e "A
dj R
-Squ
ared
" of
0.7
924
as o
ne m
ight
norm
ally
exp
ect.
Thi
s may
indi
cate
a la
rge
bloc
k ef
fect
or a
pos
sibl
e pr
oble
m w
ith y
our m
odel
and/
or d
ata.
Thi
ngs t
o co
nsid
er a
re m
odel
redu
ctio
n, re
spon
se tr
ansf
orm
atio
n, o
utlie
rs, e
tc.
"A
deq
Prec
isio
n" m
easu
res t
he si
gnal
to n
oise
ratio
. A
ratio
gre
ater
than
4 is
des
irabl
e. Y
our
ra
tio o
f 6.9
70 in
dica
tes a
n ad
equa
te si
gnal
. Th
is m
odel
can
be
used
to n
avig
ate
the
desi
gn sp
ace.
C
oeff
icie
nt
St
anda
rd
95%
CI
95%
CI
Fa
ctor
Estim
ate
df
Erro
r Lo
w
Hig
h V
IF
In
terc
ept
98.0
0 1
0.13
97
.63
98.3
7
A-H
PMC
P -0
.67
1 0.
13
-1.0
3 -0
.30
1.
00
B
-Glis
erol
0.
25
1 0.
13
-0.1
2 0.
62
1.00
AB-
0.08
2 1
0.13
-0
.45
0.28
1.
00
F
inal
Equ
atio
n in
Ter
ms o
f Cod
ed F
acto
rs:
v
isua
l =
+98.
00
-
0.67
*
A

150
+
0.25
*
B
-0
.082
*
A *
B
F
inal
Equ
atio
n in
Ter
ms o
f Act
ual F
acto
rs:
v
isua
l =
+98.
0000
0
-0.6
6750
*
HPM
CP
+0
.250
00
* G
liser
ol
-0
.082
500
* H
PMC
P *
Glis
erol
The
Dia
gnos
tics C
ase
Stat
istic
s Rep
ort h
as b
een
mov
ed to
the
Dia
gnos
tics N
ode.
In th
e D
iagn
ostic
s Nod
e, S
elec
t Cas
e St
atis
tics f
rom
the
Vie
w M
enu.
Proc
eed
to D
iagn
ostic
Plo
ts (t
he n
ext i
con
in p
rogr
essi
on).
Be
sure
to lo
ok a
t the
:
1)
Nor
mal
pro
babi
lity
plot
of t
he st
uden
tized
resi
dual
s to
chec
k fo
r nor
mal
ity o
f res
idua
ls.
2) S
tude
ntiz
ed re
sidu
als v
ersu
s pre
dict
ed v
alue
s to
chec
k fo
r con
stan
t err
or.
3) E
xter
nally
Stu
dent
ized
Res
idua
ls to
look
for o
utlie
rs, i
.e.,
influ
entia
l val
ues.
4) B
ox-C
ox p
lot f
or p
ower
tran
sfor
mat
ions
.
If al
l the
mod
el st
atis
tics a
nd d
iagn
ostic
plo
ts a
re O
K, f
inish
up
with
the
Mod
el G
raph
s ico
n.

151
151
LAMPIRAN J
RANGKUMAN HASIL PREDIKSI BERDASARKAN PROGRAM DESIGN EXPERT
Number HPMCP gliserol waktu hancur kekerasan keseragaman bobot tampilan visual 1 -1.00 -1.00 9.94 7.61 312.235 98.335 2 -1.00 1.00 4.865 6.9 312.16 99 3 0.20 -0.80 12.1763 7.7853 312.137 97.6797 4 0.75 0.90 12.6753 7.22403 312.132 97.6687 5 -0.99 0.11 7.14274 7.21699 312.193 98.7002 6 -0.26 0.49 8.98397 7.2093 312.155 98.308 7 0.15 -0.54 11.7618 7.67436 312.141 97.7708 8 -0.38 0.07 9.28464 7.3443 312.166 98.2738 9 -0.65 0.76 6.919 7.04393 312.161 98.666
10 0.59 0.52 12.2399 7.34568 312.128 97.7088 11 0.77 0.50 12.9253 7.38641 312.122 97.5801 12 0.19 -0.92 12.2931 7.83025 312.137 97.6561 13 0.16 0.54 10.5352 7.26524 312.142 98.0222 14 0.19 0.72 10.4553 7.20003 312.141 98.0424 15 -0.74 -0.48 9.33387 7.47912 312.199 98.341 16 0.58 0.86 11.9529 7.20935 312.134 97.7896 17 0.48 -0.58 12.6468 7.75813 312.118 97.5576 18 -0.88 0.46 6.68848 7.11193 312.176 98.7358 19 -0.74 -0.90 10.2447 7.62732 312.21 98.214 20 -0.35 -0.59 10.5492 7.59516 312.175 98.0694 21 0.53 0.81 11.8041 7.22362 312.134 97.8107 22 -0.06 -0.90 11.717 7.76861 312.157 97.812 23 -0.66 -0.49 9.54396 7.49517 312.194 98.292 24 0.07 0.46 10.2716 7.27762 312.145 98.0696 25 -0.63 0.46 7.6206 7.15495 312.168 98.5625 26 -0.73 -0.95 10.3815 7.64795 312.211 98.1914 27 -0.20 -0.64 11.0139 7.64339 312.165 97.9614 28 0.50 -0.43 12.5761 7.70277 312.119 97.5788 29 -0.38 -0.33 10.0027 7.49255 312.173 98.1616 30 0.70 0.83 12.4845 7.24365 312.131 97.6939 31 -0.83 0.05 7.83461 7.26803 312.188 98.5701 32 -0.27 0.28 9.29144 7.28658 312.158 98.2588 33 0.45 0.04 12.0759 7.51039 312.127 97.7072 34 -0.43 -0.55 10.261 7.56294 312.18 98.1325
152
152
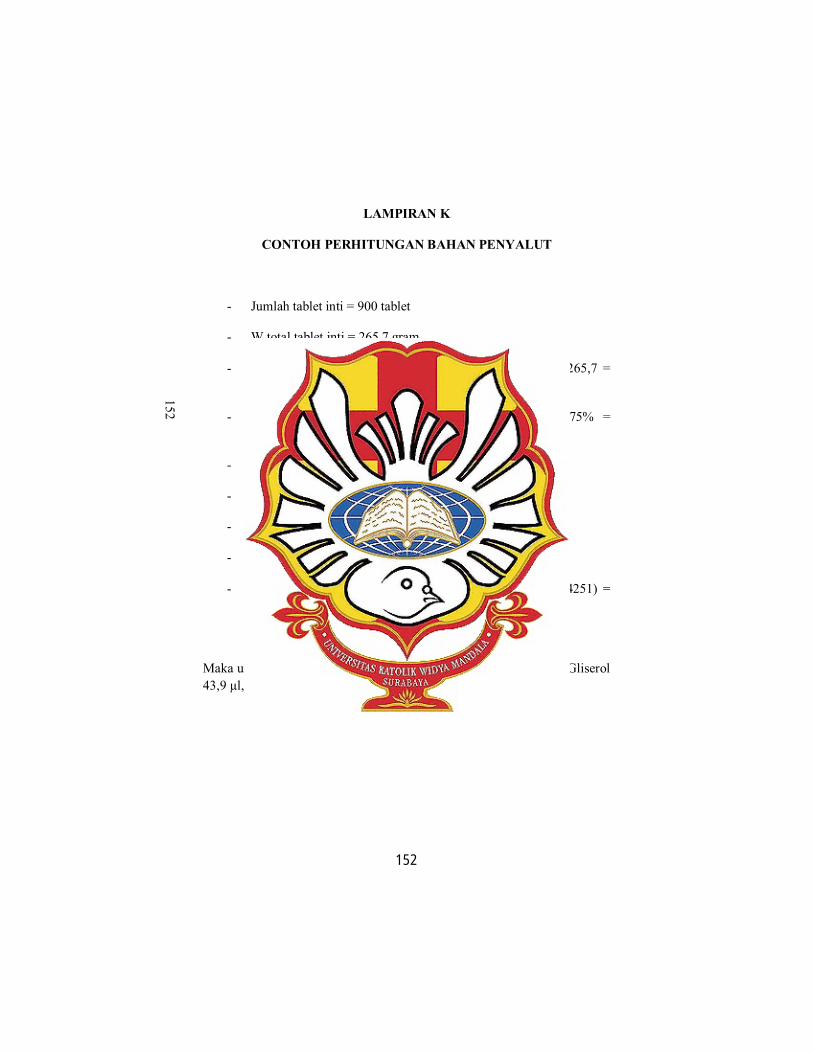
LAMPIRAN K
CONTOH PERHITUNGAN BAHAN PENYALUT
- Jumlah tablet inti = 900 tablet
- W total tablet inti = 265,7 gram
- W HPMCP (dengan pertambahan bobot 4%) = 4/100 x 265,7 = 10,628 gram
- Vol pelarut campuran dengan konsentrasi HPMCP 9,75% = 100/9,75 x 10,628 = 109,0051 ml
- Jumlah plastisaiser = 0,52/200 x 10,628 = 0,0553 gram
- BJ plastisaiser = 1,26 g/ml
- Volume plastisai
- Jumlah talk (4%) = 4/100 x 10,628 = 0,4251 gram
- % pelarut campuran = 109,0051 – (10,628 +0,0553 + 0,4251) = 97,8967 ml
Maka untuk 900 tablet dibutuhkan HPMCP sebanyak 10,628 gram, Gliserol dan pelarut campuran 97,8967 ml.

153
153
LAMPIRAN L
CONTOH PERHITUNGAN KONVERSI DOSIS EKSTRAK KELOPAK BUNGA ROSELLA
Perbandingan ekstrak jadi natura : pengisi (7 : 1)
Dosis acuan 250 mg ekstrak terstandarisasi (Hudson, 2011).
Berat tablet 300 mg
Perhitungan konversi :
8/7 x 150 = 171,42 mg
Jadi berat ekstrak dari PT. Natura Laboratoria yang harus ditimbang untuk jumlah per tablet yaitu
= 171,42 mg

154
154
LAMPIRAN M
SERTIFIKAT ANALISIS EKSTRAK KERING ROSELLA dari PT. NATURA

155
155
LAMPIRAN N
SERTIFIKAT ANALISIS KALSIUM FOSFAT DIBASIK ANHIDRAT
156
156
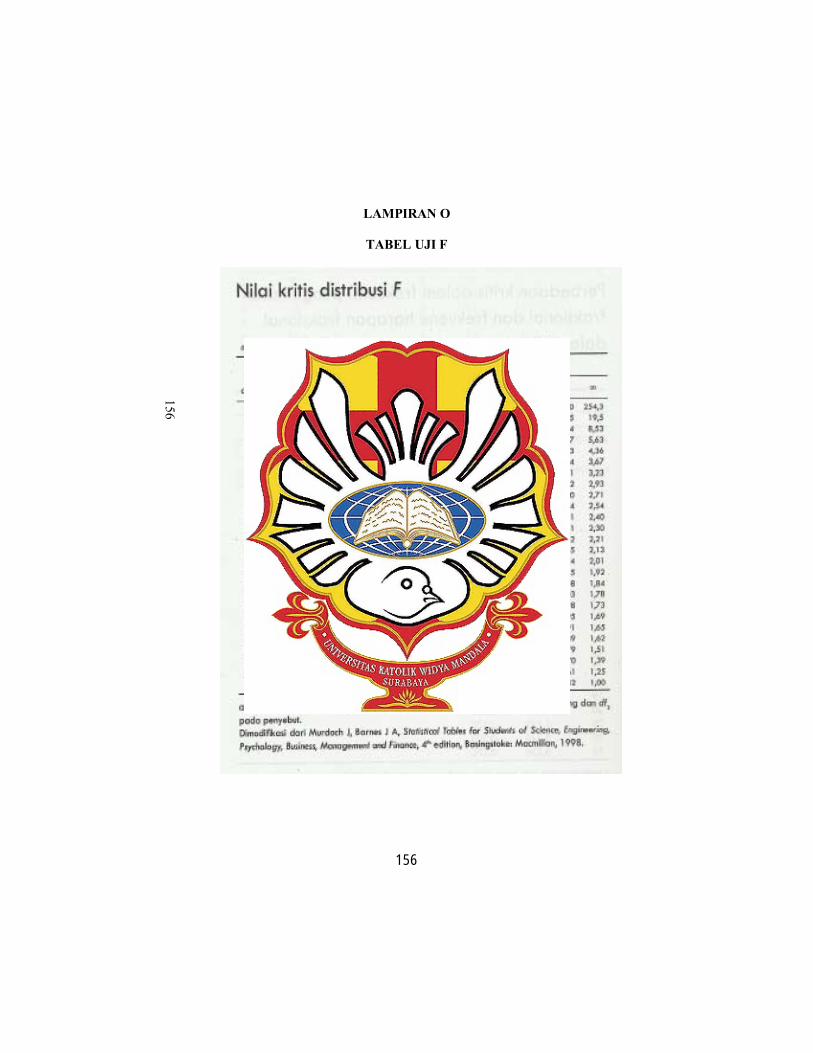
LAMPIRAN O
TABEL UJI F
157
157
LAMPIRAN P
TABEL UJI T