management impacts on nitrous oxide emissions from
TRANSCRIPT

Management Impacts on Nitrous Oxide Emissions from
Cropping Systems in Minnesota
Rodney Venterea
US Dept. of Agriculture - ARS
Dept. of Soil, Water, Climate / University of Minnesota
Michael Dolan
Jason Leonard
Anna Dwinnel
Ryo Fujinuma
Kurt Spokas
John Baker
Carl Rosen
Charles Hyatt
Bijesh Maharjan
Matt McNearney
Many undergraduate student technicians
FUNDING SOURCES •NRI-USDA CSREES/NIFA Air Quality Program
•USDA-ARS GRACEnet Project
•International Plant Nutrition Institute’s Foundation for Agronomic Research:
•Agrotain Intl.
•Agrium Inc.
•Minnesota Corn Growers Association
•John Deere & Company
•Kingenta Corporation

The Deepwater Horizon oil spill (leak)
April 20 - July 15, 2010
IS THERE ANYTHING WE CAN DO TO STOP THE LEAK(s) ?
Fukushima Dai-ichi Nuclear Power Plant
March 11, 2011 - ??

IS THERE ANYTHING WE CAN DO TO STOP THE LEAK(s) ?
IPCC, 2007.
The Leaking Nitrogen Cycle
Atmospheric Nitrous Oxide (N2O) Concentrations
1850 - ????
N2O (ppb)

1998 2000 2002 2004 2006 2008 2010 2012
Atm
os
ph
eri
c N
2O
( p
pt
)
312
314
316
318
320
322
324
Atmospheric N2O
NOAA/ESRL halocarbons in situ program ftp://ftp.cmdl.noaa.gov/hats/n2o/insituGCs/CATS/global/insitu_global_N2O.txt
Rising Atmospheric N2O
~ 20% above pre-industrial levels
Slope = 0.77 ppb y-1
r2 = 0.995

Fertilizer application: 40%
Manure application & mgmt: 40%
Biomass burning : 7%
Industrial: 14%
Davidson, 2009; Mosier et al.,1998
Anthropogenic N2O Sources
1960 1970 1980 1990 2000 2010
T
g N
fert
iliz
er
co
ns
um
ed
(ap
pro
x. %
of
cu
rren
t co
nsu
mp
tio
n)
0
5
10
15
20
25
30
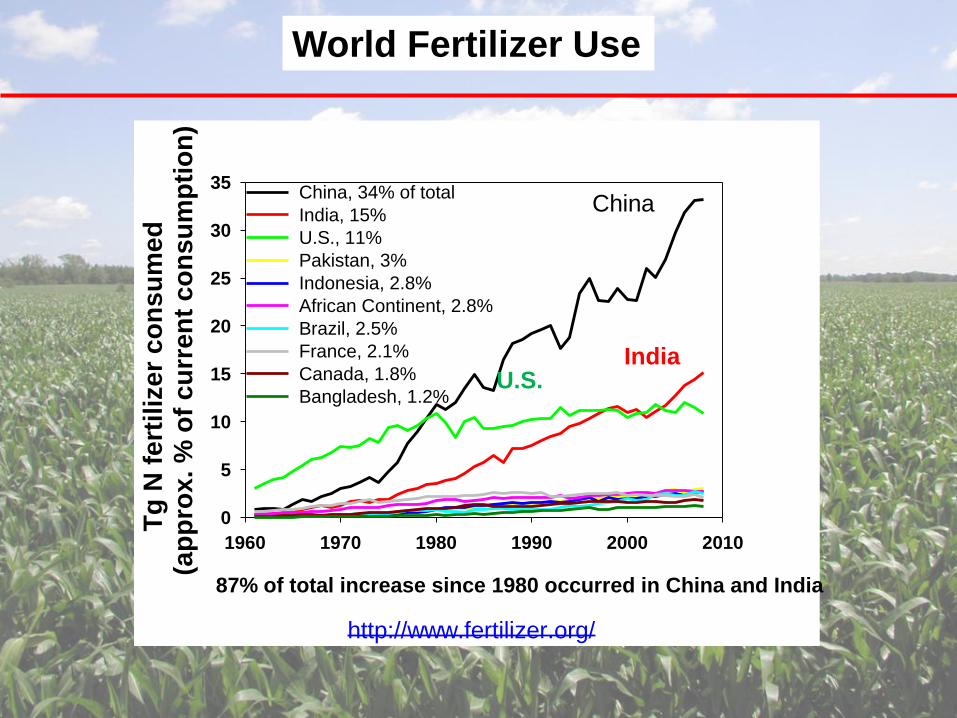
35China, 34% of total
India, 15%
U.S., 11%
Pakistan, 3%
Indonesia, 2.8%
African Continent, 2.8%
Brazil, 2.5%
France, 2.1%
Canada, 1.8%
Bangladesh, 1.2%
87% of total increase since 1980 occurred in China and India
http://www.fertilizer.org/
China
U.S. India
World Fertilizer Use

2 kg N2O-N = CO2 from
100 gallons of gasoline
Global Warming Potential (GWP) = 300 times CO2
2 kg N2O-N ha-1 ≈ 1 Mg CO2 ha-1

IPCC, 2007
% of total anthropogenic GHG emissions
Global Warming Potential (GWP) = 300 times CO2
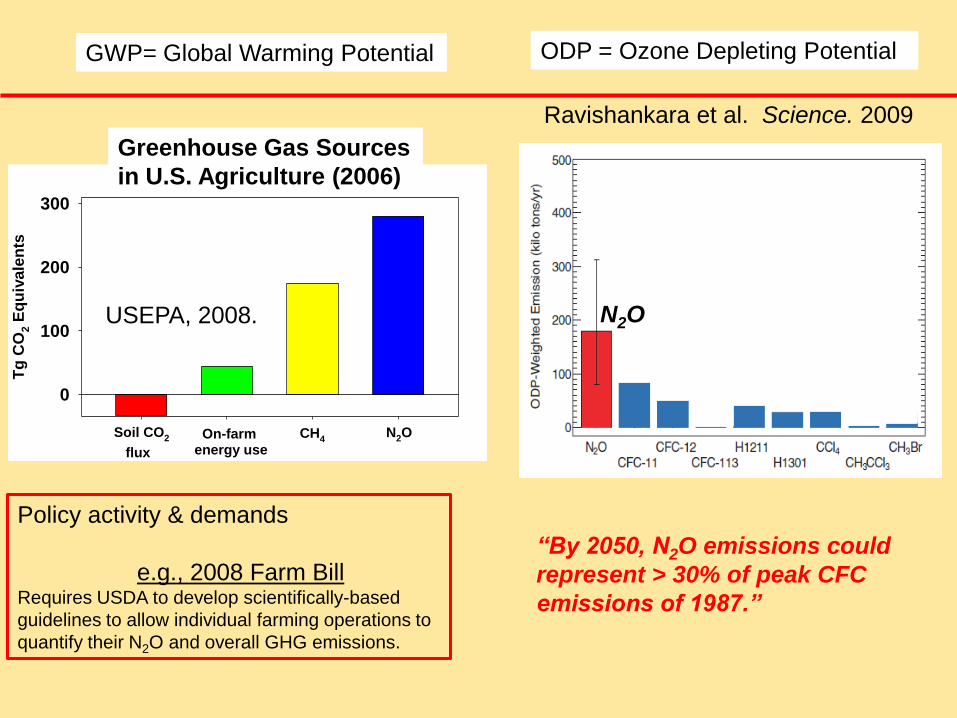
ODP = Ozone Depleting Potential
N2O
Ravishankara et al. Science. 2009
“By 2050, N2O emissions could
represent > 30% of peak CFC
emissions of 1987.”
Tg
CO
2 E
qu
ivale
nts
0
100
200
300
Soil CO2
flux
On-farm energy use
CH4N2O
USEPA, 2008.
Greenhouse Gas Sources
in U.S. Agriculture (2006)
GWP= Global Warming Potential
Policy activity & demands
e.g., 2008 Farm Bill Requires USDA to develop scientifically-based
guidelines to allow individual farming operations to
quantify their N2O and overall GHG emissions.

Few studies examining N fertilizer management practices
• Comparison of fall- vs. spring- applied AA: 1 study (0 in MN)
• Comparison of AA with and w/out N serve: 1 study (0 in MN)
• Single versus split applications: 1 study (0 in MN)
• Few empirically-based guidelines for reducing N2O while maintaining crop yields
Fertilizer Management Effects

Review our recent research regarding synthetic N fertilizer mgmt effects:
1. Controlled release fertilizers (CRFs)
2. Effects of different chemical fertilizer forms
3. Placement (depth and banding) effects
4. Mechanisms & modeling
5. Tillage effects
6. Nitrogen use efficiency (NUE)
Outline
X
X
X
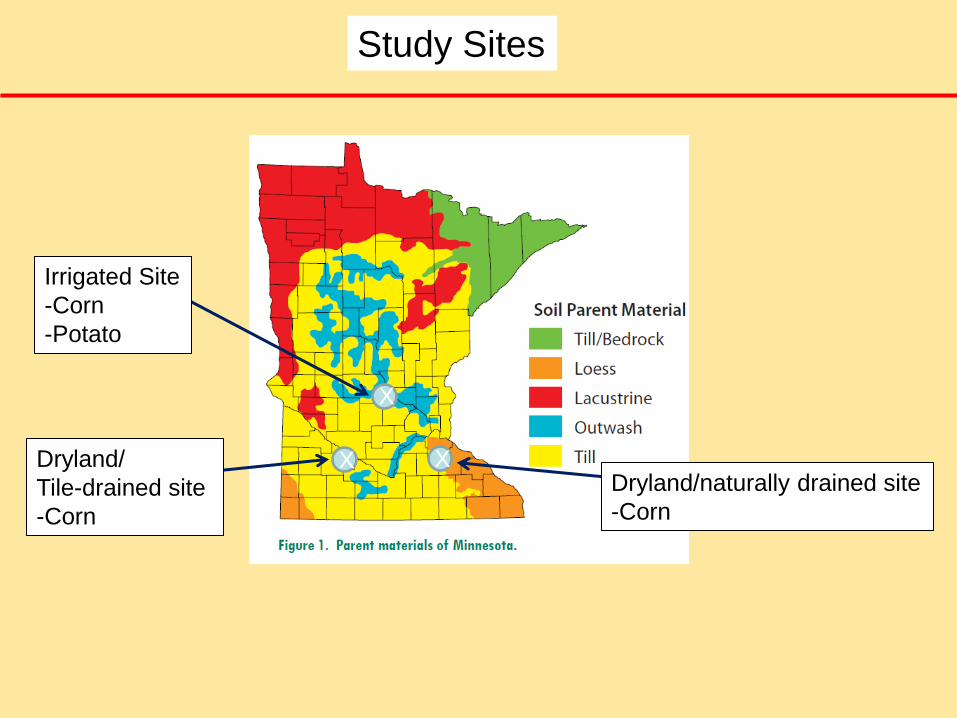
Irrigated Site
-Corn
-Potato
Dryland/naturally drained site
-Corn
Dryland/
Tile-drained site
-Corn
Study Sites

Methods: Gas Flux Chambers
Pro:
• Plot-scale studies & treatment comparisons
• Inexpensive
Con:
• Limited spatial and temporal coverage
• Physical disturbance

Methods: Automated Chambers

5/1/06 6/1/06 7/1/06 8/1/06 9/1/06 10/1/065/1/05 6/1/05 7/1/05 8/1/05 9/1/05 10/1/05 11/1/05
0
100
200
300
400
500
AA
U
4/1/07 5/1/07 6/1/07 7/1/07 8/1/07 9/1/07 10/1/07
F P PF FP
Daily N2O flux (µg N m-2 h-1)
F = Fertilizer application date
P = Planting date
Trapezoidal
Integration
Flux versus Time
Data
Cumulative Emissions
mg N m-2 ug N m-2 h-1
(1 kg N ha-1 = 100 mg N m-2)
Methods: Data Analysis
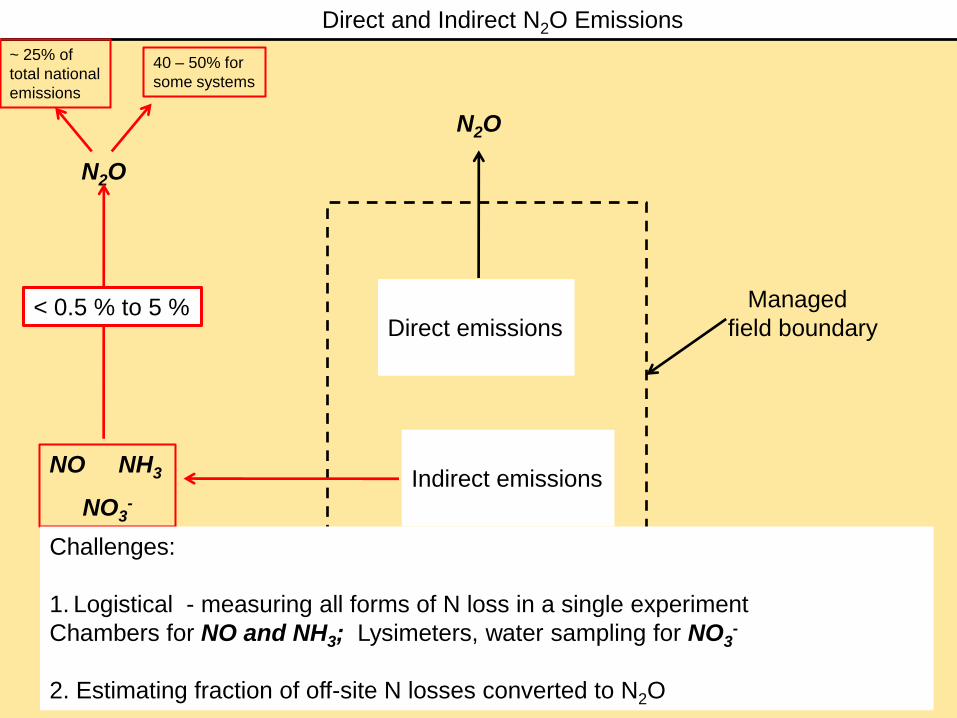
Direct emissions
N2O
Managed
field boundary
Direct and Indirect N2O Emissions
Indirect emissions
N2O
NO NH3
NO3-
Challenges:
1. Logistical - measuring all forms of N loss in a single experiment
Chambers for NO and NH3; Lysimeters, water sampling for NO3-
2. Estimating fraction of off-site N losses converted to N2O
< 0.5 % to 5 %
~ 25% of
total national
emissions
40 – 50% for
some systems

Asynchrony between N fertilizer application and crop N demand
Iowa State University Extension
Corn N Uptake
High potential for generating N losses:
Provide substrate for soil microbial population
Preplant
53%
Fall application
35%
~ 10%
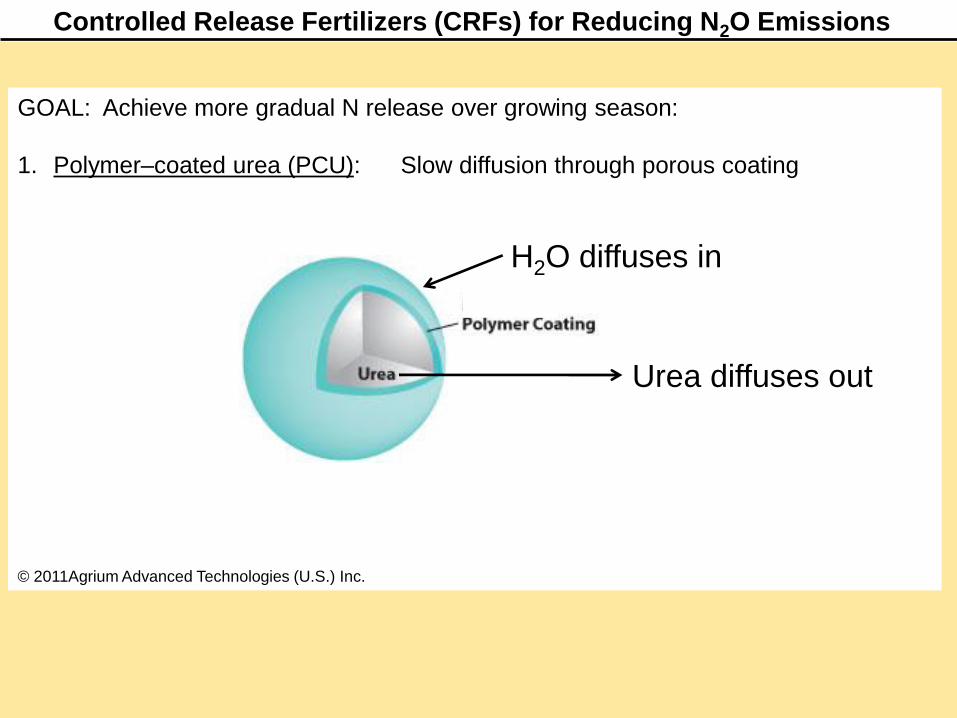
Controlled Release Fertilizers (CRFs) for Reducing N2O Emissions
GOAL: Achieve more gradual N release over growing season:
1. Polymer–coated urea (PCU): Slow diffusion through porous coating
H2O diffuses in
Urea diffuses out
© 2011Agrium Advanced Technologies (U.S.) Inc.

Polymer-coated Urea (PCU) for Irrigated Potato Production
Source Timing Rate (kg N ha-1)
1. Conventional urea (47%N) 4 split applications 270
2. PCU-1 (44%N) Before planting 270
3. PCU-2 (42%N) Before planting 270
Potato N Uptake
North Dakota State University Extension
Urea/UAN
PCUs

Controlled Release Fertilizers for Irrigated Potato Production
Hyatt et al. 2010. SSSAJ.
Three-yr mean N2O emissions
Becker, MN
N2O
em
issio
ns
(m
g N
m-2
)
0
50
100
150
200
Tu
ber
yie
lds (
ton
ha
-1)
0
50
100
150
200
Conventional Urea
Polymer-coated Urea 1
Polymer-coated Urea 2
N2O emissions Tuber yields
a
ab
b
Source Timing Rate (kg N ha-1)
1. Conventional urea (47%N) 4 split applications 270
2. PCU-1 (44%N) Before planting 270
3. PCU-2 (42%N) Before planting 270
• N2O either decreased or same
• No yield difference

Venterea et al. 2011. JEQ
Source Timing Rate (kg N ha-1)
1. Conventional urea (47%N) 4 split applications 270
2. PCU-1 (44%N) Before planting 270
3. PCU-2 (42%N) Before planting 270
Controlled Release Fertilizers for Irrigated Potato Production
Soil and leaching data for individual yearsLoamy sand, Becker, MN
Resid
ual
So
il N
(m
g N
kg
-1)
0
10
20
30
40
50
60
So
il-w
ate
r n
itra
te (
mg
N L
-1)
0
10
20
30
40
50
60
Conventional Urea
Polymer-coated Urea 1
Polymer-coated Urea 2
Residual Soil N (year 1)
a a
b
a
ab
b
Nitrate in Soil-Water(Spring following year 2)
• N2O decreased
• NO3- leaching potential increased
• Net effect on total emissions?
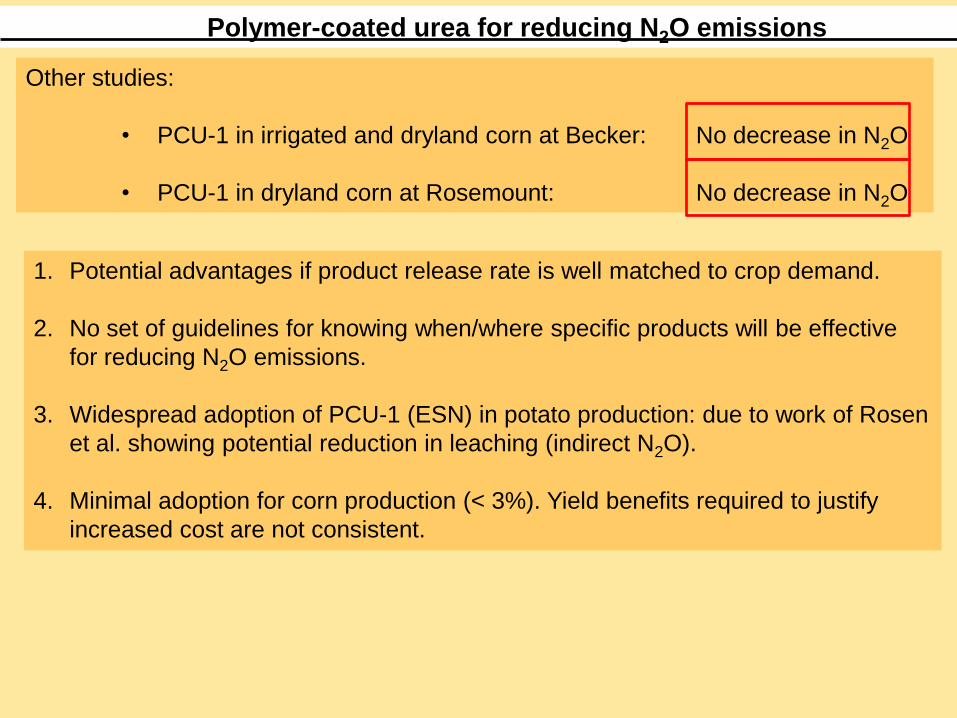
Polymer-coated urea for reducing N2O emissions
Other studies:
• PCU-1 in irrigated and dryland corn at Becker: No decrease in N2O
• PCU-1 in dryland corn at Rosemount: No decrease in N2O
1. Potential advantages if product release rate is well matched to crop demand.
2. No set of guidelines for knowing when/where specific products will be effective
for reducing N2O emissions.
3. Widespread adoption of PCU-1 (ESN) in potato production: due to work of Rosen
et al. showing potential reduction in leaching (indirect N2O).
4. Minimal adoption for corn production (< 3%). Yield benefits required to justify
increased cost are not consistent.
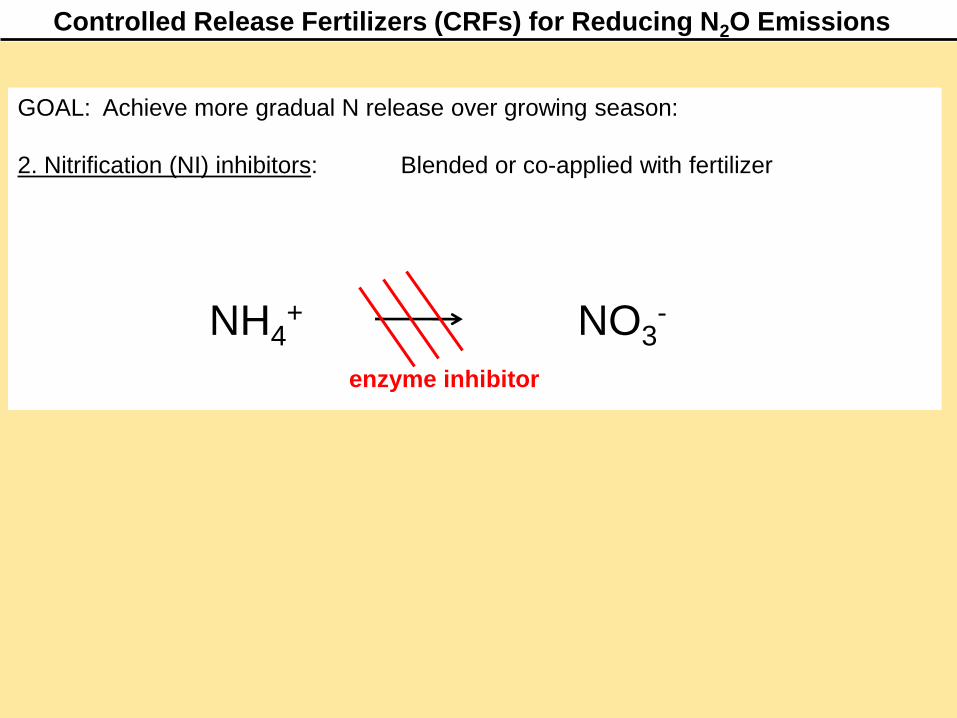
Controlled Release Fertilizers (CRFs) for Reducing N2O Emissions
GOAL: Achieve more gradual N release over growing season:
2. Nitrification (NI) inhibitors: Blended or co-applied with fertilizer
NH4+ NO3
-
enzyme inhibitor

Controlled Release Fertilizers for Dryland Corn Production
Source Timing Rate (kg N ha-1)
1. Conventional urea (47%N) Sidedress (V4-V6) 146
2. Urea + DCD + NBPT (47%N) Sidedress (V4-V6) 146
Urea
Urea + NI +UI
Treatments applied to both CT and NT treatments (in place for > 15 yr)

Controlled Release Fertilizers for Dryland Corn Production
Source Timing Rate (kg N ha-1)
1. Conventional urea (47%N) Sidedress (V4-V6) 146
2. Urea + DCD + NBPT (47%N) Sidedress (V4-V6) 146
Venterea et al. 2011. JEQ
Three-yr mean N2O emissions
Rosemount, MN
N2O
(kg
N h
a-1
)
0
20
40
60
80
100
120
Conventional Urea
Urea with Inhibitors
Conventional Tillage No Till
Waukegan silt loam
Treatments applied to both CT and NT treatments (in place for > 15 yr)
No significant effect on N2O emissions (or yield)

1. Several studies, some potential for reductions, but varying success.
2. Many different chemical formulations, but little systematic comparison.
3. Few guidelines for knowing when/where specific products will be effective for
reducing N2O emissions.
4. Yield benefits required to justify cost are not consistent, not widespread use.
5. One exception: ~ 10% of MN corn producers use N-serve (nitrapyrin), mostly with
fall-applied N. Some studies: decreased Nitrate leaching potential. Recent study
in IA showed no reduction in direct N2O with N-serve.
Nitrification inhibitors for reducing N2O emissions
Other studies:
• In irrigated and dryland corn at Becker: No decrease in N2O
• In dryland corn at Rosemount: No decrease in N2O
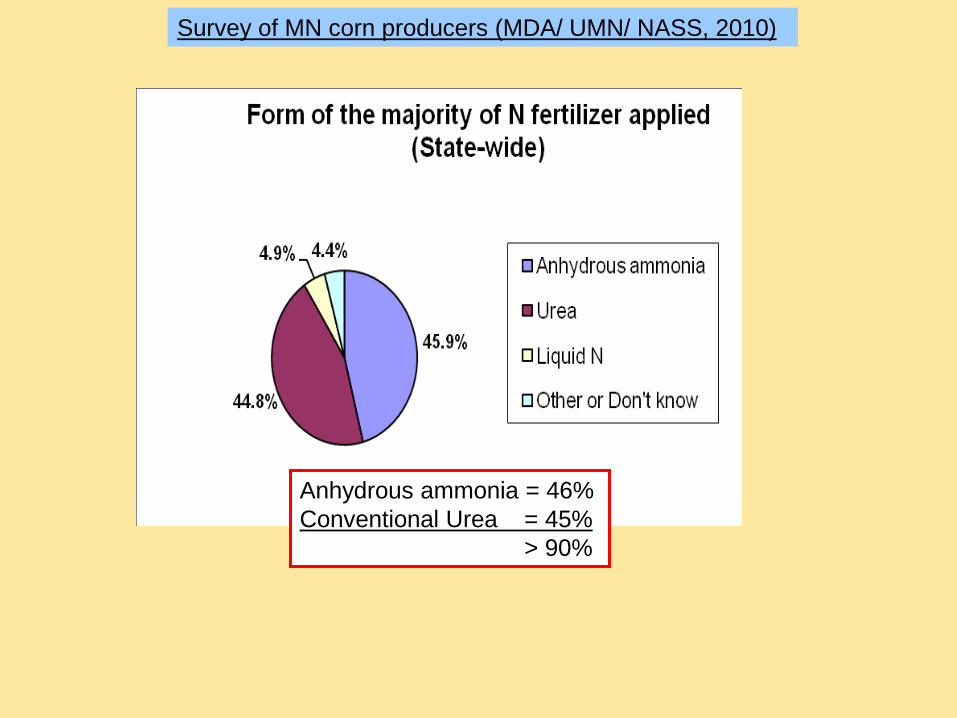
Survey of MN corn producers (MDA/ UMN/ NASS, 2010)
Anhydrous ammonia = 46%
Conventional Urea = 45%
> 90%

Fertilizer Source Effects: Conventional Sources
Tera
gra
ms o
f N
itro
gen
0
1
2
3
4
Anhydrous Ammonia
Urea Solutions (UAN)
NH4 & NO3
salts
Other
Economic Research Service (2011)
(data for 2008)35%
23%
29%
4%
10%
Nitrogen Fertilizer Use by Type in U.S.
AA + Urea = 58%
Only 1 site-year of data comparing N2O emissions with AA and Urea prior to 2005
(Thornton et al., 1996)

Continuous corn Corn after soybeans
Three-yr average growing season N2O emissions
Rosemount, MN
N2O
(m
g N
m-2
)
0
100
200
300Anhydrous ammonia
Urea
b
a
b
a
Venterea et al. 2010. SSSAJ.
Anhydrous Ammonia versus Urea: Dryland Corn
Source Timing Placement Rate (kg N ha-1)
1. Urea (47%N) Pre-plant Broadcast and incorporated 146
2. AA (82%N) Pre-plant Injected into subsurface band 146
Treatments applied to both Corn following Corn and Corn following Soybean

Irrigated corn
Two-yr average growing season N2O emissions
Becker, MN
N2O
(m
g N
m-2
)
0
25
50
75
100
Anhydrous ammonia
Urea
b
a
Fujinuma et al., 2011 (submitted.)
Anhydrous Ammonia versus Urea: Irrigated Corn
Source Timing Placement Rate (kg N ha-1)
1. Urea (47%N) Pre-plant/Sidedress Broadcast and incorporated 90 / 90
2. AA (82%N) Pre-plant/Sidedress Injected and banded 90 / 90

Summary of studies in corn systems
Emissions Factor (EF) Assessment
Study EFAA: EFurea
Thornton et al. (1996) 1.94
Venterea et al. (2010) 2.60
Fujinuma et al. (2011) 1.53
Average 2.0
Anhydrous Ammonia versus Urea
Worldwide AA Use
U.S. 85%
Canada 13%
Mexico 1%
Rest of world 1% (IFA Statistics)
1 study in Canada wheat system: No difference in emissions.
* Lower N application rate (80 kg N ha-1)
Is this enough evidence to drive a policy recommendation or
do we need more studies ?

Anhydrous Ammonia versus Urea: Indirect N2O Emissions
Fujinuma et al., 2011 (submitted); Maharjan et al., 2011 (in preparation)
N2O emitted
Direct and Indirect N2O emissions
Becker, MN
N2O
or
NO
(m
g N
m-2
)
0
25
50
75
100
NO
3
- (k
g N
ha
-1)
0
25
50
75
100Anhydrous ammonia
Ureab
a
NO emitted NO3
- leached
a
a
b b
Direct emissions
decreased with urea
Indirect emissions
increased with Urea

Anhydrous Ammonia versus Urea: Indirect N2O Emissions
2006 IPCC Guidelines for National Greenhouse Gas Inventories. De Klein et al.
Fujinuma et al., 2011 (submitted); Maharjan et al., 2011 (in preparation)
Lower limit of 95% CI0.2% of NO
0.05% of NO3
-
Total Direct plus Indirect N2O emissions
Becker, MN
To
tal N
2O
(m
g N
m-2
)
0
50
100
150
200
250
Anhydrous ammonia
Urea
Upper limit of 95% CI5% of NO
2.5% of NO3
-

Anhydrous Ammonia versus Urea: Indirect N2O Emissions
2006 IPCC Guidelines for National Greenhouse Gas Inventories. De Klein et al.
Lower limit of 95% CI0.2% of NO
0.05% of NO3
-
Total Direct plus Indirect N2O emissions
Becker, MN
To
tal N
2O
(m
g N
m-2
)
0
50
100
150
200
250
Anhydrous ammonia
Urea
Upper limit of 95% CI5% of NO
2.5% of NO3
-
Fujinuma et al., 2011 (submitted); Maharjan et al., 2011 (in preparation)
Quantifying Indirect emissions one of biggest challenges
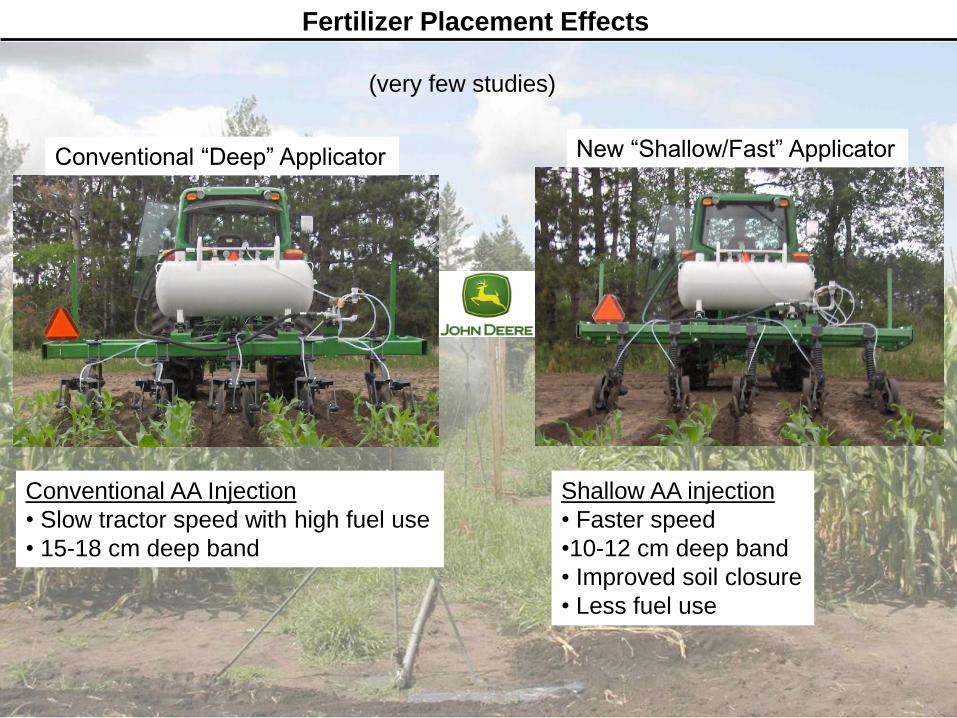
Fertilizer Placement Effects
Conventional AA Injection
• Slow tractor speed with high fuel use
• 15-18 cm deep band
Conventional “Deep” Applicator
Shallow AA injection
• Faster speed
•10-12 cm deep band
• Improved soil closure
• Less fuel use
New “Shallow/Fast” Applicator
(very few studies)
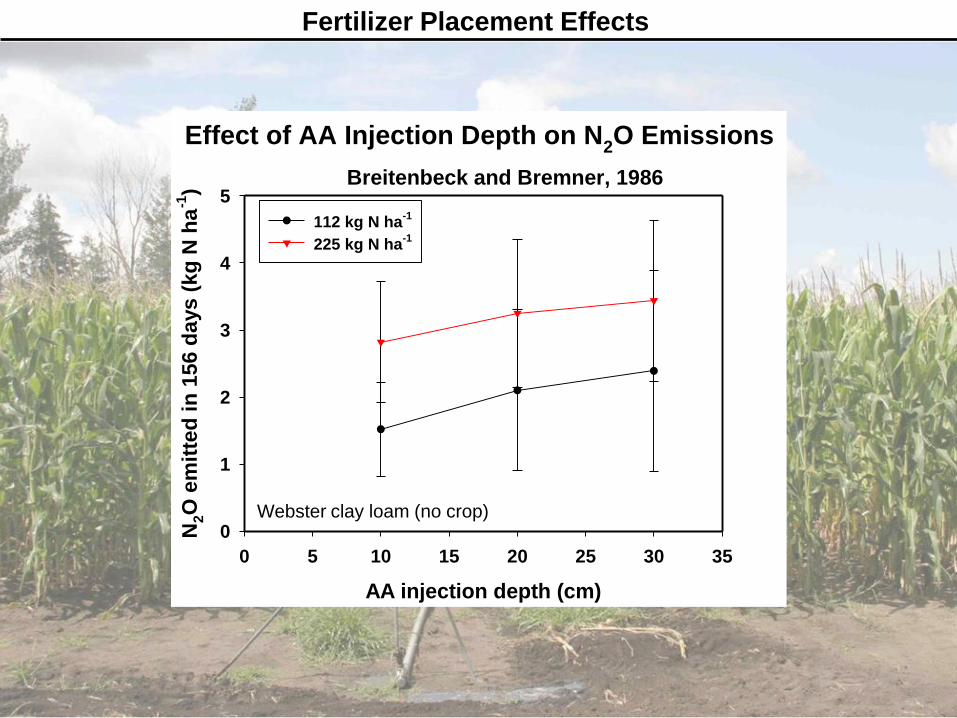
Fertilizer Placement Effects
Effect of AA Injection Depth on N2O Emissions
Breitenbeck and Bremner, 1986
AA injection depth (cm)
0 5 10 15 20 25 30 35
N2O
em
itte
d i
n 1
56 d
ays
(k
g N
ha
-1)
0
1
2
3
4
5
112 kg N ha-1
225 kg N ha-1
Webster clay loam (no crop)

2009 2010
Effects of AA placement depth on N2O emissions
Becker, MN
N2O
(m
g N
m-2
)
0
50
100
150
200
Deep
Shallow
b
a
b
a
Fujinuma et al., 2011 (submitted.)
WHY ?
Replicating experiment in Lamberton and Rosemount in finer texture soils
Anhydrous Ammonia Placement Effects: Irrigated Corn
Source Timing Placement Rate (kg N ha-1)
1. AA Pre-plant/Sidedress 18 cm 90 / 90
2. AA Pre-plant/Sidedress 12 cm 90 / 90

So
il N
O2
- (g
N g
-1)
AA
Urea
5/21/07 6/4/07 6/18/07 7/2/07
N2O
flu
x (
g N
m-2
h-1
)
Corn field, Rosemount, MN
Elevated Soil Nitrite (NO2-)
Venterea et al. 2010. Soil Sci. Soc. Am. J.
Greater N2O Emissions with Anhydrous Ammonia
Soil Nitrite (NO2-)
N2O flux
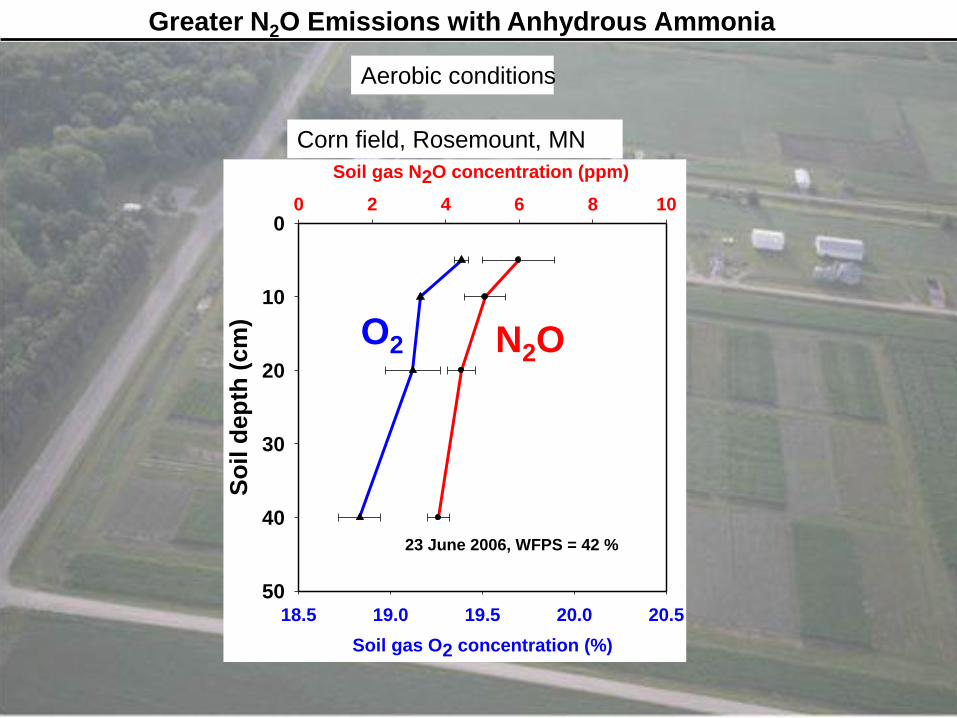
Greater N2O Emissions with Anhydrous Ammonia
Aerobic conditions
Soil gas O2 concentration (%)
18.5 19.0 19.5 20.0 20.5
So
il d
ep
th (
cm
)0
10
20
30
40
50
0 2 4 6 8 10
Soil gas N2O concentration (ppm)
23 June 2006, WFPS = 42 %
Corn field, Rosemount, MN
O2 N2O

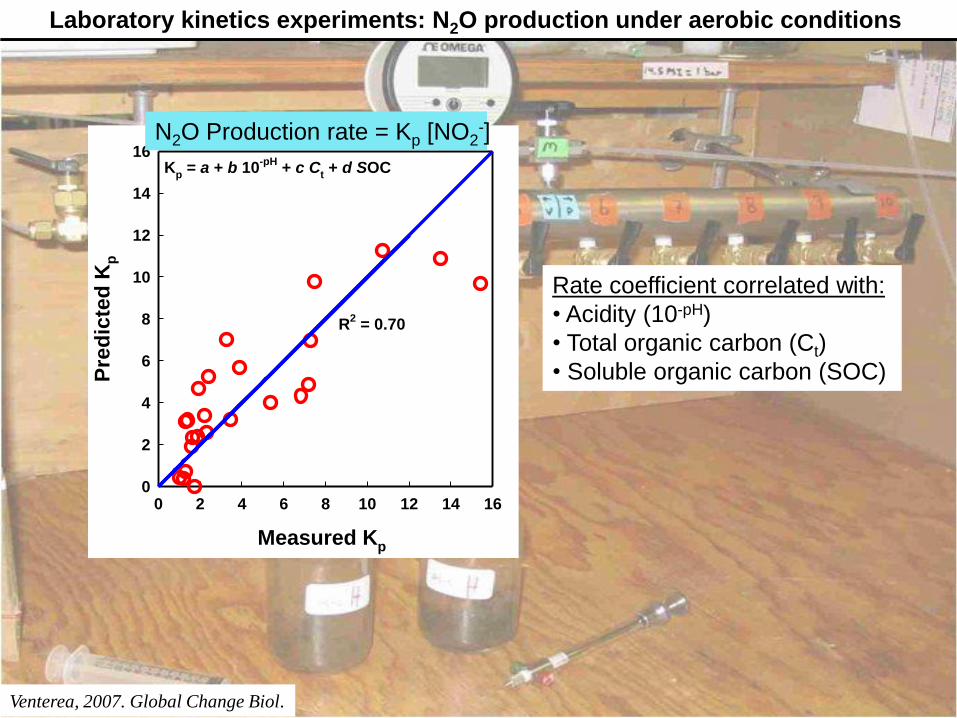
Laboratory kinetics experiments: N2O production under aerobic conditions
NO2
- added (g N g
-1)
0 10 20 30 40 50
N2O
pro
du
cti
on
(
g N
g-1
h-1
)
0.00
0.01
0.02
0.03
0.04
Non-sterile
-irradiated (5 Mrad)
Venterea, 2007. Global Change Biol.
NO2- added to soil N2O production rate
Biotic
Abiotic
Prod. rate = Kp [NO2-]
NO2- added to soil N2O production rate
Venterea, 2007. Global Change Biol.
Measured Kp
0 2 4 6 8 10 12 14 16
Pre
dic
ted
Kp
0
2
4
6
8
10
12
14
16
R2 = 0.70
Kp = a + b 10
-pH + c C
t + d SOC
N2O Production rate = Kp [NO2-]
Rate coefficient correlated with:
• Acidity (10-pH)
• Total organic carbon (Ct)
• Soluble organic carbon (SOC)
Laboratory kinetics experiments: N2O production under aerobic conditions

Venterea, 2007. Global Change Biol.
1/T (Kelvin-1
)
0.0032 0.0033 0.0034 0.0035 0.0036
ln K
p
-10
-8
-6
-4
-2
CT soil
NT soil
Forest soil
Ea (kJ mol
-1)
5 % 21 %
66 5671 6085 78
Temperature Sensitivity
Laboratory kinetics experiments: N2O production under aerobic conditions

Venterea, 2007. Global Change Biol.
Headspace O2 concentration (%)
0 5 10 15 20
Rate
co
eff
icie
nt
(Kp)
Sensitivity to O2
NO2- added
Laboratory kinetics experiments: N2O production under aerobic conditions
N2O
Pro
duction R
ate

Laboratory kinetics experiments: N2O production under aerobic conditions
Venterea, 2007. Global Change Biol.
Headspace O2 concentration (%)
0 5 10 15 20
Rate
co
eff
icie
nt
(Kp)
Sensitivity to O2
NO2- added
N2O
Pro
duction R
ate
Nitrifying
bacteria
NO3- added
Denitrifying bacteria

Concentrated Band
NH3/NH4+
NO2- NO3
- AOB
Free ammonia toxicity
NOB
NO2-
N2O
Chemical RXN
with SOM
N2O
Nitrifier
denitrification
Nitrite-driven N2O production
Venterea, 2007. Global Change Biol.
High O2 N2
“Chemo-denitrification”

Nitrite-driven N2O production
NO2- + H+ +
Lignins
Humic acids
Phenolics
Aromatics
N2O
Stevenson and Swaby, 1964
Overlooked and
understudied process
“Chemo-denitrification”

Broadcast Banded
Effects of Urea placement on N2O emissions
Engel et al., 2010
N2O
(m
g N
m-2
)
0
100
200
300
400
100 kg N ha-1
200 kg N ha-1
Nitrite-driven N2O production
High NO2- Low NO2
-
Banding of Urea

Nitrite-driven N2O production
Banding as a beneficial fertilizer management practice
Conserves Nitrogen/ Increases NUE
-Slows nitrification and nitrate leaching
-Limits contact with soil microbes
-Increases root access to N
-Decreases distance from plant to N source
• With banding, it may be possible to have:
-Greater overall NUE
-And greater N2O emissions
• N2O emissions usually are < 3% of applied N.
Malhi et al., 1985. 1991; Yadvinder-Singh et al., 1994
Robertson and Vitousek, 2009

Nitrite-driven N2O production
AA(banded)
N Losses (N2O, NO, NO
3
-)
Becker, MN
kg
N h
a-1
0
25
50
75
100
a
b
Urea(broadcast)
Is there an optimum banding intensity or geometry that maximizes NUE and
minimizes N2O emissions ?
Banding as a beneficial fertilizer management practice
Conserves Nitrogen/ Increases NUE
-Slows nitrification and nitrate leaching
-Limits contact with soil microbes
-Increases root access to N
-Decreases distance from plant to N source
Malhi et al., 1985. 1991; Yadvinder-Singh et al., 1994
Robertson and Vitousek, 2009

Modeling nitrite-driven N2O emissions
0 5 10 15 20
Bio
mas
s d
en
sit
y (
cells
g-1
)
105
106
107
Time (d)
0 5 10 15 20
0
50
100
150
200
0
1
2
3
4
NH
4
+,
NO
3- (:
g N
g-1
)
NO
2
- (:
g N
g-1
)
Nitrobacter
NitrosomonasNH
4
+NO
2
-
NO3
-
Time (d)
Biomass dynamics nitrite accumulation
Time
Bio
mass
AOB
NOB
0 5 10 15 20
Bio
mas
s d
en
sit
y (
cells
g-1
)
105
106
107
Time (d)
0 5 10 15 20
0
50
100
150
200
0
1
2
3
4
NH
4
+,
NO
3- (:
g N
g-1
)
NO
2
- (:
g N
g-1
)
Nitrobacter
NitrosomonasNH
4
+NO
2
-
NO3
-
Time (d)
Biomass dynamics nitrite accumulation
Venterea and Rolston, JEQ. 2000
jj
jinhjs
j
j
jdC
CKKB
dt
dB
,
max,
• Model can generate curves of nitrite accumulation
but we can’t predict actual behavior
• Little to no information on toxicity kinetics in soil
• Critical / threshold concentrations ?
• Wastewater treatment kinetic models:
Applicable to soils ?
Two-step Nitrification Model

Modeling nitrite-driven N2O emissions
Diffusion-reaction model: simplified: NO2- is not modeled
])[,( 22
NOOTK
y
CD
yz
CD
zt
CR p
2D gas diffusion
Source term:
Kp
temp
O2
NO2-
Soil nitrite concentration (ug N g-1
)
Lateral distance from row (cm)
0 10 20 30 40 50 60 70
Dep
th (
cm
)
0
10
20
30
40
50
20
40
60
80
100
Days following AA application
0 10 20 30 40 50 60
So
il N
O2
- co
ncen
trati
on
(g
g-1
)
0
50
100
150
200
250
Center of AA band
5 cm from center
15 cm from center
Measured soil NO2-

Modeling nitrite-driven N2O emissions
Distance from row (cm)
0 20 40 60
N2O
flu
x
N2O flux varies with position in row due to 2D effects
Model output
Higher flux
directly
above band

Modeling nitrite-driven N2O emissions
Days following AA application
0 10 20 30 40 50
N2O
flu
x (
g m
-2 h
-1)
0
200
400
600
800
1000
= automated chamber data
= model
Assumes:
All N2O comes from nitrite-driven production
No sink term (no reduction to N2)
Model output
Model versus measured fluxes
(integrated across chamber width)

Concentrated Band
NH3/NH4+
NO2- AOB
Free ammonia toxicity
NOB
NO2-
N2O
Chemical RXN
with SOM
N2O
Nitrifier
denitrification
Nitrite-driven N2O production
Venterea, 2007. Global Change Biol.
High O2 N2
NO3-
N2O
Denitrification
in anaerobic
microsites

Tillage Management Effects on N2O Emissions
Does reduced tillage decrease (or increase) N2O emissions ?
Potential for N2O emissions to enhance (or offset) GHG benefits of reduced tillage
Properties affected by long-term tillage mgmt
Bulk density
Water content
Temperature
Inorganic N
Organic carbon
Dissolved organic carbon
Soil structure

Tillage Management Effects on N2O Emissions
Properties affected by long-term tillage mgmt
Bulk density
Water content
Temperature
Inorganic N
Organic carbon
Dissolved organic carbon
Soil structure
NT Greater CT Greater
NT > CT CT > NT
Aulakh et al. 1984
MacKenzie et al. 1998
Ball et al., 1999
Yamulki and Jarvis 2002
Baggs et al., 2003
Koga et al. 2004
Venterea et al., 2005
Rochette et al., 2008
Grageda-Cabrera et al., 2011
Jacinthe and Dick, 1997
Kessavalou et al. 1998
Lemke et al. 1999
Kaharabata et al. 2003
Liu et al., 2005
Venterea et al., 2005
Ussiri et al., 2009
Halvorson et al., 2010
Omonode et al., 2011
Does reduced tillage decrease (or increase) N2O emissions ?
Potential for N2O emissions to enhance (or offset) GHG benefits of reduced tillage

Anhydrous ammonia
N2O
(m
g N
m-2
)
0
100
200
300
400
500
Conventional tillage (CT)
No tillage (NT)
b
a
CT > NT
Venterea et al. 2005. JEQ.
Tillage Management Effects on N2O Emissions

Anhydrous ammonia Surface broadcast urea
N2O
(m
g N
m-2
)
0
100
200
300
400
500
Conventional tillage (CT)
No tillage (NT)
b
a
b
a
CT > NT NT > CT
Tillage Management Effects on N2O Emissions
Venterea et al. 2005. JEQ.
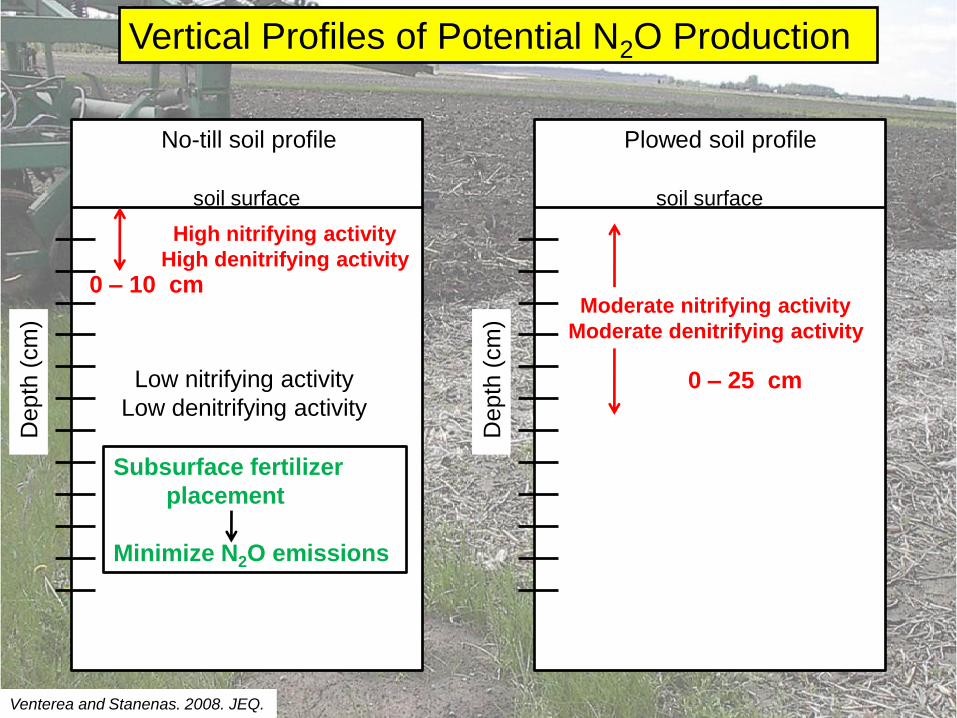
Vertical Profiles of Potential N2O Production
Venterea and Stanenas. 2008. JEQ.
No-till soil profile
soil surface
High nitrifying activity
High denitrifying activity
Low nitrifying activity
Low denitrifying activity
Depth
(cm
)
0 – 10 cm
Plowed soil profile
soil surface
Depth
(cm
)
Moderate nitrifying activity
Moderate denitrifying activity
0 – 25 cm
Subsurface fertilizer
placement
Minimize N2O emissions

Agrees with tillage-by-placement pattern
(12/18)
Mixed application or no information (5/18)
Disagrees with tillage-by-placement pattern
(1/18)
Tillage Management Effects on N2O Emissions
NT > CT CT > NT
MacKenzie et al. 1998
Ball et al., 1999
Yamulki and Jarvis 2002
Baggs et al., 2003
Venterea et al., 2005
Grageda-Cabrera et al., 2011
Koga et al. 2004
Rochette et al., 2008
Aulakh et al. 1984
Jacinthe and Dick, 1997
Lemke et al. 1999
Liu et al., 2005
Venterea et al., 2005
Ussiri et al., 2009
Omonode et al., 2011
Kaharabata et al. 2003
Kessavalou et al. 1998
Halvorson et al., 2010
NT Greater CT Greater
Recommendation for no-till: Subsurface N application, but not AA
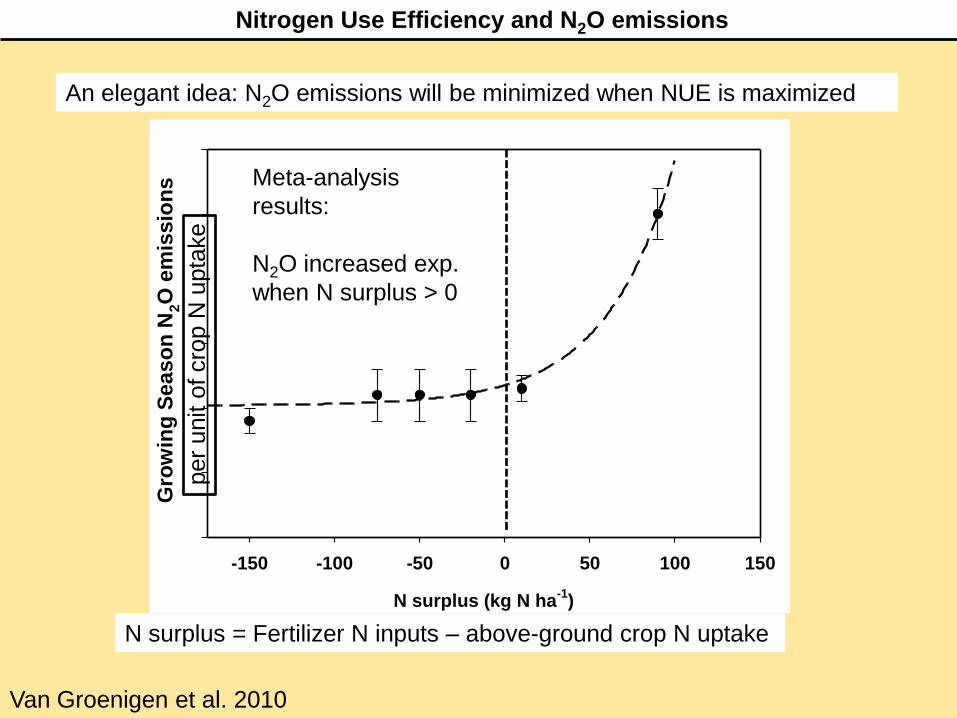
Nitrogen Use Efficiency and N2O emissions
Van Groenigen et al. 2010
An elegant idea: N2O emissions will be minimized when NUE is maximized
N surplus (kg N ha-1
)
-150 -100 -50 0 50 100 150
Gro
win
g S
ea
so
n N
2O
em
iss
ion
s Meta-analysis
results:
N2O increased exp.
when N surplus > 0
N surplus = Fertilizer N inputs – above-ground crop N uptake
per
unit o
f cro
p N
upta
ke

Nitrogen Use Efficiency and N2O emissions Nitrogen Use Efficiency and N2O emissions
Van Groenigen et al. 2010
An elegant idea: N2O emissions will be minimized when NUE is maximized
N surplus (kg N ha-1
)
-150 -100 -50 0 50 100 150
Gro
win
g S
ea
so
n N
2O
em
iss
ion
s
Outliers: Low N uptake
NT system in 2 dry years
Meta-analysis
results:
N2O increased exp.
when N surplus > 0
N surplus = Fertilizer N inputs – above-ground crop N uptake
Not clear if this simple relationship is going to hold in the majority of cases
3 years of data,
Rosemount corn
Whole curve shifted down:
Sidedress N application
per
unit o
f cro
p N
upta
ke
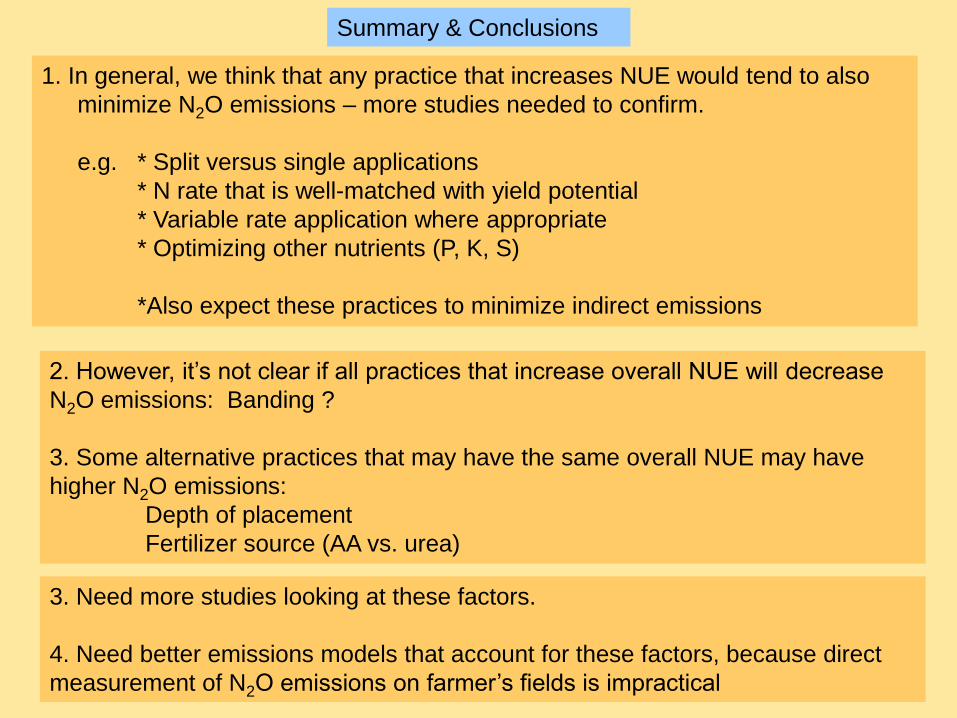
Summary & Conclusions
1. In general, we think that any practice that increases NUE would tend to also
minimize N2O emissions – more studies needed to confirm.
e.g. * Split versus single applications
* N rate that is well-matched with yield potential
* Variable rate application where appropriate
* Optimizing other nutrients (P, K, S)
*Also expect these practices to minimize indirect emissions
2. However, it’s not clear if all practices that increase overall NUE will decrease
N2O emissions: Banding ?
3. Some alternative practices that may have the same overall NUE may have
higher N2O emissions:
Depth of placement
Fertilizer source (AA vs. urea)
3. Need more studies looking at these factors.
4. Need better emissions models that account for these factors, because direct
measurement of N2O emissions on farmer’s fields is impractical
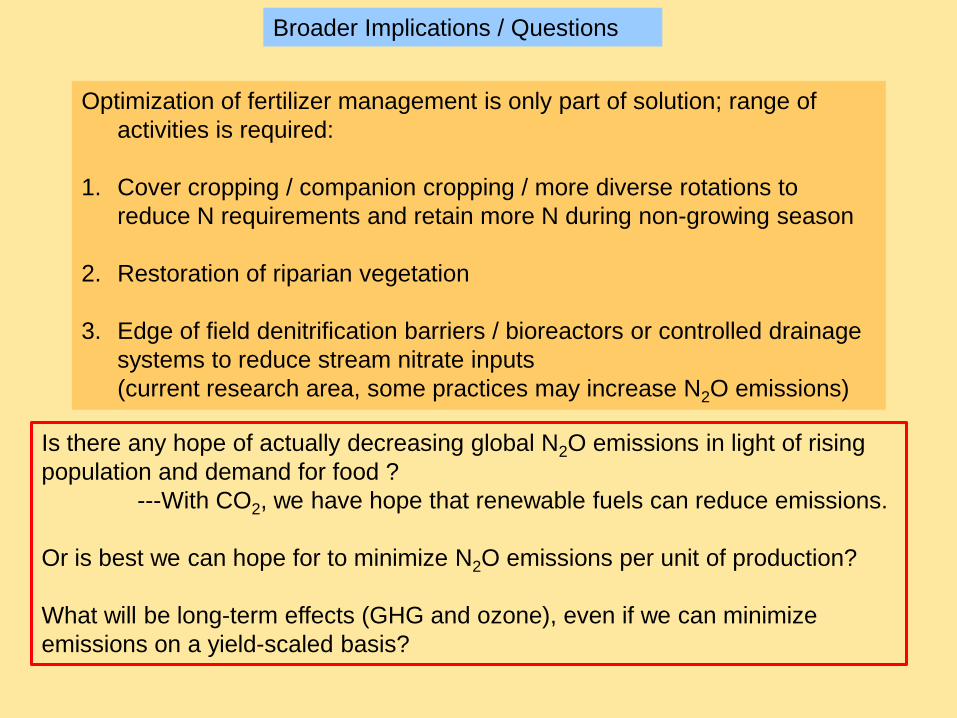
Broader Implications / Questions
Optimization of fertilizer management is only part of solution; range of
activities is required:
1. Cover cropping / companion cropping / more diverse rotations to
reduce N requirements and retain more N during non-growing season
2. Restoration of riparian vegetation
3. Edge of field denitrification barriers / bioreactors or controlled drainage
systems to reduce stream nitrate inputs
(current research area, some practices may increase N2O emissions)
Is there any hope of actually decreasing global N2O emissions in light of rising
population and demand for food ?
---With CO2, we have hope that renewable fuels can reduce emissions.
Or is best we can hope for to minimize N2O emissions per unit of production?
What will be long-term effects (GHG and ozone), even if we can minimize
emissions on a yield-scaled basis?