mapping of landslide susceptibility of coastal cliffs: the mont-roig
TRANSCRIPT

G e o l o g i c a A c t a , V o l . 1 0 , N º 4 , D e c e m b e r 2 0 1 2 , 4 3 9 - 4 5 5D O I : 1 0 . 1 3 4 4 / 1 0 5 . 0 0 0 0 0 1 7 7 6A v a i l a b l e o n l i n e a t w w w . g e o l o g i c a - a c t a . c o m
Mapping of landslide susceptibility of coastal cliffs: the Mont-Roig del Camp case study
I. MONTOYA-MONTES I. RODRÍGUEZ-SANTALLA M.J. SÁNCHEZ-GARCÍA J. ALCÁNTARA-CARRIÓ
S. MARTÍN-VELÁZQUEZ D. GÓMEZ-ORTIZ T. MARTÍN-CRESPO
Department of Biology and Geology, Universidad Rey Juan CarlosC/ Tulipán s/n. 28933, Móstoles, Madrid, Spain. Fax: (0034)916647490
Montoya E-mail: [email protected] Rodríguez E-mail: [email protected] Sánchez E-mail: [email protected] Martín-Velázquez E-mail: [email protected]
Gómez E-mail: [email protected] Martín-Crespo E-mail: [email protected]
Institute of Environmental and Marine Sciences. Universidad Católica de ValenciaC/ Guillem de Castro 94. 46001 Valencia, Spain. Fax: (0034)963153655.
Alcántara E-mail: [email protected]
*Corresponding author
A B S T R A C TThe weathered and fractured conglomerate cliffs of Mont Roig del Camp constitute a rock fall hazard for the surrounding pocket beaches and, therefore, for the population that frequent them, especially over the summer. Landslide susceptibility of the cliff has been assessed using the Rock Engineering System method (RES). The de-terminant and triggering factors considered in this study include: wave exposure, shoreline variations, cliff height, cliff slope, geotechnical quality of the rocky mass, superficial runoff and cliff orientations favoring landslides. Geographic Information Systems (GIS) have been employed to facilitate the information analysis and generate new susceptibility maps. The quality of the rock mass and cliff orientation are the most interactive factors for the stability of the cliff. However, shoreline variations and surface runoff are the most dominant factors in the system. Thus, the quality of the rock mass has been determined to be a basic variable in the cliff characterization because of its high dependence on the variations of the remaining factors. The landslide susceptibility map depicts a pre-dominance of surfaces with moderate degrees of susceptibility concentrated mainly in the headlands, where the combined actions of subaerial and marine processes control the weathering and eroding processes. Therefore, the landslide susceptibility assessment based on this methodology has allowed the identification of hazardous areas that should be considered in future management plans.
Rocky coast. Cliff instability. Landslide susceptibility. Hazard. Geographic Information Systems. KEYWORDS
1,* 1 1 2
1 1 1
1
2
439

I . M O N T O YA - M O N T E S e t a l .
G e o l o g i c a A c t a , 1 0 ( 4 ) , 4 3 9 - 4 5 5 ( 2 0 1 2 )D O I : 1 0 . 1 3 4 4 / 1 0 5 . 0 0 0 0 0 1 7 7 6
Landslide susceptibility of coastal cliffs
440
INTROduCTION
Several researchers have reported that sea cliffs are found along 80% of the Earth’s ocean coasts (Emery and Kuhn, 1982), although the amount of the world’s shoreline that is rocky is questionable (Naylor et al., 2010). Even if coasts with cliffs and rocky coasts have not been as extensively studied as beaches or sandy coasts, interest in researching this type of coast has increased in recent years (Naylor et al., 2010), possibly as a consequence of the rapid development in these coastal areas. Wave action and physical-chemical weathering cause mass movements and progressive erosion of the coast, which increasingly threaten human lives and infrastructures. This conflict between human activity and the inherent instability of coasts with cliffs has become a problem of growing magnitude (Moore and Griggs, 2002). Thus, in a first order approach to the problem, it is essential to identify potentially unstable areas through a methodology that does not require substantial resources or time and that produces reliable results.
Landslide susceptibility assessments determine the dis-tribution of potentially unstable areas. Susceptibility maps are useful to develop land management and mitigation plans (Mejía-Navarro and García, 1996) and are especially important for future damage reduction.
In the last few decades, great efforts have been made to develop methodologies related to the preparation of susceptibility models with the aim of analyzing landslide hazards (Brabb et al., 1972; Carrara, 1983; Hansen, 1984; Corominas, 1987; Carrara et al., 1991; Chung and Fabbri, 1993; Chung et al., 1995; Van Westen et al., 1997; Santa-cana, 2001; Bonaechea, 2006; Teixeira, 2006). Various fac-tors influence instability processes in these areas and sev-eral authors have analyzed the occurrences of landslides and cliff retreats, emphasizing the need to quantify the influence of each factor in the process (Palmquist and Bi-ble, 1980; Varnes, 1984; Brabb, 1984; Hutchinson, 1988; Turner and Schuster, 1995; Cruden and Varnes, 1996; González-Díez et al., 1999; Zêzere et al., 1999; Mateos, 2001; Nunes et al., 2009; Budetta et al, 2008; Del Río and Gracia, 2009).
Three methods are proposed to calculate landslide sus-ceptibility: statistical, deterministic and heuristic methods. Statistical methods determine the combinations of vari-ables which have influenced past instability processes (Dai and Lee, 2001). Deterministic methods analyze slope sta-bility using numerical modeling (Fall et al., 2006; Godt et al., 2008). The heuristic approach uses expert judgment to assess and classify the hazard, in addition to determining the causative factors of landslides (Barredo et al., 2000;
Foster et al., 2008). The landslide susceptibility is catego-rized as “very high”, “high”, “moderate”, “low” and “very low” (Fall et al., 2006; Castellanos and Van Westen, 2008).
Uncertainty regarding the potential hazards in a coastal area leads to unknown consequences derived from such hazards. Thus, studying and analyzing the sensitive areas is essential to manage and plan adequate actions. Therefore, it is necessary to emphasize the importance of cartography and Geographic Information Systems (GIS) as tools for land management and map generation (Rodríguez et al., 2009). Recently, the generation of susceptibility models has undergone important progress, as a result of the devel-opment of GIS and other techniques related to data spatial analysis (Carrara et al., 1991; Chung and Fabbri, 1993; Van Westen, 2000; Irigaray, 1995; Baeza and Corominas, 2001; Remondo, 2001; Santacana, 2001; Fabbri et al., 2003; Nunes et al., 2009; Cruz de Oliveira et al., 2008). GIS is useful in multi-factorial analysis, from the setting of the classes of parameter values to the final susceptibility map, undergoing the following phases: variable weighting, interpolation to obtain the value of each pixel, and the com-bination and reclassification of maps (Santacana, 2001).
The purpose of this work consists of developing a map of landslide susceptible areas for a section of the Tarragona coast (NE Spain) through the analysis of the factors that con-tribute to the instability of the sea cliff. The heuristic method is employed in the present paper, and one of the main dif-ficulties encountered was the adequate weighting of each variable. In this work, we apply an approximation of the Rock Engineering System (RES) methodology proposed by Hudson (1992) to determine relevant variables influencing the cliff stability and the interactions between these vari-ables (Hill and Rosenbaum, 1998; Budetta et al., 2008).
STudY AREA
The cliffs of Mont-Roig del Camp are located on the western Mediterranean coast of Spain (Fig. 1). They ex-tend for 2.5km and reach a height of up to 19m. These cliffs have developed alluvial fans, which date from the Upper Pleistocene (125–300Ky BP) according to CSN (2001), formed from material from the Llabería and Pradell mountains and eroded by marine activity over high sea level periods, such as the present period (Fig. 1). The stratigraphy of the cliffs consists of three lithological units, related to alluvial fans, which are known as A, B, and C (Fig. 2A, B) (Montoya, 2008). Units A and C are con-glomerates, which are associated with the proximal zones, showing large boulders, some degree of size sorting, and, occasionally, fine grained bodies. The intermediate unit B consists of clay, which is associated with the distal zones of the alluvial fan, with some conglomerate fragments and

G e o l o g i c a A c t a , 1 0 ( 4 ) , 4 3 9 - 4 5 5 ( 2 0 1 2 )D O I : 1 0 . 1 3 4 4 / 1 0 5 . 0 0 0 0 0 1 7 7 6
I . M O N T O YA - M O N T E S e t a l . Landslide susceptibility of coastal cliffs
441
even some small lenticular bodies (Fig. 2C). The sharp and straight contact between the clays and the conglomerates, especially within unit C, is evidence of a period without any deposition. Moreover, certain levels present undulated and erosive contacts.
Masana (1995) concluded that this area underwent tec-tonic deformation during the Pliocene and the Quaternary
from geomorphologic, tectonic, and paleoseismic indexes. The maximum compression axis was oriented from NNE-SSW to ENE-WSW during the Pliocene and changed to an orientation that varies from N-S to NE-SW during the Qua-ternary. This geologic evolution explains the position of mountain ranges and faults and agrees with the main joint orientations measured in the study area (Montoya, 2008): N10E, N70E, and N150E.
B
MontroigMontroig N
Fan
Montroig FanPorquerola Fan
Les Planes Fan
Hospitaletde L’Infant
Rifá Creek
PorquerolaCreek
Les PlanesCreek
Alluvial Fan. Generation 1Alluvial Fan. Generation 2Alluvial Fan. Generation 3Alluvial Fan. Generation 4SubstratumFault escarpFluvial channel
N
0 3000 m
326065 328910
328910326065
4539
714
4539
714
4550
634
4550
634
A
Geomorphological map A) (modified from CSN, 2001) and orthophotograph (ICC, 2006) B) with the location of the study area (white box).FIGURE 1
A) Schematic stratigraphic column of sediments that form the cliffs. B) Sharp contact between clays (unit B) and conglomerates (units A and C). C) Characteristic distal alluvial fan facies (unit B) with lenticular bodies of thick material inside finer lithologies.FIGURE 2
1 Isabel Montoya Montes
Figure 2
Table 1
Approach direction ENE to ESE SSE to SSW WNW to NNW Hs (m) 2.5 to 4 2 to 3.5 2 to 3.5 Tp (s) 5 to 8 5 to 7 4 to 6 Events 1373 167 343 Annual frequency (%) 2.02 0.25 0.51
Table 2
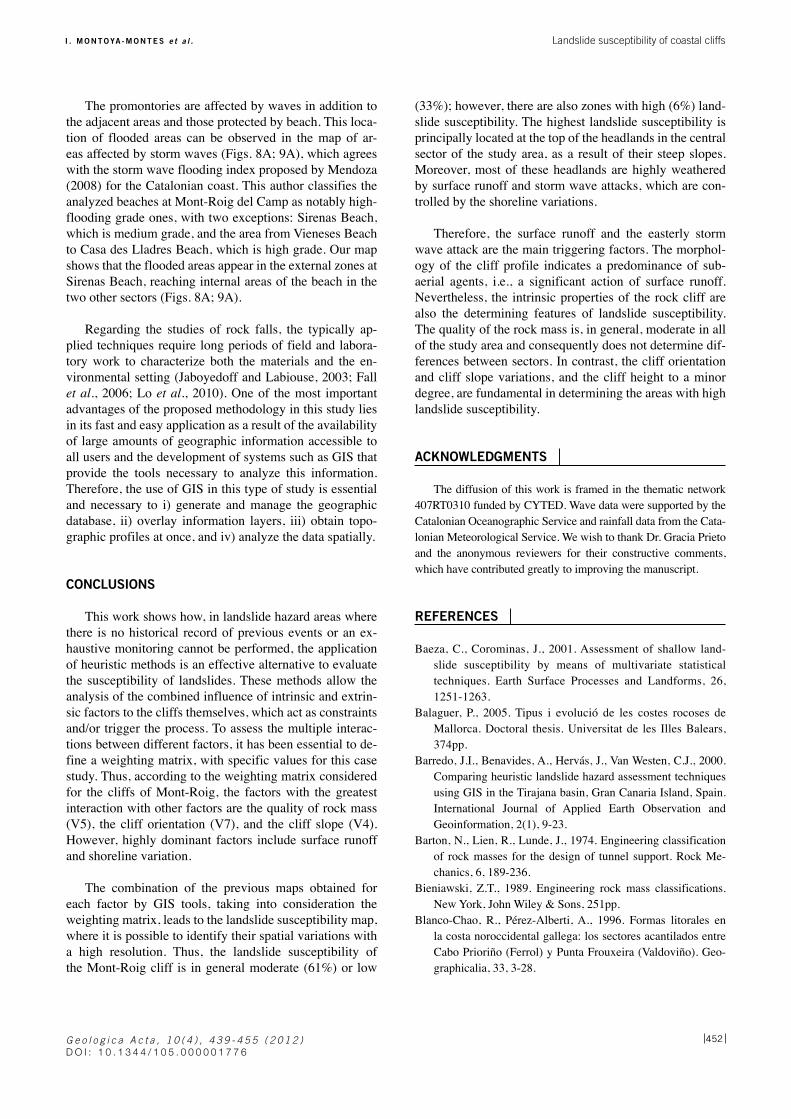
Storm wave type Frequency (%) Hs (m) T (s) Duration (h) Energy (kJ/m) Return period (y)I Weak 50.68 2.46 5.9 14.78 0.73·105 <1II Moderate 34.25 3.09 6.3 26.44 1.82·105 1.18III Significant 8.22 3.83 6.8 19.17 1.95·105 2.68IV Severe 4.11 4.47 7.1 49.67 6.35·105 5.45V Extreme 2.74 5.73 8.15 39 6.83·105 21.99
Table 3
Potential failures Cliff orientation N NE E SE S SW W NW
W 178 - 20 - X - X - - - -W 178 - 76 - X - X - - - -W 178 - 148 X - - - - - - -W 20 - 76 - X - X - - - -W 20 - 148 X - - X - - - -W 76 - 148 - - X X - - - -P-178 - - X - - - X -P-20 - - X - - - X -P-76 X - - - X - - -P-148 - X - - - X - -Total 3 4 3 5 1 1 2 0

I . M O N T O YA - M O N T E S e t a l .
G e o l o g i c a A c t a , 1 0 ( 4 ) , 4 3 9 - 4 5 5 ( 2 0 1 2 )D O I : 1 0 . 1 3 4 4 / 1 0 5 . 0 0 0 0 0 1 7 7 6
Landslide susceptibility of coastal cliffs
442
Streams and gullies are prominent features in the study area, which experiences the typical torrential rainfall of the Mediterranean. This storm events causes high runoff rates and floods (López-Bermúdez and Gomáriz-Castillo, 2006), and soil erosion during the flood events supplies large amounts of sediment to the coast. The area experi-ences moderate temperatures (15.5 to 17ºC) and an annual rainfall between 500 and 600mm. Rainfall occurs mainly during spring and autumn, with September being the raini-est month (Catalonian Meteorological Service, 2008).
Mediterranean coasts are microtidal, and the tide regime in the study area ranges from +50cm to -30cm (data from Cambrils port). The wave regime shows three predominant wave approach directions: E, S, and NW. The shoreline orientation indicates that the cliffs of Mont-Roig del Camp are mostly exposed to waves from the E and S, which also have the longest fetches (Jiménez et al., 2000). The general bathymetry in the study area exhibits a narrow and steeped shelf in contrast with the broad shelf at Ebro Delta (Fig. 3).
At present, the top of the cliffs is densely developed (Fig. 1B), as a result of tourism during the summer. The base of the cliffs has a mixed character, with active zones alternating with inactive zones, because of the presence of several narrow pocket beaches, which are intensely used for recreation from June to September. The local govern-ment has established certain restricted areas because of rock fall hazards affecting the beaches as a consequence of high levels of weathering and degradation. Several stud-ies related to littoral dynamics (Jiménez et al., 2000; Men-doza, 2008), paleoseismicity (Masana, 1995; CSN, 2001; Perea et al., 2003), hydrology (López-Geta et al., 1989), and coastal management (MMA, 2002; HIDTMA, 2002; Villanueva and Galofré, 2002; Galofré, 2005) have been conducted in this area. However, none of them included an analysis of the possible factors that contribute to increases in cliff front weakness.
MATERIALS ANd METHOdS
The procedure to design the landslide susceptible map is based on the knowledge of the factors that cause insta-bility in the study area. This heuristic approach is valid in zones with homogeneous conditions and of a medium scale (González de Vallejo et al., 2002). The following steps have been completed: i) identification of factors causing insta-bility, ii) assignment of values to each factor according to its contribution to the cliff instability, iii) weighting matrix generation with factors ordered and weighted according to their influence in the landslide formation process (Carrara et al., 1995), and iv) establishment of a susceptibility map. Stages ii and iv were completed with ArcGIS software, which allowed the processing of information in addition to numerous analyses using different data combinations.
Identification of factors affecting the cliff stability
According to the geographic and geologic characteris-tics of the study area, the variables chosen to characterize the stability of the area include the following: wave expo-sure, shoreline variations, cliff height, cliff slope, geotech-nical quality of the rock mass, superficial runoff, and cliff orientations favoring landslides. Each factor was rated in several classes depending on the influence of each factor in the landslide generation. Thus, classes with higher values will contribute to landslide occurrence in a higher grade than classes with lower values.
Wave exposure
To determine the wave exposure of the cliff, storm waves and run-up analyses were conducted. Wave data for a 17-year period (from 1990 to 2007) were obtained from the directional buoy located east of Tortosa (Fig. 3). From this database, 83 storm events were identified and classified according to the significant wave height (Hs) fol-lowing the criteria of Mendoza (2008) for the Catalonian coast. The statistical analysis of these storms allows for the characterization of their typical ranges in approach direc-tion, significant wave height (Hs), peak period (Tp) and frequency (Table 1).
The analysis of the wave propagation and impact for each approach direction was obtained by numerical simula-tions with the SMC software (GIOC, 2000), considering the bathymetry (Fig. 3) and defining three nested grids for each ap-proach direction, with successive higher resolution coastward.
Several equations have been proposed to calculate the maximum elevation reached by waves over the emerged beach or wave run-up (e.g., Iribarren and Nogales, 1949; Hunt, 1959; Holman, 1986; Mase, 1989). However, in this study, the more recent expression of Stockdon et al. (2006)
300000 320000 340000 3600004490
000
4510
000
4530
000
4550
000
0 m5 m10 m20 m30 m40 m50 m60 m70 m80 m90 m100 m120 m140 m160 m180 m200 m
0 10 20K m
Bathymetric map of the study area (white box) and location of the Tortosa buoy.FIGURE 3

G e o l o g i c a A c t a , 1 0 ( 4 ) , 4 3 9 - 4 5 5 ( 2 0 1 2 )D O I : 1 0 . 1 3 4 4 / 1 0 5 . 0 0 0 0 0 1 7 7 6
I . M O N T O YA - M O N T E S e t a l . Landslide susceptibility of coastal cliffs
443
was used because it has been tested in a full range of beach conditions.
The topography of the pocket beaches was obtained using differential GPS (obtaining a total of 16,033 data values), homogenously distributed along the beach, with a distance of 1m between the profiles and with an accu-racy of 25cm or less. These data were combined with the 1:10,000 digital map supplied by the Mont-Roig del Camp council to design the complete Digital Elevation Model (DEM) (cliff and beach) by the nearest neighbor interpola-tion method (Fig. 4).
Run-up was calculated using more than 53 beach pro-files obtained from the DEM. Next, using GIS software, the elevation reached by sea water was represented on each beach profile. The areas where the wave run-up reaches the cliff toe during extreme storms were identified and mapped as active areas. According to the contribution of this vari-able in the cliff stability, an assignment of values for this factor was proposed, with a value of 0 assigned for no ac-tion of waves and a value of 1 for a cliff affected by waves.
Shoreline variations
Shoreline analyses at the medium/long term are com-monly achieved through the comparison of aerial pho-tographs from dates significantly separated in time, and with a similar scale (Moore, 2000; Cruz de Oliveira et al., 2008; Lorenzo et al., 2007). The comparison of aerial photographs taken in 1964 and 2003 allowed the identifi-cation of shoreline migration as a result of beach erosion and the accretion processes, which implies an increasing or decreasing wave exposure of cliffs, respectively. The as-signed values to each class were a value of 1 for erosion, a value of 0 for equilibrium, and a value of -1 for accretion.
Cliff height and slope
From the cliff height data, obtained from the Digital Elevation Model, it was possible to digitize polygons along the slope with the value of the cliff top height in that portion of cliff. Next, to consider their influence in the landslide susceptibility, these polygons were ranked in five classes accordingtotheirheightvalues:value1(h≤2m),value2(2<h≤5m),value3(5<h≤10m),value4(10<h≤15m),andvalue 5 (h>15m). Similarly, the slope map was reclassified into five classes: value 1 (0-20º), value 2 (21-35º), value 3 (36-50º), value 4 (51-65º), and value 5 (>65º).
Quality of rock mass
The quality of the rock mass was determined through the description of the rock matrix and discontinuities (field and laboratory), the resistance parameters calculation, and
1 Isabel Montoya Montes
Figure 2
Table 1
Approach direction ENE to ESE SSE to SSW WNW to NNW Hs (m) 2.5 to 4 2 to 3.5 2 to 3.5 Tp (s) 5 to 8 5 to 7 4 to 6 Events 1373 167 343 Annual frequency (%) 2.02 0.25 0.51
Table 2
Storm wave type Frequency (%) Hs (m) T (s) Duration (h) Energy (kJ/m) Return period (y)I Weak 50.68 2.46 5.9 14.78 0.73·105 <1II Moderate 34.25 3.09 6.3 26.44 1.82·105 1.18III Significant 8.22 3.83 6.8 19.17 1.95·105 2.68IV Severe 4.11 4.47 7.1 49.67 6.35·105 5.45V Extreme 2.74 5.73 8.15 39 6.83·105 21.99
Table 3
Potential failures Cliff orientation N NE E SE S SW W NW
W 178 - 20 - X - X - - - -W 178 - 76 - X - X - - - -W 178 - 148 X - - - - - - -W 20 - 76 - X - X - - - -W 20 - 148 X - - X - - - -W 76 - 148 - - X X - - - -P-178 - - X - - - X -P-20 - - X - - - X -P-76 X - - - X - - -P-148 - X - - - X - -Total 3 4 3 5 1 1 2 0
DEM of the cliffs at Mont-Roig del Camp. Pixel size: 1m. Orthophotograph base from ICC (2006).FIGURE 4
Typical values of storm wave events recorded in the buoy located eastward of Tortosa from 1990 to 2007TABLE 1

I . M O N T O YA - M O N T E S e t a l .
G e o l o g i c a A c t a , 1 0 ( 4 ) , 4 3 9 - 4 5 5 ( 2 0 1 2 )D O I : 1 0 . 1 3 4 4 / 1 0 5 . 0 0 0 0 0 1 7 7 6
Landslide susceptibility of coastal cliffs
444
obtainment of the quality indexes using geomechanical classifications.
In the first stage of the data acquisition during field sur-veys, the cliff front was divided into homogeneous sets, which were described geologically (Fig. 5). A detailed study of rock matrix properties (i.e., lithology, surface alteration products, tectonic and sedimentary structures, fracture density, resistance, weathering degree, presence of water and sclerometer resistance) and the discontinui-ties (i.e., type, dip direction, dip, spacing between joints, continuity, aperture, roughness, infilling) affecting the rock mass was conducted for each cliff front set. During a sec-ond stage at the geotechnical laboratory, 90 tests were con-ducted: a density calculation with mercury; the Point Load Test; and the Slake Durability Test.
Next, the resistance parameters were determined (i.e., the angle of internal friction and cohesion), and finally, the quality indexes were obtained from the geomechanical classifications Rock Mass Rating (RMR) of Bieniawski (1989) and Q of Bar-ton et al. (1974). Since lower quality values were obtained by the Q classification, this Q criterion was used. Next, the assigned coding to each class according to the Q values was as follows; value 1: excellent quality; value 2: good quality; value 3: moder-ate quality; value 4: poor quality; and value 5: very poor quality.
Surface runoff
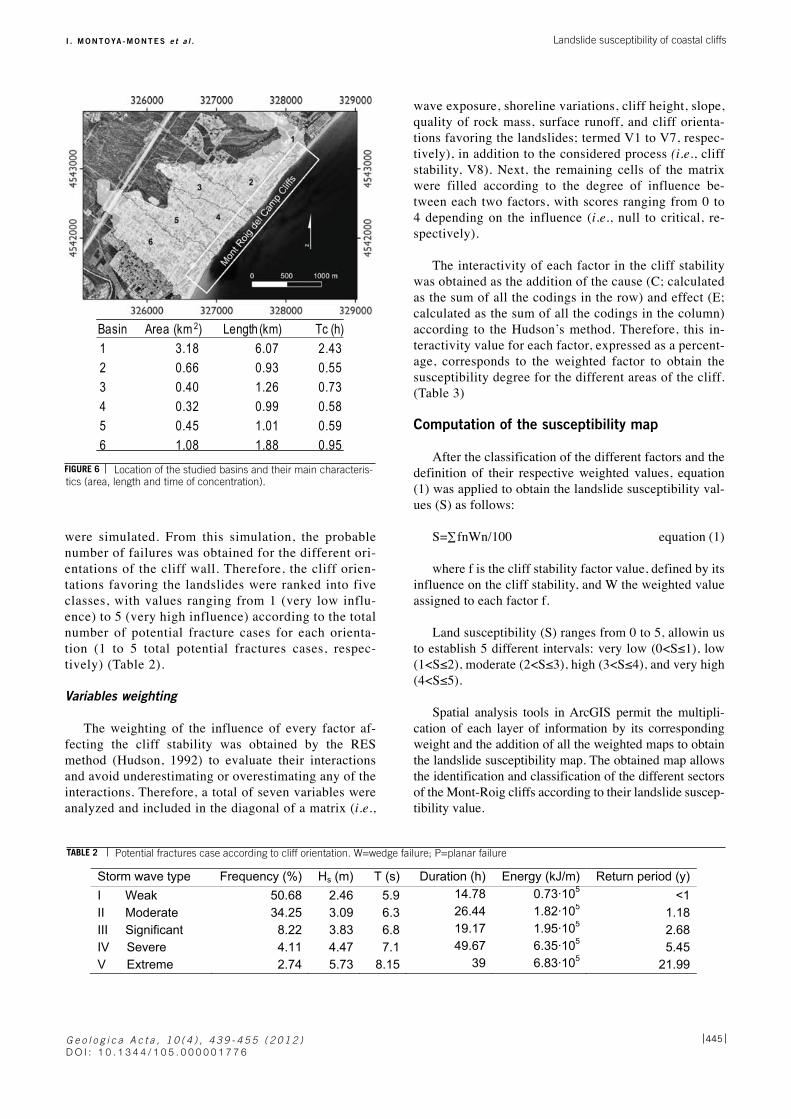
The influence of surface water processes in rock weath-ering is determined through the calculation of the surface runoff flow following the method of MOPU (1990) modi-fied by Témez (1991) and Ferrer (1993). This method has been applied to the different basins in the study area (Fig. 6), using the rainfall time-series (1994-2007) available for the Cambrils weather station.
The maximum surface runoff flow at the top of the cliff was estimated for different recurrence intervals and for a recurrence interval of 50 years. A value proportional to the contribution of every basin to the cliff stability was assigned: value 1 (Q≤20m3/h), value 2 (20<Q≤40m3/h),value 3 (40<Q≤60m3/h), value 4 (60<Q≤80m3/h), andvalue 5 (Q>80m3/h).
Cliff orientations favoring the landslides
The areas with the higher probability of potential fractures were defined to be more susceptible to cliff instability. Taking this into account and considering the pattern of preferred fracture orientation obtained from the characterization of the rock mass, differ-ent scenarios for probable planar and wedge failures
Field scheme of the cliff front. The area covered by calcareous crust is shaded in grey. Dotted lines corresponds to contacts between differ-ent units. Location of rock samples is indicated.FIGURE 5
G e o l o g i c a A c t a , 1 0 ( 4 ) , 4 3 9 - 4 5 5 ( 2 0 1 2 )D O I : 1 0 . 1 3 4 4 / 1 0 5 . 0 0 0 0 0 1 7 7 6
I . M O N T O YA - M O N T E S e t a l . Landslide susceptibility of coastal cliffs
445
were simulated. From this simulation, the probable number of failures was obtained for the different ori-entations of the cliff wall. Therefore, the cliff orien-tations favoring the landslides were ranked into five classes, with values ranging from 1 (very low influ-ence) to 5 (very high influence) according to the total number of potential fracture cases for each orienta-tion (1 to 5 total potential fractures cases, respec-tively) (Table 2).
Variables weighting
The weighting of the influence of every factor af-fecting the cliff stability was obtained by the RES method (Hudson, 1992) to evaluate their interactions and avoid underestimating or overestimating any of the interactions. Therefore, a total of seven variables were analyzed and included in the diagonal of a matrix (i.e.,
wave exposure, shoreline variations, cliff height, slope, quality of rock mass, surface runoff, and cliff orienta-tions favoring the landslides; termed V1 to V7, respec-tively), in addition to the considered process (i.e., cliff stability, V8). Next, the remaining cells of the matrix were filled according to the degree of influence be-tween each two factors, with scores ranging from 0 to 4 depending on the influence (i.e., null to critical, re-spectively).
The interactivity of each factor in the cliff stability was obtained as the addition of the cause (C; calculated as the sum of all the codings in the row) and effect (E; calculated as the sum of all the codings in the column) according to the Hudson’s method. Therefore, this in-teractivity value for each factor, expressed as a percent-age, corresponds to the weighted factor to obtain the susceptibility degree for the different areas of the cliff. (Table 3)
Computation of the susceptibility map
After the classification of the different factors and the definition of their respective weighted values, equation (1) was applied to obtain the landslide susceptibility val-ues (S) as follows:
S=∑fnWn/100 equation(1)
where f is the cliff stability factor value, defined by its influence on the cliff stability, and W the weighted value assigned to each factor f.
Land susceptibility (S) ranges from 0 to 5, allowin us toestablish5differentintervals:verylow(0<S≤1),low(1<S≤2),moderate(2<S≤3),high(3<S≤4),andveryhigh(4<S≤5).
Spatial analysis tools in ArcGIS permit the multipli-cation of each layer of information by its corresponding weight and the addition of all the weighted maps to obtain the landslide susceptibility map. The obtained map allows the identification and classification of the different sectors of the Mont-Roig cliffs according to their landslide suscep-tibility value.
Basin Area (km 2) Length (km) Tc (h)
1 3.18 6.07 2.43
2 0.66 0.93 0.55
3 0.40 1.26 0.73
4 0.32 0.99 0.58
5 0.45 1.01 0.59
6 1.08 1.88 0.95
Location of the studied basins and their main characteris-tics (area, length and time of concentration).FIGURE 6
1 Isabel Montoya Montes
Figure 2
Table 1
Approach direction ENE to ESE SSE to SSW WNW to NNW Hs (m) 2.5 to 4 2 to 3.5 2 to 3.5 Tp (s) 5 to 8 5 to 7 4 to 6 Events 1373 167 343 Annual frequency (%) 2.02 0.25 0.51
Table 2
Storm wave type Frequency (%) Hs (m) T (s) Duration (h) Energy (kJ/m) Return period (y)I Weak 50.68 2.46 5.9 14.78 0.73·105 <1II Moderate 34.25 3.09 6.3 26.44 1.82·105 1.18III Significant 8.22 3.83 6.8 19.17 1.95·105 2.68IV Severe 4.11 4.47 7.1 49.67 6.35·105 5.45V Extreme 2.74 5.73 8.15 39 6.83·105 21.99
Table 3
Potential failures Cliff orientation N NE E SE S SW W NW
W 178 - 20 - X - X - - - -W 178 - 76 - X - X - - - -W 178 - 148 X - - - - - - -W 20 - 76 - X - X - - - -W 20 - 148 X - - X - - - -W 76 - 148 - - X X - - - -P-178 - - X - - - X -P-20 - - X - - - X -P-76 X - - - X - - -P-148 - X - - - X - -Total 3 4 3 5 1 1 2 0
Potential fractures case according to cliff orientation. W=wedge failure; P=planar failureTABLE 2

I . M O N T O YA - M O N T E S e t a l .
G e o l o g i c a A c t a , 1 0 ( 4 ) , 4 3 9 - 4 5 5 ( 2 0 1 2 )D O I : 1 0 . 1 3 4 4 / 1 0 5 . 0 0 0 0 0 1 7 7 6
Landslide susceptibility of coastal cliffs
446
RESuLTS
Wave exposure
Easterly storm waves are clearly the most frequent, with a typical range of Hs from 2.5 to 4m and Tp from 5 to 8s, while storm events from the SSE to SSW, with similar or lower energy and Tp, are scarce (Table 1). Be-cause of the position and shoreline orientation of the Mont Roig cliffs, the WNW to NNW storm waves recorded in the Tortosa buoy were disregarded in the following stages of this study.
Easterly storm wave characterization (Table 4) demon-strates that the most frequent storm waves are weak and moderate. As expected, all the analyzed parameters in-crease as the storm type increases in importance (higher wave height), except the storm duration, which does not show a clear relationship with the others.
The numerical wave propagation analysis demonstrat-ed that easterly storm waves are also the most damaging in the study area (Fig. 7), and consequently, the calculation of the run-up was conducted for easterly storm waves, as they are the most relevant factor affecting cliff stability.
Run-up values increase with slope and storm wave mag-nitude, ranging from 1.49 to 3.91m high. Combining these run-up values and the topography, the more active zones of the cliffs during extreme easterly storm waves are located in the headlands (Figs. 8A, 9A); however, active cliff zones also exist in the backshore of certain pocket beaches.
Shoreline variations
The Mont-Roig shoreline is in general stable; however, two sectors with a different pattern can be identified from the comparison of the 1964 and 2003 aerial photographs. The south-western sector (Fig. 10, beach profiles 1 to 45) has an average accretion rate of 0.4 m/y. In contrast, the north-eastern sector (Fig. 10, beach profiles 46 to 135) is mainly dominated by erosion in the headland, with an average rate of -0.2 m/y; however, the Mont-Roig shoreline also presents three short sectors dominated by accretion (Figs. 8B; 9B).
Thus, the map representing the influence of the shoreline variations to the cliff instability shows a positive contribu-tion to the cliff instability in the headlands and a negative contribution in the southwest sector in addition to certain pocket beaches of the north-eastern sector (Figs. 8B; 9B).
Cliff height and slope
The cliff elevation is approximately 15m in the southwest-ern sector and decreases by 2m at the northeastern sector (Figs. 8C; 9C). Most of the talus slopes range from 20 to 50º (Fig. 8D; 9D). The steepest talus slopes (>50º) are located at the top of the cliff while the foot has a smooth slope. These results demonstrate the influential action of subaerial processes, as proposed by the Emery and Kuhn criterion (1982).
Quality of the rock mass
The rock mass that forms the cliffs at Mont-Roig del Camp appears notably fractured and weathered. The qual-
1 Isabel Montoya Montes
Figure 2
Table 1
Approach direction ENE to ESE SSE to SSW WNW to NNW Hs (m) 2.5 to 4 2 to 3.5 2 to 3.5 Tp (s) 5 to 8 5 to 7 4 to 6 Events 1373 167 343 Annual frequency (%) 2.02 0.25 0.51
Table 2
Storm wave type Frequency (%) Hs (m) T (s) Duration (h) Energy (kJ/m) Return period (y)I Weak 50.68 2.46 5.9 14.78 0.73·105 <1II Moderate 34.25 3.09 6.3 26.44 1.82·105 1.18III Significant 8.22 3.83 6.8 19.17 1.95·105 2.68IV Severe 4.11 4.47 7.1 49.67 6.35·105 5.45V Extreme 2.74 5.73 8.15 39 6.83·105 21.99
Table 3
Potential failures Cliff orientation N NE E SE S SW W NW
W 178 - 20 - X - X - - - -W 178 - 76 - X - X - - - -W 178 - 148 X - - - - - - -W 20 - 76 - X - X - - - -W 20 - 148 X - - X - - - -W 76 - 148 - - X X - - - -P-178 - - X - - - X -P-20 - - X - - - X -P-76 X - - - X - - -P-148 - X - - - X - -Total 3 4 3 5 1 1 2 0
2 Isabel Montoya Montes
Table 4
Factors Interactivity (C+E) Weight (%) Wave exposure (V1) 21 15.00 Shoreline variations (V2) 17 12.14 Cliff height (V3) 12 8.57 Cliff slope (V4) 24 17.14 Quality of rock mass (V5) 25 17.86 Surface runoff (V6) 16 11.43 Cliff orientation (V7) 25 17.86 Total 140 100
Interactivity and weight of factors favoring landslides on the Mont-Roig cliffTABLE 3
Main features of the storm waves approaching from the east. These parameters were calculated from the data available from the Catalonian Oceanographic Service
TABLE 4
Wave propagation for easterly storm waves (Hs=2.5m; Tp=6s).FIGURE 7

G e o l o g i c a A c t a , 1 0 ( 4 ) , 4 3 9 - 4 5 5 ( 2 0 1 2 )D O I : 1 0 . 1 3 4 4 / 1 0 5 . 0 0 0 0 0 1 7 7 6
I . M O N T O YA - M O N T E S e t a l . Landslide susceptibility of coastal cliffs
447
Meters
Classified factor maps for SW coastal stretch: A) Wave exposure; B) Shoreline variations; C) Cliff height; D) Cliff slope; E) Quality of rock mass; F) Surface runoff; and G) Cliff orientations favoring the landslides. Orthophotograph base from ICC (2006).FIGURE 8

I . M O N T O YA - M O N T E S e t a l .
G e o l o g i c a A c t a , 1 0 ( 4 ) , 4 3 9 - 4 5 5 ( 2 0 1 2 )D O I : 1 0 . 1 3 4 4 / 1 0 5 . 0 0 0 0 0 1 7 7 6
Landslide susceptibility of coastal cliffs
448
Classified factor maps for NE coastal stretch: A) Wave exposure; B) Shoreline variations; C) Cliff height; D) Cliff slope; E) Quality of rock mass; F) Surface runoff; and G) Cliff orientations favoring the landslides. Orthophotograph base from ICC (2006).FIGURE 9

G e o l o g i c a A c t a , 1 0 ( 4 ) , 4 3 9 - 4 5 5 ( 2 0 1 2 )D O I : 1 0 . 1 3 4 4 / 1 0 5 . 0 0 0 0 0 1 7 7 6
I . M O N T O YA - M O N T E S e t a l . Landslide susceptibility of coastal cliffs
449
ity of the rock mass in terms of geotechnical parameters (Barton et al., 1974) (i.e., strength of rock material, de-gree of jointing, condition of discontinuities, groundwa-ter conditions, stress parameters) is moderate or poor in certain sections of the cliff wall, especially in the prom-ontories, where rocky blocks of various dimensions ap-pear (Figs. 8E; 9E).
Surface runoff
Basins 1, 2 and 4 exhibit the lowest surface runoff flow for a recurrence interval of 50 years (Figs. 6; 11). Basin 6 has moderate flow, and finally, basins 3 and 5 have the largest runoff flows. Thus, the basins were clas-sified according to the previously established criteria: value 2 includes basins 1, 2 and 4; value 3 includes basin 6; value 4 includes basin 3; and value 5 includes basin 5 (Figs. 8F; 9F).
Cliff orientations favoring the landslides
The number and type of failure cases (i.e., W, wedge; P, Planar) for each talus orientation are indicated in Table 2. For example, the wedge failure between the joints trending N178 and N20 will only occur for talus oriented NE or SE. Therefore, it can be inferred that the SE and NE oriented taluses have the highest number of potential failure cases followed by the N and E oriented taluses, while the S, SW, W and NW oriented taluses are the least favorable to gen-erate landslides. Thus different talus orientations show the same number of potential failure cases (i.e., SE and NE), and consequently, they have been classified and mapped with the same value of contribution to landslide failure (Figs. 8G and 9G)).
Weighting matrix
The weighting matrix designed for the study case of the Mont-Roig cliffs is shown in Figure 12. A detailed ex-planation of the criteria used for value assignment in this matrix can be found in Montoya (2008). According to this matrix, the quality of the rock mass (V5), the cliff orienta-tion (V7), and the cliff slope (V4) have higher interactiv-ity (C+E) than the other variables, and consequently, they have higher values in the weighting (Table 3).
The graphic representation of C versus E (Hudson and Harrison, 1996) indicates that the shoreline variations (V2)
Erosión
Acreción
Profiles
Sho
relin
e va
riat
ion
(m /
y)
Longshore distance (m)
Erosion
Accretion
Shoreline variations (m/y) for period 1964-2003. Orthophotograph base from ICC (2006).FIGURE 10
Maximum surface runoff flow at the top of the cliff for dif-ferent recurrence intervals and for each basin.FIGURE 11

I . M O N T O YA - M O N T E S e t a l .
G e o l o g i c a A c t a , 1 0 ( 4 ) , 4 3 9 - 4 5 5 ( 2 0 1 2 )D O I : 1 0 . 1 3 4 4 / 1 0 5 . 0 0 0 0 0 1 7 7 6
Landslide susceptibility of coastal cliffs
450
and the surface runoff (V6) exhibit greater dominance than the other variables, followed by the slope (V4) and the wave exposure (V1) (Fig. 13). In contrast, the quality of rock mass (V5), the cliff height (V3), and, especially, the cliff orientation (V7), do not demonstrate a relevant domi-nance. The dominance of the factors V2 and V6 imply that they receive a lower influence of the remaining factors. This result can be explained because both V2 and V6 are related to processes that are independent from the intrinsic characteristics of the cliffs.
Susceptibility map
The landslide susceptibility map shows that, over a to-tal of 42,700 m2 at the Mont-Roig cliff, there is a clear prevalence of surfaces with moderate (61%) or low land-slide susceptibility (33%), while areas with high (6%) landslide susceptibility are scarce (Fig. 14).
The highest landslide susceptibility is located at the top of the headlands, because they have the steepest slopes. Furthermore, most of these headlands are highly weathered because they are exposed to storm wave attacks, which are evident by the presence of many fallen blocks in the toe and basal undercutting, and the effect of surface runoff, which depends on the characteristics of each basin (Fig. 6). Finally, the effect of shoreline variations also influences the exposure or protection of these headlands to wave at-tack.
dISCuSSION
The landslide instability analysis usually employs a historical record of previous events to determine the haz-ard (Carrara et al., 1991; Mateos, 2001; Gorsevski et al.,
2006; Budetta et al., 2008,) and monitoring events that oc-cur over the study period (Balaguer, 2005). Nevertheless, in this study, a historical record of previous events was not available, and the free access to the coastal area prevented the use of traps to determine the falling volume or similar techniques to monitor the current landslides. Therefore, the lack of data regarding the previous landslide distribu-tions hindered the ability to apply probabilistic methods, as these methods are based on the relationships of each factor with previous and current landslides (Carrara et al., 1995). Thus, it was necessary to apply the heuristic method.
The landslide and retreat cliff studies, either by probabi-listic (Lee et al., 2001), deterministic (Godt et al., 2008) or heuristic methods (Nunes et al., 2009; Budetta et al., 2008) of hazard determination normally do not include a geotech-nical and geomechanical characterization of the rock cliff. However, most of the studies agree that these analyses are necessary to obtain more accurate results. In cases with sev-eral lithologies, the properties of each material are commonly considered to classify the material resistance, according to tabulated values (Budetta et al., 2008; Castellanos and Van Westen, 2008; Ruff and Czurda, 2008); however, the specific geomechanical properties of the outcrop and their spatial variations are not typically considered. In contrast, this study attaches the adequate importance to the classical geomechan-ical analysis, as a basic tool for cliff characterization.
Several limitations arose within the geomechanical study, including the difficulty to clearly distinguish joint families or to determine the resistance of notably heteroge-neous materials (i.e., conglomerates with a moderate to high
Cause V1 0 1 2 3 0 3 3 12 3 V2 1 3 3 0 2 2 14 0 0 V3 3 0 0 0 2 5 2 0 3 V4 0 3 3 3 14 3 2 0 0 V5 0 4 4 13 0 0 0 2 4 V6 3 4 13 1 1 2 0 2 0 V7 4 10 0 0 0 0 0 0 0 V8 0 Effect 9 3 7 10 12 3 15 22 81
8x8 weighting matrix with the interactions of the factors controlling the cliff stability. V1: Wave exposure; V2: Shoreline vari-ations; V3: Cliff height; V4: Cliff slope; V5: Quality of rock mass; V6: Surface Runoff; V7: Cliff orientation; and V8: Landslides. Value 0: null influence; Value 1: Poor influence; Value 2: Moderate influence; Value 3: Strong influence; and Value 4: Critical influence.
FIGURE 12
Cause-Effect diagram. Dotted lines represent the interac-tivity contour lines (C+E).FIGURE 13

G e o l o g i c a A c t a , 1 0 ( 4 ) , 4 3 9 - 4 5 5 ( 2 0 1 2 )D O I : 1 0 . 1 3 4 4 / 1 0 5 . 0 0 0 0 0 1 7 7 6
I . M O N T O YA - M O N T E S e t a l . Landslide susceptibility of coastal cliffs
451
degree of weathering, where it was necessary to validate the sclerometer fieldwork data with the PLT test in the labora-tory). Despite these difficulties, the results of the rock mass characterization are essential to determine their parameters of resistance (i.e., angle of internal friction and cohesion) and consequently to delimit zones of good or poor quality according to the geomechanical classifications. Moreover, this analysis has produced geotechnical and geomechanical data of conglomerates, a scarcely documented material.
The relevance of the quality of the rock mass is also apparent in the multi-factorial analysis of the landslide sus-ceptibility. Thus, this factor, together with cliff orientation, shows the highest influence in the cliff instability, accord-ing to their interactivity (Table 3).
This parameter is essential to determine the occurrence of planar and wedged slides, as a result of the critical parameter of the angle of internal friction along the joints, which is an intrinsic property of the rock mass. Furthermore, the quality of the rock mass also contributes to facilitating or impeding wave erosion, according to the resistance of the material. In contrast, the quality of the rock mass is also conditioned by other factors, including the presence of water due to surface runoff or the occurrence of landslides favoring the weather-ing process. The wave exposure and the shoreline variations also have a strong influence due to the basal cliff erosion, which modifies the rock’s tensional state and consequently leads to the generation of new joints.
Following Emery and Kuhn (1982) and Trenhaile’s (1987) criteria, through DEM analysis, the most important factor in reshaping the cliffs in the study area is the action of subaerial processes, while marine processes are less active.
Nevertheless, the discontinuous wave action is of great importance, and the possibility of rock falls during storms should not be disregarded (Blanco-Chao and Pérez-Alber-
ti, 1996), because of the weathered and fractured cliff state in certain sections. The headland/beach configuration, in general, is related to the orientation of weakness planes (Blanco-Chao and Pérez-Alberti, 1996). The fallen blocks at the cliff front generate wave canals (Fig. 15) that locally increase water velocity. The combination of higher water velocity and a fractured, cracked cliff front results in the retreat of the cliff toe, which indicates that the coastal mor-phology is conditioned by structural factors.
S.L.
A
B
Landslide susceptibility map. Orthophotograph base from ICC (2006).FIGURE 14
A) Basal erosion in the sea-cliffs because of the pres-ence of rocky blocks or rock fragments piled up in front of the cliff wall (modified from Blanco-Chao and Perez-Alberti, 1996). B) Rocky blocks at the Mont-Roig del Camp cliffs.
FIGURE 15
I . M O N T O YA - M O N T E S e t a l .
G e o l o g i c a A c t a , 1 0 ( 4 ) , 4 3 9 - 4 5 5 ( 2 0 1 2 )D O I : 1 0 . 1 3 4 4 / 1 0 5 . 0 0 0 0 0 1 7 7 6
Landslide susceptibility of coastal cliffs
452
The promontories are affected by waves in addition to the adjacent areas and those protected by beach. This loca-tion of flooded areas can be observed in the map of ar-eas affected by storm waves (Figs. 8A; 9A), which agrees with the storm wave flooding index proposed by Mendoza (2008) for the Catalonian coast. This author classifies the analyzed beaches at Mont-Roig del Camp as notably high-flooding grade ones, with two exceptions: Sirenas Beach, which is medium grade, and the area from Vieneses Beach to Casa des Lladres Beach, which is high grade. Our map shows that the flooded areas appear in the external zones at Sirenas Beach, reaching internal areas of the beach in the two other sectors (Figs. 8A; 9A).
Regarding the studies of rock falls, the typically ap-plied techniques require long periods of field and labora-tory work to characterize both the materials and the en-vironmental setting (Jaboyedoff and Labiouse, 2003; Fall et al., 2006; Lo et al., 2010). One of the most important advantages of the proposed methodology in this study lies in its fast and easy application as a result of the availability of large amounts of geographic information accessible to all users and the development of systems such as GIS that provide the tools necessary to analyze this information. Therefore, the use of GIS in this type of study is essential and necessary to i) generate and manage the geographic database, ii) overlay information layers, iii) obtain topo-graphic profiles at once, and iv) analyze the data spatially.
CONCLuSIONS
This work shows how, in landslide hazard areas where there is no historical record of previous events or an ex-haustive monitoring cannot be performed, the application of heuristic methods is an effective alternative to evaluate the susceptibility of landslides. These methods allow the analysis of the combined influence of intrinsic and extrin-sic factors to the cliffs themselves, which act as constraints and/or trigger the process. To assess the multiple interac-tions between different factors, it has been essential to de-fine a weighting matrix, with specific values for this case study. Thus, according to the weighting matrix considered for the cliffs of Mont-Roig, the factors with the greatest interaction with other factors are the quality of rock mass (V5), the cliff orientation (V7), and the cliff slope (V4). However, highly dominant factors include surface runoff and shoreline variation.
The combination of the previous maps obtained for each factor by GIS tools, taking into consideration the weighting matrix, leads to the landslide susceptibility map, where it is possible to identify their spatial variations with a high resolution. Thus, the landslide susceptibility of the Mont-Roig cliff is in general moderate (61%) or low
(33%); however, there are also zones with high (6%) land-slide susceptibility. The highest landslide susceptibility is principally located at the top of the headlands in the central sector of the study area, as a result of their steep slopes. Moreover, most of these headlands are highly weathered by surface runoff and storm wave attacks, which are con-trolled by the shoreline variations.
Therefore, the surface runoff and the easterly storm wave attack are the main triggering factors. The morphol-ogy of the cliff profile indicates a predominance of sub-aerial agents, i.e., a significant action of surface runoff. Nevertheless, the intrinsic properties of the rock cliff are also the determining features of landslide susceptibility. The quality of the rock mass is, in general, moderate in all of the study area and consequently does not determine dif-ferences between sectors. In contrast, the cliff orientation and cliff slope variations, and the cliff height to a minor degree, are fundamental in determining the areas with high landslide susceptibility.
ACKNOWLEdGMENTS
The diffusion of this work is framed in the thematic network 407RT0310 funded by CYTED. Wave data were supported by the Catalonian Oceanographic Service and rainfall data from the Cata-lonian Meteorological Service. We wish to thank Dr. Gracia Prieto and the anonymous reviewers for their constructive comments, which have contributed greatly to improving the manuscript.
REFERENCES
Baeza, C., Corominas, J., 2001. Assessment of shallow land-slide susceptibility by means of multivariate statistical techniques. Earth Surface Processes and Landforms, 26, 1251-1263.
Balaguer, P., 2005. Tipus i evolució de les costes rocoses de Mallorca. Doctoral thesis. Universitat de les Illes Balears, 374pp.
Barredo, J.I., Benavides, A., Hervás, J., Van Westen, C.J., 2000. Comparing heuristic landslide hazard assessment techniques using GIS in the Tirajana basin, Gran Canaria Island, Spain. International Journal of Applied Earth Observation and Geoinformation, 2(1), 9-23.
Barton, N., Lien, R., Lunde, J., 1974. Engineering classification of rock masses for the design of tunnel support. Rock Me-chanics, 6, 189-236.
Bieniawski, Z.T., 1989. Engineering rock mass classifications. New York, John Wiley & Sons, 251pp.
Blanco-Chao, R., Pérez-Alberti, A., 1996. Formas litorales en la costa noroccidental gallega: los sectores acantilados entre Cabo Prioriño (Ferrol) y Punta Frouxeira (Valdoviño). Geo-graphicalia, 33, 3-28.

G e o l o g i c a A c t a , 1 0 ( 4 ) , 4 3 9 - 4 5 5 ( 2 0 1 2 )D O I : 1 0 . 1 3 4 4 / 1 0 5 . 0 0 0 0 0 1 7 7 6
I . M O N T O YA - M O N T E S e t a l . Landslide susceptibility of coastal cliffs
453
Bonachea, J., 2006. Desarrollo, aplicación y validación de pro-cedimientos y modelos para la evaluación de amenazas, vul-nerabilidad y riesgo debidos a procesos geomorfológicos. Doctoral thesis. Universidad de Cantabria, 356pp.
Brabb, E.E., 1984. Innovative approaches to landslide hazard and risk mapping. In: Canadian Geotechnical Society (ed.). Proceedings 4th International Symposium on Landslides, To-ronto, 1, 307-323.
Brabb, E.E., Pampeyan, E.H., Bonilla, M.G., 1972. Landslide susceptibility in San Mateo County, California. U.S. Geologi-cal Survey, Miscellaneous Field Studies Map, MF-360.
Budetta, P., Santo, A., Vivenzio, F., 2008. Landslide Hazard map-ping along the coastline of the Cilento region (Italy) by means of a GIS-based parameter rating approach. Geomorphology, 94, 340-352.
Carrara, A., 1983. Multivariate models for landslide hazard eval-uation. Mathematical Geology, 15, 403-426.
Carrara, A., Cardinali, M., Detti, R., Guzzetti, F., Pasqui, V., Re-ichenbach, P.,1991. GIS techniques and statistical models in evaluating landslide hazard. Earth Surface Processes and Landforms, 16, 427-445.
Carrara, A., Cardinali, M., Guzzetti, F., Reichenbach, P., 1995. GIS technology in mapping landslide hazard. In: Carrara, A., Guzzetti, F. (eds.). Geographical Information Systems in As-sessing Natural Hazards. The Netherlands, Kluwer Academic Publisher, 135-175.
Castellanos, E.A., Van Westen, C.J., 2008. Qualitative landslide susceptibility assessment by multicriteria analysis: A case study from San Antonio del Sur, Guantánamo, Cuba. Geo-morphology, 94, 453-466.
Catalonian Meteorological Service, 2008. Butlletí Anual d’Indicadors Climàtics. Any 2007. Generalitat de Catalunya. Departament de Medi Ambient i Habitatge. Technical Report. 33pp.
Chung, C.F., Fabbri, A., 1993. The representation of geoscience information for data integration. Nonrenewable Resources, 2, 122-139.
Chung, C.F., Fabbri, A., Van Westen, C.J., 1995. Multivariate re-gression analysis for landslide hazard zonation. In: Carrara, A., Guzzetti, F. (eds.). Geographical Information Systems in Assessing Natural Hazards. The Netherlands, Kluwer Aca-demic Publishers, 107-133.
Corominas, J., 1987. Criterios para la confección de mapas de peligrosidad de movimientos de ladera. In: Instituto Geológ-ico y Minero de España (ed.). Riesgos Geológicos, Serie Ge-ología Ambiental. Madrid, Instituto Geológico y Minero de España (IGME), 193-201.
Cruden, D.M., Varnes, D.J., 1996. Landslide types and processes. In: Turner, A.K., Shuster, R.L. (eds.). Landslides: Investiga-tion and Mitigation. Transportation Research Board Special Report 247. Washington, National Academy Press, 36-75.
Cruz de Oliveira, S.M., Catalao, J., Ferreira, O., Dias, J.A., 2008. Evaluation of cliff retreat and beach nourishment in South-ern Portugal through photogrammetric techniques. Journal of Coastal Research, 24, 184-193.
CSN, 2001. Proyecto Datación. Madrid, Consejo de Seguridad Nuclear, 159pp.
Dai, F.C., Lee, C.F., 2001. Terrain-based mapping of landslide susceptibility using a geographical information system: a case study. Canadian Geotechnical Journal, 38, 911-923.
Del Río, L., Gracia, F.J., 2009. Erosion risk assessment of active coastal cliffs in temperate environments. Geomorphology, 112, 82-95.
Emery, K.O., Kuhn, G.G., 1982. Sea cliffs: their processes, pro-files, and classification. Geological Society of American Bul-letin, 93, 644-654.
Fabbri, A., Chung, C-J., Cendrero, A., Remondo, J., 2003. Is prediction of future landslides possible with a GIS? Natural Hazards, 30, 487-499.
Fall, M., Azzam, R., Noubactep, C., 2006. A multi-method ap-proach to study the stability of natural slopes and landslide susceptibility mapping. Engineering Geology, 82, 241-263.
Ferrer, F.J., 1993. Recomendaciones para el cálculo hidromete-orológico de avenidas. Madrid, CEDEX, Ministerio de Fo-mento, 76pp.
Foster, C.; Poulton, C.; Harrison, M., 2008. A national hazard as-sessment of coastal landslides using GI capture systems: a government dataset. In: AGI Geocommunity 08: shaping a changing world, Stratford-upon-Avon, UK, 24-25 Sept 08. British Geological Survey.
Galofré, J. 2005. Cliffs erosion management: an overview of Tarragona Coast. In: National Oceanic and Atmospheric Ad-ministration Coastal Services Center (ed.). New Orleans, Pro-ceedings 14th Biennial Coastal Zone Conference, 5pp.
GIOC, Grupo de Ingeniería Oceanográfica y de Costas, 2000. Sistema de Modelado Costero, SMC. Manual de referencia y del usuario. Universidad de Cantabria y Dirección General de Costas, Ministerio de Medio Ambiente, 197pp.
Godt, J.W, Baum, R.L, Savage, W.Z., Salciarini, D., Schulz, W.H., Harp, E.L., 2008. Transient deterministic shallow landslide modeling: Requirements for susceptibility and hazard assess-ments in a GIS framework. Engineering Geology, 102, 214-226.
González de Vallejo, L.I., Ferrer, M., Ortuño, L., Oteo, C., 2002. Ingeniería Geológica. Madrid, Prentice Hall, 715pp.
González-Díez, A., Remondo, J., Díaz de Terán, J.R., Cendrero, A., 1999. A methodological approach for the analysis of the temporal occurrence and triggering factors of landslides. Ge-omorphology, 30, 95-113.
Gorsevski, P.V., Gessler, P.E., Boll, J., Elliot, W.J., Foltz, R.B., 2006. Spatially and temporally distributed modelling of land-slide susceptibility. Geomorphology, 80, 178-198.
Hansen, A., 1984. Landslide hazard analysis. In: Brunsden, D., Prior, D.B. (eds.). Slope Instability. New York, Wiley & Sons, 523-602.
HIDTMA, 2002. Asistencia técnica regeneración senda peatonal, paseo, accesos y áreas de servicio en el tramo de costa com-prendido entre la Riera de la Pixerota y L’Estany Gelat, T.M. Montroig del Camp. Ref.: 43-1392. Technical Report.
Hill, S.E., Rosenbaum, M.S., 1998. Assessing the significant fac-tors in a rock weathering system. Quarterly Journal of Engi-neering Geology and Hydrogeology, 31, 85-94.

I . M O N T O YA - M O N T E S e t a l .
G e o l o g i c a A c t a , 1 0 ( 4 ) , 4 3 9 - 4 5 5 ( 2 0 1 2 )D O I : 1 0 . 1 3 4 4 / 1 0 5 . 0 0 0 0 0 1 7 7 6
Landslide susceptibility of coastal cliffs
454
Holman, R., 1986. Extreme value statistics for wave run-up on a natural beach. Coastal Engineering, 9(6), 527-544.
Hudson, J.A., 1992. Rock Engineering Systems: theory and prac-tice. Chichester, Ellis Horwood, 185pp.
Hudson, J.A., Harrison, J.P., 1996. Engineering and Rock Me-chanics: An Introduction to the principles. Amsterdam, Else-vier, 444pp.
Hunt, I.A., 1959. Design of seawalls and breakwaters. Journal of Waterways and Harbour Division, ASCE 85(WW3), 123-152.
Hutchinson, J.N., 1988. Morphological and geotechnical param-eters of landslides in relation to geology and hydrogeology. In: Bonnard, C. (ed.). Lausanne (Rotterdam), Proceedings 5th International Symposium on Landslides, Balkema, 1, 3-35.
ICC, 2006. Orthophotographs scale 1:5000. Instituto Cartográ-fico de Cataluña. Website: http://www.icc.es.
Iribarren, C.R., Nogales, C., 1949. Protection Des Ports. In: Pro-ceedings. Lisbon, XVIIth International Naval Congress, 31-80.
Irigaray, C., 1995. Movimientos de ladera: inventario, análisis y cartografía de susceptibilidad mediante un Sistema de In-formación Geográfica. Aplicación a las zonas de Colmenar (Málaga), Rute (Córdoba) y Montefrío (Granada). Doctoral Thesis. Universidad de Granada, 578pp.
Jaboyedoff, M., Labiouse, V., 2003. Preliminary assessment of rockfall hazard based on GIS data. ISRM 2003 – Technology roadmap for rock mechanics, South African Institute of Min-ing and Metallurgy, 1, 575-578.
Jiménez, J.A., Valdemoro, H.I., Gracia, V., Sánchez-Arcilla, A., 2000. Estudio sobre la situación del tramo costero Cam-brils-Vandellós (T.M. Mont-Roig del Camp). Evolución costera y dinámica litoral. Laboratori d’Enginyeria marítima, E.T.S.E.C.C.P.B, Universitat Politécnica de Catalunya, Bar-celona. Technical Report.
Lee, E.M., Hall, J.W., Meadowcroft, I.C., 2001. Coastal cliff re-cession: the use of probabilistic prediction methods. Geomor-phology, 30(3-4), 253-269.
Lo, C.M., Lin, M.L., Lee, W.C., Chan, Y.C., Yeh, C.H., 2010. Cliff recession and progressive development of talus deposits around Xiangshan of the Taipei Sishou Hills. Terrestrial At-mospheric and Oceanic Sciences, 21, 543-561.
López-Bermúdez, F., Gomáriz-Castillo, F., 2006. Las ramblas, agentes reguladores del litoral mediterráneo ibérico. El ejem-plo de la rambla de Las Moreras. Murcia. In: Sanjaume, E., Mateu, J. (eds.). Geomorfología Litoral i Quaternari. Hom-enatge al Prof. V.M. Rosselló i Verger. Valencia, Universitat de València, 245-257.
López-Geta, J.A., Murillo-Díaz, J.M., Torrens i Plá, J., Alfonso, P.L., Silesio Lillo, J., Hernando Tornadijo, E., 1989. Serie manuales de utilización de acuíferos: Acuífero del Campo de Tarragona. Instituto Geológico y Minero de España (IGME). Website: http://aguas.igme.es/igme/homec.htm.
Lorenzo, F., Alonso, A., Pagés, J.L., 2007. Erosion and Accretion of Beach and Spit Systems in Northwest Spain: A Response to Human Activity. Journal of Coastal Research, 23(4), 834-845.
Masana, E., 1995. L’activitat neotectònica a les Cadenes Costero Catalanes. Doctoral Thesis. Barcelona, Universidad de Bar-celona, 444pp.
Mase, H., 1989. Random wave run-up height on gentle slope. Journal of Waterway, Port, Coastal, and Ocean Engineering, 115(5), 649-661.
Mateos, R.M., 2001. Los movimientos de ladera en la Serra de Tramuntana (Mallorca). Caracterización geomecánica y análisis de peligrosidad. Doctoral Thesis. Universidad Com-plutense de Madrid, 299pp.
Mejía-Navarro, M., García L.A., 1996. Natural hazard and risk assessment using Decision Support Systems. Application, Glenwood Springs, Colorado. Journal of Environmental and Engineering Geoscience, 2, 299-324.
Mendoza, E.T., 2008. Coastal vulnerability to storms in Catalan coast. Doctoral Thesis. Universidad Politécnica de Barcelona, 138pp.
MMA, 2002. Proyecto de paseo peatonal, accesos y adecuación medioambiental de las calas situadas en Mont-Roig del Camp, T.M. Mont-Roig del Camp (Tarragona). Ministerio de Medio Ambiente, Technical report.
Montoya, I., 2008. Análisis de la susceptibilidad a los movimien-tos de ladera en los acantilados de la franja costera de Mont-Roig del Camp (Tarragona). Doctoral Thesis. Universidad Rey Juan Carlos, 198pp.
Moore, L.J., 2000. Shoreline mapping techniques. Journal of Coastal Research, 16(1), 111-124.
Moore, L.J., Griggs, G.B., 2002. Long-term cliff retreat and ero-sion hotspots along the central shores of the Monterey Bay National Marine Sanctuary. Marine Geology, 181, 265-283.
MOPU, 1990. Instrucción 5.2-IC. Drenaje Superficial. Madrid, Centro de publicaciones del Ministerio de Obras Públicas y Urbanismo, 84pp.
Naylor, L.A., Stephenson, W.J., Trenhaile, A.S., 2010. Rock coast geomorphology: recent advances and future research direc-tions. Geomorphology, 114, 3-11.
Nunes, M., Ferreira, O., Schaefer, M., Clifton, J., Baily, B., Moura, D., Loureiro, C., 2009. Hazard assessment in rock cliffs at Central Algarve (Portugal): a tool for coastal manage-ment. Ocean and Coastal Management, 52, 506-515.
Palmquist, R.C., Bible, G., 1980. Conceptual modelling of land-slide distribution in time and space. Bulletin Association En-gineering Geologists, 21, 178-186.
Perea, H, Figueiredo, P.M., Carner, J., Gambini, S., Boydell, K., 2003. Paleoseismological data from a new trench across the El Camp Fault (Catalan Coastal Ranges, NE Iberian Penin-sula). Annals of Geophysics, 46(5), 764-774.
Remondo, J., 2001. Elaboración y validación de mapas de sus-ceptibilidad de deslizamientos mediante técnicas de análisis espacial. Doctoral thesis. Universidad de Oviedo, 278pp.
Rodríguez, I., Montoya, I., Sánchez, M.J., Carreño, F., 2009. Ge-ographic Information Systems applied to integrated coastal zone management. Geomorphology, 109, 100-105.
Ruff, M., Czurda, K., 2008. Landslide susceptibility analysis with a heuristic approach in the Eastern Alps (Vorarlberg, Austria). Geomorphology, 94, 314-324.

G e o l o g i c a A c t a , 1 0 ( 4 ) , 4 3 9 - 4 5 5 ( 2 0 1 2 )D O I : 1 0 . 1 3 4 4 / 1 0 5 . 0 0 0 0 0 1 7 7 6
I . M O N T O YA - M O N T E S e t a l . Landslide susceptibility of coastal cliffs
455
Santacana, N., 2001. Análisis de la susceptibilidad del terreno a la formación de deslizamientos superficiales y grandes deslizamientos mediante el uso de sistemas de informa-ción geográfica. Aplicación a la cuenca alta del río Llo-bregat. Doctoral Thesis. Universidad Politécnica de Cat-aluña, 399pp.
Stockdon, H.F., Holman, R.A., Howd, P.A., Sallenger, A.H. Jr., 2006. Empirical parameterization of setup, swash, and run-up. Coastal Engineering, 53(7), 573-588.
Teixeira, S., 2006. Slope mass movements on rocky sea-cliffs: A power-law distributed natural hazard on the Barlavento Coast, Algarve, Portugal. Continental Shelf Research, 26, 1077-1091.
Témez, J.R., 1991. Extended and improved rational method. Ver-sion of the Highways Administration of Spain. Madrid, Pro-ceedings of XXIV IAHR Congress, 33-40.
Trenhaile, A.S., 1987. The Geomorphology of Rock Coasts. Ox-ford, Oxford University Press, 344pp.
Turner, A.K., Schuster, R.L., 1995. Landslide: investigation and mitigation. Transportation Research Board Special Report 247. Washington, National Academy Press, 673pp.
Van Westen, C.J., 2000. The modelling of landslide hazards using GIS. Surveys in Geophysics, 21, 241-255.
Van Westen, C.J., Rengers, N., Terlien, M.T.J., Soeters, R., 1997. Pre-diction of the occurrence of slope instability phenomena through GIS-based hazard zonation. Geologische Rundschau, 86, 404-414.
Varnes, D.J. (1984). Landslide hazard zonation: a review of principles and practice. Natural Hazards, 3. Paris, UNESCO, 63pp.
Villanueva, T., Galofré, J., 2002. Conservación y recuperación medio ambiental en las calas de Miami-Platja. T.M. Montroig (Tarrago-na). Tarragona Coastal Service, Ref.: 43-1461, Technical report.
Zêzere, J.L., Ferreira, A.D., Rodrigues, M.L., 1999. The role of con-ditioning and triggering factors in the occurrence of landslides: a case study in the area north of Lisbon (Portugal). Geomor-phology, 30, 133-146.
Manuscript received January 2010;revision accepted May 2012;published Online July 2012.