market.pdf
TRANSCRIPT

Q4 13 Q4 14 12-Month Forecast
Overall Vacancy 7.5% 7.6%
Net Absorption -17,706 1,545,451
Under Construction 5.6M 2.0M
Average Asking Rent $5.67 $5.77
NEW JERSEY
Industrial Market SnapshotFourth Quarter • 2014
NEW JERSEY
Net Absorption/Asking Rent 4Q TRAILING AVERAGE
Overall Vacancy
Economic IndicatorsQ4 13 Q4 14 12-Month
Forecast
New Jersey Employment 3.20M 3.28M
New Jersey Unemployment 6.6% 5.6%
U.S. Unemployment 7.0% 5.8%
Economy The Northern New Jersey industrial market had a surge during the fourth quarter of 2014, as 758,157 square feet of positive absorption was recorded. This performance represents the highest positive absorption in Northern New Jersey since the first quarter of 2013. Additionally, vacancy fell 10 basis points to 7.9 percent from the previous quarter. Despite a strong fourth quarter, the Northern New Jersey industrial market did not perform as well over the year, posting 593,419 square feet of negative absorption for 2014. Central New Jersey industrial market conditions improved as the year drew to a close with fourth quarter positive absorption of 787,294 square feet. Vacancy fell 10 basis points to 7.2 percent and asking rents increased to $5.42 per square foot from $5.35 the previous quarter as demand rose along the turnpike corridor. Over the year, positive absorption totaled over 2 million square feet, the sixth year in a row of positive absorption.
Market Overview Three submarkets were mainly responsible for an uptick in market conditions in Northern New Jersey to cap off the year. In Central Bergen, availability dropped 50 basis points in the fourth quarter to 7 percent as Sealed Air Corporation signed a lease for 201,600 square feet at 301 Mayhill Street in Saddle Brook. B&H Photo leased 107,186 square feet at 1000 Secaucus Road and SnowJoe leased 100,000 square feet at 305 Veterans Boulevard contributing to a decline of 70 basis points in the Meadowlands submarket to 6.2 percent. Availability fell 90 basis points in the Port/Airport submarket to 5.8 percent, which can be partially attributed to a lease by Greenspan and Associates for 70,000 square feet at 1 Slater Drive in Elizabeth.
Over the year, the Northern New Jersey industrial market was sluggish, posting 593,419 square feet of negative absorption. This fall in absorption and increase in vacancy can be partially attributed to the Hoffman La Roche campus in Nutley and Clifton being officially put on the market. The site, which was marketed for sale in the beginning of the year, proved to be a significant factor in increased vacancy in the Passaic submarket. Additionally, vacancies at 40-50 Seaview Drive and 550 Meadowlands Parkway during the second quarter contributed to rising vacancies and falling asking rents in Northern New Jersey.
Market Indicators
Net Absorption/Asking Rent
1
Four Quarter Trailing Average
$5.00
$5.20
$5.40
$5.60
$5.80
$6.00
-2,000
-1,500
-1,000
-500
0
500
1,000
1,500
2,000
2,500
3,000
3,500
4,000
2010 2011 2012 2013 2014
Net Absorption, 000's Asking Rent, $ PSF
5.0%
5.5%
6.0%
6.5%
7.0%
7.5%
8.0%
8.5%
9.0%
9.5%
10.0%
10.5%
11.0%
2010 2011 2012 2013 2014
Overall Vacancy Rate
2
www.dtz.com | 2
Looking forward to 2015, the trend of tenants moving out of NYC is expected to continue, but tenants will still require locations within close proximity to the city in order to effectively service the area. Furthermore, we will continue to see a trend of users and investors competing for the same properties in the market, leading to bidding contests, which will drive sale prices even higher.
With an improving market in Central New Jersey, comes more robust leasing activity as evidenced by falling vacancy rates. The 305,751 square foot lease signed by SHI International Corporation at 10 Knox Drive was a major factor in the 320 basis point drop in vacancy in the Western 287 submarket, quarter over quarter. In the Monmouth submarket, Festo Didactics leased 55,000 square feet at 607 Industrial Way West, leading to a rise in absorption during the fourth quarter. At 9 Cotters Lane in East Brunswick, JB Cocoa Incorporated purchased the building and took the remaining space off the market with plans to redevelop the property after the current tenant’s lease expires.
Several noteworthy leases throughout the year contributed to a strong 2014. Home Depot leasing 470,640 square feet at 100 Riverside Drive in Woodbridge in the first quarter was a major factor in a 320 basis point drop in vacancy from the previous quarter. Furthermore, Port Logistics leasing 443,421 square feet at 200 Liberty Way was a large contributor to rising absorption and falling vacancy in the Exit 8A submarket during the second quarter.
With over 4.5 million square feet of industrial space delivered in 2014, the market is on a fast track to an even stronger 2015 as developers take advantage of improving conditions. We expect rents to rise as demand for newer, quality warehouse and industrial space increases, while supply dwindles.
Outlook• Users and investors will compete in bidding wars, leading to an increase in sale prices.
• Demand for quality buildings will continue, driving vacancy down in the next 6 to 12 months.
• Tenants will continue to relocated from New York City in order to maintain close proximity to better service the area.
Fidelity Investment’s decision to sign a 10-year lease is a strong commitment for the market.
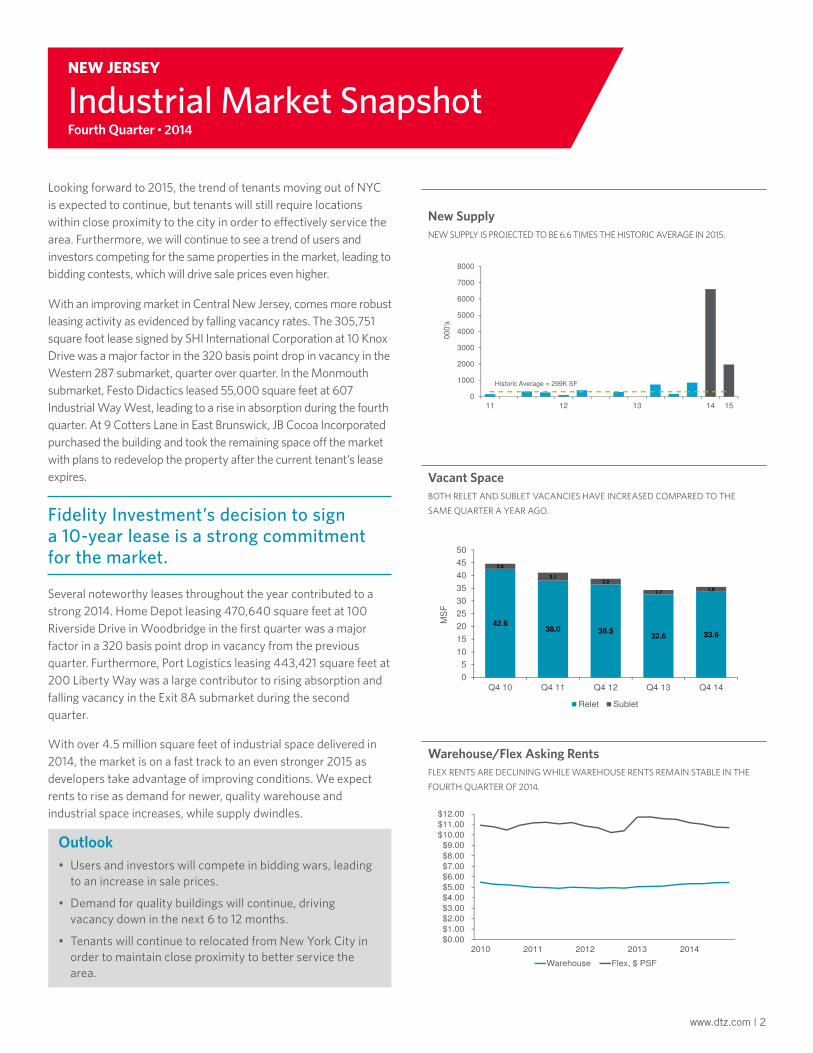
Warehouse/Flex Asking RentsFLEX RENTS ARE DECLINING WHILE WAREHOUSE RENTS REMAIN STABLE IN THE FOURTH QUARTER OF 2014.
New SupplyNEW SUPPLY IS PROJECTED TO BE 6.6 TIMES THE HISTORIC AVERAGE IN 2015.
Vacant SpaceBOTH RELET AND SUBLET VACANCIES HAVE INCREASED COMPARED TO THE SAME QUARTER A YEAR AGO.
New Supply Industrial
0
1000
2000
3000
4000
5000
6000
7000
8000
11 12 13 14 15
00
0’s
Historic Average = 299K SF
5
Vacant Space Industrial
42.638.0 36.5
32.6 33.6
2.0
3.1
2.2
1.71.9
0
5
10
15
20
25
30
35
40
45
50
Q4 10 Q4 11 Q4 12 Q4 13 Q4 14
MS
F
Relet Sublet
4
Warehouse/Flex Asking Rents
$0.00
$1.00
$2.00
$3.00
$4.00
$5.00
$6.00
$7.00
$8.00
$9.00
$10.00
$11.00
$12.00
2010 2011 2012 2013 2014
Warehouse Flex, $ PSF
3
NEW JERSEY
Industrial Market SnapshotFourth Quarter • 2014
www.dtz.com | 3
Key Sales Transactions 4Q 14
PROPERTY SF SELLER/BUYER PRICE SUBMARKET
1 Sharp Plaza 497,480Sharp Electronics/Sitex Realty Group
$38,000,000 Northern Bergen
680 Belleville Toke 135,115 Russo Development/TIAA-CREF $32,100,000 Port/Airport
111 Cokesbury Road 729,000PVI-WIP Clinton LLC/111 Cokesbury LLC
$28,066,500 Somerset
Key Lease Transactions 4Q 14
PROPERTY SF TENANT TRANSACTION TYPE SUBMARKET
10 Knox Drive 305,751 SHI International Corp. Lease Western 287
1 Montgomery Way 219,000 Falken Tire Lease Exit 7A
130 Interstate Blvd 192,000 Home Depot Renewal Exit 8A
200 Docks Corner Road 172,249 Moulten Fulfillment Lease Exit 8A
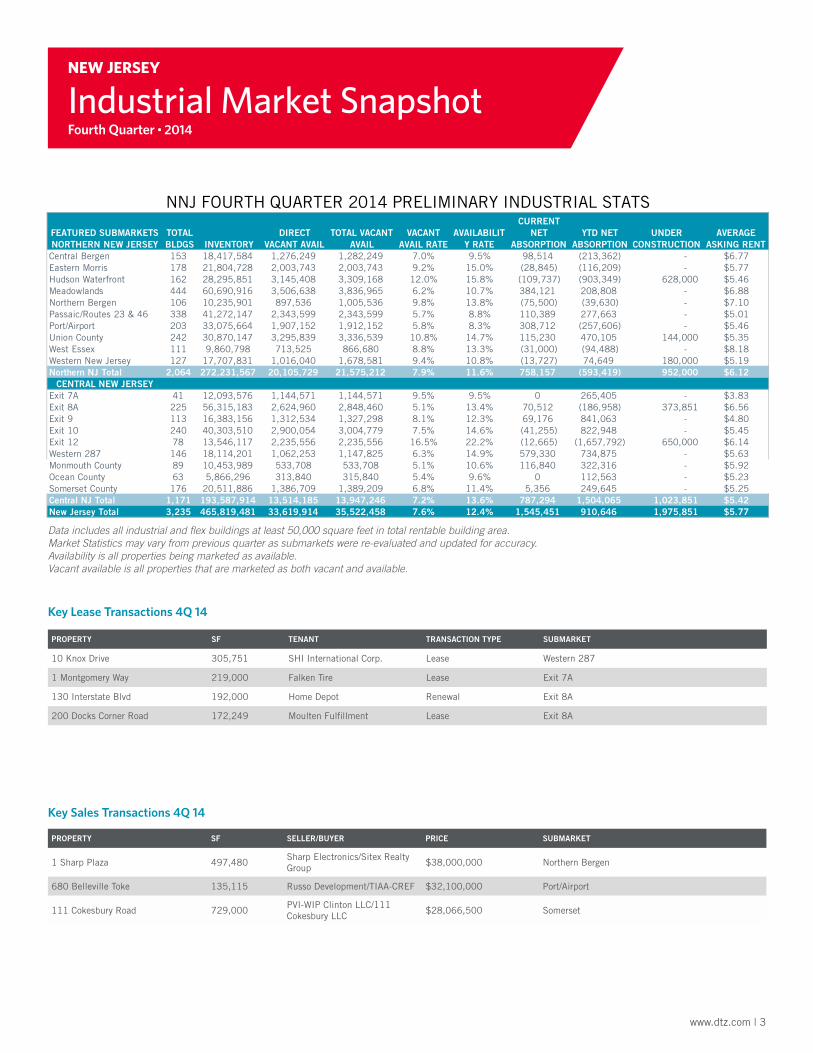
Data includes all industrial and flex buildings at least 50,000 square feet in total rentable building area.Market Statistics may vary from previous quarter as submarkets were re-evaluated and updated for accuracy.Availability is all properties being marketed as available.Vacant available is all properties that are marketed as both vacant and available.
NEW JERSEY
Industrial Market SnapshotFourth Quarter • 2014
FEATURED SUBMARKETS NORTHERN NEW JERSEY
TOTAL BLDGS INVENTORY
DIRECT VACANT AVAIL
TOTAL VACANT AVAIL
VACANT AVAIL RATE
AVAILABILITY RATE
CURRENT NET
ABSORPTIONYTD NET
ABSORPTIONUNDER
CONSTRUCTIONAVERAGE
ASKING RENTCentral Bergen 153 18,417,584 1,276,249 1,282,249 7.0% 9.5% 98,514 (213,362) - $6.77Eastern Morris 178 21,804,728 2,003,743 2,003,743 9.2% 15.0% (28,845) (116,209) - $5.77Hudson Waterfront 162 28,295,851 3,145,408 3,309,168 12.0% 15.8% (109,737) (903,349) 628,000 $5.46Meadowlands 444 60,690,916 3,506,638 3,836,965 6.2% 10.7% 384,121 208,808 - $6.88Northern Bergen 106 10,235,901 897,536 1,005,536 9.8% 13.8% (75,500) (39,630) - $7.10Passaic/Routes 23 & 46 338 41,272,147 2,343,599 2,343,599 5.7% 8.8% 110,389 277,663 - $5.01Port/Airport 203 33,075,664 1,907,152 1,912,152 5.8% 8.3% 308,712 (257,606) - $5.46Union County 242 30,870,147 3,295,839 3,336,539 10.8% 14.7% 115,230 470,105 144,000 $5.35West Essex 111 9,860,798 713,525 866,680 8.8% 13.3% (31,000) (94,488) - $8.18Western New Jersey 127 17,707,831 1,016,040 1,678,581 9.4% 10.8% (13,727) 74,649 180,000 $5.19Northern NJ Total 2,064 272,231,567 20,105,729 21,575,212 7.9% 11.6% 758,157 (593,419) 952,000 $6.12
CENTRAL NEW JERSEYExit 7A 41 12,093,576 1,144,571 1,144,571 9.5% 9.5% 0 265,405 - $3.83Exit 8A 225 56,315,183 2,624,960 2,848,460 5.1% 13.4% 70,512 (186,958) 373,851 $6.56Exit 9 113 16,383,156 1,312,534 1,327,298 8.1% 12.3% 69,176 841,063 - $4.80Exit 10 240 40,303,510 2,900,054 3,004,779 7.5% 14.6% (41,255) 822,948 - $5.45Exit 12 78 13,546,117 2,235,556 2,235,556 16.5% 22.2% (12,665) (1,657,792) 650,000 $6.14Western 287 146 18,114,201 1,062,253 1,147,825 6.3% 14.9% 579,330 734,875 - $5.63Monmouth County 89 10,453,989 533,708 533,708 5.1% 10.6% 116,840 322,316 - $5.92Ocean County 63 5,866,296 313,840 315,840 5.4% 9.6% 0 112,563 - $5.23Somerset County 176 20,511,886 1,386,709 1,389,209 6.8% 11.4% 5,356 249,645 - $5.25Central NJ Total 1,171 193,587,914 13,514,185 13,947,246 7.2% 13.6% 787,294 1,504,065 1,023,851 $5.42New Jersey Total 3,235 465,819,481 33,619,914 35,522,458 7.6% 12.4% 1,545,451 910,646 1,975,851 $5.77
NNJ FOURTH QUARTER 2014 PRELIMINARY INDUSTRIAL STATS

www.dtz.com | 4
Industrial SubmarketsNew Jersey
About DTZ
DTZ is a global leader in commercial real estate services providing occupiers, tenants and investors around the world with a full spectrum of property solutions. Our core capabilities include agency leasing, tenant representation, corporate and global occupier services, property management, facilities management, facilities services, capital markets, investment and asset management, valuation, building consultancy, research, consulting, and project and development management. DTZ manages 3.3 billion square feet and $63 billion in transaction volume globally on behalf of institutional, corporate, government and private clients. Our more than 28,000 employees operate across more than 260 offices in more than 50 countries and proudly represent DTZ’s culture of excellence, client advocacy, integrity and collaboration. For further information, visit: www.DTZ.com or follow us on Twitter @DTZ.
Liliya Magid Research Analyst
26 Main Street Suite 202 Chatham, NJ 07928 Tel: 973 908 6118 Email: [email protected]
The information contained within this report is gathered from multiple sources considered to be reliable. The information may contain errors or omissions and is presented without any warranty or representations as to its accuracy.
Copyright © 2015 DTZ. All rights reserved.
17
31
31
72
510
511
512
513
513
513
202
22
9
9
1
195
287
78
95
95
80
OCEAN COUNTY
MONMOUTH COUNTYMONMOUTH COUNTY
SOMERSET COUNTYSOMERSET COUNTY
HUDSONWATERFRONT
HUDSONWATERFRONT
MEADOWLANDS
PASSAIC
Delaware R. EXIT 9EXIT 9
I-78 WEST
UNION COUNTYUNION COUNTY
OCEAN COUNTY
MEADOWLANDS
WEST ESSEXWEST ESSEX
EASTERN MORRISEASTERN MORRIS
NORTHERN BERGENNORTHERN BERGEN
CENTRAL BERGENCENTRAL BERGENPASSAIC
PORT/AIRPORT
PORT/AIRPORT
EXIT 7AEXIT 7A
EXIT 8AEXIT 8A
I-78 WEST
WESTERN NJWESTERN NJ
EXIT 10EXIT 10
EXIT 12EXIT 12
NEW JERSEY
Industrial Market SnapshotFourth Quarter • 2014