master thesis - kola.opus.hbz-nrw.de
TRANSCRIPT

Challenges and solutions for HRM in international organization
(based on materials of PrJSC “Philip Morris Ukraine”)
Master thesis
To Earning a Master of Science
Presented by
Yuliya Morozova
217203686
First Examiner: Professor Dr. Harald F.O. von Korflesch
Second Examiner: Associate Professor Ph.D. in Economics Protsun N.M.
Third Examiner: Denisse Mendoza Almanzar MA
Koblenz, May 2019
Erklärung
Ich versichere, dass ich die vorliegende Arbeit selbständig verfasst und
keine anderen als die angegebenen Quellen und Hilfsmittel benutzt habe.
Mit der Einstellung dieser Arbeit in die Universitätsbibliothek Ja Nein
bin ich einverstanden. □ □
Koblenz, Mai 2019
Declaration
I assure you that I have written this thesis independently and that I did not
use any other sources and aids than those indicated.
Yes No
I agree with the employment of this work in the university library.□□
Koblenz, May 2019

Abstract i
Abstract
Thesis is devoted to the topic of challenges and solutions for human resources
management (HRM) in international organizations. The aim is to investigate
methodological approaches to assessment of HRM challenges and solutions, and to
apply them on practice, to develop ways of improvement of HRM of a particular
enterprise. The practical research question investigated is “Is the Ongoing Professional
Development – Strategic HRM (OPD-SHRM) model a better solution for HRM system
of PrJSC “Philip Morris Ukraine”?”
To achieve the aim of this work and to answer the research question, we have studied
theoretical approaches to explaining and assessing HRM in section 1, analyzed HRM
system of an international enterprise in section 2, and then synthesized theory and
practice to find intersection points in section 3.
Research findings indicate that the main challenge of HRM is to balance between
individual and organizational interests. Implementation of OPD-SHRM is one of the
solutions. Switching focus from satisfaction towards success will bring both tangible
and intangible benefits for individuals and organization. In case of PrJSC “Philip Morris
Ukraine”, the maximum forecasted increase is 330% in net profit, 350% in labor
productivity, and 26% in Employee Development and Engagement Index.
Key words: human resources management, challenges, solutions, international
organization, effectiveness, OPD-SHRM

Table of Contents ii
Table of Contents
Introduction ...................................................................................................................... 1
Section 1. Theoretical Basis of Human Resources Management in International
Organization ..................................................................................................................... 4
1.1. The essence of human resources management in international organization .... 4
1.2. Mechanism of human resources management in international organization ..... 9
1.3. Methodological approaches to the evaluation of human resources management
effectiveness ................................................................................................................ 15
Section 2. Analysis of Human Resources Management of PrJSC “Philip Morris
Ukraine” .......................................................................................................................... 22
2.1. Characteristic of financial and economic activity of PrJSC “Philip Morris
Ukraine” ...................................................................................................................... 22
2.2. Analysis of human resources planning system of PrJSC “Philip Morris
Ukraine” ...................................................................................................................... 38
2.3. Assessment of human resources management effectiveness of PrJSC “Philip
Morris Ukraine” .......................................................................................................... 48
Section 3. Ways of Improvements of Human Resources Management of PrJSC “Philip
Morris Ukraine” .............................................................................................................. 53
3.1. Necessity of improvement of human resources management of PrJSC “Philip
Morris Ukraine” .......................................................................................................... 53
3.2. Link between current HRM success and OPD-SHRM .................................... 57
3.3. Forecasted changes in activity of PrJSC “Philip Morris Ukraine” on the basis
of proposed measures (Implementing OPD-SHRM in PMU) .................................... 71
Conclusions and Proposals ............................................................................................. 78
References ...................................................................................................................... 83
Appendices ..................................................................................................................... 87
Appendix A ................................................................................................................. 87
Appendix B ............................................................................................................... 122
Appendix C ............................................................................................................... 124
Appendix D ............................................................................................................... 125
Appendix E ............................................................................................................... 127
Appendix F................................................................................................................ 128

List of Tables iii
List of Tables
Table 1.1: Tasks of human resources management………………………........…….......6
Table 2.1: Main indicators of financial and economic activity of PMU in 2013-
2017, UAH th………………..........................…………………………....……….……23
Table 2.2: Net revenue and net profit (loss) of PMU in 2013-2017, UAH th…….........24
Table 2.3: Ukrainian cigarette market size and PMU share in 2013-2017………....…..25
Table 2.4: Main profitability indicators of PMU, BAT, IMP and JTI in 2013-
2017………………………………………………………………………........…….....26
Table 2.5: Liquidity ratios of PMU in 2013-2017………….………...………………...28
Table 2.6: Long-term solvency ratios of PMU in 2013-2017.........................................29
Table 2.7: Business activity ratios of PMU in 2013-2017...............................................31
Table 2.8: PMU’s export commodity structure in 2013-2017, UAH mln…...................33
Table 2.9: PMU’s finished goods export geographic structure in 2013-2017, UAH
mln…...............................................................................................................................35
Table 2.10: PMU’s import commodity structure in 2013-2017, UAH th…...................36
Table 2.11: Profit and profitability indicators of foreign economic activity of PMU in
2013-2017....................................................................................................................…37
Table 2.12: Analysis of dynamics and structure of personnel of PMU in 2013-
2017….............................................................................................................................40
Table 2.13: Educational, gender and qualification distribution of employees of PMU in
2017….............................................................................................................................41
Table 2.14: Managerial Effectiveness Index at PMI, PMU and PMP in 2013-
2017….............................................................................................................................45
Table 2.15: Employee Development and Engagement Index at PMU in 2013-
2017...........................................................................................................................…..46
Table 2.16: Analysis of dynamics of the number of employees and wage fund of PMU
in 2013-2017…................................................................................................................48
Table 2.17: Number of hired and dismissed employees of PMU in 2013-2017,
people…...........................................................................................................................49
Table 2.18: Labor profitability of PMU in 2013-2017…................................................52
Table 3.1: Pearson correlation coefficient matrix of Type 2 questions’ answers with
Employee Development and Engagement Index….........................................................66
List of Tables iv
Table 3.2: Regression linear equations for determining Employee Development and
Engagement Index (Y) in terms of answers to Type 2 questions (Xi
variables)..........................................................................................................................67
Table 3.3: Multiple regression statistics (Y, Xi)…..........................................................68
Table 3.4: Multiple regression coefficients (Y, Xi)….....................................................68
Table 3.5: Frequency distribution (Y, Xi)...................................................................…69
Table 3.6: PMU financial results’ forecast for 2018-2020 under unchanged strategy,
UAH mln….....................................................................................................................71
Table 3.7: Employee Development and Engagement Index and net profit (loss) of PMU
in 2013-2017…................................................................................................................72
Table 3.8: PMU financial results’ forecast for 2018 – 2020 under OPD-SHRM
implementation, UAH mln…..........................................................................................74

List of Figures v
List of Figures
Figure 1.1: System of human resources management…...................................................8
Figure 2.1: PMU’s export commodity structure in 2013-2017..................................….33
Figure 2.2: PMU’s finished goods export geographic structure in 2013-2017...........…34
Figure 2.3: PMU’s import commodity structure in 2013-2017...................................…36
Figure 2.4: Results of job motivation survey of employees of PMU in 2017.............…46
Figure 3.1: Simplified OPD model..............................................................................…55
Figure 3.2: Linking the details of the role structure to define psychological targets
.........................................................................................................................................56
Figure 3.3: Distribution of responses to Question 1 “If I continue to perform well, I will
get ahead in this company”…..........................................................................................59
Figure 3.4: Distribution of responses to Question 2 “I believe I am paid fairly”
….....................................................................................................................................60
Figure 3.5: Distribution of responses to Question 3 “I receive useful coaching and
feedback that helps me improve my performance”.....................................................…60
Figure 3.6: Distribution of responses to Question 4 “I think there is a clear link between
job performance and pay at my company”..................................................................…61
Figure 3.7: Distribution of responses to Question 5 “Management provides recognition
for performance when I perform above and beyond my job
responsibilities”...........................................................................................................…61
Figure 3.8: Distribution of responses to Question 6 “I understand how my performance
is measured and evaluated”.............................................................................................62
Figure 3.9: Distribution of responses to Employee Development and Engagement
Index............................................................................................................................…62
Figure 3.10: Distribution of responses to Question 7 “Key performance activities that
are relevant to my role are clear to me for me to be successful in my role”……...........63
Figure 3.11: Distribution of responses to Question 8 “How often does your manager
give you ‘on the spot’ social rewarding?”...................................................................…64
Figure 3.12: Distribution of responses to Question 9 “How realistic are the expectations
of your manager from you?”........................................................................................…64
Figure 3.13: Distribution of responses to Question 10 “I know how to be successful in
my current role”..........................................................................................................….65
Figure 3.14: Distribution of responses to Question 11 “How often does your supervisor
do one on one meeting with you?”..............................................................................…65

List of Figures vi
Figure 3.15: Scatter plot and regression line of Employee Development and
Engagement Index and net profit (loss) of PMU for 2013-2017.................................…73
Figure 3.16: Net profit (loss) forecast with and without OPD-SHRM.......................….75

List of Abbreviations vii
List of Abbreviations
BAT………………………………………………………….. British American Tobacco
bio……………………………………………………………………………...…...billion
CAGR…………………………………………………. Compound Annual Growth Rate
CBI……………………………………………………..… Competency Based Interview
CCE………………………………………………………..... Cash and Cash Equivalents
EBIT………………………………………………... Earnings Before Interest and Taxes
EOS………………………………………………………..… Employee Opinion Survey
EU……………………………………………………………………..... European Union
FG……………………………………………………………………….. Finished Goods
GCC………………………………………………………….. Gulf Cooperation Council
HR…………………………………………………………………….. Human Resources
HRM………………………………………………….... Human Resources Management
IMP……………………………………………………………………. Imperial Tobacco
IT……………………………………………………………....Information Technologies
JTI………………………………………………………….. Japan Tobacco International
KPI………………………………………………………….. Key Performance Indicator
LLC……………………………………………………….… Limited Liability Company
MAP…………………………………………..... Managing and Appraising Performance
mln……………………………………….………………………………………...million
OPD-SHRM……………………………………………………………………………….
Ongoing Professional Development - Strategic Human Resources Management
P&L…………………………………………………………………….... Profit and Loss
PMI…………………………………………………………...Philip Morris International
PMSD…………………………………………...…. Philip Morris Sales and Distribution
PMU……………………………………………………………… Philip Morris Ukraine
PPE…………………………………………………….... Property, Plant and Equipment
PrJSC……………………………………………………... Private Joint-Stock Company
ROA……………………………………………………………………. Return on Assets
ROE……………………………………………………………………. Return on Equity
SKU…………………………………………………………………. Stock Keeping Unit
th………………………………………………………………………………....thousand
UAE………………………………………………………………. United Arab Emirates

Introduction 1
Introduction
With the development of social production and the transition to post-industrial
principles of its functioning, the fundamental importance of human resources in the
development of civilization becomes increasingly evident. Public development is
inextricably linked with the dynamic updating of the system of managerial relations,
which, among other things, manifests itself in increasing the role of a set of measures
aimed at improving the human resources management system.
Execution of foreign economic activity by an enterprise and production of goods that
would be competitive in foreign markets depend not only on technical equipment of an
enterprise, availability of modern technologies, clear system of product quality control,
market environment research and consistent implementation of promotion strategies, but
also on qualification of employees of an enterprise and effective human resources
management (Кириченко, 2015, p.67).
HRM plays one of the leading roles in the management system of an enterprise, since
achievement of the main goal directly depends on the labor productivity of employees.
At the heart of any commercial organization there is a group of people who carry out
certain activities for the sole purpose: to make profit. That is why it is necessary to
direct and motivate people so that they make the greatest possible contribution to
achieve that main goal of an organization. A manager always tries to persuade
employees to work more productively and to maintain their interest in the results of
work. The provision of an enterprise with labor resources, their rational use, and high
level of labor productivity contribute to an increase of production volumes, efficient use
of equipment and machinery, reduction of production costs and increasing profits.
The relevance of the chosen topic lies in the fact that modern conditions are
characterized by an increase in the role of personnel in enterprises, because it is the
productive work of human resources that guarantees the prosperity and high
profitability of any organization. This is due to the following factors: changes in the
content of labor, caused by the use of new technology; transformation of control
function, increase of significance of self-control and self-discipline; macroeconomic
factors (aggravation of competition in the market, orientation of enterprises to meet
consumers’ demand, increasing attention to the quality of goods); change in the forms
of work organization at enterprises; improvement of educational and cultural levels of
employees; change of priorities in the system of personnel values (Балабанова &
Introduction 2
Сардак, 2016, p.5). The mechanism of HRM has particular importance for international
enterprises.
The theoretical significance: this work will be a generalized basis of theoretical and
practical solutions to the challenges of human resources management, and will form the
basis for more in-depth studies.
The practical significance: organizations can analyse their current HRM system with its
challenges and existing solutions, compare them to the ones described in this work,
choose the best solutions and apply them to improve the effectiveness of human
resources management and overall organization. This work also contains practical tips
for improvement of HRM of PrJSC “Philip Morris Ukraine”.
The object of this work is human resources management in international organizations.
The subject of this work is challenges and solutions for HRM in international
organizations.
The purpose of this work is to consider the theoretical basis of human resources
management of an enterprise, to define the possible challenges of HRM, to consider the
methodical approaches to the assessment of these challenges and their solutions, as well
as to investigate the use of theoretical principles of human resources management in
practice, on an example of a particular enterprise. The final purpose is to develop ways
of improvement of HRM of PrJSC “Philip Morris Ukraine”.
Research methods: generalization of theoretical materials, comparison of theory with
practice, conducting analogies between theoretical assumptions and manifestations in
practice, formalizing influence of factors through formulas, synthesis of theory and
practice to find intersection points.
To achieve the purpose of this work, the following tasks were solved:
theoretical approaches to explaining human resources management are
disclosed;
the mechanism of HRM is analyzed;
approaches to assessing human resources management are described;
financial and economic activity of an international enterprise operating in
Ukraine are analyzed;
human resources management system of an enterprise is analyzed;
directions of improvement of HRM the given enterprise are revealed.
Master thesis was written using the materials of PrJSC “Philip Morris Ukraine” (PMU),
where I have passed my pre-diploma internship. PMU is an affiliate of Philip Morris

Introduction 3
International (PMI) - an American corporation, which is one of the biggest tobacco
companies in the world. It has been present on Ukrainian market since 1994. It has a
head office in Kiev, and a factory in Kharkiv. PMU also manages the affiliates of PMI
in Armenia, Georgia and Moldova. In 2017 the company has produced 32,96 bio
cigarettes and collected revenues of 10,7 UAH bio.
Using the obtained work experience and theoretical information about the peculiarities
of human resources management system of PrJSC “Philip Morris Ukraine”, we have
analysed company’s HRM system and its elements, as well as developed ways of
improvement of HRM for the company.

Section 1. Theoretical Basis of Human Resources Management in International Organization 4
Section 1. Theoretical Basis of Human Resources Management
in International Organization
1.1. The essence of human resources management in international
organization
In the transition to a market economy, enterprises have to operate in a competitive
environment, find and expand their "niche" in the market of goods and services, master
new type of economic behavior, and constantly prove their competitiveness. In this
regard, every day requires an increase in the contribution of each employee in achieving
the goals of an enterprise, and one of the main tasks of each economic entity is search
for effective ways of managing human resources, that is, ways to ensure the activation
of the human factor (Колот, 2017, p.3).
For the most complete development of the topic of this work, first of all, it is necessary
to clearly identify what the labor resources, hired workers, personnel and staff of an
enterprise are. Labor resources are part of the able-bodied population, which according
to their age, physical, and educational characteristics corresponds to one or another
sphere of activity. Hired workers are employees who work for a certain salary,
stipulated by an employment contract. Under the staff we understand the regular
(permanent) skilled workers who have undergone previous refresher training, have work
skills, work experience, specialist knowledge in the chosen field of activity and are in
labor relations with the management of firms. Personnel are the entire manpower of an
institution, organization, enterprise, all permanent and temporary workers,
representatives of skilled and unskilled labor (Петюх, 2015, pp. 24-25).
In the process of production, the optimal combination of such factors as the means of
production, materials and labor is carried out. These factors also include such variable
factor as management, the main tasks of which are planning, organization and control.
Considering the factors of production, along with technical and economic problems, it is
necessary to take into account social and human interests. Man, as a carrier of the
productive factor of labor, is different from other factors of production, primarily
because it is not a passive subject, but has its own thoughts, goals, initiative, and is
guided by certain needs. Within a classical approach to management, a man is a factor
in production. However, according to many scholars, such an approach to management
does not meet the needs of the current world. Instead, there is a new approach to human
management, according to which, human resource policy becomes an active strategy.
Section 1. Theoretical Basis of Human Resources Management in International Organization 5
This strategy integrates into the overall policy of human resource management. A new,
non-classical vision of management makes it possible to consider a person as a factor in
implementation of organizational policies, source of income, cultural, transformative,
and creative power. The human work in an organization must be used in a way to ensure
the optimal use of human resources, the potential of organizational behavior of
employees.
Managers need to take into account two aspects of organizational behavior as a
management problem:
• Socio-psychological - spheres, methods and means by which the manager can
influence the organizational behavior of the subordinate;
• Organizational and technical - measures that must be taken within an
organization to orient the organizational behavior of employees to achieve production
goals (Храмов & Бовтрук, 2015, p.17).
The processes of human management were carried out in all civilizations and in
different societies. HRM is a specific function of management activity, the main object
of which are people belonging to certain social groups, labor collectives. Executives and
specialists who perform management functions in relation to their subordinates serve as
subjects of HRM.
Hence, human resources management is a deliberate activity of an organization's
management team to develop concepts, strategies of personnel policy and methods of
human resources management. It is a systemic, systematically organized influence
through a system of interconnected economic and social organizational measures aimed
at creating conditions for the normal development and use of labor force potential at an
enterprise level. Planning, forming, redistribution and rational use of human resources is
the core content of human resources management (Крушельницька, 2005, p.8).
Human resources management should be consistent with the concept of enterprise
development, protect the interests of employees and ensure compliance with labor
legislation in the formation, consolidation (stabilization) and use of personnel. In
modern conditions, the basis of the concept of human resources management is the
growing role of an employee identity, knowledge of his/her motivational settings, and
ability to form them and guide them in accordance with the tasks that an organization
faces.
The basic tasks of human resources management include:

Section 1. Theoretical Basis of Human Resources Management in International Organization 6
provision of an enterprise with required quantity and quality of personnel for the
current and future periods;
creation of equal opportunities of labor efficiency and rational occupation of
employees, stable and uniform workload during the working period;
satisfaction of reasonable staffing needs;
ensuring compliance of the labor potential of an employee and his/her psycho-
physiological characteristics to the requirements of the workplace;
maximum performance of various operations in the workplace.
The typical tasks of HRM, as well as the methods to be used for each task, are discussed
in more detail in Table 1.1.
Table 1.1
Tasks of human resources management
Task of HRM What needs to be defined Research methods
Formation of
structures and
staff
1. Psychologically substantiated
standards of controllability and optimal
size of production teams
2. Professional qualification
requirements for employees
3. Socio-psychological models of
production teams
Analysis of content of work,
compliance with professional
requirements of the
workplace. Modeling, expert
evaluations.
Recruitment 1. Level of development of
general and special abilities of a person
2. Individual psychological
features of a person, his/her orientation
Observation, conversation,
documents analysis, tests of
interests, intellectual tests,
tests of special abilities,
experiment
Personnel
development
1. Level of professional
knowledge, skills, desires of an
employee
2. The most effective forms of
vocational training
3. Effective means of influence on
those who are studying
Surveys, expert evaluations,
conversation, business cases,
situational tasks, experiment,
training
Personnel
assessment and
placement
1. Fit between an employee and
his/her workplace
2. Opportunities for further
cooperation
3. Results of labor activity
4. Place of an employee in the
collective
Surveys (questionnaires,
interviews), group assessment
of personality, expert
evaluation, observation
Rational use of
personnel
1. Reasons for discipline violation
2. Socio-psychological climate in
the team
3. Efficiency of personnel work
Documents analysis, tests,
questionnaires, survey
method, analysis of
disciplinary power,
conversation, analysis of team
work results, leadership style
Source: own representation based on Загірняк, 2015, p.383

Section 1. Theoretical Basis of Human Resources Management in International Organization 7
Human resources management system in an enterprise consists of many subsystems,
each of which performs appropriate functions.
The subsystem of general and linear management manages the organization as a whole,
as well as individual functions and production units. Functions of this subsystem are
performed by the head of an organization, his/her deputies, heads of functional and
production units, and their deputies.
The subsystem of personnel planning and marketing performs the following functions:
development of personnel policy and personnel management strategy, human resources
analysis, labor market analysis, personnel planning, planning and forecasting of staffing
needs, etc.
The subsystem of personnel management and accounting organizes personnel hiring
processes and activities, assesses selection and recruitment of staff, accounts hirings,
transfers, promotions and dismissals of the personnel, takes care of professional
orientation and organization of rational use of personnel, etc.
The subsystem of labor relations management conducts analysis and regulation of group
and personal relationships, analysis and regulation of relations of management,
management of industrial conflicts and stress, etc.
The subsystem of ensuring normal working conditions fulfills the following functions:
compliance with the requirements of psychophysiology and ergonomics of labor,
compliance with the requirements of technical aesthetics, occupational safety and
environmental protection.
The subsystem of personnel development management carries out: training, retraining
and advanced training, entry into the office and adaptation of new workers, evaluation
of candidates for a vacant position, periodic assessment of personnel, etc.
The subsystem of personnel behavior motivation management performs the following
functions: management of motivation of labor behavior, normalization and rating of
labor process, development of remuneration systems, development of forms of
employee participation in profits and capital, etc.
The subsystem of social development management carries out: organization of public
nutrition, management of housing and communal services, development of culture and
physical education, provision of health and rest, provision with children's institutions,
management of social conflicts and stress.

Section 1. Theoretical Basis of Human Resources Management in International Organization 8
The subsystem of managerial organizational structure development performs such
functions as analysis of the formed management organizational structure, design and
formation of a new management organizational structure, development of schedules.
The subsystem of legal support of the system of human resources management carries
out: settlement of legal issues of labor relations, coordination of administrative and
other documents on human resources management, settlement of legal issues of
economic activity, consultations on legal issues.
The subsystem of information support of the human resources management system
performs the following functions: keeping records and statistics of personnel,
information and technical support of the HRM system, provision of personnel with
scientific and technical information, etc. (Новицкий, 1991, p.134).
Schematically, the structure of human resources management is depicted in figure 1.1.
Fig. 1.1. System of human resources management (Source: own representation
based on Новицкий, 1991, p.134)
To conclude, human resources management is responsible for the most
important production factor – labor. The core activities of human resources management
is planning, forming, redistribution and rational use of human resources. HRM consists
Subsystem of general and linear
management
Subsystem of personnel planning
and marketing
Subsystem of personnel
management and accounting
Subsystem of labor relations
management
Subsystem of ensuring normal
working
Subsystem of personnel
development management
Subsystem of personnel behavior
motivation management
Subsystem of social development management
Subsystem of managerial
organizational structure
development
Subsystem of information
support of HRM system
Subsystem of legal support of HRM
system

Section 1. Theoretical Basis of Human Resources Management in International Organization 9
of many subsystems, each of which performs appropriate functions. Such variety allows
for complex approach to ensure all aspects of labor are covered.
1.2. Mechanism of human resources management in international
organization
At the heart of the mechanism of HRM of an international enterprise is its personnel
policy, because it is used to implement the functions of each of the subsystems of HRM
under consideration. Personnel policy is a set of principles, methods, and forms of
organizational mechanism for the formation, reproduction, development and use of
personnel, creation of optimal working conditions, work motivation and stimulation.
Personnel policy defines the general line and the principle guidelines for human
resources management for a long-term perspective (Крушельницька, 2005, p.38).
The main objectives of personnel policy are:
- timely provision of personnel of required quality and in sufficient quantity;
- provision of conditions for implementation of the rights and obligations of
citizens envisaged by labor legislation;
- rational use of labor potential;
- formation and maintenance of effective work of labor collectives (Петюх, 2015,
p.33).
Personnel policy includes the following elements:
employment policy, which covers provision of highly skilled personnel, creation
of attractive working conditions, ensuring of their safety, and creation of career
opportunities in order to increase the level of work satisfaction;
training policy, which involves formation of an appropriate training base,
opportunities for advanced training and realization of aspirations for
professional growth;
compensation policy, which covers provision of wages that are relatively high
compared to other employers, and that would correspond to the experience,
abilities and attitudes of an employee to his duties, his labor contribution;
welfare policy based on providing a wide range of social benefits, creating
conditions that are attractive to employees and mutually beneficial for them and
for an enterprise firm;

Section 1. Theoretical Basis of Human Resources Management in International Organization 10
labor relations policy, which provides for establishment of certain procedures to
prevent emergence of labor conflict, establishment of a better style of
management, relations with trade unions, etc. (Храмов & Бовтрук, 2001, p.76).
Personnel policy, firstly, forms the requirements for the labor force at the hiring stage.
Such requirements include the necessary level of education, special training, work
experience, personal qualities, professional skills, etc. Secondly, personnel policy
affects an attitude towards "investment" into labor force, targeted influence on
personnel development, as well as stabilization of the team and the nature of the training
of new employees, retraining and refresher training. Personnel policy, in general sense,
should be based on such principles as justice, consistency, equality, absence of
discrimination on the basis of age, gender, religion, compliance with labor legislation.
Each organization independently defines its personnel policy, but there are a number of
factors that, in any case, have a direct impact on its formation. The above factors can be
divided into two groups: external and internal.
External factors include national labor law, relationship with the trade union, state of
economic conditions, state and prospects of development of the labor market.
Internal factors are structure, goals and strategy of an organization; territorial
placement; production technologies; organizational culture; quantitative and qualitative
composition of current personnel and its possible changes in perspective; financial
capabilities of organizations that determine the permissible level of personnel costs;
current payment level (Крушельницька, 2005, p.40).
Personnel policy is closely linked to the system and subsystems of HRM, and, therefore,
performs similar tasks and functions. The main elements of personnel policy include:
1) Choice of management style, which determines the choice of other tools
2) Social policy and wage policy (labor motivation)
3) Policy in the field of education, advanced training and appointment
4) Creation of proper working conditions
5) Provision of personnel (Храмов & Бовтрук, 2015, p.21)
Thus, the mechanism of human resources management of a company is based on
implementation of personnel policy, which, in turn, is implemented through a set of
methods of impact on personnel. Methods are a way to influence the team or individual
employee to achieve the goal and to coordinate his/her activities in the production
process. In the theory and practice of management there are three groups of methods:

Section 1. Theoretical Basis of Human Resources Management in International Organization 11
administrative, economic and socio-psychological. The proper application of those
methods is one of the main challenges of HRM.
Administrative methods are based on authority, discipline and punishment, known in
history as a "whip method". They rely on administrative subordination of an object to a
subject, on the basis of the existing management hierarchy. Administrative methods are
guided by such motives of behavior as a need for labor discipline, sense of duty,
person's desire to work in a particular organization, culture of work. They are quite
diverse and operate through the following mechanisms:
- legal norms and acts - state laws, decrees, regulations, standards, instructions,
approved by state authorities and mandatory for compliance;
- instructions, organizational schemes, standardization;
- orders used in the process of operational management.
The main functions of administrative methods are to provide a stable legal environment
for organization's activities, protect the specific environment, and guarantee rights and
freedoms.
Economic methods are based on the use of economic incentives and are known as the
"carrot method". They are used for material stimulation of the collective and individual
workers.
Socio-psychological methods are based on the use of moral incentives for work and
affect personnel with a help of psychological mechanisms in order to translate
administrative tasks into a conscious responsibility, the inner need of a person
(Крушельницька, 2005, p.19).
At the heart of human resources management mechanism there is an effective labor
motivation, because it helps to increase the labor productivity, increase the volume of
produced and sold products, thereby positively affecting profitability of an enterprise.
The abovementioned methods of HRM are implemented with a use of various tools of
motivation.
All tools for labor motivation can be divided into material and non-material incentives,
compensations and mixed incentives. All of them form a system of personnel
incentives. Labor motivation cannot be effective without satisfying material needs,
focusing on the material interest of employees. Increase in the value of labor and status
motives does not mean an absolute decrease in the role of material motives and
incentives. They continue to be an important catalyst that can significantly increase
work activity and contribute to the achievement of personal and organizational goals

Section 1. Theoretical Basis of Human Resources Management in International Organization 12
(Колот, 2017, p.50). The main material incentive, of course, is salary. It is
conventionally divided into two parts: base and extra. A base wage/salary is the
remuneration for the work performed in accordance with the established norms of labor
(norms of time, production, service, duties). It is set in the form of tariff rates and piece
rates for workers and employees. An extra wage/salary is the remuneration for work
exceeding the established norms, labor advancements and ingenuity and special
working conditions. It includes fringe benefits, allowances, warranties and
compensatory payments, bonuses (Прокопенко, 1998, p.327).
Depending on the factors taken into account as the basis for salary calculation, all its
numerous varieties (systems) are divided into two main forms: hourly and piece rate. A
piece rate form of salary is a payment, which is established depending on the quantity of
products manufactured, work performed or services rendered in a certain quality and
which are carried out in accordance with the norms and rates established in accordance
with the level of work performed. At the same time for each unit of production there is
an established amount of payment - a piece rate. In the piece rate form of salary, the
level of labor is the product produced by the worker (or the amount of work performed),
and the amount of earnings is directly proportional to its quantity and quality, based on
the established piece rates.
The piece rate salary is effective in cases where scientifically sound labor rate setting is
used, which enables an establishment of technically sound production norms or time
standards; a correct tariffing of works is carried out in accordance with the requirements
of tariff-qualifying directories; there are well-stocked production records; there is
control over the quality of work performed; a rational organization of labor is provided,
which helps to eliminate the loss of working time for organizational and technical
reasons. The piece rate form of salary is represented in the following systems: direct
piece rates; piece plus-bonus rates; progressive piece rates; indirect piece rates; accord.
In the case of a direct piece rate system, the worker receives a payment for each unit of
the product, equal to the piece rate, regardless of whether the norm of output has been
fulfilled or over fulfilled. Piece plus-bonus system of remuneration stimulates
achievement of quantitative and qualitative indicators in the labor process. The
progressive piece rate salary system implies a progressive increase in rates depending
on the achievement of production norms and is used in works that affect the results of
the workshop or an entire enterprise, as well as in cases where it is necessary to increase
the output without introduction of additional equipment and without increasing the

Section 1. Theoretical Basis of Human Resources Management in International Organization 13
number of workers. Indirect piece rate salary system is used for auxiliary workers or
support workers employed by the main workers. Their earnings depend on the results of
work of the workers they serve. The accord salary system oversees an establishment of
a piece rate for the entire complex of works, based on the current norms of production
and piece rates. Often, the accord system is used in industries with a long production
cycle (shipbuilding, heavy machinery); as well as for the payment of workers in the
event that they perform their work in a short time (repair of large aggregates,
performance of loading and unloading and construction works) (Федоренко, Діденко,
Руженський, & Іткін, 2008, p.256).
Except for piece rate payment method, there is also an hourly payment method, that is,
the payment for a certain length of work (hour, day, month). The application of hourly
salary requires:
- accurate accounting and control over the actual time worked;
- proper assignment of tariff ranks to employees according to their qualifications
and taking into account the qualification level of the work performed;
- development and proper application of reasonable production norms, tasks
norms, service and quantity norms.
At modern enterprises, labor of workers with hourly pay should be standardized and
assessed on the basis of indicators that take into account the results of their work. Such
indicators can include:
production tasks that determine an amount of work per shift, week or month for
each hourly worker;
planned production norms or tasks for a brigade, a shop;
labor standards that can be established as a degree of compliance with
technological parameters, regimes, norms of consumption of raw materials,
materials and other productive resources, terms of execution of certain types of
work, etc.
In a simple hourly system, amount of earnings is determined depending on the tariff rate
of the worker and the amount of time worked out by him. By way of paying, hourly
payment can be hourly, daily, monthly. A more effective system is hourly plus-bonus
system. Under this system, earnings for the worker are calculated not only for the time
spent, but also for the achievement of certain quantitative and qualitative indicators.
Quantitative indicators may include time spent, execution of planned tasks. Qualitative
indicators include increase in the quality of the product, saving of raw materials, fuel,

Section 1. Theoretical Basis of Human Resources Management in International Organization 14
tools, compliance with technological regimes, etc. Many enterprises use the hourly plus-
bonus system with normalized tasks. Workers are rewarded for fulfilling their
normalized tasks. In the case of using this system, each worker has a specific variable or
monthly task (in units, hours or money) and the results are taken into account when
calculating bonuses for this period. The introduction of this system is accompanied by
an increase in the standardization of labor, introduction of technically sound quantitative
norms and standards (Завіновська, 2016, p.76).
In conditions of expansion of economic independence of enterprises and transition to
market relations, the ineffectiveness of salary organization on the basis of a rigid tariff
system becomes evident. Under inflation, imperfect tax mechanisms complicate the
work of enterprises and firms in such a way that they do not always have an opportunity
to pay salaries guaranteed by the tariff system to all employees. Therefore, this led to
the development and implementation of non-tariff and flexible salary systems,
remuneration systems for qualifications and personal merits, taking into account the
financial performance of enterprises.
Flexible remuneration system is a system in which a certain part of earnings is
dependent on personal merits and an overall efficiency of an enterprise. When
determining an amount of pay, a company takes into account not only experience,
qualifications, and professional skills, but also an importance of an employee, his/her
ability to achieve certain goals for the development of an organization.
In flexible systems, tariff serves as a basis for an employee's earnings, which is
supplemented by various bonuses and fringe benefits. Flexible tariff system differs from
the usual systems by the fact that it is developed for the needs and taking into account a
specific enterprise; the basis of its formation is, first of all, a list of those works that are
carried out at this enterprise and qualify in terms of complexity and significance for this
enterprise; employee's earnings are individualized and depend on the actual results of
work. Expansion of economic independence is accompanied by the use of a non-tariff
remuneration system.
Non-tariff remuneration system is an organization of remuneration based on the
principle of partial distribution of collective’s earned money among employees
according to established ratios (coefficients) in salaries for work of different quality
(depending on qualification, position, profession of employees, etc.). In this case,
guaranteed tariff rates, as well as most types of bonuses, fringe benefits and allowances
are not used. The level of payment for each employee depends on the salary fund of an

Section 1. Theoretical Basis of Human Resources Management in International Organization 15
enterprise. Thus, each employee receives his share depending on the final result of an
organization and its position in the market, which contributes to increasing interest in
the affairs of an organization. Non-tariff remuneration systems are flexible, easy for
understanding by all employees, and ensure their interest in the results of work. They
are widely used at joint-stock, small and private enterprises in various modifications and
models (Буряк, Карпінський, & Григор’єва, 2004, p.196).
The main non-material means of maintaining high labor activity are creation of
favorable working conditions, normal psychological climate, promotion of workers,
possibility of career growth and rapid advancement, awarding, conducting training and
advanced training courses, etc. In the general sense, it is necessary to create conditions
favorable for employees to express themselves, to take the initiative and to develop
interest in work. In modern conditions, non-material incentives and compensation are
gaining in importance, and therefore, for an ideal system of job incentives, it is
necessary to balance the use of all four tools of motivation: material and non-material
incentives, mixed forms of incentives and compensatory payments.
In general, whatever means, tools and methods are chosen, functioning of human
resources management mechanism should meet the following requirements: complexity,
that is, taking into account the interconnection of all functions and departments;
flexibility, which is expressed in readiness for rapid changes; self-improvement;
continuous monitoring of key indicators with further adjustment of measures aimed at
achieving goals; information using modern approaches and technologies; effective
development; continuity of the mechanism (Шитікова, 2015, p.57).
1.3. Methodological approaches to the evaluation of human
resources management effectiveness
When considering approach to assessing the HRM and what should be assessed in order
to see how it deals with existing challenges, it is necessary to assess HRM effectiveness.
Effectiveness of an integrated system of human resources management of an enterprise
should be considered as part of the effectiveness of an enterprise as a whole. However,
there is currently no single approach to assessing this effectiveness. The difficulty lies in
the fact that the process of work of employees is closely linked to the production
process, its final results, and to the social development of an enterprise. Accordingly,
the methodology of evaluation is based on the choice of criteria of effectiveness of
Section 1. Theoretical Basis of Human Resources Management in International Organization 16
organizational, economic and social subsystems of the complex system. Goals of these
subsystems can server as such criteria (Козак, 2000, p.3).
The task of assessing the effectiveness of human resources management of an enterprise
is to determine:
1) economic effectiveness (characterizes achievement of the goals of an enterprise
through better use of labor potential);
Criteria for assessing the economic effectiveness of HRM of an enterprise should reflect
the effectiveness and result of human labor.
2) social effectiveness (characterizes meeting expectations and satisfaction of needs
and interests of employees of an enterprise);
Social effectiveness of human resources management of an enterprise is largely
determined by an organization and motivation of labor, the state of socio-psychological
climate in the collective, that is depends more on the forms and methods of working
with each employee.
3) organizational effectiveness (evaluates an integrity and organizational design of
an enterprise) (Балабанова & Сардак, 2016, p.487).
Assessment of the effectiveness of human resources management is carried out by
analyzing the coefficients that characterize stability of personnel and firm's staffing,
structure of personnel, analysis of the wage fund and its profitability, ratio of production
and financial costs of the human resources system, labor productivity, qualitative and
quantitative personnel assessment, level of personnel satisfaction with working
conditions and other factors. Choice of methodology for HRM research depends on the
type of organization conducting the analysis, specific research objectives and available
resources.
One of the basic methods of assessment is the analysis of qualifications of the
personnel, their level of education, as well as age structure. These indicators can be used
to observe the general tendency of the personnel system development and to analyze the
qualitative characteristics of the personnel.
The next group of factors relates to the provision of human resources. It includes the
turnover of personnel, the consistency of personnel, the rate of turnover based on
dismissal and hiring, the ratio of total personnel turnover.
Personnel turnover is an aggregate of employees' dismissals, both unsolicited and for
absenteeism and other violations of labor discipline, in relation to their average number.
Turnover worsens many performance indicators. First of all, it is a lost profit due to the

Section 1. Theoretical Basis of Human Resources Management in International Organization 17
slow integration of new-hires and the reduction of labor productivity. There are
difficulties with motivation of the personnel. The turnover of the personnel worsens the
climate in the collective, which prevents the creation of a team. The state of the process
of personnel turnover in an enterprise is characterized by the coefficient of personnel
turnover (𝐶𝑇) (formula 1.1):
𝐶𝑇 = 𝑁𝑈𝑁𝑆𝑂𝐿.𝐷𝐼𝑆𝑀.+ 𝑁𝐷𝐼𝑆𝐶.𝑉𝐼𝑂𝐿.𝐷𝐼𝑆𝑀.
𝑁𝐴𝑉𝑅 x 100% (1.1)
where 𝑁𝐴𝑉𝑅 - average number of employees;
𝑁𝑈𝑁𝑆𝑂𝐿.𝐷𝐼𝑆𝑀. - number of employees who left the company based on unsolicited
dismissal;
𝑁𝐷𝐼𝑆𝐶.𝑉𝐼𝑂𝐿.𝐷𝐼𝑆𝑀. - number of employees dismissed for violations of labor discipline
(Балабанова & Сардак, 2016, p.234).
If 𝐶𝑇 is 3-5% - turnover of personnel in an enterprise is low and symbolizes the natural
renewal of personnel;
5% ≤ 𝐶𝑇 ≤ 10% - turnover of personnel in an enterprise is average;
𝐶𝑇 > 10% - turnover of personnel in an enterprise is high.
The ratio of hiring turnover is defined as the ratio of the number of all hired employees
to the average number of employees (formula 1.2):
𝐶𝐻𝑇 = 𝑁𝐻
𝑁𝐴𝑉𝑅 x 100% (1.2)
where 𝑁𝐻 - number of hired employees during the reporting period;
𝑁𝐴𝑉𝑅 - average number of employees.
The dismissal turnover is characterized by the number of employees who dismissed (or
were dismissed) from an enterprise for the given period for various reasons. The
coefficient of dismissal turnover is defined as the ratio of the number of all employees
dismissed for a certain period to an average number of employees (formula 1.3):
𝐶𝐷𝑇 = 𝑁𝐷
𝑁𝐴𝑉𝑅 x 100% (1.3)
where 𝑁𝐷 - number of dismissed employees during the reporting period;
𝑁𝐴𝑉𝑅 - average number of employees (Іванілов, 2009, p.351).

Section 1. Theoretical Basis of Human Resources Management in International Organization 18
The coefficient of total turnover (𝐶𝑇𝑇) is calculated by the ratio of the number of hired
and dismissed employees to the average number of employees or determined as the sum
of the coefficients of hiring turnover and dismissal turnover for the period (formula 1.4):
𝐶𝑇𝑇 = 𝐶𝐻𝑇 + 𝐶𝐷𝑇 (1.4)
where 𝐶𝐻𝑇 – coefficient of hiring turnover;
𝐶𝐷𝑇 – coefficient of dismissal turnover.
There is also a set of ratios used to assess talent acquisition:
Turnover coefficient of new employees (formula 1.5):
𝐶𝑇𝑁𝐸 = 𝑁𝐷𝑁𝐸
𝑁𝑇𝑁𝐸
(1.5)
where 𝑁𝐷𝑁𝐸 – number of new employees (working at the company for less than 2
years), who dismissed during the reporting period;
𝑁𝑇𝑁𝐸 – total number of new employees (working at the company for less than 2 years).
Coefficient of attraction of diversified profiles (formula 1.6):
𝐶𝐴𝐷𝑃 = 𝑁𝐷𝑃
𝑁𝐴𝑉𝑅
(1.6)
where 𝑁𝐷𝑃 – number of employees, who belong to particular group according to gender
or age criteria;
𝑁𝐴𝑉𝑅 – average number of employees.
Another important area to assess is talent development:
Coefficient of international assignments (formula 1.7):
𝐶𝐼𝐴 = 𝑁𝐷𝑃
𝑁𝐴𝑉𝑅
(1.7)
where 𝑁𝐼𝐴 – number of employees, who got an international assignment during the
reporting period;
𝑁𝐴𝑉𝑅 – average number of employees.
Coefficient of retaining of key talents (formula 1.8):

Section 1. Theoretical Basis of Human Resources Management in International Organization 19
𝐶𝑅𝐾𝑇 = 𝑁𝐷𝐾𝑇
𝑁𝑇𝐾𝑇
(1.8)
where 𝑁𝐷𝐾𝑇 – number of key talents that left the company during the reporting period;
𝑁𝑇𝐾𝑇 – total number of key talents in the company.
Coefficient of promotions (formula 1.9):
𝐶𝑃 = 𝑁𝑃
𝑁𝐴𝑉𝐺
(1.9)
where 𝑁𝑃 – number of employees, who received promotion during the reporting period;
𝑁𝐴𝑉𝑅 – average number of employees.
For the analysis of the economic effectiveness of the existing personnel policy,
companies use the ratio of profitability of the use of labor resources (𝑃𝐿), which is
calculated as the ratio of profit to the average number of employees of the enterprise
(formula 1.10):
𝑃𝐿 = 𝑃𝑁𝐼
𝑁𝐴𝑉𝑅
(1.10)
where 𝑃𝑁𝐼 – net income;
𝑁𝐴𝑉𝑅 - average number of employees.
This indicator characterizes the amount of profit provided for the company by one
average employee. It is expressed in UAH per employee (Дядечко, 2007, p.211).
Indicators for assessing the economic effectiveness of human resources management of
an enterprise:
1) Ratio of the costs necessary to provide the company with skilled personnel, and
the results derived from their activities.
2) Ratio of the budget of the unit of an enterprise to the number of personnel of this
unit.
3) Cost assessment of the differences in the effectiveness of labor (determined as a
difference in results of the work of the best and average employees performing
the same job).

Section 1. Theoretical Basis of Human Resources Management in International Organization 20
These indicators target employees for achievement of planned tasks, rational use of
working time, improvement of labor and executive discipline and, mainly, aimed at
improving the organization of work.
In addition, in a market economy, the following economic indicators are important:
profit;
labor productivity;
sales volume;
profitability;
ratio of the growth rates of labor productivity to the growth rates of average
salaries;
wages and salary fund;
management costs (Балабанова & Сардак, 2016, p.237).
For a complete analysis of effectiveness at enterprises with a large number of
employees, companies use indicators of the achievement of the plan by the number and
composition of employees. To do this, you need to analyze the overall provision of an
enterprise with labor force, namely:
1) determine achievement of plan by number by groups and categories of
employees;
2) determine the specific weight of industrial and production personnel and non-
industrial personnel to the total number. At the same time, the higher level of
provision with industrial and production personnel is a positive factor, because
they produce products, and non-industrial staff only helps with its release to the
market;
3) determine an absolute and relative excess or shortage of labor in groups and
categories of workers.
An absolute deviation is the difference between actual and planned number for each
category of industrial and production personnel. An enterprise plans its size based on a
certain volume of output. Change in the volume of output leads to a change in the
number of employees. Therefore, it is necessary to calculate a relative deviation as well.
Relative deviation must be adjusted by the percentage of achievement of the production
volume plan. Relative deviation is calculated only in the category of workers, because
only they take part in the production. The calculations oversee the difference between
actual number of workers and adjusted planned number. The absolute deviation
accurately reflects achievement of the plan by number in case, when the plan for the

Section 1. Theoretical Basis of Human Resources Management in International Organization 21
production is executed for 100%. If the plan is not executed or over fulfilled, then it is
necessary to determine the relative deviation (“Економічний аналіз”, 2015).
There are also other performance indicators to analyze effectiveness, which are
primarily related to an organizational effectiveness of human resources management:
1) Ratio of the number of management apparatus and other categories of
employees.
2) Reliability of the personnel (determined by the magnitude of possible failures in
the work of all units of an enterprise due to late information provision, errors in
calculations, violations of labor discipline).
3) Uniformity of loading of personnel (characterizes a specific weight of losses due
to overload of workers).
4) Level of labor discipline (reflects the ratio of the number of cases of violations
of labor and executive discipline to the total number of employees of an
enterprise). It allows us to make conclusions about organizational order in the
enterprise and its organizational culture.
5) Staffing.
It is assessed:
quantitatively - by comparing the actual number of personnel with the required
amount (calculated based on the labor intensity of operations) or with the
planned number provided by the staff list;
qualitatively - according to corresponding of professional qualification level,
education, practical experience of personnel to the requirements of occupied
jobs (positions) (Балабанова & Сардак, 2016, p.239).
It is important to understand that there is no one proper way to assess the effectiveness
of HRM of an enterprise, because each company is unique and its challenges are also
unique. Therefore, while choosing the indicators for assessment, it is necessary to
ensure that they cover the individual characteristics of an enterprise and its personnel,
and allow assessing the system under study in a sufficient manner.

Section 2. Analysis of Human Resources Management of PrJSC “Philip Morris Ukraine” 22
Section 2. Analysis of Human Resources Management of PrJSC
“Philip Morris Ukraine”
2.1. Characteristic of financial and economic activity of PrJSC “Philip
Morris Ukraine”
Philip Morris International (PMI) is an American corporation, which is one of the
biggest tobacco companies in the world. Currently Philip Morris International employs
approximately 80 000 employee. The company has affiliates in 71 countries and 48
factories in 32 of these countries. Products of the company are sold on the markets of
more than 180 countries.
On the market of Ukraine, Philip Morris International is represented by two legal
entities: PrJSC “Philip Morris Ukraine” (PMU) and LLC “Philip Morris Sales and
Distribution” (PMSD). PrJSC “Philip Morris Ukraine” is responsible for production and
all administrative functions. The head office is in Kiev, and the factory is in Kharkov.
PMU also manages the affiliates of PMI in Armenia, Georgia and Moldova, creating a
so called “cluster” (“Philip Morris International”, 2017).
PMU produces cigarettes both for the Ukrainian market and for export, as well as
imports cigarettes and necessary materials for their production. Therefore, it is engaged
in foreign economic activity. Based on licensing conditions, the main areas of activity
of the enterprise are:
manufacturing of tobacco products;
wholesale of tobacco products;
import of tobacco products;
export of tobacco products;
advice on business and management.
Let’s analyse the dynamics of the main indicators of financial and economic activity of
PMU for 2013-2017, based on the balances and statements of financial results
(Appendix A). They are presented in table 2.1.

Section 2. Analysis of Human Resources Management of PrJSC “Philip Morris Ukraine” 23
Table 2.1
Main indicators of financial and economic activity of PMU in 2013-2017, UAH th
Source: own representation based on balances and statements of financial results of
PMU for 2013-2017 (Appendix A)
We can observe a steady growth of total assets of the company (compound annual
growth rate of 34,28%). This growth was mainly driven by an increase in total accounts
receivable (CARG = 49,90%), namely intercompany settlements. It can be explained by
active exports of PMU to other affiliates, thus in 2014 PMU started exporting to Japan,
which over the years became its main export destination. Every year it was expanding
its export geography, the last countries added to the list in 2017 were Saudi Arabia and
Albania. Besides accounts receivable, there was also slight increase in PPE (CAGR =
3,37%), which mainly happened in 2017 due to capacity expansion for new export
markets and new products (new brand “Phillip Morris” replaced “President” in the
beginning of 2017). Inventories amount also grew by 149,65% percent, mainly through
accumulation of production stock. The amount of cash and cash equivalents has also
increased over 2013-2017 by 87,16%. However, this increase happened in 2017, while
in 2016 CCE amount dropped by 64,86% in comparison to 2015. Such change was
caused by price wars, taking place on Ukrainian tobacco market in 2016.
Long-term liabilities of PMU decreased by 26,76% over 2013-2017, with significant
increase in 2014 by 249,63% in 2014 and then decrease by 38,02% and 66,90% in 2015
and 2016 correspondingly. This change was mainly driven by acquired deferred tax
liabilities and long-term provisions in 2014, and their payment out in 2016. It is a very
positive tendency, since the company decreases the amount of money owned in long-
term perspective. At the same time, current liabilities of the company increased by
467,86% over the same period of 2013-2017, with two main increases in 2014 (93,61%)
and in 2016 (by 90,46%). For both years, current liabilities almost doubled mostly due
to increase in accounts payable on intercompany settlements. PMU imports raw
materials and finished goods from other affiliates. Such sharp increase of accounts
CAGR, %
2014 -
2013
2015 -
2014
2016 -
2015
2017 -
2016
2017 -
2013
2014 -
2013
2015 -
2014
2016 -
2015
2017 -
2016
2017-
2013
2017 -
2013
Total assets 3 058 001 4 136 888 5 147 164 7 923 414 9 941 709 1 078 887 1 010 276 2 776 250 2 018 295 6 883 708 35,28 24,42 53,94 25,47 225,10 34,28
Property, plant and
equipment1 068 688 991 197 960 540 1 013 504 1 220 379 -77 491 -30 657 52 964 206 875 151 691 -7,25 -3,09 5,51 20,41 14,19 3,37
Inventories 508 532 1 058 950 939 781 1 286 855 1 269 558 550 418 -119 169 347 074 -17 297 761 026 108,24 -11,25 36,93 -1,34 149,65 25,70
Total accounts receivable 1 341 130 1 866 824 2 966 459 4 693 277 6 771 537 525 694 1 099 635 1 726 818 2 078 260 5 430 407 39,20 58,90 58,21 44,28 404,91 49,90
Cash and cash equivalents 20 541 22 513 19 515 6 858 38 444 1 972 -2 998 -12 657 31 586 17 903 9,60 -13,32 -64,86 460,57 87,16 16,96
Retained earnings
(accumulated deficit)1 301 519 746 326 751 766 -330 977 296 329 -555 193 5 440 -1 082 743 627 306 -1 005 190 -42,66 0,73 -144,03 189,53 -77,23 -30,92
Equity 1 348 777 793 564 798 994 -283 758 343 538 -555 213 5 430 -1 082 752 627 296 -1 005 239 -41,16 0,68 -135,51 221,07 -74,53 -28,96
Registered (share) capital 2 647 2 647 2 647 2 647 2 647 0 0 0 0 0 0,00 0,00 0,00 0,00 0,00 0,00
Long-term liabilities 21 809 76 251 47 263 15 642 15 973 54 442 -28 988 -31 621 331 -5 836 249,63 -38,02 -66,90 2,12 -26,76 -7,49
Current liabilities 1 687 415 3 267 073 4 300 907 8 191 530 9 582 198 1 579 658 1 033 834 3 890 623 1 390 668 7 894 783 93,61 31,64 90,46 16,98 467,86 54,37
Deviation, +/-
IndicatorDec 31,
2015
Dec 31,
2016
Dec 31,
2017
Dec 31,
2014
Dec 31,
2013
Growth rate, %

Section 2. Analysis of Human Resources Management of PrJSC “Philip Morris Ukraine” 24
payable was caused by the fact that those years PMU imported more semi-finished
products and raw materials.
There has been no change in share capital, while total equity of the company decreased
by 74,53% over 2013-2017. In addition to that, in 2016 it was negative (-283 758 UAH
th). Such drop in equity was fully driven by changes in retained earnings of the
company, which, in turn, were affected by net profit (loss) of the company. In 2016 the
company lost 1 082 743 UAH th due to price war that started in 2015 and reached its
peak in 2016. This price war forced all players of Ukrainian tobacco market to decrease
their prices and sometimes even sell below the cost of goods sold. However, in 2017 the
company recovered and managed to earn 627 306 UAH th, leading to 296 329 UAH th
of accumulated retained earnings. If we analyse the dynamics of net profit in 2013-
2017, presented in table 2.2, we can see that despite overall it decreased by 51,80%,
while net sales increased by 88,38%, after crisis in 2016, net income grew by 157,94%,
while new sales growth was only 22,6%. It shows that the company managed to
optimize its costs and expenses (e.g. it decreased its selling and distribution expenses by
approximately 1/3) to drive up its profits.
Table 2.2
Net revenue and net profit (loss) of PMU in 2013-2017, UAH th
Source: own representation based on balances and statements of financial results of
PMU for 2013-2017 (Appendix A)
Heavy effect of pricing on net sales of the company can be observed also when
analyzing shipment volumes of the company, which are shown in table 2.3. We can see
that when in 2016, during price war, shipments grew by 14,73%, net sales decrease by
1,93%. And then in 2017, when the situation with prices stabilized, shipments decreased
by 12,11%, and net sales grew by 22,60%. Therefore, we can conclude that the sales of
the company are price-driven, not volume-driven.
CAGR, %
2014 -
2013
2015 -
2014
2016 -
2015
2017 -
2016
2017 -
2013
2014 -
2013
2015 -
2014
2016 -
2015
2017 -
2016
2017-
2013
2017 -
2013
Net revenue from sales 5 675 111 6 824 507 8 891 769 8 719 818 10 690 885 1 149 396 2 067 262 -171 951 1 971 067 5 015 774 20,25 30,29 -1,93 22,60 88,38 17,15
Net profit (loss) 1 301 500 746 304 5 440 -1 082 743 627 306 -555 196 -740 864 -1 088 183 1 710 049 -674 194 -42,66 -99,27 -20 003,36 157,94 -51,80 -16,68
2017
Deviation, +/-
Indicator 2013 2014 2015 2016
Growth rate, %

Section 2. Analysis of Human Resources Management of PrJSC “Philip Morris Ukraine” 25
Table 2.3
Ukrainian cigarette market size and PMU share in 2013-2017
Source: own representation based on “Philip Morris International”, 2017
If we analyse cigarette market and PMU performance on it (see table 2.3), we can see
that the market dropped by 7,19% in 2014, then grew by 1,29% and 3,54% in 2015 and
2016 correspondingly, and then dropped again by 8,2% in 2017. A decrease in 2014
was mainly influenced by the impact of price increases and business disruption due to
the political instability in the east of the country. An increase in 2016 was mainly driven
by a lower prevalence of illicit trade, because due to price war, cigarette prices were so
low that illicit trade was not cost-efficient. When the prices went up in 2017, the
prevalence of illicit trade increased, and these two factors caused total cigarette market
decrease. At the same time we can see that PMU has lost 6.2% of its market share over
2013-2017. In 2014 share of all brands decreased, slightly offset by growth from low-
price President in “Others”. In 2015 share decrease happened primarily due to
Marlboro, reflecting the impact of widened price gaps, and mid-price Chesterfield and
super-low President in “Others”, mainly resulting from competitive price pressure in the
low price segment, partly offset by Bond Street and L&M in “Others”. The decrease in
2017 was mainly due to Bond Street, reflecting competitive pressure from lower-priced
alternatives, partly offset by Parliament and Philip Morris, following the successful
portfolio consolidation of a local, low-price brand in “Others”.
We have calculated and analysed several profitability indicators: gross profit margin,
operating profit margin, net profit margin, return on assets (ROA) and return of equity
(ROE). We have also compared PMU results with those of its three main competitors:
British American Tobacco (BAT), Imperial Tobacco (IMP) and Japan Tobacco
International (JTI). The results are summarized in table 2.4.
CAGR, %
2014 -
2013
2015 -
2014
2016 -
2015
2017 -
2016
2017 -
2013
2017 -
2013
Total Cigarette Market bln cigarettes 75,10 69,70 70,60 73,10 67,10 -7,19 1,29 3,54 -8,21 -10,65 -2,78
PMU Shipments mln cigarettes 25 500 23 273 19 195 22 022 19 356 -8,73 -17,52 14,73 -12,11 -24,09 -6,66
PMI Cigarrete Market Share
Marlboro % 5,50 4,90 3,80 3,10 3,00 -10,91 -22,45 -18,42 -0,32 -45,45 -14,06
Parliament % 3,30 3,10 2,90 2,90 3,20 -6,06 -6,45 0,00 1,03 -3,03 -0,77
Bond Street % 8,96 8,90 8,30 10,00 8,40 -0,61 -6,74 20,48 -1,60 -6,20 -1,59
Philip Morris % - - - - 3,10 x x x x x x
Others % 15,75 15,80 15,00 13,20 9,60 0,35 -5,06 -12,00 -2,73 -39,03 -11,63
Total % 33,50 32,70 30,00 29,20 27,30 -2,39 -8,26 -2,67 -0,65 -18,51 -4,99
2015 2016 2017Indicator Units 20142013
Growth rate, %
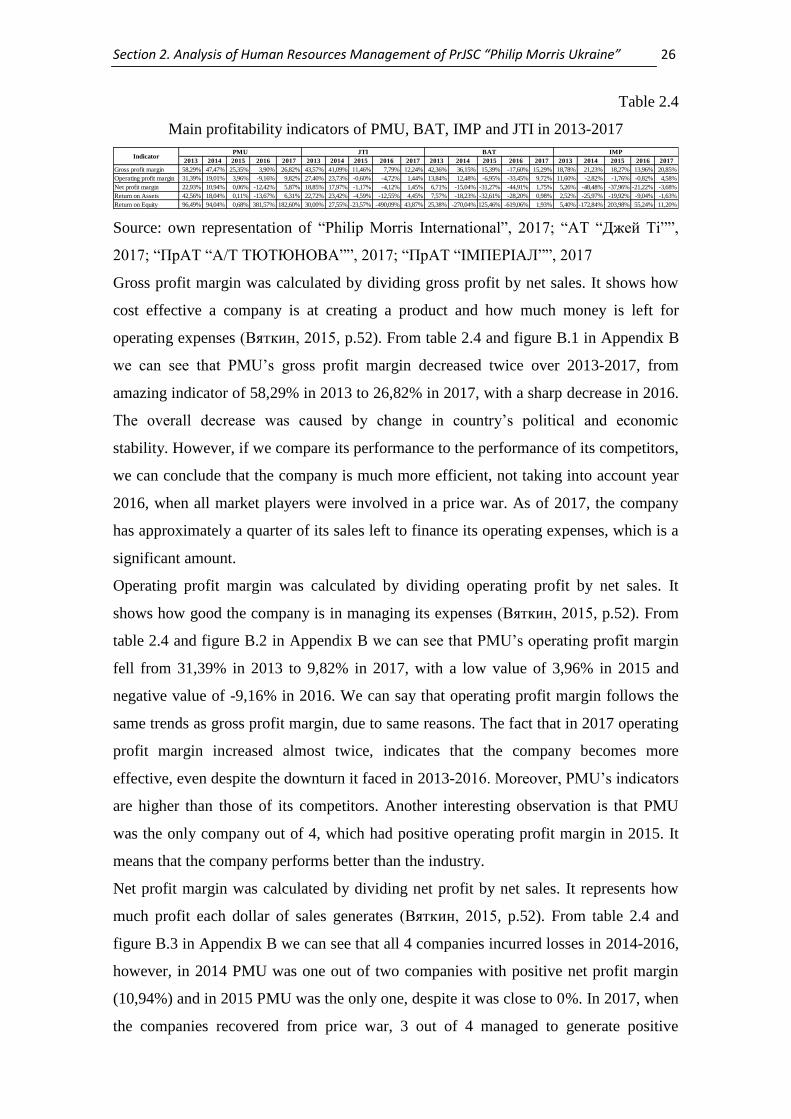
Section 2. Analysis of Human Resources Management of PrJSC “Philip Morris Ukraine” 26
Table 2.4
Main profitability indicators of PMU, BAT, IMP and JTI in 2013-2017
Source: own representation of “Philip Morris International”, 2017; “АТ “Джей Ті””,
2017; “ПрАТ “А/Т ТЮТЮНОВА””, 2017; “ПрАТ “ІМПЕРІАЛ””, 2017
Gross profit margin was calculated by dividing gross profit by net sales. It shows how
cost effective a company is at creating a product and how much money is left for
operating expenses (Вяткин, 2015, p.52). From table 2.4 and figure B.1 in Appendix B
we can see that PMU’s gross profit margin decreased twice over 2013-2017, from
amazing indicator of 58,29% in 2013 to 26,82% in 2017, with a sharp decrease in 2016.
The overall decrease was caused by change in country’s political and economic
stability. However, if we compare its performance to the performance of its competitors,
we can conclude that the company is much more efficient, not taking into account year
2016, when all market players were involved in a price war. As of 2017, the company
has approximately a quarter of its sales left to finance its operating expenses, which is a
significant amount.
Operating profit margin was calculated by dividing operating profit by net sales. It
shows how good the company is in managing its expenses (Вяткин, 2015, p.52). From
table 2.4 and figure B.2 in Appendix B we can see that PMU’s operating profit margin
fell from 31,39% in 2013 to 9,82% in 2017, with a low value of 3,96% in 2015 and
negative value of -9,16% in 2016. We can say that operating profit margin follows the
same trends as gross profit margin, due to same reasons. The fact that in 2017 operating
profit margin increased almost twice, indicates that the company becomes more
effective, even despite the downturn it faced in 2013-2016. Moreover, PMU’s indicators
are higher than those of its competitors. Another interesting observation is that PMU
was the only company out of 4, which had positive operating profit margin in 2015. It
means that the company performs better than the industry.
Net profit margin was calculated by dividing net profit by net sales. It represents how
much profit each dollar of sales generates (Вяткин, 2015, p.52). From table 2.4 and
figure B.3 in Appendix B we can see that all 4 companies incurred losses in 2014-2016,
however, in 2014 PMU was one out of two companies with positive net profit margin
(10,94%) and in 2015 PMU was the only one, despite it was close to 0%. In 2017, when
the companies recovered from price war, 3 out of 4 managed to generate positive
2013 2014 2015 2016 2017 2013 2014 2015 2016 2017 2013 2014 2015 2016 2017 2013 2014 2015 2016 2017
Gross profit margin 58,29% 47,47% 25,35% 3,90% 26,82% 43,57% 41,09% 11,46% 7,79% 12,24% 42,36% 36,15% 15,39% -17,60% 15,29% 18,78% 21,23% 18,27% 13,96% 20,85%
Operating profit margin 31,39% 19,01% 3,96% -9,16% 9,82% 27,40% 23,73% -0,60% -4,72% 1,44% 13,84% 12,48% -6,95% -33,45% 9,72% 11,60% -2,82% -1,76% -0,82% 4,58%
Net profit margin 22,93% 10,94% 0,06% -12,42% 5,87% 18,85% 17,97% -1,17% -4,12% 1,45% 6,71% -15,04% -31,27% -44,91% 1,75% 5,26% -48,48% -37,96% -21,22% -3,68%
Return on Assets 42,56% 18,04% 0,11% -13,67% 6,31% 22,72% 23,42% -4,59% -12,55% 4,45% 7,57% -18,23% -32,61% -28,20% 0,98% 2,52% -25,97% -19,92% -9,04% -1,63%
Return on Equity 96,49% 94,04% 0,68% 381,57% 182,60% 30,00% 27,55% -23,57% -490,09% 43,87% 25,38% -270,04% 125,46% -619,06% 1,93% 5,40% -172,84% 203,98% 55,24% 11,20%
IndicatorPMU JTI BAT IMP

Section 2. Analysis of Human Resources Management of PrJSC “Philip Morris Ukraine” 27
returns and PMU demonstrated the best result (5,87%). An interesting observation is
that BAT, having almost equal operating profit margin with PMU in 2017 (9,72% vs.
9,82%), has a significantly lower net profit margin (1,75% vs. 5,87%). It means that
PMU is more effective in its debt management and has smaller amounts of interest and
taxes to pay.
Return on Assets (ROA) was calculated by dividing net profit by total assets. ROA is an
indicator of how efficient a company's management is at using its assets to generate
earnings (Базілінська, 2009, p.203). The picture with ROA (see Fig. B.4 in Appendix
B) is very similar to the one with net profit margin, since Total Assets demonstrated
similar dynamics to that of Net Sales. PMU has successfully recovered in 2017 with
ROA of 6,31%, which is higher than of its competitors. It shows that management is
working on improvement of the effective use of assets.
Return on Equity (ROE) was calculated by dividing net profit by total equity. It is the
amount of net income returned as a percentage of shareholders equity (Базілінська,
2009, p.202). Return on equity measures a corporation's profitability by revealing how
much profit a company generates with the money shareholders have invested. In table
2.4 and figure B.5 in Appendix B positive ROE in 2015 for BAT and IMP, in 2016 for
PMU and IMP, and in 2017 for IMP can be misleading, because in reality both net
profit and total equity in these cases were negative, which actually states about a very
bad situation and loss of money for the companies. Taking that into account we can
conclude that in 2015 only PMU had positive ROE, which stated about profitability of
the company (although it was very low - 0,68%). In 2016 all the companies incurred
losses. And in 2017, 3 out of 4 companies became profitable again, however, PMU did
it much better. It reached ROE of 182,60%, which means the company was very
effective that year in using its investors’ money. In addition to that, PMU’s ROE in
2017 is twice higher than in 2013. Therefore, despite an overall decrease in revenues
and profitability, the company managed to increase its effectiveness for investors.
However, we have to take into account that in 2016 equity was negative, which affected
ROE in 2017.
Overall we can state that PMU is a profitable company for its investors. It knows how to
recover fast and efficiently from market disturbances and it performs better than its
main competitors on tobacco market.
The financial state of an enterprise is determined by a set of indicators that reflect the
availability, allocation and use of enterprise resources, its real and potential financial

Section 2. Analysis of Human Resources Management of PrJSC “Philip Morris Ukraine” 28
opportunities. It directly affects the efficiency of entrepreneurial activity of economic
entities. Satisfactory financial state is stable liquidity, solvency and financial stability of
an enterprise, its provision with working capital and efficient use of enterprise
resources. Liquidity ratios characterize an ability of an enterprise to repay its current
debts (Іванілов, 2009, p.43).
To analyse liquidity of PMU we have calculated cash ration, quick ratio, current ratio as
well as net working capital to total assets ratio. The results are presented in table 2.5.
Table 2.5
Liquidity ratios of PMU in 2013-2017
Source: own representation based on balances and statements of financial results of
PMU for 2013-2017 (Appendix A)
Cash ratio (rate of cash reserves) is determined by the ratio of cash and cash equivalents
to the total amount of short-term debt of an enterprise. Its level shows how much of the
short-term liabilities can be redeemed at the expense of available cash. The higher is its
value, the higher is the guarantee of repayment of debts (Кірейцев, 2002, p.32).
This indicator shows that PMU can repay less than 1% of its short-term liabilities with
cash available, and it decreases over time (CARG = -24,23%). It means that in case the
company is asked to repay all of its short-term debt immediately, it will not be able to
do so without having to sell other assets. Therefore, we can conclude that company’s
liquidity is low, which might be a warning sign for its investors. However, it also means
that the company does not keep idle cash and invests into further development.
Quick ratio is the ratio of the total amount of current assets less inventories and deferred
expenses, to the amount of short-term liabilities. An acceptable value of an indicator is
considered to be between 0,6 and 1 (Кірейцев, 2002, p.33). In our case, this ratio stays,
mainly, within this interval (0.71 in 2017), therefore, quick liquidity is quite
satisfactory, although it slightly decreased by 12,15% over 2013-2017.
Current liquidity ratio is the ratio of the total amount of current assets less deferred
expenses to the total amount of short-term liabilities. It measures the cushion of working
capital maintained to allow for the unevenness in the flow of funds through the working
capital accounts. Excess of current assets over short-term liabilities provides a reserve
margin to compensate for losses incurred by the company in placing and eliminating all
current assets, except for cash. The larger is the value of this reserve, the greater is the
CAGR, %
2014 -
2013
2015 -
2014
2016 -
2015
2017 -
2016
2017 -
2013
2014 -
2013
2015 -
2014
2016 -
2015
2017 -
2016
2017 -
2013
2017 -
2013
Cash ratio 0,012 0,007 0,005 0,001 0,004 -0,005 -0,002 -0,004 0,003 -0,008 -43,392 -34,153 -81,549 379,216 -67,042 -24,231
Quick ratio 0,810 0,579 0,695 0,574 0,712 -0,231 0,116 -0,121 0,137 -0,098 -28,551 20,096 -17,358 23,886 -12,149 -3,186
Current ratio 1,111 0,903 0,914 0,732 0,844 -0,209 0,011 -0,182 0,113 -0,267 -18,761 1,184 -19,928 15,393 -24,049 -6,646
Growth rate, %Deviation, +/-
IndicatorDec 31,
2013
Dec 31,
2014
Dec 31,
2015
Dec 31,
2016
Dec 31,
2017

Section 2. Analysis of Human Resources Management of PrJSC “Philip Morris Ukraine” 29
credibility of the creditors that the debt will be repaid (“Економічний аналіз”, 2015).
The norm for this ratio is a value that equals to or is above 1. We can see that PMU’s
current ratio is below 1 and it dropped from 1,11 in 2013 to 0,84 in 2017. So, the
company does not have a very good margin of safety and it becomes weaker over time.
Solvency of an enterprise is a sign of financial stability, the essence of which is the
provision of current assets by long-term sources of financing. There are two types of
solvency: current solvency, at a certain point in time, and promising solvency, expected
in the short, medium and long term.
Analysis of long-term solvency of an enterprise is carried out by calculation of the
following indicators: equity multiplier ratio, debt-equity ratio, long-term debt ratio,
times interest earned ratio, working capital to current assets ratio, working capital to
equity ratio (“Економічний аналіз”, 2015).
The results are presented in table 2.6.
Table 2.6
Long-term solvency ratios of PMU in 2013-2017
Source: own representation based on balances and statements of financial results of
PMU for 2013-2017 (Appendix A)
Equity multiplier measures the amount of a firm's assets that are financed by its
stockholders' equity. The share of equity in the total amount of financial resources
should be not less than 50%, that is, equity multiplier should be equal to or lower than 2
(Незамайкин, 2015, p.62). In 2013 equity multiplier was 2,27 and by 2017 it grew with
a compound annual growth rate of 89,02% up to 28,94. Such tendency is caused by
sharp decrease in equity due to losses that the company incurred in 2016. As a result,
the company has low autonomy and most of its assets are currently financed through
debt.
Debt-to-equity ratio is calculated as the ratio of borrowed and own funds and
characterizes the dependence of an enterprise on the borrowed funds. The ratio should
be less than 1 (Незамайкин, 2015, p.64). For PMU the indicator is significantly greater
than 1 and in 2017 in amounted to 27,94, meaning that for each dollar of equity there
are 27,94 dollars of borrowed funds. At the same time in 2013 it was only 1,27 dollars.
CAGR, %
2014 -
2013
2015 -
2014
2016 -
2015
2017 -
2016
2017 -
2013
2014 -
2013
2015 -
2014
2016 -
2015
2017 -
2016
2017 -
2013
2017 -
2013
Equity multiplier ratio 2,267 5,213 6,442 -27,923 28,939 2,946 1,229 -34,365 56,862 26,672 129,929 23,576 -533,451 -203,639 1 176,406 89,015
Debt-equity ratio 1,267 4,213 5,442 -28,923 27,939 2,946 1,229 -34,365 56,862 26,672 232,459 29,171 -631,474 -196,598 2 104,727 116,690
Long-term debt ratio 0,007 0,018 0,009 0,002 0,002 0,011 -0,009 -0,007 0,000 -0,006 158,448 -50,183 -78,501 -18,615 -77,472 -31,106
Times interest earned ratio 1,000 1,000 0,998 -2,423 5,048 0,000 -0,002 -3,421 7,471 4,048 0,000 -0,189 -342,765 -308,327 404,793 49,892
Working capital to current assets ratio 0,106 -0,103 -0,094 -0,366 -0,184 -0,210 0,009 -0,272 0,182 -0,290 -197,180 -8,978 288,577 -49,829 -272,445 N/A
Working capital to equity 0,149 -0,386 -0,463 7,734 -4,326 -0,535 -0,077 8,197 -12,060 -4,475 -358,959 20,021 -1 769,309 -155,943 -3 002,515 N/A
Growth rate, %
IndicatorDec 31,
2013
Dec 31,
2014
Dec 31,
2015
Dec 31,
2016
Dec 31,
2017
Deviation, +/-

Section 2. Analysis of Human Resources Management of PrJSC “Philip Morris Ukraine” 30
So after that events of 2014 the company started to rely heavily on debt and it might be
at risk of servicing its debt, taking into account its unstable profitability.
Long-term debt ratio computes the proportion of a company's long-term debt compared
to its available capital (Барышникова, 2015, p.175). In 2013 it was 0,007, which is a
very low indicator, and it decrease even further to 0,002 in 2017. Such change was
caused by decreasing long-term debt along with rowing assets. Taking into account
previous indicators we can conclude that most of company’s assets are financed though
short-term debt. And in terms of long-term debt the company becomes less dependent
on it to grow its business.
Times interest earned ratio represents the margin of protection for the creditors (how
many times a company can cover its interest charges on a pre-tax basis) (Ефимова,
2013, p.276). In 2013 this indicator was equal to 1, which meant the company could
fully cover its interest expenses using funds provided by operations that year. In 2016
the situation worsened, since EBIT was negative, thus the ratio was negative as well,
meaning PMU could not fund any of its interest expenses through its operations.
However, then in 2017 the situation improved fast, with times interest earned ratio of
5,05, meaning that year the company could cover its interest expenses 5 times with its
net operations income. Therefore, we can see that the company is unstable and it may
cause concerns of the investors. However, taking into account that 2015-2016 were
years of disturbances on tobacco market and that in 2017 the company recovered fast,
the severity of risk is off-set by these facts.
Working capital to current assets ratio indicates the ability of a company to finance its
current assets with its working capital. It can be computed by dividing the company’s
working capital by its current assets (Барышникова, 2015, p.177). It should be not
lower than 0,1. Before 2014, the indicator was 0,11, which demonstrated a healthy
situation. However, since 2014 this indicator had a negative value, which means lack of
working capital and the gap between current assets and current liabilities increases,
since the ratio becomes even less. Therefore, the company cannot operate without
access to short-term financing sources and it does not have any long-term funds to
finance its working capital.
Working capital to equity ratio shows which portion of equity is used to finance current
operations, thus invested in working capital, and which is capitalized (Кірейцев, 2002,
p.37). It should be not lower than 0,1. Same as with working capital to current assets
ratio, after 2013 it is negative (positive value for 2016 is misleading because both,
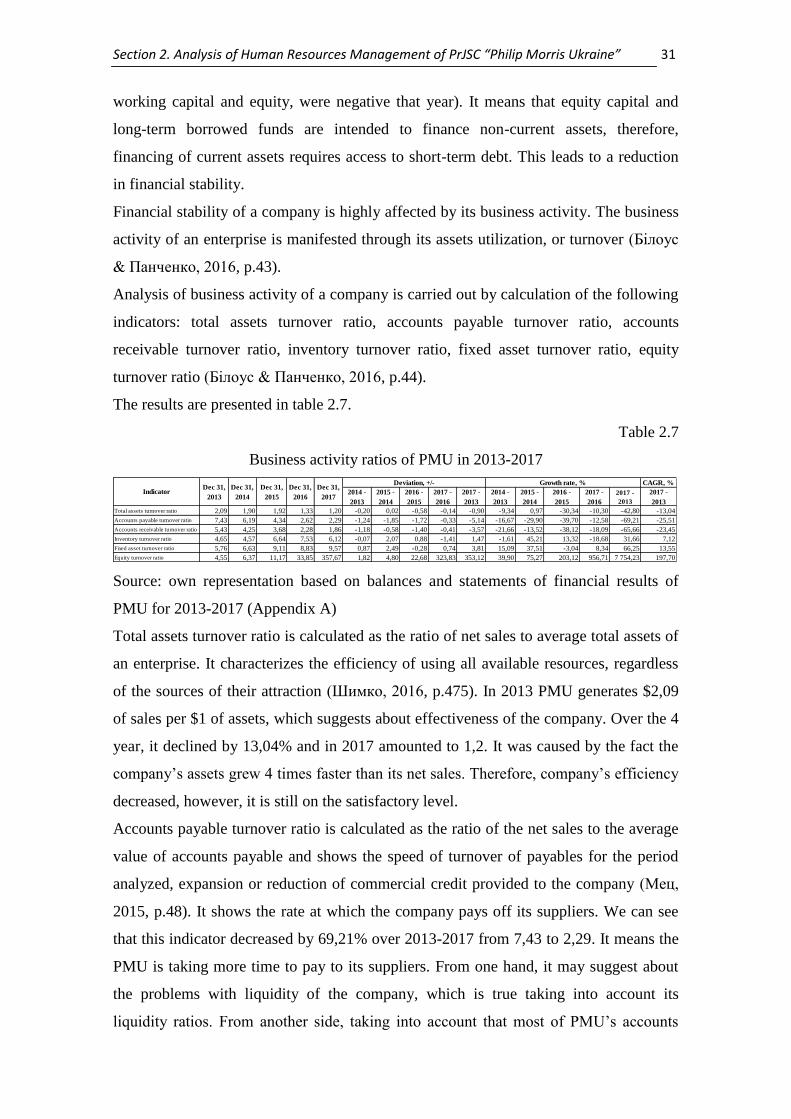
Section 2. Analysis of Human Resources Management of PrJSC “Philip Morris Ukraine” 31
working capital and equity, were negative that year). It means that equity capital and
long-term borrowed funds are intended to finance non-current assets, therefore,
financing of current assets requires access to short-term debt. This leads to a reduction
in financial stability.
Financial stability of a company is highly affected by its business activity. The business
activity of an enterprise is manifested through its assets utilization, or turnover (Білоус
& Панченко, 2016, p.43).
Analysis of business activity of a company is carried out by calculation of the following
indicators: total assets turnover ratio, accounts payable turnover ratio, accounts
receivable turnover ratio, inventory turnover ratio, fixed asset turnover ratio, equity
turnover ratio (Білоус & Панченко, 2016, p.44).
The results are presented in table 2.7.
Table 2.7
Business activity ratios of PMU in 2013-2017
Source: own representation based on balances and statements of financial results of
PMU for 2013-2017 (Appendix A)
Total assets turnover ratio is calculated as the ratio of net sales to average total assets of
an enterprise. It characterizes the efficiency of using all available resources, regardless
of the sources of their attraction (Шимко, 2016, p.475). In 2013 PMU generates $2,09
of sales per $1 of assets, which suggests about effectiveness of the company. Over the 4
year, it declined by 13,04% and in 2017 amounted to 1,2. It was caused by the fact the
company’s assets grew 4 times faster than its net sales. Therefore, company’s efficiency
decreased, however, it is still on the satisfactory level.
Accounts payable turnover ratio is calculated as the ratio of the net sales to the average
value of accounts payable and shows the speed of turnover of payables for the period
analyzed, expansion or reduction of commercial credit provided to the company (Мец,
2015, p.48). It shows the rate at which the company pays off its suppliers. We can see
that this indicator decreased by 69,21% over 2013-2017 from 7,43 to 2,29. It means the
PMU is taking more time to pay to its suppliers. From one hand, it may suggest about
the problems with liquidity of the company, which is true taking into account its
liquidity ratios. From another side, taking into account that most of PMU’s accounts
CAGR, %
2014 -
2013
2015 -
2014
2016 -
2015
2017 -
2016
2017 -
2013
2014 -
2013
2015 -
2014
2016 -
2015
2017 -
2016
2017 -
2013
2017 -
2013
Total assets turnover ratio 2,09 1,90 1,92 1,33 1,20 -0,20 0,02 -0,58 -0,14 -0,90 -9,34 0,97 -30,34 -10,30 -42,80 -13,04
Accounts payable turnover ratio 7,43 6,19 4,34 2,62 2,29 -1,24 -1,85 -1,72 -0,33 -5,14 -16,67 -29,90 -39,70 -12,58 -69,21 -25,51
Accounts receivable turnover ratio 5,43 4,25 3,68 2,28 1,86 -1,18 -0,58 -1,40 -0,41 -3,57 -21,66 -13,52 -38,12 -18,09 -65,66 -23,45
Inventory turnover ratio 4,65 4,57 6,64 7,53 6,12 -0,07 2,07 0,88 -1,41 1,47 -1,61 45,21 13,32 -18,68 31,66 7,12
Fixed asset turnover ratio 5,76 6,63 9,11 8,83 9,57 0,87 2,49 -0,28 0,74 3,81 15,09 37,51 -3,04 8,34 66,25 13,55
Equity turnover ratio 4,55 6,37 11,17 33,85 357,67 1,82 4,80 22,68 323,83 353,12 39,90 75,27 203,12 956,71 7 754,23 197,70
Growth rate, %Dec 31,
2017
Deviation, +/-
IndicatorDec 31,
2013
Dec 31,
2014
Dec 31,
2015
Dec 31,
2016

Section 2. Analysis of Human Resources Management of PrJSC “Philip Morris Ukraine” 32
payable are on intercompany settlements, it is most like that the company has negotiated
different payment terms.
Accounts receivable turnover ratio is calculated as the ratio of net sales to the average
annual amount of receivables and shows the rate of turnover of receivables of an
enterprise for the analyzed period, expansion or reduction of commercial loans provided
by the enterprise (Мец, 2015, p.49). It is used to quantify a firm's effectiveness in
extending credit as well as collecting debts. We can see that the indicator decreased by
65,66% from 2013 (5,43) to 2017 (1,86). Such indicators may suggest that the company
has not very good collecting policies and/or bad customers. However, if we take into
account the fact that most of PMU’s accounts receivable are on intercompany
settlements, we may assume that such receivables turnover is caused by negotiated
terms between the affiliates.
Inventory turnover ratio is calculated as the ratio of the cost of goods sold to the average
annual value of inventories and characterizes the rate of sales of inventory of the
enterprise (“Економічний аналіз”, 2015). It measures how many times a company sold
its total average inventory dollar amount during the year. There was an increase over
2013-2017 (from 4,65 to 6,12) with a peak in 2016 of 7,53, due to less inventories that
year because of price wars. Taking into account that this company operates in tobacco
industry, such numbers state about strong sales, and the situation is improving.
Fixed asset turnover ratio is calculated as the ratio of net sales to the average annual cost
of fixed assets. It shows the effectiveness of using fixed assets of an enterprise to
generate sales (Школьник, 2016, p.168). With slight off-set in 2016, PMU
demonstrates improving ability to support its sales by its fixed-assets. Thus, the
compound annual growth rate over 2013-2017 was 13,55%, amounting to fixed asset
turnover ratio of 9,57 in 2017. It means that per each dollar spend on fixed assets the
company generates $9,57 of sales.
Equity turnover ratio is calculated as the ratio of net sales to the average annual equity
of the company. It shows the effectiveness of using equity to generate sales
(Школьник, 2016, p.170). Since in 2016 company’s equity was negative, average
annual equity of PMU in 2016 and 2017 was very small. As a result, we can observe
high equity turnover ratio value in 2016 (33,85) and huge value in 2017 (357,67). In
general it means that even despite accumulated losses, the company is able to
effectively generate sales.

Section 2. Analysis of Human Resources Management of PrJSC “Philip Morris Ukraine” 33
Philip Morris Ukraine is an international company, which is engaged in foreign
economic activity. The company exports both finished goods (FG) and semi-finished
products to Phillip Morris International (PMI) affiliates. PMU’s commodity structure of
export in 2013-2017 is presented in figure 2.1 and table 2.8.
Fig. 2.1. PMU’s export commodity structure in 2013-2017 (Source: own representation
based on internal company data)
Table 2.8
PMU’s export commodity structure in 2013-2017, UAH mln
Source: own representation based on internal company data
Finished goods prevail, however, their share in total value of exports decreased from
75,1% in 2013 to 47,4% in 2017. Share of cut filler has also decreased from 32,8% in
2014 (when it first went for export) to 28,3% in 2017. Cut filler is exported only to
Egypt. Despite its share in PMU’s exports decreased, there has been an increase in
absolute values (from 770,56 UAH mln in 2014 to 1 743,18 UAH mln in 2017). Such
changes are directly affected by the state of tobacco market in Egypt. If demand in
Egypt grows, amount of cut filler exported by Ukraine grows as well.
Meanwhile, the share of filters for export stayed almost the same in percentage (24,9%
in 2013 and 24,3% in 2017) but increased in absolute values (245,59 UAH mln in 2013
and 1 500,00 UAH mln in 2017). In addition to that, if we analyse the dynamics, we can
see that in 2015 the volumes went down almost to 0 (0,6% - 21,43 UAH mln) and then
CAGR, %
2014 -
2013
2015 -
2014
2016 -
2015
2017 -
2016
2017 -
2013
2014 -
2013
2015 -
2014
2016 -
2015
2017 -
2016
2017 -
2013
2017 -
2013
Fininshed goods 742,59 933,03 2 270,89 2 030,95 2 921,74 190,44 1 337,86 -239,95 890,80 2 179,16 25,65 143,39 -10,57 43,86 293,46 40,84
Cut filler 0,00 770,56 1 392,90 1 226,21 1 743,18 770,56 622,34 -166,69 516,97 1 743,18 N/A 80,76 -11,97 42,16 N/A N/A
Filters 245,59 646,10 21,43 151,04 1 500,00 400,52 -624,67 129,61 1 348,96 1 254,41 163,08 -96,68 604,82 893,11 510,78 57,21
Total 988,18 2 349,70 3 685,23 3 408,20 6 164,93 1 361,52 1 335,53 -277,03 2 756,73 5 176,75 137,78 56,84 -7,52 80,89 523,87 58,04
2013 2014
Growth rate, %Deviation, +/-Name of
good/product2015 2016 2017

Section 2. Analysis of Human Resources Management of PrJSC “Philip Morris Ukraine” 34
grew again up to 1 500,00 UAH mln in 2014, which is a very significant increase. Such
tendency was caused by several factors. A decrease in 2015 happened due to political
and economic instability in 2014. After that, in 2016-2017 PMU has purchased and
installed additional filter-making machines in order to be able to satisfy all needs of
local market in terms of various filter types, which led to creation of excessive capacity.
In addition to that, one of PMI’s biggest filter-making factories in Europe was
repurposed. As a result, PMI needed to find new filter-making centers. So PMU’s filter
export volumes increased again. Filters are exported to Germany, Russia, Serbia,
Poland, Turkey, Switzerland, and Lithuania. Export volumes are relatively evenly
distributed among these countries.
The company currently exports finished goods to Albania, Armenia, Georgia, Moldova,
Japan, Hong Kong, GCC (Bahrain, Kuwait, Oman, Qatar, Saudi Arabia and the UAE).
Until 2017 PMU also exported to Kazakhstan. Exports to Hong Kong and GCC started
in 2018. PMU’s finished goods export geographic structure in presented in figure 2.2.
Fig. 2.2. PMU’s finished goods export geographic structure in 2013-2017 (Source: own
representation based on internal company data)
PMU fully supplies needs of its cluster affiliates: Armenia, Moldova and Georgia. All
markets demonstrated decrease: Georgia from 30,4% in 2013 to 19,1% in 2017;
Armenia from 25,0% in 2013 to 4,3% in 2017; Moldova from 39,3% in 2013 to 12,% in
2017. Such decrease in weight of these countries in PMU’s export geographic structure
was caused by appearance of new export market in 2014 – Japan.

Section 2. Analysis of Human Resources Management of PrJSC “Philip Morris Ukraine” 35
As of 2017, Japan is the main export market for PMU. In 2017 its share in total PMU
export comprised 61,7%. It grew from 6,5% in 2014 (exports started in the second half
of the year), with a peak of 63,9% in 2015. Such slight decrease in weight in 2017 in
comparison to 2015 mainly happened due to growth of export to other markets from
1,2% in 2015 to 2,1% in 2017.
The volumes of exports of FG to different countries are shown in table 2.9. The
volumes of export to Armenia, Georgia and Moldova depend on the trends of tobacco
industry in these countries. As we can see, export to Georgia and Moldova grew over
2013-2017. The biggest growth was demonstrated by Georgia, with compound annual
growth rate of 25,51%. Export to Moldova grew much slower with CAGR of 6,34%.
Armenian export decreased with compound annual growth rate of -9,54%.
Table 2.9
PMU’s finished goods export geographic structure in 2013-2017, UAH mln
Source: own representation based on internal company data
Exports to Japan have also increased over 2014-2017 from 60,20 UAH mln in 2014 to
1 802,78 UAH mln in 2017, with a 20,57% decline in 2016, after which exports grew by
56,40%.
Other exports grew with a compound annual growth rate of 11,81%. Main increase
happened in 2017 – 126,50%, after a decrease in 2015 due to the events of 2014. Such
growth of other exports and total exports (CAGR = 40,84%) is caused by several
factors. First of all, Ukrainian tobacco market is decreasing, which means PMU
produces less for local needs and it frees up factory capacity. Secondly, there have been
several legislation changes in Europe regarding tobacco industry, which made it
impossible to continue producing export cigarettes in EU for some markets. For
example, in Albania cigarettes are sold in packs that contain 10 cigarettes. Until
recently, EU legislation restricted selling 10 cigarette packs within EU, however, it did
not restrict producing them. Currently, it is forbidden to even produce such packs
(Brivio, 2016). As a result, PMI had to look for new affiliates to product such packs,
and Philip Morris Ukraine became one of them.
CAGR, %
2014 -
2013
2015 -
2014
2016 -
2015
2017 -
2016
2017 -
2013
2014 -
2013
2015 -
2014
2016 -
2015
2017 -
2016
2017 -
2013
2017 -
2013
Armenia 185,65 180,59 120,94 137,23 124,33 -5,06 -59,65 16,29 -12,90 -61,32 -2,73 -33,03 13,47 -9,40 -33,03 -9,54
Georgia 225,43 361,17 322,49 384,23 559,48 135,74 -38,68 61,74 175,25 334,05 60,22 -10,71 19,14 45,61 148,19 25,51
Moldova 291,73 300,98 349,37 329,34 372,99 9,25 48,39 -20,03 43,65 81,26 3,17 16,08 -5,73 13,25 27,85 6,34
Japan 0,00 60,20 1 451,22 1 152,70 1 802,78 60,20 1 391,03 -298,52 650,08 1 802,78 N/A 2 310,85 -20,57 56,40 N/A N/A
Other 39,78 30,10 26,87 27,45 62,16 -9,68 -3,22 0,57 34,72 22,38 -24,34 -10,71 2,12 126,50 56,27 11,81
Total 742,59 933,03 2 270,89 2 030,95 2 921,74 190,44 1 337,86 -239,95 890,80 2 179,16 25,65 143,39 -10,57 43,86 293,46 40,84
Name of
good/product2015 2016 20172013 2014
Deviation, +/- Growth rate, %

Section 2. Analysis of Human Resources Management of PrJSC “Philip Morris Ukraine” 36
Taking into account that Ukrainian tobacco market is prognosed to decrease further,
PMU is going to increase its exports, and can even become an “export-hub” in Eastern
Europe region.
PMU imports FG, various semi-finished products and raw materials from PMI affiliates
and external suppliers. PMU’s commodity structure of import in 2013-2017 is presented
in figure 2.3 and table 2.10.
Fig. 2.3. PMU’s import commodity structure in 2013-2017 (Source: own representation
based on internal company data)
Table 2.10
PMU’s import commodity structure in 2013-2017, UAH th
Source: own representation based on internal company data
The biggest share in product import structure of PMU belongs to Raw materials and it
increased from 70,59% in 2013 to 78,71% in 2017. Their value in absolute terms has
grown as well with CAGR of 38,72% from 0,85 UAH bio to 3,1 UAH bio. Raw
materials are mainly tobacco leaf. Since PMU produces only international brands, it
imports all of the tobacco leaf used. Therefore, such growth in raw materials exports is
caused by growing production volumes (from 27,1 bio cigarettes in 2013 to 32,96 bio
cigarettes in 2017).
The share of semi-finished products has decreased from 29,41% in 2013 to 21,29% in
2017. However, in absolute values their imports grew with compound annual growth
rate of 24,51% up to 0,8 UAH bio in 2017. Semi-finished products are mainly filters,
tobacco paper and flavored capsules. Volumes of their imports also depend on
CAGR, %
2014 - 2013 2015 - 20142016 -
2015
2017 -
20162017 - 2013
2014 -
2013
2015 -
2014
2016 -
2015
2017 -
2016
2017 -
2013
2017 -
2013
Finished goods 4,2 5,8 6,30 4,36 0,48 1,60 0,50 -1,94 -3,88 -3,72 38,10 8,57 -30,77 -88,89 -88,47 -41,72
Semi-finished products 355 041,45 501 886,70 796 554,96 820 451,61 853 269,67 146 845,25 294 668,26 23 896,65 32 818,06 498 228,22 41,36 58,71 3,00 4,00 140,33 24,51
Raw materials 852 099,48 1 326 414,85 2 655 183,20 2 955 218,90 3 154 909,92 474 315,37 1 328 768,35 300 035,70 199 691,02 2 302 810,44 55,66 100,18 11,30 6,76 270,25 38,72
Total 1 207 145,13 1 828 307,35 3 451 744,46 3 775 674,87 4 008 180,08 621 162,22 1 623 437,11 323 930,41 232 505,21 2 801 034,95 51,46 88,79 9,38 6,16 232,04 34,99
Name of
good/product2015 2016 20172013 2014
Deviation, +/- Growth rate, %
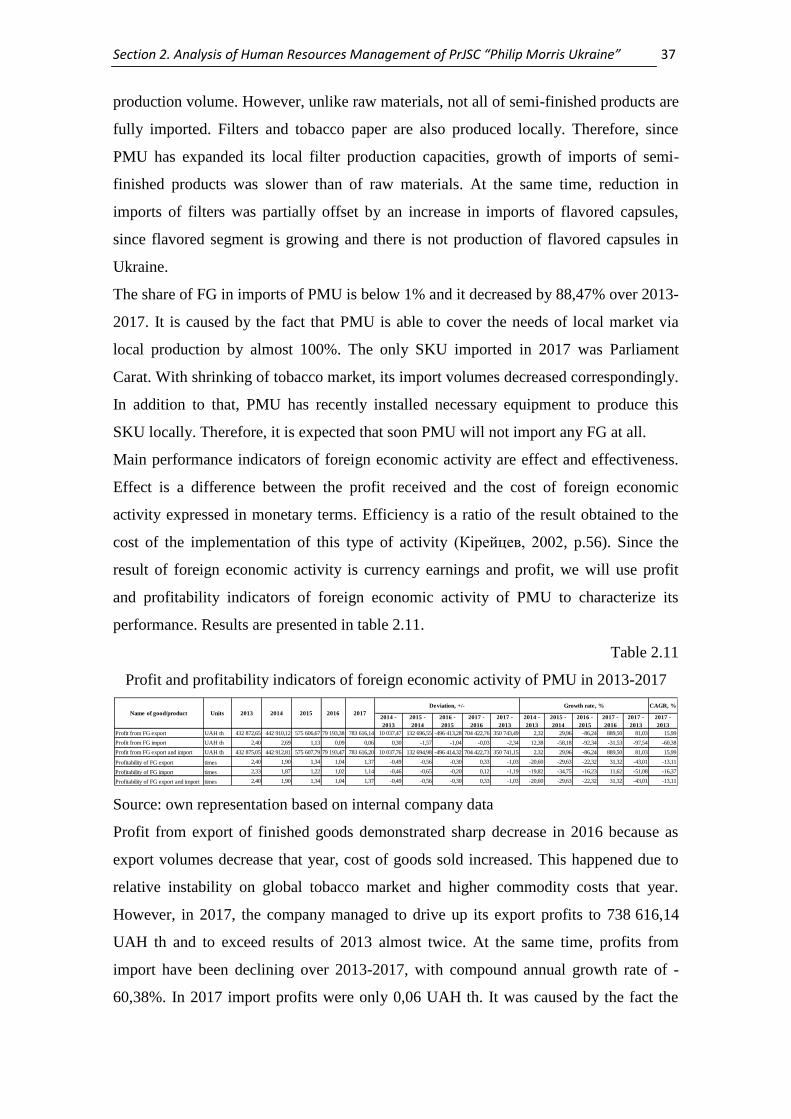
Section 2. Analysis of Human Resources Management of PrJSC “Philip Morris Ukraine” 37
production volume. However, unlike raw materials, not all of semi-finished products are
fully imported. Filters and tobacco paper are also produced locally. Therefore, since
PMU has expanded its local filter production capacities, growth of imports of semi-
finished products was slower than of raw materials. At the same time, reduction in
imports of filters was partially offset by an increase in imports of flavored capsules,
since flavored segment is growing and there is not production of flavored capsules in
Ukraine.
The share of FG in imports of PMU is below 1% and it decreased by 88,47% over 2013-
2017. It is caused by the fact that PMU is able to cover the needs of local market via
local production by almost 100%. The only SKU imported in 2017 was Parliament
Carat. With shrinking of tobacco market, its import volumes decreased correspondingly.
In addition to that, PMU has recently installed necessary equipment to produce this
SKU locally. Therefore, it is expected that soon PMU will not import any FG at all.
Main performance indicators of foreign economic activity are effect and effectiveness.
Effect is a difference between the profit received and the cost of foreign economic
activity expressed in monetary terms. Efficiency is a ratio of the result obtained to the
cost of the implementation of this type of activity (Кірейцев, 2002, p.56). Since the
result of foreign economic activity is currency earnings and profit, we will use profit
and profitability indicators of foreign economic activity of PMU to characterize its
performance. Results are presented in table 2.11.
Table 2.11
Profit and profitability indicators of foreign economic activity of PMU in 2013-2017
Source: own representation based on internal company data
Profit from export of finished goods demonstrated sharp decrease in 2016 because as
export volumes decrease that year, cost of goods sold increased. This happened due to
relative instability on global tobacco market and higher commodity costs that year.
However, in 2017, the company managed to drive up its export profits to 738 616,14
UAH th and to exceed results of 2013 almost twice. At the same time, profits from
import have been declining over 2013-2017, with compound annual growth rate of -
60,38%. In 2017 import profits were only 0,06 UAH th. It was caused by the fact the
CAGR, %
2014 -
2013
2015 -
2014
2016 -
2015
2017 -
2016
2017 -
2013
2014 -
2013
2015 -
2014
2016 -
2015
2017 -
2016
2017 -
2013
2017 -
2013
Profit from FG export UAH th 432 872,65 442 910,12 575 606,67 79 193,38 783 616,14 10 037,47 132 696,55 -496 413,28 704 422,76 350 743,49 2,32 29,96 -86,24 889,50 81,03 15,99
Profit from FG import UAH th 2,40 2,69 1,13 0,09 0,06 0,30 -1,57 -1,04 -0,03 -2,34 12,38 -58,18 -92,34 -31,53 -97,54 -60,38
Profit from FG export and import UAH th 432 875,05 442 912,81 575 607,79 79 193,47 783 616,20 10 037,76 132 694,98 -496 414,32 704 422,73 350 741,15 2,32 29,96 -86,24 889,50 81,03 15,99
Profitability of FG export times 2,40 1,90 1,34 1,04 1,37 -0,49 -0,56 -0,30 0,33 -1,03 -20,60 -29,63 -22,32 31,32 -43,01 -13,11
Profitability of FG import times 2,33 1,87 1,22 1,02 1,14 -0,46 -0,65 -0,20 0,12 -1,19 -19,82 -34,75 -16,23 11,62 -51,08 -16,37
Profitability of FG export and import times 2,40 1,90 1,34 1,04 1,37 -0,49 -0,56 -0,30 0,33 -1,03 -20,60 -29,63 -22,32 31,32 -43,01 -13,11
Deviation, +/- Growth rate, %
Name of good/product 2015 2016 2017Units 2013 2014

Section 2. Analysis of Human Resources Management of PrJSC “Philip Morris Ukraine” 38
PMU decreased its import volumes. Therefore, the main contributor to the profits from
foreign economic activity with finished goods was export.
Profitability indicator shows how much profit was obtained by an enterprise for 1 UAH
of incurred expenses (Небава, 2011, p.99). In case of PMU, we can see that in 2013 the
company made 2,40 UAH per each 1 UAH spent on FG exports, and in 2017 this value
decreased to 1,37 UAH. Therefore, the company is demonstrating overall decrease in
profitability of its export operations. Same tendency can be observed with import. Its
profitability decreased over 2013-2017 from 2,33 UAH per 1 UAH spent to 1,14 UAH.
It means that the company makes proper decision in decreasing its import volumes,
since they become less profitable. At the same time, it needs to analyse how it can
increase the profitability of its export, although it is still satisfactory.
Abovementioned indicators show that effectiveness of foreign economic activity of
PMU is quite good and it has tendency to improve. Nevertheless, it is necessary to work
on improvement with higher growth rate by increasing sales and decreasing costs. One
of the ways to achieve that is to replace imported semi-finished products with locally
produced ones. However, this should be done very carefully to keep the quality.
2.2. Analysis of human resources planning system of PrJSC “Philip
Morris Ukraine”
Organizational structure of the company is quite branched out, taking into account that
the Ukrainian affiliate also manages PMI affiliates in Armenia, Georgia and Moldova. It
means that managers of different level of one department can be located in different
countries and have subordinates in several affiliates at the same time. No doubt that
such structure makes both managers’ work and its assessment more complicated.
However, a general structure is similar in all departments. Let’s have a look at the
simplified typical hierarchical structure of Philip Morris on the examples of IT
department.
Hierarchical structure of IT department has 4 levels (Appendix C):
1) Analyst
2) Team leader
3) Function manager
4) Department director
In total, in 2017 the Ukrainian affiliate employed 807 employees, 160 of which were
managers of different level:

Section 2. Analysis of Human Resources Management of PrJSC “Philip Morris Ukraine” 39
18 team leaders
70 supervisors
65 managers
7 directors
In general, we can make a conclusion that starting from the second level of the
hierarchy, employees become managers and gradually move from managements of
other people to management of the whole function. Additional levels in the structure are
created due to managers that “manage managers”.
Human resources planning, as one of the important functions of human resources
management, includes determination of staffing needs in terms of quantity, quality, time
and physical location, to achieve goals of an organization. Human resources planning is
based on the organization's development strategy, its personnel policies. Function of
human resources planning is becoming increasingly important in ensuring organization's
strategy, since accurate accounting of future needs makes it possible to clearly navigate
through the development of training plans and work with personnel reserve.
Human resources planning includes the following stages:
1. identification of staffing needs;
2. personnel search;
3. planning of engagement (participation) of personnel;
4. planning of personnel development;
5. planning of personnel dismissal (Петюх, 2017, p.73).
The initial stage of staff planning is the identification of quantitative and qualitative
needs of personnel, which is affected by the economic condition of an enterprise. It is
necessary to take into account labor market conditions, in order to ensure effective
satisfaction of needs of an organization in skilled workers, which is a prerequisite for
the realization of its goals. It is advisable to conduct market research in order to
determine current and future needs of personnel, taking into account its quantity,
quality, and development of production to prepare new jobs and requirements for
employees; and to attract personnel whose personal qualities correspond to the
requirements set by the organization (Беляцкий, 2006, p.41).
Planning of staffing needs in the company is done on three levels: strategic (3 years
perspective), tactical (review of strategic plans per year), and operational (every month).
While planning, HR department takes into accounts plans of the company for
expansion, introduction of new functions, products, and prospective of current

Section 2. Analysis of Human Resources Management of PrJSC “Philip Morris Ukraine” 40
employees. The qualitative need for personnel is determined by categories, professions,
specialization, level of qualification, and individual requirements, established for every
position (Балабанова & Сардак, 2016, p.47). New job openings usually happen due to
two reasons: reorganizations and staff turnover. Reorganizations happen in such
dynamic big functions and Sales and Marketing. In smaller functions vacancies appear
because of staff turnover. The reason for that is the nature of the business of the
company, since it is very specific and has a limited variety of activities to be performed.
A detailed analysis of the staff structure can reveal a tendency in change of the number
of employees from year to year. For this purpose, it is advisable to carry out a
qualitative and quantitative assessment of the staff of PMU.
Level of the qualitative state of the personnel determines the level of efficiency of
activity of the entire company because their personal qualities affect not only the quality
of service of the customers, but also the quality of management decisions and the results
of their implementation. Labor potential of the company is characterized by a system of
indicators: qualification composition of personnel, their turnover and stability, rate of
personnel variability. Let’s consider such general and specific indicators of the
quantitative composition of the personnel of Philip Morris Ukraine.
First, we will analyze the changes that took place in the number of employees during
2013-2017. The analysis is presented in Table 2.12.
Table 2.12
Analysis of dynamics and structure of personnel of PMU in 2013-2017
Source: own representation based on internal company data
From the table we can see that there is a decrease in the number of personnel of all
types: management, main and auxiliary employees. Such changes are connected to the
restructuring of the company in order to optimize its personnel and costs structure. This
way PMU is trying to get rid of redundant positions, due to redundant processes and
tasks.
Q-ty,
people
Specific
weight, %
Q-ty,
people
Specific
weight, %
Q-ty,
people
Specific
weight, %
Q-ty,
people
Specific
weight, %
Q-ty,
people
Specific
weight, %
2014-
2013
2015-
2014
2016-
2015
2017-
2016
2017-
2013
2014 -
2013
2015 -
2014
2016 -
2015
2017 -
2016
2017 -
2013
2017 -
2013
1. Management 259 17,87 256 18,56 195 17,94 160 19,30 160 19,83 -3 -61 -35 0 -99 -1,16 -23,83 -17,95 0,00 -38,22 -11,34
2. Main
personnel, total981 67,70 925 67,08 742 68,26 558 67,31 538 66,67 -56 -183 -184 -20 -443 -5,71 -19,78 -24,80 -3,58 -45,16 -13,94
incl. production
dept.479 33,06 465 33,72 368 33,85 289 34,86 280 34,70 -14 -97 -79 -9 -199 -2,92 -20,86 -21,47 -3,11 -41,54 -12,56
incl. distribution
dept.269 18,56 250 18,13 210 19,32 137 16,53 130 16,11 -19 -40 -73 -7 -139 -7,06 -16,00 -34,76 -5,11 -51,67 -16,62
incl. procurement
dept74 5,11 65 4,71 50 4,60 41 4,95 39 4,83 -9 -15 -9 -2 -35 -12,16 -23,08 -18,00 -4,88 -47,30 -14,80
incl. finance
dept.68 4,69 64 4,64 49 4,51 35 4,22 34 4,21 -4 -15 -14 -1 -34 -5,88 -23,44 -28,57 -2,86 -50,00 -15,91
incl. HR dept. 44 3,04 39 2,83 30 2,76 26 3,14 26 3,22 -5 -9 -4 0 -18 -11,36 -23,08 -13,33 0,00 -40,91 -12,32
incl. IT dept. 36 2,48 32 2,32 25 2,30 20 2,41 20 2,48 -4 -7 -5 0 -16 -11,11 -21,88 -20,00 0,00 -44,44 -13,67
incl. legal dept. 11 0,76 10 0,73 10 0,92 10 1,21 9 1,12 -1 0 0 -1 -2 -9,09 0,00 0,00 -10,00 -18,18 -4,89
3. Auxiliary
personnel209 14,42 198 14,36 150 13,80 111 13,39 109 13,51 -11 -48 -39 -2 -100 -5,26 -24,24 -26,00 -1,80 -47,85 -15,02
Total 1 449 100,00 1 379 100,00 1 087 100,00 829 100,00 807 100,00 -70 -292 -258 -22 -642 -4,83 -21,17 -23,74 -2,65 -44,31 -13,61
Deviation, +/- CAGR, %Growth rate, %
Indicator
2015 2016 20172013 2014

Section 2. Analysis of Human Resources Management of PrJSC “Philip Morris Ukraine” 41
The highest specific weight belongs to the employees of production department (34,7%
in 2017). It is logical, since these people work on factory and are responsible for
production of goods for sale. A significant role belongs also to employees of
distribution departments (16,11% in 2017) and management personnel (19,83% in
2017).
The educational, gender and qualification distribution of the company’s employees is
given in Table 2.13 (as of 2017).
Educational level of company’s employees is rather high: 76% of employees studied in
educational institutions of 3rd-4th levels of accreditation. Employees with general level
of education are mostly cleaners and security guards.
Gender distribution in the company is uneven. Men comprise almost 63% of the whole
personnel. The target of the company is to increase the number of women in the
company up to 40% from the total personnel.
Table 2.13
Educational, gender and qualification distribution of employees of PMU in 2017
Source: own representation based on internal company data
The age structure of the personnel is characterized by high specific weight of young
personnel (up to 30 years old) – 43,99%. More than 80% of employees are younger than
40 years old. It means that the company is focusing on the acquisition of young talents,
as well as tried to keep its overall company personnel age structure young.
Men Women Total Men Women
Average number of
employees, total807 506 301 100 62,70 37,30
3rd-4th levels of
accreditation612 399 213 75,84 49,44 26,39
1st-2nd levels of
accreditation182 102 80 22,55 12,64 9,91
General education 13 5 8 1,61 0,62 0,99
20-25 years old 145 93 52 17,97 11,52 6,44
26-30 years old 210 132 78 26,02 16,36 9,67
31-35 years old 186 115 71 23,05 14,25 8,80
36-40 years old 129 86 43 15,99 10,66 5,33
41-45 years old 73 44 29 9,05 5,45 3,59
46-50 years old 32 18 14 3,97 2,23 1,73
51-55 years old 24 15 9 2,97 1,86 1,12
56-60 years old 8 3 5 0,99 0,37 0,62
Number of employees who graduated from higher education institutions
Number of employees aged:
Indicator Total, peopleFrom the total number, people From the total number, %

Section 2. Analysis of Human Resources Management of PrJSC “Philip Morris Ukraine” 42
In terms of recruitment process, there are a defined number of steps followed in the
company. When there is a job opening, first of all, critical positions are defined. By
critical positions we mean those, if they stay vacant, it will harm the company. First,
there is an internal consideration for employees. Is there anyone, who can be a
successor? Successors are evaluated based on three criteria: willingness, readiness and
availability. In case there is no successor or the position in generic, an internal
announcement is made and simultaneously job advertisement is made outside the
company. For these purposes the company uses various job websites, as well as uses
help of recruitment agencies. There is also a referral program, where current employees
can refer somebody for the vacancy. If that person gets the job, that employee gets
remuneration. This way PMU motivates its employees to participate in the recruitment
process.
The application process is also defined and is different for entry level positions and
senior management positions. For entry level positions a person goes through phone
interview, tests (SHL, target detect test, etc.), scanner, situational analysis that measures
4-5 competencies), CBI (competency based interview, which is usually a structured
panel interview).
For Senior Management positions the applications pass: full fledge interview, business
case, additional interviews, interview with managing director.
Philip Morris Ukraine pays a lot of attention to employees’ training and development.
The company uses three types of training. The first one is auditorium (in class)
trainings, which are done by in-house trainers (representatives of different departments).
There are two dimensions of those trainings: manage self, which focuses of what the
company is about; manage others, which tells what kind of managers are expected to be.
The second type is online training. PMU has a huge platform iLearn with lots of
information. The third type is external trainings, which are focused mainly on hard
skills. However, the company believes that only 10% of all knowledge comes through
classroom training. The largest amount of development (70%) happens on-the job. The
rest 20% come from working with others on cross-functional projects (Голубков,
2016).
For talent management the company has a special process - Managing & Appraising
Performance (MAP). It is a global, annual process designed to support employees and
their managers in assessing individual contributions to the organization and
development of their individual abilities. This process oversees planning of two types of

Section 2. Analysis of Human Resources Management of PrJSC “Philip Morris Ukraine” 43
objectives: work objectives and development objectives. For each objective a certain
benchmark is set (for example, percentage of solved user requests, amount spent on a
new trade program, percentage of new employees, etc.) Planning is done by an
employee together with the direct manager at the beginning of the year. At the end of
the year, the manager evaluates the subordinate by comparing the objectives and their
benchmarks with the actual results achieved. Managers also take into account the
circumstances in which the employee had to work (whether there was a headwind or a
tailwind) and compare employee’s performance relative to others. The final score is
given on a scale from 1 to 5. It affects the promotion of an employee, salary increase
and bonuses.
Work objectives include 4 categories: business, strategic, organizational, and
effectiveness. Organizational objectives category is related to organizational and social
effectiveness of the manager and is used to assess areas of talent acquisition and talent
development.
Development objectives are designed to improve personal and professional skills. The
list of possible objectives is very diverse, from knowledge of foreign languages to time-
management. There is also such notion as 7 key behaviors, which are considered to be
the most critical characteristics for an employee to become successful in the company.
They include leading, collaboration, communication, learning, agility, entrepreneurship
and impact. Each employee has to choose at least one of these behaviors for
development. At the end of the year, the results of employee’s development are asses
based on the factual activities he/she was involved in.
Another approach used in the company for talent training and development is
mentoring. Each newcomer has a “buddy”, who helps him/her to integrate into the
company as smoothly as it is possible. Besides newcomers, there are also formalized
and non-formalized mentoring programs for regular employees. It is done for
knowledge and experience sharing and is useful both for the mentor and for the mentee.
To understand what the employees think and feel about working in the company, Philip
Morris has a tool, called Employee Opinion Survey (EOS). It is an anonymous survey,
conducted among all employees every year in order to receive their feedback related to
various aspects of working in the company. EOS is focused on three main areas:
dedication, strategic alignment and agility.
The survey has 63 standardized questions in 17 dimensions (e.g. authority,
communication, safety, team work, quality, development, etc.) Each question is

Section 2. Analysis of Human Resources Management of PrJSC “Philip Morris Ukraine” 44
assessed on the 5-level Likert scale: Strongly disagree, Disagree, Neither agree nor
disagree, Agree, Strongly agree.
An index is formed to assess each the areas and dimensions key elements. Dedication
Index consists of answers to such questions as:
- I would recommend the company as a great place to work;
- I am proud to work for the company;
- If I have my own way, I will be working for the company 12 months from now.
Strategic Alignment Index consists of answers to such questions as:
- I have confidence in the company’s business strategy;
- I clearly understand how my job supports the company’s objectives.
Agility Index consists of answers to such questions as:
- At the company, our process are developed to be flexible;
- The people in my team adapt easily to new ways of doing things.
Besides indices, there are also various dimensions assessed. An interesting one is
Managerial Effectiveness, which consists of answers to 4 questions:
1) My direct supervisor is a role model for company values;
2) My direct supervisor encourages feedback on his/her leadership effectiveness;
3) My direct supervisor communicates openly and honestly;
4) My direct supervisor effectively communicates our departments’ objectives.
Calculation of the index is conducted in the following way:
1) Percentage of employees, who answered “Strongly agree” or “Agree” from the
total number of employees, who took part in the survey (for each question).
2) Average score on the five-point scale based on the percentage obtained (for each
question).
3) Average number of employees, who answered “Strongly agree” or “Agree”,
based on the percentage of each particular question, which is part of the index.
4) Index as an average score based on the average scores of each particular
question, which is part of the index.
Such calculations are made on different levels of consolidation, from individual teams
(15 people minimum) to aggregated result of all affiliates of the company. After that,
the obtained results are analyzed for each question and an overall index based on the
comparison:
- with the results of previous years (dynamics);
- with results of other teams/departments/functions/countries.

Section 2. Analysis of Human Resources Management of PrJSC “Philip Morris Ukraine” 45
Managerial Effectiveness dimension is the one directly related to human resources
management, therefore, let’s have a look at the results for this dimension on the
example of IT Department of the company in 2013-2017 (Table 2.14).
Table 2.14
Managerial Effectiveness Index at PMI, PMU and PMP in 2013-2017
Source: own representation based on internal company data
We can see that Managerial Effectiveness Index demonstrated growth on PMI level, as
well as separately for PM Ukraine and PM Poland over 2013-2017. However, an
increase for Ukraine was the lowest (2,46%) in comparison to Poland (4,41%) and PMI
(6,10%).
Another important dimension is Employee Development and Engagement Index. It
demonstrates how satisfied the employees are working for the company, in terms of
development and their role in the company. It consists of answers to 6 questions:
1) If I continue to perform well, I will get ahead in this company
2) I believe I am paid fairly
3) I receive useful coaching and feedback that helps me improve my performance
4) I think there is a clear link between job performance and pay at my company
5) Management provides recognition for performance when I perform above and
beyond my job responsibilities
6) I understand how my performance is measured an evaluated
Results of Employee Development and Engagement Index in 2013-2017 are shown in
table 2.15. We can see that the average score decreased over the five years by 9,5%
from 4,02 to 3,64. It means that level of employees’ satisfaction with their development
and role in the company decreased. However, if we analyse the years in between,
average score in 2017 is the highest one after 2013, which can suggest about a positive
tendency.
Average score
CAGR, %
Average
score
Percentage
«Agree»
Average
score
Percentage
«Agree»
Average
score
Percentage
«Agree»
Average
score
Percentage
«Agree»
Average
score
Percentage
«Agree»
2014 -
2013
2015 -
2014
2016 -
2015
2017 -
2016
2017 -
20132017 - 2013
ІТ Department - PMI 3,44 68% 3,47 69% 3,45 69% 3,51 70% 3,65 73% 0,78 -0,48 1,64 4,09 6,10 1,49
Corporate function - PMI 3,37 67% 3,40 68% 3,40 68% 3,50 70% 3,60 72% 0,89 0,00 2,94 2,86 6,82 1,66
Commercial function - PMI 3,45 69% 3,50 71% 3,45 69% 3,40 68% 3,70 74% 1,45 -1,43 -1,45 8,82 7,25 1,76
Customer service function - PMI 3,50 69% 3,50 69% 3,60 72% 3,62 73% 3,75 75% 0,00 2,86 0,56 3,59 7,14 1,74
ІТ Department – PM Ukraine 3,66 73% 3,65 73% 3,70 74% 3,70 74% 3,75 75% -0,27 1,37 0,00 1,35 2,46 0,61
Corporate function - PMU 3,60 72% 3,60 72% 3,75 75% 3,80 76% 3,90 78% 0,00 4,17 1,33 2,63 8,33 2,02
Commercial function - PMU 3,80 77% 3,75 75% 3,75 75% 3,65 72% 3,55 71% -1,32 0,00 -2,67 -2,74 -6,58 -1,69
Customer service function - PMU 3,58 70% 3,60 71% 3,65 73% 3,65 73% 3,80 76% 0,56 1,39 0,00 4,11 6,15 1,50
ІТ Department – PM Poland 3,78 76% 3,87 77% 3,90 78% 3,93 79% 3,95 79% 2,20 0,86 0,85 0,42 4,41 1,08
Corporate function - PMP 3,95 79% 3,90 78% 3,95 79% 3,90 78% 4,00 80% -1,27 1,28 -1,27 2,56 1,27 0,31
Commercial function - PMP 3,70 74% 3,85 77% 4,00 80% 4,00 80% 4,05 81% 4,05 3,90 0,00 1,25 9,46 2,29
Customer service function - PMP 3,70 75% 3,85 77% 3,85 77% 3,90 78% 3,90 78% 4,05 0,00 1,30 0,00 5,41 1,32
Average score
Growth rate, %2013 2014 2015 2016 2017
Teams

Section 2. Analysis of Human Resources Management of PrJSC “Philip Morris Ukraine” 46
Table 2.15
Employee Development and Engagement Index at PMU in 2013-2017
Source: own representation based on internal company data
Therefore, EOS tool is used to have an up-to-date picture of what and how the
employees feel in the company and what areas of improvement there are.
Besides training and development, to motivate and stimulate employees to stay in the
company and improve their performance, there is, of course, a compensation and
benefits system. It represents the economic method of human resources management,
which is mainly based on the material incentives for labor: salary.
In order to check if economic methods of HRM play a key role for the employees of
PMU, in 2017 the company has conducted a survey, focused on personal job motivation
of employees. Each respondent had to choose one option, which is the most important
for him/her, from the given list. The results are presented on figure 2.4.
Fig. 2.4. Results of job motivation survey of employees of PMU in 2017 (Source: own
representation based on internal company data)
As we can see, material part plays an important role, however, not the key one. Material
motivation factors in total comprise 32,6%, while non-material – 67,4%. For almost a
quarter of all employees the most important motivation for work is getting satisfaction
from the job. At the same time, around 20% of employees are motivated by ensuring a
financially stable future. Only 5,2% want to make for living. Therefore, we can say that
there is a healthy correlation between material and non-material motivational factors in
the company. The fact that non-material motivation is stronger means that company’s
employees are very loyal.
CAGR, %
Average
score
Percentage
«Agree»
Average
score
Percentage
«Agree»
Average
score
Percentage
«Agree»
Average
score
Percentage
«Agree»
Average
score
Percentage
«Agree»
2014 -
2013
2015 -
2014
2016 -
2015
2017 -
2016
2017 -
2013
2017 -
2013
Number of answers -7,67 -22,61 -27,59 -4,48 -50,58 -16,16
Employee Development and
Engagement Index4,02 84% 3,30 69% 3,21 67% 2,97 62% 3,64 76% -17,86 -2,90 -7,46 22,58 -9,52 -2,47
2016 2017
Indicator
Growth rate, %
1121 1035 801 580 554
2013 2014 2015

Section 2. Analysis of Human Resources Management of PrJSC “Philip Morris Ukraine” 47
Let’s analyze the compensation and benefits system of PMU.
When establishing compensation and benefits programs, PMU reviews the practices of
selected companies in the relevant market. These are typically high performing
companies which compete for company’s employees or business. PMU recognizes and
rewards individuals for their individual performance and contribution to the business
and uses a common job evaluation system throughout the company. Therefore, Philip
Morris Ukraine uses flexible payment method.
Flexible remuneration system is a system in which a certain part of earnings is
dependent on personal merits and an overall efficiency of an enterprise. When
determining an amount of pay, a company takes into account not only experience,
qualifications, and professional skills, but also an importance of an employee, his/her
ability to achieve certain goals for the development of an organization.
In flexible systems, tariff serves as a basis for an employee's earnings, which is
supplemented by various bonuses and fringe benefits (Буряк, Карпінський,
Григор’єва, 2004, p.196). Therefore, the salary of PMU employees consists of the fixed
part (based on their personal hourly rate) and the variable part – bonuses.
The fixed part of the salary depends on the “grade” of an employee. Grades are levels
used to group jobs of similar value according to PMI’s Job Evaluation Methodology.
The company uses 28 levels, starting from Grade 1. For each grade there is a salary
range, within which an employee with this grade can have his/her salary.
The variable bonus part of the salary is based on the PMI Recognition Awards. These
awards are presented to employees based on their outstanding performance. There are
different levels of awards and each award corresponds to some financial remuneration.
Besides the compensation, PMU also offers various benefits to its employees. The core
benefits include medical and life insurance for the employee and his/her family. PMU is
the only company in Ukraine that offers unique critical advantage medical insurance
program, insuring from serous life-threatening diseases. The additional benefits include
sport allowances, meal allowances, vacation allowances etc.
Therefore, we can conclude that the company is taking care of its employees and
ensures it provides diverse types of motivation, both material and non-material, to
satisfy different profiles of employees.

Section 2. Analysis of Human Resources Management of PrJSC “Philip Morris Ukraine” 48
2.3. Assessment of human resources management effectiveness of
PrJSC “Philip Morris Ukraine”
Analysis of the quantitative and qualitative composition of the staff has already been
performed by me earlier, therefore, we will now focus on indicators of the efficiency of
the use of labor resources.
The analysis of effectiveness of HRM system of Philip Morris will begin with an
analysis of the main indicators of the work of the personnel.
Table 2.16 contains analysis of the number of employees and the wage fund for 2013-
2017.
Table 2.16
Analysis of dynamics of the number of employees and wage fund of PMU in 2013-2017
Source: own representation based on balances and statements of financial results of
PMU for 2013-2017 (Appendix A)
As we can see from the table, changes in the average number of employees and the
wage fund were disproportionate. Due to decrease by 70 employees in 2014 the wage
fund also decreased, which happened both in the base salary fund and in extra salary
fund. However, with further decrease in the number of employees in 2015, we can
observe an increase in the wage fund by 6,03%. Then again with decrease of number of
employees in 2016 the wage fund decreased as well, and with continuing decrease of
the number of employees in 2017 the wage fund grew by 11,11%. In both cases (2015
and 2017) the increase happened due to growth in base salary and extra salary. In 2015
the base salary fund grew more than extra salary fund (6,57% vs. 4,05%). In 2017, extra
salary fund grew slightly more (11,24%) than the base salary fund (10,83%). It means
that the company decided to focus on its existing employees and to make an increase in
their salary, probably through re-distribution of the salaries of the dismissed employees.
An overall picture for the 5 years shows that together with headcount decrease there was
a decrease in the wage fund, which happened mostly through decrease in extra salary
with CARG of -7,44% and also some decrease in base salary (CAGR = -4,91%).
CAGR, %
2014-
2013
2015-
2014
2016-
2015
2017-
2016
2017-
2013
2014 -
2013
2015 -
2014
2016 -
2015
2017 -
2016
2017 -
2013
2017 -
2013
Average
number of
employees
people 1 449 1 379 1 087 829 807 -70 -292 -258 -22 -642 -4,83 -21,17 -23,74 -2,65 -44,31 -13,61
Wage fund UAH th 321 986 301 817 320 013 231 564 257 298 -20 169 18 196 -88 449 25 734 -64 688 -6,26 6,03 -27,64 11,11 -20,09 -5,45
incl. base
salary fundUAH th 251 149 237 228 252 810 185 251 205 312 -13 921 15 582 -67 559 20 061 -45 837 -5,54 6,57 -26,72 10,83 -18,25 -4,91
incl. extra
salary fundUAH th 70 837 64 589 67 203 46 313 51 986 -6 248 2 614 -20 890 5 673 -18 851 -8,82 4,05 -31,08 12,25 -26,61 -7,44
2016 2017Indicator Units 2013 2014 2015
Deviation, +/- Growth rate, %

Section 2. Analysis of Human Resources Management of PrJSC “Philip Morris Ukraine” 49
It is easy to see that base salary payment prevails in the structure of the wage fund of
Philip Morris Ukraine (around 80% on average), while the share of extra incentives is
low (around 20% on average). Consequently, the management of the company pays too
little attention to bonus payments, other incentive and compensation payments, which
are not part of the main earnings of the company’s employees.
In order to determine the effectiveness of human resources management mechanism,
among other things, we can use indicators of stability of personnel tenure: hiring
turnover rate, dismissal turnover rate, personnel turnover rate, coefficient of total
turnover (Гетьман & Шаповал, 2010, p.136).
To calculate these rates we need to know how many people were hired and dismissed in
2013-2017. Calculation results are summarized in table 2.17.
Table 2.17
Number of hired and dismissed employees of PMU in 2013-2017, people
Source: own representation based on internal company data
One of the basic methods of assessment is the analysis of qualifications of the
personnel, their level of education, as well as age structure. These indicators can be used
to observe the general tendency of the personnel system development and to analyze the
qualitative characteristics of the personnel.
In our case, in 2013-2017 personnel turnover rates were:
𝐶𝑇(2013) = 8+1
1 449 x 100% = 0,62% (2.1)
𝐶𝑇(2014) = 15+4
1 379 x 100% = 1,38% (2.2)
𝐶𝑇(2015) = 14+5
1 087 x 100% = 1,75% (2.3)
𝐶𝑇(2016) = 10+2
829 x 100% = 1,45% (2.4)
𝐶𝑇(2017) = 9+1
807 x 100% = 1,24% (2.5)
CAGR,
%
2014-
2013
2015-
2014
2016-
2015
2017-
2016
2017-
2013
2014 -
2013
2015 -
2014
2016 -
2015
2017 -
2016
2017 -
2013
2017 -
2013
Number of hired
employees50 15 17 10 6 -35 2 -7 -4 -44 -70,00 13,33 -41,18 -40,00 -88,00 -41,14
Number of dismissed
employees24 85 309 268 28 61 224 -41 -240 4 254,17 263,53 -13,27 -89,55 16,67 3,93
incl. unsolicited dismissal 8 15 14 10 9 7 -1 -4 -1 1 87,50 -6,67 -28,57 -10,00 12,50 2,99
incl. dismissal for violation
of labor dissipline
1 4 5 2 1 3 1 -3 -1 0 300,00 25,00 -60,00 -50,00 0,00 0,00
incl. other dismissal
(reduction, restructuring
etc.)
15 51 290 256 18 36 239 -34 -238 3 240,00 468,63 -11,72 -92,97 20,00 4,66
2013 2014 2015 2016 2017
Growth rate, %Deviation, +/-
Indicator
Section 2. Analysis of Human Resources Management of PrJSC “Philip Morris Ukraine” 50
According to formulas 2.1 – 2.5 the turnover rate was below 2%, which is the natural
renewal of personnel.
The next indicator analyzed by us was hiring turnover rate:
𝐶𝐻𝑇(2013) = 50
1 449 x 100% = 3,45% (2.6)
𝐶𝐻𝑇(2014) = 15
1 379 x 100% = 1,09% (2.7)
𝐶𝐻𝑇(2015) = 17
1 087 x 100% = 1,56% (2.8)
𝐶𝐻𝑇(2016) = 10
829 x 100% = 1,21% (2.9)
𝐶𝐻𝑇(2017) = 6
807 x 100% = 0,74% (2.10)
The dismissal turnover rate was:
𝐶𝐷𝑇(2013) = 24
1 449 x 100% = 1,65% (2.11)
𝐶𝐷𝑇(2014) = 85
1 379 x 100% = 6,16% (2.12)
𝐶𝐷𝑇(2015) = 309
1 087 x 100% = 28,43% (2.13)
𝐶𝐷𝑇(2016) = 268
829 x 100% = 32,33% (2.14)
𝐶𝐷𝑇(2017) = 28
807 x 100% = 3,47% (2.15)
As we can see in formulas 2.6 – 2.15 the dismissal turnover rate is much higher than the
hiring turnover rate. In 2016 the dismissal rate was 32,33%, which is quite high. It
means that more than 1/3 of the personnel left the company. Such tendency is not
positive, however, taking into account that is was connected to restructuring in the
company, therefore, it was planned, there is no need to worry much about it. Moreover,
in 2017 the indicator became rather low (3,47%), which supports the conclusion that the
state of personnel in the company is healthy, and abnormal changes in 2015 and 2016
were a planned step. At the same time, the low hiring ratio shows that currently the
company is not in need of new personnel and does not plan to expand it.
The coefficient of total turnover was:
Section 2. Analysis of Human Resources Management of PrJSC “Philip Morris Ukraine” 51
𝐶𝑇𝑇(2013) = 3,45% + 1,65% = 5,10% (2.16)
𝐶𝑇𝑇(2014) = 1,09% + 6,16% = 7,25% (2.17)
𝐶𝑇𝑇(2015) = 1,56% + 28,43% = 29,99% (2.18)
𝐶𝑇𝑇(2016) = 1,21% + 32,33% = 33,54% (2.19)
𝐶𝑇𝑇(2017) = 0,74% + 3,47% = 4,21% (2.20)
According to formulas 2.16 – 2.20, the coefficients in 2015 and 2016 demonstrate a
rather high level of total turnover of personnel, due to high quantity of dismissed
employees those years. However, before 2015 it was much lower and in 2017 it went
down again to 4,21%, which is an acceptable level.
To assess the economic effectiveness of personnel work, we have used the ratio of
profitability of the use of labor resources (𝑃𝐿), which is calculated as the ratio of profit
to the average number of employees of the enterprise (Лігоненко & Височин, 2010).
Data about net income and average number of employees was taken from financial
statements for 2013-2017 (see Appendix A).
𝑃𝐿(2013) = 1 301 500 𝑈𝐴𝐻 𝑡ℎ
1 449 𝑒𝑚𝑝𝑙𝑜𝑦𝑒𝑒𝑠 = 898,21 UAH th per employee (2.21)
𝑃𝐿(2014) = 746 304 𝑈𝐴𝐻 𝑡ℎ
1 379 𝑒𝑚𝑝𝑙𝑜𝑦𝑒𝑒𝑠 = 541,19 UAH th per employee (2.22)
𝑃𝐿(2015) = 5 440 𝑈𝐴𝐻 𝑡ℎ
1 087 𝑒𝑚𝑝𝑙𝑜𝑦𝑒𝑒𝑠 = 5,00 UAH th per employee (2.23)
𝑃𝐿(2016) = − 1 082 734 𝑈𝐴𝐻 𝑡ℎ
829 𝑒𝑚𝑝𝑙𝑜𝑦𝑒𝑒𝑠 = - 1 306,07 UAH th per employee (2.24)
𝑃𝐿(2017) = 627 306 𝑈𝐴𝐻 𝑡ℎ
807 𝑒𝑚𝑝𝑙𝑜𝑦𝑒𝑒𝑠 = 777,33 UAH th per employee (2.25)
Labor profitability calculations are summarized in table 2.18.

Section 2. Analysis of Human Resources Management of PrJSC “Philip Morris Ukraine” 52
Table 2.18
Labor profitability of PMU in 2013-2017
Source: own representation based on balances and statements of financial results of
PMU for 2013-2017 (Appendix A)
As we can see, the profitability of the company throughout five years was very volatile.
Thus, in 2013 an average employee of the company generated 898,21 UAH th in profit.
Then in 2016 the company incurred huge losses of 1 306,07 UAH th per employee. And
in 2017 the company again became profitable, and increased its profitability per person
by 159,52%, while the average number of employees that year decreased only by 2,65%
in comparison to 2016. At the same time, if compared to 2013, profitability per person
decreased by 13,45%, while the average number of employees decreased by 44,31%.
Therefore, it is hard to make conclusions about efficiency and effectiveness of usage of
human resources in the company, because its performance is not stable. However,
according to the results of the last year – the company is very effective.
CAGR,
%
2014 - 2013 2015 - 2014 2016 - 2015 2017 - 2016 2017 - 20132014 -
2013
2015 -
2014
2016 -
2015
2017 -
2016
2017 -
2013
2017 -
2013
Net profit (loss) UAH th 1 301 500,00 746 304,00 5 440,00 -1 082 734,00 627 306,00 -555 196,00 -740 864,00 -1 088 174,00 1 710 040,00 -674 194,00 -42,66 -99,27 -20 003,20 -157,94 -51,80 -16,68
Average number
of employeespeople 1 449 1 379 1 087 829 807 -70 -292 -258 -22 -642 -4,83 -21,17 -23,74 -2,65 -44,31 -13,61
Labor profitabilityUAH th per
employee898,21 541,19 5,00 -1 306,07 777,33 -357,01 -536,19 -1 311,08 2 083,40 -120,87 -39,75 -99,08 -26 197,44 -159,52 -13,46 -3,55
Deviation, +/- Growth rate, %
UnitsIndicator 2013 2014 2015 2016 2017

Section 3. Ways of Improvements of Human Resources Management of PrJSC “Philip Morris Ukraine” 53
Section 3. Ways of Improvements of Human Resources
Management of PrJSC “Philip Morris Ukraine”
3.1. Necessity of improvement of human resources management of
PrJSC “Philip Morris Ukraine”
Having analysed the HRM system of PMU we can see that the company uses a lot of
various tools and approaches to overcome the challenges it faces while working with
human personnel and to make it bring benefits both to the employees and the company.
However, there is always space for improvement.
Company’s HRM approach is based on the psychological assumption that when people
are provided with the freedom to plan their actions and choose by themselves their way
of achieving the goal, they are more independent and motivated. Because people have
been provided with freedom to plan and carry out their actions on their own, they are
more satisfied and enjoy a work-life balance and tend to be more motivated and thus
more productive. More productive people in the organization are more likely to achieve
their goals and thus attain a higher rate of success in the market (Little, 2013). Thus, the
basis assumption is that satisfied people yield success and main HR’s effort goes into
building satisfaction of its employees. We can see it by the efforts the company does to
provide various benefits, drive up motivation, etc. However, the main aim of HR is not
to achieve satisfied workforce. It is to achieve the best results for organization.
Therefore, if the approach is changed towards company’s goals, it might bring more
benefits for the company. We suggest it would be beneficial for PMU to adopt Ongoing
Professional Development Strategic Human Resources Management (OPD-SHRM)
theory practices in its HRM. To assess the validity of this suggestion, we will have to
answer the research question: Is the OPD-SHRM model a better solution for HRM
system of PrJSC “Philip Morris Ukraine”?
OPD-SHRM is an improved science of HR practices which redefines the link between
people and organizations and that best matches and deals with the people’s behavior in
an organization, developed by Graham Little, a scientist from New Zealand. According
to his theory, satisfaction follows success, it does not lead to success.
The psychological assumptions underlying OPD theory are as follows:
If a person is clear about what they need to do to be successful, he/she can do it
more efficiently;
Section 3. Ways of Improvements of Human Resources Management of PrJSC “Philip Morris Ukraine” 54
The person’s performance then depends on him/her choosing to be self-
disciplined and to do what is required with his/her full commitment and
appropriate intensity.
The OPD-SHRM process is to have the people themselves choose to be successful. The
OPD-SHRM process comprises the following activities:
Agreement for success: Ask the people if they want to be successful and get
their agreement for that.
Psychological insight: They will drive themselves for success as they themselves
have chosen so.
Clear conveying of ideal actions: They should have a clear understanding of
ideal actions in the role assigned to them: ideal actions that they are expected to
deliver for their own success.
Signoff on ideal actions: Getting their signoff for ideal actions will focus their
minds on ideal actions and leave them with the least possibility to have their
minds stray about any other action.
Personal choice and commitment: Full delivery of ideal actions from them will
mean their greater chance of success because they have agreed on to be
successful.
The fundamental principle of OPD-SHRM is that for each goal, specific clear actions
must be executed in order to achieve the goals. In OPD-SHRM terminology such
specific clear actions are called “ideal actions” and defined as those actions which when
executed, offer the greatest chance of greatest success (OPD International Limited,
2014b).
The second fundamental principle is that strategy is a complex goal and that all
organisation roles need to be defined by goals derived from strategy—measured in key
performance indicators (KPIs). The organisation team structure is designed to map the
strategy onto the target market, hence roles with similar focus are grouped into teams,
teams into divisions, divisions into operating units, etc. It follows that in every role,
defined by the KPIs derived from strategy, there must be ideal actions (Little, 2013).
It now follows that for the whole organisation there is a set of ideal actions underlying
the strategy. This set of ideal actions grouped from each role is called the behavioural
structure. It follows that the more effective the organisation at identifying the guiding
delivery of the behavioural structure, the more effective the roll-out of strategy (Little,
2013).

Section 3. Ways of Improvements of Human Resources Management of PrJSC “Philip Morris Ukraine” 55
A person if left unattended for a prolonged time may get distracted from his/her focus in
ideal actions. This is where the role of a Team Leader comes in. A Team Leader will
consistently remind the team of the agreement they have signed to be successful by
exhibiting the ideal actions they have agreed to. The Team Leader’s main objective is to
ensure that the ideal actions are not forgotten by the team members by means of one on
one interaction, periodical reviews and by rewarding, coaching or by remonstrating with
them as and when appropriate. Whichever way the Team Leader feels appropriate is
right in the current scenario.
One of the tasks of the HR Key Performance Indicator would be to monitor the extent to
which the team leader has been capable of implementing the process derived from the
OPD model. This way, HR will enact the OPD model in the team. The model can be
simplified as shown in figure 3.1.
Fig. 3.1. Simplified OPD model (Source: Nel and Little (2010, p. 50))
Most importantly, as OPD-SHRM imparts in the person a perspective of working for
his/her own professional success, it thus becomes an eminent step for the Team Leader
to celebrate the person's success in a grand enough way to glorify his/her success, so the
person can have the ultimate satisfaction of having finally achieved his/her professional
goal that he/she had previously agreed. Rewarding is a crucial practice to be exercised
in this phase of celebration (Nel & Little, 2010).
The OPD-SHRM Elements ensures:
Focus (Are people clear on goals/KPIs?)
Accuracy: (Are people clear on the ideal actions to achieve those KPIs?)
Commitment (Are people inclined to do it?)
Team leader support (Do people feel their team leader is providing the support
and guidance for them to achieve their KPIs?)

Section 3. Ways of Improvements of Human Resources Management of PrJSC “Philip Morris Ukraine” 56
Business processes (Do people think the business processes assist them to do a
good job (Du Plessis et al., 2012)?)
Links between the details of the role structure of OPD model to define psychological
targets are presented in figure 3.2.
Fig. 3.2. Linking the details of the role structure to define psychological targets (Source:
Nel and Little (2010, p.49))
To sum up, OPD theory is based on a scientific and unconventional binding between
employees' behavior and organizational goals. OPD theory enables the team leader to
identify the ideal actions based on KPIs or goals, which are clear, concise and of the
nature that accomplishing them ensures a maximum chance of success. The team leader
ensures that the ideal actions are clearly understood by the team. The employees agree
on performing ideal actions with full commitment based on prior agreement to
commitment for success. As the employees are committed and determined on what they
must do, they seek to be more precise in the delivery of ideal actions. As a result, of
precision in delivery, when employees are eventually successful, they feel satisfied. The
employees are motivated by achieving their goal with the execution of the ideal actions
derived from the KPIs or goals with their self-discipline and perseverance (Little, 2013).

Section 3. Ways of Improvements of Human Resources Management of PrJSC “Philip Morris Ukraine” 57
3.2. Link between current HRM success and OPD-SHRM
From the previous chapter we have learned that the company measures Employee
Development and Engagement Index. It demonstrates employees’ opinion about their
job satisfaction level, motivation at work, their efficiency, productivity, their
performance, rating by their manager, and professional development. Thus, on a very
high level it shows the effectiveness of current HRM system. We would like to examine
whether OPD-SHRM could have been more beneficial and effective to the organization
in reaching its objectives. In order to do that, we will perform the following steps:
1) Study correlation and relationship between Employee Development and
Engagement Index and OPD-SHRM elements in the company
2) Calculate the impact on Employee Development and Engagement Index from an
increase in OPD-SHRM elements
Data analysis: During data analysis, we have used statistical methods of simple and
multiple regression, Pearson correlation coefficient and coefficient of determination.
“Correlation coefficient is a number that summarizes the nature of relationship between
two variables” (Hatcher, 2003, p.290). The larger the correlation coefficient number is
(absolute value), the stronger the relationship would be. Two variables with higher
correlation coefficient mean that the two variables are related and it though does not
determine any causality between the variables (Weinberg & Abramowitz, 2002).
The coefficient of determination is the ratio of explained variation in y to the total
variation in y, and is computed as r² = Explained variation/Total variation.
Simple regression analysis assumes that one variable can be expressed, at least
approximately, as a linear function of another variable. Multiple regression correlation
technique is an extended form of simple linear regression statistical method. It is used to
evaluate the value of one or more variables from the values of another set of 2 or more
variables. The variable that is to be predicted is also called dependent. The variables that
are used to predict the values for dependent variables are called independent (Lund
Research Ltd, 2013).
1) Study correlation and relationship between Employee Development and
Engagement Index and OPD-SHRM elements in the company
To study correlation and relationship between Employee Development and Engagement
Index and OPD-SHRM elements in the company, we conducted surveys among
employees, asking two types of questions:
Type 1: Employee Development and Engagement Index questions;

Section 3. Ways of Improvements of Human Resources Management of PrJSC “Philip Morris Ukraine” 58
Type 2: Questions which revolve around key characteristics of OPD theory
identified by Little (2013), Nel and Little (2010, 2014) regarding key aspects of
the OPD model and cultural issues that the OPD model addresses.
The survey questionnaire used in this research is included in Appendix D for reference
purposes.
Type 1 questions are questions to ascertain how successful the existing HRM was in
achieving its objectives. Type 2 questions were to assess the extent of OPD-SHRM
already present in the existing HRM. This type of question sought to determine the
characterizing attributes of OPD-SHRM already present and being exercised in the
existing HRM of the organization. The purpose was to find the correlation between the
extent of the presence of OPD-SHRM and the extent of HRM objectives being met in
terms of employees' performance, their satisfaction level and general HRM objectives.
Upon finding the correlation, we would like to see what would be the impact on
company’s income, if OPD-SHRM techniques would be developed and strengthened.
Sampling: In order to ensure obtained Employee Development and Engagement Index
results from my survey match those, from Employee Opinion Survey 2017, while
choosing the sample, we used stratified sampling technique. First of all, we split all
organization into groups by departments, salary grades, and age groups, to match those
used during EOS. Then, we have selected a random sample from each group, in
proportion to respondents from each group during EOS.
We have decided that if obtained Employee Development and Engagement Index would
be within +/- 2% from the corresponding one from EOS 2017, we could use the results
of my survey to use linear regression model based on Employee Development and
Engagement Index from EOS for income prediction.
Survey: The survey was distributed by means of company’s internal Share Point survey
forms. Since it is an internal source, we could ensure necessary level of privacy. As the
survey was intended for a limited audience, it was distributed only via web-links sent in
emails to the participants.
There were 55 responses obtained for the survey (10% from the number of respondents
to EOS 2017). It consisted of 11 questions: 6 Type 1 questions and 5 Type 2 questions.
Results for each question split by type are presented below on figures 3.3 – 3.14. Survey
results are presented in Appendix E.
Type 1 (Questions 1-6)
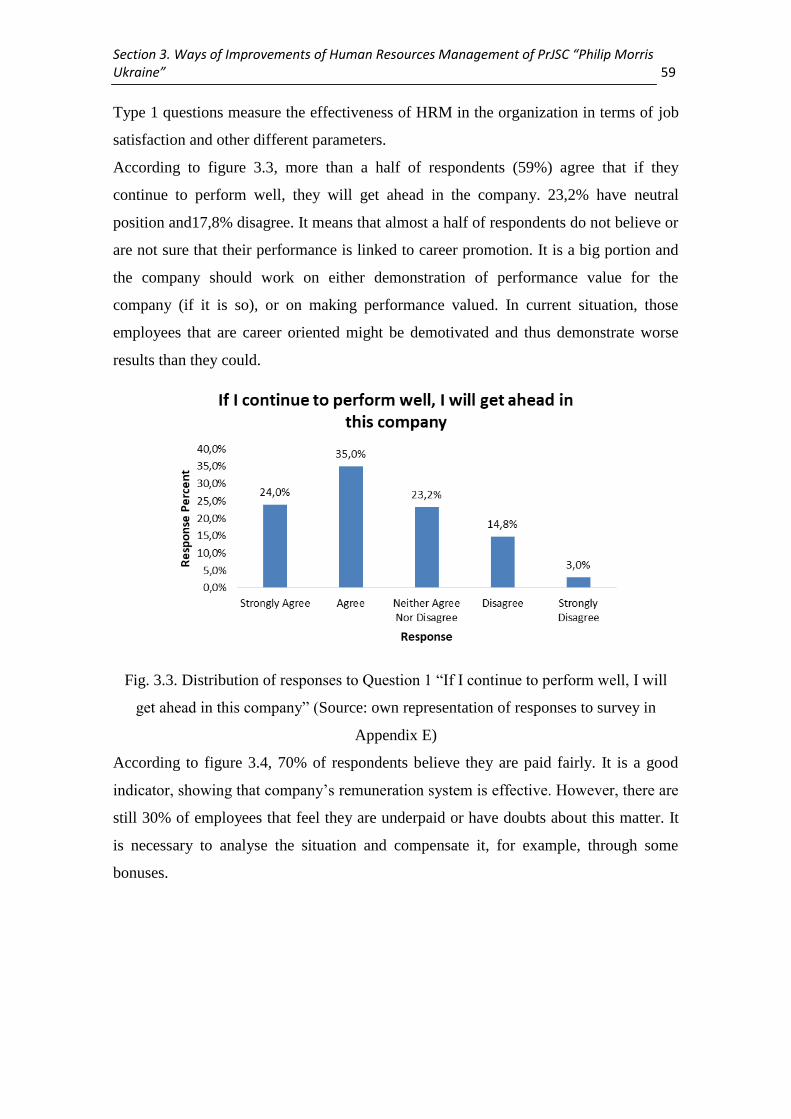
Section 3. Ways of Improvements of Human Resources Management of PrJSC “Philip Morris Ukraine” 59
Type 1 questions measure the effectiveness of HRM in the organization in terms of job
satisfaction and other different parameters.
According to figure 3.3, more than a half of respondents (59%) agree that if they
continue to perform well, they will get ahead in the company. 23,2% have neutral
position and17,8% disagree. It means that almost a half of respondents do not believe or
are not sure that their performance is linked to career promotion. It is a big portion and
the company should work on either demonstration of performance value for the
company (if it is so), or on making performance valued. In current situation, those
employees that are career oriented might be demotivated and thus demonstrate worse
results than they could.
Fig. 3.3. Distribution of responses to Question 1 “If I continue to perform well, I will
get ahead in this company” (Source: own representation of responses to survey in
Appendix E)
According to figure 3.4, 70% of respondents believe they are paid fairly. It is a good
indicator, showing that company’s remuneration system is effective. However, there are
still 30% of employees that feel they are underpaid or have doubts about this matter. It
is necessary to analyse the situation and compensate it, for example, through some
bonuses.

Section 3. Ways of Improvements of Human Resources Management of PrJSC “Philip Morris Ukraine” 60
Fig. 3.4. Distribution of responses to Question 2 “I believe I am paid fairly” (Source:
own representation of responses to survey in Appendix E)
According to figure 3.5, 68% of respondents agree that they receive necessary coaching
and feedback from their managers. Around 20% are neutral and around 12% disagree.
Taking into account the proportion of managers to employees, 68% of satisfied
employees is a good measure. Therefore, company’s managers are doing a good job,
although, there is still space for improvement.
Fig. 3.5. Distribution of responses to Question 3 “I receive useful coaching and
feedback that helps me improve my performance” (Source: own representation of
responses to survey in Appendix E)
According to figure 3.6, 59% of respondents believe that there is a clear link between
job performance and pay at the company. It repeats the dynamics of respondents’
position about link between performance and promotion, and support the conclusion

Section 3. Ways of Improvements of Human Resources Management of PrJSC “Philip Morris Ukraine” 61
that the company has to work on demonstration of performance value for organization
over all other factors.
Fig. 3.6. Distribution of responses to Question 4 “I think there is a clear link between
job performance and pay at my company” (Source: own representation of responses to
survey in Appendix E)
In figure 3.7 we see that 62% of respondents agree that they are recognized when they
perform above and beyond their job responsibilities. Such proactive behavior is what
drives an organization forward, therefore, it is very important to support it. 62% is not
bad, however, it means that the rest 38% are not motivated to “go an extra mile” and
thus the company is losing possible opportunities.
Fig. 3.7. Distribution of responses to Question 5 “Management provides recognition for
performance when I perform above and beyond my job responsibilities” (Source: own
representation of responses to survey in Appendix E)
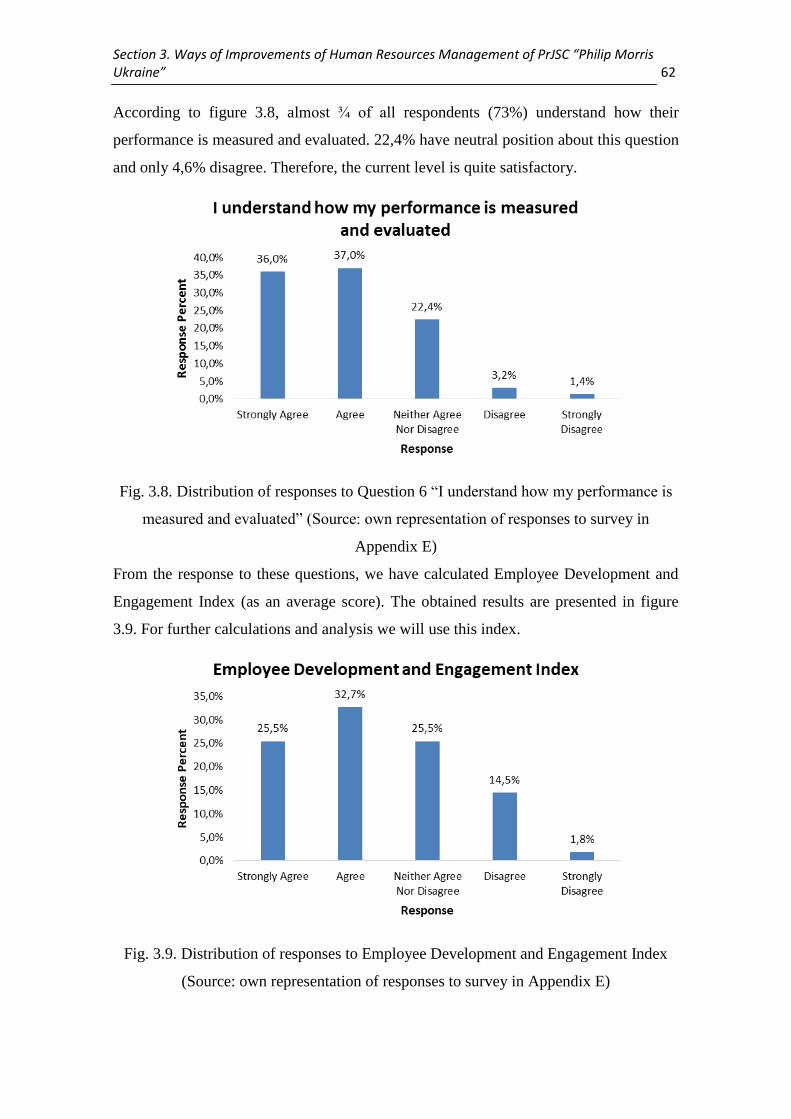
Section 3. Ways of Improvements of Human Resources Management of PrJSC “Philip Morris Ukraine” 62
According to figure 3.8, almost ¾ of all respondents (73%) understand how their
performance is measured and evaluated. 22,4% have neutral position about this question
and only 4,6% disagree. Therefore, the current level is quite satisfactory.
Fig. 3.8. Distribution of responses to Question 6 “I understand how my performance is
measured and evaluated” (Source: own representation of responses to survey in
Appendix E)
From the response to these questions, we have calculated Employee Development and
Engagement Index (as an average score). The obtained results are presented in figure
3.9. For further calculations and analysis we will use this index.
Fig. 3.9. Distribution of responses to Employee Development and Engagement Index
(Source: own representation of responses to survey in Appendix E)

Section 3. Ways of Improvements of Human Resources Management of PrJSC “Philip Morris Ukraine” 63
Employee Development and Engagement Index average score obtained from the survey
is 3,7061. Index value in 2017 according to EOS was 3,64. The obtained result is 1,82%
higher than EOS result, which is within the acceptable range of +/- 2%. Therefore, we
can use the results of survey to use linear regression model based on Employee
Development and Engagement Index from EOS for income prediction.
Type 2 (Questions 7-11)
Type 2 questions measured the extent of the presence of OPD-SHRM elements. OPD-
SHRM has an emphasis on more frequent manager-employee interactions, help and
support from the manager, more employees’ engagement, inclination towards success
and emphasis on actions over results. These questions measured the degree to which
these elements of OPD-SHRM were present.
According to figure 3.10, 47,3% of respondents say that they know about key
performance activities that will lead to their success. 34,5% are not sure about that and
18,2% do not know about them. It means that around a half of respondents might be
focusing on less important activities, thus decreasing their own success and overall
success of an organization.
Fig. 3.10. Distribution of responses to Question 7 “Key performance activities that are
relevant to my role are clear to me for me to be successful in my role” (Source: own
representation of responses to survey in Appendix E)
In figure 3.11 we see that 78,1% of respondents sometimes or even often ‘on the spot’
social rewarding from their managers. Only 5,5% claim they never receive it. Thus, in
general, the level is quite satisfactory.

Section 3. Ways of Improvements of Human Resources Management of PrJSC “Philip Morris Ukraine” 64
Fig. 3.11. Distribution of responses to Question 8 “How often does your manager give
you ‘on the spot’ social rewarding?” (Source: own representation of responses to survey
in Appendix E)
According to figure 3.12, around a half of respondents (52,7%) say that their manager’s
expectations from them are realistic. 16,4% state they are not realistic at all and 12,7%
they are mostly not realistic. It is worth attention, since it means that around a quarter of
employees feel their managers usually expect too much of them, which means no matter
how hard they are trying – they are not able to reach success. Managers have to align
their expectations with employees to stay on the same ground.
Fig. 3.12. Distribution of responses to Question 9 “How realistic are the expectations of
your manager from you?” (Source: own representation of responses to survey in
Appendix E)
In figure 3.13 we see that repeating the distribution of answers for the question about
key activities, only half of the respondents (49,1%) know how to be successful in their

Section 3. Ways of Improvements of Human Resources Management of PrJSC “Philip Morris Ukraine” 65
current role. It means that the other half has low chances of reaching success, since they
are not sure or do not know how. This should become one of the main focus points of
the company.
Fig. 3.13. Distribution of responses to Question 10 “I know how to be successful in my
current role” (Source: own representation of responses to survey in Appendix E)
According to figure 3.14, 63,7% of respondents say their managers do one on one
meetings with them either weekly or fortnightly. It is a good level. However, it is
advisable to pay attention to 7,3%, who have their one on one meetings more rare than
monthly. Such rare communication might hurt employees’ performance and thus,
company’s results.
Fig. 3.14. Distribution of responses to Question 11 “How often does your supervisor do
one on one meeting with you?” (Source: own representation of responses to survey in
Appendix E)
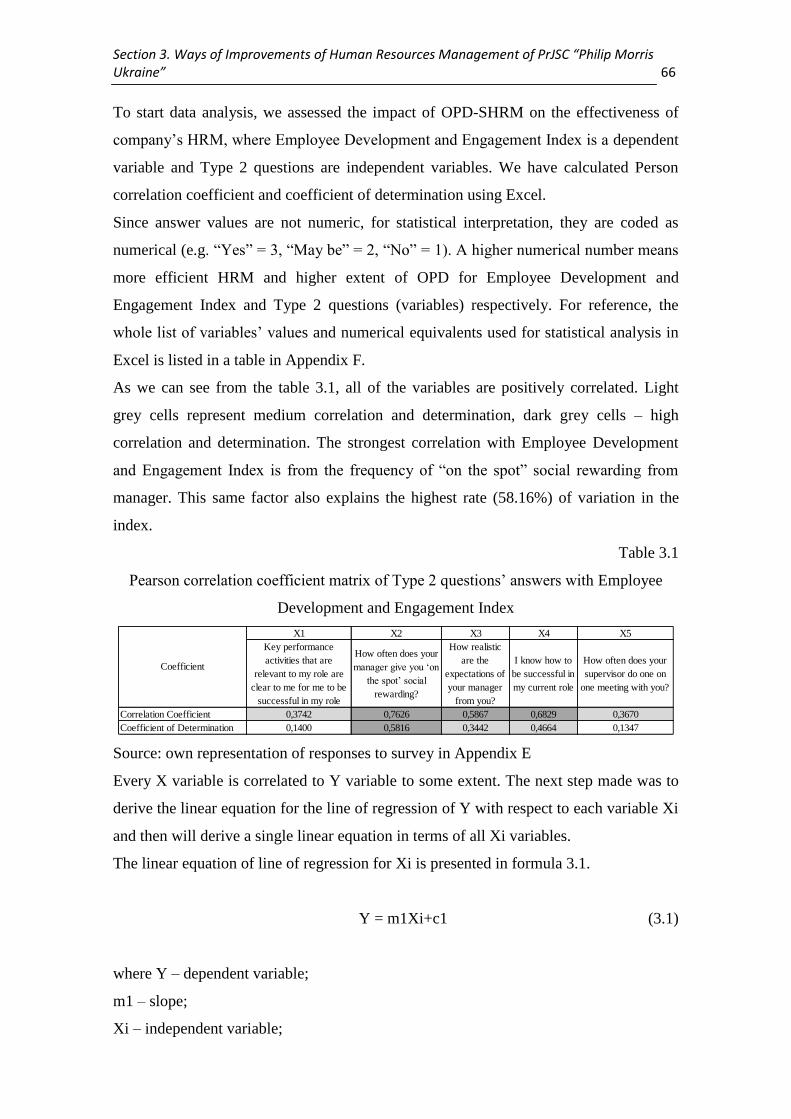
Section 3. Ways of Improvements of Human Resources Management of PrJSC “Philip Morris Ukraine” 66
To start data analysis, we assessed the impact of OPD-SHRM on the effectiveness of
company’s HRM, where Employee Development and Engagement Index is a dependent
variable and Type 2 questions are independent variables. We have calculated Person
correlation coefficient and coefficient of determination using Excel.
Since answer values are not numeric, for statistical interpretation, they are coded as
numerical (e.g. “Yes” = 3, “May be” = 2, “No” = 1). A higher numerical number means
more efficient HRM and higher extent of OPD for Employee Development and
Engagement Index and Type 2 questions (variables) respectively. For reference, the
whole list of variables’ values and numerical equivalents used for statistical analysis in
Excel is listed in a table in Appendix F.
As we can see from the table 3.1, all of the variables are positively correlated. Light
grey cells represent medium correlation and determination, dark grey cells – high
correlation and determination. The strongest correlation with Employee Development
and Engagement Index is from the frequency of “on the spot” social rewarding from
manager. This same factor also explains the highest rate (58.16%) of variation in the
index.
Table 3.1
Pearson correlation coefficient matrix of Type 2 questions’ answers with Employee
Development and Engagement Index
Source: own representation of responses to survey in Appendix E
Every X variable is correlated to Y variable to some extent. The next step made was to
derive the linear equation for the line of regression of Y with respect to each variable Xi
and then will derive a single linear equation in terms of all Xi variables.
The linear equation of line of regression for Xi is presented in formula 3.1.
Y = m1Xi+c1 (3.1)
where Y – dependent variable;
m1 – slope;
Xi – independent variable;
X1 X2 X3 X4 X5
Key performance
activities that are
relevant to my role are
clear to me for me to be
successful in my role
How often does your
manager give you ‘on
the spot’ social
rewarding?
How realistic
are the
expectations of
your manager
from you?
I know how to
be successful in
my current role
How often does your
supervisor do one on
one meeting with you?
Correlation Coefficient 0,3742 0,7626 0,5867 0,6829 0,3670
Coefficient of Determination 0,1400 0,5816 0,3442 0,4664 0,1347
Coefficient

Section 3. Ways of Improvements of Human Resources Management of PrJSC “Philip Morris Ukraine” 67
c1 – Y-intercept.
We have calculated linear equations for determining Employee Development and
Engagement Index (Y) in terms of answers to each Type 2 question (Xi variable). The
constants m1 (Xi variable B value) and c1 (intercept B value) have been determined
using the Excel. Data is summarized in table 3.2
Table 3.2
Regression linear equations for determining Employee Development and Engagement
Index (Y) in terms of answers to Type 2 questions (Xi variables)
Source: own representation of responses to survey in Appendix E
In addition to linear regression equations, we have calculated the standard error of
estimate. The “Standard error of estimate” is also an indicator of correlation between the
dependent and independent variable. The more they are correlated, the more accurately
the independent variable can be determined in terms of dependent variable; thereby the
“Standard error of estimate” will be lesser (Chaudhary, 2009).
For example, in case with X1, the standard error of estimate of 0,9447 means the
difference between the predicted value of Y and the actual value of Y is less than or
equal to 0,9447.
By looking at the table 3.2, it can be found that the “Standard error of estimate” is
lowest when Y is represented in terms of X2. This means that X2 is the best predictor of
Y among all other independent variables, Xi.
Before selecting equation 3.2 as the final one to calculate a value for Y, we have first to
determine linear equation for the line of regression between the independent variable, Y
and all dependent variables, Xi taken together. This is also known as the multiple
regression equation.
Y = (0,8572)X2 + 0,9942 (3.2)
A Multiple Linear Regression Equation represents the dependent variable in terms of all
the predictors (independent variables). In this case, we will find an equation for Y in
R R SquareAdjusted
R Square
Std. Error of
the EstimateIndicator B Std. Error
Intercept 2,0749 0,5697
Xi variable 0,4956 0,1687
Intercept 0,9942 0,3282
Xi variable 0,8572 0,0999
Intercept 2,1274 0,3193
Xi variable 0,5138 0,0974
Intercept 0,6350 0,4622
Xi variable 0,9230 0,1356
Intercept 2,6031 0,4047
Xi variable 0,3745 0,1304
Y = (0,4956)X1 + 2,0749
Y = (0,8572)X2 + 0,9942
Y = (0,5138)X3 + 2,1274
Y = (0,923)X4 + 0,635
Y = (0,3745)X5 + 2,6031
Xi (Dependent Variable)
Regression Linear
equation of Y in terms
of Xi
0,9447
0,6590
0,8250
0,7441
0,9476
X1
X2
X3
X4
X5 0,1347
0,1238
0,5737
0,3318
0,4563
0,1184How often does your supervisor do one on one meeting
with you?
0,3742
0,7626
0,5867
0,6829
0,3670
Regression Statistics Regression Coefficients
Key performance activities that are relevant to my role
are clear to me for me to be successful in my role
How often does your manager give you ‘on the spot’
social rewarding?
How realistic are the expectations of your manager
from you?
I know how to be successful in my current role
0,1400
0,5816
0,3442
0,4664
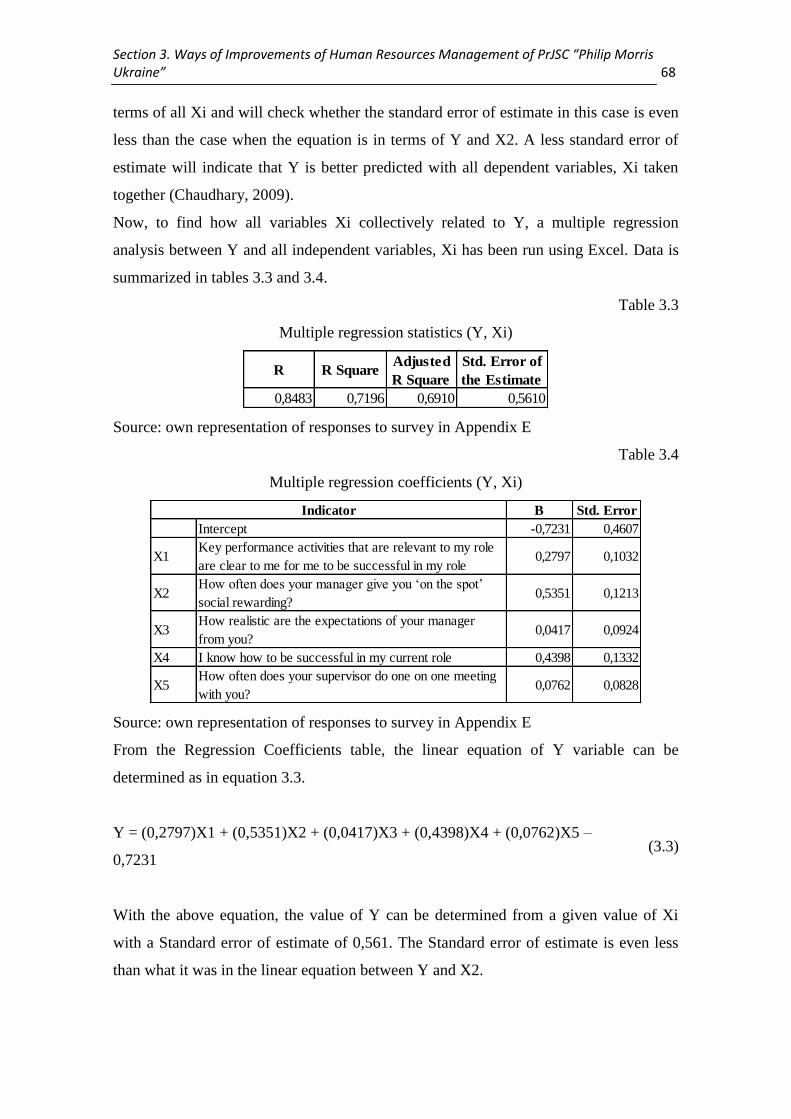
Section 3. Ways of Improvements of Human Resources Management of PrJSC “Philip Morris Ukraine” 68
terms of all Xi and will check whether the standard error of estimate in this case is even
less than the case when the equation is in terms of Y and X2. A less standard error of
estimate will indicate that Y is better predicted with all dependent variables, Xi taken
together (Chaudhary, 2009).
Now, to find how all variables Xi collectively related to Y, a multiple regression
analysis between Y and all independent variables, Xi has been run using Excel. Data is
summarized in tables 3.3 and 3.4.
Table 3.3
Multiple regression statistics (Y, Xi)
Source: own representation of responses to survey in Appendix E
Table 3.4
Multiple regression coefficients (Y, Xi)
Source: own representation of responses to survey in Appendix E
From the Regression Coefficients table, the linear equation of Y variable can be
determined as in equation 3.3.
Y = (0,2797)X1 + (0,5351)X2 + (0,0417)X3 + (0,4398)X4 + (0,0762)X5 –
0,7231 (3.3)
With the above equation, the value of Y can be determined from a given value of Xi
with a Standard error of estimate of 0,561. The Standard error of estimate is even less
than what it was in the linear equation between Y and X2.
R R SquareAdjusted
R Square
Std. Error of
the Estimate
0,8483 0,7196 0,6910 0,5610
B Std. Error
Intercept -0,7231 0,4607
X1Key performance activities that are relevant to my role
are clear to me for me to be successful in my role0,2797 0,1032
X2How often does your manager give you ‘on the spot’
social rewarding?0,5351 0,1213
X3How realistic are the expectations of your manager
from you?0,0417 0,0924
X4 I know how to be successful in my current role 0,4398 0,1332
X5How often does your supervisor do one on one meeting
with you?0,0762 0,0828
Indicator

Section 3. Ways of Improvements of Human Resources Management of PrJSC “Philip Morris Ukraine” 69
The above linear equation comprises all independent variables to determine the
dependent variable Y with the least standard error of estimate and hence is the best
determinant equation for predicting the value for Y variable.
2) Calculate the impact on Employee Development and Engagement Index from an
increase in OPD-SHRM elements
Equation 3.3 has been deduced to find out the value for dependent variable Y. Variables
X1…X5 are Type 2 questions, which determine the extent of OPD elements in PMU.
Before going further, we had to verify multiple regression approach. We verify multiple
regression equation for Y in terms of all Xi to find out if the equation can correctly
predict the value of Y from a given set of values of Xi. We substitute the values of Xi
obtained from the survey and compute Y to verify whether it matches with the Y
obtained from survey. If it matches, it proves the validity of the multiple regression
equation we have derived thereby validating the multiple regression approach used in
this research. The mean values of Xi obtained from the survey are presented in table 3.5.
Table 3.5
Frequency distribution (Y, Xi)
Source: own representation of responses to survey in Appendix E
We have substituted Xi variables with their means in the multiple regression equation.
The result is presented in equation 3.4.
Y = (0,2797) x 3,29 + (0,5351) x 3,16 + (0,0417) x 3,07 + (0,4398) x 3,33 +
(0,0762) x 2,95 – 0,7231 = 3,7061 (3.4)
Y X1 X2 X3 X4 X5
Employee
Developme
nt and
Engagement
Index
Key
performance
activities that
are relevant to
my role are
clear to me for
me to be
successful in
my role
How often
does your
manager give
you ‘on the
spot’ social
rewarding?
How realistic
are the
expectations
of your
manager from
you?
I know how
to be
successful
in my
current role
How often
does your
supervisor
do one on
one meeting
with you?
N 55 55 55 55 55 55
Mean 3,7061 3,2909 3,1636 3,0727 3,3273 2,9455
Median 4 3 3 4 3 3
Mode 4 4 4 4 4 4
Std. Deviation 1,0092 0,7619 0,8978 1,1524 0,7467 0,9892
Range 3,5 2 3 3 2 3
Minimum 1,5 2 1 1 2 1
Maximum 5 4 4 4 4 4

Section 3. Ways of Improvements of Human Resources Management of PrJSC “Philip Morris Ukraine” 70
Using the formula, we have obtained the same value, as the mean value of Employee
Development and Engagement Index from the survey (3,7061). Therefore, our multiple
regression equation is valid and we can use it to measure the impact of increase in
extent of OPD-SHRM.
To measure the impact of OPD-SHRM on HRM effectiveness, the value of each Xi
variable is increased to its maximum. And, the value of Y is predicted with this
increased value of Xi. The maximum value for each variable can be found in Appendix
F, which lists the numerical equivalent of each choice of the survey questions. With the
help of multiple regression equations for Y in terms of Xi, we predict the value of Y to
know how an increase in OPD characteristics within HRM impacts on Employee
Development and Engagement Index. Calculations are presented in equation 3.5.
Y = (0,2797) x 4 + (0,5351) x 4 + (0,0417) x 4 + (0,4398) x 4 + (0,0762) x 4 –
0,7231 = 4,7668 (3.5)
So, with all Xi increased to its maximum value, an increase in the value of Y can be
seen. The value of Y soared from 3,7061 to 4,7668. This implies that Employee
Development and Engagement Index increases with an increase in the extent of OPD-
SHRM elements.
This is now measured in percentages:
Current Y (Employee Development and Engagement Index) is calculated in equation
3.6.
Y = ((3,7061 – 1) x 100) / (5-1) = 67,65% (3.6)
Increased Employee Development and Engagement Index calculation is presented in
equation 3.7.
Y = ((4,7668 – 1) x 100) / (5-1) = 94,17% (3.7)
Clearly, there is an increase of about 26% in Engagement and Development Index with
the increase in the extent of OPD-SHRM elements.

Section 3. Ways of Improvements of Human Resources Management of PrJSC “Philip Morris Ukraine” 71
3.3. Forecasted changes in activity of PrJSC “Philip Morris Ukraine” on
the basis of proposed measures (Implementing OPD-SHRM in PMU)
We have come into conclusion that implementation of OPD-SHRM in PMU will make
it possible to increase Employee Development and Engagement Index from 3,7061 up
to 4,7668. To assess the feasibility of its implementation, we carried out a forecast
estimate of net income of the company.
It was determined that if the strategy of the enterprise is unchanged in the next 3 years,
one can expect a decrease in company’s income and, in fact, even losses, despite an
increase in net revenue. If the trends remain unchanged by 2020, company’s losses
might reach 3 208,89 UAH mln, which is even greater than the losses incurred in 2016
(1 082,74 UAH mln) (table 3.6). Such forecasted results definitely call for strategy
change.
First of all, we forecast the net income figures without introduction of our proposals.
We used the extrapolation method, which allows transferring the averaged trends of the
previous periods to the future.
Table 3.6
PMU financial results’ forecast for 2018-2020 under unchanged strategy, UAH mln
Source: own representation based on balances and statements of financial results of
PMU for 2013-2017 (Appendix A)
We calculated compound annual growth rates of all P&L items, besides profit tax and
net income. With the use of the rates obtained, the forecast indicators for the years 2018
- 2020 were calculated. Profit tax was calculated at the level of 18% from financial
results before taxation. In addition to that, in case financial results before taxation was
positive, we deducted profit tax, and when it was negative, we added profit tax. Net
2018 2019 2020 2018 - 2017 2019 - 2018 2020 - 2019
Net revenue from sales of
products (goods, works,
services)
10 690,89 17,15 12 524,88 14 673,49 17 190,68 1 833,99 2 148,61 2 517,20
Other operating income 400,14 61,11 644,65 1 038,58 1 673,23 244,51 393,93 634,65
Other income 108,03 54,07 166,44 256,43 395,09 58,41 89,99 138,65
Total income 11 199,05 - 13 335,97 15 968,50 19 258,99 2 136,92 2 632,53 3 290,50
Cost of sales (goods, works,
services)-7 823,57 34,84 -10 548,96 -14 223,74 -19 178,65 -2 725,38 -3 674,78 -4 954,91
Other operating expenses -2 217,51 8,74 -2 411,28 -2 621,98 -2 851,09 -193,77 -210,70 -229,11
Other expenses -402,40 41,60 -569,81 -806,86 -1 142,53 -167,41 -237,05 -335,67
Total expenses -10 443,49 - -13 530,04 -17 652,58 -23 172,27 -3 086,56 -4 122,53 -5 519,69
Financial results before
taxation755,56 - -194,08 -1 684,08 -3 913,28 -949,64 -1 490,00 -2 229,19
Profit tax -128,26 - 34,93 303,13 704,39 163,19 268,20 401,25
Net profit 627,31 - -159,15 -1 380,95 -3 208,89 -786,45 -1 221,80 -1 827,94
ForecastIndicator 2017
CAGR, %
2017 -
2013
Deviation, +/-

Section 3. Ways of Improvements of Human Resources Management of PrJSC “Philip Morris Ukraine” 72
income value was obtained as the sum of all P&L items. As the baseline year, we used
data of 2017 obtained at the enterprise.
Forecasting is of utmost importance for the enterprises changing the strategy of business
activity. The role of forecasting can’t be ignored in estimating the financial
requirements for further innovations. Financial estimates can be calculated in the light
of probable sales and cost thereof.
Forecasting provides the information which helps in the achievement of effective
control. The managers become aware of their weaknesses during forecasting and
through implementing better effective control they can overcome these weaknesses.
The next step is to study the correlation and relationship between Employee
Development and Engagement Index and company’s net profit (loss), to see if we can
use the change in index value to forecast net profit (loss). Indicators’ values for 2013-
2017 are presented in table 3.7.
Table 3.7
Employee Development and Engagement Index and net profit (loss) of PMU in
2013-2017
Source: own representation based on balances and statements of financial results of
PMU for 2013-2017 (Appendix A) and internal company data
Scatter plot in figure 3.15 represents the relationship between Employee Development
and Engagement Index (independent variable) and net profit (loss) (dependent variable).
The scatter plot shows that the correlation between these two variables is positive.
The correlation coefficient of our data set is r = 0,8777. This value shows that the
correlation between variables is positive (since the value is greater than zero) and that
the correlation between these two variables is strong (since the value is close to 0,9). It
means that income values strongly depend on Employee Development and Engagement
Index values.
CAGR,
%
2014 -
2013
2015 -
2014
2016 -
2015
2017 -
2016
2017 -
2013
2014 -
2013
2015 -
2014
2016 -
2015
2017 -
2016
2017 -
2013
2017 -
2013
Employee Development and
Engagement Indexpoints 4,02 3,30 3,21 2,97 3,64 -0,72 -0,10 -0,24 0,67 -0,38 -17,86 -2,90 -7,46 22,58 -9,52 -2,47
Net profit (loss) UAH mln 1 301,50 746,30 5,44 -1 082,74 627,31 -555,20 -740,86 -1 088,18 1 710,05 -674,19 -42,66 -99,27 -20 003,36 -157,94 -51,80 -16,68
Indicator
Deviation, +/- Growth rate, %
2013 2014 2015 2016 2017Units

Section 3. Ways of Improvements of Human Resources Management of PrJSC “Philip Morris Ukraine” 73
Fig. 3.15. Scatter plot and regression line of Employee Development and Engagement
Index and net profit (loss) of PMU for 2013-2017 (Source: own representation based on
balances and statements of financial results of PMU for 2013-2017 (Appendix A) and
internal company data)
The coefficient of determination is r² = 0,7704. It means that about 77% of the variation
in income can be explained by the relationship between income and Employee
Development and Engagement Index. Other 23% is unexplained and is due to sampling
error or other factors.
The correlation coefficient (r) and coefficient of determination (r²) were calculated
using Excel.
Taking into account such high correlation coefficient and coefficient of determination,
we can use Employee Development and Engagement Index to predict company’s
income. This can be done using regression equation. The regression equation for our
samples is presented in equation 3.8 and in figure 3.15. We calculated it using Excel.
y = (1 946)x – 6 353,9 (3.8)
The slope of the equation tells us how much we can expect y to change as x increases.
In our equation the slope is 1 946. It means that as Employee Development and
Engagement Index increases by 1, the value of income increases by 1 946 UAH mln.
The y-intercept of the regression line is the place where the regression line crosses the
y-axis (where x = 0). In our equation the y-intercept is -6 353,9, meaning that when
Employee Development and Engagement Index is 0, company’s losses are 6 353,9
UAH mln.

Section 3. Ways of Improvements of Human Resources Management of PrJSC “Philip Morris Ukraine” 74
In order to identify the potential income increase from improved OPD-SHRM in the
company, we will plot increased Employee Development and Engagement Index into
regression equation for this Index and income.
Since it is not possible to boost all OPD-SHRM elements in one year, we assume that
increase in Employee Development and Engagement Index will be gradually distributed
over 3 years. The maximum possible index to obtain is 4,7668, which is 1,0607 points
greater than index in 2017, obtained from the survey (3,7061). We assume that during
the first year, index will increase by 20% from that difference, during the second year it
will increase by 30%, and the rest 40% will be gained during the third year.
Thus, in 2018 the forecasted Employee Development and Engagement Index would be
3,9182. When we plot it into our equation (3.9), we receive the forecasted value of net
income of 1 271,1277 UAH mln.
y = (1 946) x 3,9182 – 6 353,9 = 1 271,1277 UAH mln (3.9)
Following the same approach, we plot values for 2019 and 2020. The obtained results
are summarized in table 3.8.
Table 3.8
PMU financial results’ forecast for 2018 – 2020 under OPD-SHRM implementation,
UAH mln
Source: own representation based on balances and statements of financial results of
PMU for 2013-2017 (Appendix A) and internal company data
So, with an increase of Employee Development and Engagement Index by almost 26%
due to OPD-SHRM, company’s income will increase up to 2 716,04 UAH mln, which is
almost 4,5 times greater than company’s income in 2017 (627,31 UAH mln).
We can compare net profit (loss) forecast without implementation of OPD-SHRM
(current strategy) and after implementation of OPD-SHRM (new strategy) by looking at
figure 3.16. It is obvious, that strategy change will be beneficial for the company.
CAGR,
%
2018 2019 20202018 -
2017
2019 -
2018
2020 -
2019
2018 -
2017
2019 -
2018
2020 -
2019
2020 -
2017
2020 -
2017
Employee Development
and Engagement Indexpoints 3,71 3,92 4,24 4,66 0,21 0,32 0,42 5,72 8,12 10,01 25,76 7,94
Net profit (loss) UAH mln 627,31 1 271,13 1 890,38 2 716,04 643,82 619,25 825,66 102,63 48,72 43,68 332,97 62,99
Average number of
employeespeople 807 799 791 783 -8 -8 -8 -1,00 -1,00 -1,00 -2,97 -1,00
Labor profitabilityUAH mln per
employee0,78 1,59 2,39 3,47 0,81 0,80 1,08 104,68 50,22 45,13 346,22 64,63
Units
Forecast
2017Indicator
Deviation, +/- Growth rate, %

Section 3. Ways of Improvements of Human Resources Management of PrJSC “Philip Morris Ukraine” 75
Fig. 3.16. Net profit (loss) forecast with and without OPD-SHRM (Source: own
representation based on balances and statements of financial results of PMU for 2013-
2017 (Appendix A) and internal company data)
Since company’s income will increase, it also means that labor profitability will
increase as well. Let’s assume that the average number of employees will continue to
decrease each year by 1%. The compound annual growth rate of the average number of
employees over 2013-2017 was -13,61%, however, the main changes happened in 2015
and 2016, due to disturbances in the country. In 2017 the decrease rate was already -
2,65%, therefore, we suppose that further decrease will be even less and choose -1%
rate for our forecast.
At 1% decrease of average number of employees every year, by 2020 labor profitability
will increase by 346,22% and reach 3,47 UAH mln per employee. In case the decrease
rate of the average number of employees will be higher, labor profitability will increase
even more.
As we see, we got a positive answer to our research question “Is the OPD-SHRM model
a better solution for HRM system of PrJSC “Philip Morris Ukraine”?”. Based on the
obtained results we can clain that OPD-SHRM implementation at PMU can bring
significant financial and non-material benefits for the company. In terms of intangible
benefits, a powerful benefit of using this model in an organization is for HR personnel.
HR has a KPI to quantify managers' efficiency in the execution of OPD processes
within his/her team. The execution of OPD process is more the responsibility of the
manager rather than HR personnel. However, the HR personnel have to ensure that
supervisors and managers have the expertise to implement strategic HR processes. HR
personnel observe that the procedures are being applied correctly. If the OPD-SHRM
processes and procedures are not being implemented then the HR should present a

Section 3. Ways of Improvements of Human Resources Management of PrJSC “Philip Morris Ukraine” 76
report to the divisional managers to steer them to take remedial action in order to
reinforce the ongoing success of employees. HR’s essential role thus remains to
supervise and direct ways of improving human performance that strategically drives the
organization toward better results (Nel & Little, 2010).
In OPD-SHRM, the managers’ responsibility is reduced to just management. They need
to just ensure that the link between staff behavior and organizational goals and outputs
are accurate. The manager can concentrate on his/her other activities like preparing and
sending reports to divisions and superiors. Whenever a new strategy to plan is
introduced, such as a new marketing campaign, the manager is simply required to
review and identify changes in the staff’s behavior necessary to make the new plan or
tactic a success. The OPD model provides the managers with the understanding of how
to identify the required behavior change. The OPD model takes all the guess work out
of how to get the best results from the team. The OPD model works best wherever
people are a strategic factor in deciding the success (OPD International Limited, 2014a).
Within OPD-SHRM, identification of performance lapses and its controls is relatively
easy. The basic principle is to monitor the business by monthly results and from that
identify which ideal actions need improvement and then coach people in the better
delivery of those ideal actions.
The team leader will keep a check of performance lapses and take measures to control it
by four different ways.
Performance Management: The team leader will manage the team performance on a
daily basis. The team leader will ensure that ideal actions are distinct and clearly written
on paper. The ideal actions are clear in the mind of the staff as the best and only way to
ensure the greatest success.
Performance Review: The second activity of the team leader is Performance Review.
The team leader will meet with the staff every few weeks and review their success. The
team leader will discuss the ideal actions, what the staff finds difficulty in delivering
and ideal actions, and what the staff feels went well which enabled the success. As
required the team leader will either coach the staff to improve on the delivery of that
ideal action or may review the ideal actions. The objective is to maintain the ideal action
at the forefront of the minds of the staff.
Management by Wandering Around: The Manager walks around in the team and
watches people delivering ideal actions and ensures they are doing it correctly. If
required, the manager provides assistance and mentoring to correct them. He/she

Section 3. Ways of Improvements of Human Resources Management of PrJSC “Philip Morris Ukraine” 77
watches ideal actions acted upon and if anything appears wrong with an ideal action,
takes note so it can be revised.
Fun at Work: Last but not least, it is important to incorporate fun in the job. People must
enjoy what they are doing and have fun doing it.
Implementation of OPD theory begins with working from the minds of individuals. If
the mind of the individual is committed and guided, success will follow.
To implement OPD-SHRM at PMU, the company will have to perform the following
steps:
1. Identify the KPIs drawn from strategy that if each one achieved the strategy
achieved.
2. Identify the ideal actions derived from the KPIs.
3. Identify the ideal actions needed to integrate the activities in each role into the
team and the company (the business processes).
4. Ask each person choose work life success.
5. Ask each person if they agree that success in the job is delivery of ideal actions
to standard.
6. Have each person choose delivery of ideal actions to standard as their drive for
work life success.
7. Guide each person to adopt the ideal actions as their game plan of what they do
at work.
8. Encourage team leaders to support each person by keeping game plan top of
mind and by ensuring they are having fun while doing that which they need do
to be personally successful at work (Little, 2017).
Benefits from implementation:
Increased profits
People engagement is significantly improved.
Because individual success increases, satisfaction automatically follows.
Fun at work is ensured by the team manager.
A culture of professionalism and focus on performance is built.
People become self-responsible with their commitment for being successful.
Performance management becomes simpler and it improves talent identification.
OPD theory success mainly depends upon the team leaders/managers. A team leader is
required to identify factors and execute models which influence the people most and
help him/her achieve greatest team performance (Nel & Little, 2010).

Conclusions and Proposals 78
Conclusions and Proposals
Human resources management can be characterized as a set of actions aimed at
achieving the most effective use of employees to achieve enterprise goals and personal
goals. In the general sense, effectiveness of operation of the mechanism of human
resources management of any enterprise affects its performance, and, consequently,
profitability. That is why each organization should create its unique human resources
management system that simultaneously meets the basic requirements of the concept of
human resources management and is best suited to all the characteristics of both the
firm itself and its employees, and would ensure the most efficient use of available
resources, the most productive production or provision of services and, ultimately,
would contribute to the profitability of an enterprise.
At the current stage of society reforms in Ukraine, problem of effective use of human
resources has gained importance since solution of the problems, facing our society,
depends on a person and his/her internal motives. New forms of economic activity and
property provide great opportunities for formation and practical use of various forms of
personnel policy in order to increase personnel productivity. However, the mechanism
of personnel management is still underdeveloped. The challenges faced by HRM
include its every aspect: staffing planning, recruitment and selection, personnel training
and development, personnel motivation, compensation and benefits system, etc. Proper
solution of these challenges through establishment of right policies, practices and
processes, will help to increase the effectiveness of personnel and the overall company.
To identify the current challenges and to find proper solutions it is necessary to analyse
both, internal and external best practices. The best indicator for “weak spots” and
success of changes made is the assessment of effectiveness of HRM. HRM
effectiveness is a characteristic of quality and usefulness of human resources
management at an enterprise, its ability to provide a triple effect in the form of
economic benefits for an enterprise, improved organization of production (commerce)
and labor, and social benefits for employees.
There are hundreds of approaches to effectiveness assessing, so it is important to
understand that there is no one proper way, because each company is unique and its
challenges are also unique. Therefore, while choosing the indicators for assessment, it is
necessary to ensure that they cover the individual characteristics of an enterprise and its
personnel, and allow assessing the system under study in a sufficient manner. Usage of

Conclusions and Proposals 79
combination of different approaches increases the level of reliability of the results
received.
In this paper, I have discussed the theoretical foundations of HRM and their practical
application in international companies on the example of PrJSC “Philip Morris
Ukraine”, as well as suggested ways to improve the existing personnel system in the
enterprise system.
PMU demonstrates great results in optimization of its personnel and costs structure.
Educational level of company’s employees is rather high: 76% of employees studied in
educational institutions of 3rd-4th levels of accreditation. The age structure of the
personnel is characterized by high specific weight of young personnel (up to 30 years
old) – 43,99%. It enables the company to be innovative and progressive. Gender
distribution in the company is uneven. Women comprise 37% of the whole personnel.
However, it is close to company’s target of 40%.
The company has a very effective recruitment process, training and development tools
and approaches, and remuneration system. It is supported by the fact that personnel
turnover rate in 2013-2017 was below 2%, which is the natural renewal of personnel,
meaning that people are willing to stay in the company. At the same time, salary
payment prevails in the structure of the wage fund of Philip Morris Ukraine, while the
share of extra incentives in 2017 dropped sharply. Consequently, the management of the
company pays too little attention to bonus payments, other incentive and compensation
payments, which are not part of the main earnings of the company’s employees.
While an employee’s salary and bonuses are important, it doesn’t necessarily guarantee
happiness, loyalty or engagement. Non-material aspect of motivation plays an important
role in the hierarchy of priorities of modern employees. Effective non-financial
incentives for employees touch the emotions to make the employee feel appreciated and
valued. Therefore, it is crucial to pay attention to moral incentives, including those,
related to employees’ self-realization. The company does great job in this sphere,
however, I would give more opportunities to participate in the process of company
management. One of them could be participation in cross-functional projects, which
allows for development of communication and management skills, learning about other
departments and influencing their work with employee’s ideas and insights. Another
powerful tool is responsibility increase via empowerment. Empowered employees often
have higher job satisfaction because they know that their manager values and trusts
them. To motivate an employee it is also important to give him/her challenging tasks.

Conclusions and Proposals 80
People do not show preference for routine jobs. They are always ready to accept
challenging assignments. Challenge can be brought through mentoring, job redesigning
– job enlargement and job enrichment.
Besides all above mentioned factors, overall company’s performance also plays an
important role in human resources state. General effectiveness of the company is quite
high. It is a leader on Ukrainian tobacco market. It demonstrated extraordinary ability to
recover fast from market disturbances (price war) and did it faster than its main
competitors. It was due to effective costs and expenses optimization done by
management. At the same time, this situation demonstrated that company’s revenues are
very sensitive to price and illicit trade volumes. Therefore, it has to pay close attention
to its own pricing policies, tobacco market regulations in terms of excise and
minimum/maximum prices allowed, and governmental instruments against illicit trade.
The company adjusts its portfolio dynamically to meet the needs and tendencies of the
market. Thus, for example, it replaced its brand President with Philip Morris, which
allowed improving company’s performance in low-value segment. It shows that the
company is developing fast and adapting to new market requirements.
Company’s revenue grew over the investigated periods and is expected to grow further.
To drive it, PMU is increasing its export volumes and has a tendency to become an
“export-hub” for PMI in Eastern Europe region. At the same time, company’s imports
grow with much slower pace, because PMU tries to become less dependent on imported
semi-finished products and finished goods. It means the company is becoming more and
more autonomous in terms of production, which, in addition to that, becomes more cost
effective, due to lower local prices.
However, there are also some weak spots in company’s effectiveness management. The
company demonstrates low liquidity, which can become a problem in case of
unexpected need to pay-off short-term debts. In addition to that, the company has low
financing autonomy and most of its assets are currently financed through debt. Equity
capital and long-term borrowed funds are intended to finance non-current assets,
therefore, financing of current assets requires access to short-term debt. This leads to a
reduction in financial stability. In addition to that, company’s management of accounts
receivable and accounts payable is not very effective, which is tightly connected to its
liquidity. Therefore, this could be the starting point for improvement to ensure overall
financial stability increase.

Conclusions and Proposals 81
Despite the above mentioned weaknesses, the most important thing is how good the
company is in generating revenues. PMU demonstrated very high equity turnover ratio,
which means that despite accumulated losses and liabilities, the company is able to
effectively generate sales.
In terms of HRM system of the company, the basis assumption is that satisfied people
yield success and main HR’s effort goes into building satisfaction of its employees. The
importance of this factor is supported by the fact that for almost a quarter of all
employees the most important motivation for work is getting satisfaction from the job.
However, it is possible that the cause-effect relationship is understood vice-versa. It is
success that leads to satisfaction, not satisfaction that leads to success. Therefore, in
order to make employees satisfied it is necessary to make them succeed, which will also
be benefitial for the company. In order to change the strategy of HRM to this new one,
we suggest adopting Ongoing Professional Development Strategic Human Resources
Management (OPD-SHRM) theory practices in company’s HRM.
The psychological assumptions underlying OPD theory are that if a person knows what
has to be done to become successful, he/she can do it more efficiently, and that person’s
performace then depends on him/her choosing to be self-disciplined and commited.
OPD theory enables the team leader to identify the ideal actions based on KPIs or goals,
which are clear, concise and of the nature that accomplishing them ensures a maximum
chance of success.
The statistical method employed in this work explored the correlation between different
variables to measure OPD-SHRM elements and current HRM system effectiveness from
employees’ perspective. According to 55 participants of the survey, the results show
that an increase in OPD-SHRM elements has a positive impact on HRM effectiveness
measured via Employee Development and Engagement Index. This statistical analysis
of the survey predicts a maximum increase of 26% in Employee Development and
Engagement Index, which will lead up to 330% increase in company’s net profit and
350% increase in company’s labor productivity during the 3 years of OPD-SHRM
implementation. At the same time, in case the company keeps the strategy unchanged, it
is forecasted to incur losses in the upcoming years.
To implement OPD-SHRM at PMU, the company will have first to identify the KPIs,
based on strategy. Then identify ideal actions to fulfill every KPI. After that it will be
necessary to ensure all emplyees are commited to reach success and to perform ideal
actions for that. Then managers will have to guide each person to adopt the ideal actions
Conclusions and Proposals 82
as their game plan of what they do at work. It will also be necessary to support each
person by keeping game plan top of mind and by ensuring they enjoy the process of
reaching success.
In case the company applies the suggested improvements both to its current HRM
system and company’s financial management approaches, PMU will be able to increase
its labor productivity, through improvement in the quality of work and employees’
motivation. As a result, it will cause a positive effect on the profitability of the
company and its competitiveness.
References 83
References
1. АТ «Джей Ті Інтернешнл Компані Україна»: Річні звіти емінента. (2017).
Retrieved from http://jti.pat.ua/emitents/reports/year, last accessed: 10.04.2019
2. Базілінська О. Я. (2009). Фінансовий аналіз : теорія та практика. Київ:
Центр учбової літератури.
3. Балабанова Л. В., Сардак О. В. (2016). Управління персоналом. Київ: ВД
«Професіонал».
4. Барышникова Н. А. (2015). Экономика предприятия (2-е изд.). Mосква:
Издательство Юрайт.
5. Беляцкий Н. П. Управление персоналом. (2006). Минск: ЮНОНА.
6. Білоус О.Г., Панченко Є.Г. (2016). Менеджмент: конкурентоздатність і
ефективність. Київ: Знання.
7. Буряк П. Ю., Карпінський Б. А., Григор’єва М. І. (2004). Економіка праці й
соціально-трудові відносини. Київ: ЦУЛ.
8. Вяткин, В. Н. (2015). Финансовые решения в управлении бизнесом (4-е изд.).
Москва: Издательство Юрайт.
9. Гетьман О. О., Шаповал В. М. (2010). Економіка підприємства (2-ге вид.).
Київ: Центр учбової літератури.
10. Голубков С.В. (2016). Трансформационная программа как инструмент
внедрения модели обучения «70:20:10» в современных организациях.
Управление развитием персонала, №2. Retrieved from
https://grebennikon.ru/article-nwn9.html, last accessed: 15.03.2019
11. Дядечко Л.П. (2007). Економіка туристичного бізнесу. Київ: Центр учбової
літератури.
12. Економічний аналіз : Конспект лекцій (УДПСУ). Тема 5. (2015). Экономико-
правовая библиотека. Retrieved from http://www.vuzlib.net/ea_l/5.html, last
accessed: 13.08.2018
13. Ефимова О. В. (2013). Анализ финансовой отчетности. Москва:
Издательство «Омега-Л».
14. Завіновська Г. Т. (2001). Економіка праці. Київ: КНЕУ.
15. Загірняк, П. Г. (2015). Економіка підприємства. Кременчук : ТОВ
"Кременчуцька міська друкарня".
16. Іванілов О. С. (2009). Економіка підприємства. Київ: Центр учбової
літератури.

References 84
17. Кириченко О.А. (2002). Менеджмент зовнішньоекономічної діяльності (3-тє
вид.). Київ: Знання-Прес.
18. Кірейцев Г.Г. (2002). Фінансовий менеджмент. Київ: ЦУЛ.
19. Козак Н. (2000). Мотивація персоналу щодо досягнення стратегічних цілей
організації. Управление компанией, №13-14. Retrieved from
http://www.management.com.ua/hrm/hrm001.html, last accessed: 15.09.2018
20. Колот М.А. (2002). Мотивація персоналу. Київ: КНЕУ.
21. Крушельницька О.В. (2005). Управління персоналом (2-ге вид.). Київ:
«Кондор».
22. Лігоненко Л. О., Височин І. В. (2010). Економіка торговельного
підприємства. Київ: Київ. нац. торг.-екон. ун-т.
23. Мец В. О. (2015). Економічний аналіз фінансових результатів та
фінансового стану підприємства. Київ: КНЕУ.
24. Небава М. І. (2011). Економіка та організація виробничої діяльності
підприємства. Ч.2. Організація виробництва. Вінниця: ВНТУ.
25. Незамайкин, В. Н. (2015). Финансовый менеджмент. Москва: Издательство
Юрайт.
26. Новицкий А.Г. (1991). Население и трудовые ресурсы. Москва: Мысль.
27. Петюх В. М. (2017). Управління персоналом. Київ: КНЕУ.
28. ПрАТ «А/Т ТЮТЮНОВА КОМПАНIЯ «В.А.Т.-ПРИЛУКИ» : Інформація
про емітента. (2017). Retrieved from
http://www.bat.ua/group/sites/BAT_ALAJQW.nsf/vwPagesWebLive/DOAKXLA
Q, last accessed: 11.04.2019
29. ПрАТ «ІМПЕРІАЛ ТОБАККО ПРОДАКШН УКРАЇНА» : Річні звіти
емінента. (2017). Retrieved from http://imperial-tobacco.com.ua/about/report/,
last accessed: 10.04.2019
30. Прокопенко В. I. (1998). Трудове право України. Xарків: Фірма «Консум».
31. Федоренко В.Г., Діденко О.М., Руженський М.М., Іткін О.Ф. (2008).
Політична економія. Київ: Алерта.
32. Храмов В. О., Бовтрук А. П. (2001). Основи управління персоналом. Київ:
МАУП.
33. Шимко П. Д. (2016). Международный финансовый менеджмент (2-е изд.).
Москва: Издательство Юрайт.

References 85
34. Шитікова, Л. В. (2015). Теоретичні підходи до формування механізмів
управління персоналом підприємства. Держава та регіони. Серія:
Економіка та підприємництво, № 1, 130–133.
35. Школьник І.О. (2016). Фінансовий аналіз. Київ: «Центр учбової літератури».
36. Brivio, E. (2016). 10 key changes for tobacco products sold in the EU. European
Commission - Press release. Retrieved from http://europa.eu/rapid/press-
release_IP-16-1762_en.html, last accesed: 10.11.2018
37. Chaudhary, D. K. K. S., Dr Arun Kumar, Dr Alka. (2009). Statistics in
Management Studies (10th ed.). Meerut, India: Krishna Prakashan Media.
38. Du Plessis, A. J., Paine, M. S., & Botha, C. J. (2012). The role of human resource
practitioners maintaining sustainability in organisations: some empirical evidence
of expectations, challenges and trends. Contemporary Business Studies. Retrieved
from
http://www.researchgate.net/publication/224952514_Is_Outward_Bound_Trainin
g_(OBT)_An_Effective_Tool_for_Human_Resource_Development_(HRD)_A_C
ase_Study_from_Sri_Lanka/file/e0b4952da65b828931.pdf#page=16, last
accessed: 02.01.2019
39. Hatcher, L. (2003). Step-by-Step Basic Statistics Using SAS: Student Guide. SAS
Institute.
40. Little, G. (2013). OPD theory: a new way of thinking about HR. Employment
Today, (July 2013), 31–34.
41. Little, G. (2017). Modern Team Leadership: What to do to ensure the team has
greatest chance of greatest success. Auckland, N.Z.: Self Help Guides.
42. Lund Research Ltd. (2013). How to perform a Multiple Regression Analysis in
SPSS Statistics| Laerd Statistics. Retrieved from https://statistics.laerd.com/spss-
tutorials/multiple-regression-using-spssstatistics.Php, last accessed: 20.10.2018
43. Nel, P., & Little, G. (2010). Sustainable leadership: The fundamental solution to
lasting superior staff performance.
44. Nel, P., & Little, G. (2014). The Future of Organizational Design. Retrieved from
http://www.wbiworldconpro.com/uploads/new-zealand-conference-
2014/management/1392796500_428-Pieter.pdf, last accessed: 14.11.2018
45. OPD International Limited. (2014a). OPD Articles - What makes OPD unique and
different? Retrieved from http://www.opdcoach.com/article6.php, last accessed:
01.02.2019

References 86
46. OPD International Limited. (2014b). Strategic Human Resource Management
System for improving profits in business by improved alignment of staff behavior
with strategy and goals. Retrieved from http://www.opdcoach.com/, last accessed:
18.03.2019
47. Philip Morris International: Annual finance data. (2017). Retrieved from
https://www.pmi.com/, last accessed: 20.03.2019
48. Weinberg, S. L., & Abramowitz, S. K. (2002). Data Analysis for the Behavioral
Sciences Using SPSS. Cambridge University Press.

Appendices 87
Appendices
Appendix A
Appendix A.1 CODES
Date 01.01.2014
Company Private joint stock company “Philip Morris
Ukraine” EDRPOU 00383231
Territory Kharkiv Region, Komunist Village KOATUU 6325158502
Business legal
structure Joint stock company KOPFG 230
Type of
economic
activity
Manufacturing of tobacco products KVED 12.00
Average number
of employees: 1449
Address, phone: 62482 Komunist Village, 1 Polyovy Vyizd,
0577867700
Units of
measure: UAH th without decimal sign
Prepared (mark the respective cell with “v”):
under Ukrainian Accounting Standards v
under International Financial Reporting
Standards
Balance
(Statement of Financial Position)
as of 31.12.2013
Form #1
DKUD code 1801001
Assets Line
code
Opening
balance for
the period
Closing
balance for
the period
1 2 3 4
I. Non-surrent assets
Intangible assets 1000 13 568 11 748
initial value 1001 41 006 44 390
accumulated amortization 1002 -27 438 -32 642
Construction in progress 1005 168 551 56 380
Property, plant and equipment 1010 902 804 1 068 688
initial value 1011 1 502 871 1 719 469
depreciation 1012 -600 067 -650 781
Investment property 1015 0 0
initial value 1016 0 0
depreciation 1017 0 0
Long-term biological assets 1020 0 0
initial value 1021 0 0
accumulated amortization 1022 0 0

Appendices 88
Long-term capital investments:
accounted for under the equity method 1030 0 0
other financial investments 1035 0 0
Long-term receivables 1040 0 0
Deferred tax assets 1045 5 801 32 561
Goodwill 1050 0 0
Deferred acquisition costs 1060 0 0
Balance on centralized insurance reserve fund account 1065 0 0
Other non-current assets 1090 0 0
Total per section I 1095 1 090 724 1 169 377
II. Current assets
Inventories 1100 509 750 508 532
Production stock 1101 265 860 320 399
Work in progress 1102 15 380 19 911
Finished goods 1103 175 956 118 442
Merchandise 1104 52 554 49 780
Current biological assets 1110 0 0
Reinsurance deposits 1115 0 0
Promissory notes received 1120 0 0
Accounts receivable for products, goods, works,
services 1125 609 190 549 431
Accounts receivable for settlements:
on advance payments made 1130 36 418 54 870
with budget 1135 40 157 649 723
including income tax 1136 0 153 829
on accrued income settlements 1140 0 0
on intercompany settlements 1145 60 651 85 038
Other current receivables 1155 2 306 2 068
Current financial investments 1160 0 0
Cash and cash equivalents 1165 12 102 20 541
Cash 1166 2 1
Accounts in banks 1167 0 0
Deferred expenses 1170 623 13 072
Reinsurer's share in insurance reserves 1180 0 0
including:
long-term liabilities reserve 1181 0 0
claim reserves or due payment reserves 1182 0 0
unearned premium reserves 1183 0 0
other isurance reserves 1184 0 0
Other current assets 1190 4 007 5 185
Total per section II 1195 1 275 204 1 888 460
III. Non-current assets held for sales and disposal
groups 1200 164 164
Balance 1300 2 366 092 3 058 001

Appendices 89
Liabilities Line
code
Opening
balance for
the period
Closing
balance
for the
period
1 2 3 4
I. Equity
Registered (share) capital 1400 2 647 2 647
Contributions to unregistered share capital 1401 0 0
Revaluation surplus 1405 0 0
Additional capital 1410 43 949 43 949
Share premium 1411 0 0
Accumulated translation differences 1412 0 0
Reserve capital 1415 662 662
Retained earnings (accumulated deficit) 1420 1 096 380 1 301 519
Unpaid capital 1425 0 0
Withdrawn capital 1430 0 0
Other reserves 1435 0 0
Total per section I 1495 1 143 638 1 348 777
II. Long-term liabilities and provisions
Deferred tax liabilities 1500 0 0
Pension liabilities 1505 0 0
Long-term bank loans 1510 0 0
Other long-term liabilities 1515 34 335 21 809
Long-term provisions 1520 9 109 0
Long-term provision for personnel expenses 1521 0 0
Special-purpose financing 1525 0 0
Charity 1526 0 0
Insurance reserves 1530 0 0
including:
long-term liabilities reserve 1531 0 0
claim reserve or due payment reserve 1532 0 0
unearned premium reserve 1533 0 0
other insurance reserves 1534 0 0
Investment contracts 1535 0 0
Prize fund 1540 0 0
Jackpot payment reserve 1545 0 0
Total per section II 1595 43 444 21 809
IІІ. Current liabilities and provisions
Short-term bank loans 1600 130 000 1 137 320
Promissory notes issued 1605 0 0
Current accounts payable on:
long-term liabilities 1610 2 614 5 346
goods, works, services 1615 140 870 154 576
settlements with the budget 1620 703 262 123 201

Appendices 90
including income tax 1621 124705 0
insurance 1625 2 571 4 186
payroll 1630 5 010 12 004
advance payments 1635 32539 4
settlements with participants 1640 631 743
intercompany settlements 1645 134 969 205 377
insurance activities 1650 0 0
Current provisions 1660 16 703 21 498
Deferred commission income from reinsurers 1665 0 0
Deferred income 1670 0 0
Other current liabilities 1690 9 841 23 160
Total per section IІІ 1695 1 179 010 1 687 415
ІV. Liabilities related to non-current assets held for
sale and disposal groups 1700 0 0
Net asset value of non-state pension fund 1800 0 0
Balance 1900 2 366 092 3 058 001

Appendices 91
Appendix A.2
CODES
Date 01.01.2014
Company Private joint stock company “Philip Morris
Ukraine” EDRPOU 00383231
Statement of Financial Results
(Statement of Comprehensive Income)
for 2013
Form #2
I. Financial Results
DKUD code 1801003
Item Line code Reporting
period
Same
period of
previous
year
1 2 3 4
Net revenue from sales of products (goods, works,
services) 2000 5 675 111 5 257 087
Net insurance premiums earned 2010 0 0
Written premiums, gross amount 2011 0 0
Reinsured premiums 2012 0 0
Change in reserve of unearned premiums, gross
amount 2013 0 0
Change in share of reinsurers in unearned
premiums reserve 2014 0 0
Cost of sales (goods, works, services) 2050
-2 366
943 -2 363 925
Net losses incurred on insurance payments 2070 0 0
Gross:
profit 2090 3 308 168 2 893 162
loss 2095 0 0
Income (expense) from changes in long-term
liability reserves 2105 0 0
Income (expenses) from changes in other
insurance reserves 2110 0 0
Change in other insurance reserves, gross amount 2111 0 0
Change in share of reinsurers in other insurance
reserve 2112 0 0
Other operating income 2120 59 394 86 613
Income from changes in value of assets measured
at fair value 2121 0 0
Income from initial recognition of biological
assets and agricultural products 2122 0 0
Income from the use of tax-free funds 2123 0 0
Administrative expenses 2130 -386 006 -331 155
Selling and distribution expenses 2150 -612 155 -596 564
Other operating expenses 2180 -587 967 -535 158

Appendices 92
Expenses from changes in value of assets
measured at fair value 2181 0 0
Expenses from initial recognition of biological
assets and agricultural products 2182 0 0
Financial result from operating activities:
profit 2190 1 781 434 1 516 898
loss 2195 0 0
Income from equity investments 2200 0 0
Other financial income 2220 0 0
Other income 2240 0 0
Income from charity 2241 0 0
Finance costs 2250 -93 259 -19 330
Loss from equity method investment 2255 0 0
Other expenses 2270 -6 831 -3 670
Profit (loss) from the influence of inflation on
monetary items 2275 0 0
Financial results before tax:
profit 2290 1 681 344 1 493 898
loss 2295 0 0
Income taxes (expense)/benefit 2300 -379 844 -397 528
Income/(loss) from discontinued operations after
tax 2305 0 0
Net financial result:
profit 2350 1 301 500 1 096 370
loss 2355 0 0
II. Comprehensive income
Item Line code Reporting
period
Same
period of
previous
year
1 2 3 4
Revaluation of non-current assets 2400 0 0
Revaluation of financial instruments 2405 0 0
Accumulated translation differences 2410 0 0
Share of other comprehensive income of
associates and joint ventures 2415 0 0
Other comprehensive income 2445 0 0
Other comprehensive income before tax 2450 0 0
Income tax related to other comprehensive
income 2455 0 0
Other comprehensive income after tax 2460 0 0
Comprehensive income (sum lines 2350, 2355
and 2460) 2465 1 301 500 1 096 370

Appendices 93
III. Elements of operating expenses
Item Line code Reporting
period
Same
period of
previous
year
1 2 3 4
Cost of materials 2500 1 899 578 1 975 710
Labour costs 2505 321 986 228 255
Social security charges 2510 83 948 72 345
Depreciation 2515 117 202 108 792
Other operating expenses 2520 1 156 641 1 201 938
Total 2550 3 579 355 3 587 040
IV. Earnings per share
Item Line code Reporting
period
Same
period of
previous
year
1 2 3 4
Annual average number of ordinary shares 2600 2 005 018 2 005 018
Adjusted annual average number of ordinary
shares 2605 2 005 018 2 005 018
Net income (loss) per ordinary share 2610 649,12 546,81
Adjusted net income (loss) per ordinary share 2615 649,12 546,81
Dividends per ordinary share 2650 546,81 559,23

Appendices 94
Appendix A.3 CODES
Date 01.01.2015
Company Private joint stock company “Philip Morris
Ukraine” EDRPOU 00383231
Territory Kharkiv Region, Komunist Village KOATUU 6325158502
Business legal
structure Joint stock company KOPFG 230
Type of
economic
activity
Manufacturing of tobacco products KVED 12.00
Average number
of employees: 1379
Address, phone: 62482 Komunist Village, 1 Polyovy Vyizd,
0577867700
Units of
measure: UAH th without decimal sign
Prepared (mark the respective cell with “v”):
under Ukrainian Accounting Standards v
under International Financial Reporting
Standards
Balance
(Statement of Financial Position)
as of 31.12.2014
Form #1
DKUD code 1801001
Assets Line
code
Opening
balance for
the period
Closing
balance
for the
period
1 2 3 4
I. Non-surrent assets
Intangible assets 1000 11 748 8 614
initial value 1001 44 390 47 673
accumulated amortization 1002 -32 642 -39 059
Construction in progress 1005 56 380 176 153
Property, plant and equipment 1010 1 068 688 991 197
initial value 1011 1 719 469 1 753 228
depreciation 1012 -650 781 -762 031
Investment property 1015 0 0
initial value 1016 0 0
depreciation 1017 0 0
Long-term biological assets 1020 0 0
initial value 1021 0 0
accumulated amortization 1022 0 0
Long-term capital investments:
accounted for under the equity method 1030 0 0

Appendices 95
other financial investments 1035 0 0
Long-term receivables 1040 0 0
Deferred tax assets 1045 32 561 0
Goodwill 1050 0 0
Deferred acquisition costs 1060 0 0
Balance on centralized insurance reserve fund account 1065 0 0
Other non-current assets 1090 0 0
Total per section I 1095 1 169 377 1 175 964
II. Current assets
Inventories 1100 508 532 1 058 950
Production stock 1101 320 399 717 762
Work in progress 1102 19 911 21 584
Finished goods 1103 118 442 187 628
Merchandise 1104 49 780 131 976
Current biological assets 1110 0 0
Reinsurance deposits 1115 0 0
Promissory notes received 1120 0 0
Accounts receivable for products, goods, works, services 1125 549431 619697
Accounts receivable for settlements:
on advance payments made 1130 54 870 46 252
with budget 1135 649 723 949 812
including income tax 1136 153 829 317 105
on accrued income settlements 1140 0 0
on intercompany settlements 1145 85 038 242 703
Other current receivables 1155 2 068 8 360
Current financial investments 1160 0 0
Cash and cash equivalents 1165 20 541 22 513
Cash 1166 1 0
Accounts in banks 1167 0 0
Deferred expenses 1170 13 072 10 964
Reinsurer's share in insurance reserves 1180 0 0
including:
long-term liabilities reserve 1181 0 0
claim reserves or due payment reserves 1182 0 0
unearned premium reserves 1183 0 0
other isurance reserves 1184 0 0
Other current assets 1190 5 185 1 509
Total per section II 1195 1 888 460 2 960 760
III. Non-current assets held for sales and disposal
groups 1200 164 164
Balance 1300 3 058 001 4 136 888

Appendices 96
Liabilities Line
code
Opening
balance
for the
period
Closing
balance
for the
period
1 2 3 4
I. Equity
Registered (share) capital 1400 2 647 2 647
Contributions to unregistered share capital 1401 0 0
Revaluation surplus 1405 0 0
Additional capital 1410 43 949 43 929
Share premium 1411 0 0
Accumulated translation differences 1412 0 0
Reserve capital 1415 662 662
Retained earnings (accumulated deficit) 1420 1 301 519 746 326
Unpaid capital 1425 0 0
Withdrawn capital 1430 0 0
Other reserves 1435 0 0
Total per section I 1495 1 348 777 793 564
II. Long-term liabilities and provisions
Deferred tax liabilities 1500 0 37 244
Pension liabilities 1505 0 0
Long-term bank loans 1510 0 0
Other long-term liabilities 1515 21 809 17 911
Long-term provisions 1520 0 21 096
Long-term provision for personnel expenses 1521 0 0
Special-purpose financing 1525 0 0
Charity 1526 0 0
Insurance reserves 1530 0 0
including:
long-term liabilities reserve 1531 0 0
claim reserve or due payment reserve 1532 0 0
unearned premium reserve 1533 0 0
other insurance reserves 1534 0 0
Investment contracts 1535 0 0
Prize fund 1540 0 0
Jackpot payment reserve 1545 0 0
Total per section II 1595 21 809 76 251
IІІ. Current liabilities and provisions
Short-term bank loans 1600 1 137 320 1 513 549
Promissory notes issued 1605 0 0
Current accounts payable on:
long-term liabilities 1610 5346 2 820
goods, works, services 1615 154 576 258 426
settlements with the budget 1620 123 201 124 703

Appendices 97
including income tax 1621 0 0
insurance 1625 4 186 4 266
payroll 1630 12 004 4 920
advance payments 1635 4 2
settlements with participants 1640 743 340 726
intercompany settlements 1645 205 377 963 689
insurance activities 1650 0 0
Current provisions 1660 21 498 24 982
Deferred commission income from reinsurers 1665 0 0
Deferred income 1670 0 0
Other current liabilities 1690 23 160 28 990
Total per section IІІ 1695 1 687 415 3 267 073
ІV. Liabilities related to non-current assets held for
sale and disposal groups 1700 0 0
Net asset value of non-state pension fund 1800 0 0
Balance 1900 3 058 001 4 136 888

Appendices 98
Appendix A.4
CODES
Date 01.01.2015
Company Private joint stock company “Philip Morris
Ukraine” EDRPOU 00383231
Statement of Financial Results
(Statement of Comprehensive Income)
for 2014
Form #2
I. Financial Results
DKUD code 1801003
Item Line code Reporting
period
Same
period of
previous
year
1 2 3 4
Net revenue from sales of products (goods, works,
services) 2000 6 824 507 5 675 111
Net insurance premiums earned 2010 0 0
Written premiums, gross amount 2011 0 0
Reinsured premiums 2012 0 0
Change in reserve of unearned premiums, gross
amount 2013 0 0
Change in share of reinsurers in unearned
premiums reserve 2014 0 0
Cost of sales (goods, works, services) 2050 -3 584 905 -2 366 943
Net losses incurred on insurance payments 2070 0 0
Gross:
profit 2090 3 239 602 3 308 168
loss 2095 0 0
Income (expense) from changes in long-term
liability reserves 2105 0 0
Income (expenses) from changes in other
insurance reserves 2110 0 0
Change in other insurance reserves, gross amount 2111 0 0
Change in share of reinsurers in other insurance
reserve 2112 0 0
Other operating income 2120 132 782 59 394
Income from changes in value of assets measured
at fair value 2121 0 0
Income from initial recognition of biological
assets and agricultural products 2122 0 0
Income from the use of tax-free funds 2123 0 0
Administrative expenses 2130 -479 524 -386 006
Selling and distribution expenses 2150 -732 156 -612 155
Other operating expenses 2180 -863 280 -587 967

Appendices 99
Expenses from changes in value of assets
measured at fair value 2181 0 0
Expenses from initial recognition of biological
assets and agricultural products 2182 0 0
Financial result from operating activities:
profit 2190 1 297 424 1781434
loss 2195 0 0
Income from equity investments 2200 0 0
Other financial income 2220 0 0
Other income 2240 0 0
Income from charity 2241 0 0
Finance costs 2250 -199 453 -93 259
Loss from equity method investment 2255 0 0
Other expenses 2270 -18 731 -6 831
Profit (loss) from the influence of inflation on
monetary items 2275 0 0
Financial results before tax:
profit 2290 1 079 240 1681344
loss 2295 0 0
Income taxes (expense)/benefit 2300 -332 936 -379 844
Income/(loss) from discontinued operations after
tax 2305 0 0
Net financial result:
profit 2350 746 304 1301500
loss 2355 0 0
II. Comprehensive income
Item Line code Reporting
period
Same
period of
previous
year
1 2 3 4
Revaluation of non-current assets 2400 0 0
Revaluation of financial instruments 2405 0 0
Accumulated translation differences 2410 0 0
Share of other comprehensive income of
associates and joint ventures 2415 0 0
Other comprehensive income 2445 0 0
Other comprehensive income before tax 2450 0 0
Income tax related to other comprehensive
income 2455 0 0
Other comprehensive income after tax 2460 0 0
Comprehensive income (sum lines 2350, 2355
and 2460) 2465 746 304 1 301 500

Appendices 100
III. Elements of operating expenses
Item Line code Reporting
period
Same
period of
previous
year
1 2 3 4
Cost of materials 2500 2 754 261 1 899 578
Labour costs 2505 301 817 321 986
Social security charges 2510 84 961 83 948
Depreciation 2515 145 638 117 202
Other operating expenses 2520 1 755 406 1 156 641
Total 2550 5 042 083 3 579 355
IV. Earnings per share
Item Line code Reporting
period
Same
period of
previous
year
1 2 3 4
Annual average number of ordinary shares 2600 2 005 018 2 005 018
Adjusted annual average number of ordinary
shares 2605 2 005 018 2 005 018
Net income (loss) per ordinary share 2610 372,22 649,12
Adjusted net income (loss) per ordinary share 2615 372,22 649,12
Dividends per ordinary share 2650 649,12 546,81

Appendices 101
Appendix A.5 CODES
Date 01.01.2016
Company Private joint stock company “Philip Morris
Ukraine” EDRPOU 00383231
Territory Kharkiv Region, Komunist Village KOATUU 6325158502
Business legal
structure Joint stock company KOPFG 230
Type of
economic
activity
Manufacturing of tobacco products KVED 12.00
Average number
of employees: 1087
Address, phone: 62482 Komunist Village, 1 Polyovy Vyizd,
0577867700
Units of
measure: UAH th without decimal sign
Prepared (mark the respective cell with “v”):
under Ukrainian Accounting Standards v
under International Financial Reporting
Standards
Balance
(Statement of Financial Position)
as of 31.12.2015
Form #1
DKUD code 1801001
Assets Line
code
Opening
balance for
the period
Closing
balance
for the
period
1 2 3 4
I. Non-surrent assets
Intangible assets 1000 8 614 5 735
initial value 1001 47 673 48 598
accumulated amortization 1002 -39 059 -42 863
Construction in progress 1005 176 153 250 099
Property, plant and equipment 1010 991 197 960 540
initial value 1011 1 753 228 1 743 947
depreciation 1012 -762 031 -783 407
Investment property 1015 0 0
initial value 1016 0 0
depreciation 1017 0 0
Long-term biological assets 1020 0 0
initial value 1021 0 0
accumulated amortization 1022 0 0
Long-term capital investments:
accounted for under the equity method 1030 0 0

Appendices 102
other financial investments 1035 0 0
Long-term receivables 1040 0 0
Deferred tax assets 1045 0 0
Goodwill 1050 0 0
Deferred acquisition costs 1060 0 0
Balance on centralized insurance reserve fund account 1065 0 0
Other non-current assets 1090 0 0
Total per section I 1095 1 175 964 1 216 374
II. Current assets
Inventories 1100 1 058 950 939 781
Production stock 1101 717 762 691 382
Work in progress 1102 21 584 34 272
Finished goods 1103 187 628 205 238
Merchandise 1104 131 976 8 889
Current biological assets 1110 0 0
Reinsurance deposits 1115 0 0
Promissory notes received 1120 0 0
Accounts receivable for products, goods, works, services 1125 619 697 0
Accounts receivable for settlements:
on advance payments made 1130 46 252 38 680
with budget 1135 949 812 774 786
including income tax 1136 317 105 456 333
on accrued income settlements 1140 0 0
on intercompany settlements 1145 242 703 2 149 434
Other current receivables 1155 8 360 3 559
Current financial investments 1160 0 0
Cash and cash equivalents 1165 22 513 19 515
Cash 1166 0 0
Accounts in banks 1167 22 513 19 515
Deferred expenses 1170 10 964 1 555
Reinsurer's share in insurance reserves 1180 0 0
including:
long-term liabilities reserve 1181 0 0
claim reserves or due payment reserves 1182 0 0
unearned premium reserves 1183 0 0
other isurance reserves 1184 0 0
Other current assets 1190 1 509 3 440
Total per section II 1195 2 960 760 3 930 750
III. Non-current assets held for sales and disposal
groups 1200 164 40
Balance 1300 4 136 888 5 147 164

Appendices 103
Liabilities Line
code
Opening
balance for
the period
Closing
balance
for the
period
1 2 3 4
I. Equity
Registered (share) capital 1400 2 647 2 647
Contributions to unregistered share capital 1401 0 0
Revaluation surplus 1405 0 0
Additional capital 1410 43 929 43 919
Share premium 1411 0 0
Accumulated translation differences 1412 0 0
Reserve capital 1415 662 662
Retained earnings (accumulated deficit) 1420 746 326 751 766
Unpaid capital 1425 0 0
Withdrawn capital 1430 0 0
Other reserves 1435 0 0
Total per section I 1495 793 564 798 994
II. Long-term liabilities and provisions
Deferred tax liabilities 1500 37 244 21 959
Pension liabilities 1505 0 0
Long-term bank loans 1510 0 0
Other long-term liabilities 1515 17 911 2 754
Long-term provisions 1520 21 096 22 550
Long-term provision for personnel expenses 1521 0 0
Special-purpose financing 1525 0 0
Charity 1526 0 0
Insurance reserves 1530 0 0
including:
long-term liabilities reserve 1531 0 0
claim reserve or due payment reserve 1532 0 0
unearned premium reserve 1533 0 0
other insurance reserves 1534 0 0
Investment contracts 1535 0 0
Prize fund 1540 0 0
Jackpot payment reserve 1545 0 0
Total per section II 1595 76 251 47 263
IІІ. Current liabilities and provisions
Short-term bank loans 1600 1 513 549 1 800 799
Promissory notes issued 1605 0 0
Current accounts payable on:
long-term liabilities 1610 2 820 2 748
goods, works, services 1615 258 426 242 388
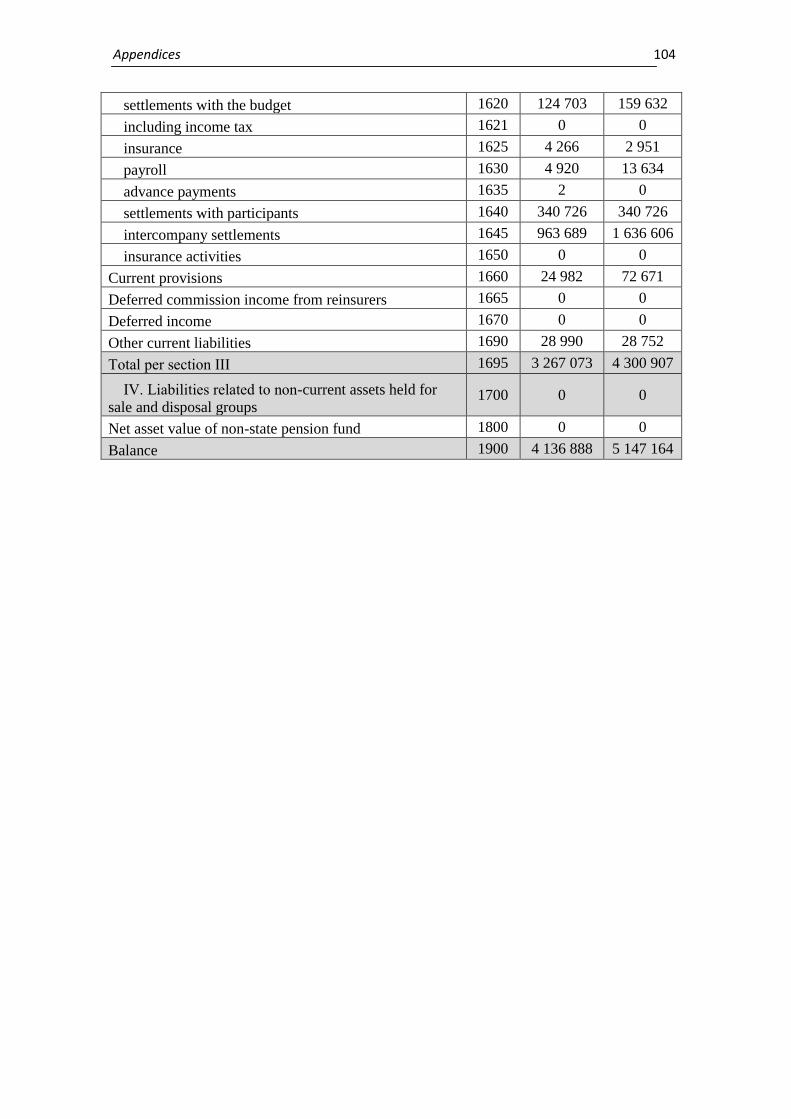
Appendices 104
settlements with the budget 1620 124 703 159 632
including income tax 1621 0 0
insurance 1625 4 266 2 951
payroll 1630 4 920 13 634
advance payments 1635 2 0
settlements with participants 1640 340 726 340 726
intercompany settlements 1645 963 689 1 636 606
insurance activities 1650 0 0
Current provisions 1660 24 982 72 671
Deferred commission income from reinsurers 1665 0 0
Deferred income 1670 0 0
Other current liabilities 1690 28 990 28 752
Total per section IІІ 1695 3 267 073 4 300 907
ІV. Liabilities related to non-current assets held for
sale and disposal groups 1700 0 0
Net asset value of non-state pension fund 1800 0 0
Balance 1900 4 136 888 5 147 164

Appendices 105
Appendix A.6
CODES
Date 01.01.2016
Company Private joint stock company “Philip Morris
Ukraine” EDRPOU 00383231
Statement of Financial Results
(Statement of Comprehensive Income)
for 2015
Form #2
I. Financial Results
DKUD code 1801003
Item Line code Reporting
period
Same
period of
previous
year
1 2 3 4
Net revenue from sales of products (goods, works,
services) 2000 8 891 769 6 824 507
Net insurance premiums earned 2010 0 0
Written premiums, gross amount 2011 0 0
Reinsured premiums 2012 0 0
Change in reserve of unearned premiums, gross
amount 2013 0 0
Change in share of reinsurers in unearned
premiums reserve 2014 0 0
Cost of sales (goods, works, services) 2050 -6 637 958 -3 584 905
Net losses incurred on insurance payments 2070 0 0
Gross:
profit 2090 2 253 811 3 239 602
loss 2095 0 0
Income (expense) from changes in long-term
liability reserves 2105 0 0
Income (expenses) from changes in other
insurance reserves 2110 0 0
Change in other insurance reserves, gross amount 2111 0 0
Change in share of reinsurers in other insurance
reserve 2112 0 0
Other operating income 2120 796 485 132 782
Income from changes in value of assets measured
at fair value 2121 0 0
Income from initial recognition of biological
assets and agricultural products 2122 0 0
Income from the use of tax-free funds 2123 0 0
Administrative expenses 2130 -569 234 -479 524
Selling and distribution expenses 2150 -669 198 -732 156
Other operating expenses 2180 -1 459 460 -863 280

Appendices 106
Expenses from changes in value of assets
measured at fair value 2181 0 0
Expenses from initial recognition of biological
assets and agricultural products 2182 0 0
Financial result from operating activities:
profit 2190 352 404 1 297 424
loss 2195 0 0
Income from equity investments 2200 0 0
Other financial income 2220 0 0
Other income 2240 0 0
Income from charity 2241 0 0
Finance costs 2250 -335 123 -199 453
Loss from equity method investment 2255 0 0
Other expenses 2270 -17 913 -18 731
Profit (loss) from the influence of inflation on
monetary items 2275 0 0
Financial results before tax:
profit 2290 0 1 079 240
loss 2295 -632 0
Income taxes (expense)/benefit 2300 6 072 -332 936
Income/(loss) from discontinued operations after
tax 2305 0 0
Net financial result:
profit 2350 5 440 746 304
loss 2355 0 0
II. Comprehensive income
Item Line code Reporting
period
Same
period of
previous
year
1 2 3 4
Revaluation of non-current assets 2400 0 0
Revaluation of financial instruments 2405 0 0
Accumulated translation differences 2410 0 0
Share of other comprehensive income of
associates and joint ventures 2415 0 0
Other comprehensive income 2445 0 0
Other comprehensive income before tax 2450 0 0
Income tax related to other comprehensive
income 2455 0 0
Other comprehensive income after tax 2460 0 0
Comprehensive income (sum lines 2350, 2355
and 2460) 2465 5 440 746 304

Appendices 107
III. Elements of operating expenses
Item Line code Reporting
period
Same
period of
previous
year
1 2 3 4
Cost of materials 2500 5 577 002 2 754 261
Labour costs 2505 320 013 301 817
Social security charges 2510 75 719 84 961
Depreciation 2515 148 908 145 638
Other operating expenses 2520 2520 2 241 022
Total 2550 8 362 664 5 042 083
IV. Earnings per share
Item Line code Reporting
period
Same
period of
previous
year
1 2 3 4
Annual average number of ordinary shares 2600 2 005 018 2 005 018
Adjusted annual average number of ordinary
shares 2605 2 005 018 2 005 018
Net income (loss) per ordinary share 2610 3 372
Adjusted net income (loss) per ordinary share 2615 3 372
Dividends per ordinary share 2650 0 649

Appendices 108
Appendix A.7
CODES
Date 01.01.2017
Company Private joint stock company “Philip Morris
Ukraine” EDRPOU 00383231
Territory Kharkiv Region, Komunist Village KOATUU 6325158502
Business legal
structure Joint stock company KOPFG 230
Type of
economic
activity
Manufacturing of tobacco products KVED 12.00
Average number
of employees: 1087
Address, phone: 62482 Komunist Village, 1 Polyovy Vyizd,
0577867700
Units of
measure: UAH th without decimal sign
Prepared (mark the respective cell with “v”):
under Ukrainian Accounting Standards v
under International Financial Reporting
Standards
Balance
(Statement of Financial Position)
as of 31.12.2016
Form #1
DKUD code 1801001
Assets Line
code
Opening
balance for
the period
Closing
balance
for the
period
1 2 3 4
I. Non-surrent assets
Intangible assets 1000 5 735 19 009
initial value 1001 48 598 68 795
accumulated amortization 1002 -42 863 -49 786
Construction in progress 1005 250 099 225 404
Property, plant and equipment 1010 960 540 1 013 504
initial value 1011 1 743 947 1 904 591
depreciation 1012 -783 407 -891 087
Investment property 1015 0 0
initial value 1016 0 0
depreciation 1017 0 0
Long-term biological assets 1020 0 0
initial value 1021 0 0
accumulated amortization 1022 0 0
Long-term capital investments:
accounted for under the equity method 1030 0 0
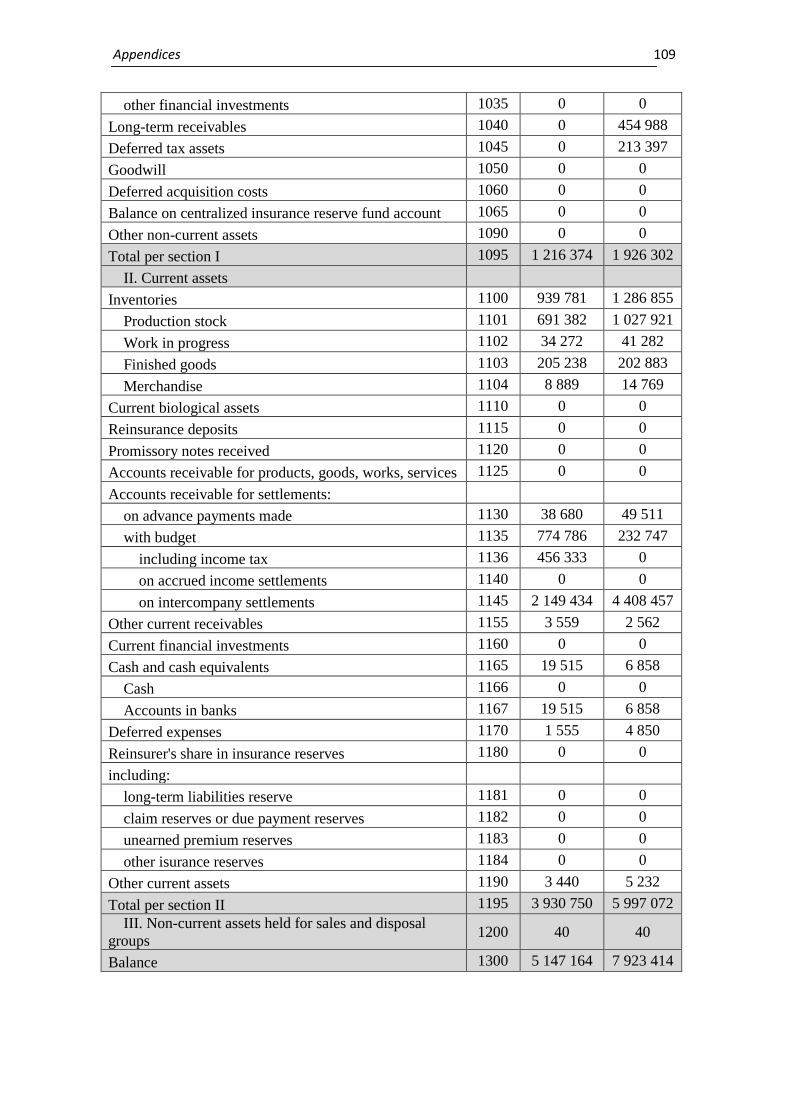
Appendices 109
other financial investments 1035 0 0
Long-term receivables 1040 0 454 988
Deferred tax assets 1045 0 213 397
Goodwill 1050 0 0
Deferred acquisition costs 1060 0 0
Balance on centralized insurance reserve fund account 1065 0 0
Other non-current assets 1090 0 0
Total per section I 1095 1 216 374 1 926 302
II. Current assets
Inventories 1100 939 781 1 286 855
Production stock 1101 691 382 1 027 921
Work in progress 1102 34 272 41 282
Finished goods 1103 205 238 202 883
Merchandise 1104 8 889 14 769
Current biological assets 1110 0 0
Reinsurance deposits 1115 0 0
Promissory notes received 1120 0 0
Accounts receivable for products, goods, works, services 1125 0 0
Accounts receivable for settlements:
on advance payments made 1130 38 680 49 511
with budget 1135 774 786 232 747
including income tax 1136 456 333 0
on accrued income settlements 1140 0 0
on intercompany settlements 1145 2 149 434 4 408 457
Other current receivables 1155 3 559 2 562
Current financial investments 1160 0 0
Cash and cash equivalents 1165 19 515 6 858
Cash 1166 0 0
Accounts in banks 1167 19 515 6 858
Deferred expenses 1170 1 555 4 850
Reinsurer's share in insurance reserves 1180 0 0
including:
long-term liabilities reserve 1181 0 0
claim reserves or due payment reserves 1182 0 0
unearned premium reserves 1183 0 0
other isurance reserves 1184 0 0
Other current assets 1190 3 440 5 232
Total per section II 1195 3 930 750 5 997 072
III. Non-current assets held for sales and disposal
groups 1200 40 40
Balance 1300 5 147 164 7 923 414
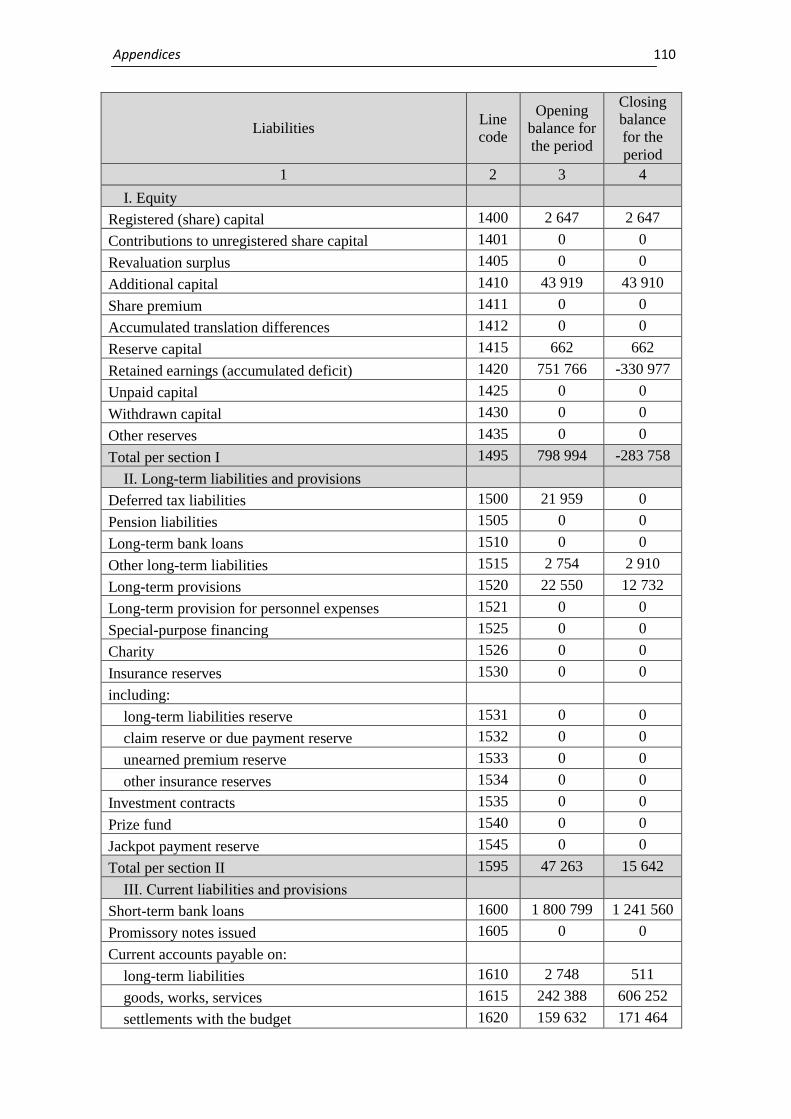
Appendices 110
Liabilities Line
code
Opening
balance for
the period
Closing
balance
for the
period
1 2 3 4
I. Equity
Registered (share) capital 1400 2 647 2 647
Contributions to unregistered share capital 1401 0 0
Revaluation surplus 1405 0 0
Additional capital 1410 43 919 43 910
Share premium 1411 0 0
Accumulated translation differences 1412 0 0
Reserve capital 1415 662 662
Retained earnings (accumulated deficit) 1420 751 766 -330 977
Unpaid capital 1425 0 0
Withdrawn capital 1430 0 0
Other reserves 1435 0 0
Total per section I 1495 798 994 -283 758
II. Long-term liabilities and provisions
Deferred tax liabilities 1500 21 959 0
Pension liabilities 1505 0 0
Long-term bank loans 1510 0 0
Other long-term liabilities 1515 2 754 2 910
Long-term provisions 1520 22 550 12 732
Long-term provision for personnel expenses 1521 0 0
Special-purpose financing 1525 0 0
Charity 1526 0 0
Insurance reserves 1530 0 0
including:
long-term liabilities reserve 1531 0 0
claim reserve or due payment reserve 1532 0 0
unearned premium reserve 1533 0 0
other insurance reserves 1534 0 0
Investment contracts 1535 0 0
Prize fund 1540 0 0
Jackpot payment reserve 1545 0 0
Total per section II 1595 47 263 15 642
IІІ. Current liabilities and provisions
Short-term bank loans 1600 1 800 799 1 241 560
Promissory notes issued 1605 0 0
Current accounts payable on:
long-term liabilities 1610 2 748 511
goods, works, services 1615 242 388 606 252
settlements with the budget 1620 159 632 171 464

Appendices 111
including income tax 1621 0 0
insurance 1625 2 951 2 158
payroll 1630 13 634 14 684
advance payments 1635 0 0
settlements with participants 1640 340 726 340 726
intercompany settlements 1645 1 636 606 3 130 562
insurance activities 1650 0 0
Current provisions 1660 0 0
Deferred commission income from reinsurers 1665 0 0
Deferred income 1670 0 0
Other current liabilities 1690 28 752 2 613 086
Total per section IІІ 1695 4 300 907 8 191 530
ІV. Liabilities related to non-current assets held for
sale and disposal groups 1700 0 0
Net asset value of non-state pension fund 1800 0 0
Balance 1900 5 147 164 7 923 414

Appendices 112
Appendix A.8
CODES
Date 01.01.2017
Company Private joint stock company “Philip Morris
Ukraine” EDRPOU 00383231
Statement of Financial Results
(Statement of Comprehensive Income)
for 2016
Form #2
I. Financial Results
DKUD code 1801003
Item Line
code
Reporting
period
Same
period of
previous
year
1 2 3 4
Net revenue from sales of products (goods, works,
services) 2000 8 719 818 8 891 769
Net insurance premiums earned 2010 0 0
Written premiums, gross amount 2011 0 0
Reinsured premiums 2012 0 0
Change in reserve of unearned premiums, gross
amount 2013 0 0
Change in share of reinsurers in unearned
premiums reserve 2014 0 0
Cost of sales (goods, works, services) 2050 -8 379 803 -6 637 958
Net losses incurred on insurance payments 2070 0 0
Gross:
profit 2090 340 015 2 253 811
loss 2095 0 0
Income (expense) from changes in long-term
liability reserves 2105 0 0
Income (expenses) from changes in other
insurance reserves 2110 0 0
Change in other insurance reserves, gross amount 2111 0 0
Change in share of reinsurers in other insurance
reserve 2112 0 0
Other operating income 2120 393 555 796 485
Income from changes in value of assets measured
at fair value 2121 0 0
Income from initial recognition of biological
assets and agricultural products 2122 0 0
Income from the use of tax-free funds 2123 0 0
Administrative expenses 2130 -449 073 -569 234
Selling and distribution expenses 2150 -251 034 -669 198
Other operating expenses 2180 -831 788 -1 459 460

Appendices 113
Expenses from changes in value of assets
measured at fair value 2181 0 0
Expenses from initial recognition of biological
assets and agricultural products 2182 0 0
Financial result from operating activities:
profit 2190 0 352 404
loss 2195 -798 325 0
Income from equity investments 2200 0 0
Other financial income 2220 0 0
Other income 2240 70 117 0
Income from charity 2241 0 0
Finance costs 2250 -385 532 -335 123
Loss from equity method investment 2255 0 0
Other expenses 2270 -205 965 -17 913
Profit (loss) from the influence of inflation on
monetary items 2275 0 0
Financial results before tax:
profit 2290 0 0
loss 2295 -1 319 705 -632
Income taxes (expense)/benefit 2300 236 962 6 072
Income/(loss) from discontinued operations after
tax 2305 0 0
Net financial result:
profit 2350 0 5 440
loss 2355 -1 082 743 0
II. Comprehensive income
Item Line
code
Reporting
period
Same
period of
previous
year
1 2 3 4
Revaluation of non-current assets 2400 0 0
Revaluation of financial instruments 2405 0 0
Accumulated translation differences 2410 0 0
Share of other comprehensive income of
associates and joint ventures 2415 0 0
Other comprehensive income 2445 0 0
Other comprehensive income before tax 2450 0 0
Income tax related to other comprehensive
income 2455 0 0
Other comprehensive income after tax 2460 0 0
Comprehensive income (sum lines 2350, 2355
and 2460) 2465 -1 082 743 5 440
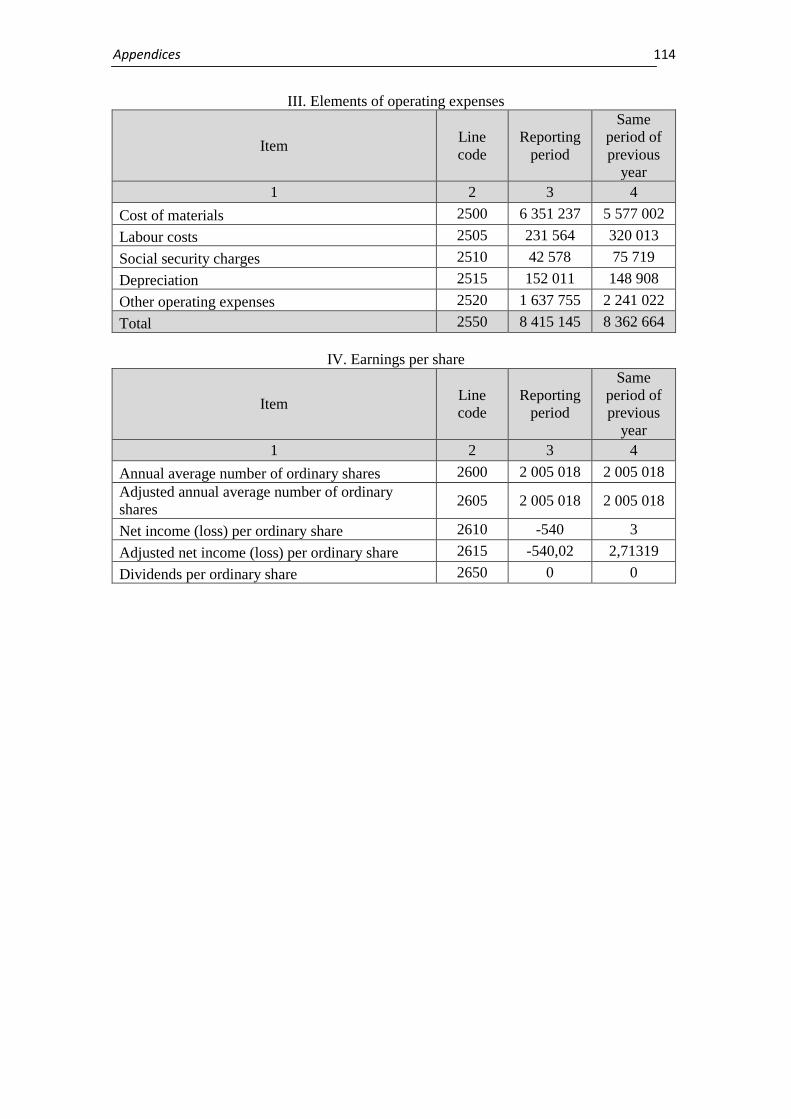
Appendices 114
III. Elements of operating expenses
Item Line
code
Reporting
period
Same
period of
previous
year
1 2 3 4
Cost of materials 2500 6 351 237 5 577 002
Labour costs 2505 231 564 320 013
Social security charges 2510 42 578 75 719
Depreciation 2515 152 011 148 908
Other operating expenses 2520 1 637 755 2 241 022
Total 2550 8 415 145 8 362 664
IV. Earnings per share
Item Line
code
Reporting
period
Same
period of
previous
year
1 2 3 4
Annual average number of ordinary shares 2600 2 005 018 2 005 018
Adjusted annual average number of ordinary
shares 2605 2 005 018 2 005 018
Net income (loss) per ordinary share 2610 -540 3
Adjusted net income (loss) per ordinary share 2615 -540,02 2,71319
Dividends per ordinary share 2650 0 0

Appendices 115
Appendix A.9
CODES
Date 01.01.2018
Company Private joint stock company “Philip Morris
Ukraine” EDRPOU 00383231
Territory Kharkiv Region, Komunist Village KOATUU 6325158502
Business legal
structure Joint stock company KOPFG 230
Type of
economic
activity
Manufacturing of tobacco products KVED 12.00
Average number
of employees: 1087
Address, phone: 62482 Dokuchaievs'ke Village, 1 Polyovy
Vyizd, 0577867700
Units of
measure: UAH th without decimal sign
Prepared (mark the respective cell with “v”):
under Ukrainian Accounting Standards v
under International Financial Reporting
Standards
Balance
(Statement of Financial Position)
as of 31.12.2017
Form #1
DKUD code 1801001
Assets Line
code
Opening
balance
for the
period
Closing
balance for
the period
1 2 3 4
I. Non-surrent assets
Intangible assets 1000 19 009 12 215
initial value 1001 68 795 69 401
accumulated amortization 1002 -49 786 -57 186
Construction in progress 1005 225 404 354 670
Property, plant and equipment 1010 1 013 504 1 220 379
initial value 1011 1 904 591 2 276 076
depreciation 1012 -891 087 -1 055 697
Investment property 1015 0 0
initial value 1016 0 0
depreciation 1017 0 0
Long-term biological assets 1020 0 0
initial value 1021 0 0
accumulated amortization 1022 0 0
Long-term capital investments:
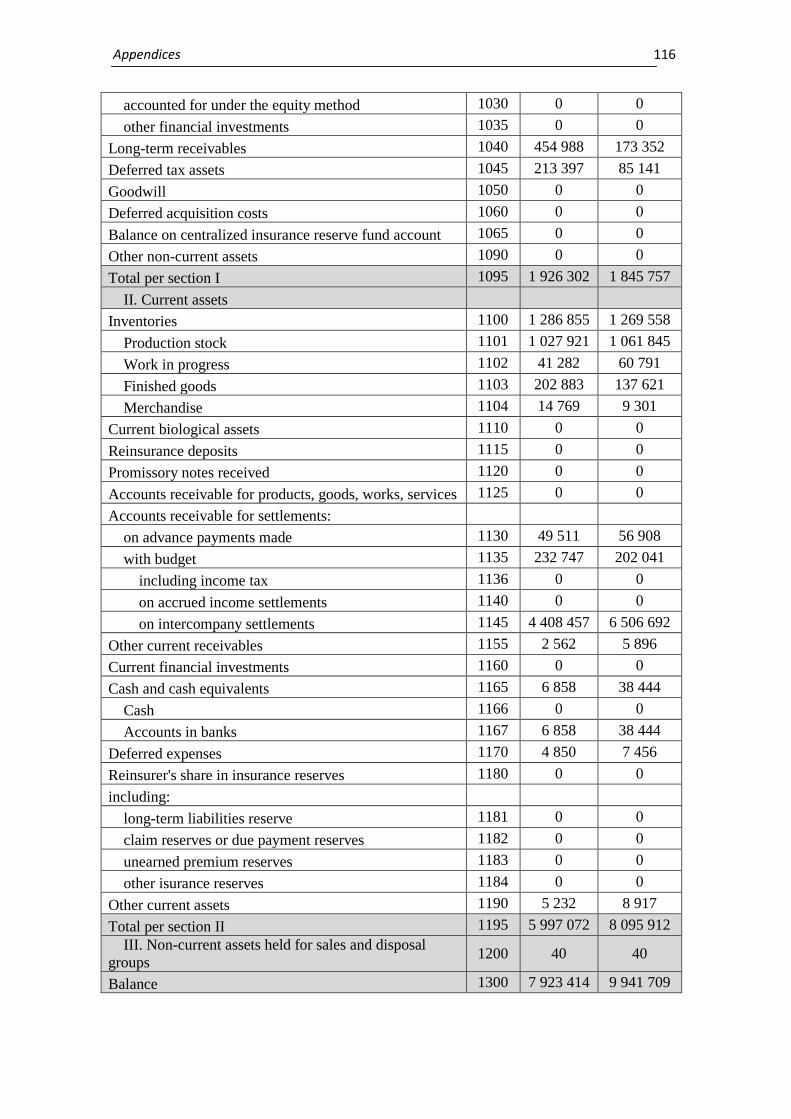
Appendices 116
accounted for under the equity method 1030 0 0
other financial investments 1035 0 0
Long-term receivables 1040 454 988 173 352
Deferred tax assets 1045 213 397 85 141
Goodwill 1050 0 0
Deferred acquisition costs 1060 0 0
Balance on centralized insurance reserve fund account 1065 0 0
Other non-current assets 1090 0 0
Total per section I 1095 1 926 302 1 845 757
II. Current assets
Inventories 1100 1 286 855 1 269 558
Production stock 1101 1 027 921 1 061 845
Work in progress 1102 41 282 60 791
Finished goods 1103 202 883 137 621
Merchandise 1104 14 769 9 301
Current biological assets 1110 0 0
Reinsurance deposits 1115 0 0
Promissory notes received 1120 0 0
Accounts receivable for products, goods, works, services 1125 0 0
Accounts receivable for settlements:
on advance payments made 1130 49 511 56 908
with budget 1135 232 747 202 041
including income tax 1136 0 0
on accrued income settlements 1140 0 0
on intercompany settlements 1145 4 408 457 6 506 692
Other current receivables 1155 2 562 5 896
Current financial investments 1160 0 0
Cash and cash equivalents 1165 6 858 38 444
Cash 1166 0 0
Accounts in banks 1167 6 858 38 444
Deferred expenses 1170 4 850 7 456
Reinsurer's share in insurance reserves 1180 0 0
including:
long-term liabilities reserve 1181 0 0
claim reserves or due payment reserves 1182 0 0
unearned premium reserves 1183 0 0
other isurance reserves 1184 0 0
Other current assets 1190 5 232 8 917
Total per section II 1195 5 997 072 8 095 912
III. Non-current assets held for sales and disposal
groups 1200 40 40
Balance 1300 7 923 414 9 941 709

Appendices 117
Liabilities Line
code
Opening
balance
for the
period
Closing
balance for
the period
1 2 3 4
I. Equity
Registered (share) capital 1400 2 647 2 647
Contributions to unregistered share capital 1401 0 0
Revaluation surplus 1405 0 0
Additional capital 1410 43 910 43 900
Share premium 1411 0 0
Accumulated translation differences 1412 0 0
Reserve capital 1415 662 662
Retained earnings (accumulated deficit) 1420 -330 977 296 329
Unpaid capital 1425 0 0
Withdrawn capital 1430 0 0
Other reserves 1435 0 0
Total per section I 1495 -283 758 343 538
II. Long-term liabilities and provisions
Deferred tax liabilities 1500 0 0
Pension liabilities 1505 0 0
Long-term bank loans 1510 0 0
Other long-term liabilities 1515 2 910 1 500
Long-term provisions 1520 12 732 14 473
Long-term provision for personnel expenses 1521 0 0
Special-purpose financing 1525 0 0
Charity 1526 0 0
Insurance reserves 1530 0 0
including:
long-term liabilities reserve 1531 0 0
claim reserve or due payment reserve 1532 0 0
unearned premium reserve 1533 0 0
other insurance reserves 1534 0 0
Investment contracts 1535 0 0
Prize fund 1540 0 0
Jackpot payment reserve 1545 0 0
Total per section II 1595 15 642 15 973
IІІ. Current liabilities and provisions
Short-term bank loans 1600 1 241 560 1 655 131
Promissory notes issued 1605 0 0
Current accounts payable on:
long-term liabilities 1610 511 0
goods, works, services 1615 606 252 732 318

Appendices 118
settlements with the budget 1620 171 464 185 493
including income tax 1621 0 0
insurance 1625 2 158 2 150
payroll 1630 14 684 8 260
advance payments 1635 0 1
settlements with participants 1640 340 726 340 726
intercompany settlements 1645 3 130 562 3 811 961
insurance activities 1650 0 0
Current provisions 1660 70 527 24 740
Deferred commission income from reinsurers 1665 0 0
Deferred income 1670 0 0
Other current liabilities 1690 2 613 086 2 821 418
Total per section IІІ 1695 8 191 530 9 582 198
ІV. Liabilities related to non-current assets held for
sale and disposal groups 1700 0 0
Net asset value of non-state pension fund 1800 0 0
Balance 1900 7 923 414 9 941 709

Appendices 119
Appendix A.10
CODES
Date 01.01.2018
Company Private joint stock company “Philip Morris
Ukraine” EDRPOU 00383231
Statement of Financial Results
(Statement of Comprehensive Income)
for 2017
Form #2
I. Financial Results
DKUD code 1801003
Item Line
code
Reporting
period
Same
period of
previous
year
1 2 3 4
Net revenue from sales of products (goods, works,
services) 2000 10 690 885 8 719 818
Net insurance premiums earned 2010 0 0
Written premiums, gross amount 2011 0 0
Reinsured premiums 2012 0 0
Change in reserve of unearned premiums, gross
amount 2013 0 0
Change in share of reinsurers in unearned
premiums reserve 2014 0 0
Cost of sales (goods, works, services) 2050 -7 823 573 -8 379 803
Net losses incurred on insurance payments 2070 0 0
Gross:
profit 2090 2 867 312 340 015
loss 2095 0 0
Income (expense) from changes in long-term
liability reserves 2105 0 0
Income (expenses) from changes in other
insurance reserves 2110 0 0
Change in other insurance reserves, gross amount 2111 0 0
Change in share of reinsurers in other insurance
reserve 2112 0 0
Other operating income 2120 400 135 393 555
Income from changes in value of assets measured
at fair value 2121 0 0
Income from initial recognition of biological
assets and agricultural products 2122 0 0
Income from the use of tax-free funds 2123 0 0
Administrative expenses 2130 -527 833 -449 073
Selling and distribution expenses 2150 -266 509 -251 034
Other operating expenses 2180 -1 423 168 -831 788

Appendices 120
Expenses from changes in value of assets
measured at fair value 2181 0 0
Expenses from initial recognition of biological
assets and agricultural products 2182 0 0
Financial result from operating activities:
profit 2190 1 049 937 0
loss 2195 0 -798 325
Income from equity investments 2200 0 0
Other financial income 2220 0 0
Other income 2240 108 029 70 117
Income from charity 2241 0 0
Finance costs 2250 -186 654 -385 532
Loss from equity method investment 2255 0 0
Other expenses 2270 -215 750 -205 965
Profit (loss) from the influence of inflation on
monetary items 2275 0 0
Financial results before tax:
profit 2290 755 562 0
loss 2295 0 -1 319 705
Income taxes (expense)/benefit 2300 -128 256 236 962
Income/(loss) from discontinued operations after
tax 2305 0 0
Net financial result:
profit 2350 627 306 0
loss 2355 0 -1 082 743
II. Comprehensive income
Item Line
code
Reporting
period
Same
period of
previous
year
1 2 3 4
Revaluation of non-current assets 2400 0 0
Revaluation of financial instruments 2405 0 0
Accumulated translation differences 2410 0 0
Share of other comprehensive income of
associates and joint ventures 2415 0 0
Other comprehensive income 2445 0 0
Other comprehensive income before tax 2450 0 0
Income tax related to other comprehensive
income 2455 0 0
Other comprehensive income after tax 2460 0 0
Comprehensive income (sum lines 2350, 2355
and 2460) 2465 627 306 -1 082 743

Appendices 121
III. Elements of operating expenses
Item Line
code
Reporting
period
Same
period of
previous
year
1 2 3 4
Cost of materials 2500 6 996 461 6 351 237
Labour costs 2505 257 298 231 564
Social security charges 2510 48 392 42 578
Depreciation 2515 188 583 152 011
Other operating expenses 2520 2 142 280 1 637 755
Total 2550 9 633 014 8 415 145
IV. Earnings per share
Item Line
code
Reporting
period
Same
period of
previous
year
1 2 3 4
Annual average number of ordinary shares 2600 2 005 018 2 005 018
Adjusted annual average number of ordinary
shares 2605 2 005 018 2 005 018
Net income (loss) per ordinary share 2610 312,86801 -540,0166
Adjusted net income (loss) per ordinary share 2615 312,86801 -540,0166
Dividends per ordinary share 2650 0 0

Appendices 122
Appendix B
Fig. B.1. Gross profit margin of PMU, BAT, IMP and JTI in 2013-2017
Fig. B.2. Operating profit margin of PMU, BAT, IMP and JTI in 2013-2017
Fig. B.3. Net profit margin of PMU, BAT, IMP and JTI in 2013-2017
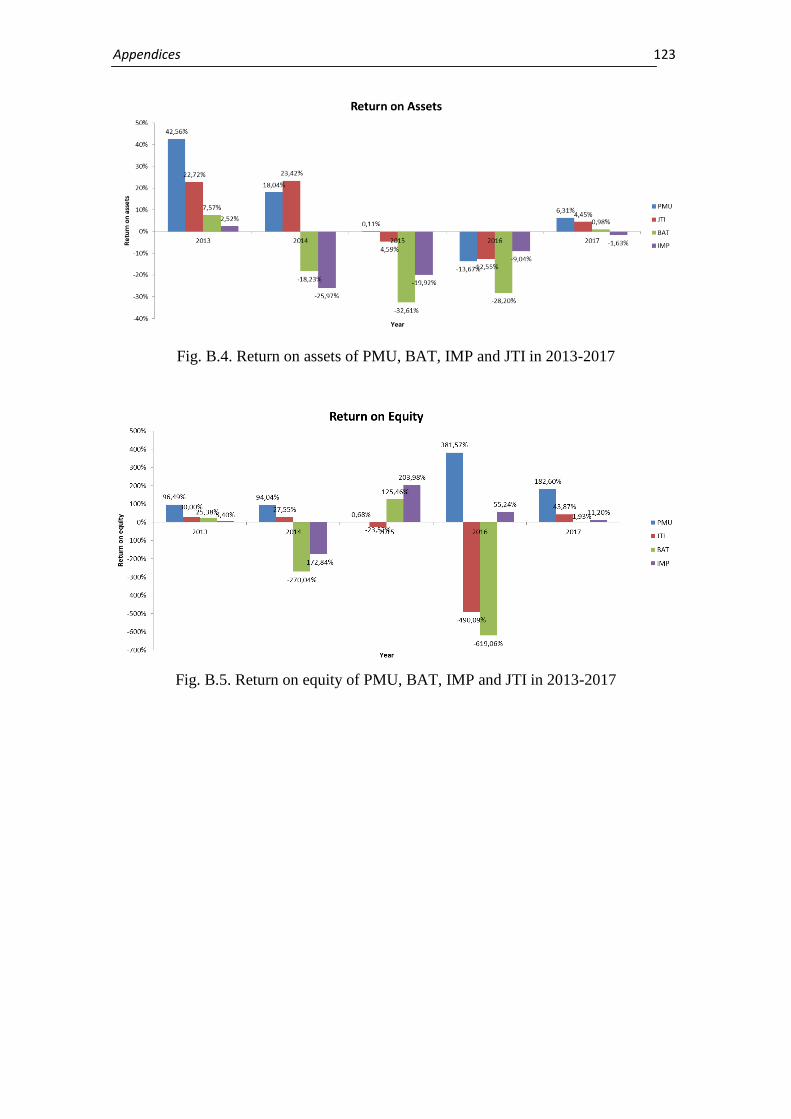
Appendices 123
Fig. B.4. Return on assets of PMU, BAT, IMP and JTI in 2013-2017
Fig. B.5. Return on equity of PMU, BAT, IMP and JTI in 2013-2017

Appendices 124
Appendix C
ІТ Department Director
Commercial Function Manager
Project Team Leader
Analyst 1
...
Analyst n
Technical Support Team
Leader
Analyst 1
...
Analyst n
Corporate Function Manager
Project Team Leader
Analyst 1
...
Analyst n
Technical Support Team
Leader
Analyst 1
...
Analyst n
Customer Service Manager
Technical Support Team
Leader
Analyst 1
...
Analyst n
Call-center Team Leader
Analyst 1
...
Analyst n

Appendices 125
Appendix D
Survey Questions
1. If I continue to perform well, I will get ahead in this company
a. Strongly Agree
b. Agree
c. Neither Agree Nor Disagree
d. Disagree
e. Strongly Disagree
2. I believe I am paid fairly
a. Strongly Agree
b. Agree
c. Neither Agree Nor Disagree
d. Disagree
e. Strongly Disagree
3. I receive useful coaching and feedback that helps me improve my performance
a. Strongly Agree
b. Agree
c. Neither Agree Nor Disagree
d. Disagree
e. Strongly Disagree
4. I think there is a clear link between job performance and pay at my company
a. Strongly Agree
b. Agree
c. Neither Agree Nor Disagree
d. Disagree
e. Strongly Disagree
5. Management provides recognition for performance when I perform above and
beyond my job responsibilities
a. Strongly Agree
b. Agree
c. Neither Agree Nor Disagree
d. Disagree
e. Strongly Disagree
6. I understand how my performance is measured and evaluated

Appendices 126
a. Strongly Agree
b. Agree
c. Neither Agree Nor Disagree
d. Disagree
e. Strongly Disagree
7. Key performance activities that are relevant to my role are clear to me for me to
be successful in my role
a. Yes
b. May be
c. No
8. How often does your manager give you ‘on the spot’ social rewarding?
a. Often
b. Sometimes
c. Seldom
d. Never
9. How realistic are the expectations of your manager from you?
a. Realistic
b. To some extent realistic
c. Mostly not realistic
d. Not realistic at all
10. I know how to be successful in my current role
a. Yes
b. May be
c. No
11. How often does your supervisor do one on one meeting with you?
a. Weekly
b. Fortnightly
c. Monthly
d. More rare than monthly

Appendices 127
Appendix E
Answers to survey
Respondent #
If I continue to
perform well, I
will get ahead in
this company
I believe I am
paid fairly
I receive useful
coaching and
feedback that
helps me
improve my
performance
I think there is
a clear link
between job
performance
and pay at my
company
Management
provides
recognition for
performance
when I perform
above and
beyond my job
responsibilities
I understand
how my
performance is
measured and
evaluated
Key
performance
activities that
are relevant to
my role are
clear to me for
me to be
successful in my
role
How often does
your manager
give you ‘on the
spot’ social
rewarding?
How realistic
are the
expectations of
your manager
from you?
I know how to
be successful in
my current role
How often does
your supervisor
do one on one
meeting with
you?
Employee
Development
and
Engagement
Index
1 5 5 5 5 4 5 4 4 4 4 4 4,83
2 5 5 5 5 4 5 3 4 4 4 2 4,83
3 5 5 5 5 4 5 3 4 4 4 3 4,83
4 5 4 5 5 4 5 4 4 4 4 3 4,67
5 5 5 5 5 5 5 3 4 4 4 4 5,00
6 5 5 5 5 5 5 3 4 3 4 4 5,00
7 5 5 5 5 5 5 3 4 3 3 4 5,00
8 5 5 5 5 5 5 4 4 4 4 4 5,00
9 5 5 5 5 5 5 4 4 4 4 4 5,00
10 5 5 5 5 5 5 4 3 1 3 4 5,00
11 5 4 5 5 5 5 4 4 4 4 1 4,83
12 5 4 5 5 5 5 4 4 4 4 4 4,83
13 5 4 5 5 5 5 4 4 4 4 3 4,83
14 4 4 5 5 5 5 3 4 4 3 4 4,67
15 4 3 5 4 4 5 3 4 3 4 4 4,17
16 4 4 5 4 4 5 2 4 3 3 2 4,33
17 4 4 4 4 4 5 4 3 3 3 2 4,17
18 4 4 4 4 4 5 3 3 4 4 4 4,17
19 4 4 4 4 4 5 4 4 4 4 4 4,17
20 4 4 4 4 4 5 4 4 4 4 2 4,17
21 4 4 4 4 4 4 4 4 4 3 4 4,00
22 4 4 4 4 4 4 4 3 4 4 4 4,00
23 4 4 4 4 4 4 4 3 4 4 4 4,00
24 4 4 4 4 4 4 4 3 1 4 2 4,00
25 4 4 4 4 4 4 3 4 3 3 3 4,00
26 4 4 4 4 4 4 4 3 3 3 3 4,00
27 4 4 4 4 4 4 3 2 1 4 2 4,00
28 4 4 4 4 4 4 4 3 4 4 4 4,00
29 4 4 4 4 4 4 3 3 4 4 2 4,00
30 4 4 4 4 4 4 3 4 4 4 3 4,00
31 4 4 4 4 4 4 4 3 4 2 3 4,00
32 4 4 4 4 3 4 2 3 4 4 3 3,83
33 3 4 4 3 3 4 2 4 3 4 4 3,50
34 3 4 4 3 3 4 2 4 4 3 4 3,50
35 3 4 4 3 3 4 4 3 3 4 4 3,50
36 3 4 4 3 3 4 3 3 4 3 2 3,50
37 3 4 4 3 3 4 3 3 4 3 2 3,50
38 3 4 3 3 3 4 2 3 4 4 2 3,33
39 3 3 3 3 3 4 4 4 2 4 2 3,17
40 3 3 3 3 3 4 4 4 4 3 2 3,17
41 3 3 3 3 3 3 4 3 2 2 3 3,00
42 3 3 3 3 3 3 3 2 2 3 2 3,00
43 3 3 3 3 3 3 4 2 1 2 3 3,00
44 3 3 3 3 4 3 3 2 2 3 1 3,17
45 3 3 1 3 4 3 3 2 4 3 2 2,83
46 2 2 3 3 4 3 4 2 3 3 4 2,83
47 2 2 3 2 3 3 2 3 4 3 2 2,50
48 2 2 3 2 1 3 4 2 1 2 3 2,17
49 2 2 2 2 2 3 3 3 2 3 3 2,17
50 2 2 2 2 2 3 3 3 2 2 3 2,17
51 2 1 2 2 2 3 4 1 1 2 1 2,00
52 2 1 2 1 1 3 2 1 1 2 3 1,67
53 2 2 1 1 2 2 2 2 1 2 2 1,67
54 1 2 1 1 2 2 2 2 1 2 1 1,50
55 1 2 3 1 2 1 2 1 2 3 4 1,67

Appendices 128
Appendix F
Numerical coding for variables values
Answers Numerical
Equivalent
Strongly Agree
Agree
Neither Agree Nor Disagree
Disagree
Strongly Disagree
5
4
3
2
1
Yes
May be
No
4
3
2
Often
Sometimes
Seldom
Never
4
3
2
1
Realistic
To some extent realistic
Mostly not realistic
Not realistic at all
4
3
2
1
Weekly
Fortnightly
Monthly
More rare than monthly
4
3
2
1