modalexperimentonstructuralconditionmonitoringusing...
TRANSCRIPT

Hindawi Publishing CorporationAdvances in Acoustics and VibrationVolume 2012, Article ID 327135, 6 pagesdoi:10.1155/2012/327135
Research Article
Modal Experiment on Structural Condition Monitoring UsingCumulative Harmonic Analysis
Yoshinori Takahashi,1 Satoru Goto,2 and Mikio Tohyama2
1 Tokyo Metropolitan College of Industrial Technology, 8-17-1 Minami Senju, Arakawa-ku, Tokyo 116-0003, Japan2 Graduate School of Fundamental Science and Engineering, Waseda University, 3-4-1 Okubo Shinjyuku-ku, Tokyo 1698555, Japan
Correspondence should be addressed to Yoshinori Takahashi, [email protected]
Received 3 July 2011; Accepted 23 November 2011
Academic Editor: Luc Gaudiller
Copyright © 2012 Yoshinori Takahashi et al. This is an open access article distributed under the Creative Commons AttributionLicense, which permits unrestricted use, distribution, and reproduction in any medium, provided the original work is properlycited.
This paper describes a cumulative harmonic analysis (CHA) that replaces the stepwise time window function of Berman andFincham’s cumulative spectral analysis with a spectral accumulation function, thereby enabling a new structural health monitoringmethod. CHA estimates and visualizes system damping conditions without the need of transient-vibration records. The dampingconditions are closely related to the spectral distribution around the dominant spectral peaks due to structural resonance. Thistype of spectral distribution can be visualized with CHA even within a short interval of random vibration samples. The effect ofCHA on monitoring the damping conditions was reported by the authors in a previous study. In the current study, the authorsconfirmed the usefulness of CHA for structural condition monitoring by conducting scale-model experiments.
1. Introduction
This study aims at visualizing the spectral changes in randomstructural vibrations due to external noise. Spectral changesin a vibration might be informative for monitoring the healthof a system and for structural diagnostics. In one of thestandard methods, a test signal is given to the subject andthe transmitted vibration at the other point is observed [1].Abnormalities in the health of a structure are detectablefrom the time variance of the damping constant seen in thetransfer function. However, the health of a structure canonly be evaluated with a general measurement method thatrequires a test signal. Instead, if the changes in harmoniccharacteristics could be analyzed from the subtleties ofstructural vibrations caused by external noise, the health ofthe structure would be able to be monitored at any time.However, it is difficult to track random variations by usingthe structural transfer functions independent of the sourcesignal characteristics. This is because the transfer functionanalysis of structural vibration systems generally requires theexternal source characteristics to be specified [2, 3].
Hirata proposed a method for monitoring invisible chan-ges in a structure on the basis of the frequency distributions
of the dominant spectral components during short-intervalperiods (SIPs) under random and nonstationary vibrationconditions without placing assumptions or restrictions onthe specific source signal [4]. The maximum point ofthe cumulative curves of the SIP distribution are used toestimate the resonant frequency, and the sharpness of thedistribution can be evaluated from the statistical frequencyof the dominant spectral components. As the variance inthe distribution increases, the modal bandwidth widens,thus increasing the damping. Recently, Hirata and coworkersconducted experiments on health monitoring of a modalstructure using its nonstationary vibrations, wherein SIPdistributions were used for detecting changes in the dynamicproperties of a structure [5]. The maximum points of the SIPdistribution without the magnitude were used to prevent badinfluences from the source variation and from the resonantfrequency.
Different from Hirata’s work, the authors proposed anew spectral analysis method using a cumulative harmonicanalysis (CHA) that includes growing a resonant spectralpeak through spectral accumulation of a long interval [6].A very short frame length is used for SIPs, on the orderof the one-twentieth of the target vibration period. The
2 Advances in Acoustics and Vibration
Model
Hammer
380
210
10
10(mm) Data recorder
Amplifier
180
Piezoelectricaccelerometer
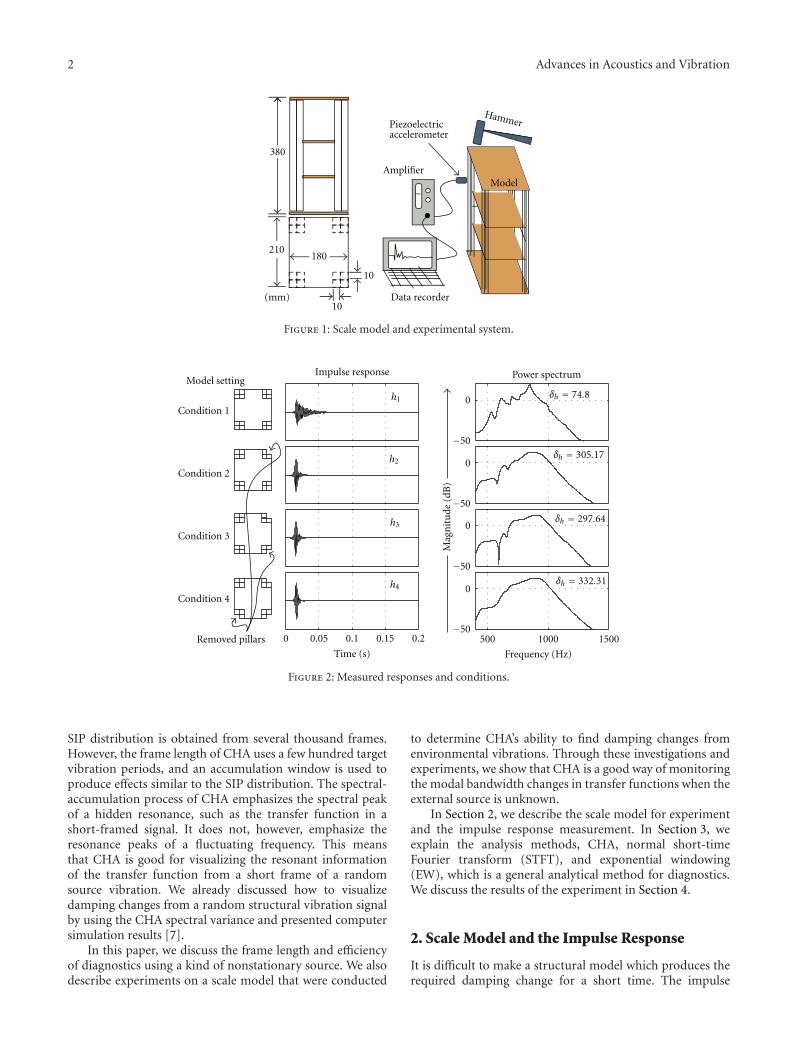
Figure 1: Scale model and experimental system.
Model setting
Condition 1
Condition 2
Condition 3
Condition 4
Removed pillars 0 0.05 0.1 0.15 0.2
Time (s)
Impulse response Power spectrum
h1
h2
h3
h4
0
−50
0
−50
0
−50
0
−50500 1000 1500
δh = 74.8
δh = 305.17
δh = 297.64
δh = 332.31
Frequency (Hz)
Mag
nit
ude
(dB
)
Figure 2: Measured responses and conditions.
SIP distribution is obtained from several thousand frames.However, the frame length of CHA uses a few hundred targetvibration periods, and an accumulation window is used toproduce effects similar to the SIP distribution. The spectral-accumulation process of CHA emphasizes the spectral peakof a hidden resonance, such as the transfer function in ashort-framed signal. It does not, however, emphasize theresonance peaks of a fluctuating frequency. This meansthat CHA is good for visualizing the resonant informationof the transfer function from a short frame of a randomsource vibration. We already discussed how to visualizedamping changes from a random structural vibration signalby using the CHA spectral variance and presented computersimulation results [7].
In this paper, we discuss the frame length and efficiencyof diagnostics using a kind of nonstationary source. We alsodescribe experiments on a scale model that were conducted
to determine CHA’s ability to find damping changes fromenvironmental vibrations. Through these investigations andexperiments, we show that CHA is a good way of monitoringthe modal bandwidth changes in transfer functions when theexternal source is unknown.
In Section 2, we describe the scale model for experimentand the impulse response measurement. In Section 3, weexplain the analysis methods, CHA, normal short-timeFourier transform (STFT), and exponential windowing(EW), which is a general analytical method for diagnostics.We discuss the results of the experiment in Section 4.
2. Scale Model and the Impulse Response
It is difficult to make a structural model which produces therequired damping change for a short time. The impulse

Advances in Acoustics and Vibration 3
External noise
Recorded noise
Time
Time
Frame length: 6 (s)
+
+
+
∗h1∗h2 ∗h3 ∗h4
Figure 3: Time variant convolution.
DFT DFT DFT DFT DFT DFT
++
· · ·
··· ···· · ·· · ·
n
(a)
DFT DFT DFT
Triangle windowing
n
(b)
DFTDFTDFT
Rectangular windowing
n
(c)
DFTDFTDFT
Exponential windowing
n
(d)
Figure 4: Analysis methods. (a) CHA, (b) CHA with triangular windowing, (c) STFT (short-time Fourier transform), and (d) EW(exponential windowing).
responses of a scale model were recorded (Figure 1). Themodel had three floors with four groups of wooden pillars.The response to an impulsive hammer was recorded witha piezoelectric accelerometer (PV-90B, RION). The mea-surements were carried out for different responses obtainedunder different conditions (the number of pillars wasvaried). Figure 2 shows the measured response waveformswith the power spectral records for each measurementcondition. A band-pass Butterworth filter of the 6th orderand a passband of 600 Hz < fpass < 1000 Hz was used in theanalysis.
The external noise was assumed to be unknown. Fourtypes of noise were used in the numerical experiments: whitenoise, recorded noise from an aircraft, street noise, and seawaves recorded at a beach. Different impulse responses,
measured under different conditions, were convolved withthe external noise every 6 seconds (Figure 3).
3. Experimental Analysis Methods
Figure 4(a) illustrates the CHA method. One defines thefunction
CHA(n, e− jΩ
)≡
n∑
m=0
w(m)x(m)e− jΩm (1)
of the framed input signal x(n), (0 ≤ n < N). The spectral-accumulation function w(m) is
w(m) ≡ n−m + 1, (0 ≤ m ≤ n). (2)
4 Advances in Acoustics and Vibration
0 2 4 6 8 10 12 14Time (s)Frame length: 0.1 (s)
0
−50
0
−50
0
−50400 800 1200 400 800 1200 400 800 1200 400 800 1200 400 800 1200 400 800 1200
16 18 20 22 24
Frequency (Hz)
(dB
)(d
B)
(dB
)
CH
AST
FTE
W
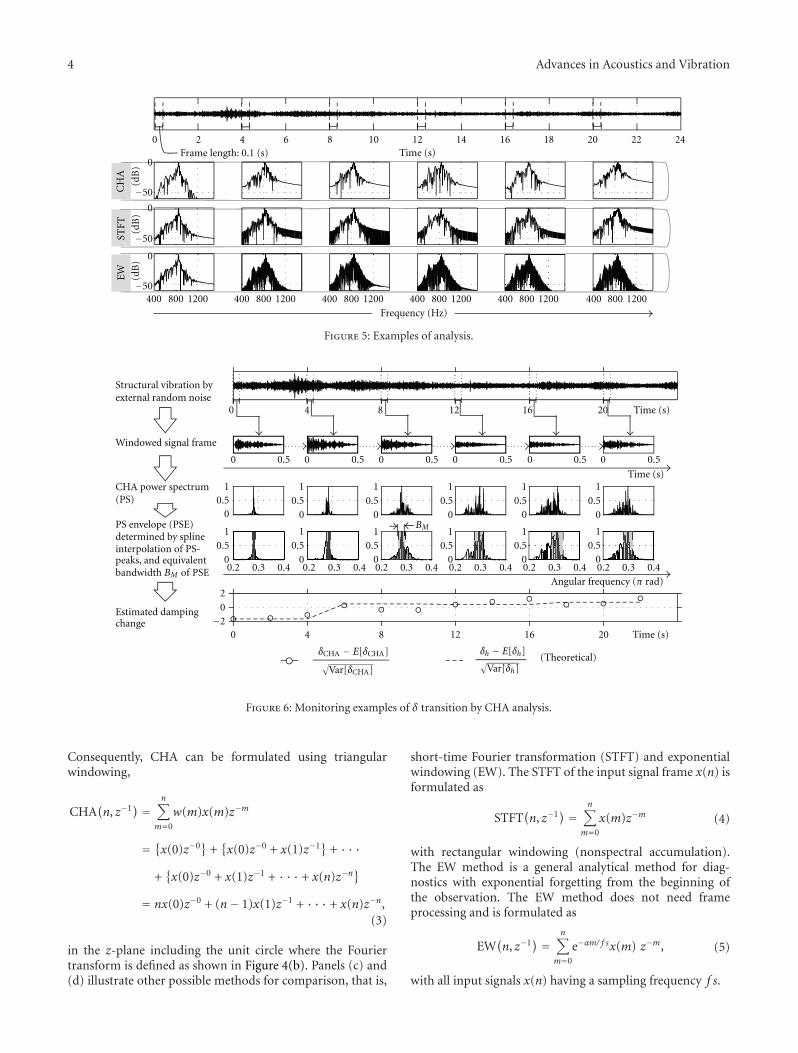
Figure 5: Examples of analysis.
Structural vibration byexternal random noise
Windowed signal frame
CHA power spectrum(PS)
PS envelope (PSE)determined by splineinterpolation of PS-peaks, and equivalent
BM
bandwidth BM of PSE
Estimated dampingchange
0 4 8 12 16 20 Time (s)
Time (s)
Time (s)
0
0
0.5
0.5
0 0.5 0 0.5 0 0.5 0 0.5 0 0.5
1
00.5
1
00.5
1
00.5
1
00.5
1
00.5
1
00.5
1
00.5
1
00.5
1
00.5
1
00.5
1
00.5
1
0.2 0.3 0.4 0.2 0.3 0.4 0.2 0.3 0.4 0.2 0.3 0.4 0.2 0.3 0.4 0.2 0.3 0.4
20
−20 4 8 12 16 20
Angular frequency (π rad)
δCHA − E[δCHA] δh − E[δh](Theoretical)
Var[δCHA]
Var[δh]
Figure 6: Monitoring examples of δ transition by CHA analysis.
Consequently, CHA can be formulated using triangularwindowing,
CHA(n, z−1) =
n∑
m=0
w(m)x(m)z−m
= {x(0)z−0} +{x(0)z−0 + x(1)z−1} + · · ·
+{x(0)z−0 + x(1)z−1 + · · · + x(n)z−n
}
= nx(0)z−0 + (n− 1)x(1)z−1 + · · · + x(n)z−n,(3)
in the z-plane including the unit circle where the Fouriertransform is defined as shown in Figure 4(b). Panels (c) and(d) illustrate other possible methods for comparison, that is,
short-time Fourier transformation (STFT) and exponentialwindowing (EW). The STFT of the input signal frame x(n) isformulated as
STFT(n, z−1) =
n∑
m=0
x(m)z−m (4)
with rectangular windowing (nonspectral accumulation).The EW method is a general analytical method for diag-nostics with exponential forgetting from the beginning ofthe observation. The EW method does not need frameprocessing and is formulated as
EW(n, z−1) =
n∑
m=0
e−αm/ f sx(m) z−m, (5)
with all input signals x(n) having a sampling frequency f s.

Advances in Acoustics and Vibration 5
White
Aircraft
Street
Sea wave
1
0.5
0
1
0.5
0
1
0.5
0
1
0.5
0
10−1 100 101
10−1 100 101
10−1 100 101
10−1 100 101
Damping estimation does not work
Windowing length (normalized by TR)
CHASTFT
Cor
rela
tion
coe
ffici
ent
betw
een
th
eore
tica
lan
d es
tim
ated
dam
pin
g tr
ansi
tion
Figure 7: Correlation of damping constants estimated from therandom vibration records and by using CHA and STFT on theimpulse response data.
20
10
0
20
10
0
20
10
0
Aircraft
Street
Sea wave
0 5 10 15 20
0 5 10 15 20
0 5 10 15 20
Time (ms)
τc = 1.33 ms
τc = 4.33 ms
τc = 10.67 ms
Cep
stru
m a
mpl
itu
de
Figure 8: Amplitude cepstrum of external source signals.
Figure 5 shows examples of spectral analysis for eachmethod. The CHA and STFT examples have a 0.1 (s) framelength, whereas the EW example uses all past signals andapplies an exponentially decaying window function to all thedata from the past that are to be used for the analysis atthe present time. CHA also uses data from the past in theframe, but it has a triangular widowing function instead ofan exponentially decaying one. Note that accumulation andrestoration could also be used in CHA in order to adapt tothe time varying behavior to be monitored and diagnosed.
White
Aircraft
Street
Sea wave
1
0.5
0
1
0.5
0
1
0.5
0
1
0.5
0
Damping estimation does not work
10−110−2 100 101 102
10−110−2 100 101 102
10−110−2 100 101 102
10−110−2 100 101 102
Cor
rela
tion
coe
ffici
ent
betw
een
th
eore
tica
lan
d es
tim
ated
dam
pin
g tr
ansi
tion
Decay constant α for EW
Figure 9: Correlation of damping constants estimated from therandom vibration records by using EW and from the impulseresponse data.
The modal bandwidth BM denotes the spectrum extentevaluated as an equivalent rectangular spectrum with thesame area. The damping constant can be estimated by
δ = BM
π. (6)
However, there are a lot of peaks that the power spectrum ofa windowed signal frame when a random vibration sourceis used. The BM is calculated from the power spectrumenvelope. Figure 6 shows the example of calculating BM
and monitoring the system’s damping changes with theCHA method. The top panel shows the recorded structuralvibration signal. This signal is framed and windowed in thenext step. The framing point is selected every 2 seconds.However, due to space limitations, the spectrum in this figureis shown only every 4 seconds. The CHA power spectrumis calculated and the peaks selected. The power spectrumenvelope is estimated by spline interpolation. The spectrumenvelope is normalized by the maximum value. Finally, thedamping changes are estimated from the changes in themodal bandwidth of the spectrum envelope.
4. Estimation Results
Figure 7 shows the correlation coefficient between the damp-ing constants estimated from the random vibration recordsby CHA (or STFT) and the estimation from the impulseresponses shown in Figure 2. The horizontal axis is thewindowing length (normalized by the reverberation time

6 Advances in Acoustics and Vibration
TR � 0.1(s) of h1), and the vertical axes show the correlationcoefficients. It can be seen that CHA “◦” yields a betterestimation than STFT “×” when the windowing length isshort; in particular, the time variance of the source signalincreases in the case of a sea wave. The time variance of thesource signal is confirmed from the zero-cross period of theamplitude cepstrum τc shown in Figure 8.
Figure 9 shows the correlation coefficient between thedamping constants estimated from the random vibrationrecords by EW and the estimation from the impulseresponses shown in Figure 2. The horizontal axis is thedecay constant α of the exponential window eαt. Fromthis figure, one sees that the decay constant α does notdepend on the source signal for stable estimation. In theconventional EW method, an effective constant α is chosenfor the known source signal. However, if the characteristics ofthe transfer function and the source signal contained in theobservation signal are both unknown, α cannot be adjustedautomatically.
5. Summary
Numerical simulations and experiments using a scale modelconfirmed that CHA well-visualizes temporal changes in adamped vibrating system and modal overlap conditions fromrandom vibration records corresponding to an unknownexternal noise source. This development opens up a potentialnew area in cumulative analysis by introducing a spectralaccumulation function into the method of Berman andFincham. Spectral properties of the transfer function can beemphasized and visualized by the CHA magnitudes even in ashort interval of random vibration samples. Monitoring thedamping constants estimated by CHA will make it possible toestimate or predict temporal changes in the system dampingof a structure. The experimental study confirmed that CHAworks better than exponential windowing analysis or ashort-time Fourier transform when the windowing length isshort. CHA thus seems to be a practical way of monitoringconditions and making system diagnostics without a specificexternal source.
Acknowledgment
This work was supported by a Grant from the Japan Societyfor the Promotion of Science, KAKENHI (21860084).
References
[1] R. H. Lyon, “Progressive phase trends in multi-degree-of-freedom systems,” Journal of the Acoustical Society of America,vol. 73, no. 4, pp. 1223–1228, 1983.
[2] P. J. Halliday and K. Grosh, “Maximum likelihood estimationof structural wave components from noisy data,” Journal of theAcoustical Society of America, vol. 111, no. 4, pp. 1709–1717,2002.
[3] J. G. McDaniel and W. S. Shepard, “Estimation of structuralwave numbers from spatially sparse response measurements,”Journal of the Acoustical Society of America, vol. 108, no. 4, pp.1674–1682, 2000.
[4] Y. Hirata, “A method for monitoring invisible changes in astructure using its non-stationary vibration,” Journal of Soundand Vibration, vol. 270, no. 4-5, pp. 1041–1044, 2004.
[5] Y. Hirata, M. Tohyama, M. Matsumoto, and S. Gotoh, “Healthmonitoring for a structure using its nonstationary vibration,”Advances in Acoustics and Vibration, vol. 2010, Article ID696512, 2010.
[6] Y. Takahashi, M. Tohyama, and Y. Yamasaki, “Cumulativespectral analysis for transient decaying signals in a transmissionsystem including a feedback loop,” Journal of the AudioEngineering Society, vol. 54, no. 7-8, pp. 620–629, 2006.
[7] Y. Takahashi, T. Taniguchi, and M. Tohyama, “Structuralcondition monitoring by cumulative harmonic analysis ofrandom vibration,” Advances in Acoustics and Vibration, vol.2008, Article ID 261758, 2008.

International Journal of
AerospaceEngineeringHindawi Publishing Corporationhttp://www.hindawi.com Volume 2010
RoboticsJournal of
Hindawi Publishing Corporationhttp://www.hindawi.com Volume 2014
Hindawi Publishing Corporationhttp://www.hindawi.com Volume 2014
Active and Passive Electronic Components
Control Scienceand Engineering
Journal of
Hindawi Publishing Corporationhttp://www.hindawi.com Volume 2014
International Journal of
RotatingMachinery
Hindawi Publishing Corporationhttp://www.hindawi.com Volume 2014
Hindawi Publishing Corporation http://www.hindawi.com
Journal ofEngineeringVolume 2014
Submit your manuscripts athttp://www.hindawi.com
VLSI Design
Hindawi Publishing Corporationhttp://www.hindawi.com Volume 2014
Hindawi Publishing Corporationhttp://www.hindawi.com Volume 2014
Shock and Vibration
Hindawi Publishing Corporationhttp://www.hindawi.com Volume 2014
Civil EngineeringAdvances in
Acoustics and VibrationAdvances in
Hindawi Publishing Corporationhttp://www.hindawi.com Volume 2014
Hindawi Publishing Corporationhttp://www.hindawi.com Volume 2014
Electrical and Computer Engineering
Journal of
Advances inOptoElectronics
Hindawi Publishing Corporation http://www.hindawi.com
Volume 2014
The Scientific World JournalHindawi Publishing Corporation http://www.hindawi.com Volume 2014
SensorsJournal of
Hindawi Publishing Corporationhttp://www.hindawi.com Volume 2014
Modelling & Simulation in EngineeringHindawi Publishing Corporation http://www.hindawi.com Volume 2014
Hindawi Publishing Corporationhttp://www.hindawi.com Volume 2014
Chemical EngineeringInternational Journal of Antennas and
Propagation
International Journal of
Hindawi Publishing Corporationhttp://www.hindawi.com Volume 2014
Hindawi Publishing Corporationhttp://www.hindawi.com Volume 2014
Navigation and Observation
International Journal of
Hindawi Publishing Corporationhttp://www.hindawi.com Volume 2014
DistributedSensor Networks
International Journal of