modern technologies way to higher productivity
TRANSCRIPT
ŽILINSKÁ UNIVERZITA V ŽILINE STROJNÍCKA FAKULTA
KATEDRA PRIEMYSELNÉHO INŽINIERSTVA
and
Katedra Inżynierii Produkcji, Akademia Techniczno-Humanistyczna, Bielsko-Biala Katedra priemyselného inžinierstva a manažmentu, Technická univerzita Košice
Katedra průmyslového inženýrství a managementu, Západočeská univerzita v Plzni Ústav priemyselného inžinierstva, manažmentu a kvality, STU v Bratislave,
Katedra výrobních systémů, Technická univerzita v Liberci Ústav technologie obrábění, projektování a metrologie, České vysoké učení technické v Praze
MODERN TECHNOLOGIES
WAY TO HIGHER PRODUCTIVITY
INVENT 2013
19. 6. – 21. 6. 2013, Lopušná dolina
Proceedings of the International Conference
InvEnt 2013 Scientific Committee:
prof. Ing. Branislav MIČIETA, PhD. (SK) prof. Ing. Milan GREGOR, PhD. (SK) prof. Ing. Štefan MEDVECKÝ, PhD. (SK) hosť. prof. Ing. Peter MAGVAŠI, CSc. (SK) prof. Ing. Jozef KOVÁČ, CSc. (SK) prof. Ing. Jozef BASL, CSc. (CZ) prof. dr hab. Inż. Józef MATUSZEK, dr h.c. (PL) dr hab. Inż. Dariusz PLINTA, prof. ATH, (PL) dr hab. Inż. Janusz MLECZKO, (PL) doc. Ing. Michal ŠIMON, Ph.D. (CZ) doc. Ing. Milan EDL, Ph.D. (CZ) doc. Ing. Martin VRABEC, CSc.(CZ) doc. Dr. Ing. František MANLIG(CZ)
doc. Ing. Miloš ČAMBAL, PhD. (SK) doc. Ing. Peter TREBUŇA, PhD.(SK) doc. Ing. Peter BUBENÍK, PhD. (SK) doc. Ing. Ľuboslav DULINA, PhD. (SK) doc. Ing. Martin KRAJČOVIČ, PhD. (SK) doc. Ing. Miroslav RAKYTA, PhD. (SK) doc. Ing. Eva SLAMKOVÁ, PhD. (SK) doc. Ing. Helena TUREKOVÁ, PhD. (SK) Ing. BcA. Jan PODANÝ, Ph.D. (CZ) Ing. Pavel NOVÁK, Ph.D. (CZ) Ing. Peter ZELENÝ, Ph.D. (CZ) Ing. Pavel ZEMAN Ph.D. (CZ)
Organizing Committee: Ing. Vladimíra BIŇASOVÁ (SK) Ing. Slavomír DILSKÝ (SK) Ing. Martin GAŠO, PhD. (SK) mgr inż. Ewa GOLIŃSKA (PL) Ing. Tomáš GÖRNER (CZ)
Ing. Jan HUDAK (SK) Ing. František KALL (SK) Ing. František KOBLASA (CZ) Ing. Jiří KUDRNA(CZ) Ing. Peter LONC (SK)
Organizational garant of the conference:
CEIT, n.o. All articles were reviewed in the proceedings of the workshop scientific committee. The articles have not undergone editorial, graphic or language treatment. For the content of articles are responsible their authors.

Title: InvEnt 2013: Modern Technologies – Way to Higher Productivity Kind of publication: Proceedings Publisher: University of Žilina, EDIS – Žilina University Publisher Date of issue: Jun 2013 Proceedings maker: Ing. Peter Lonc, Ing. Martin Gašo, PhD. Cover and design: Ing. Martin Gašo, PhD., Ing. Peter Lonc Edition: 1st Edition Range: 139 Pages Expense: 200 Pieces Binding: Perfect Binding – Glued Font: Times New Roman CE ISBN 978-80-554-0658-9

InvEnt 2013
4
CONTENTS
Ján BAJANA, Martin KRAJČOVIČ MOBILE ROBOT CONTROL BASED ON MARKER DETECTION ......8
Miroslava BARTÁNUSOVÁ, František KALL ERGONOMICS IN THE WORKPLACE ....................................................12
Miroslava BARTÁNUSOVÁ, Ľuboslav DULINA ERGONOMIC PROGRAMS AND THEIR APPLICATION IN
MODERN ERGONOMICS ............................................................................16
Vladimíra BIŇASOVÁ, Miroslav RAKYTA SEQUENCE FOR COST REDUCTION OF THE
MANUFACTURING SYSTEM ENERGY PERFORMANCE ..................20
Jana BJALONČÍKOVÁ, Miroslav RAKYTA INFORMATION SUPPORT OF INTELLIGENT
MANUFACTURING SYSTEM ON THE BASE OF KNOWLEDGE ......24
Jana ČUCHRÁNOVÁ, Ján ŠESTÁK ANALYSIS OF WORKING POSTURES DURING THE WORK
USING OWAS METHOD, STATIC STRENGHT PREDICTION
AND LOW BACK ANALYSIS ......................................................................28
Slavomír DILSKÝ, Miroslav HEGLAS, Milan GREGOR COMPUTER SIMULATION – SUPPORT TOOL FOR PLANNING
AND OPTIMIZATION OF LOGISTIC PROCESSES ...............................34
Slavomír DILSKÝ, Tomáš KASANICKÝ SIMULATION MODEL OF ZILINA INTELLIGENT
MANUFACTURING SYSTEM – ZIMS .......................................................38
Irena DUDZIK-LEWICKA, Aneta MADYDA THE ATTITUDE OF ENTERPRISES TOWARDS INNOVATIONS ......42

InvEnt 2013
5
CONTENTS
Ivan GABAJ, Martin KRAJČOVIČ, Dawid KURCZYK PLM SOLUTION SIEMENS TECNOMATIX AND CAVE ......................48
Gabriela GABAJOVÁ, Ivan GABAJ , Ewa GOLIŃSKA WAREHOUSE USING AUGMENTED REALITY ....................................52
Gabriela GABAJOVÁ, Martin KRAJČOVIČ, Dariusz PLINTA NAVIGATION WITH AUGMENTED REALITY ......................................56
Jana HALČINOVÁ, Peter TREBUŇA WAY OF EXPRESSING SIMILARITY RELATIONSHIPS
BETWEEN OBJECTS ....................................................................................60
Michal HALUŠKA, Filip HORÁK AGENT COMMUNICATION IN THE FIELD OF INTELLIGENT
MANUFACTURING SYSTEMS ...................................................................66
Michal HALUŠKA, Peter LONC CLOUD COMPUTING IN MANUFACTURING ENVIRONMENT .......70
Miroslav HEGLAS, Silvia PALAJOVÁ SIMULATION OPTIMIZATION WITH THE USE OF GENETIC
ALGORITHMS ...............................................................................................74
Jozef HNÁT, Patrik GRZNÁR USE OF VIRTUAL REALITY TOOLS AS A PART OF PLM .................78
Filip HORÁK, Michal HALUŠKA SERVER-BASED DATA MINING ...............................................................82
Peter HRUBANÍK, Branislav MIČIETA, Ján ROFÁR OPC UA USAGE IN THE MOBILE AND WEB APPLICATIONS........86

InvEnt 2013
6
CONTENTS
František KALL, Martin KRAJČOVIČ, Miroslava BARTÁNUSOVÁ LOADING APPRAISAL OF AN OPERATOR IN WORKING
PROCESS USING TECNOMATIX JACK AND ERGOPAK ...................90
Marta KASAJOVÁ TRENDS - TECHNICAL PREPARATION OF PRODUCTION ..............94
Marek KLIMENT, Peter TREBUŇA CREATION OF OPTIMIZATION MODEL PRODUCTION LINE
USING TECNOMATIX PLANT SIMULATION ......................................100
Peter LONC, Michal HALUŠKA KNOWLEDGE BASED MANUFACTURING ..........................................104
Aneta MADYDA, Irena DUDZIK-LEWICKA INNOVATIVENESS IN THE DEVELOPMENT OF SMALL AND
MEDIUM ENTERPRISES IN POLAND ...................................................108
Martin MAJDAN, Peter LONC SIMULATION - A SUPPORT TOOL IN A DIGITAL ENTERPRISE ..112
Józef MATUSZEK, Kinga BYRSKA, Jozef HNÁT ERGONOMIC EVALUATION FORM ......................................................116
Branislav MIČIETA, Vladimíra BIŇASOVÁ PLANNING ENERGY EFFICIENT MANUFACTURING
SYSTEMS ......................................................................................................120
Branislav MIČIETA, Vladimíra BIŇASOVÁ ENERGY MANAGEMENT SYSTEMS .....................................................124
Marek MINDA, Rastislav GÁLL PRODUCTIVITY INCREASE THROUGH INNOVATION ...................128

InvEnt 2013
7
CONTENTS
Dariusz PLINTA, Ewa GOLIŃSKA, Patrik GRZNÁR RISK VALUATION CONNECTED WITH ASSEMBLY
OPERATIONS IN THE AUTOMOTIVE INDUSTRY EXAMPLE ........132
Dariusz PLINTA, Dariusz WIĘCEK, Martin KRAJČOVIČ SIMULATION ANALYSIS OF MANUFACTURING PROCESSES
WITH TAKING INTO ACCOUNT PRODUCTION COSTS ..................136
InvEnt 2013
8
Ella, marker, simulation, camera
Ján BAJANA∗, Martin KRAJČOVIČ **
MOBILE ROBOT CONTROL BASED ON MARKER
DETECTION Abstract
The main goal of this article is to describe a software solution focused for mobile
robot navigation based on visual AR Marker detection in the image. The primary
output of the work is a working application based on Ella software platform.
Most of the development and testing was performed in virtual environment.
1. INTRODUCTION
Processing image information isn't confined to capture visual information nowadays. After capturing image may be followed further processing of the image pixels which aim will be to modification that may prevent recognition of scanned objects. My idea is try to use a augmented reality marker to the precise location of the position in space and the obtained information used for mobile robot navigation. The solution is designed in virtual reality and next tested on a physical robot prototype.
Possibilities of using virtual reality and simulation give us many advantages in the design of algorithms and control systems. In virtual reality we can propose and test our control system without having to work with a physical device.
2. MOBILE ROBOT NAVIGATION BASED ON MARKER
DETECTION
2.1 Augmented reality and marker
Augmented reality is a direct or an indirect physical insight into the real environment, whose elements are augmented by new sensory inputs generated by a computer. View of reality is modified on the computer and enhanced with new knowledge. This technology allows us to enhance the perception of reality that is seen. The most common element to calculate the position of virtual objects in augmented reality systems is a visual marker.
In general visual marker represents two-dimensional tags that carry within themselves some information. One field of application is industrial systems where marker is intended to identify
∗ Ing. Ján Bajana: ŽU, SjF, KPI , [email protected] ** doc. Ing. Martin Krajčovič, PhD: ŽU, SjF, KPI, [email protected]
InvEnt 2013
9
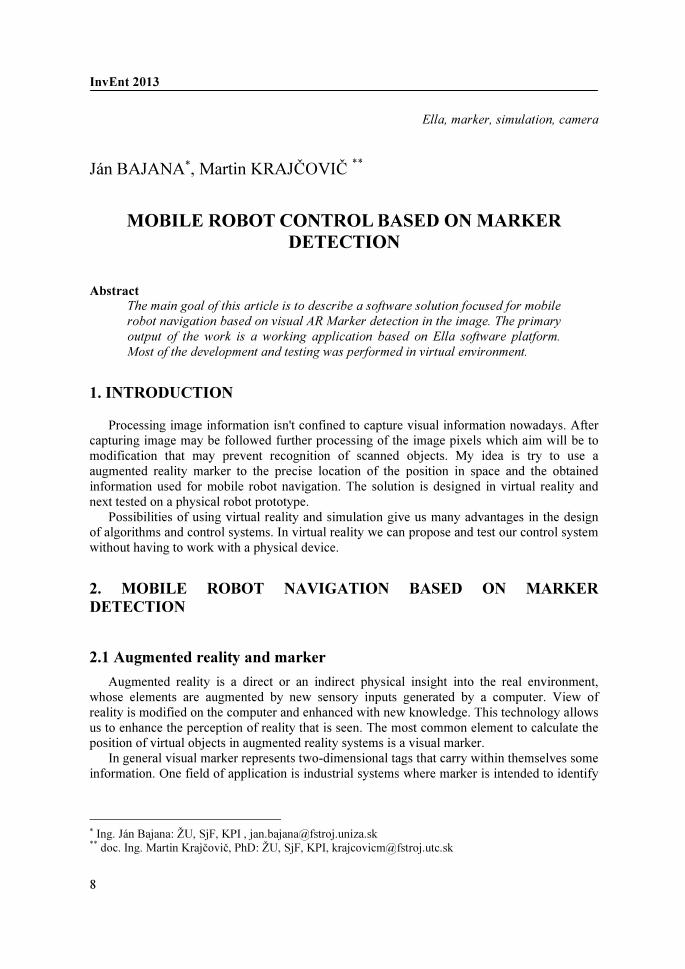
of different parts or contain control information such as traffic information (MaxiCode, DataMAtrix, QR Code) [2].
Another area is system where the marker is used to determine the position, such as augmented reality (AR Marker)
Fig. 1. Our intention is to test the possibility of using AR markers for mobile robot navigation.
Fig. 1. AR marker
2.2 Navigation
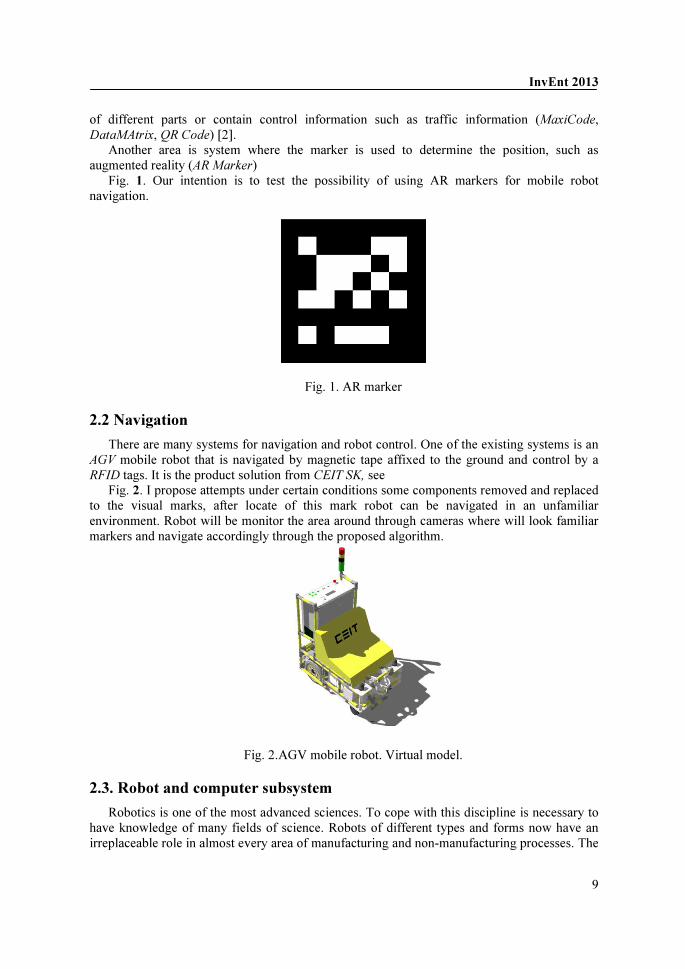
There are many systems for navigation and robot control. One of the existing systems is an AGV mobile robot that is navigated by magnetic tape affixed to the ground and control by a RFID tags. It is the product solution from CEIT SK, see
Fig. 2. I propose attempts under certain conditions some components removed and replaced to the visual marks, after locate of this mark robot can be navigated in an unfamiliar environment. Robot will be monitor the area around through cameras where will look familiar markers and navigate accordingly through the proposed algorithm.
Fig. 2.AGV mobile robot. Virtual model.
2.3. Robot and computer subsystem
Robotics is one of the most advanced sciences. To cope with this discipline is necessary to have knowledge of many fields of science. Robots of different types and forms now have an irreplaceable role in almost every area of manufacturing and non-manufacturing processes. The
InvEnt 2013
10
biggest advantage of using robots is their sedulity, performance, accuracy, speed and ability to be employed in environments that are dangerous for humans, harmful or unavailable [1].
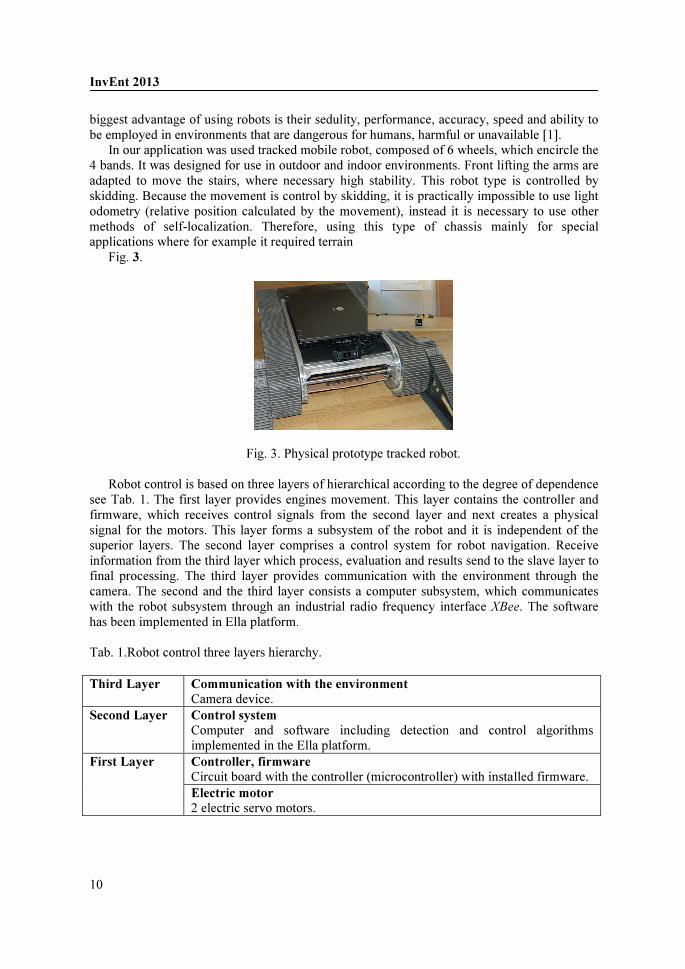
In our application was used tracked mobile robot, composed of 6 wheels, which encircle the 4 bands. It was designed for use in outdoor and indoor environments. Front lifting the arms are adapted to move the stairs, where necessary high stability. This robot type is controlled by skidding. Because the movement is control by skidding, it is practically impossible to use light odometry (relative position calculated by the movement), instead it is necessary to use other methods of self-localization. Therefore, using this type of chassis mainly for special applications where for example it required terrain
Fig. 3.
Fig. 3. Physical prototype tracked robot. Robot control is based on three layers of hierarchical according to the degree of dependence
see Tab. 1. The first layer provides engines movement. This layer contains the controller and firmware, which receives control signals from the second layer and next creates a physical signal for the motors. This layer forms a subsystem of the robot and it is independent of the superior layers. The second layer comprises a control system for robot navigation. Receive information from the third layer which process, evaluation and results send to the slave layer to final processing. The third layer provides communication with the environment through the camera. The second and the third layer consists a computer subsystem, which communicates with the robot subsystem through an industrial radio frequency interface XBee. The software has been implemented in Ella platform. Tab. 1.Robot control three layers hierarchy. Third Layer Communication with the environment
Camera device. Second Layer Control system
Computer and software including detection and control algorithms implemented in the Ella platform.
First Layer Controller, firmware
Circuit board with the controller (microcontroller) with installed firmware. Electric motor
2 electric servo motors.

InvEnt 2013
11
3. IMPLEMENTATION IN ELLA PLATFORM
Ella is an industrial software platform for complex graphics systems, developed to design robotic control systems, physical simulation, logistics systems and industrial buildings. The whole control system is based on a modular architecture, which is a fundamental and integral part of the platform Ella. My task was to program a set of functional modules, which together will form a software solution for image processing from the camera and robot navigation.
3.1 Simulation
For designing and testing we used simulation in virtual environment in Ella platform. Possibilities of using virtual reality in the design of control systems bring us any benefits. In virtual reality we can design and test our algorithms and the control system without having to work with a physical device, which can reduce the time requirements of the proposal. Here we used the AGV mobile robot model from CEIT SK company which through camera capture the surrounding environment and looking for marker.
Fig. 4. Simulation two AGV robots in the industrial build. There are two mobile robots in the hall. The first robot has AR Marker on the back. This
robot is control by using the keyboard. The second robot has mounted virtual camera on his upper through which picks up the ambient environment. The image is processing detection algorithm after captured. After the marker is detected, the robot is navigating using the control algorithm. Next the control system has been tested on a physical robot prototype.
This article was prepared by within the grant project VEGA 1/0583/12 named as
Interactive projection system for production and logistics systems based on immersive
technologies (SIPIT).
References
[1] ZÁHORČÁK, G.: Kráčajúci robot. Diploma thesis, Košice [2] HIRZER, D.: Marker Detection for Augmented Reality Application, Austria, 2008
InvEnt 2013
12
Ergonomics, Ergonomic layout of the workplace, Risk assessment
Miroslava BARTÁNUSOVÁ∗, František KALL∗∗
ERGONOMICS IN THE WORKPLACE Abstract
The intention of this article is to provide the reader with information about
ergonomics in order to extend his horizon. “Ergonomics applies information
about human behavior, abilities, limitations, and other characteristics related to
tools, machinery, obligations, jobs and the environment, so as to ensure their
productive, safe, comfortable and effective human use” (McCormick a Saunders,
1993).
1. THE IMPORTANCE OF ERGONOMICS IN THE WORKPLACE
The aim of ergonomics is to ensure maximum productivity with minimal cost. In the
workplace there are also obligations that exceed the possibilities of the workforce, although their occurrence is less frequent. It can be work with the specific tasks which require more effort or work can not be performed continuously for a long time. With the application of ergonomic principles, people should be able to perform the job with minimal risk of injury.
The primary aim of ergonomics is in this case the draft the work activities that meets the employee that takes into account their capabilities and limitations. In defining the appropriate requirements for a job, which takes into account the ability of the staff, it is necessary to reduce the risks of musculoskeletal system during handling.
Proactive ergonomics emphasizes prevention related musculoskeletal disorders through anticipating, identifying and reducing risk factors while still in the planning stages of new systems of work or workplaces. In fact, it is about the design of operations, to ensure the correct selection and use of tools, working methods, layout and materials, which are stored without undue stress and strain on an employee. Increased costs are in many cases made primarily for the processing or treatment in employment processes, so it is more efficient to use these costs still at the design stage and reducing risk factors.
A proactive approach to ergonomics ensures that: - employees will be trained and will have information and instructions relating to the
reduction of risks in the workplace, - new working practices should include ergonomic principles, which help to reduce or
eliminate risk,
∗ Ing. Miroslava Bartánusová, KPI, SjF, ŽU; e-mail: [email protected] ∗∗ Ing. František Kall, KPI, SjF, ŽU; e-mail: [email protected]

InvEnt 2013
13
- the arrangement of the workplace in order to allow easy access for mechanical equipment where necessary and eliminating unnecessary lifting during operation.
1.1. Ergonomic principles that contribute to the layout of the workplace
The main aim of the design workplace is the propose for the greatest number of employees and at the same time bear in understanding of ergonomic principles on posture and movement of employees in the workplace. They play a central role in providing safety, health and comfort in the workplace.
For proper posture and movement of the employee at work will be defined the role and place of work, taking into account the fact that the muscles, ligaments and joints are continually involved in the process of holding the body. Muscles provide strength, which is needed to keep the position or carry out movement. Improper posture and movement can contribute to the weakening of the muscles, ligaments and joints, which leads to the load on the back, shoulders, wrists, neck and other parts of the skeletal system. Ergonomic principles provide us with opportunities for optimization tasks in the workplace.
2. RISK ASSESSMENT
Risk assessment is a process that involves the acquisition of relevant details about the activity
carried out, information about the risk factors and the presence of danger, in this case, if there is one. It is necessary to examine what options and solutions available to reduce or eliminate risk factors and subsequent definition of a plan for the implementation of the proposed control measures. There are a number of steps to risk assessment in the evaluation process and those briefly I describe below. Step 1: Identify the activities that need to be considered
A list should be drawn up of all the tasks that are carried out at the place where it is a key part of the role of manual manipulation.
Step 2: Developing a program for risk assessment
It is necessary to define what tasks will be assessed and where the assessment will take place. The involvement of employees in the planning and implementation of the process of risk assessment can be an important step to increase the probability of success of the process. Step 3: The risk assessment process.
There are several key steps that can be used in step 3 and briefly I describe them below.
a) Observation and description. The aim of this phase is to get detailed information about how the task is performed and to identify activities which will contribute to the completion of the overall completion of the job. b) Collection of data. Form for a risk assessment should include sufficient information on the role of technical and general information. Examples of technical information might include information about the weight of the object, load, noise and others.

InvEnt 2013
14
c) Identification of risk factors. Part of the risk assessment process should be drawn up plan to regulate the adverse ergonomic conditions or risk factors. Based on ergonomic survey, which was conducted in Ireland has been defined several factors that contribute to the development of disorders of the musculoskeletal system, including a back injury. Tasks that require an increased effort to put a greater strain on the muscles, tendons and joints. Increase of expended strength means an increase in body strength requirements.
The wrong attitude. The position of the joints and muscles of the human body, which is defined for use in work activities. Greater emphasis is placed on the spinal vertebrae when lifting, lowering or handling objects is the rear part of the back bent. Activities that require frequent and prolonged work through the arm, can be stressful for the employee and to the detriment of his health.
Increased effort. Tasks that require an increased effort put a greater strain on the muscles, tendons and joints. The mass of the object which is to be raised, the amount of which shall be raised to and the frequency of stroke are the factors that influence the level of effort on the muscles and joints. There are guidelines, which take into account weight, frequency and location of the object and thus are a means to search for activities in which there may be risks for the employee. When using the principles of the weight, which are shown in Fig.1. should take into account the type of work activity. Then it would be to propose improvements, in order to prevent or at least reduce the occurrence of risks. Other factors to be considered are frequency, individual skills, his posture and work environment.
Fig.1. Principles of weight
When the prescribed weight in Fig. 1 is necessary to assume that the object can be easily grasped with both hands. Indicative weights are defined for a few common operations and to 30 operations per hour. A further condition is that the pace of work is not compulsory and for the employee are given adequate rest breaks. In the case of more frequent operations is necessary to reduce weight and repeating it as follows: Tab.1. Table informing about reducing weight depending on the frequency of operation
The frequency of operation Data reduction (%)
A maximum of two times per minut. 30 A maximum of eight times per minut. 50
More than twelve times per minute 80
InvEnt 2013
15
If the movements are repeated frequently (every few seconds), and for a long time, fatigue and muscle tension can accumulate. The negative effects of repeated movements, during which they performed the same activity are raised in this case, if an employee has an unnatural posture. Step 4: Design solutions and action plan
Risk factors that may arise during the implementation of activities should be documented and
should be outlined as well as the evidence of each risk factor. Creation solutions can be defined as the process of eliminating or reducing risk factors. On its creation should involve the employer in cooperation with employees. The reasons for the application of control measures should be documented and must also be defined as the control measures proposed eliminating or limiting the risk of injury. The introduction of any control measures, whether in the form of mechanical support or new organization of work is the introduction of the new system work. That is what should ensure that all new hazards are identified and controlled. Step 5: Research effectiveness of control measures
Defining of the effectiveness of control measures, means the determination of the extent to
which control measures be eliminated or reduced the risk of injury. 2. CONCLUSION
To create such a work space that would meet the demands and needs of all pages of the
employee in the workplace this is a very difficult process. It requires in addition to technical knowledge also knowledge of ergonomics. Knowledge of ergonomics is not enough just to have in mind, but to apply them into practice. If the workspace is better suited for the job the employee, then the higher productivity of his work and reduce the burden on the body. References
[1] Slamková, E., Dulina, Ľ., Tabaková, M.: Ergonómia v priemysle.Žilina : GEORG,
2010, 260 s., ISBN 978-80-89401-09-3 [2] LORKO, M.: Ergonómia vo výrobe. Technická univerzita, 2001, 105 s., ISBN 80-7099-
692-7 [3] GILBERTOVÁ,S., MATOUŠEK,O.: Ergonomie. Optimalizace lidské činnosti. Grada
Publishing, Praha 2002, 239 s., ISBN 80-247-0226-6
This work was supported by the Slovak Research and Development Agency under the contract No. APVV-0615-10.
InvEnt 2013
16
Modern ergonomics, Cumulative trauma disorders, Ergonomic prevention programs
Miroslava BARTÁNUSOVÁ∗, Ľuboslav DULINA∗∗
ERGONOMIC PROGRAMS AND THEIR APPLICATION IN
MODERN ERGONOMICS Abstract
On the basis of practical experience, it is possible to point out the fact that
addressing the issues of ergonomics helps to humanizing the work, optimizing
the working conditions and thus to the growth of productivity and quality of
work.. With the use of ergonomic programs can ensure the effectiveness of each
element of the work process.
1. MODERN ERGONOMICS
For practical reasons, began to apply the division of ergonomics to mikroergonomics and
makroergonomics.This division is not yet fully enforced and applied in Slovakia. As stated Hatiar, makroergonomics includes understanding of ergonomics as a whole.I n the context of the development of new solutions it focuses mainly on equipment and systems.In their creation, we should start with the implementation of the legislation and to use such data as accurately characterize the population for which they are intended to be a solution.It is therefore a proactive approach.
Microergonomics is trying to solve the problems in enterprises in a systematic way.In the context of ergonomic programs through ergonomic analyses and methods of trying to uncover the negative impact factors of work and working environment for employees.In particular, the effort to eliminate difficulties associated with musculoskeletal system that identifies deficiencies in terms of workplace ergonomics.The aim of mikroergonomics is to remove difficulties, thus achieve a positive impact on the health of workers and also bring the benefits of cost(Hatiar). 1.1. Ergonomic prevention programs
Working conditions are people working in enterprises tailored to only in exceptional cases.Currently, against improving conditions in the workplace are the people themselves due to fear of withdrawal risk premiums and the fear of losing their job.
From a practical standpoint, we can consider ergonomics for science, which seeks to ensure the human comfort and at the same time bring benefits to the enterprise.When the requirements
∗ Ing. Miroslava Bartánusová, KPI, SjF, ŽU; e-mail: [email protected] ∗∗ doc. Ing. Ľuboslav Dulina, PhD., KPI, SjF, ŽU; e-mail: [email protected]
InvEnt 2013
17
of the workplace or the workplace is higher than the physical skills of an employee, the result is often musculoskeletal disorders (MSD).MSD are also known in the context of other names:
- CTDs (cumulative trauma disorders), - RSIs (repetitive stress or repetitive strain injuries ), - RMIs (repetitive motion injuries).
The most commonly used name for the MSD is cumulative trauma disorders (CTDs).These
belong to the group of diseases from wear and tear injuries, which may have an effect on the muscles, nerves, tendons, joints, blood vessels, spine, and other effects. 1.2. The application of ergonomic programs in Slovakia
Enterprises in Slovakia adapt the working environment and production facilities to man only in very few cases.They focus in particular, to meet the requirements of current the legislation, pursuing the supervisory authorities, public health authorities and institutions of OSHA. Application of ergonomic preventive programs in companies would bring more effective ergonomic human labor, as well as economic benefits.Their use should be especially useful for their anti-crisis potential.
The application of ergonomic prevention programs to Slovakia is only used in such a if does not turn out well control of the labor inspectorate or hygiene and it is needed to implement control measures.When the check finishes, it finishes the use of ergonomic programs.In some cases, there is a large percentage of the difficulties of musculoskeletal system that are caused by the implementation of demanding work.It is also a major employers in Slovakia and, therefore, the state authorities in solving this problem not placed from its own interests.
Slovak companies are trying to introduce ergonomic programs, but not to a sufficient degree.Doctors in the company who would regularly monitor the impact of the working environment on human health of businesses have gone and replaced them in occupational health services.Therefore, efforts to introduce ergonomic prevention programs remained only on safety technicians, who, however, in particular dealing with safety at work.
1.3. Ergonomic prevention programs and their objectives
The main objective of ergonomic programs is to provide a safe and healthy workplace for all employees.They should be incorporated into any undertaking in writing. This record should document the identification, prevention and control of employees from the perspective of ergonomic risk factors.It should be the result of the cooperation of all employees. For the implementation of ergonomic program should be responsible coordinator, who should be responsible for program implementation, its management and maintenance of required records.
The purpose of ergonomic programs is to apply the principles of ergonomics in the workplace with the effort to reduce the number and severity of MSDs.This would reduce the cost of sick leave employees and an increase in productivity and quality.A proactive approach to ergonomic programs focuses on removing risks that have been identified, also the incorporation of ergonomics into the design phase of a new device or process to purchase and planning changes.

InvEnt 2013
18
1.4. Components of the ergonomic programs
Management control. Management should undertake to use ergonomics in the process.It would be financially and non-financially support of coordinator of the ergonomic program, which identifies and controls the ergonomic risk factors.Management should encourage of effective reporting, immediately respond to messages and communicate with employees about the program.
The involvement of employees. An essential step for the ergonomic program has been successful are employees.They should be asked to assist in the identification of ergonomic risk factors in the at a workshop assessing, when carrying out controls and training. Employee participation should be only in the framework of working time.
Identification of the risk of work. Ergonomic programs should be part of the collect data to identify injury and disease arising in the workplace.It may be a case of active or passive data collection.An example of the passive collection may be record keeping, which takes into account the already existing data (the cost of the indemnity to staff, treatments in health facilities, records of absence).Active data collection using observation, interviews, surveys, questionnaires, checklists for identifying and assessing risk factors.It is advisable to use both methods of data collection.
Evaluation of the workplace. It is necessary to establish triggers for the evaluation offices in the cases listed below:
- if the employee observes a sign or symptom of MSDs, - at work, work processes and work activities, which have been identified ergonomic,
risk factors that can cause or exacerbate MSD, - in the event of any changes to jobs, tasks, tools, processes or changes in hours of work
changes (e.g. from 5 working days after 8 hours on a narrow 4 working days after 10 hours to change),
- in the case where, through a survey or inspection will reveal a potential risk of MSDs. The setting of priorities. Assessment of the work will be planned on the basis of the
following data:
- at each job, process, operation, which contributed to the fact that a worker currently emerging problems with MSD,
- specific work processes, operations, or workplaces that have the potential to cause MSDs.
Evaluation of work of employees. For the evaluation of problem employees can be used a variety of methods such as walk and observation, interviews with employees, surveys and questionnaires, checklists or evaluation directly on a workshop.
Control of ergonomic risk factors. The company should take steps to identify ergonomic risk factors and reduce the risk of using a three-stage hierarchical control (in this order):
1. Technical control. Suitable and reliable way to reduce the risk of workplace exposure to potential harmful effects.This can be achieved by focusing on the physical adaptations of workplaces, tools, equipment or processes.
2. Administrative control. Preventing workplace exposure to potential harmful effects by implementing administrative changes.Example can be a rotation, job enlargement, rest breaks and the use, modification pace of work and worker training.
3. Personal protective equipment (PPE). We can consider it as an effective means of controlling risks.
InvEnt 2013
19
Training. The training is designed to enhance the skills of managers, executives and other employees. The aim is to realize and understand the work being carried out and ergonomic risk factors and implement appropriate control measures. Training for recognize and control ergonomic risk factors shall be determined as follows:
- for all new employees during their training, - for all employees, provided that they carry out a new task, - when introducing new jobs, tasks, tools, equipment, workplaces or processes, - to identify ergonomic risk factors. Medical treatment. The company should provide health care to all employees injured
during work. They should maintain good working relationships with health care providers. All accidents at work and occupational diseases should be recorded in written form and they are pursued. In the event of an accident or sickness the employee will be provided to health care and to the following procedure:
- for employee shall be granted a medical diagnosis and treatment, - determine whether the reported MSD symptoms associated with the work, - create a positive working relationship with employees through compensation, - he company should facilitate the return to work of employees after injury recovery.
The evaluation program. In order to solve the existing problems and not create a new, should be carried out continuously monitoring and evaluation. They should be used individual interviews and checklists.
References
[1] Slamková, E., Dulina, Ľ., Tabaková, M.: Ergonómia v priemysle.Žilina : GEORG,
2010, 260 s., ISBN 978-80-89401-09-3 [2] HATIAR, K.: Ergonomické programy a zdravie, Proceedings of Ergonómia 2012 –
Ergonómia – zdravie a produktivita, Žilina, 2012pp. 20-32, ISBN 978-80-970974-2-4 [3] GILBERTOVÁ,S., MATOUŠEK,O.: Ergonomie. Optimalizace lidské činnosti. Grada
Publishing, Praha 2002, 239 s., ISBN 80-247-0226-6
This work was supported by the Slovak Research and Development Agency under the contract No. APVV-0615-10.

InvEnt 2013
20
energy efficiency, planning, manufacture
Vladimíra BIŇASOVÁ*, Miroslav RAKYTA ∗∗
SEQUENCE FOR COST REDUCTION OF THE
MANUFACTURING SYSTEM ENERGY PERFORMANCE
Abstract
The development and deployment of new energy technologies is essential for
security of supply, sustainability and competitiveness of the sector. Energy
related research has contributed strongly to energy efficiency (e.g. in car
engines) and to energy diversity through renewable energy sources. Magnitude
of the challenges that lie ahead, however, requires extra effort. Long-term
commitment is necessary.
1. REQUIREMENT ON ENERGY EFFICIENCY
The success of manufacturing companies in the current market economy is conditioned by the ability to succeed in competition. In particular, company have to deliver the product in a shorter time, better quality, required quantity, to the desired location, and lower costs than its competitors. Knowledge of the factors that affects ability to compete is a prerequisite for the development of effective corporate management strategy.
Reducing energy consumption has recently become one of the cornerstones of sustainable business development and therefore deserves appropriate attention. Attention should be paid to the MoE SR. 429/2009 Z. z. which establishing a procedure for carrying out energy audits, and especially to Directive of the European Parliament and the Council 2012/27eu about energy efficiency.
Energy costs negatively affect the amount of company profits. For their effective use and
reduction can be used in the field of energy management following steps:
1. Measurement of consumption. 2. Modification of the installation. 3. Monitoring of consumption. 4. Automatic consumption control.
* Ing. Vladimíra Biňasová, The Faculty of Mechanical Engineering at the University of Zilina,
[email protected] ∗∗ doc. Ing. Miroslav Rakyta, PhD., The Faculty of Mechanical Engineering at the University of Zilina,
InvEnt 2013
21
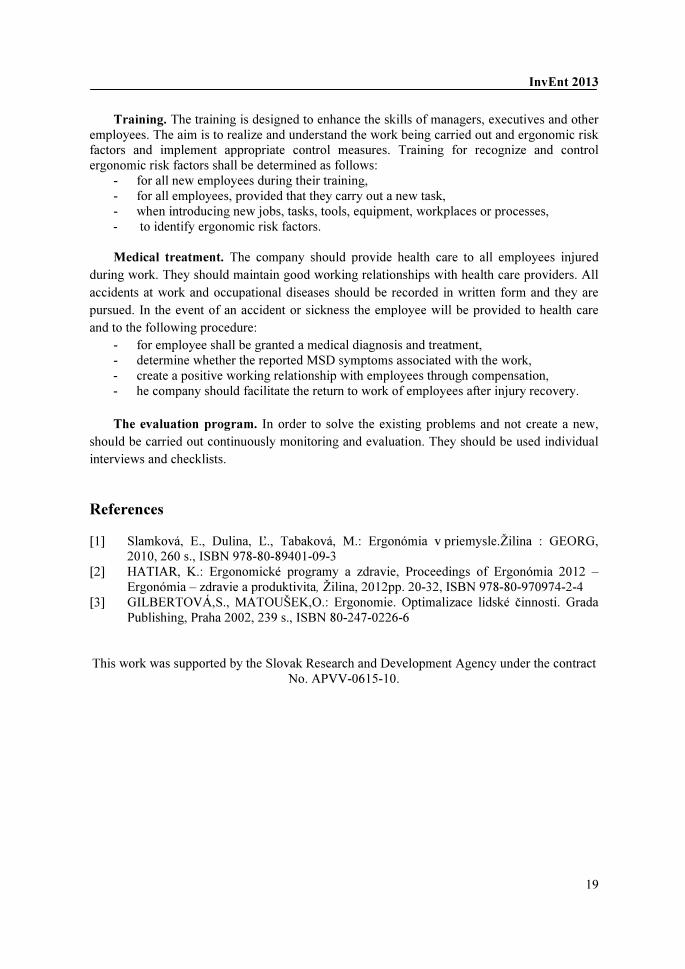
In order to gain the greatest benefits, the company must focus on finding opportunities in all areas of energy related costs: fixed, variant and special. This requires a complete timeline of energy consumption across the company.
Fig. 1. Cycle of continuous improvement in energy efficiency
New energy management technologies provide the relevant economic information that can be used as a basis for decision making.
2. ENERGY CONSUMPTION MONITORING
Energy costs are rising, form a significant part of the company operation costs. It is important to effort to reduce energy consumption while rising efficiency of its use. Therefore, energy consumption monitoring is of high importance, what is caused following reasons: 1. Economic reasons: Spending on austerity measures start to save costs immediately.
Savings will accrue throughout the life of building or device that was target of investment.
2. Ecological reasons: Reducing energy consumption reduce the need for energy production and distribution, which often means major environmental benefits such as natural resources saving and pollution remediation.
3. Strategic reasons: Increasing energy efficiency supports the local economy and can create
new jobs. As far as possible, to implement austerity measures (eg insulation of buildings) should be used local businesses and people. Obtained financial savings would be used for general purpose, such as financing of other actions that will strengthen the energy stability.

InvEnt 2013
22
Energy consumption monitoring (Fig. 2) is necessary especially in terms of the decision making for: • Modern technology using, • improving the thermo-technical and operational properties of buildings and equipment, • changes in the behavior of their users (e.g. by streamlining the organization of work, more
appropriate placement of workstations, using methods of industrial engineering).
Fig. 2 Devices for monitoring energy consumption
3. SEQUENCE OF ENERGY PERFORMANCE COST REDUCTION
Basis for determining potential energy savings are energy audits which are also an important tool to assess the potential savings in the company. They should be a prerequisite for implementing energy saving measures. Energy efficiency law established duty to regular (every five years) evaluates energy demand service in the industry. That requires action plan of energy efficiency and post of reducing energy cost (Fig. 3).
Potential to improve the energy efficiency of industrial technologies in particular at the field of electric motors, pumps, fans and heating systems, implementation of energy management, but also more efficient light sources, which consume up to 30% of the energy in industry in the Slovak Republic. The energy efficiency directive contains proposals for increasing awareness of the benefits which results from increased energy efficiency (EE) in the industry.
The output and benefit of mentioned method are: agreement adjustment for the purchase of energy carriers, compliance with the terms of energy consumption, monitoring and reporting of

InvEnt 2013
23
real consumptions depending on the production and on the basis of their interventions to operation and automatic control of energy consumption.
GENERAL POLICIES
ENERGY AUDIT
DISCOVER
(Behavioural
assessment)
EVALUATION
DEFINITION OF
SPECIFIC GOALS
PLAN
PREPARE
LAUNCH
OPERATION
TOOLS
TO BE
USED
TECHNOLOGICAL
TOOLBOX
BEHAVIOURAL
TOOLBOX
1.
PREPARATION
PHASE
2. EXECUTION
PHASE
RE-
EVALUATIO
N NEEDED
OBJECTIVE
ACHIEVED
YES
NO
REVIEW
REPORT
NO
YES
FINAL REPORT
3. CHECKING
PHASE
Fig. 3. Sequence of cost reduction of energy intensity of the production system
This article was prepared by within the project VEGA 1/0701/12 Výskum v oblasti využitia
nízkonákladovej automatizácie a umelej inteligencie v procese tvorby
stereoskopického záznamu.
References
[1] MIČIETA, B., TUREKOVÁ, H. Inovačný manažment: Podpora vzniku inovácií,
GEORG, Žilina 2010. [2] MIČIETA, B. – GREGOR, M., QUIRENC, P., BOTKA, M., Kanban - ste na ťahu!,
Georg, Žilina 2001.

InvEnt 2013
24
Artificial intelligence, Knowledge-based system, Expert system
Jana BJALONČÍKOVÁ*, Miroslav RAKYTA ∗∗
INFORMATION SUPPORT OF INTELLIGENT
MANUFACTURING SYSTEM ON THE BASE OF
KNOWLEDGE
Abstract
The increasing demand for knowledge in the creation of of complex sophisticated
systems will require the development of new methods for the easy collection,
storage and use of the latest knowledge (knowledge engineering).The Intelligent
Manufacturing System is a socio - technical system with autonomous ability to
identify systemic change in their causes and lessons learned used for learning,
adaptation and reaction to any changes in the surroundings manner similar to
how a person reacts.
1. CHARACTERISTICS OF PRODUCTION SYSTEMS
Generally, the basic characteristics of the production system are flexibility and reliability. These are intended on degree of resistance and adaptability of the system to changes that result from the activities of its reliability and production elements of the program but number and type of elements of the system remains unchanged. It will be better understanding from these perspectives:
• structural and technological flexibility,
• capacity and social stability.
Technological flexibility reflects the ability of a system and manner of the implementation elements and realization varying requirements of technological processes in the production program. On other side structural flexibility reflects the ability of the system (not just its elements) to do transformation with a different sequence of technological operations or operations sorting and storage. In case the elements of the production system capacity to meet the requirements of capacity swaying quantity and product range which means that the system capacity is firm. Socially stable system is such a production system that creates jobs and does not constitute cause staff turnover and the treatment of which would have lead to additional investments or to an increase in labor costs (eg due to increases risk for workplace noise, dust, etc.). * Ing. Jana Bjalončíková, TUBAPACK, a.s., ZH, [email protected], ∗∗ Doc. Ing. Miroslav Rakyta, PhD., The Faculty of Mechanical Engineering at the University of Zilina,
InvEnt 2013
25
A stable system is characteristic of system about returning to a steady state or regime after its disruption by certain external and internal influences or considerations. Some systems can have several states of stable equilibrium. The flexibility of the production system has been understood in two dimensions: technological and structural. Technological work plane is focused on seeking solutions issues such as transfer of work piece through technological workplace. Structural work plane deals with transfer work piece over the entire production system. If we are increase the variability in the manufacturing process, we have to increase the requirements on flexibility equipment too (For example: features, tools, jigs, readjustment of machinery and so on.), materials and components in the stock, people management. For better illustration to increase productivity means to increase the amount of output work pieces, reduce input costs which add value to the product, reduce wasted space, materials, time, resources and capacity.
Production system should be divided into external and internal subsystem. The external subsystem includes activities aimed at preparing and supporting processes. The inner subsystem taking place at technological processes under conditions that were identified external subsystem.
2. ARTIFICIAL INTELLIGENCE
The theory of artificial intelligence to determine the objectives (what we would expect from
an intelligent system) and looking across disciplines available solutions that tend to simulate diagrams of human behavior, evaluation and analysis of environmental suggestions or creative activity. Apposite working-out of artificial intelligence and understanding of the distribution of the various definitions make [2], they are differentiated two dimensions: whether evaluated thought processes. Judgement on the one handor behavior on the other side • whether they are evaluated as a success by similarity to human action or the perfect idea of intelligence - the so-called. prudence. The system is sensible, if doing the right thing.
• Whether is evaluated the thought process. The reasoning on the one hand or behavior on the other side
• If success is evaluated by similarity to human action or by perfect idea of intelligence - the so-called. sensible. The system is sensible if it is doing the right thing.
Field of artificial intelligence
For solving the problems of artificial intelligence and intelligent manufacturing systems are making experiment with different algorithms, tools, methods and their combinations, which include:
• semantic network, • production rule, • expert systems, • neural networks, • fuzzy logic, • machine learning theory (machine learning), • genetic algorithms and others.

InvEnt 2013
26
2. KNOWLEDGE ENGINEERING
Knowledge Engineering (Knowledge Engineering) can currently be regarded as a real
engineering discipline aimed at supporting the practical applications of theoretical and experimental results of academic artificial intelligence [3]. The range of possibilities of computer knowledge is conditional upon to what extent we are able to provide a suitable conceptual system to describe the problem and on the form which is represented by using symbols. The mission of knowledge-based systems is make to assist in solving problems for them even though we do not know solving algorithmic procedures but we are solvable using productive methods utilizing knowledge. Expert systems are knowledge-based systems to solve technical problems. These systems are based on special knowledge not on the general knowledge. Expert systems are given the special character of expertise and they are considered for subclass of knowledge-based systems Their specificity consists in the fact that there we can use the knowledge and solving procedures which were created by experts in their profession. So expert systems are created to solve problems which are usually delegate to experts. Part of the "intelligence" expert system is its ability to explain and justify their solving procedures based on the knowledge. This is an important feature that allows the user of expert system to assess the level of expertise embodied system and on this base, to identify the solution possibly modify it or reject it. When could help us knowledge and expert system?
This is in cases if may answer positively at least some of the following questions: 1) Is there hardly substitutable specialist in the company - holders of know-how who is
independent for the production?
2) Are there specialists whose company needs not so much and those employed who are
constantly overloading by work responsibilities?
3) Is there difficulty with compliance technology discipline even if the workers are responsible
approach to their duties? 4) Is it possible that the company has reduced consumption the inputs.
(Eliminate the creation of downtime, non-conforming products should be managed accurately
observe operational discipline)
5) Are there a hazardous operation?

InvEnt 2013
27
3. DATABASE FOR SUPPORT INTELLIGENT MANUFACTURING
SYSTEM
The most appropriate but also the most expensive way is to automatically collect and evaluate data on the exact behavior of the production facilities. In this way it is possible to record all downtime. Companies which have implemented automatic data collection system from the production process shall avoid of errors made by the worker since such systems work automatically and almost with zero involvement of the human factor. The company determines itself which data should be collected in the depth and what is important to evaluate and subsequently visualized. Machine operator need not write out unnecessarily various forms for data collection, the error process of production, confusions, downtimes, failures of the process etc.
Benefits of automatic data collection from the manufacturing process:
• zero participation operator writing, • automatic collection of all relevant data, • store data into databases, • immediate evaluation, • the possibility of immediate response to occurrence of abnormality, disorder • low risk of errors, • to create facts and knowledges.
Disadvantages of automatic data collection from the manufacturing process:
• financially and time more demanding solution, • technical difficulty of construction
Fig. 1. Automatic data collection
References
[1] ENGELMORE,R.S.–FEIGENBAUM,E. Expert systems and artificial intelligence. [2] KELEMEN, J. – FTÁČNIK, M. – KALAŠ, I. – MIKULECKÝ, P. 1992. Fundamentals of
Artificial Intelligence. 1. Publ. Bratislava : ALFA, 1992. 400 s. ISBN 80-05-00957-7. [3] MAŘÍK, V. – ŠTEPÁNKOVÁ, O. – LAŽANSKÝ, J. a kol. 1997. Artificial Intelligence(2) 1. Publ. Praha : Academia, 1997. 367 s. ISBN 80-200-0504-8 [4] POPPER, M. – KELEMEN, J.: Expert system. 1. Publ. Bratislava: Alfa 1989, 360 s., ISBN 80 -05-00051-0
InvEnt 2013
28
Method OWAS, Static Strength prediction , Low Back Analysis ,evaluation working position
Jana ČUCHRÁNOVÁ*, Ján ŠESTÁK**
ANALYSIS OF WORKING POSTURES DURING THE
WORK USING OWAS METHOD, STATIC STRENGHT
PREDICTION AND LOW BACK ANALYSIS Abstract
This article deals with evaluation of position and workload during execution of
work task method OWAS, Static Strength prediction and Low Back Analysis
Musculoskeletal injuries as a result of physical activity usually have common
origin, overload of bodily structures such as joints, tendons, ligaments and
muscles. Congestion results from repeated motion or too unnatural posture.
Work analysis was done in company producing plastic moldings on production
facilities - ARBURG. Experimental verification methods was performed using
software module Tecnomatix Jack.
1. INTRODUCTION
Continuous development of science and technology brings new technology, machinery,
equipment and work methods. This can cause conflict and imbalance between demands and requirements and worker skills. This may result in human factor overloading, leading to fatigue failure, injury or even crash. In addition to risks that translate potential threats, ill health, injury or even death, there are a number of factors that directly endanger human health. Their effect, however, may gradually accumulate and injury manifests itself over time. These are mostly factors that affect human musculoskeletal system through the action of forces and moments. There is a number of methods that help to address and eliminate all adverse factors. The paper deals with evaluation of working posture and load during work method OWAS, Static Strength prediction and Low Back Analysis. 2. TERMS FOR ANALYSIS EXECUTION
In terms of work physiology it is important to review working position in performance of work
tasks. To realize the analysis, Owas method was chosen for workers with working position in collection and sorting runners and molding for equipment ARBURG 320. This occupation is * Ing. Jana Čuchránová, Technical University Košice, Faculty of Mechanical Engineering, Department of Industrial Engineering and Management, Boženy Nemcovej 32, [email protected] ** Ing. Ján Šesták, Technical University Košice, Faculty of Mechanical Engineering, Department of Industrial Engineering and Management, Boženy Nemcovej 32, [email protected]

InvEnt 2013
29
characterized by monotony of forced labor rate. Worker can choose work pace and work is subject to work rhythm. The reason for using selected method was relatively simple and understandable: assessment of discomfort on job position of back, arms and legs and load size . Analyzed workers working position is shown in Fig. 1.
In Fig. 2 is a model of man in working position created by software Tecnomatix Jack.
Fig. 1. Analyzed workers working position Fig. 2 Model of man by software Tecnomatix Jack [3]
3. CHARACTERISTIC OF OWAS METHOD
Method OWAS - Ovako Working Analysis System, based their findings on observations of various staff positions in course of work task. To identify 252 different positions because of possible combinations back position (4 positions), hands (3 positions), leg (7 positions) and load power (3 phase load). The result is method Owase numerical code, total employee load in performance of work tasks, while expressing the need for ergonomic changes in the workplace. [1]
Evaluation of method OWAS
Tab. 1 Category of risk for method OWAS[4] Category of
risk Effects on the musculoskeletal system Corrective Action
1 Normal posture without harmful effects on the musculoskeletal system.
No action required
2 Position with the possibility of damage to the musculoskeletal system.
Corrective actions are needed in the near future.
3 Position with harmful effects on the musculoskeletal system.
Corrective actions are needed ASAP.
InvEnt 2013
30
4
The burden caused by this approach is extremely harmful effects on the musculoskeletal system.
Corrective action is required immediately.
Application of OWAS method
Given working attitude evaluation a number that indicates urgent evaluation by making correction workflow was assigned. Rating of workers position performing activities to press ARBURG 320 was entered into tables. 2. Tab. 2 Working positions of workers during work activities
Part of body Position Code of
position
Back Back bent 2 Arms Both arms of the worker are located under the
shoulder level. 1
Leg Position Standing or squatting with both legs bent and the weight balanced between both
4
Loads and forces supported
Less than 10 kg. 1
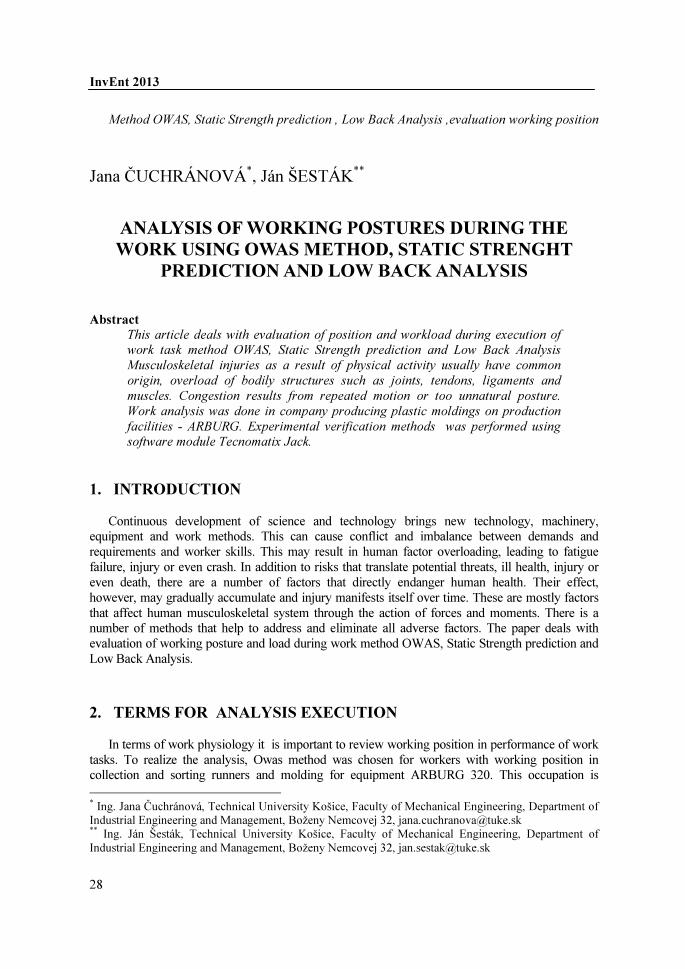
Tab.3 Risk categories and positions codes [4]
The evaluation of position of workers showed that overall burden of musculoskeletal
disorders in risk category 3.
Evaluation of OWAS method using Tecnomatix Jack software

InvEnt 2013
31
A model of worker performing a given work task was created using Tecnomatix Jack software. On this basis, software was chosen for analyzing the activity of Owase method. Control software evaluation confirmed that risk category of worker working position reaches 3, what is position of harmful effects on musculoskeletal system.
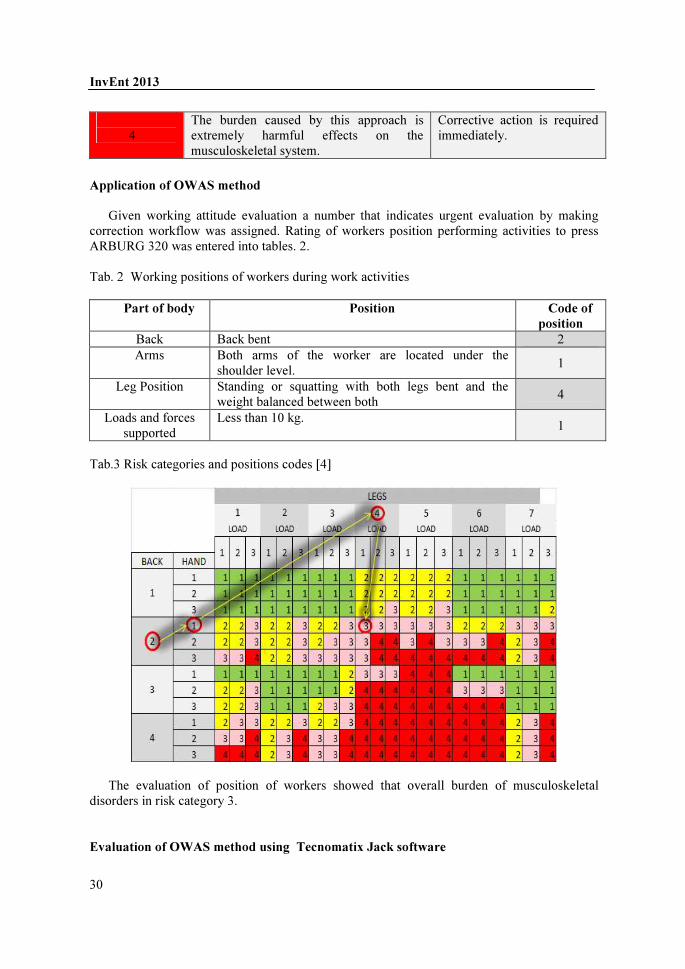
Fig. 3 Control OWAS evaluation methods using Tecnomatix Jack Static Strength Prediction [6]
The Static Strength Prediction tool helps you evaluate the percentage of a worker population that has the strength to perform a task based on posture, exertion requirements and anthropometry. Based on strength studies performed over 25 years at the University of Michigan Center for Ergonomics, the Strength Prediction tool:
- Aids in analyzing material handling tasks involving lifts, lowers, pushes and pulls requiring complex hand forces, torso twists and bends,
- Predicts the percentage of men and women who have the static strength to perform the prescribed job,
- Evaluates jobs in real-time, flagging postures where the requirements of a task exceed NIOSH or user-specified strength capability limits.
The Static Strength Prediction tool is used to:
- Analyze whether all workers will have the strength to perform a prescribed job,
- Identify the tasks of a job where the strength requirements exceed the capabilities of a worker population,
- Run "what-if" scenarios for manual task design or redesign by varying parameters that influence strength capability--posture and hand loads,
- Demonstrate to workers the proper postures for tasks.
InvEnt 2013
32
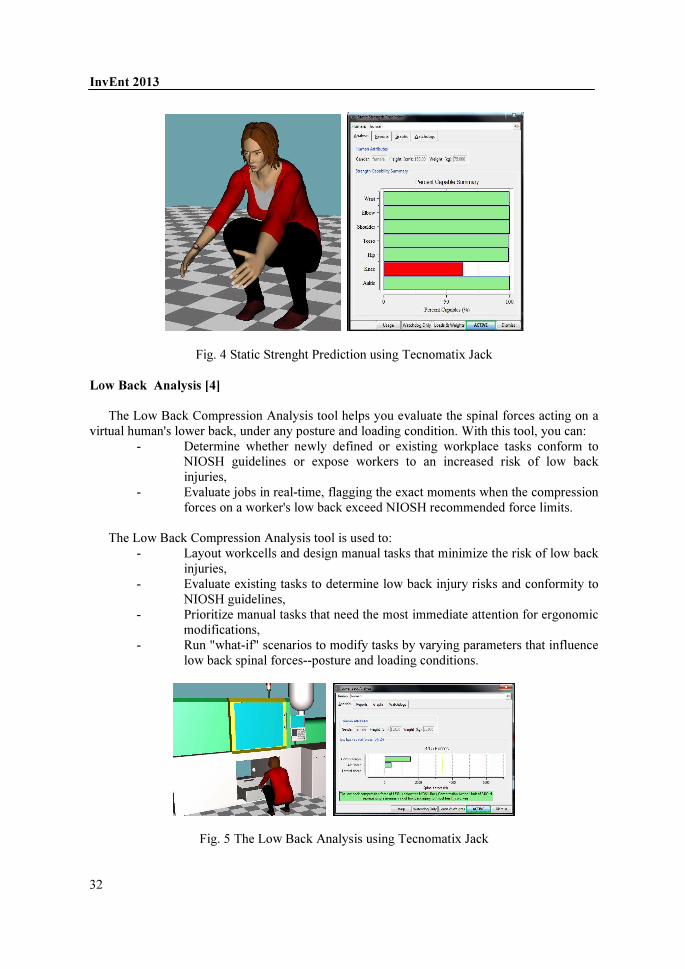
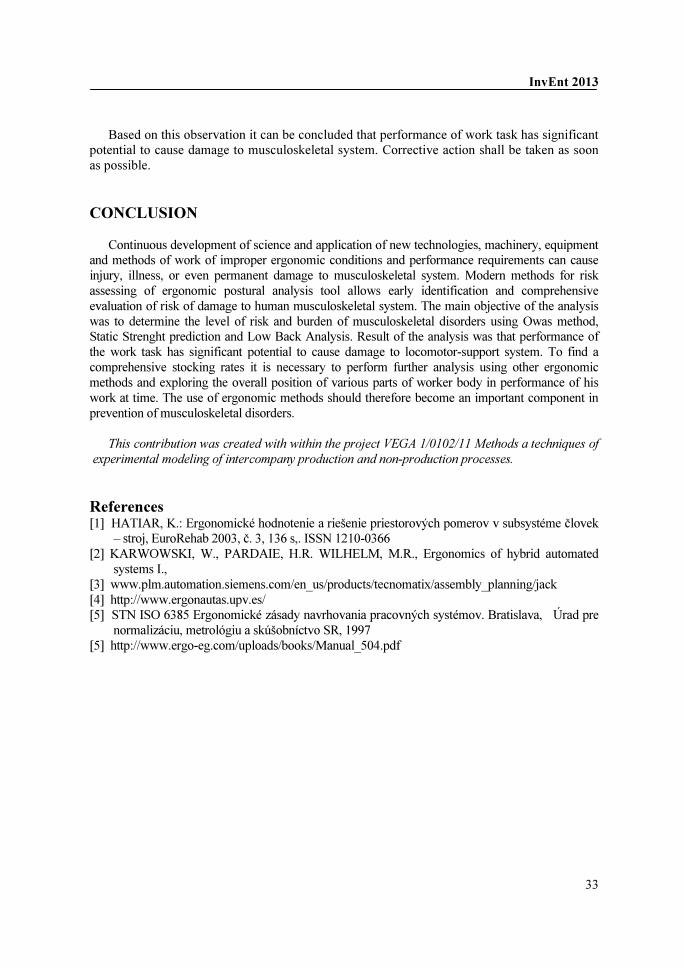
Fig. 4 Static Strenght Prediction using Tecnomatix Jack Low Back Analysis [4]
The Low Back Compression Analysis tool helps you evaluate the spinal forces acting on a virtual human's lower back, under any posture and loading condition. With this tool, you can:
- Determine whether newly defined or existing workplace tasks conform to NIOSH guidelines or expose workers to an increased risk of low back injuries,
- Evaluate jobs in real-time, flagging the exact moments when the compression forces on a worker's low back exceed NIOSH recommended force limits.
The Low Back Compression Analysis tool is used to:
- Layout workcells and design manual tasks that minimize the risk of low back injuries,
- Evaluate existing tasks to determine low back injury risks and conformity to NIOSH guidelines,
- Prioritize manual tasks that need the most immediate attention for ergonomic modifications,
- Run "what-if" scenarios to modify tasks by varying parameters that influence low back spinal forces--posture and loading conditions.
Fig. 5 The Low Back Analysis using Tecnomatix Jack
InvEnt 2013
33
Based on this observation it can be concluded that performance of work task has significant
potential to cause damage to musculoskeletal system. Corrective action shall be taken as soon as possible. CONCLUSION
Continuous development of science and application of new technologies, machinery, equipment
and methods of work of improper ergonomic conditions and performance requirements can cause injury, illness, or even permanent damage to musculoskeletal system. Modern methods for risk assessing of ergonomic postural analysis tool allows early identification and comprehensive evaluation of risk of damage to human musculoskeletal system. The main objective of the analysis was to determine the level of risk and burden of musculoskeletal disorders using Owas method, Static Strenght prediction and Low Back Analysis. Result of the analysis was that performance of the work task has significant potential to cause damage to locomotor-support system. To find a comprehensive stocking rates it is necessary to perform further analysis using other ergonomic methods and exploring the overall position of various parts of worker body in performance of his work at time. The use of ergonomic methods should therefore become an important component in prevention of musculoskeletal disorders.
This contribution was created with within the project VEGA 1/0102/11 Methods a techniques of
experimental modeling of intercompany production and non-production processes.
References
[1] HATIAR, K.: Ergonomické hodnotenie a riešenie priestorových pomerov v subsystéme človek – stroj, EuroRehab 2003, č. 3, 136 s,. ISSN 1210-0366
[2] KARWOWSKI, W., PARDAIE, H.R. WILHELM, M.R., Ergonomics of hybrid automated systems I.,
[3] www.plm.automation.siemens.com/en_us/products/tecnomatix/assembly_planning/jack [4] http://www.ergonautas.upv.es/ [5] STN ISO 6385 Ergonomické zásady navrhovania pracovných systémov. Bratislava, Úrad pre
normalizáciu, metrológiu a skúšobníctvo SR, 1997 [5] http://www.ergo-eg.com/uploads/books/Manual_504.pdf

InvEnt 2013
34
Business logistics, Computer simulation, Planning and optimization
Slavomír DILSKÝ∗, Miroslav HEGLAS∗∗, Milan GREGOR∗∗∗
COMPUTER SIMULATION – SUPPORT TOOL FOR
PLANNING AND OPTIMIZATION OF LOGISTIC
PROCESSES
Abstract
This article deals with description of use of computer simulation in planning and
optimization of business logistics. Article tries to define several areas in which
simulation, as one tool for decision support system, can deal in transport and
storage systems in company.
INTRODUCTION
Area of business logistics belongs now in many companies to key areas in terms of
productivity growth. Achieve certain change in improving productivity, quality of output and cost reduction implies clear definition of objectives, defining architecture of enterprise logistics, defining necessary resources and in particular complex system of enterprise logistics operations. In transformation of existing systems on future states arises large number of questions about functioning of future conditions because interactions of all systems in enterprise. Therefore in recent years it starts to promote systems that try to detect problems at work planning logistics system before starting operation. One of those tools used in planning or improvement stage of logistics processes is computer simulation.
1. COMPUTER SIMULATION
Computer simulation is one tool for manager’s decision support and according to Gregor
(1997) may be included in statistical experimental methods. It works on same theoretical basis as estimation methods in mathematical statistics. Its basic principle (Gregor, 1997) consists of simplified representation of real system with simulation model describing only these characteristics of real system that we are interested in terms of study. After verifying logical correctness and validity of simulation model experimenter realizes set of simulation experiments. In these simulation experiments he designs various improvements in modelled ∗ Ing. Slavomír Dilský – Department of Industrial Engineering, Faculty of Mechanical Engineering, University of Žilina, Univerzitná 8215/1, 010 26 Žilina, [email protected]
∗∗ Ing. Miroslav Heglas – Department of Industrial Engineering, Faculty of Mechanical Engineering, University of Žilina, Univerzitná 8215/1, 010 26 Žilina, [email protected] ∗∗∗ prof. Ing. Milan Gregor, PhD. – Department of Industrial Engineering, Faculty of Mechanical Engineering, University of Žilina, Univerzitná 8215/1, 010 26 Žilina, [email protected]
InvEnt 2013
35
system and verifies impact of changes on this system. Results of these experiments are re-applied to real system to improve his properties. Every change is made in virtual enterprise and therefore we can decide which alternative is suitable for us before we implement this change in real state.
2. BUSINESS LOGISTICS
Business logistics is used (Krížová, 1994) in support of business objectives, it is set of
tasks, from which it arises actions to ensure optimal material, information and value flow in company transformation processes. Mutual alignment of individual flows, that interact with each other is very difficult. Modern tools make it possible to provide affective support when deciding how to efficiently use available resources to achieve different objectives. Such tools are particularly needed if there are many possible solutions and it is not easy to pick out the best, or is difficult to find solution that would suit the situation. Using suitable optimization algorithm integrated into decision support tool, it is possible to find one or more suitable solutions, which are then provided to person responsible for decision-making in field and facilitate decision on given issue.
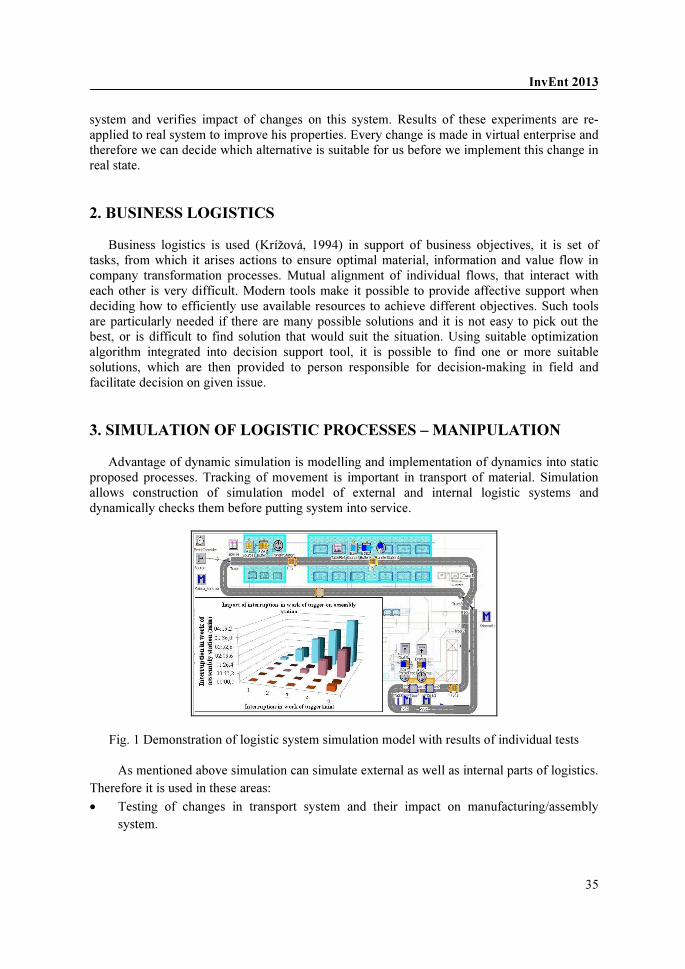
3. SIMULATION OF LOGISTIC PROCESSES – MANIPULATION
Advantage of dynamic simulation is modelling and implementation of dynamics into static
proposed processes. Tracking of movement is important in transport of material. Simulation allows construction of simulation model of external and internal logistic systems and dynamically checks them before putting system into service.
Fig. 1 Demonstration of logistic system simulation model with results of individual tests
As mentioned above simulation can simulate external as well as internal parts of logistics. Therefore it is used in these areas:
• Testing of changes in transport system and their impact on manufacturing/assembly system.
InvEnt 2013
36
• Testing of various types of goods delivery to workplace (direct supply on demand, milk run circuits etc.).
• Testing of manipulation equipment changes and their capacity on system
• Testing of transport tasks priority changes and their impacts on ability to ensure planned amount of products.
• Monitoring effects of crossroads and solving of transport hubs for utilization of transport equipment.
• Testing impact of transport equipment failure on supply of material.
• Thanks to detailed monitoring of statistics during these processes we can watch following data:
• Utilization of equipment – precise division activities of such equipment as forklifts/ logistics tuggers.
• Amount of material delivered system respectively ability to comply supplies for some workstations.
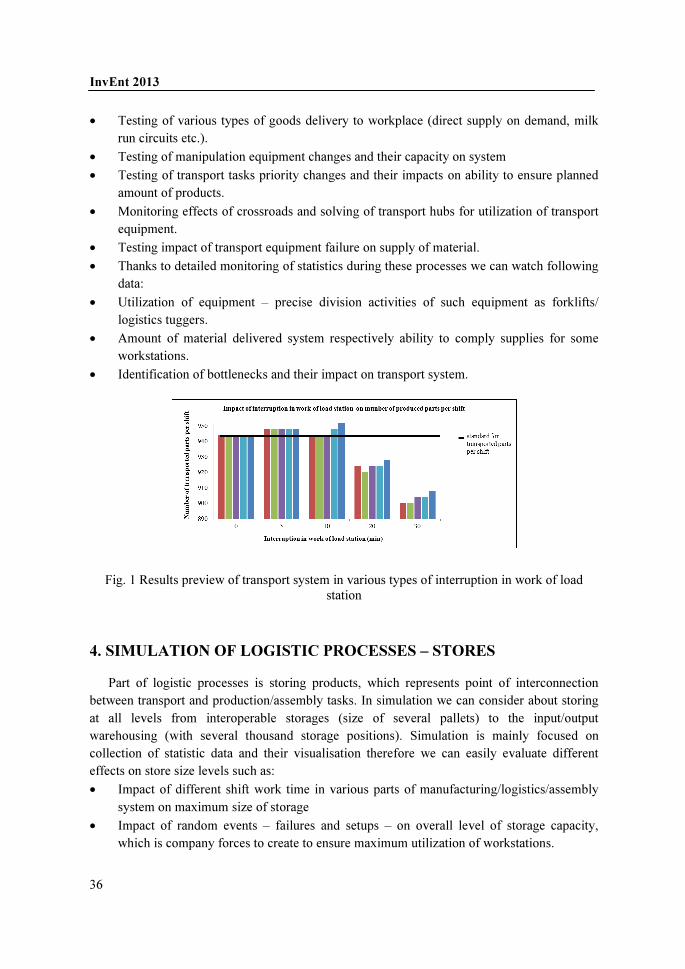
• Identification of bottlenecks and their impact on transport system.
Fig. 1 Results preview of transport system in various types of interruption in work of load station
4. SIMULATION OF LOGISTIC PROCESSES – STORES
Part of logistic processes is storing products, which represents point of interconnection
between transport and production/assembly tasks. In simulation we can consider about storing at all levels from interoperable storages (size of several pallets) to the input/output warehousing (with several thousand storage positions). Simulation is mainly focused on collection of statistic data and their visualisation therefore we can easily evaluate different effects on store size levels such as:
• Impact of different shift work time in various parts of manufacturing/logistics/assembly system on maximum size of storage
• Impact of random events – failures and setups – on overall level of storage capacity, which is company forces to create to ensure maximum utilization of workstations.

InvEnt 2013
37
Fig. 3 View over number of pallets in output warehouse for different kinds of products
CONCLUSION
Perception of logistics has changed considerably. Logistics costs are from 10 to 30 % of total company expenses. How much money will be spent on logistics depends on planning and logistics planning is based on productions requirements, which follows requirements of customer. Ensure requirements of production and customers at the lowest possible costs has become increasingly demanding in today’s turbulent times. Therefore in recent years companies demonstrated effort to examine impact of planned changes in work systems of external and internal material flows in order to achieve maximum utilization of existing resources, thereby increasing productivity and competitiveness of enterprises. Computer simulation cannot provide solutions, but can test proposing solutions and facilitate work of managers in decision making between several alternative solutions.
„We support research activities in Slovakia/ Project ITMS 26220220155 is co-financed by
the EU.“
References
[1] GREGOR, M. – KOŠTURIAK, J. – HALUŠKOVÁ, M. 1997. Priemyselné inžinierstvo:
Simulácia výrobných systémov. Žilina : Jozef BLAHA, 1997. 166 s. ISBN 80-966996-8-7.
[2] KŘÍŽOVÁ, E.; GREGOR, M. a RAKYTA, M. 1994.Podniková logistika. 1. vyd. Žilina: Vysoká škola dopravy a spojov v Žiline, 1994. 197 s. ISBN 80-7100-201-1
[3] WIĘCEK, D.: Wprowadzenie do procesów logistycznych w przedsiębiorstwach produkcyjnych. Wydawnictwo Naukowe Akademii Techniczno-Humanistycznej, Bielsko-Biała 2011. - 122 s.: il. ; 25 cm. - ISBN 978-83-62292-90-5.

InvEnt 2013
38
Simulation model, Zilina intelligent manufacturing system, Plant simulation
Slavomír DILSKÝ∗, Tomáš KASANICKÝ∗∗
SIMULATION MODEL OF ZILINA INTELLIGENT
MANUFACTURING SYSTEM - ZIMS
Abstract
This article deals with description of nascent simulation model of Žilina intelligent manufacturing system (ZIMS), possibilities of applications and further orientation of its development and use in connection with areas developed by department of industrial engineering in Žilina.
1. ZIMS – ZILINA INTELLIGENT MANUFACTURING SYSTEM
University of Žilina in collaboration with its spin-off Central European Institute of
technology (CEIT) decided to support preparation of students and practitioners for future business environment using latest global approaches and results of own research. Research centres of Žilina University and CEIT cooperate on creating and building intelligent manufacturing concept which is called ZIMS – Žilina intelligent manufacturing system. In addressing research projects were gradually built:
• Laboratory ZIMS, • department for research and application of digital factory, • department for designing manufacturing systems with support of wirtual reality,, • MPS – modular production system (Festo), • department for research intelligent mobile systems, • department for reverse engineering based on 3D laser scanning technology, • department for research technology of Rapid Prototyping • department for research technology of Vacuum Casting, • department for research technology of bionics and biomedical engineering, • department for research technology of using image analysis in industrial applications.
∗ Ing. Slavomír Dilský – PhD. student, Department of Industrial Engineering, Faculty of Mechanical Engineering, University of Žilina, Univerzitná 8215/1, 010 26 Žilina, [email protected]
∗∗ Bc. Tomáš Kasanický – student, Department of Industrial Engineering, Faculty of Mechanical Engineering, University of Žilina, Univerzitná 8215/1, 010 26 Žilina, [email protected]
InvEnt 2013
39
2. ZIMS SIMULATION MODEL
Production system which is part of ZIMS laboratory consists of several parts such as
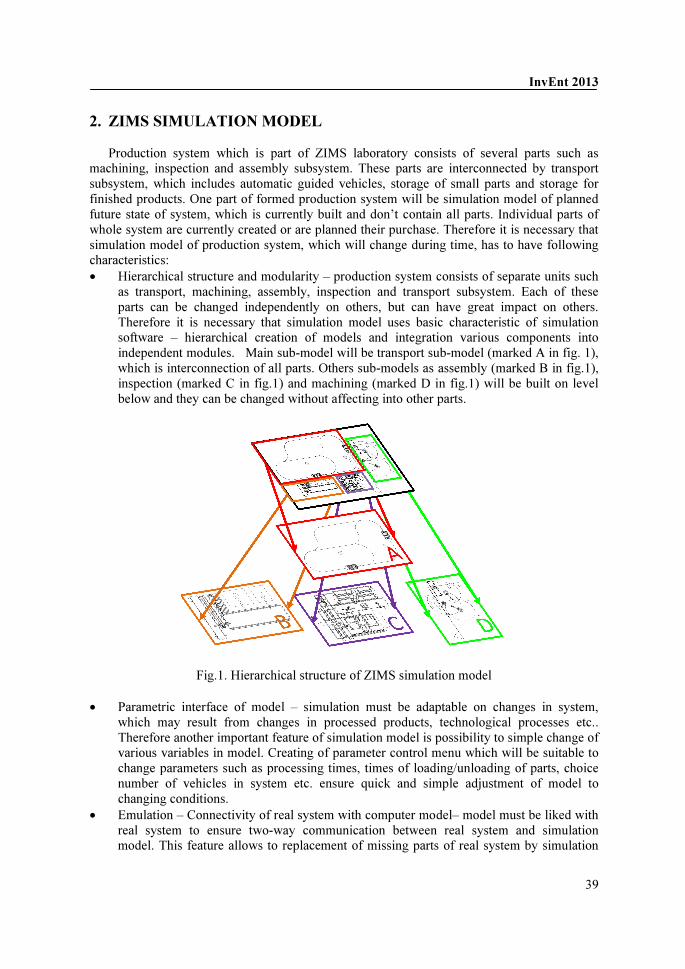
machining, inspection and assembly subsystem. These parts are interconnected by transport subsystem, which includes automatic guided vehicles, storage of small parts and storage for finished products. One part of formed production system will be simulation model of planned future state of system, which is currently built and don’t contain all parts. Individual parts of whole system are currently created or are planned their purchase. Therefore it is necessary that simulation model of production system, which will change during time, has to have following characteristics: • Hierarchical structure and modularity – production system consists of separate units such
as transport, machining, assembly, inspection and transport subsystem. Each of these parts can be changed independently on others, but can have great impact on others. Therefore it is necessary that simulation model uses basic characteristic of simulation software – hierarchical creation of models and integration various components into independent modules. Main sub-model will be transport sub-model (marked A in fig. 1), which is interconnection of all parts. Others sub-models as assembly (marked B in fig.1), inspection (marked C in fig.1) and machining (marked D in fig.1) will be built on level below and they can be changed without affecting into other parts.
Fig.1. Hierarchical structure of ZIMS simulation model
• Parametric interface of model – simulation must be adaptable on changes in system, which may result from changes in processed products, technological processes etc.. Therefore another important feature of simulation model is possibility to simple change of various variables in model. Creating of parameter control menu which will be suitable to change parameters such as processing times, times of loading/unloading of parts, choice number of vehicles in system etc. ensure quick and simple adjustment of model to changing conditions.
• Emulation – Connectivity of real system with computer model– model must be liked with real system to ensure two-way communication between real system and simulation model. This feature allows to replacement of missing parts of real system by simulation

InvEnt 2013
40
model for real-time testing such situations that may occur in system before implementation of missing parts of system.
• Participation of students on creation of model – priority objective of ZIMS is preparing students for practice and therefore simulation model will be work of students. Involving students ensure maintenance of model, while students will be prepared on creation of simulation models in term of real plants.
2.1. Current state of ZIMS simulation model
Developing of model was based on assumption that system will produce cubicle product
that contain 4 or more components. Box of assembly composition travels on machining operations then on inspection and then on assembly system where it forms basis of assembled product. Small parts, which are inserted into box, are picked on system pallet and travels from input storage to assembly workplace, where are moved using longitudinal link and checked for completeness of components in pallets. Then pallet is moved on conveyor and into assembly area where components from pallets are inserted into box. After assembly is complete product transported to storage of finished products. At present there are completed two parts of model – transport submodel of AGV system (part 1 in fig. 2) and assembly sub-model (part B in fig 2). In creating the model it was consider with estimates of each part work system therefore model is created as first parametric version with regard to fact that some parameters can be changed.
Fig. 2. Existing sub-models created in Plant Simulation
2.2. Future steps in completing of ZIMS simulation model To full completion and fulfilment model properties, those have been mentioned above. It is
necessary to take following actions and so ensure full functionality of model: • Completion of machining and inspection sub-models – the first condition is complete
missing sub-models for machining and inspection parts of system and resolve any
InvEnt 2013
41
changes in whole system that can occur when creating the system and were not captured in current state of simulation model
• Parameterization of model – after completion of model next step is to create parametric control menu of model, for setting variables in model to cover changes in different parts of system, that will bring change of processed product etc..
• Linking model and real system – last step is to connect computer model to all parts of real system to ensure data collection respectively transmission of information between virtual and real system.
2.3 Use of simulation model
Created model will be used to: • Testing of system future states – priority of simulation models is to test future systems
and “what if” situations by changing various parameters if system. Therefore also this simulation model will be used to test parameters such as number of system pallets, number of needed AGV tuggers and system of their work, allocation of storages for input components and final products etc..
• Data collection for other areas of research – knowledge management – because data collection and publish details of real factory production process is currently very difficult because companies take maximum effort to not disclose information for competitors, simulation model of ZIMS test facility can serve as basis for data collection for knowledge system under which proves functionality of such knowledge system based on data close to real conditions of practise.
• Teaching students – simulation model will not be used only in laboratory ZIMS, but after completion will be used to teach students to better understand possibility of simulation uses in practise.
Department ZIMS is unique by involving students into creating process and therefore building and developing its parts, into which we can include also simulation model, will help students better to prepare for industrial practise and accelerate implementation of ideas of future shape of this department into real state.
This paper was made about research work support KEGA no. 070ŽU-4/2012.
References
[1] CEIT. 2013. Žilinský inteligentný výrobný systém [online]. 2013, [cited 10.5.2013]. <http://ceit-europe.com/index.php/vyskum-vyvoj-a-rozvoj/inteligentny-vyrobny- system.html?lang=sk_SK.u tf8%2C+sk_SK.UTF-8%2C+sk_SK.UTF8%2C+sk_SK%2C+svk_SK%2C+sk%2C+slovak>.

InvEnt 2013
42
Innovations, Innovativeness, Competitiveness
Irena DUDZIK-LEWICKA*, Aneta MADYDA
**
THE ATTITUDE OF ENTERPRISES TOWARDS
INNOVATIONS
Abstract
The present paper attempts to analyze and evaluate the level of innovativeness of
production-oriented enterprises found in the region of Bielsko-Biała. The area
stands out in the Silesian province and the Polish country in general as an area
that can boast great capabilities of a parallel development of both industry and
tourism. A big industrial potential, specialized personnel, the existence of many
scientific-research institutes, as well as an active presence of institutions
supporting the development of entrepreneurialism – all constitute factors expected
to enhance innovative activity. Nevertheless, research results clearly show that it’s
only a theory and managers’ decisions are contradictory with these theoretical
premises. The results exhibit poor innovativeness of the enterprises analyzed.
1. INTRODUCTION
In developed market economies, there is one deeply-rooted assumption which entrepreneurs have only recently started to realize, namely that the capability of enterprises to absorb innovations is one of the most important manifestations of their modern character, effectiveness and productivity. Therefore, nowadays, innovations are considered as a rudimentary factor of the development of enterprises, a factor which contributes to the enrichment of the market in new high-quality products and services, as well as organizational reconstructions inside the enterprise and of its environment.
Innovations and innovativeness should be seen as a broad and complex set of resources meant to improve the capability of management, to establish firm competitive positions, as well as to make it possible for enterprises, national markets and societies to gain economic profits. The capacity to obtain such benefits is realized through the category of competitiveness [5].
* Irena Dudzik-Lewicka, Ph.D. Eng, Akademia Techniczno-Humanistyczna in Bielsko-Biała,
Aneta Madyda, Ph.D. Eng, Akademia Techniczno-Humanistyczna in Bielsko-Biała, [email protected]
InvEnt 2013
43
Innovations play a decisive role when it comes to a company’s competitiveness, i.e. its capability to survive on the market. The fact that much attention has been paid to innovativeness as a factor shaping competitiveness is attributable to several premises. First of all, innovativeness is a factor that is bound to many other factors influencing the improvement of competitiveness, both at input and output, which suggests an impact on the general efficiency of a company’s actions. Secondly, the impact of innovations on the remaining factors from the point of view of competitiveness generally has a synergically positive character; it is possible to prove that innovations have a strong influence on the shape of market demand [1]. Therefore, a popular claim that the introduction of innovations is hazardous is not true; on the contrary, the lack of innovations may jeopardize a company’s well-being [2]. The conclusion is clear: the introduction of innovations should form a part and parcel of a strategy of every enterprise.
According to the results of a research conducted in 2006 by The Boston Consulting Group, innovations were a top strategic priority for 40% of world companies, and found their place in the three top positions on the list of priorities for over 70% of companies. More than 90% of managers confirmed that organic growth thanks to innovations is absolutely essential to achieve a success in their field of business activity. Nearly every three out of four companies admitted that innovative breakdown is indispensable [3].
A research conducted by the Polish Confederation of Private Employers Lewiatanregarding the innovativeness of Polish enterprises showed that the idea of building a company’s competitive position based on innovations is not favored by Polish managers. Definitely, the majority of managers declare that they prefer actions aimed at cost saving, and in turn decreasing the prices of products. The issue of price is of less concern to medium enterprises (66,5% of companies point to price as one of the top three factors supporting the establishment of their competitive position) than to small and micro-companies (77,1%). Only 1% of the enterprises exposed to analysis put emphasis on innovative products. 9,3% of small, 9,2% of medium, and only 5,7% of micro-companies point to the innovative character of products or services as one of the top three factors enhancing their competitive position. 51% of the analyzed companies point out the lack of investments. This means that the group of non-investing businesses will not be able to face the demands and challenges of the competitive and innovative economy. The results show this explicitly [4].
The issues signaled in the research already discussed have inspired the authors of the present paper to conduct a similar analysis in the region of Bielsko-Biała in order to verify and evaluate the attitude of local enterprises towards innovations.
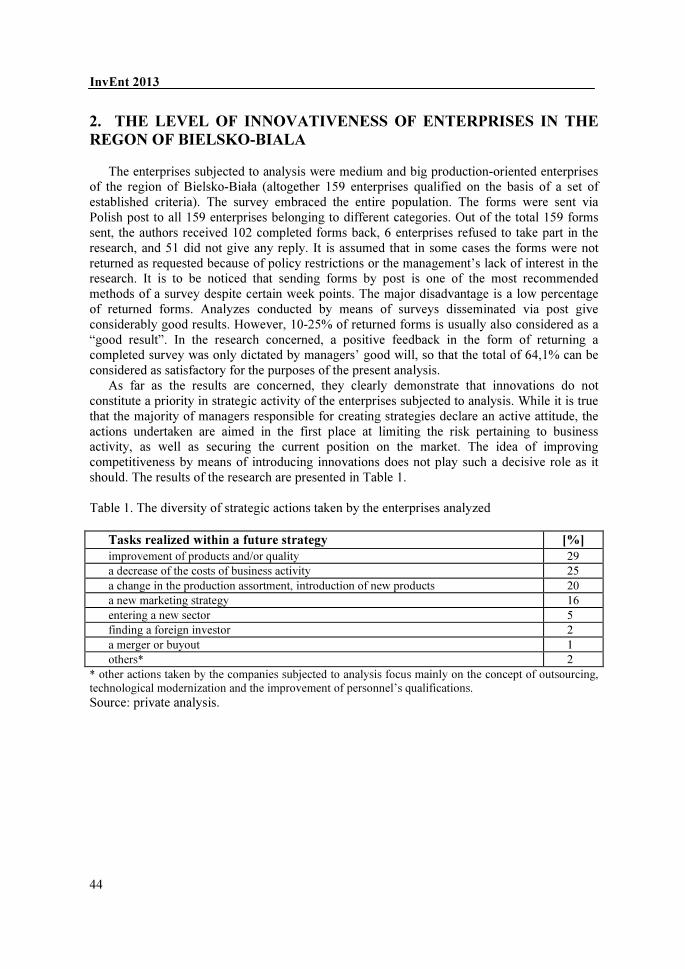
InvEnt 2013
44
2. THE LEVEL OF INNOVATIVENESS OF ENTERPRISES IN THE
REGON OF BIELSKO-BIALA
The enterprises subjected to analysis were medium and big production-oriented enterprises
of the region of Bielsko-Biała (altogether 159 enterprises qualified on the basis of a set of established criteria). The survey embraced the entire population. The forms were sent via Polish post to all 159 enterprises belonging to different categories. Out of the total 159 forms sent, the authors received 102 completed forms back, 6 enterprises refused to take part in the research, and 51 did not give any reply. It is assumed that in some cases the forms were not returned as requested because of policy restrictions or the management’s lack of interest in the research. It is to be noticed that sending forms by post is one of the most recommended methods of a survey despite certain week points. The major disadvantage is a low percentage of returned forms. Analyzes conducted by means of surveys disseminated via post give considerably good results. However, 10-25% of returned forms is usually also considered as a “good result”. In the research concerned, a positive feedback in the form of returning a completed survey was only dictated by managers’ good will, so that the total of 64,1% can be considered as satisfactory for the purposes of the present analysis.
As far as the results are concerned, they clearly demonstrate that innovations do not constitute a priority in strategic activity of the enterprises subjected to analysis. While it is true that the majority of managers responsible for creating strategies declare an active attitude, the actions undertaken are aimed in the first place at limiting the risk pertaining to business activity, as well as securing the current position on the market. The idea of improving competitiveness by means of introducing innovations does not play such a decisive role as it should. The results of the research are presented in Table 1.
Table 1. The diversity of strategic actions taken by the enterprises analyzed
Tasks realized within a future strategy [%]
improvement of products and/or quality 29
a decrease of the costs of business activity 25
a change in the production assortment, introduction of new products 20
a new marketing strategy 16
entering a new sector 5
finding a foreign investor 2
a merger or buyout 1
others* 2
* other actions taken by the companies subjected to analysis focus mainly on the concept of outsourcing, technological modernization and the improvement of personnel’s qualifications.
Source: private analysis.

InvEnt 2013
45
The analysis of enterprises functioning in the region of Bielsko-Biała clearly shows that in the group of investing companies, innovations have mostly qualitative character, i.e. related to the improvement of products by means of concentrating on their quality. A huge percentage of analyzed companies base their business strategies on cost-saving, so they emphasize their competitiveness as dependent on the concept of cost. A third group is constituted by innovations enhancing productivity, related mostly to modification in production assortment through the introduction of new products. It is to be said that the obtained results underline poor evaluation of innovativeness of the local companies. The only positive fact is that in comparison with the research conducted by Lewiatan, definitely fewer companies in the Bielsko-Biała region focus on cost-saving when compared to innovative activity. Undoubtedly, in order to survive on the market, it is necessary to launch new products, start new processes, i.e. make changes which have a bigger influence on competitiveness than cost-saving. It seems that the companies analyzed which declare the necessity to search for and implement innovations when competing with their business rivals stand a big chance to maintain their current share in the market.
The results obtained thanks to the information offered by medium and big enterprises of the Bielsko-Biała region show that enterprises employing 50-149 and those employing 150-249 employees are inclined to go for a strategy based on product improvement (31% and 28% accordingly), cost-saving (22% and 25% accordingly), a change in production assortment (19% and 20% accordingly). Enterprises employing 250-999 employees and those employing more than 1000 employees tend to choose a strategy based on the improvement of their products (29% and 33% accordingly), as well as cost-saving (also 29% and 33% accordingly). 22% of enterprises employing 250-999 employees, and 17% of companies employing more than 1000 people, opt for modifications in production assortment. However, actions taken in the group of medium and big enterprises are diversified. Whereas medium companies claim to focus on actions aimed at the improvement and quality enhancement of their products, big enterprises (perhaps for fear of competition from abroad) focus on the protection of their current position. The most frequent step taken is cost-saving and the improvement of the quality of produced assortment.
The results provided in Table 5 illustrate the answers given by two groups of enterprises: those which possess and those lacking a share in foreign capital. The preferred action is to improve products and enhance their quality (companies with a foreign capital – 38%, companies without a foreign capital – 28%). On the other hand, cost-saving is favored by 32% of companies with a foreign capital, and by 23% of companies without it. A change of production assortment through the introduction of new products is planned by 16% of companies with a foreign capital, and by 21% of companies without such resources. Therefore, having analyzed the answers given by the respondents with and without a foreign capital we can see the lack of significant discrepancies between the two groups. Thus, it can be inferred that both groups opt for the realization of similar goals.

InvEnt 2013
46
CONCLUSIONS
The results obtained through our analysis let us formulate certain final conclusions. When we compare the results of the present analysis with the results obtained by The Boston Consulting Group, we can observe certain visible differences in the approaches towards management. The priorities of the managers of world companies are far different from those declared by the managers of production-oriented companies from the Bielsko-Biała region, as well as the strategies of Polish companies in general. Innovations do not constitute a top strategic priority for Polish enterprises. There comes a question for the reason of such a status quo. What is the cause of the apparent lack of interest in innovations?
For sure, there are certain limitations which have an influence on decisions about strategies of development taken by the enterprises of the Bielsko-Biała region. There are limited investing possibilities (poor accessibility to capital), which hinder the construction of new objects, the purchase of new machinery and tools, as well as the introduction of any kinds of innovations. However, even if we assume that poor accessibility to capital makes it difficult for some companies to implement any innovations, it is always possible to look for alternative means of handling this situation. It often turns out that a solution comes in the form of a foreign partner. Nevertheless, if we have a look at the results presented in Table 1 above, it is clear that only 2% of the managers asked opt for such a solution even though foreign partners bring in capital, technologies, modern methods of management, organization and marketing. Thus, it can be claimed that foreign enterprises can become an effective stimulus on the Polish market, stirring the innovativeness of the companies found in the Bielsko-Biała region, and stimulate economic growth of the region.
Secondly, the lack of interest in innovations can be attributable to the lack of proper cooperation between enterprises and scientific-research centers and institutes whose top-priority task is a support for the development of entrepreneurialism in the region. Our thorough and long-lasting observations let us see this cooperation as rather poor and negative. It can be noticed that the two sides mentioned are ready to fight rather than cooperate. Those who favor a pragmatic attitude point out scientists’ lack of practical knowledge. On the other hand, scientists claim that managements have insufficient theoretical grounds. Sure enough, both sides are right up to some point, but nevertheless this antagonistic attitude does not bring any good; just the contrary, it brings negative consequences, especially for entrepreneurs.
Thirdly, the lack of interest in innovations may come from the fact that the entrepreneurs answering the survey may share a point of view consistent with the general tendencies (as shown by the research done by Lewiatan), namely that local products are far more attractive as far as price is concerned when compared to their equivalents from the European Union. Therefore, the actions taken by the managers are focused more on cost-saving because it is the argument of cost and price that the companies are going to use to establish their competitive advantage on the market. Low prices of products offered should not constitute the only source of business competitiveness.
Summing up, the actions undertaken by strategists of analyzed enterprises are a natural reaction to the uncertainty coming from our unstable surroundings. The local enterprises are afraid of these changes. Therefore, is seems obvious that the established concepts of action are aimed at first place at limiting the risk pertaining to business activity, and secondly at securing the current position on the market. Nevertheless, the managers cannot forget that their priorities should embrace those actions which will attempt to improve the competitiveness of their enterprises. Undoubtedly, innovative solutions are exactly such actions. Nowadays, it is innovations that form an important factor of the development of enterprises, which guarantees
InvEnt 2013
47
their success in a given field. The necessity to face growing competition should motivate the managers to strive to perfection. The adaptation of strategies related to the introduction of innovations should make the companies more competitive, and in turn make it possible for them to compete effectively with foreign enterprises. Thus, solutions which, when implemented, are expected to increase competitiveness of the local enterprises and in turn particular business fields and the entire economy of the Bielsko-Biała region are: more enthusiasm of the managers towards cooperation with scientific-research institutes and institutions supporting the development of entrepreneurialism, an active search for alternative means in case of various capital limitations, and finally, avoiding certain short-sightedness consisting in building a competitive advantage by means of mere cost-saving. According to the statistics, the region of Bielsko-Biała is capable of rapid industrial development based on high technology, interesting prospects of future development, and this fact should definitely be used.
References [1] BAL-WOZNIAK T.: Innowacyjność w kształtowaniu konkurencyjności przedsiębiorstwa, [in:] M. JUCHNIEWICZ, Zarządzanie przedsiębiorstwem w warunkach konkurencji. Determinanty konkurencyjności przedsiębiorstw – część II: Wyd. UWM, Olsztyn, 2006. [2] BOGDANIENKO J. (ed.): Zarządzanie innowacjami: Oficyna Wydawnicza SGH, Warszawa, 1998. [3] KAMINSKA M.: Firmy zwiększają wydatki na innowacje, http://www.pit.egospodarka.pl 2008 [4] STARCZEWSKA-KRZYSZTOSZEK M.: Innowacyjność przedsiębiorstw w Polsce, [in:] Regionalne strategie innowacji w rejonach konwergencji, Uniwersytet Łódzki, Łódź, 2006. [5] ŚWITALSKI W.: Innowacje i konkurencyjność: Wyd. Uniwersytetu Warszawskiego, Warszawa, 2005.
InvEnt 2013
48
ICC (International Cave Clouding), Cave, Siemens Tecnomatix, PLM (Product Life Management)
Ivan GABAJ∗, Martin KRAJČOVIČ**, Dawid KURCZYK***
PLM SOLUTION SIEMENS TECNOMATIX
AND CAVE Abstract
This paper describes possibilities of international connections for industrial engineering
teams. In the introductory part of the article there is described the concept of ICC
(International Cave Clouding), as well as its hardware solutions. In the next part of the
paper is described the connection of advanced visualization with equipment CAVE with
software solutions of digital factory Siemens Tecnomatix. In the final part of the paper
there is described process of making connections between individual CAVE devices from
workstations all around the world. The conclusion summarizes benefits of ICC concept. 1. INTRODUCTION
International Cave Clouding represents the international, interdisciplinary, digital data
management (Product Data Management) throughout the life cycle of the product in the 3D virtual environment. The overall ICC conception is based to use the virtual world supported the integration powerful hardware and software solutions. International Cave Clouding also is accessible in the virtual environment for people from all over the world and interdisciplinary manage and manage the product design in respect during entire life cycle of product. 2. ICC CONCEPTION
International Cave Clouding integrates powerful hardware systems with the robust software
applications of digital factory. The overall hardware solution consists of the equipment CAVE (Cave automatic virtual environment). The actual device CAVE so, as is designed on research and development workplace ZIMS of Žilina (Zilina Intelligent Manufacturing System), consisting of several basic components. ∗ Ing. Ivan GABAJ, KPI, ŽU, SJF; e-mail: [email protected] ** doc. Martin KRAJČOVIČ, KPI, ŽU, SJF; e-mail: [email protected] *** mgr inż. Dawid KURCZYK, University of Bielsko-Biała, Faculty of Mechanical Engineering and Computer Science, Production Engineering Department, e-mail: [email protected]
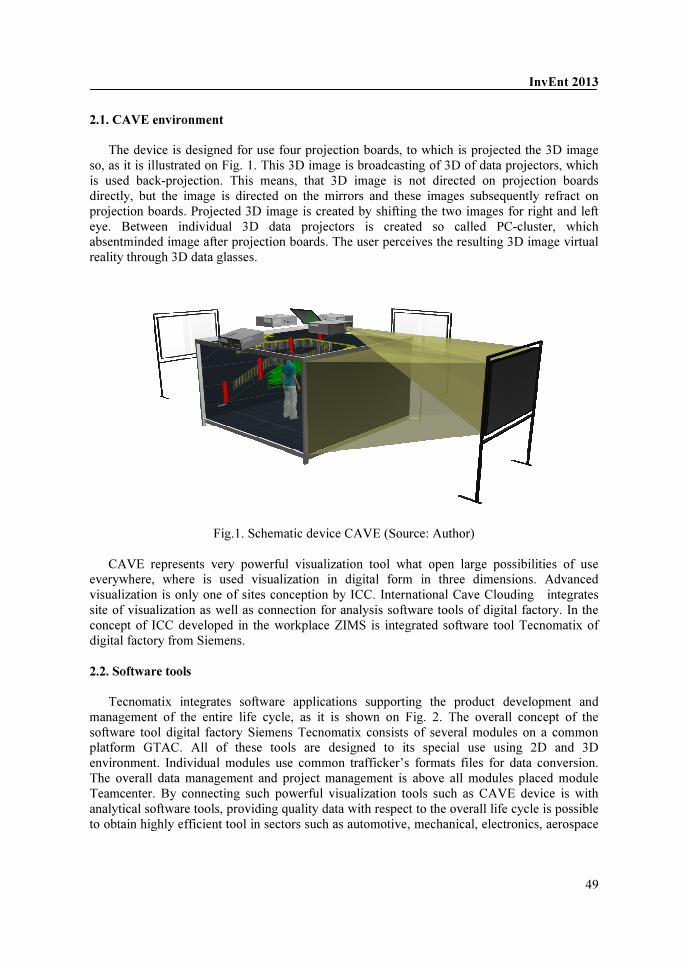
InvEnt 2013
49
2.1. CAVE environment
The device is designed for use four projection boards, to which is projected the 3D image
so, as it is illustrated on Fig. 1. This 3D image is broadcasting of 3D of data projectors, which is used back-projection. This means, that 3D image is not directed on projection boards directly, but the image is directed on the mirrors and these images subsequently refract on projection boards. Projected 3D image is created by shifting the two images for right and left eye. Between individual 3D data projectors is created so called PC-cluster, which absentminded image after projection boards. The user perceives the resulting 3D image virtual reality through 3D data glasses.
Fig.1. Schematic device CAVE (Source: Author)
CAVE represents very powerful visualization tool what open large possibilities of use everywhere, where is used visualization in digital form in three dimensions. Advanced visualization is only one of sites conception by ICC. International Cave Clouding integrates site of visualization as well as connection for analysis software tools of digital factory. In the concept of ICC developed in the workplace ZIMS is integrated software tool Tecnomatix of digital factory from Siemens. 2.2. Software tools
Tecnomatix integrates software applications supporting the product development and
management of the entire life cycle, as it is shown on Fig. 2. The overall concept of the software tool digital factory Siemens Tecnomatix consists of several modules on a common platform GTAC. All of these tools are designed to its special use using 2D and 3D environment. Individual modules use common trafficker’s formats files for data conversion. The overall data management and project management is above all modules placed module Teamcenter. By connecting such powerful visualization tools such as CAVE device is with analytical software tools, providing quality data with respect to the overall life cycle is possible to obtain highly efficient tool in sectors such as automotive, mechanical, electronics, aerospace

InvEnt 2013
50
engineering and in education and research. ICC concept is designed to be not isolated in the environment of individual organizations.
Fig.2. The concept of digital software tool Siemens Tecnomatix (Source: Siemens)
2.3. FactoryCAD,VisViewMockup and CAVE
FactoryCAD is a software solution from Siemens Tecnomatix and it is using to rapid design
and optimization of available 3D production and assembly systems or complete production halls. It contains a set of libraries of 3D parametric models, which can be divided into several basic categories such as building blocks, industrial objects and automotive. Using these 3D parametric models can be modeled manufacturing and assembly systems and save them as .jt which represents a standard for 3D models. Thus prepared model of production system can be opened in an VisMockup environment where after importing the model user has all the rights for model. This means that the model may be transformed, parts deleted and to be supplemented. Software solution VisMockup supports visualization in a CAVE environment also allows you to create 3D meetings. This means that the model shown in the device CAVE can consider people from around the world. The process of 3D meeting is relatively simple and is described in the following part of the article. 2.4. 3D virtual workshops
With using 3D digital virtual reality environment and internet networks allows create
subcontracting engineers around the world and to contribute so participate of such in the development new construction units and products so, as it is shown on Fig. 3.
Possibilities of creation 3D meeting in device CAVE allow suitable configuration software solution Teamcenter Visualization Mockup. 3D meeting is initialized one of the cooperating parties and other teams have the possibility to log on in the process of solving the necessary tasks. Each of the participants can be sent 3D model and to grant them necessary rights.
This means that individual participants can review 3D model projected in the CAVE device. After allocation the other rights they can perform the necessary operations with model such as transformation of model, completion the tree structure of 3D model, removal of parts of the model and more. Individual participants meeting can in CAVE device of course use also audio transmission and so communicate with each other. With advanced hardware solutions participants may project other participants 3D virtual image of your digital avatar responding to participant meeting located in the device CAVE.

InvEnt 2013
51
Fig.3. Schematic connection of device CAVE (Source: Author)
3. CONCLUSION
Concept of ICC provides engineering teams completely new concept of digital workshops
in solving various tasks. The concept combines extremely powerful visualization tool with software solutions digital factory providing the necessary analytical data. This solution also supports connection between individual research and development centers with using the internet and realizing international solutions necessary tasks.
References
[1] HNÁT, J. 2011 Siemens PLM solution at the University of Žilina. In: Industrial engineering of the future - InvEnt 2011. ISBN 978-80-554-0409-7. - S. 32-35.
The article was prepared under the project KEGA 004ŽU-4/2013 - Integrácia progresívnych informačných technológií a e-vzdelávania do výučby projektovania výrobných
a montážnych systémov (AIT-MASD)
InvEnt 2013
52
Picking, Unifeye Design, Workflow
Gabriela GABAJOVÁ∗, Ivan GABAJ ∗∗, Ewa GOLIŃSKA∗**
WAREHOUSE USING AUGMENTED REALITY
Abstract
The paper describes the different parts of the experimental workplace, the hardware and
software requirements. This paper contains a simple case study, which illustrates the
different steps of the process of picking with augmented reality, further it describes the
operation principle in the context of experimental workplace. The result of this task case
is a practical demonstration, which samples can be found in this paper. 1. INTRODUCTION
Options to optimize logistics processes are almost exhausted, so industry is looking for new
technologies and their potential. Augmented reality is a technology that is looking for its application in the production. In the area of planning, logistics and stock picking process, it aims to shorten order processing, improve the quality of the processes, to provide support for the work of employees, reducing their cognitive load at work and allows the introduction of new and innovative technologies in the enterprise.
2. THE CASE STUDY
The workplace of manual assembly sent to the warehouse an order for picking five basic
structural parts for mounting the connecting fork. The order is shown in the table. The role of warehouse worker is to pick these items according to the order in the shortest possible time and with zero errors using the technology of augment reality (glasses and software support).
The order for picking contains these items: • Fork body – 1 Pcs • Fork head – 1 Pcs • Casing – 1 Pcs • Phase pin – 4 Pcs • Reinsurance nut – 1 Pcs
The role of warehouse worker is to pick these items from order in the shortest possible time and with zero error rate using augmented reality technology (AR glasses for software Unifeye Design).
∗ Ing. Gabriela GABAJOVÁ, ŽU, SjF, KPI, e-mail: [email protected] ∗∗ Ing. Ivan GABAJ, ŽU, SjF, KPI, [email protected] ∗** mgr inż. Ewa GOLIŃSKA, University of Bielsko-Biała, Faculty of Mechanical Engineering and
Computer Science, Production Engineering Department, e-mail: [email protected]

InvEnt 2013
53
For testing the picking items from the store using augmented reality is needed to propose parts of experimental workplace. Our experimental workplace must include following parts: 1. Rack storage systems – racking and shelving systems have a high technical level and
quality, stability, load capacity and a broad range of dimensional. 2. Plastic boxes – plastic containers. 3. Trolley – with handle, metal glove areas, two rigid casters and two swivel. 4. Software support for augmented reality – Unifeye Design is a software solution for
augmented reality from German company Metaio, which is now the European leader on market in software solutions in the field of augmented reality. Unifeye Design is software that can place virtual object “teal-time” into the real space in several ways and it also contains a powerful workflow tool, which can generate scenarios of displaying and behavior of the virtual objects in real space.
5. Picked items – for this case task were used models of connecting fork. The specified task will be solved in the experimental workplace created on common
workplace ZIMS. To fulfill the task is needed to follow these steps: • to create 3D models of components of connecting fork, • to save them to VRML (Virtual Reality Modeling Language) for import into the
software for augmented reality, • to decide what form of placing objects into the real environment will be used: marker,
markerless or 3D extensible tracking, • to create a set of markers and decide how will be they replaced into the space, • to create a scenario of displaying and controlling objects in Workflow, • test scenario and edit any gaps.
To solve the task is needed the following equipment: • shelving racks, • plastic boxes, • the construction of the connecting fork, • the handling trolley, • the computer, • the glasses for augmented reality Vuzix iWear VR920, • the licensed software for augmented reality Unifeye Desing by Metaio, • set of markers (65 pieces) on paper form, • Logitech HD Pro Webcam C910.
Creating the Workflow scenario is one of the most difficult part of solving this task. The
first step is to decide what marker system will be used. To solve this problem was chosen marker system, which is based on classic black-and-white square markers. These markers are placed in the area and after assigning coordinate systems, it is possible to save these virtual objects. Markers are spread over in two ways:
1. On the shelves with blue plastic boxes are markers located on the third and fourth shelf. Set of markers placed on third shelf can cover series of boxes in the second and third shelf and set of markers places on fourth shelve can cover boxes in the fourth and fifth shelf.
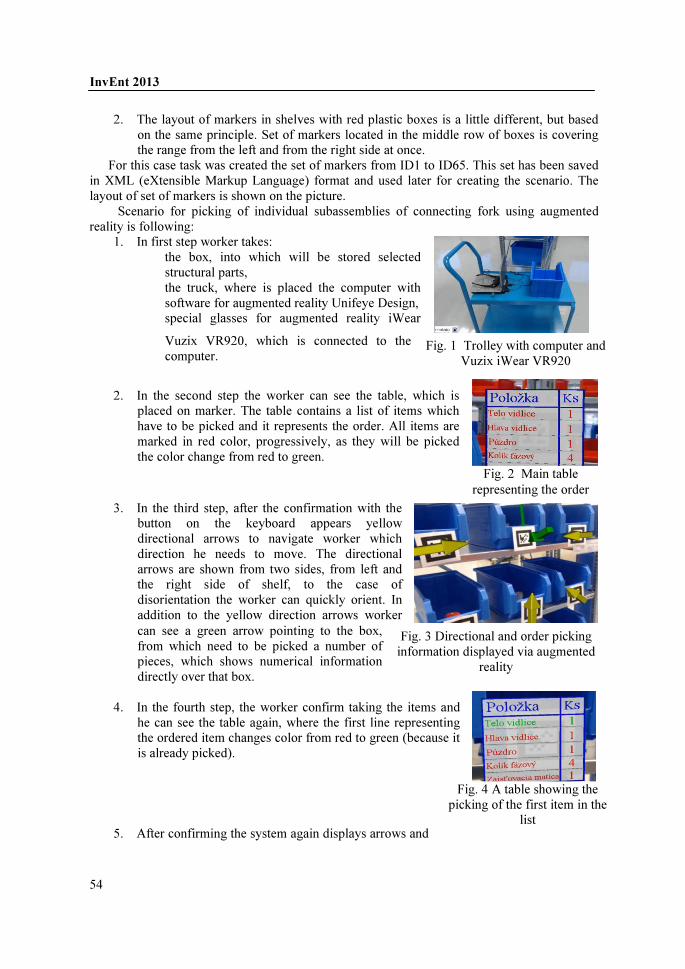
InvEnt 2013
54
2. The layout of markers in shelves with red plastic boxes is a little different, but based on the same principle. Set of markers located in the middle row of boxes is covering the range from the left and from the right side at once.
For this case task was created the set of markers from ID1 to ID65. This set has been saved in XML (eXtensible Markup Language) format and used later for creating the scenario. The layout of set of markers is shown on the picture.
Scenario for picking of individual subassemblies of connecting fork using augmented reality is following:
1. In first step worker takes: the box, into which will be stored selected structural parts, the truck, where is placed the computer with software for augmented reality Unifeye Design, special glasses for augmented reality iWear
Vuzix VR920, which is connected to the computer.
2. In the second step the worker can see the table, which is
placed on marker. The table contains a list of items which have to be picked and it represents the order. All items are marked in red color, progressively, as they will be picked the color change from red to green.
3. In the third step, after the confirmation with the button on the keyboard appears yellow directional arrows to navigate worker which direction he needs to move. The directional arrows are shown from two sides, from left and the right side of shelf, to the case of disorientation the worker can quickly orient. In addition to the yellow direction arrows worker can see a green arrow pointing to the box, from which need to be picked a number of pieces, which shows numerical information directly over that box.
4. In the fourth step, the worker confirm taking the items and
he can see the table again, where the first line representing the ordered item changes color from red to green (because it is already picked).
5. After confirming the system again displays arrows and
Fig. 1 Trolley with computer and Vuzix iWear VR920
Fig. 2 Main table representing the order
Fig. 3 Directional and order picking information displayed via augmented
reality
Fig. 4 A table showing the picking of the first item in the
list

InvEnt 2013
55
directed staff to the nearest point of picking the next item in the list order. This process is repeated until it is picked the last item.
Fig. 5 Picking items with augmented reality 3. CONCLUSION
For using this methodology for picking in large storage it is necessary to expand the
technical device by: • wireless glasses, • connection with navigation system, • use the small computer wearable at the waist instead of laptop, • use the confirmation button wearable at the waist instead of keyboard button, • using the technology pick-by-voice.
The terms of functional of demonstration for experimental workstation are: • static location of shelves, • unchanged location of storage plastic boxes, • each box has its own marker, which belongs exclusively to her, • a satisfactory lighting conditions (daylight is the best without direct sunlight).
References
[1] KRAJČOVIČ, M. 2011. Projektovanie výrobných dispozícií s podporou rozšírenej
reality. In: Produktivita a inovácie : dvojmesačník Žilinskej univerzity v Žiline v spolupráci so Slovenským centrom produktivity a Ústavom konkurencieschopnosti a inovácií. - ISSN 1335-5961. - Roč. 12, č. 5 (2011), s. 27-29.
The article was prepared under the project KEGA 004ŽU-4/2013 - Integrácia progresívnych informačných technológií a e-vzdelávania do výučby projektovania výrobných
a montážnych systémov (AIT-MASD)

InvEnt 2013
56
Navigation systems, Augmented reality, Marker navigation
Gabriela GABAJOVÁ*, Martin KRAJČOVIČ**, Dariusz PLINTA***
NAVIGATION WITH AUGMENTED
REALITY Abstract
Article compares the different navigation methods appropriate for the
implementation of augmented reality in the process of picking. Individual
navigation systems are each other compared in the table and are there recovered
their pluses, minuses and their restrictions. For the most advantageous system is
proposed, how to implement this technology into the process of picking with
Augmented Reality. 1. NAVIGATION SYSTEM
Very important piece for picking with augmented reality is tracking and orientation system.
This system accurately identifies a user´s location in relation to his surroundings and moreover, follows his sight and head movements. The complex procedure of monitoring the overall location and movements of the user and displaying graphics are some of major obstacles in developing this technology. And so far the best developed systems still contain a discrepancy between user movement and displaying the image.
Navigation can be defined as the purposeful leadership of people and vehicles from one place to another along a preselected route. At present, there are some basic navigation techniques, which are based on mathematical and physical principles. 1.1. Comparison of navigation systems for augmented reality
Navigation
system Pluses Minuses Restrictions
Global
Positioning
System
(GPS)
o the ability to provide location data 24 hours a day
o the independence of the weather
o not applicable under the tunnels, in buildings, rooms and even in the narrow streets,
o the only serve to
o the need for maps
* Ing. Gabriela GABAJOVÁ, KPI, ŽU,SJF; e-mail: [email protected] ** doc. Martin KRAJČOVIČ, KPI, ŽU, SJF; e-mail: [email protected] *** dr hab. Inż. Dariusz PLINTA, prof. ATH, University of Bielsko- Biała, Faculty of Mechanical Engineering and Computer Science, Production Engineering Department, e-mail: [email protected]
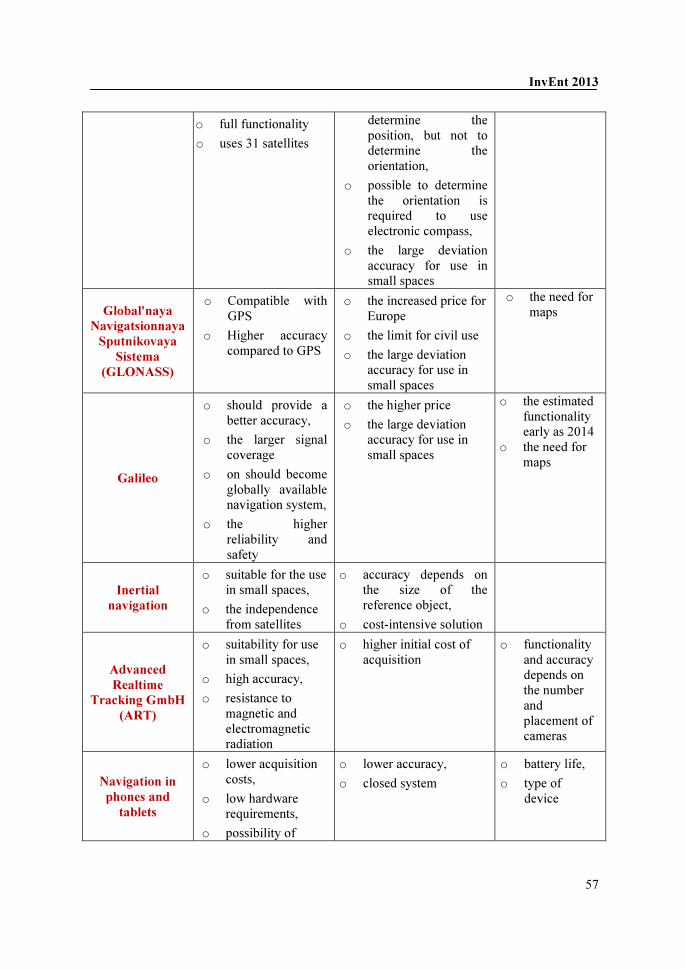
InvEnt 2013
57
o full functionality
o uses 31 satellites
determine the position, but not to determine the orientation,
o possible to determine the orientation is required to use electronic compass,
o the large deviation accuracy for use in small spaces
Global'naya
Navigatsionnaya
Sputnikovaya
Sistema
(GLONASS)
o Compatible with GPS
o Higher accuracy compared to GPS
o the increased price for Europe
o the limit for civil use
o the large deviation accuracy for use in small spaces
o the need for maps
Galileo
o should provide a better accuracy,
o the larger signal coverage
o on should become globally available navigation system,
o the higher reliability and safety
o the higher price
o the large deviation accuracy for use in small spaces
o the estimated functionality early as 2014
o the need for maps
Inertial
navigation
o suitable for the use in small spaces,
o the independence from satellites
o accuracy depends on the size of the reference object,
o cost-intensive solution
Advanced
Realtime
Tracking GmbH
(ART)
o suitability for use in small spaces,
o high accuracy,
o resistance to magnetic and electromagnetic radiation
o higher initial cost of acquisition
o functionality and accuracy depends on the number and placement of cameras
Navigation in
phones and
tablets
o lower acquisition costs,
o low hardware requirements,
o possibility of
o lower accuracy,
o closed system
o battery life,
o type of device
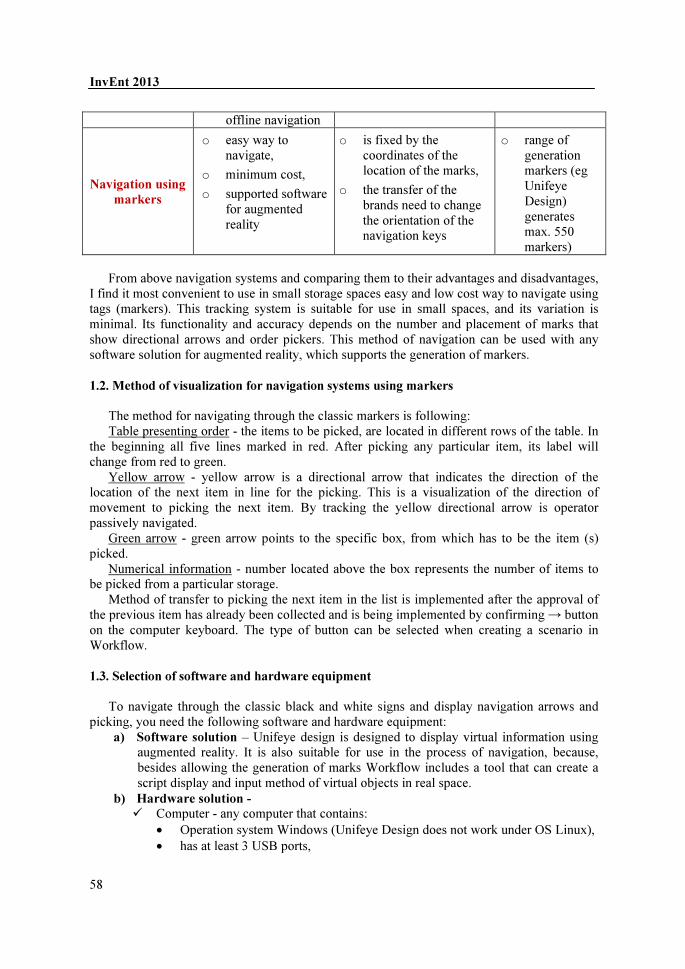
InvEnt 2013
58
offline navigation
Navigation using
markers
o easy way to navigate,
o minimum cost,
o supported software for augmented reality
o is fixed by the coordinates of the location of the marks,
o the transfer of the brands need to change the orientation of the navigation keys
o range of generation markers (eg Unifeye Design) generates max. 550 markers)
From above navigation systems and comparing them to their advantages and disadvantages,
I find it most convenient to use in small storage spaces easy and low cost way to navigate using tags (markers). This tracking system is suitable for use in small spaces, and its variation is minimal. Its functionality and accuracy depends on the number and placement of marks that show directional arrows and order pickers. This method of navigation can be used with any software solution for augmented reality, which supports the generation of markers. 1.2. Method of visualization for navigation systems using markers
The method for navigating through the classic markers is following: Table presenting order - the items to be picked, are located in different rows of the table. In
the beginning all five lines marked in red. After picking any particular item, its label will change from red to green.
Yellow arrow - yellow arrow is a directional arrow that indicates the direction of the location of the next item in line for the picking. This is a visualization of the direction of movement to picking the next item. By tracking the yellow directional arrow is operator passively navigated.
Green arrow - green arrow points to the specific box, from which has to be the item (s) picked.
Numerical information - number located above the box represents the number of items to be picked from a particular storage.
Method of transfer to picking the next item in the list is implemented after the approval of the previous item has already been collected and is being implemented by confirming → button on the computer keyboard. The type of button can be selected when creating a scenario in Workflow.
1.3. Selection of software and hardware equipment
To navigate through the classic black and white signs and display navigation arrows and
picking, you need the following software and hardware equipment: a) Software solution – Unifeye design is designed to display virtual information using
augmented reality. It is also suitable for use in the process of navigation, because, besides allowing the generation of marks Workflow includes a tool that can create a script display and input method of virtual objects in real space.
b) Hardware solution - � Computer - any computer that contains:
• Operation system Windows (Unifeye Design does not work under OS Linux), • has at least 3 USB ports,

InvEnt 2013
59
• allows VGA connection to Vuzix glasses for augmented reality. � Glasses for augmented reality - allow you to see virtual objects (navigation and
directional arrows) in a real environment. � Trolley - for storing computer or pallets (to the worker hands free).
Fig.1. Navigation by augmented reality using markers 2. CONCLUSION
The proposed way how to use navigation considers only with the static location of virtual
models and textual information in real space. This system does not respond flexibly to change the layout of storage units, but in case of
relocation real objects requires manual editing of virtual models in the space to real objects. Despite the lack of navigation, however, this system provides certain advantages over the traditional way of navigating using various boards and LCD screens located on ceilings or walls. References
[1] ŠTEFÁNIK, A. – GREGOR, M. – GRZNÁR, P. – HNÁT, J. – ŠKORÍK, P. 2007. Implementácia riešení konceptu Digitálneho podniku. In: Produktivita a inovácie : dvojmesačník Slovenského centra produktivity. - ISSN 1335-5961. - Roč. 8, č. 4 (2007), s. 16-18.
[2] MATUSZEK, J. – GREGOR, M. – MIČIETA, B. 2011. Digital factory management methods and techniques in engineering production. - Bielsko-Biała: Wydawnictwo Akademii techniczno-humanistycznej, 2011. - ISBN 978-83-62292-57-8. - S. 119-124.
[3] GÖRNER, T. – GRZNÁR, P.: Virtuálna realita v automotive industry. Využitie v rámci FORD MOTOR COMPANY. In: ai magazine. 2/2011, str. 96-98.
The article was prepared under the project KEGA 004ŽU-4/2013 - Integrácia progresívnych informačných technológií a e-vzdelávania do výučby projektovania výrobných
a montážnych systémov (AIT-MASD)

InvEnt 2013
60
Degree of correlation, Degree of association, Distance degree, Cars
Jana HALČINOVÁ*, Peter TREBUŇA**
WAY OF EXPRESSING SIMILARITY RELATIONSHIPS
BETWEEN OBJECTS
Abstract
The article deals with defining the modalities of expression similarity
relationships between objects, which are subject to cluster analysis. Besides the
degree of association there are 2 more degrees of similarity: degree of
correlation and the degree of distance. The article in the Peace Association
gives an example of the use of Peace Association for the assessment of the
similarity of passenger cars.
1. DEGREE OF ASSOCIATION
To determine the similarity of objects whose characteristics are non-metric nature -
dichotomous characteristics (described in words), using the coefficients of association (observed data are recorded in the Association Table) [1].
Measuring the association is based on monitoring whether the two events occurred simultaneously and as often occurs only one of them does not occur unless the second. Take values from <−1,1>..
Positive Association - both phenomena often occur resp. do not occur together (complete positive association, if you set resp. has not set only once).
Negative - indirect association - one of the more frequently occurring events (full - if one of the events occurs only if the other does not occur).
Association between objects xi and xj can be expressed by the Association table (Tab. 1), where [1]:
a the number of characters in which the objects xi and xj simultaneously take a value of 1, d is the number of characters in which objects xi and xj simultaneously take values 0, b is the number of characters in the character xi which takes on the value 1 and the character xj 0, c is the number of characters in the character xi which takes on the value 0 and the value of the first character xj .
* Ing. Jana HALČINOVÁ, Department of Industrial Engineering and Management, Faculty of Engineering, Technical University of Kosice, Boženy Němcovej 32, 040 01 Košice, [email protected] ** doc. Ing. Peter TREBUŇA, PhD, Department of Industrial Engineering and Management, Faculty of Engineering, Technical University of Kosice, Boženy Němcovej 32, 040 01 Košice, ,[email protected],
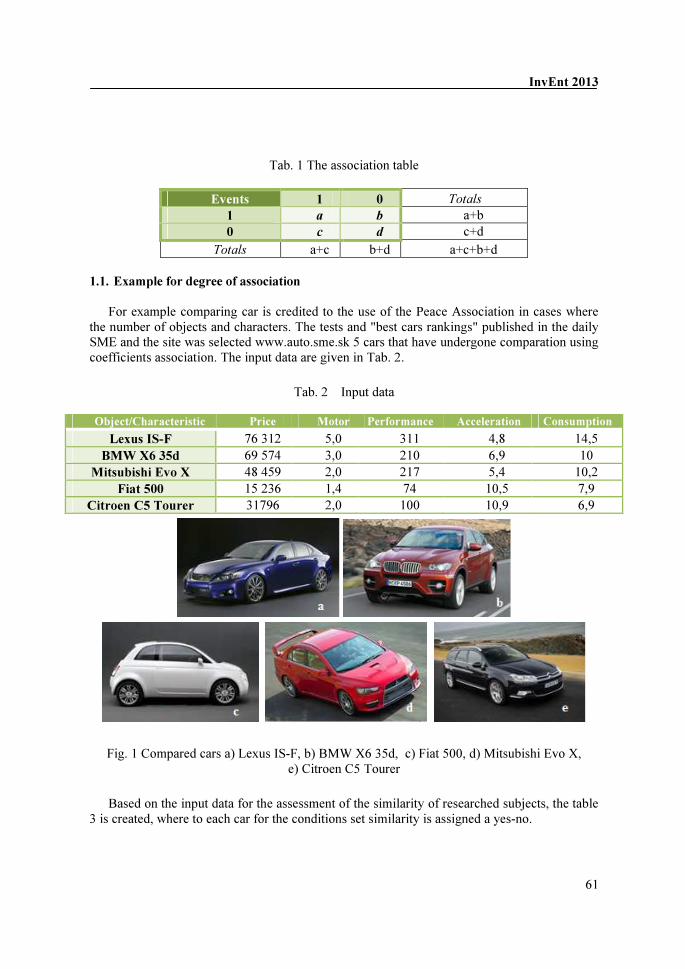
InvEnt 2013
61
Tab. 1 The association table
Events 1 0 Totals
1 a b a+b 0 c d c+d
Totals a+c b+d a+c+b+d
1.1. Example for degree of association
For example comparing car is credited to the use of the Peace Association in cases where the number of objects and characters. The tests and "best cars rankings" published in the daily SME and the site was selected www.auto.sme.sk 5 cars that have undergone comparation using coefficients association. The input data are given in Tab. 2.
Tab. 2 Input data
Object/Characteristic Price Motor Performance Acceleration Consumption
Lexus IS-F 76 312 5,0 311 4,8 14,5 BMW X6 35d 69 574 3,0 210 6,9 10
Mitsubishi Evo X 48 459 2,0 217 5,4 10,2 Fiat 500 15 236 1,4 74 10,5 7,9
Citroen C5 Tourer 31796 2,0 100 10,9 6,9
Fig. 1 Compared cars a) Lexus IS-F, b) BMW X6 35d, c) Fiat 500, d) Mitsubishi Evo X, e) Citroen C5 Tourer
Based on the input data for the assessment of the similarity of researched subjects, the table
3 is created, where to each car for the conditions set similarity is assigned a yes-no.

InvEnt 2013
62
Tab. 3 Objects and characteristics
Objects/Characteristics z1 - price over
30 000,–€
z2 - motor over
2,0
z3 –
performance
over 150 kW
z4 –
acceleration
over 7s
z5 –
consumption
over 8l/100km
A1 Lexus IS-F yes yes yes no yes A2 BMW X6 35d yes yes yes no yes A3 Mitsubishi Evo X yes yes yes no yes A4 Fiat 500 no no no yes no A5 Citroen C5 Tourer yes yes yes yes no
Based on data from Tab. 3 is compiled table for dichotomous data objects considered (Tab.
4), where the positive characteristics (yes) is assigned 1 and negative characteristics (not) is assigned 0.
Tab. 4 Dichotomous data characterizing the objects
z1 z2 z3 z4 z5
A1 1 1 1 0 1
A2 1 1 1 0 1
A3 1 1 1 0 1
A4 0 0 0 1 0
A5 1 1 0 1 0 According to Tab. 4 it is possible to easily calculate a, b, c, d association object table
(Tab. 5) for each pair of objects the procedure described in Tab. 1.
Tab.5 2 Association table objects
A1 A2 A3 A4 A5
A1 4 0 4 0 4 0 1 0 3 0
0 1 0 1 0 1 0 4 0 2
A2 4 0 4 0 4 0 0 1 2 1
0 1 0 1 0 1 4 0 2 0
A3 4 0 4 0 4 0 0 1 2 1
0 1 0 1 0 1 4 0 2 0
A4 1 0 0 1 0 1 1 0 1 2
0 4 4 0 4 0 0 4 0 2
A5 3 0 2 1 2 1 1 2 3 0
0 2 2 0 2 0 0 2 0 2
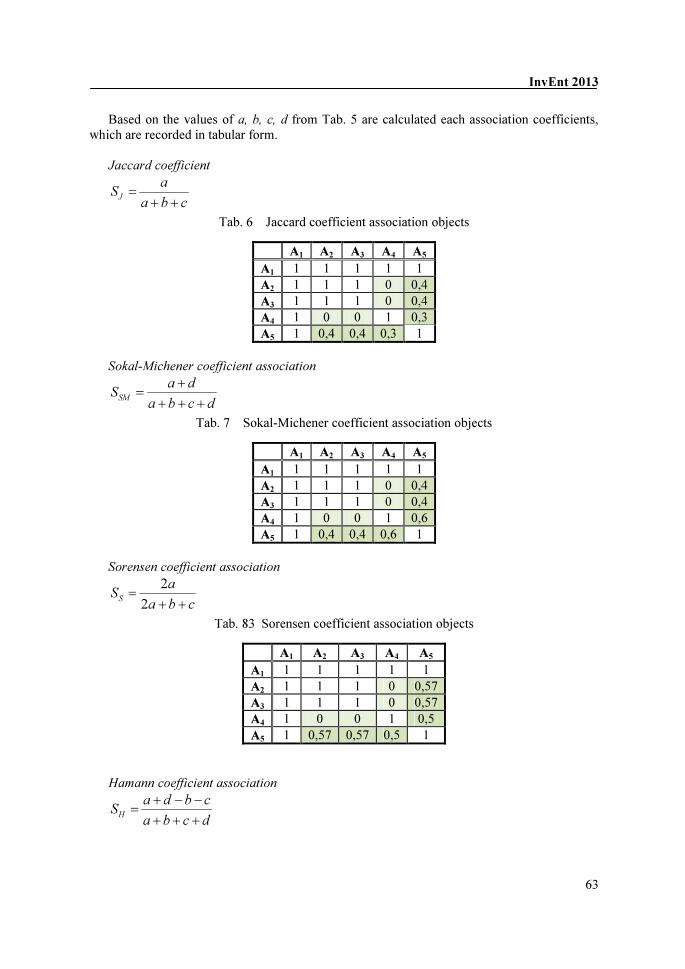
InvEnt 2013
63
Based on the values of a, b, c, d from Tab. 5 are calculated each association coefficients, which are recorded in tabular form.
Jaccard coefficient
J
aS
a b c=
+ + Tab. 6 Jaccard coefficient association objects
A1 A2 A3 A4 A5
A1 1 1 1 1 1 A2 1 1 1 0 0,4 A3 1 1 1 0 0,4 A4 1 0 0 1 0,3 A5 1 0,4 0,4 0,3 1
Sokal-Michener coefficient association
SM
a dS
a b c d
+=
+ + + Tab. 7 Sokal-Michener coefficient association objects
A1 A2 A3 A4 A5
A1 1 1 1 1 1 A2 1 1 1 0 0,4 A3 1 1 1 0 0,4 A4 1 0 0 1 0,6 A5 1 0,4 0,4 0,6 1
Sorensen coefficient association
2
2S
aS
a b c=
+ + Tab. 83 Sorensen coefficient association objects
A1 A2 A3 A4 A5
A1 1 1 1 1 1 A2 1 1 1 0 0,57 A3 1 1 1 0 0,57 A4 1 0 0 1 0,5 A5 1 0,57 0,57 0,5 1
Hamann coefficient association
H
a d b cS
a b c d
+ − −=
+ + +

InvEnt 2013
64
Tab. 9 Hamann coefficient association objects
A1 A2 A3 A4 A5
A1 1 1 1 1 1 A2 1 1 1 0 -0,2 A3 1 1 1 0 -0,2 A4 1 0 0 1 0,2 A5 1 -0,2 -0,2 0,2 1
Finally a comparison of selected vehicles using the Peace Association can be stated, that the method of evaluation similarity of relationships of objects within each set of coefficients of association much different, the difference is only seen in the values of the coefficients. All tested coefficients take maximum similarity for a pair of objects (A1, A2), (A1,A3), (A1,A4), (A1,A5), (A2,A3) and a minimum of the similarity of pairs of objects (A2,A4), (A3,A4). Objects (A2,A5), (A3,A5), (A4,A5) show a weak positive associations, objects (A2,A4) and (A3,A4) show little or. and no association between other pairs of objects is a strong positive association.
The article is an example of comparing cars allocated to the use of the Peace Association. Degree of association can be used for different objects, if we analyze the relationship between objects, ie. determine whether the objects are similar to each other and to what extent. If the value of the association coefficient is higher, the higher is the similarity of objects, and vice versa. To assess the similarity of the cars were used as comparative parameters tests daily SME. Example applications Peace Association for the types of cars were selected because of their diversity, which can be better observed similarity resp. dissimilarity of objects.
2. DEGREE OF CORRELATION
The base rate used by the cluster correlation analysis, the Pearson and Spearman
correlation coefficient. Pearson's correlation coefficient indicates the degree of linear dependence of two variables X and Y (eg. weight and height of a person) and is defined as follows:
.
.
P
x y
xy x yr
s s
−
=. (1)
Spearman coefficient correlation, having the form [3]:
2
2
1
61 . ( )
( 1)
n
S i i
i
r x yn n
=
= − −
−
∑ , (2)
where n is the number of observations in the order dependence measured values, irrespective of their size and is therefore in the cluster analysis underused.
The correlation coefficient takes the values from the interval <−1,1>.The higher the correlation coefficient, the similarity (in our case characters) is higher and conversely.
3. DISTANCE DEGREE
Distance metrics are based on the presentation of objects in space, the coordinates of which
are individual variables. These measures dissimilarity of objects are used in a statistical

InvEnt 2013
65
programs, the longer distance between objects, they are not more dissimilar. The best-known distance rates for expressing the distance of two points xi and xj in m-dimensional space are:
• Euklidean metric ji
m
l
jliljiE xxxxxxD −=−= ∑=1
2)(),(
• Manhattan metric li
m
l
jliljiB xxxxxxD −=−=∑=1
),(
• Chebyshev metric )(max),( jlilljiC xxxxD −=
• Minkowski metric q
m
l
q
jliljiM xxxxD ∑=
−=
1
),(
• Sokal metric ∑=
−=
m
l
jliljiS xxm
xxD
1
2)(1
),(
, m - the number of signs
This article was created by implementation of the grant project VEGA no. 1/0102/11
Experimental methods and modeling techniques in-house manufacturing and non-
manufacturing processes and KEGA 004TUKE-4/2013 Intensification of modeling in teaching
II. and III. degree in the field of study 5.2.52 Industrial Engineering.
References
[1] MELOUN, M. – MILITKÝ, J.: Statistická analýza experimentálních dat. Praha:
Academia. 2004. 953 s. ISBN 80-200-1254-0. [2] ŘEZANKOVÁ, H. – HÚSEK, D. – SNÁŠEL, V.: Shluková analýza dat. Praha:
Professional Publishing. 2009. 218 s. ISBN 978-80-86946-81-8. [3] STANKOVIČOVÁ, I. – VOJTKOVÁ, M.: Viacrozmerné štatistické metódy
s aplikáciami. Bratislava: IURA Edition, 2007, 261 s. ISBN 978-80-8078-152-1. [4] WARD, J.H. (1963), "Hierarchical Grouping to Optimize an Objective Function,"
Journal of the American Statistical Association, 58, 236 - 244.

InvEnt 2013
66
Manufacturing system, Intelligent agent
Michal HALUŠKA*, Filip HORÁK **
AGENT COMMUNICATION IN THE FIELD OF INTELLIGENT
MANUFACTURING SYSTEMS
Abstract
Agent technology is an important method for implementation of autonomous
management system which is the most appropriate way for efficient control of
intelligent manufacturing systems. In multi-agent system decisions and actions
are realized based on mutual agent interactions. Agent-oriented systems require
an architectural approach with emphasis on software engineering processes and
relevant methods.
1. INTELLIGENT MANUFACTURING SYSTEMS
Intelligent manufacturing systems are used for realization of productive activities and techniques of AI. Such manufacturing system can exhibit intelligent capabilities such as learning, thinking, decision making, etc. Intelligent manufacturing systems are designed for work in extreme conditions, which includes the measurement of complex business results and frequent operational changes.
Intelligent manufacturing systems should have the following characteristics: • Self-adaptation – is one of the most important features of intelligent manufacturing
systems. They should be able to adapt to the environment in which they carry out operations without endangering of production targets.
• Intelligent maintenance - is also an important aspect of intelligent manufacturing system. System should be able to identify errors and directly generate corrective actions without any human intervention. In that sense system should be autonomous and reconfigurable.
• Internal and external communication – the system can generate reports and direct orders which have influence on selecting of manufacturing components. It must be also implemented communication platform which will provide cooperation with external systems with a view of carrying out certain activities.
• System autonomy – is a degree of independence of intelligent manufacturing systems without which would be restricted performance of intelligent behaviour.
* Ing. Michal Haluška, The Faculty of Mechanical Engineering at the University of Zilina,
[email protected] ** Ing. Filip Horák, The Faculty of Mechanical Engineering at the University of Zilina,

InvEnt 2013
67
• Learning – allows incremental improve knowledge on the basis of the knowledge available in the knowledge bases. This ability is one of essential elements of intelligent manufacturing systems.
• Self-organized evolution – ability of intelligent manufacturing systems to evolve in time. This capability can be achieved through learning or updating of knowledge in the knowledge base. The system can experiment with existing knowledge and evaluate current performance.
• Estimation of abilities (forecasting) – allows anticipate changes and their possible impact on future operations.
• Searching of goal – the capability of the systems to create goals, refine or update the existing ones in accordance with the progress and mission of the system. This paradox can be achieved through continuous system evolution. For achieving of predefined goal is required to decompose tasks (functions) for easier control of complex system architecture.
• System vitality – the system should generate new working principles, new theories, forecasts, etc. The system should generate new working principles, new theories, forecasts, etc. This ability requires interactions of human with manufacturing components on a high degree of autonomy.
• System recovery – is ability to create or reuse of system components. Intelligent manufacturing systems can on this principle utilized functional tasks to different locations in same time.
1.1. Control in intelligent manufacturing systems
Intelligent manufacturing systems must provide autonomous decisional capabilities. In addition to traditional manufacturing functions, they include knowledge bases and respective software which utilize the existing knowledge. Intelligent manufacturing systems should be designed based on general framework which provides dynamic integration and standardization of knowledge infrastructure in distributed environments. This paradox requires a new form of organization in manufacturing systems (modular system). Control units consist of a group of intelligent agents. Each of these agents has its own knowledge, skills and abilities. In view of these considerations, the intelligent manufacturing systems must take into account three fundamental aspects:
• Process control and loading of work (system), • Knowledge and information flow (knowledge), • Logical conclusions and intelligent capabilities (thinking).
Fig. 1. Basic architecture of intelligent manufacturing system

InvEnt 2013
68
1.2. System
System view includes description of manufacturing system and its aim is to set-up relations with respect to desired system functionality. Intelligent manufacturing systems should consist of the following areas: marketing, quality, planning, supply chain management, manufacturing, quality, materials management, research, development and monitoring of performance. Intelligent manufacturing systems must have hierarchical control architecture in which individual layers will be nested. Each of these layers must be coded separately. Such intelligent manufacturing systems provide flexibility. During arrival of new requirements, agent approaches encourage improvements and modifications of control.
Fig. 2. Principle of agent communication
1.3. Knowledge
Intelligent agents are carriers of internal knowledge through which mutual communications and effective implementation of actions can be realized. Agent communication must be standardized in this regard. Standardized interface ensure effective automation of information and knowledge. The exchange of knowledge can be realized by knowledge protocol and knowledge network which is controlled by agents. On the basis of presented arguments, network can be classified as distributed information system which involves various agents interactions.

InvEnt 2013
69
1.4. Thinking
This level provides decision-making actions which are based on solving problems within the agent capabilities. Individual agent is responsible for carrying out certain activities. Agents can also have different architectural structures. Ideal perception and realization of actions will be ensured by implementation of appropriate sensors and effectors.
Fig. 3. Exchanges of agent knowledge
This paper is the part of research supported by: VEGA 1/1146/12. References
[1] AHMED, S., KARSITI M.: Multiagent Systems, Vienna : In-Tech, 2009, 426 p. ISBN 978-3-902613-51-6.
[2] CUAUTLE, E.: Chaotic Systems, Rijeka : In-Tech, 2011, 309 p. ISBN 978-953-307-564-8.
[3] GREGOR, M., KOŠTURIAK, J., MATUSZEK, J. MIČIETA, B.: Design of
Manufacturing Systems for 21. Century, Žilina : EDIS, 2000, 397 p. ISBN 80-7100-533-3.
[4] GUO, Q., ZHANG, M.: Research on Intelligent Manufacturing System Based on Multi-Agent, In First International Conference : Intelligent Robotics and Applications, Beijing : Peking University, 2008, ISBN 978-3-540-88518-4, p. 829-838.
[5] SUPADULCHAI, P.: Reasoning-based capability configuration management in
adaptable service systems, Trondheim : NTNU-trykk, 2008, 238 p. ISBN 978-82-471-
6034-3.

InvEnt 2013
70
Manufacturing system, Capabilities
Michal HALUŠKA*, Peter LONC**
CLOUD COMPUTING IN MANUFACTURING
ENVIRONMENT
Abstract
As a reaction to rapid development in information technology in manufacturing organizations there has been proposed the concept of cloud computing, which is designed to support development of manufacturing informatization. Research of cloud technology will accelerate development of intelligent manufacturing systems.
1. INTRODUCTION
Cloud computing is a new maintenance-oriented computer technique which began to emerge only recently. In clouds, virtual computing resources are used and organized. Cloud computing offers a new mode of production and computerization of manufacturing systems. This technology guarantees the intelligent service processes and reducing of energy consumption.
Cloud computing technology can be used for displaying of virtual objects, collaboration of productive resources, optimization and scheduling. The development of semantic web technologies forms the knowledge base of computer intelligence and provides rapid development of embedded systems which enables intelligent access to physical devices. The development of powerful computers and computing technologies can provide effective solving of production problems.
Nowadays, organizations are building computational repositories and service centres for archiving "clouds" virtual resources. These organizations can have access to computing resources over heterogeneous web services. 2. MANUFACTURING INFORMATIZATION
Manufacturing informatization is based on linking of information, modelling, simulation, advanced control, design, production technologies with engineering and product-related technologies that are used to integrate and optimize three factors: management, technologies and people and four flows: information flow, material flow, knowledge flow and value flow. This approach improves product quality, service and energy efficiency. Innovative
* Ing. Michal Haluška, The Faculty of Mechanical Engineering at the University of Zilina,
[email protected] ** Ing. Peter Lonc, The Faculty of Mechanical Engineering at the University of Zilina,

InvEnt 2013
71
technologies will ensure reduction of production costs and development time. Manufacturing informatization is developed based on requirements for future systems which should provide operability of digital, intelligent, agile and green manufacturing. Technologies based on knowledge and innovations are key factors for enhancing competitiveness of the manufacturing industry. 2.1 Cloud manufacturing
Manufacturing realized through integrated cloud computing technology is focuses on system services and knowledge base. In the cloud manufacturing are integrated advanced technologies such as:
• Information and manufacturing technologies, • Internet of things • Semantic network, • High performance computers, • Manufacturing cloud.
In this type of manufacturing, there can be efficiently realized coordination of activities of
manufacturing resources, which are used for setting of the required manufacturing capabilities. This kind of manufacturing provides safe and reliable services. Manufacturing cloud technology is a low cost solution for implementation cooperative distributed systems. 2.2 Cloud operations in manufacturing systems
These manufacturing systems consist from resources, capabilities, manufacturing cloud and applications. Three type of elements are integrated into these systems. Those are supportive base (knowledge), processes (import and export) and also three types of actuators:
• Providers, • Operators, • Users.
Manufacturing resources and capabilities provides cloud services. Cloud services are
merged into manufacturing cloud based on different manufacturing requirements. This modification provides various application services during life cycle of manufacturing. Knowledge supports generating of operational procedures of the manufacturing cloud. Figure 1. illustrates operating principle of the manufacturing cloud.
To ensure cloud manufacturing, user requirements are needed, through which it is possible to design control platform. This platform should be responsible for:
• Control, operation and maintenance of the manufacturing cloud, • Services and tasks which carried out import and export, • Analysing and assignment of requested services, • Automatic search of most suitable cloud which ensure the required services.

InvEnt 2013
72
During planning, optimization and combination, solutions are generated, which can be simultaneously sent. Based on this approach, user doesn't need to directly communicate with each service node or even analyse specific places and situations.
Fig.1. Operation principle of manufacturing cloud
Fig.2. Key technologies of cloud manufacturing
InvEnt 2013
73
Figure 2. shows the core technology of manufacturing cloud including: • System architecture, operating models and specifications, • Resources and capabilities of cloud technology, • Complex control technology of cloud services, • Control model and service techniques.
Cloud manufacturing represents new approach for achieving manufacturing informatization
which has huge development potential. Research of cloud manufacturing relies on mutual effort between industry, academia and government. Companies should be equipped with suitable information technologies which will ensure the required integration of information and processes.
This paper was made about research work support KEGA no. 070ŽU-4/2012 References
[1] BUBENÍK, P., GREGOR, M., MIČIETA, B.: Production Planning, Žilina : EDIS, 2005, 169 p. ISBN 80-8070-427-9.
[2] BOTTI, V., GIRET, A.: Anemone: A multi-agent methodology for holonic manufacturing systems, Valencia : Universidad Politécnica de Valencia, 2008.ISSN, 2008, 213 p. ISBN 978-1-84800-1.
[3] GREGOR, M., KOŠTURIAK, J., MATUSZEK, J. MIČIETA, B.: Design of Manufacturing Systems for 21. Century, Žilina : EDIS, 2000, 397 p. ISBN 80-7100-533-3.
[4] HUANG, B. et al.: Cloud manufacturing service platform for small- and medium-sized enterprises. In International Journal of Advanced Manufacturing Technology, ISNN 1433-3015, 2013, vol. 65, 1261 - 1272.
[5] RODRÍGUES, S.: Cloud Computing Integrated into Service-Oriented Multi-Agent Architecture. In 9th IFIP WG 5.5 International Conference : Balanced Automation Systems for Future Manufacturing Networks, Salamanca : Universidad de Salamanca, 2010, ISBN 978-3-642-14341-0, p. 251-259.
[6] WILBRINK, A. et al.: Enterprise Information Systems as a Service. In IFIP WG 5.7 International Conference : Advances in Production Management Systems. Netherlands : Groningen University, 2012, 978-3-642-33980-6, p. 496-505.
[7] WU, L. et al.: A Solution of Manufacturing Resources Sharing in Cloud Computing Environment. In 7th International Conference : Cooperative Design, Visualization and Engineering, Jinan : Shandong University, 2010, ISBN 978-3-642-16066-0, p. 247-252.

InvEnt 2013
74
Genetic algorithms, Simulation, optimization
Miroslav HEGLAS∗, Silvia PALAJOVÁ∗∗
SIMULATION OPTIMIZATION WITH THE USE OF
GENETIC ALGORITHMS
Abstract
This paper discusses simulation optimization of manufacturing processes. The
first part reflects the current state of computer simulation and optimization using
genetic algorithms. The next section describes own optimization application
GAsfoS2 that uses genetic algorithms and is a part of the simulation program.
1. INTRODUCTION
Currently, at the time of rapid increase of computing power, it can be observed very
massive advent of techniques and methods that have been recently highness of very powerful computers with the necessary team of highly skilled professionals. One of these techniques is computer simulation. The beginnings of using of computer simulation date back to the simulation of military operations, whence the methodology moved into space research. The advantages of computer simulation gradually assumed into production and nonproductive systems. The indisputable advantage of todays’ simulation programs is fact that they are very user-friendly orientated for usage. Most of these simulation programs are oriented so that the creation of simple simulation models of manufacturing processes does not need knowledge of programming.
In the proposed simulation model simulation allows to perform many experiments, evaluate them, optimize processes and apply results to the real system.
In the world we monitor the development of simulation optimization for several decades. New optimization techniques as well as modifications of older methods have played a crucial role in the development of simulation optimization. Simulation optimization provides a structured approach to determination of optimal values of the input parameters, and optimum is measured by function of output variables from the simulation model.
∗ Ing. Miroslav Heglas – výskumný pracovník, Katedra priemyselného inžinierstva, Strojnícka fakulta, Žilinská univerzita v Žiline, Univerzitná 8215/1, 010 26 Žilina, [email protected] ∗∗ Ing. Silvia Palajová, PhD. – výskumný pracovník, Katedra priemyselného inžinierstva, Strojnícka fakulta, Žilinská univerzita v Žiline, Univerzitná 8215/1, 010 26 Žilina, [email protected]
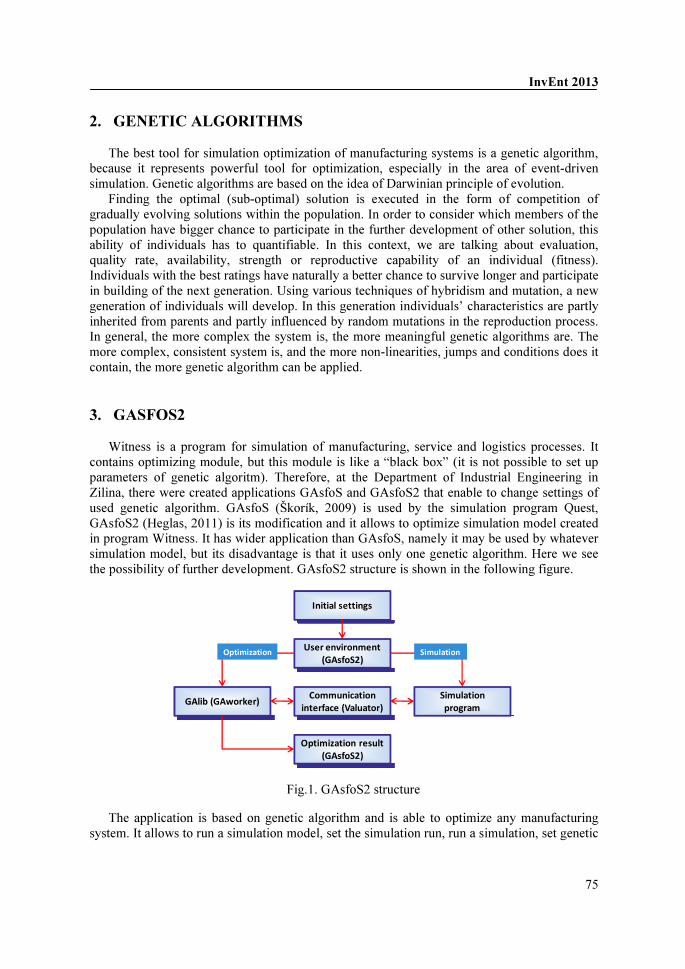
InvEnt 2013
75
2. GENETIC ALGORITHMS
The best tool for simulation optimization of manufacturing systems is a genetic algorithm,
because it represents powerful tool for optimization, especially in the area of event-driven simulation. Genetic algorithms are based on the idea of Darwinian principle of evolution.
Finding the optimal (sub-optimal) solution is executed in the form of competition of gradually evolving solutions within the population. In order to consider which members of the population have bigger chance to participate in the further development of other solution, this ability of individuals has to quantifiable. In this context, we are talking about evaluation, quality rate, availability, strength or reproductive capability of an individual (fitness). Individuals with the best ratings have naturally a better chance to survive longer and participate in building of the next generation. Using various techniques of hybridism and mutation, a new generation of individuals will develop. In this generation individuals’ characteristics are partly inherited from parents and partly influenced by random mutations in the reproduction process. In general, the more complex the system is, the more meaningful genetic algorithms are. The more complex, consistent system is, and the more non-linearities, jumps and conditions does it contain, the more genetic algorithm can be applied.
3. GASFOS2
Witness is a program for simulation of manufacturing, service and logistics processes. It
contains optimizing module, but this module is like a “black box” (it is not possible to set up parameters of genetic algoritm). Therefore, at the Department of Industrial Engineering in Zilina, there were created applications GAsfoS and GAsfoS2 that enable to change settings of used genetic algorithm. GAsfoS (Škorík, 2009) is used by the simulation program Quest, GAsfoS2 (Heglas, 2011) is its modification and it allows to optimize simulation model created in program Witness. It has wider application than GAsfoS, namely it may be used by whatever simulation model, but its disadvantage is that it uses only one genetic algorithm. Here we see the possibility of further development. GAsfoS2 structure is shown in the following figure.
Initial settings
User environment
(GAsfoS2)
Communication
interface (Valuator)
Optimization result
(GAsfoS2)
GAlib (GAworker)Simulation
program
Optimization Simulation
Fig.1. GAsfoS2 structure
The application is based on genetic algorithm and is able to optimize any manufacturing system. It allows to run a simulation model, set the simulation run, run a simulation, set genetic
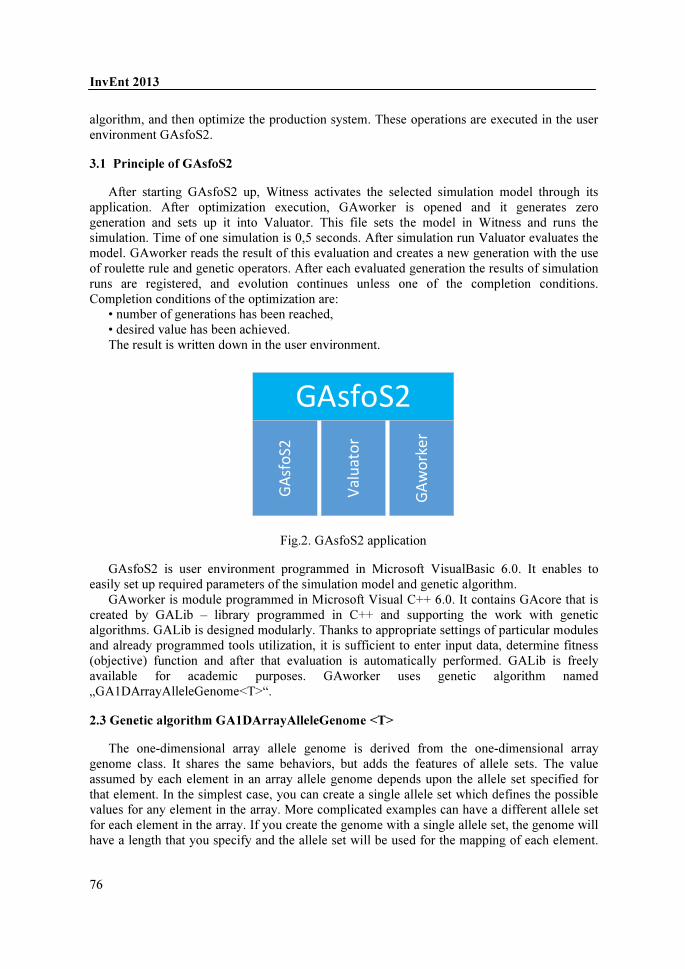
InvEnt 2013
76
algorithm, and then optimize the production system. These operations are executed in the user environment GAsfoS2.
3.1 Principle of GAsfoS2
After starting GAsfoS2 up, Witness activates the selected simulation model through its application. After optimization execution, GAworker is opened and it generates zero generation and sets up it into Valuator. This file sets the model in Witness and runs the simulation. Time of one simulation is 0,5 seconds. After simulation run Valuator evaluates the model. GAworker reads the result of this evaluation and creates a new generation with the use of roulette rule and genetic operators. After each evaluated generation the results of simulation runs are registered, and evolution continues unless one of the completion conditions. Completion conditions of the optimization are:
• number of generations has been reached, • desired value has been achieved. The result is written down in the user environment.
GAsfoS2
GAsfoS2
Valuator
GAworker
Fig.2. GAsfoS2 application
GAsfoS2 is user environment programmed in Microsoft VisualBasic 6.0. It enables to easily set up required parameters of the simulation model and genetic algorithm.
GAworker is module programmed in Microsoft Visual C++ 6.0. It contains GAcore that is created by GALib – library programmed in C++ and supporting the work with genetic algorithms. GALib is designed modularly. Thanks to appropriate settings of particular modules and already programmed tools utilization, it is sufficient to enter input data, determine fitness (objective) function and after that evaluation is automatically performed. GALib is freely available for academic purposes. GAworker uses genetic algorithm named „GA1DArrayAlleleGenome<T>“.
2.3 Genetic algorithm GA1DArrayAlleleGenome <T>
The one-dimensional array allele genome is derived from the one-dimensional array genome class. It shares the same behaviors, but adds the features of allele sets. The value assumed by each element in an array allele genome depends upon the allele set specified for that element. In the simplest case, you can create a single allele set which defines the possible values for any element in the array. More complicated examples can have a different allele set for each element in the array. If you create the genome with a single allele set, the genome will have a length that you specify and the allele set will be used for the mapping of each element.

InvEnt 2013
77
If you create the genome using an array of allele sets, the genome will have a length equal to the number of allele sets in the array and each element of the array will be mapped using the corresponding allele set. When you define an allele set for an array genome, the genome makes its own copy. Subsequent clones of this genome will refer to the original genome's allele set (allele sets do reference counting). (Wall, 1996)
Valuator is a communication interface between GAworker and Witness. It is a program
created in the programming language Microsoft Visual Basic 6.0. Communication is based on OLE interface. Valuator that controls simulation uses commands of language WCL.
CONCLUSION
Optimization has become a tool for competitiveness increasing. Therefore, it is necessary to
optimize as quickly and efficiently as possible. There are many optimization methods. Stronger methods have very good results, but they are specified for a narrow range of issues. Weaker have conversely wider field of application, but do not achieve satisfactory results. Simulation optimization allows finding the optimal solution to the problem of company in a very short time and with the support of genetic algorithms that have a broad spectrum application, optimization becomes a powerful tool for solving various types of tasks in different areas. In the field of manufacturing and logistics systems are solved e.g. nonlinear dynamic systems, looking for robot trajectory, the travelling salesman problem, scheduling of customer and line production, and so on.
„We support research activities in Slovakia/ Project ITMS 26220220155 is co-financed by
the EU.“
References
[1] HEGLAS, M. , 2011. Simulation of the production system using evolutionary techniques: master's thesis. Zilina: ZU, 2011. 72 s. [2] ŠKORÍK, P. , 2009. Simulation of manufacturing systems with the support of virtual reality: doctoral thesis. Zilina: ZU, 2009. 125 s. [3] MACH, M. , 2009. Evolutionary algorithms: the elements and principles. 1 ed. Kosice: Elf Ltd., 2009. 250 s. ISBN 978-80-8086-123-0. [4] HYNEK, J. , 2008. Genetic algorithms and genetic programming. Praha: Grada Publishing, OJSC, 2008. 200 s. ISBN 978-80-247-2695-3. [5] WALL, M. 1996. Galib: A C + + Library of Genetic Algorithm Components. Massachusetts: Massachusetts Institute of Technology, 1996. 101 s. [6] HNÁT, J. - GREGOR, M.: Genetic algorithm as optimizing tool in line balancing process. In: APPLIED COMPUTER SCIENCE – BUSINESS PROCESS OPTIMISATION Vol. 3, No 2, Žilinská univerzita v Žiline – Katedra priemyselného inžinierstva 2007, s. 18 - 33, ISBN 978-80-89333-01-1.

InvEnt 2013
78
Product Lifecycle Management, Virtual Reality
Jozef HNÁT∗, Patrik GRZNÁR**
USE OF VIRTUAL REALITY TOOLS AS A PART OF PLM
Abstract
This article highlights the importance of using visualization tools in the life cycle
management (PLM). Main idea and platform of PLM is mentioned in the article,
but the main part of the article is focused on virtual reality tools and its usage in
the process of assembly design.
1. INTRODUCTION
In the past we used to search for weaknesses in organization and management of work, later in
the creation of giant corporations, using mainly reduction of costs on supply inputs. Then computer
technology came and the first real results have been done by ERP systems, which made the order in
stock inventories and could reduce overall operating costs. It was followed by CRM and SCM
systems, which helped to shorten delivery times and reduce costs.
2. PLM STRATEGY
The ability to effectively manage product life cycle from initial concept to disposal and
recycling represents next level of company development, giving a presumption of success in the
market. This requires a huge amount of correct information, correctly evaluated and properly used.
It is necessary that this information must be available at the actual time for those workers who need
them, so they can use them and exchange them, wherever they are located in the world. It is
necessary to work with this information during development of strategic business plans,
development plans, definition of conceptual properties of product and its development,
manufacture, marketing, sales or service at any time in the life cycle of the product, and very often
much sooner or even long after its life. Every manufacturer has a different nature of their products,
operates in different markets, in different environment. Product Lifecycle Management (PLM) is a
business strategy that provides space for innovation, development, production, promotion and
retirement products in its life cycle in large corporations as well as small businesses. It captures best
Product creation practices, knowledge, processes and intellectual property for re-use.
∗ Ing. Jozef Hnát, PhD., Department of Industrial Engineering, Faculty of Mechanical Engineering,
University of Žilina, Univerzitná 1, 010 26 Žilina, Slovak Republic, tel. 00421-0415132733, e-mail: [email protected],
** Ing. Patrik Grznár, PhD., Department of Industrial Engineering, Faculty of Mechanical Engineering, University of Žilina, Univerzitná 1, 010 26 Žilina, Slovak Republic, tel. 00421-0415132733, e-mail: [email protected],

InvEnt 2013
79
Fig.1. PLM platform
PLM solution is not software and it is not an application. PLM solution is set of rules, tools,
software, standards and actions within which the software is an important tool to meet this corporate
strategy.
PLM consists of many elements including:
• unified technologies and standards (e.g. data exchange formats, visualization, collaboration
and integration with other enterprise subsystems),
• data core functions - PDM (such as data bank, documentation, data management,
workflow and process management),
• graphic and text editors and engineering systems (e.g. CAD / CAM systems),
• functional applications (specialized for the needs of the user).
Product Lifecycle Management simplifies business processes and integrates them with ERP,
SCM and CRM systems. This leads to the introduction of permanent, repeated functions, processes
and information throughout the product life cycle - from idea to retirement. Producers who
implemented PLM achieve benefits by reducing costs, faster innovation and increasing the share of
their products in the market. The main part of the PLM strategy is the concept of Digital Factory.
In addition to common data management (PDM), the use of CAx systems and other support
tools for managing product life cycle, it is important the ability to visualize and present the designed
solutions. Tools of augmented reality (AR) represent a powerful tool in this process. Thanks to their
interactivity they help to reduce the time needed for choosing appropriate solutions and decisions.

InvEnt 2013
80
3. USE OF VIRTUAL REALITY TOOLS IN DESIGN OF ASSEMBLY
IN PLM
Assembly represents a significant and potential area for innovation activities in manufacturing.
Assembly represents high proportion of total production time in many companies. It is important to
avoid any possible errors before the start of production. This can be done by testing of assembly in a
virtual environment. The actions proposed in the virtual assembly are essential because they provide
higher productivity, help to increase competitiveness of production, its quality, etc.
System of virtual assembly is realized on the bases of the real assembly exercises. Application
achieves high speed on a standard personal computer. An important outcome for the user is the
natural linkage with a virtual reality environment. There are no special knowledge or computer
skills required while working in the environment of virtual reality. Assembly with using gloves and
tracking sensors provides an easy and uninterrupted way of work. [1]
Importance of virtual reality is that the virtual environment can be shared by many users
simultaneously, while they can interact. In this way, more people can work together to solve
problems.
Way of virtual reality applications in industry:
• visualization - simulation is represented in 3D,
• interactivity - user interaction (twitching hands, movement, press one button, click the
item) affects the simulation,
• simulation - 3D models of real or imaginary environment are simulated by using a
computer.
Following figure shows the schematic representation of the assembly system design with virtual
reality tools. [3]
Fig.2. Schematic representation of the assembly system design with virtual reality tools [2]
Product creation - in the first step CAD model is created. This model is exported into a standard
format STEP (Standard of the Exchange of Product Data Model) (ISO103031994), containing the
product structure and 3D model of the product. This format allows you to record and thus transmit
information that occur during the development-design as well as technologic-implementation cycle.

InvEnt 2013
81
It allows transfer of a wide range of geometrical and non-geometrical information relating to various
areas of processing.
Geometry simplification - models simplification is achieved by removing the details (small
holes, etc.). The final model is build from triangles.
Assembly and analysis planning - apart from the parts of assembly you need to enter additional
information, such as the assembly procedure, work descriptions, time required to perform each
operation, as well as information about the tools. Each product is defined by:
• individual parts,
• assembly operations,
• needed tools.
Creation of content and scenario - the individual work instructions are assigned to parts or sub-
assemblies. Each component has defined position, rotation angle, type of animation and duration
(seconds). After defining the entire assembly it is possible to simulate process.
Visualization - as imaging devices are commonly used monitors with camera. Here it is possible
to use conventional paper markers as identification marks. After identification of marker, computer
assigns the correct 3D object. Worker can rotate the assembly as needed. Displayed objects are
highlighted by colored border for better visualization.
Virtual reality tools in addition to providing support for workers in their work, allows to shorten
assembly time and time for "learning".
4. CONCLUSION
New unique technologies, we can currently use, offer miracles. You just have to reach for them.
The current time of digitizing represents a significant movement towards achieving more and more
realistic representation of modeled and digitized world.
Development of the automotive, electronics and aerospace industry brings new approaches.
These approaches use rapid prototyping technologies, digitization, virtual reality and simulation.
This paper is the part of research supported by: VEGA 1/1146/12.
References
[1] GÖRNER, T., HOŘEJŠÍ, P.: Virtuální realita, SmartMotion, Plzeň 2011, ISBN 978-80-87539-02-6. [2] MIRANDOVÁ, G. – KRAJČOVIČ, M. 2011. Rozšírená realita v montáži. In: MOPP 2011 Modelování a
optimalizace podnikových procesů [elektronický zdroj] : 13. ročník mezinárodního semináře : 24.-25.11.2011. Plzeň: Západočeská univerzita, 2011. - ISBN 978-80-261-0060-7.
[3] MIRANDOVÁ, G. – KRAJČOVIČ, M. 2011. Use of augmented reality in industrial engineering. In TRANSCOM 2011 : 9-th European conference of young research and scientific workers. Žilina : University of Žilina, 2011. ISBN 978-80-554-0370-0. s. 193-196.
[4] MATUSZEK, J. – MOCZAŁA, A.: The modelling and simulation method in computer aided cooperation, Journal Control & Cybernetics ,vol.39 (2010) No. 1
[5] PLINTA, D: Optimization methods in modeling and simulation of production systems. In Applied computer science: Supporting enterprise management processes /ed. Zbigniew Banaszak, Józef Matuszek. Wydawnictwo Akademii Techniczno-Humanistycznej, Bielsko-Biała 2009 - ISBN 978-83-60714-95-9 . - p. 81-92
[6] http://www.plm.automation.siemens.com/cz_cz/
InvEnt 2013
82
Data Mining, SQL, DMX, database systems
Filip HORÁK*, Michal HALUŠKA**
SERVER-BASED DATA MINING
Abstract
The article introduces MS SQL Server solutions like DMX language and
Business Intelligence Development Studio to data mining and describes some
crucial advantages and disadvantages of server based data mining in
comparison to classic desktop data mining solutions.
1. DATA MINING SOLUTIONS
Nowadays, there is a huge quantity of software products that support data mining, or offer
features that enables users to analyze their data through data mining methods as a part of
overall solution. Despite some similarities and mutual integration efforts, many of these
products still have significantly different representation of workflow. In addition to this, there
is a vast amount of data mining techniques that are supported by different vendors, so users are
sometimes forced to transform their data from one product to another in order to get desired
results. This applies not only to data mining itself, but also to other necessary analytical tasks
in knowledge discovery process such as initial transformation and data visualization. These
facts then further isolate solutions for data mining from existing enterprise information
systems, which contributes to increase of difficulty and implementation costs of specific
knowledge-based solutions to real problems.
2. DATA MINING EXTENSIONS
DMX (Data Mining Extensions) is an extension of SQL language, which aims to define
standard queries and concepts in field of data mining similarly to way that was taken by SQL
developers in field of databases. DMX was developed in the way that it is user-friendly for
database developers, which might sometimes make it a bit confusing for analysts who
previously worked with desktop data mining solutions.
Essentially, it is a 4th generation query language (4GL) based on client-server architecture,
which is syntactically very similar to SQL, which can be further supported by the fact that
commands used in DMX can be divided into following categories:
* Ing. Filip Horák, University of Žilna, Department of Industrial Engineering, Univerzitná 8215/1, 010 26 Žilina, [email protected] ** Ing. Michal Haluška, University of Žilna, Department of Industrial Engineering, Univerzitná 8215/1, 010 26 Žilina, [email protected]

InvEnt 2013
83
• Data Definition Statements
• Data Manipulation Statements
One can consider a DMX language to be a useful tool, which enables to transform data in
table format to form that is accepted by data mining algorithms, while still working with
relational database. This is a major advantage over desktop data mining solutions, mainly
because of the fact that updating these data is significantly less time consuming. The evident
example of this transformation can be an existence of two main logical objects, that are:
• Mining Structure
• Mining Model
Mining Structure contains table columns with data that are available for specific data
mining issue and also information about these columns.
Mining model is partially used for transformation of mining structure and realizes a
machine learning process through specific algorithms chosen by user. It can be viewed as
subset of columns of Mining Structure with assigned way of handling and defined mining
algorithm with its solution-specific parameters. Moreover, this model can be limited by user to
mine just a certain fraction or subset of data. In Microsoft SQL Server environment, which
offers the possibility to exploit DMX features, there can be found following data mining
algorithms: Decision Trees, Association Rules, Naive Bayes, Sequence Clustering, Time
Series, Neural Networks, Linear Regression, Logistic Regression
3. MICROSOFT SQL SERVER AND DMX
Nowadays, there is still a rapid growth of Business Intelligence (BI) solutions. Main
Microsoft product in this field is SQL Server Analysis Services (SSAS), which is aimed at
gaining as much knowledge as possible from data available to enterprise. To reach this goal,
SSAS defines two types of objects:
• Data Cubes
• Data Mining Models
With Data Cubes, information can be extracted and visualized using Multidimensional
expressions language (MDX) and for working with data mining models, aforementioned DMX
language is used. One of the most common ways to create DMX query in MS SQL Server is
SQL Server Management Studio (SSMS), which is perfectly known to database developers.
An example of a simple DMX query for outputting source date of mining structure in
SSMS may look like this: select * from mining structure [customer mining].cases;
For experts in the field of statistics and data mining, who are used to work in more user-
friendly environments offered by some popular desktop applications such as RapidMiner or
KNIME, can the concept of writing queries be a relatively difficult experience, since it is
aimed more at database developers or at software application developers with at least minor
knowledge of writing queries in SQL language. Microsoft partially fights this disadvantage by
its BI Dev Studio product, which on one hand is still mainly oriented on application
developers, but on the other hand uses a lot of wizards, which help user to construct his
solution without previous knowledge of programming.

InvEnt 2013
84
4. DATA MINING IN BI DEVELOPMENT STUDIO
SQL Server Business Intelligence Development Studio (BI Dev Studio) is an developing
environment integrated into Microsoft Visual Studio, which among other things offers more
graphic view of data mining process with use of intuitive graphic user interface.
In most cases, it doesn't matter if a data mining solution is implemented through SSMS
(with use of DMX language), or through BI Dev Studio. For software application developers, it
is more efficient to work with DMX language in SSMS, because there the creation and testing
of queries take place. These queries can then be generated dynamically, or can be integrated as
part of a solution being developed, but for visualization and user friendly manipulation with
data mining objects it is often more efficient to use BI Dev Studio. Both approaches
manipulate same objects and same data and have almost same functions.
In BI Dev Studio it is possible to create new Analysis Services Project in the same way that
a new project is created in Visual Studio. After defining of Data Sources and Data Source
Views, it is possible to define the Mining Structure.
Fig. 2. Defining of new mining structure in BI Dev Studio.
Most of the objects in BI Dev Studio (mining structures, models, views, etc.) can be
constructed using wizards, where user in individual steps defines desired parameters. This way
BI Dev Studio ensures logical flow of steps necessary in creation of mining objects without the
need for user to remember their sequence. Vast majority of work takes place at Data Mining
Designer window which shows up just after the creation of Mining Structure and Mining
Model. Data Mining Model consists of following tabs: Mining Structure, Mining model,
Mining Model Viewer, Mining Accuracy Chart, Mining Model Predictions
To further support user-friendliness, BI Dev Studio offers also tools for visualization of
data that user works with. It is possible to view data from any table by using tools such as:
Table, Pivot Table, Chart, Pivot Chart
Since the solution discussed is a server-based solution, it is necessary to pay more attention
to way of accessing source data. In BI Dev Studio, it is possible to access data in two modes:
• Offline mode
• Immediate mode
In immediate mode, user is constantly connected to server. Changing and saving of object
thus creates immediate change of data on server. In Offline mode, files with project data are
stored on the side of the client and changes are stored on hard disk in form of XML-based

InvEnt 2013
85
format. Models and other objects are not created on side the of the server until they're not
deployed there from client machine.
5. INTELLIGENT APPLICATIONS AND DATA MINING
Technology of data mining opens possibilities to creation of new kind of intelligent
applications, which, to some extent, don't need their own specific code for reaction to various
situations, because they can learn and adjust their behavior right from data itself. Great
advantage of this approach is, that in case of slight changes in patterns that are extracted from
data, there is no need to readjust (or in worst case scenario completely reprogram) application,
but it is sufficient to just reprocess models that represent enterprise logic, and apply newly
retrieved control parameters. However there is a broad range of data-mining algorithms and
their combinations, that are not yet supported neither by these client-server solutions, nor by
third party plug-in developers, which diverts users to desktop platforms and forces database
owners to export data to non-relational formats like .csv or .xlsx for further analysis, thus
avoiding additional benefits of own analytical capacity.
CONCLUSION
The article contains brief description of data mining in Microsoft SQL Server with use of
DMX language and it's user-friendlier counterpart Business Intelligence Development Studio,
which compete against desktop solutions for data mining. It is shown here, that MS SQL
Server offers many possibilities in terms of data analysis and it is usually beneficial for
database owners who use SQL Server to explore these possibilities before trying to further
complicate their own system by implementing software products from other vendors.
This paper is the part of research supported by: VEGA 1/1146/12.
References
[1] MACLENNAN J. – TANG Z. – CRIVAT B. 2009. Data Mining with Microsoft SQL
Server 2008. Indianapolis : Wiley Publishing, 2009. ISBN 978-0-470-27774-4
[2] TENNICK A. 2011. Practical DMX Queries for Microsoft SQL Server. New York : The
McGraw Hill Companies, 2011.
ISBN 978-0-07-1784867-4
[3] Data Mining Extensions (DMX) Reference. 2012. [online] 2012
[cit. 2012-09-27] Dostupné na internete:
<http://msdn.microsoft.com/en-US/library/ms132058.aspx>
[4] Developing and Implementing using Business Intelligence Development Studio. 2012.
[online] 2012 [cit 2012-09-27] Dostupné na internete: <http://msdn.microsoft.com/en-
us/library/ms174597(v=sql.105).aspx>
[5] Plugin Algorithms. 2012. [online] 2012 [cit. 2012-09-27] Dostupné na internete:
<http://msdn.microsoft.com/en-us/library/ms176127.aspx>

InvEnt 2013
86
OPC UA, SOA, SERVER, CLIENT, WEB, COM
Peter HRUBANÍK∗
Branislav MIČIETA**
Ján ROFÁR***
OPC UA USAGE IN THE MOBILE AND WEB
APPLICATIONS
Abstract
OPC Unified Architecture (OPC UA) is the new standard of the OPC
Foundation. Unified Architecture providing cross platform approach in process
automation. OPC UA provides a service-oriented architecture (SOA) for
industrial applications – from process level in factory to web and mobile
enterprise applications.
1. INTRODUCTION
OPC Unified Architecture is the most recent OLE for process control (OPC) specification
from the OPC Foundation and differs significantly from its predecessors. The first version of
Unified Architecture was released in 2006, after 3 years of specification work and another year of
prototyping. The Foundation's goal for this project was to provide a path forward from the
original OPC communications model (namely COM/DCOM) to a cross-platform service-oriented
architecture (SOA) for process control, while enhancing security and providing an information
model.
1.1 Why a new type of communication model?
The existing OPC COM based specifications have served the OPC Community well over the
past 10 years, but as technology moves on so must our interoperability standards. Here are the
factors that influenced the decision to create a new architecture:
• Microsoft has deemphasized COM in favor of cross-platform capable Web Services
and SOA (Service Oriented Architecture)
• OPC Vendors want a single set of services to expose the OPC data models (DA,
A&E, HDA ...)
• OPC Vendors want to implement OPC on non-Microsoft systems, including
embedded devices
∗ Ing., Department of industrial engineering, Univerzitná 8215/1010 26 Žilina, [email protected]
** prof., Department of industrial engineering, Univerzitná 8215/1010 26 Žilina, [email protected] *** PhD., Department of industrial engineering, Univerzitná 8215/1010 26 Žilina, [email protected]

InvEnt 2013
87
• Other collaborating organizations need a reliable, efficient way to move higher level
structured data
The minimal OPC UA(Fig.1) implementation is lightweight and uses an efficient binary
communication protocol. As a result, OPC UA has already been ported to many embedded
operating systems including VxWorks, Linux and proprietary RTOSs (Real Time Operating
Systems). At the top end OPC UA supports communication with enterprise standard XML Web
Services protocols. This reduces system integration costs by providing a common architecture for
accessing information.
Fig.1. Cross platform approach
The OPC UA Specification defines a binary TCP based protocol which provides fast
performance with minimal overhead. For the enterprise environments SOAP/XML is normally
the preferred communication protocol. OPC UA offers the ability to pre-encode messages with
UA Binary before packaging them in a SOAP/XML compatible message which improves
performance by as much as 10x when compared to the same message sent using XML. This
architectural advantage provides benefits even when using SOAP/XML with formats such as
the proposed WC3 Efficient XML because it reduces the complexity and size of the XML
before it is sent on the wire.
2. UPGRADING COM MODEL SERVER
In the InMoSys QC we using OPC server(COM model) from Mitsubishi. For using
UA(Unified Architecture) communication model we must install OPC XML DA Wrapper.
The OPC UA COM interoperability components allow vendors to quickly OPC UA enable
their existing COM client and server applications. The components can then be customized to
add advanced OPC UA features as needed. This means users can continue to leverage their
investment in OPC COM technology while deploying new OPC UA applications.
Fig.2 COM model to UA model.

InvEnt 2013
88
3. EXAMPLE OF USING UA CLIENT IN INDUSTRY
OPC UA client is able used in mobile devices. There are two ways to use in mobile devices.
First way is using application into mobile devices. Application tries to connected device(Fig. 3)
over TCP/IP protocol. Functions for control and manage process are included in this
application. Second way is using web server with SOA client. Client send request to web
server. Web server processed request with using SOA client. SOA client communicated with
OPC UA server. The web server sent result in HTML code to client web browser(Fig. 4).
Client can see 2D or 3D SCADA graphic in the web browser. 3D graphic is supported in web
browser whit using special Java Script library∗
. This library support OpenGL engine. Model is
possible rotate and show live information from process level in 3D scene. Support 3D format is
*.obj.
Fig 3. Example of Android OPC UA client application.
Fig.4 Example of using 3D model in web browser
CONCLUSION
∗ Three.js is a library that makes WebGL - 3D in the browser.

InvEnt 2013
89
OPC UA is an important step to integrate new technologies into industrial automations. The
strong meta model, the open and standardized service-oriented architecture and the ability of
unifying different kind of OPC servers opens the door for new areas of application. Since many
companies participated in developing the OPC UA specification it is expected that soon there
will be many products available supporting OPC UA.
Acknowledgements: Research and development of a prototype based on unmanned
technologies and subsequent application of knowledge gained in practical terms ITMS code
26220220122 "on the basis of Operational Programme Research and Development financed by
the European Regional Development Fund.
References
[1.] Mahnke, Wolfgang; Leitner, Stefan-Helmut OPC Unified Architecture - The future
standard for communication and information modeling in automation, 3/2009 ABB
Review 3/2009, page 56-61
[2.] Leitner, Stefan-Helmut; Mahnke, Wolfgang OPC UA – Service-oriented Architecture for
Industrial Applications, 11/2006 Softwaretechnik-Trends (ISSN 0720-8928)
[3.] Massaro, Simone What is OPC UA and how does it affect your world?, 5/15/2008
planetengineering.com
[4.] OPC UA Stack Written in Java--Write Once, Run Anywhere". Automation World. 1
November 2010. Retrieved 29 Dec 2012.
[5.] OPC Foundation: Data Access Custom Interface Standard. Version 3.00, March 04, 2003

InvEnt 2013
90
Loading appraisal, TX Jack, ErgoPak
František KALL*, Martin KRAJČOVIČ**, Miroslava BARTÁNUSOVÁ***
LOADING APPRAISAL OF AN OPERATOR
IN WORKING PROCESS USING
TECNOMATIX JACK AND ERGOPAK Abstract
Physical loading affects health and working performance during working
process especially in assembly operations. This physical loading can cause
serious diseases and increase fluctuation of operators. We can evaluate it by
several ergonomics analyses. These analyses we can find also in software
solution TX Jack, but problem is how to find out value of loading. We describe
one possible solution in this article.
1. INTRODUCTION
Assembly is a collection of activities aimed at creating a functional unit (machine, equipment, etc.) by means of joining various components. Usually it is the last stage of production, followed by functional testing and running in. It has decisive impact not only on quality and reliability of products, but also on productivity and efficiency of the whole assembly and production system. Assembly of difficult products is still manual work even in automotive or mechanical industry. Therefore it is necessary to ensure suitable working conditions during designing assembly workstations. When operator manipulates with bur in incorrect way and many times per day it can cause serious health problems. That is the reason why we have to know measure loading. 2. LOADING APPRAISAL IN TECNOMATIX JACK
At present for loading appraisal we can use several ergonomics software. One of them is Tecnomatix Jack, which offers all well known ergonomic analyses. Each of these analyses has special menu and you have to put in different data. For example OWAS of RULA evaluates only working posture. When you add loading to the figure in evaluating posture the results will not change. But there are many other analyses that’s results change very significantly by adding loading. You can add loading in this program in two ways. First way is to add weight of bur in kilograms. In this way direction of loading always aims downward. Second way is to
* Ing. František Kall, KPI, SjF, ŽU, františ[email protected] ** Doc. Ing. Martin Krajčovič, PhD, KPI, SjF, ŽU, [email protected] *** Ing. Miroslava Bartánusová, KPI, SjF, ŽU, [email protected]

InvEnt 2013
91
add load vector. You can specify x,y,z coordinates of this vector and level of loading you define in newtons. These variants you can see at Fig. 1.
Fig.1 3D model of selected workplaces
As was said this loading significantly changes results of ergonomics analyses. You can see it at the Figure 2, where is compared the same situation at first without loading (operator is bending down to the bur) and then again with loading 15kg (operator is lifting 15kg object). In this working sequence operator is lifting work piece and than he is flattening it at the worktable.
Fig.2 Comparison of loading with and without bur

InvEnt 2013
92
3. MEASUREMENT OF LOADING WITH ERGOPAK
When we sole a real project we have no problems to detect real weight of components or work pieces, but there is problem how to detect real loading while pushing or pulling something. There are several possibilities how to measure this loading. One of them is ErgoPAK. It is tool kit for collecting and analyzing data under real job conditions. It can measure force, velocity and also angle. It has few sensors whose can measure push or pull. Each sensor is calibrated independently. Its wireless hub has eight ports so you can use more sensors at the same time. For collecting and processing data you have to install special ergoPak data acquisition software. But is very user friendly. ErgoPAK tool kit includes these sensors: • handle sensor for measuring push or pull of both hands, • handle sensor for measuring push or pull of one hand, • one finger sensor for push measuring, • two fingers sensor for push measuring, • “mushroom” sensor for push measuring of the whole hand, • gyroscopes for angle measuring, • accelerometers for acceleration measuring, • special glove with four push sensors measuring each finger independently.
Fig.3 ErgoPAK tool kit This device is able to capture one hundred elevations per second. It means that we get about one thousand values in ten seconds. Push values are captured in positive numbers and pull values are captured in negative numbers. At Fig. 4 you can see sample of pushcart pulling with two hand handle. In the graph we can see push forces at four fingers and pull force needed for movement of the pushcart.

InvEnt 2013
93
Fig.4 Pulling of pushcart – measured values
4. CONCLUSION
It is very important to know right loading values especially in assembly processes where are the same movements repeated very often. Because when they have some harmful influences they can cause serious health problems. This article describes possibility how to measure push and pull forces in working and assembly processes using ErgoPAK tool kit and how to use these values in loading appraisal. Loading appraisal we can also do in many ways. We have introduced loading appraisal using ergonomic analyses in Tecnomatix Jack software. This paper was made about research work support: KEGA 004ŽU-4/2013 - Integration of advanced information technologies and e-learning into education of manufacturing and assembly systems design (AIT-MASD). References
[1] KALL, F. – BARTANUSOVÁ, M. 2012 Softvéry pre ergonomické posúdenie pracovísk. In: Ergonómia 2012. Zdravie a produktivita. Zborník prednášok a recenzovaných publikovaných príspevkov z vedeckej konferencie (e-book), SES, Žilina, 2012, s. 42-49, ISBN 978-80-970974-1-7. [2] DULINA, L. - SLAMKOVÁ, E. – TABAKOVA,M. 2010. Ergonómia v priemysle. Georg, 2010. ISBN 978-80-89401-09-3 [3] DULINA, L. - SLAMKOVÁ, E. 2006.Kumulatívne traumatické ťažkosti a ich aspekty v automobilovom priemysle. In: InvEnt 2006 – zborník referátov, UNIZA, Žilina, 2006, ISBN 80-969391-1-4
InvEnt 2013
94
Technical preparation of production, Trends, SYSKLASS
Marta KASAJOVÁ*
TRENDS - TECHNICAL PREPARATION OF PRODUCTION
Abstract
Article focuses on the technical preparation of production, its main parts:
preparation of production design, technological preparation of production,
production project preparation and implementation. The article describes the
development direction of technical preparation of production, SYSKLASS as an
information system of the new generation. This system aims to preserve and promote
the development of technical documentation.
1. INTRODUCTION
The growth rate of industrial production and the level of efficiency is determined primarily
in product development. Objectives in the development of new products and technological processes, the rational course of preparation of production and labor force quick results in the production and marketing of products always determined by the requirements of the overall intensification of production processes. This means that on the one hand, it is necessary to reduce production and consumption on the other hand increase the efficiency of human labor at all stages of the reproductive process in compliance with the objective trend of higher product quality and performance. 2. TECHNICAL PREPARATION OF PRODUCTION
Summary of technical, technological, organizational and technical-economic activities
necessary for the timely initiation and completion of production, its good organization and high technical level with favorable economic results form the technical preparation of production. We may conclude that it is a set of activities based with customer requirements, coordination processes to process design, technology and design and documentation of material and technical equipment of the production process for the implementation of production tasks (Fig. 1).
* Ing.Marta Kasajová*, PhD., ŽU, SJF, KPI, email: [email protected]

InvEnt 2013
95
Fig.1. Model technical preparation of production
2.1 Overall production preparation
Overall production preparation implements the creation of design documentation within the
prescribed deadlines in accordance with production plans. It is actually a series of works aimed at the construction of new or upgrading existing products with respect to functional excellence, commitment in patent, design simplicity and operational efficiency. 2.2 Technological preparation of production
Technological preparation of production technology ensures complete documentation and means of technological equipment. The flexibility of the organizational structure of technological preparation of production allows a rapid transition to address new challenges and rationalization of processing information. technological preparation of production is therefore a set of activities aimed at the production of documentation and processing documents for material equipment and tools preparations (Fig. 2)
Fig. 2 . Framework scheme technological preparation of production

InvEnt 2013
96
2.3 Project preparation for production
The project activity is aggregated set of information in the form of classical technical
documentation, and recently the numerical entries stored inside information systems. The aim of the processing of information is the suggestion of production activities to ensure that all work associated with converting materials and semi-finished products to finished product. Design of optimal production process and the algorithms for the substance needs to take account of the production process and: 1. identify the source, volume, quality and method of processing input information; 2. describe the activities determined in the design of the production process, that is to define
input and output variables, functional links subsystems and their structure; 3. formulate criteria for optimal production process. Project activities under way in the design of technological information processing can be divided into three stages:
a) study-analysis - projects focusing on assembly, recording and analysis of input, b) design - at this stage of the study process information-analytical phase by the same algorithm. Under the algorithm means a logical sequence of operations set of instructions, rules, under which the work piece assigned variants of operations, processes and solutions, c) optimization - the result of the design phase is a set of variants to choose from which is the most convenient. 2.4 Material production preparation
Material management company ensures acquisition of material inputs for business activity,
thus: - Ensure work equipment, - Addresses the material and technical support for the production and material handling. 2.5 Implementation
The process of realizing the objectives of the business entity goes through phases: research and development, production preparation, actual production and subsequent assembly, which in engineering includes all activities which combine all manufacturing finished parts in a fixed order to make the product so that it has all the required behavior. The production phase is decisive contribution to the success of enterprise and becomes a strategic weapon in the hands of corporate management. The success of the production process decides rational way of organizing its management

InvEnt 2013
97
3. TRENDS TPP
The answer to the efforts to achieve maximum productivity, maximum utilization of
available resources, efficient use of production processes with view to saving material, energy and labor in the process of finalizing the products are new insights into the development and direction of technical preparation of production: - Preferred method of team work organization and technical preparation of production, - Use many methods and techniques from the field of systems engineering (project
management, value engineering, simulation), quality assurance (FMEA, QFD, - Strong computer support - Systems CAD, CAE, CAPP, simulation capabilities, which
are used block technology. - Group technology is a method of classifying the parts into groups, and components
within a group produced in a similar way, that is technologically similar operations and a similar sequence of operations. This method is based concept of product development, and the actual production, at which the individual items are made up from the similarity of certain selected technology of characteristics in each group. Production of parts is often carried out by already drawn up and validated technological processes. This fact is used in computer systems to support the creation of technological processes (Technology Group based CAPP system), which represents SYSKLASS (Fig. 3) as a comprehensive system for the technical preparation of production.
Fig. 3 SW Sysklass

InvEnt 2013
98
SYSKLASS ® system is used for automated documentation creation of technical preparation of production and concept of CAD / CAM (Fig., integrates performance systems efficient management of business know-how. TPV processing large information systems seems to be insufficient for demanding profession technologists and engineers and their requirements for specialized information system. System solution is SYSKLASS ®.
SYSKLASS ® system ensures high comfort radically improve the profitability of new products and production contracts and increase the flexibility and speed of implementation. The biggest advantage of SYSKLASS ® is a high comfort, productivity and profit, which SYSKLASS ® brings users. This allows the original security method selected business activities, from marketing analysis, through the optimization of design and technological preparation of production, automated production of material and performance standards, bills of materials, production technologies, tools, change management, operational capacity calculations, creating material and performance standards, to strong management support at all levels with the information and evaluation system. System at each level offers next convenient type or in the form of a unified solution of:
- Design drawings, - Determination work piece blank , - Production technology (obr. 4), - Documentation of plant and tools.
Fig. 4 Determination of production technology
The most important aim of the system is SYSKLASS management and the creation of
technical documentation, which is the basis for planning and record production. The main part of the technical documentation include:
- Design documentation - items, parts lists, drawings and other documents (regulations, standards, etc.).
- technological documentation - technological processes, operations, equipment requirements, location, people, tools, standards and time consumption of materials and other supporting documentation (regulations, protocols, quality, etc..).

InvEnt 2013
99
Modules for processing technical documents are suitable for processing technical documents from simple types to precise and detailed production of high-tech products. Provide opportunities for rapid creation of documents defined and allow the administration in one place so that it is currently available and usable for modern production planning and scheduling. One of its benefits is that it allows variability to provide sufficient opportunities for production planning under the current terms of business, which in today's dynamically changing environment is one of the preconditions for its smooth functioning.
This article is part of Project VEGA: 1/0583/12 References:
[1] BUDA, J.- KOVÁČ, M.: Methodology for designing manufacturing processes in engineering, Alfa, Bratislava [2] HLAVENKA, B.: Management planning and technical production, . SNTL, Praha, 1983. [3] SLAMKOVÁ, E. - STACH, F.: Designing manufacturing processes (user training). Alfa, Bratislava, 1987. [3] http://www.sysklass.sk. [4] Sysklass – TPP, general information, http://www.sysklass.sk/sysklass_TPV.html

InvEnt 2013
100
Model, Tecnomatix. Plant Simulation, Optimization
Marek KLIMENT*, Peter TREBUŇA**
CREATION OF OPTIMIZATION MODEL PRODUCTION
LINE USING TECNOMATIX PLANT SIMULATION
Abstract
Companies are nowadays trying to save resources, material and time and thus
optimize production and maximize production outputs and minimize inputs. There
are many ways by which a manufacturing process may be analyzed and optimized.
The article deals with the optimization of the production line using software
module Tecnomatix Plant Simulation that creates models of production in its
original form and in an optimized form after evaluation and analysis of what can
be improved and where to save.
1. INTRODUCTION
In the manufacturing enterprise any savings cost , time, material, or improvement the
production is positive development of the manufacturing process and increased revenue. For
each optimization process it is necessary to choose the resource which can be used for given
optimization. One of the possibility is to apply the PLM system, suitable alternatives in the
process of dynamic modeling and simulation of future production processes Tecnomatix Plant
Simulation module.
2. CREATING MODELS IN TECNOMATIX PLANT SIMULATION
In developing the model of the real production it is necessary to map the production to reflect it
to the form of a digital model and make it a simulation set in it and know all the necessary
items and then evaluate and explore possible shortcomings could be removed in any way, or
minimize. In developing the simulation Plant Simulation used mainly major area selection of
items forming a simulation model that includes processes commonly used in the simulation of
simple and complex production processes that are inputs and outputs of production, simple and
parallel process, assembly and disassembly, transfer stations, conveyors, access roads and
connectors of all processes and the like (Fig. 1).
* Ing. Marek KLIMENT, Department of Industrial Engineering and Management, Faculty of Engineering, Technical University of Kosice, Boženy Němcovej 32, 040 01 Košice, [email protected] ** doc. Ing. Peter TREBUŇA, PhD, Department of Industrial Engineering and Management, Faculty of Engineering, Technical University of Kosice, Boženy Němcovej 32, 040 01 Košice, ,[email protected],

InvEnt 2013
101
Fig. 1 The main area of selection of items in the simulation
After selecting these items and their bonding and determination of production routes it is
necessary in each menu item to set all the known elements such as the times of the production
lines, production volumes, volumes of production lots, etc. In the menu Event Controller item
we set the duration of one shift and display speed simulation.
When preparing a particular simulation model of production (layout) we have created a first
simulation of the original state of production and we performed analyzes which Module Plant
Simulation offers. The arised simulation is illustrated on Fig. 2.
Fig. 2 Simulation of production before optimization
After completing layout simulations are based on the analysis and observation of production
optimization model to make only one change in the set of objects used in the simulations. This
object is Assembly - fold, where we used two different values Assembly table settings. In the
original models of this object - workstation, packed in one box set 1, which is 25 pieces. In the
new module package 4 sets, it is 100 units which is the maximum signal level (Fig. 3). Signal
level is the volume of the box in which the sets are packed in original manufacturing packaging
were a large amount of unused space, it caused a larger quantity of pallets during transport
between production machines and workplaces where the products is processed. We have come
to several optimization changes by this solution :
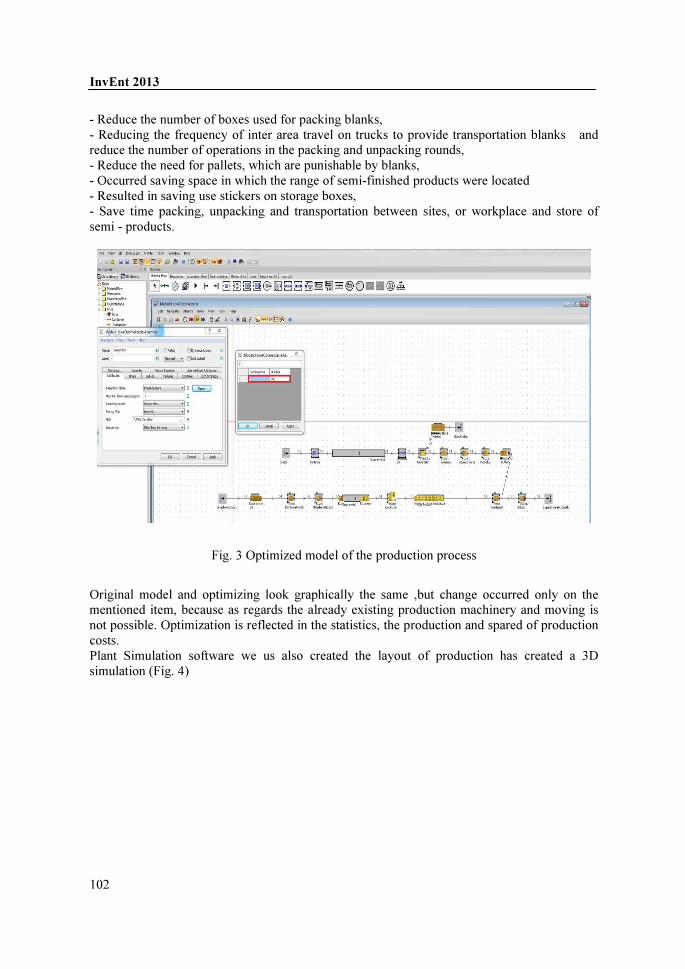
InvEnt 2013
102
- Reduce the number of boxes used for packing blanks,
- Reducing the frequency of inter area travel on trucks to provide transportation blanks and
reduce the number of operations in the packing and unpacking rounds,
- Reduce the need for pallets, which are punishable by blanks,
- Occurred saving space in which the range of semi-finished products were located
- Resulted in saving use stickers on storage boxes,
- Save time packing, unpacking and transportation between sites, or workplace and store of
semi - products.
Fig. 3 Optimized model of the production process
Original model and optimizing look graphically the same ,but change occurred only on the
mentioned item, because as regards the already existing production machinery and moving is
not possible. Optimization is reflected in the statistics, the production and spared of production
costs.
Plant Simulation software we us also created the layout of production has created a 3D
simulation (Fig. 4)

InvEnt 2013
103
Fig. 4 3D simulation of the production line
3. CONCLUSION
Module Tecnomatix Plant Simulation offers a wide range of options applicable in the field
of dynamic simulation models and layouts of gross production processes, so it is an appropriate
tool usable in any manufacturing enterprise, whether the planning of new production lines, or
to optimize existing products. Outputs are from the simulation of manufacturing processes,
statistical data of different character, from the statistics of production processes to statistics on
to individual items used in the models. Analysis, which can help to assess the design of optimal
solutions when designing any kind of production.
References
[1] TREBUŇA P. – PEKARČÍKOVÁ M.: Zásobovacia a distribučná logistika, Košice 2011, ISBN 978-
80-553-0797-8, str. 201 [2] SAAKSVUORI, A.-IMMONEN,A.: Product Lifecycle Management, ISBN 987-3-540-78172-1 [3] STARK, J.: Product Lifecycle Management, 21 st Century Paradigm for Product Realisation, ISBN
978-0-85729-546-0 [4] MIČIETA, B., TUREKOVÁ, H.: Model procesu inovovania v učiacej sa organizácii, In: Koncepcje,
modele, metody i techniki zarządzania = Concepts, models, methods and techniques of management : monografia. - Bielsko-Biała: ATH, 2011. - ISBN 978-83-62292-85-1
[5] Rosová, A.: Podniková logistika / Andrea Rosová - 1. vyd. - Košice : TU - 2012. - 100 s.. - ISBN 978-80-553-0881-4.
[6] BUDA,J., FIĽO,M.: Manažment operácií, Prešov: Vydavateľstvo Michala Vaška, 2008. 152s., ISBN 978-80-7165-710-1.
[7] MARKOVIČ, J., JAMRICHOVÁ, S.: Prosperujúci podnik v globálnom prostredí, Invent, Žilina 2008.

InvEnt 2013
104
Knowledge, manufacturing, paradigms, management
Peter LONC*, Michal HALUŠKA**
KNOWLEDGE BASED MANUFACTURING
Abstract
Manufacturers have long recognized, that, much like their service industry peers, they find themselves competing in a knowledge economy. The article deals with the definition of knowledge based manufacturing and with its most important subtopics. Later, the most knowledge intense manufacturing paradigms are described, as they are the leading modern trends in the concept of future manufacturing.
1. INTRODUCTION
Knowledge economy is built on the possession and configuration of intellectual resources
and knowledge production, distribution and reuse. Market competition is becoming more
intense, more and more enterprises cannot depend on single factor to obtain competitive
advantage. In fact, manufacturing industry has become the main engine of Europe’s economy.
At present, knowledge economy and knowledge management has become a common
concern in economists and management scientists. But as a main part of social economic,
manufacturing industry pays little attention to intellectual capital, and it is necessary that
knowledge capital management should be regarded by manufacturing enterprise in order to
benefit from the potential opportunities and challenges. Under knowledge economy
environment, modern manufacturing enterprises are changing from production-based enterprise
to knowledge-based enterprise.
A typical characteristic of the manufacturing process is dynamic, where conditions are
constantly changing and decisions have to be made within a short space in time. It is often
preferable to make a decision at the right moment rather than to seek the optimum decision
without any time limit. The better we have the available relevant data at the right time, the
better decision we can reach. A computer is a tool that can be employed to narrow the gap
between the conflictions demands of "time" and "decision".
2. MANUFACTURING KNOWLEDGE
European manufacturers have long recognized, that, much like their service industry peers,
they find themselves competing in a knowledge economy. Companies both large and small
possess vast amounts of knowledge spread across countless structured and unstructured
* Ing. Peter LONC, KPI, ŽU,SJF; e-mail: [email protected] ** Ing. Michal HALUŠKA, KPI, ŽU,SJF; e-mail: [email protected]
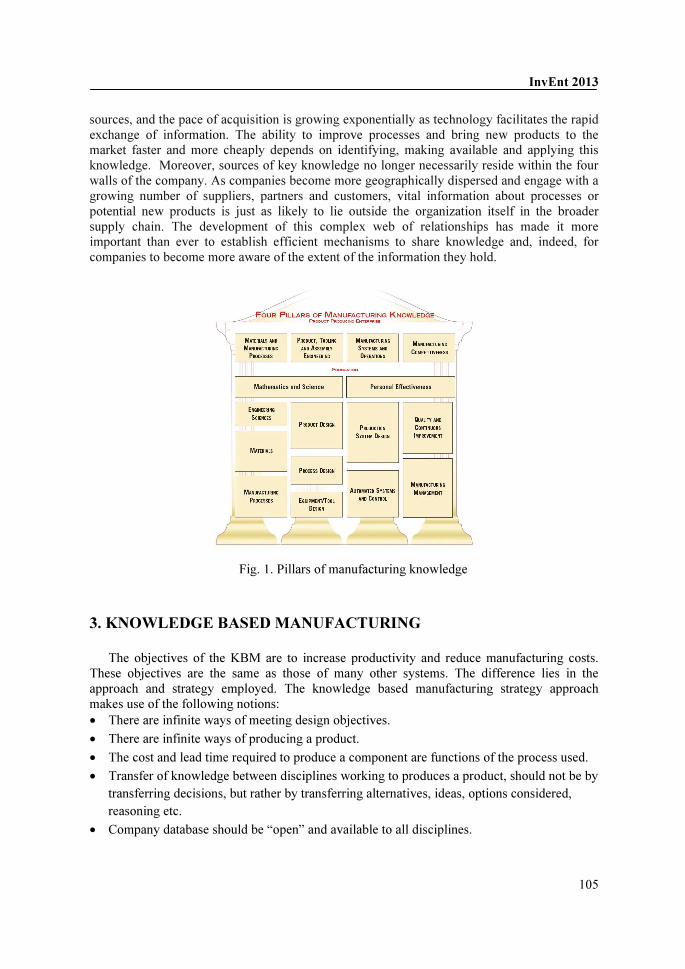
InvEnt 2013
105
sources, and the pace of acquisition is growing exponentially as technology facilitates the rapid
exchange of information. The ability to improve processes and bring new products to the
market faster and more cheaply depends on identifying, making available and applying this
knowledge. Moreover, sources of key knowledge no longer necessarily reside within the four
walls of the company. As companies become more geographically dispersed and engage with a
growing number of suppliers, partners and customers, vital information about processes or
potential new products is just as likely to lie outside the organization itself in the broader
supply chain. The development of this complex web of relationships has made it more
important than ever to establish efficient mechanisms to share knowledge and, indeed, for
companies to become more aware of the extent of the information they hold.
Fig. 1. Pillars of manufacturing knowledge
3. KNOWLEDGE BASED MANUFACTURING
The objectives of the KBM are to increase productivity and reduce manufacturing costs.
These objectives are the same as those of many other systems. The difference lies in the
approach and strategy employed. The knowledge based manufacturing strategy approach
makes use of the following notions:
• There are infinite ways of meeting design objectives.
• There are infinite ways of producing a product.
• The cost and lead time required to produce a component are functions of the process used.
• Transfer of knowledge between disciplines working to produces a product, should not be by
transferring decisions, but rather by transferring alternatives, ideas, options considered,
reasoning etc.
• Company database should be “open” and available to all disciplines.
InvEnt 2013
106
Knowledge based manufacturing enterprise is dense-knowledge enterprise with realizing
that knowledge acquisition and sharing is the key concept to become successful in today’s
knowledge intense economy.
Knowledge acquisition is a process that transforms recessive knowledge into dominant
knowledge. There are many knowledge acquisition approaches because of different existence
format of recessive knowledge, which includes expert knowledge in human brain and relation
knowledge in database. Knowledge representation makes people grasp and use knowledge
quickly, and enables the computer to be able to process knowledge effectively. Knowledge
transferring process can happen in enterprise organization interior, between human and
computer, among different business process and product, which includes knowledge
conversion, sharing and management etc. The chief goals of knowledge usage are to utilize
core knowledge based on accumulated enterprise knowledge base, and improve the ability of
knowledge absorption and integration, which makes knowledge become enterprise innovation
engine.
4. KNOWLEDGE INTENSE MANUFACTURING PARADIGMS
• Bionic Manufacturing System (BMS): The BMS investigates biological systems and
proposes concepts for future manufacturing systems. A biological system includes
autonomous and spontaneous behavior and social harmony within hierarchically ordered
relationships. Cells as an example are basic units, which comprises all other parts of a
biological system and can have different capabilities from each other, and are capable of
multiple operations. In such structures, each layer in the hierarchy supports and is supported
by the adjacent layers. The components, including the part, communicate and inform each
other of the decisions.
• Fractal Factory (FF): The concept of a fractal factory proposes a manufacturing company
composed of small components or fractal entities. These entities can be described by
specific internal features of the fractals. The first feature is self-organization that implies
freedom for the fractals in organizing and executing tasks. The fractal components can
choose their own methods of problem solving including self-optimization that takes care of
process improvements. The second feature is dynamics where the fractals can adapt to
influences from the environment without a formal organization structure. The third feature
is self-similarity understood as similarity of goals among the fractals to conform the
objectives in each unit.
• Holonic Manufacturing System (HMS): The core of HMS is derived from the principles
behind the term ’holon’. The term holon means something that is at the same time a whole
and a part of some greater whole. The model of integrated manufacturing systems consists
of manufacturing system entities and related domains, the structure of individual
manufacturing entities, and the structuring levels of the entities. A manufacturing system is,
at the same time, part of a bigger system and a system consisting of subsystems. Each of
the entities possesses self-description and capability for self-organization and
communication.
InvEnt 2013
107
5. CONCLUSION
To fight competition effectively, the manufacturing sector has to transform by moving from
resource based driven manufacturing to knowledge based driven manufacturing and from mass
produced single use products to new concepts of higher added value, custom-made, eco -
efficient and sustainable products, processes and services.
By incorporating intelligence into a manufacturing system, knowledge-based software offers
the opportunity to streamline, improve and tailor business processes. These operational benefits
can help companies respond better to customers. Knowledge-based manufacturing simplifies
processes for the end-user – and simpler processes mean faster responses, more flexibility,
shorter lead-times and a more cost-effective operation.
This paper was made about research work support KEGA no. 070ŽU-4/2012
References
[1] HALEVI, G. – WANG, K. 2007. Knowledge based manufacturing system (KBMS). In:
Journal of Intelligent Manufacturing, Volume 18, Issue 4 , pp 467-474, ISSN 0956-5515
[2] JINSONG, Z. 2011. Knowledge-based Manufacturing Enterprise and Enterprise Knowledge Management, College of Management, South-Central University For
Nationalities, Hubei Wuhan, 430073, Available on internet:
http://www.seiofbluemountain.com/upload/product/201001/1263784418k66sivm7.pdf
[3] Knowledge Management In Manufacturing, 2007, In: The Economist – Economist Intelligence Unit, 2007, Available on internet: http://media.plm.automation.siemens.com/plm-
perspective/docs/knowledge_mgmt.pdf
[4] POWELL,W. – SNELLAM, K. 2004. The Knowledge Economy. In: Annual Review of
Sociology. Vol. 30: 199-220 (Volume publication date August 2004). Available on internet:
http://www.annualreviews.org/doi/abs/10.1146/annurev.soc.29.010202.100037?journalCode=s
oc
[5] FOXLOW, T. 1994. Knowledge-based Manufacturing: The Key to Recovery. In: Logistics
Information Management, Volume 7, Number 4, pp. 23-26. ISSN 0957-6053
[6] LANZ, M. – JARVENPAA, E. – GARCIA, F. 2012. Towards Adaptive Manufacturing
Systems - Knowledge and Knowledge Management Systems. Tampere University of
Technology, Finland. Available on internet: http://www.intechopen.com/books/manufacturing-
system/towards-adaptive-manufacturing-systems-knowledge-and-knowledge-management-
systems
InvEnt 2013
108
Innovation, Development, Enterprise
Aneta MADYDA*, Irena DUDZIK-LEWICKA**
INNOVATIVENESS IN THE DEVELOPMENT OF SMALL
AND MEDIUM ENTERPRISES IN POLAND
Abstract
There are various factors which influence an enterprise’s innovative activity. In order to arouse and maintain sensitivity to innovations, one should combine science and research with practice, focus on a favourable organizational, financial and technical condition of a company, as well as create a suitable climate of innovativeness in the company, where innovations, improvements, imagination and creativity, flexibility and courage are highly valued and appreciated. Favourable changes can improve the level of competitiveness of those companies on the market.
1. FACTORS GOVERNING INNOVATIVE PROCESSES IN AN
ENTERPRISE
Factors of innovative processes govern the direction, strength and effectiveness of tools enhancing innovative activity of enterprises.
In literature, an innovative process has several synonyms. According to P. McGowan, an innovative process is a creative activity in which most emphasis is put on the implementation of a creative idea. An innovative process comes to an end at the moment when a decision is made about putting an idea into action. The idea to be implemented is selected from many others. P. McGowan differentiates among twelve stages of an innovative process: starting from the identification of a problem or an opportunity up to the implementation, evaluation and, if needed, to the improvement of the best of ideas [5].
R. Griffin proposes a different interpretation of an innovative process. According to him, an organizational innovative process is equivalent to the preparation, application, launching, developing of a creative idea, as well as controlling its way of development and fall [3]. Contemporary innovations, widely acknowledged as a driving force of economic development, should play a key role in the functioning of every enterprise. Therefore, they should find their place in companies’ business strategies. An enterprise should look for inspirations of innovations both in its inner as well as outer environment, and implement such innovative strategies that consider both material and nonmaterial innovations as the foundation of business success .
* Ph.D. Eng., Faculty of Management and Computer Science, University of Bielsko-Biala, 43-309 Bielsko-Biała, ul. Willowa 2, Poland, [email protected] ** Ph.D. Eng., Faculty of Management and Computer Science, University of Bielsko-Biala, 43-309 Bielsko-Biała, ul. Willowa 2, Poland, [email protected]

InvEnt 2013
109
2. SELECTED DETERMINANTS OF THE INNOVATIVENESS OF AN
ENTERPRISE
The intensity of innovative processes is an outcome of various factors (determinants,
stimuli). A determinant is any factor whose function is to designate something. On the other hand, a factor is one of the causes of a given phenomenon, one of the aspects determining something. In literature devoted to innovations, the concepts of determinants and factors are frequently used interchangeably.
In an enterprise, there are many such determining factors of innovations. Those determinants can have a sociological, psychological, philosophical, historical, organizational or economic character. Their changeability is governed by time, they are dynamic and dependent on a variety of factors [9].
Such determinants have an impact on an enterprise as a whole, as well as on individual units employed in it.
The most important stimulus of innovative processes of an enterprise is the market, which constitutes the most rigorous touchstone of new products of services. Apart from the market, determinants coming from a company’s environment also have considerable influence on a company’s innovative activity. The environment can be divided into two spheres: macro-environment (general, distant) and micro-environment (operative, closer). The innovative determinants found in the micro-environment include [8]: - receivers, suppliers, co-operators and other partners, competitors, i.e. units that are into
technological-industrial activity, implementations and commercialization of new solutions which play a stimulant role in the innovative process,
- scientific and technical institutions working to improve scientific and technical knowledge in a form of inventions, new ideas, discoveries; such institutions include higher universities, research centers and scientific institutes, etc.,
- organizations and institutions supporting and mediating in the field of innovation; among them we can mention technological and scientific centers, entrepreneurial mines, counseling and training centers,
- regional and local environment, which includes accessible infrastructure and local economic atmosphere.
The innovative determinants found in the macro-environment include [8]: - organizational, institutional and informative solutions that form an innovative system of a
given country, i.e. the arrangement of production and scientific-technological sub-systems, and their interrelation,
- a country’s innovative policy, - institutional-marketing conditions together with the infrastructure, technical services,
judicial and fiscal systems , - educational system including a complex of public and private institutions, as well as
educational programs and those aimed at improving job qualifications, which enable employees to acquire skills and show innovative attitudes.
Even though many innovative factors can influence the effectiveness of the implementation of innovative ideas, the most crucial role is played by the factors coming from the environment of an organization.

InvEnt 2013
110
3. INNOVATIVENESS OF SMALL AND MEDIUM ENTERPRISES
The stage of development of a given business sector is one of the most crucial factors (in the close environment) having an impact on the organization’s inclination towards undertaking innovative activity. It turns out that organizations functioning in sectors at early stages of development often implement technological and product-oriented innovations, as well as they actively benefit from various sources of innovations. On the other hand, in sectors characterized by a higher level of development, innovations tend to concern modifications in the production process.
Small companies are often successful in identifying an opportunity, but less effective when it comes to gaining an advantage necessary to obtain a desired value. An invention may be an outcome of activity of a single individual but its commercialization calls for resources and efforts of the whole organization, which have to be managed [7].
The major problem concerning financing undertakings in Poland, but also in the European Union in general, is the fact that a part of capital investments is refunded and the activities aimed at creating a new innovative product are not directly financed. Modern and recently founded enterprises have a limited chance in Poland to acquire capital by traditional means such as the following [4]: - investment credits, long-term loans, - emission of bonds by companies and partnerships, and other long-term debentures, - franchising, - leasing, - short-term bank loans, - emission of short-term debentures, - commercial loans and other obligations.
Poor involvement and limited access to private capital undoubtedly have an impact on the
way innovative projects are financed. Such limitations result in the fact that new innovative enterprises have a limited influence on the absorption of new technologies or progress in the field of productivity.
The factors of competitiveness of the Polish sector of small and medium enterprises have remained unchanged for years. Starting from 2003, entrepreneurs have been competing using the argument of price, whereas other factors such as the quality of products or services, narrow specification, the ability to adapt to customers’ demands, or the innovative character of products have played a minor role. Therefore, they do not build a stable advantage over competitors, immune to limitations. Among the causes of such a status quo, the entrepreneurs quoted a small demand for innovative products as well as a limited access to external sources of funds.
Small and medium enterprises take advantage of both private as well as external sources of financing their business activity [1][2]. Nevertheless, it is private resources that dominate in the capital structure. The dominant preferable private source is definitely net profit. It means that small and medium enterprises make profits which they can use to finance their own development. This concerns mostly micro-companies whose development depends on earned financial surplus.
Micro- and small business units should show more enthusiasm and interest in the sources of funds for innovative developmental actions, and choose those which are cheapest to gain. They can apply for resources from structural funds, where the most valued action is a support for

InvEnt 2013
111
product-oriented and technological competitiveness, the improvement of competitiveness through innovations and the enhancement of human resources.
The instable nature of anticipated economic fluctuations contributes to the fact that many enterprises still postpone the initiation of new undertakings in spite of the lack of more serious obstacles, because they still value negatively the investment atmosphere [6].
SUMMARY
The dominant characteristic of the development of an enterprise is innovative activity, i.e.
creative problem solving. Companies should react flexibly to any signals coming from their environment in order to secure their dominant position on the market in the long run. Innovative activity is a time-consuming process, in which a lot of time has to pass before outlays bring anticipated results.
A considerably low level of innovativeness of Polish economy is, to a great extent, caused by the lack of financial resources for the development of new enterprises. According to GUS, as much as 50% of small and medium enterprises exist no longer than one year. On the market marked by firm competition and turbulent environment, the only companies which stand a chance to survive are those which are able to flexibly adapt to more and more demanding surroundings.
References
[1] DUDA J.: Czynniki rozwoju polskiego i małopolskiego sektora MSP w zmieniającym się
otoczeniu, in: Współczesne wyzwania i uwarunkowania rozwoju przemysłu i usług, ed. J.Pyka, Towarzystwo Naukowe Organizacji i Kierowania Oddział w Katowicach, Katowice 2010.
[2] DUDZIK-LEWICKA I., MADYDA A.: Kryzys a preferencje małych i średnich przedsiębiorstw w zakresie źródeł finansowania działalności gospodarczej regionu bielsko-bialskiego, in: Gospodarka oparta na wiedzy i innowacyjność przedsiębiorstw-wybrane zagadnienia, ed. K.Mieszkowski, K.Piech, Instytut Wiedzy i Innowacji, Warszawa 2011, p.217-237.
[3] GRIFFIN R.W.: Podstawy zarządzania organizacjami, PWN, Warszawa 2007. [4] JANASZ K.: Źródła i modele finansowania procesów innowacyjnych w przedsiębiorstwie,
„Przegląd organizacji” 2008, nr 10, p. 38-39. [5] MOCZAŁA A.: Zarządzanie innowacjami, ATH w Bielsku-Białej, Bielsko-Biała 2005,
p.27. [6] OKRĘGLICKA M.: Działalność inwestycyjna mikroprzedsiębiorstw w Polsce-wybrane
aspekty, in: Gospodarka oparta na wiedzy i innowacyjność przedsiębiorstw-wybrane zagadnienia, ed. K.Mieszkowski, K.Piech, Instytut Wiedzy i Innowacji, Warszawa 2011, p.275.
[7] POLOWCZYK J.: Przedsiębiorczość strategiczna, „Przegląd organizacji” 2009, nr 6, p.8-9.
[8] STAWASZ E.: Innowacje a mała firma, Wydawnictwo Uniwersytetu Łódzkiego, Łódź 1999, p.36-41.
[9] SZWIEC P.: Determinanty procesu innowacyjnego, „Przegląd organizacji” 2009, nr 9, p.10-11.
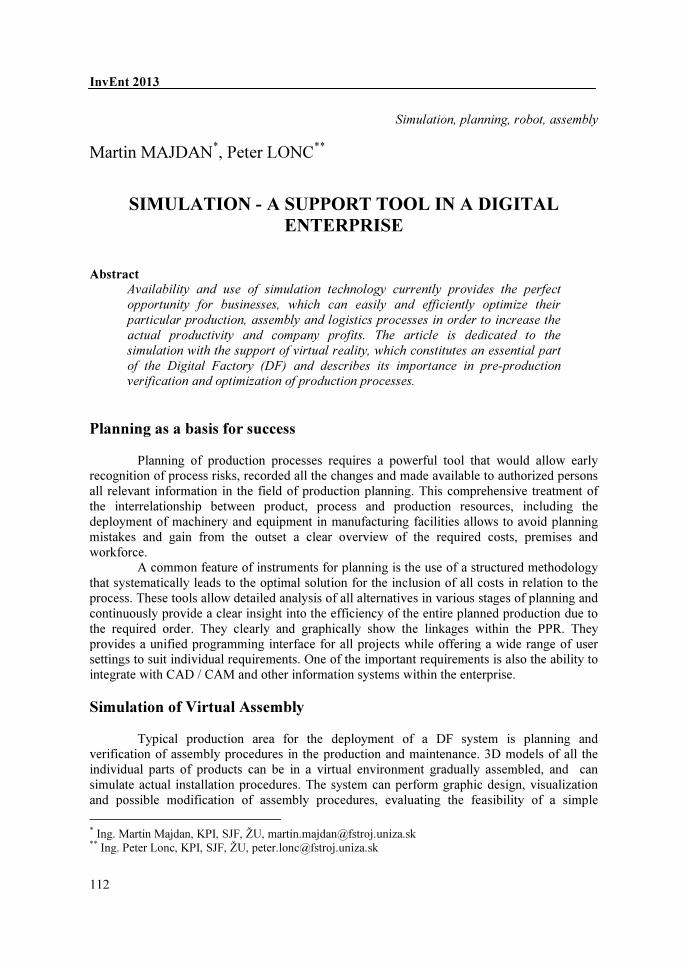
InvEnt 2013
112
Simulation, planning, robot, assembly
Martin MAJDAN*, Peter LONC
**
SIMULATION - A SUPPORT TOOL IN A DIGITAL
ENTERPRISE
Abstract
Availability and use of simulation technology currently provides the perfect opportunity for businesses, which can easily and efficiently optimize their particular production, assembly and logistics processes in order to increase the actual productivity and company profits. The article is dedicated to the simulation with the support of virtual reality, which constitutes an essential part of the Digital Factory (DF) and describes its importance in pre-production verification and optimization of production processes.
Planning as a basis for success
Planning of production processes requires a powerful tool that would allow early recognition of process risks, recorded all the changes and made available to authorized persons all relevant information in the field of production planning. This comprehensive treatment of the interrelationship between product, process and production resources, including the deployment of machinery and equipment in manufacturing facilities allows to avoid planning mistakes and gain from the outset a clear overview of the required costs, premises and workforce.
A common feature of instruments for planning is the use of a structured methodology that systematically leads to the optimal solution for the inclusion of all costs in relation to the process. These tools allow detailed analysis of all alternatives in various stages of planning and continuously provide a clear insight into the efficiency of the entire planned production due to the required order. They clearly and graphically show the linkages within the PPR. They provides a unified programming interface for all projects while offering a wide range of user settings to suit individual requirements. One of the important requirements is also the ability to integrate with CAD / CAM and other information systems within the enterprise. Simulation of Virtual Assembly
Typical production area for the deployment of a DF system is planning and verification of assembly procedures in the production and maintenance. 3D models of all the individual parts of products can be in a virtual environment gradually assembled, and can simulate actual installation procedures. The system can perform graphic design, visualization and possible modification of assembly procedures, evaluating the feasibility of a simple
* Ing. Martin Majdan, KPI, SJF, ŽU, [email protected] ** Ing. Peter Lonc, KPI, SJF, ŽU, [email protected]
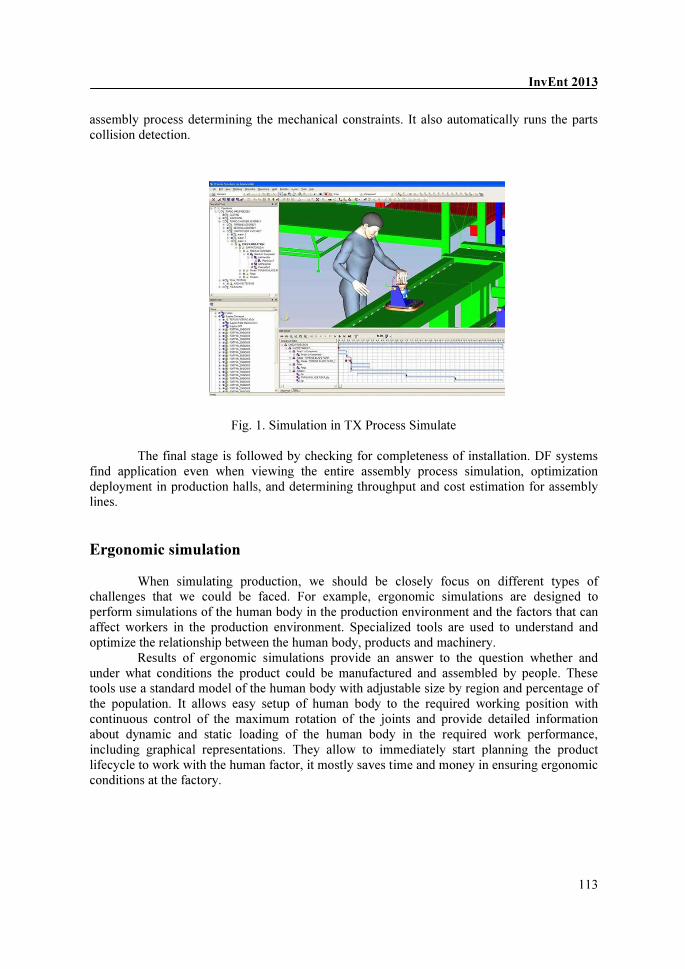
InvEnt 2013
113
assembly process determining the mechanical constraints. It also automatically runs the parts collision detection.
Fig. 1. Simulation in TX Process Simulate
The final stage is followed by checking for completeness of installation. DF systems find application even when viewing the entire assembly process simulation, optimization deployment in production halls, and determining throughput and cost estimation for assembly lines. Ergonomic simulation When simulating production, we should be closely focus on different types of challenges that we could be faced. For example, ergonomic simulations are designed to perform simulations of the human body in the production environment and the factors that can affect workers in the production environment. Specialized tools are used to understand and optimize the relationship between the human body, products and machinery. Results of ergonomic simulations provide an answer to the question whether and under what conditions the product could be manufactured and assembled by people. These tools use a standard model of the human body with adjustable size by region and percentage of the population. It allows easy setup of human body to the required working position with continuous control of the maximum rotation of the joints and provide detailed information about dynamic and static loading of the human body in the required work performance, including graphical representations. They allow to immediately start planning the product lifecycle to work with the human factor, it mostly saves time and money in ensuring ergonomic conditions at the factory.
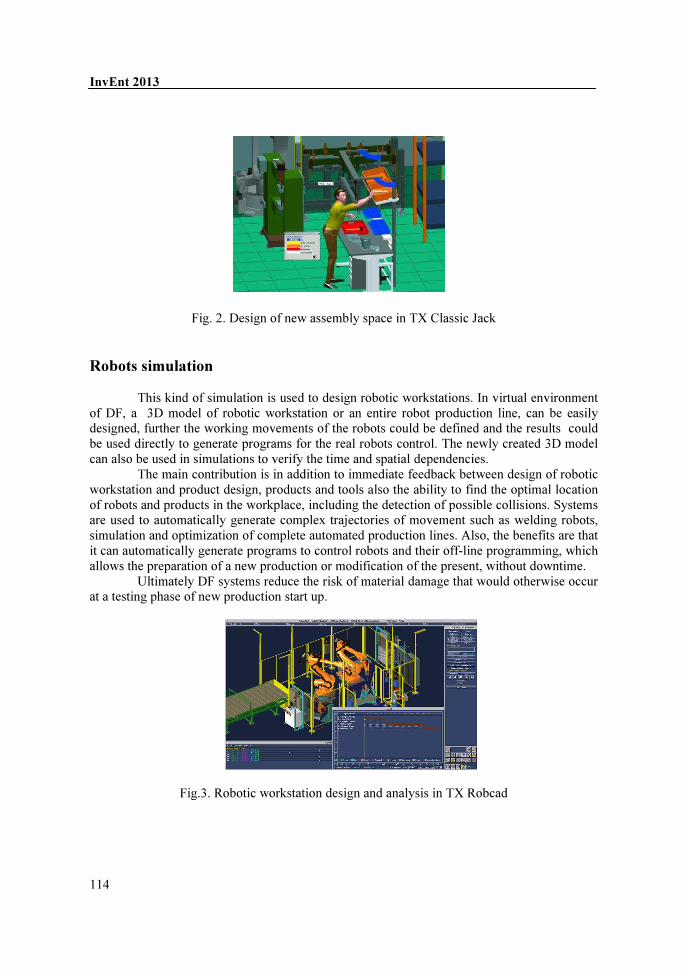
InvEnt 2013
114
Fig. 2. Design of new assembly space in TX Classic Jack Robots simulation
This kind of simulation is used to design robotic workstations. In virtual environment of DF, a 3D model of robotic workstation or an entire robot production line, can be easily designed, further the working movements of the robots could be defined and the results could be used directly to generate programs for the real robots control. The newly created 3D model can also be used in simulations to verify the time and spatial dependencies.
The main contribution is in addition to immediate feedback between design of robotic workstation and product design, products and tools also the ability to find the optimal location of robots and products in the workplace, including the detection of possible collisions. Systems are used to automatically generate complex trajectories of movement such as welding robots, simulation and optimization of complete automated production lines. Also, the benefits are that it can automatically generate programs to control robots and their off-line programming, which allows the preparation of a new production or modification of the present, without downtime.
Ultimately DF systems reduce the risk of material damage that would otherwise occur at a testing phase of new production start up.
Fig.3. Robotic workstation design and analysis in TX Robcad

InvEnt 2013
115
Simulation of Material Flow Material flow simulation is designed to analyze the behavior of complex systems that are solved by other methods or are time consuming. Simulation is the only way to describe the behavior of a very complex process with random events and considering all relevant external and internal links. These systems include tools for design of simulation model, which can include 3D view of goods, machines, equipment and operators. It also includes tools for analytical check of system performance and for the throughput of production lines for the given period. Finding the optimal parameter settings with regard to the required output is automatic. For clear display of the production system, these systems are well equipped with a dynamic display of simulation model. Additional user information could be provided by statistics for each individual machine or for whole simulated system as a complex.
Fig. 4. Simulation of material flow in TX Plant Simulation
This paper was made about research work support KEGA no. 070ŽU-4/2012 References [1] BURIETA, J., KAKAČKA, S.,: Simulácia výrobných a logistických procesov [online]. Dostupné na internete: http://www.ipaslovakia.sk/UserFiles/File/ZL/Uspech/2010-4%20Uspech%20Simulacia%20vyrobnych%20a%20logistickych%20procesov.pdf
[2] HRABČÁK, R.: Tvorba a overovanie simulačných modelov vybraných druhov výrobných procesov. Diplomová práca. Košice: Technická univerzita, Strojnícka fakulta, 2011, [online]
[3] KRAUCSZOVÁ, A., : Importance of simulation in production managing and optimizing. The14th International Scientific Conference Trends and Innovative Approaches in Business Processes “2011” [online]. Dostupné na internete: http://www.sjf.tuke.sk/kpiam/ TaIPvPP/ 2011/ index.files/clanky/Andrea%20Krausova%20Vyznam.pdf
[4] PALAJOVÁ, S., FIGA, Š., GREGOR, M.,: Simulation on manufacturing and logistics systems for the 21th century. In: Applied computer science : management of production processes. - ISSN 1895-3735. - Vol. 7, no. 2 (2011), s. 57-70.

InvEnt 2013
116
Ergonomic, Workstation evaluation, Safety, Occupational health
Józef MATUSZEK∗, Kinga BYRSKA**, Jozef HNÁT∗**
ERGONOMIC EVALUATION FORM Abstract
The paper presents example of applicable ergonomic evaluation form. Shown
are the principles and the most important criteria. Contained example are
actually used by selected international company.
1. INTRODUCTION
Ergonomic evaluation of workstation is increasingly becoming a part of the companies routinely performed safety audit. In a regular time intervals are analyze selected machines, step by step all workplaces. Due to continuous improvement and results from many audits manages to gather information about the actual state and knowledge about ergonomic in the analyzed company.[5]
The first phase of form implementation should include questions about ergonomics which increase employee awareness about its importance and the possibility of significant impact on health long-term work on the one workplace [5]. Operation space requirements are mandatory and based on directives, laws, regulations, other legal acts and sometimes on norms.[3]
In recent years began to function term “ergonomic diagnostics”. The object of research is antropo-technical and socio-technical system. The purpose of diagnosis, as in the case of technical diagnostics, is identification of the current state of ergonomic (dangerous, harmful, disruptive, normal) and an indication of the factors which may contribute to the occurrence of a state different than the normal.[2]
2. FORM CONCEPT
2.1. Evaluation criteria
Sheet verify the level of compliance with criteria. The criteria are:[6]
∗ prof. dr hab. inż. Józef Matuszek, dr h.c., University of Bielsko-Biała, Faculty of Mechanical
Engineering and Computer Sciences, Department of Industrial Engineering, Willowa 2, 43-309 Bielsko-Biała, Poland, e-mail: [email protected]
** mgr inż. Kinga Byrska, University of Bielsko-Biała, Faculty of Mechanical Engineering and Computer Sciences, Department of Industrial Engineering, Willowa 2, 43-309 Bielsko-Biała, Poland, e-mail: [email protected]
∗∗∗ Ing. Jozef Hnát, PhD., Department of Industrial Engineering, Faculty of Mechanical Engineering, University of Žilina, Univerzitná 1, 010 26 Žilina, Slovak Republic, tel. 00421-0415132733, e-mail: [email protected],

InvEnt 2013
117
� cognitive, helpful, enabling the identification of needs, � orderly recognition of all the requirements and limitations of the conditioned capabilities of a
particular company situation, � logical basis for corporate actions � heuristic factor magnifying the possibility of systemic and structural improvement, � basis for evaluating the results of creative activities, which is a necessary condition for the
optimization of the system and the structure and effectiveness. They should be comprehensible to anyone who has to make assessments on the basis of
them, and be possible to establish a clear justification. For each criterion can be determine the seriousness. Evaluation as much as it is possible should be lead by a multidisciplinary team to ensure the objectivity.[2]
2.2 Fuzzy logic in evaluation
Each question can be evaluated by assigning point values corresponding to the following situations:[2] � 5 - very well, meeting all requirements, the optimal employee load, � 4 - well, met most of the requirements, recommended apply a rationalization solution � 3 - medium, some requirements met, improvements in many areas of work
recommended, � 2 - acceptably, met some requirements, required changes, � 1 - found a high number of irregularities, change is necessary.
It's not possible clearly identify where there is a boundary between the results very well (5) as well (4). High impact on the result of the analysis is a subjective assessment of the investigator or assessment team.
Fig.1. Fuzzy logic under ergonomic criteria
2.3 Evaluation results
The result indicates the percentage of fulfillment of all requirements. In case of an assessment of all questions is "weakly", result not exceed 25% throughout the test component.
Meeting the requirements of ergonomics in the four criteria is visualized automatically in form. The audit also define areas of the worker body, which as a result of their work are most vulnerable to the annoyance of work and feeling pain. Next should be determine the task for perfecting, set a time for make them and repeat audit of the same workstation.
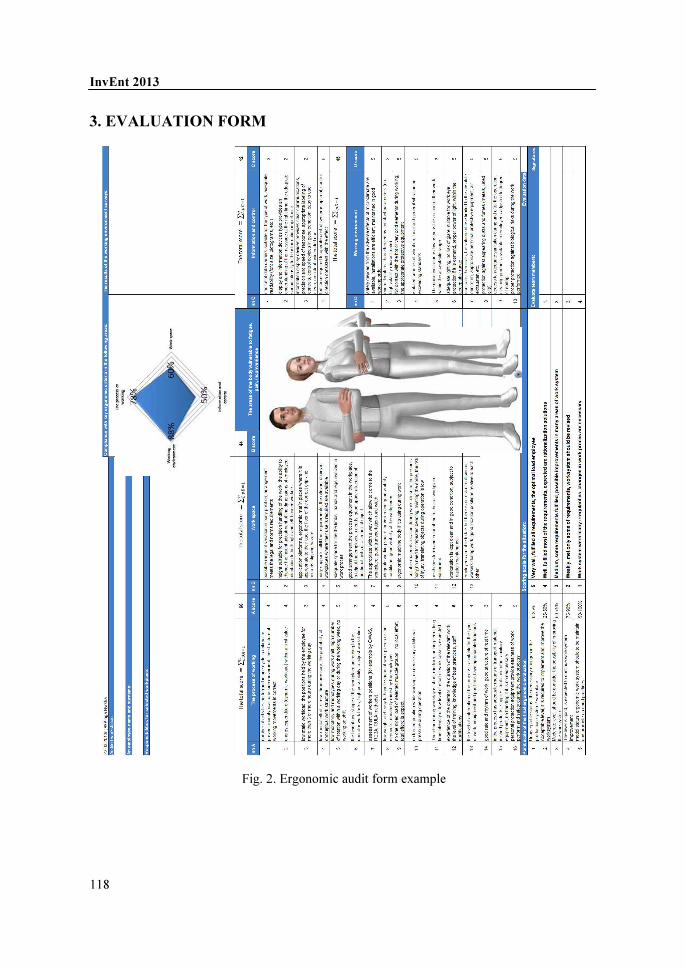
InvEnt 2013
118
3. EVALUATION FORM
Fig. 2. Ergonomic audit form example

InvEnt 2013
119
4. CONCLUSION
Ergonomic criteria in ergonomic assessing fulfill three important roles which are complementary:[1] � are a source of ergonomic information, � mechanisms and analogies which indicate the correct solutions in terms of ergonomics, � mechanisms which may indicate the possibility of applying the best ergonomic solutions,
proven in practice, Presented ergonomic evaluation form allows to conduct analyzes in a transparent and easy way. At the same time it allows to carry out analyzes of design positions and positions remain in the conceptual stage.[1] Ergonomic assessment is part of a large working system. Particular emphasis is placed on this issue in corporations with developed and certified management systems, such as the quality standards, environmental management systems, occupational health and safety or the integrated systems and other management systems.[4] International corporations perform regular audits, in which the issue of ergonomics is taken seriously. This is a good trend, as it will allow of performing work in a healthy and safe for the employee.[4]
This paper is the part of research supported by: APVV SK-PL-0030-12. References
[1] KORADECKA D., Bezpieczeństwo pracy i ergonomia, Centralny Instytut Ochrony Pracy - Państwowy Instytut Badawczy, Warszawa 1999.
[2] BYRSKA K., Ergonomiczne projektowanie stanowisk pracy, w: Inżynieria procesów produkcyjnych: monografia pod red. Józefa Matuszka. - Opole: Oficyna Wydawnicza Polskiego Towarzystwa Zarządzania Produkcją, 2013.
[3] BYRSKA K., Workers energy expenditure during the work on thermoforming machine in
selected automotive company, Journal of the University of Applied Sciences Mittweida, Scientific Reports 2012 nr 3. - ISSN 1437-7624.
[4] BANASZAK Z., KŁOS S., MLECZKO J., Zintegrowane systemy zarządzania, Polskie Wydawnictwo Ekonomiczne, 2011.
[5] MATUSZEK J., PLINTA D., KUBICA S., ŚCIESZKA D., Modelowanie i symulacja
procesów produkcyjnych z punktu widzenia ergonomii i bezpieczeństwa pracy, w: Ergonomia niepełnosprawnym w organizacji pracy i medycynie-projektowanie / red. Joanna Lecewicz-Bartoszewska, Aleksandra Polak-Sopińska. - Łódź : Wydawnictwo Politechniki Łódzkiej, 2008.
[6] CHARYTONOWICZ J., Zasady kształtowania laboratoryjnych stanowisk pracy, Prace Naukowe Instytutu Architektury i Urbanistyki Politechniki Wrocławskiej, 1994.

InvEnt 2013
120
energy efficiency, planning, manufacture
Branislav MIČIETA*, Vladimíra BIŇASOVÁ **
PLANNING ENERGY EFFICIENT MANUFACTURING
SYSTEMS
Abstract
The paper deals with energy manufacturing systems, which are essential to enhancement of efficiency, productivity and profitability in future industrial processes. Energy manufacturing systems as an operational strategy are oriented toward achieving the Energy efficient manufacturing by eliminating energy waste. The technique is designed to radically improve profitability, customer satisfaction, throughput time, and environmental responsibility.
1. UTILISATION OF ENERGY SIMULATION MODEL
Planning energy efficient Manufacturing systems require detailed knowledge on the energy
consumption behaviour of their components, energy consumption of production processes, and methods to evaluate design variants. Green sources of power generation and efficient management of energy demand are among
the greatest challenges facing manufacturing businesses. A significant proportion of energy used in manufacturing is currently generated through fossil fuels. Therefore in the foreseeable future, the rationalisation of energy consumption still provides the greatest opportunity for the reduction of greenhouse gases. There are many areas and opportunities to reduce energy costs and pollution emissions
within a manufacturing facility. One way to achieve an energy efficient manufacturing system is to measure and evaluate the combined impact of process energy from manufacturing operations, their resources, and facility energy from building services (ventilation, lighting, etc.) The issue of fostering energy efficient manufacturing gains more and more importance due
to global mega trends like global warming, climate change and scarcity of resources. Furthermore industrial drivers constituted by rising and volatile energy prices, ever-stricter becoming legislations and increased customer awareness rise the attention to the research field. Holistic approaches to design and operate modern green production systems are required to
cope with those challenges adequately. Utilisation of energy simulation model to support both design and operational decisions is
shown in figure 1. * Prof. Ing. Branislav Mičieta, PhD., The Faculty of Mechanical Engineering at the University of Zilina,
[email protected] ** Ing. Vladimíra Biňasová, The Faculty of Mechanical Engineering at the University of Zilina,

InvEnt 2013
121
Fig. 1. Utilisation of energy simulation model
This part of article will be examine the overall role of an energy management strategy,
focus on the benefits of looking at Energy Management and then examine the role that an effective program, either existing or new, can play in a collaborative manufacturing environment, and how these improvements can reduce energy requirements while maintaining, or improving productivity.
2. DEFINING THE ENERGY MANAGEMENT STRATEGY
Virtually all manufacturers have some degree of formal energy management strategy in place today, and the more successful programs periodically examine their effectiveness and evaluate potential improvements. Successful strategies are typically driven from top management, and considered a strategic aspect of an overall manufacturing strategy; however, few strategies actually address how they could be incorporated in a future looking manufacturing environment. An organization’s energy management strategy is typically structured into three steps: 1) Creating the Strategy, Policy and Targets that identify the goals and objectives of the strategic initiative. The steps to create the strategy usually start with accessing the current performance, then setting the goals and objectives and making the organizational commitment to the program. This step often starts by using internal or external resources to establish the “as is” baseline to measure progress against. This will include the analysis of current energy usage patterns and identify potential areas to save energy.

InvEnt 2013
122
2) Identifying the Targeted Initiatives, or the tactical implementation of the strategy. The second step, the tactical implementation of the strategy, will typically start with identifying the gaps between the current “as is” environment and focusing on the areas with the largest potential for both short and long term gains, creating an action plan that addresses these areas, and then implementing this plan. 3) Monitoring the Progress and Results, or the measurement of results and program. effectiveness. An effective strategy must include short term considerations, or gains that can be
immediately realized, but must be coupled with a longer term vision that incorporates strategies dealing with upcoming or potential financial and legislative changes. Some of the key components that should be evaluated in determining the value of the strategy include: • social concerns, • emissions management, • energy monitoring, visualization and reporting, • energy reductions, • network management, • process management • energy forecast, • energy balance. The strategy normally focuses on these key areas: • Energy purchase cost savings. • Energy efficiency improvements. • Energy reductions from process improvements. • Environmental sustainability. • Instantiation of the strategy into the corporate culture.
2.1 What is an Energy Management System?
The vast majority of the world’s energy consumption derives from fossil fuels oil, gas and
coal. Due to the resulting cost implications, security of supply issues and environment impacts, energy management has become crucial for the sustainable development of today’s businesses and our society as a whole. An Energy Management System is understood as referring to the set of inter-related or
inter-acting elements that work to establish the energy policy, the energy objectives and the processes and procedures for achieving these aims. To do this, the standard is based on a system of Plan > Do > Check > Act for continuous
improvement that includes the EMS (Energy Management System) in all company practices (figure 2). The certification process is simple through the following steps: Gap analysis - this helps identify areas that need more work before to carry out a formal assessment, to save time and money. Formal assessment - this happens in two stages. First it review organization’s preparedness for assessment by checking if the necessary ISO 50001 procedures and controls have been developed. It will share the details of findings, so that if it finds gaps, it can be close them. If all the requirements are in place, it will then assess the implementation of the procedures and controls within organization to make sure that they are working effectively as required for certification.

InvEnt 2013
123
Certification and beyond - when it has passed the formal assessment it will be receive an ISO 50001 certificate, which is valid for three years.
Fig. 2. Steps for continuous improvement
In today’s manufacturing environment there is a strong recognition of Energy Management as a significant source of both social responsibility and cost savings. Energy typically represents the single largest controllable cost in manufacturing, and is under constant scrutiny by all levels of management. This article was prepared by within the project KEGA 029ŽU-4/2011 Implementácia inovačných riešení systémov rozpoznávania obrazu v laboratóriu automatizovaných montážnych procesov. References
[1] SCHENK, M., WIRTH, S, MULLER, E.: Factory Planning Manual: Situation-Driven Production Facility Planning, Springer, London, 2010, p. 283-285.
[2] RAKYTA, M. 2002. Údržba ako zdroj produktivity. Žilina : Georg, 2002. p. 200. ISBN 80–68324–3–3.

InvEnt 2013
124
Energy efficiency, Energy management
Branislav MIČIETA*, Vladimíra BIŇASOVÁ **
ENERGY MANAGEMENT SYSTEMS
Abstract
The paper deals with standard ISO 50001, which represents the latest best
practice in energy management systems building upon existing national
standards and initiatives. The standard specifies the requirements for an Energy
Management Systems (EnMS). This enables your organisation to develop and
implement an energy policy, identify significant areas of energy consumption
and establish a ISO 50001 provides a structured framework to embed energy
management in organisation’s culture.
1. ENERGY MANAGEMENT SYSTEMS. REQUREMENTS WITH
GUIDANCE FOR USE ISO 50 001:2011
ISO 50001 represents the latest best practice in energy management systems building upon existing national standards and initiatives. The standard specifies the requirements for an Energy Management Systems (EnMS). This enables your organisation to develop and implement an energy policy, identify significant areas of energy consumption and establish a ISO 50001 provides a structured framework to embed energy management in organisation’s culture. Effective implementation can enable year- on-year reductions in energy use via a cycle of continual improvement.ISO 50001 implementation requirements: • determine organisation’s energy needs, • establish energy policy and objectives, • conduct an energy review, • determine necessary processes and responsibilities, • establish methods for energy monitoring and analysis, • determine energy performance indicators, • establish means to effective operational control. • Review and monitor for continual improvement in energy efficiency.
Worldwide application of this International Standard contributes to more efficient use of
available energy sources, enhanced competitiveness, and to reduce greenhouse gases emissions
* Prof. Ing. Branislav Mičieta, PhD., The Faculty of Mechanical Engineering at the University of Zilina,
[email protected] ** Ing. Vladimíra Biňasová, The Faculty of Mechanical Engineering at the University of Zilina,

InvEnt 2013
125
and other related environmental impacts. This International Standard is applicable irrespective of the types of energy used.
This International Standard can be used for certification, registration and self-declaration of an organization’s EnMS. It does not establish absolute requirements for energy performance beyond the commitments in the energy policy of the organization and its obligation to comply with applicable legal requirements and other requirements.
Thus, two organizations carrying out similar operations, but having different energy performance, can both conform to its requirements. The document is based on the common elements found in all of ISO’s management system standards, ensuring a high level of compatibility with ISO 9001 (quality management) and ISO 14001 (environmental management). The organization can choose to integrate ISO 50001 with other management systems such as quality, environment, occupational health and safety, and other. The basis of this approach is shown in figure 1.
Fig. 1. Energy management system model Energy policy
ISO 50001 requires you to produce a policy statement that communicates your policy on
energy management to stakeholders and to translate this policy into specific, measurable and timely objectives and targets. The objectives are achieved through the implementation of management program that defines what will be done, who will do what and by when. An energy review will enable you to identify how you currently use energy and determine which activities need to be monitored and managed.

InvEnt 2013
126
Energy planning
Energy Performance Indicators can be used to quantify improvements in energy efficiency, use and consumption at the organization, facility, system and process or equipment level. Energy Performance Indicators are a measure of energy intensity used to gauge effectiveness of energy management efforts. These indicators, previously defined during the preparation of the company's energy policy, express a quantitative value of the energy performance measurement. The value of energy consumption has to be related to a reference variable that allows it to be correctly interpreted. For example: kWh/m², kWh/m³, etc. Responsibility for determining the Energy Performance Indicators typically rests with the energy management representative and may involve other members of the energy team, as well as management. Resources to complete the Energy Performance Indicators determination process are allocated by top management.
The concept of energy performance includes energy use, energy efficiency and energy consumption. Thus the organization can choose between a wide range of energy performance activities. For example, the organization could reduce peak demand, utilize surplus or waste energy or improve the operations of its systems, processes or equipment. Figure 2 is an illustrative conceptual representation of energy performance.
Fig. 2. An illustrative conceptual representation of energy performance The following figure 3 shows how based on a series of inputs and outputs of energy planning, the key meeting points are structured.This diagram is not intended to represent the details of a specific organization. The information in the energy planning diagram is not exhaustive and there may be other details specific to the organization or particular circumstances.

InvEnt 2013
127
Fig. 3. Basic diagram of energy planning
Implementation and operation
To implement and operate an effective Energy management system (EnMS), you will need to: • Define the roles, responsibilities and authorities of staff with regard to energy use and
energy management. • Ensure that staff is appropriately trained and competent. • There is effective internal communication. • Management system documentation is controlled so that current versions are in use and
obsolete documents are removed. • Implement operational controls, to minimize the situations were deviations could occur.
Checking and corrective action
You will need a process for monitoring and measuring your EnMS including significant energy consumption and associated relevant variables as well as assessing actual versus expected energy consumption. Procedures are required for the handling and investigation of problems and the organization will also need to carry out audits of the energy management system. Management review Top management will need to meet periodically to ensure that the EnMS is still effective and to act upon identified weaknesses and opportunities for improvement.
Energy audit
An energy audit is defined as a systematic procedure to obtain knowledge of the existing energy consumption profile of the building, identifying the factors that have an effect on the energy consumption and identifying and scaling the cost effective saving opportunities.
This article was prepared by within the project VEGA 1/0701/12 Výskum v oblasti využitia
nízkonákladovej automatizácie a umelej inteligencie v procese tvorby
stereoskopického záznamu. References
[1] SCHENK, M., WIRTH, S, MULLER, E.: Factory Planning Manual: Situation-Driven Production Facility Planning, Springer, London, 2010, p. 283-285.
[2] RAKYTA, M. 2005. Koncepcia údržby TPM. Žilina: EDIS, 2005. p. 33. ISBN 80–8070–364–7.

InvEnt 2013
128
Productivity, Innovations, Improvement
Marek MINDA*, Rastislav GÁLL**
PRODUCTIVITY INCREASE THROUGH INNOVATION
Abstract
Increasing Productivity through Innovative Processes and Continuous Improvement
approach – the way how to achieve sustainable success.
Why not better equip yourself and your company with processes and tools that will
improve performance, eliminate inefficiencies in all your activities and processes.
Why not look to your weaknesses and opportunities with opened eyes and find
solutions which are easy and bring results.
1. INNOVATION BY NEW TECHNOLOGY SOLUTION
What do we know about the relationship between innovation and productivity among firms?
No matter what your business does, improving productivity can boost your bottom line and can
often be achieved without substantial capital investment. Doing more with less has become a fact
of life in today’s globally competitive market. This event will explore innovative productivity
solutions and help you better understand the principals and benefits of applying “productive”
business processes within your company.
Since labor productivity is the key driver of standards of living in the long run, it is important
to discern the underlying trends in productivity. This task is complicated by the fact that in the
short run, productivity depends on more than those underlying trends. It is powerfully influenced
by the state of the business cycle, as well as by other factors (including simple measurement
error) that leave no lasting mark on productivity.
Progress is a law of life and perhaps nowhere is this more manifest than in the business world.
Indeed, in our fast-paced competitive economies it is vital for sustained success and long term
survival. However, the constant demand for productivity improvement may be counter-
productive in so far as people seem to be increasingly less engaged in their work. Whatever the
reasons for this, improving productivity is unquestionably a greater challenge for you if your
workforce is disengaged. In fact, any lack of productivity improvement may well indicate that
your people are disengaged.
Nevertheless, for the purposes of this paper productivity improvement includes any demand
for performance improvement, and - along with sense and respond, customer experience,
retention and innovation - remains one of the 5 critical capabilities you need to build on for
sustained success. Consequently this is a paradox that you must overcome.
You might better understand the paradox by recognizing that productivity is perhaps a
narrower, more inward-focused form of innovation and that innovation is not something that be
* Nemak Slovakia, Ladomerská Vieska 394, 965 01, Žiar nad Hronom, Slovakia ** Nemak Slovakia, Ladomerská Vieska 394, 965 01, Žiar nad Hronom, Slovakia

InvEnt 2013
129
commanded. Since nobody likes to be told what to do this must apply equally to productivity.
Furthermore, because of this similarity, the same actions suggested for enhancing innovation
capability also apply to productivity.
Here however, 5 additional factors have been identified as helping to enhance this capability.
Explained in more detail below, they are:
_ Constructively challenge your subordinates;
_ Challenge all targets;
_ Encourage initiative;
_ Consistently measure performance improvement;
_ Encourage personal development.
Of course this has to be done in the right way if you are to engage your employees rather than
making them more frustrated and disengaged.
We would like to share with you our experience regarding PRODUCTIVITY THROUGH
INNOVATION.
Our company developed and realized robust system for Optical flow test which was done
formal by air system which was very long and expensive approach. The abstract of our innovative
solution you can see at picture no.1. This was first step of Productivity improvement (speed up
process and decrease manufacturing cost)
Fig. 1. Scheme of operation - Light thru system for 100% flow test for Aluminum Cylinder
Head.

InvEnt 2013
130
Second step is to integrate Light thru system with Optical measurement system to one cabinet
as seen in picture no.2
Fig. 2. Integration of Light thru and Optical measurement system in ONE equipment
Last step of innovative approach was to try to integrate as many as possible production
processes to one cell. Semi-finished products are tested in various control units to check
dedicated parameters related product. The process is fully automated to identify any deviation
which are out of scope. Products signed as incorrect are separated and excluded from process.
Compatible products are followed all steps up to final packaging what is the last step before
products are shipped to dispatch store.
The benefit is obvious – SAFETY,PRODUCTIVITY, COST, SPACE MANAGEMENT
AND LOGISTIC ACTIVITY as seen at picture no. 3.
Fig. 3. Integrated Cell view - Material flow through control processes
2. CONTINUOUS IMPROVEMENT ACTIVITIES AS BASE FOR
SUSTAIN GROWTH
We understand in our company that Continuous Improvement is the way to accomplish
higher levels of performance and continuously share our best practices to innovate our systems
and processes.
Development people to build the Lean Manufacturing mindset as a support to the
sustainability of improvements are inevitable and essential.
If we can make the weakness transparent, then the continuous improvement cycle can
be sustained.

InvEnt 2013
131
For organizations to be successful over the long term, leaders must deeply and personally
understand the principles that govern their success. Further, they must ensure the behaviors of
every person who contributes to the business are in harmony with these principles. In short, the
organizational culture they build must be grounded in correct principles (picture nb.4).
Fig. 4. Continuous Improvement model based on principles
Guiding Principles:
1. Create Value for the Customer
2. Create Constancy of Purpose
3. Think Systematically
4. Focus on Process
5. Embrace Scientific Thinking
6. Flow and Pull Value
7. Assure Quality in the Source
8. Seek Perfection
9. Lead with Humility
10. Respect Every Individual
Systems build on Principles with focus on people and effective processes will be able
provide us New Behaviors:
� Continuously improving our processes as a part of daily routines
� Thinking People System > Think First > resolve problems
� Sustainability of CIP by making weaknesses visible
� Better company perceiving in Customers eyes
� Lean leadership by involving employees
� Necessary involvement and endorsement of Top management
Better way every day is not just cliché, but this is part of our philosophy where involving
people in daily improvements means bring into our processes innovation which help us increased
productivity.
References
[1] Nemak Internal source

InvEnt 2013
132
Risk valuation, Quality problems, FMEA, Assembly line, Automotive
Dariusz PLINTA∗, Ewa GOLIŃSKA**, Patrik GRZNÁR***
RISK VALUATION CONNECTED WITH ASSEMBLY
OPERATIONS IN THE AUTOMOTIVE INDUSTRY
EXAMPLE Abstract
The issues of possible quality problems that may occur in the spoiler assembly in
the automotive enterprise example have been presented in the article. Pareto-
Lorenza analysis has been used in the research. The author has presented an
example of a procedure of conducting FMEA in an organization – the procedure
of failure mode and effects analysis.
1. INTRODUCTION
The changes on the car sales market require introducing elastic production systems that
enable adjusting the series of the cars produced to the market demand and potential customers’ taste. Instead of the need to construct cars adjusted to average tastes, produced within the global, mass production, there is a growing market demand for individuation of offers, oriented on customers’ preferences and needs. Car producers aspire to provide the maximization of the options to choose from while searching for different variants of cars. More and more often the cars produced are adjusted to individual requirements of customers. The market demands presented above make the management of final car versions complicated. The cars produced at the assembly simultaneously, are of different workmanship and have various fittings. This situation causes diversity of the assembly activity durations. In addition, the vacillations of customers’ tastes influence the complexity of the process. This situation made the minimization of the production costs and human resources management become one of the most important criterion for production (next to the quality requirements, duration of the order completion, and the originality of carrying out the project from the customer’s point of view)[4].
In the article on the example of the spoiler assembly one of popular methods of the risk valuating is discussed in the process - Failure Method and Effect Analysis. Analysis of causes of
∗ dr hab. inż. Dariusz Plinta, prof. ATH, University of Bielsko-Biała, Faculty of Mechanical Engineering
and Computer Sciences, Department of Industrial Engineering, Willowa 2, 43-309 Bielsko-Biała, Poland, e-mail: [email protected]
** mgr inż. Ewa Golińska, University of Bielsko-Biała, Faculty of Mechanical Engineering and Computer Sciences, Department of Industrial Engineering, Willowa 2, 43-309 Bielsko-Biała, Poland, e-mail: [email protected]
*** Ing. Patrik Grznár, PhD., Department of Industrial Engineering, Faculty of Mechanical Engineering, University of Žilina, Univerzitná 1, 010 26 Žilina, Slovak Republic, tel. 00421-0415132733, e-mail: [email protected]

InvEnt 2013
133
problems and mistakes is conducted to the purpose of identifying and the counteraction for potential risks and threats in functioning of specific areas of the organization. It is used in the process for the minimizations of losses caused by the product quality failure.
The computer tool, supporting the quality management is Computer Aided Quality Assurances (CAQ). In this area organizations have to choose from huge, multimodule systems which besides their complexity have a lots of defects - in it high the price of the software and problems in the service; as well as dedicated programs, appropriate for small and medium enterprises [1].
2. ASSEMBLY LINE QUALITY PROBLEMS
A model of the assembly work in one of the motor companies presented in the thesis and specialized in producing motor cars, is utilized in accordance with the tendencies described in the introduction to the article. It differs from typical mass or serial production. A car assembled is unique to a considerable degree, geared towards individual needs of customers. The company mentioned above produces cars only to specific customers’ orders. Introducing a multitude in the assembly operations variants causes higher probability of mistakes made by workers, resulting in the assembly breaks, and the necessity of creating buffer stores in order to minimize the results of disruption. Their elimination is connected with considerable financial outlays. Those sections, especially no. 9, are very often stopped in order to correct mistakes. The research shows that most of disruptions within the assembly section no. 9 occur at the workstation no. 9.8 the workstation of spoiler and back seats assembly [2].
The process of the spoiler assembly includes three basic variants - assembly of the spoiler in the classic version ,city version and sport version - this variant is presented in the article. Models without spoiler are also made. The part of the workplace procedure P_9.8 is showing (Fig. 1). The procedure determines the appropriate manner of the fitting on this workstation. In the production practice parts, replaced in procedures, given are individual encoded version, enabling their explicit identification.
Fig.1. Procedure P_9.8 concerning operations performed on the 9.8 workstation

InvEnt 2013
134
In the first phase ten kinds of defects which can come into existence at the spoiler assembly were determined. An amount of cases of the appearance of the given defect is a measure of the defectiveness. On the basis of the number of cases of the appearance of the incompatibility and the accumulated directed number appropriately a Pareto chart and a Lorenz curve were compiled.
3. FAILURE MODE AND EFFECT ANALYSIS PROCEDURE
The Failure Method and Effect Analysis consists he analytical of establishing connections
causally - consecutive of coming into existence of potential defects in the product and for including in analysis of the criticality factor (risks). Consistent and systematic identifying potential defects in the structure/product/process, and next eliminating them or minimizing risk associated with them, are an aim of the method. Using the Failure Method and Effect Analysis it is possible it respect on of principles of the quality management - of constant improving. The FMEA is and really subjective method, so the proceedings should be explain for a workers (Fig. 2) [3].
Fig.2. Fragment FMEA procedure (flow diagram) proceedings at of risk valuating
The main aim of this procedure is maximum leveling the risk valuating, during analysis led by different experts. Everyone from possible to allot rankings (in the scale 1-10), grouped to three areas (meaning of the potential defect for the customer, frequency defect of, possibility
InvEnt 2013
135
of detection) which about the priority size numbers of the risk constitute (RPN) should be possibly exactly describe. The estimated RPN value enables to take the managerial decision, for which data is a base from analysis, and tied directly with taking or ceasing to take prevention/correction activity. During the problem analysis author established, similarly how the majority literature sources are giving, as well as the experiencing from the production practice that a critical RPN value will be on the level equal 100. From this value, in the automotive company, the prevention/correction action will be taken for appearance of the analysed incompatibility. The author wants to give extra weight to, that according to the contemporary attempt at analysis FMEA, RPN indicator isn't an important criterion in determining the priority of action - every time first it should be concentrate on action about highest (on level 9 and 10) for meaning for the customer which are tied up with the safety of the use and meeting legal requirements (critical characterizations) [5].
4. CONCLUSION
To sum up for the FMEA it is possible to say, that it is the systematic method being used for an evaluation the size and criticalities of potential mistakes and their coming into existence sources identification. In it important is evaluation of connections between individual causes of the damage and risks being able to cause losses is material. Knowing these relations it isn't possible to omit analysis of real effects of their becoming known (not every error means catastrophic losses, so financial as well as in perceiving the company by customers). This way so the FMEA in fact is an evaluation of the ultimate influence of appearing of risks in the process. Every potential error is also being analysed under the identifications of most effective action preventing/correction or minimizing the incompatibility occurrence. Success of the FMEA analysis depends on many factors which it is possible to divide in organizational factors (ensuring stores, planning, commitment, awareness of needs, effective implementing applications) and factors connected with the skill level for conducting analyses of this type (ability of applying of the FMEA sheet, ability to take the group work up, qualifications of the team moderator). It is essential to remember that the FMEA sheet is a “living” document which needs to be constantly revised.
This paper is the part of research supported by: APVV SK-PL-0030-12. References
[1] BANASZAK, Z., KŁOS, S., MLECZKO, J.: Zintegrowane systemy zarządzania, Polskie Wydawnictwo Ekonomiczne, 2011.
[2] GOLIŃSKA E.: Metody i techniki kształtowania procesów montażu w warunkach nierytmicznej produkcji, Oficyna Wydawnicza PTZP, 2013.
[3] HAMROL A.: Zarządzanie jakością z przykładami, Wydawnictwo Naukowe PWN, 2008.
[4] PŁOSZAJSKI P.(red): Przerażony kameleon. Eseje o przyszłości zarządzania, Fundacja Rozwoju Edukacji Menedżerskich SGH, 2005.
[5] WAWAK S.: Zarządzanie jakością – teoria i praktyka, Wydawnictwo Helion, 2006.
[6] MIRANDOVÁ, G. – KRAJČOVIČ, M. 2011. Use of augmented reality in industrial engineering. In TRANSCOM 2011 : 9-th European conference of young research and scientific workers. Žilina : University of Žilina, 2011. ISBN 978-80-554-0370-0.

InvEnt 2013
136
Simulation of manufacturing processes, Activity based costing
Dariusz PLINTA∗, Dariusz WIĘCEK**, Martin KRAJČOVIČ***
SIMULATION ANALYSIS OF MANUFACTURING
PROCESSES WITH TAKING INTO ACCOUNT
PRODUCTION COSTS Abstract
This paper presents contemporary approach to analysis of manufacturing
processes by simulation with taking into account the Activity Based Costing.
Possibilities of contemporary simulation software and tools for activity cost
determination are described in this paper and illustrated by practical example of
simulation with cost calculation for exemplary manufactured part.
1. INTRODUCTION
With development of production techniques, increasing complexity of production processes,
increasing cooperative ties, growing varieties of final products, developing data processing systems and increasing requirements of calculation precision some new methods of production costs calculation start to develop [3]. Together with the development of these methods, participation of costs in self-cost of products established by “averaging” or by overheads decreases. Joining the indirect costs with the particular places of costs formation, with which different products can be executed according to different production techniques, we receive the costs calculation in accordance with places of cost formations.
Dividing a yearly sum of costs by the assumed yearly fund of machine work, which is used in the calculations of production cost, we receive the rate of machine’s hourly work to be used in production costs calculations.
Some operations can be accomplished on different machine tools. Some of them are performed in cooperation. Use of the overheads in calculation algorithms can distort calculation results. The products made on simple and inexpensive machine tools are often executed in a too expensive way, while those treated at expensive workplaces make their production costs lower. There is a danger that product prices are calculated in a wrong way, which may bring losses. Therefore, a trend to minimize the overheads is visible. Bringing the overheads to zero, a transition to adding calculation according to the method of costs of activities does not always
∗ dr hab. inż. Dariusz Plinta, prof. ATH, University of Bielsko-Biała, Faculty of Mechanical Engineering
and Computer Sciences, Department of Industrial Engineering, Willowa 2, 43-309 Bielsko-Biała, Poland, e-mail: [email protected]
** dr inż. Dariusz Więcek, University of Bielsko-Biała, Faculty of Mechanical Engineering and Computer Sciences, Department of Industrial Engineering, Willowa 2, 43-309 Bielsko-Biała, Poland, e-mail: [email protected]
*** Doc. Ing. Martin Krajčovič, PhD, KPI, SjF, ŽU, [email protected]

InvEnt 2013
137
seem to be profitable. The cost of collecting all indispensable information can even exceed the effects of the precision of the assumed costs [4].
Determining costs of each activity connected with product manufacture, apart from the indirect costs, which are defined by the overheads, we proceed to modern, quickly developing calculations according to methods of activities costs. The idea of activities costs account consists in clearing of indirect costs for products, determining some suitable methods of their measurement and settlement. Indirect costs are divided into very simple components connected with simple activities and then, each of these elements is added to direct costs by a properly chosen accounting key [1].
The activity based costing also found practical application in computer simulation of production processes. During simulation model building of such a process, we define activities, which we attribute different parameters, also costs. Practical examples described further in this paper confirm it.
2. MODEL OF THE PRODUCTION SYSTEM
At projecting and analysing of the production systems a large number of possible variants of
solution often occur. Their complexity often makes it impossible to choose an optimal solution. Then, the method of modelling and simulation of production processes, becomes very useful. While working out the model of production system, the following data should be collected [5]: − information about accessible resources - machines, means of transport, workers,
organization of work and planned repairs, − plan of production - types of products, quantity of pieces, − manufacturing processes - operations, times tj and tpz, − material costs, − direct labour cost, − workplaces costs, etc.
The prepared production system model can be further improved and next simulations can be made for various variants of the system (new machines, different quantity of treated elements, different sizes of buffers, expected disturbances and possible breaks e.g. connected with planned repairs of machines, alternative processes of manufacture). In the analysis one can additionally take into account the costs of investment or manufacturing costs for different variants of the designed system [2].
The implementation of the method of Activity Based Costing is not easy in practice. The method is connected with all processes, which are realized in the production organization. Processes do not finish on the border of organizational units, but they spread into functional ranges. Implementing calculation based on activity analysis brings about not only the change of calculation procedure itself, but the change of an organization, enterprise, reorganization of the way of cost measurement and record. This method, unlike the traditional cost account, seems to be easier to understand by workers, who have no contact with accounting [1].
The starting point for preparing activity cost account is creating a database of all activities performed in an enterprise. Apart from activity identification, it is also necessary to describe them, that is: to determine by which departments the operations are carried out, how many people perform actions which compose the given activity, what is their work time, what meaning the separated activities have for the enterprise, what data express effects of activities. The specified direct, indirect activities and connections between them create the so called map of direct and

InvEnt 2013
138
indirect activities. For simulation of manufacturing processes it is necessary to determine direct busy and idle costs per hour for all used workplaces and initial costs for manufactured parts – Fig.2.
ACTIVITIES
Dete rmined partition keys and c oe fficients
Costs o f human resources m anagem en t
Costs o f f inance m anagem en t Costs o f s upervision
Costs o f produc tion m anagement
Costs o f produc tion m aintenance
Types of costs connected w ith the
ac tiv ity C osts stands
Al l-facto ry Ma in Suppo rtive Admi ni stra tion S a le
I II I II. .. I II I I I I , I I,. .. I, I I, II I . . I, I I, II I. .
Supply
Sum of costs:
Activities
Researc hes and
developmen t Marketing
Designing
Supply
...
Identification of activities
M easurem ent of cost s o f each activity D eterm ining the keys for cost se tt lem ent
C reation of c entre responsib le for cost s
A ccount ing of activities cost s am ong p roduc ts
Activitie s conducted
by each organiz ational
cell
Fig.1. Algorithm of costs calculation according to the costs of activities
List of direct activities
Determined busy costs per hour
for all used workplaces
Determined initial costs for all
manufactured parts
Fig.2. Preparation of costs’ data for simulation
3. RESULTS FROM SIMULATION
After modelling of the production processes and simulation of weekly production we obtain
information about duty of workplaces, the time of order realisation and production costs for final products and workplaces.

InvEnt 2013
139
Fig.3. Simulation model of the shaft seat and production costs forming during simulation
During simulation each new part, which is put into a production system, has automatically
attributed initial costs like value added, non value added, wait and transfer costs and later are added other costs of realized on these parts activities as working processes, waiting before workplaces and transfer between them. Busy and idle costs are the main parameters of production workplaces. These costs should be determined for all workplaces. These costs multiplied by operation time gives the costs connected with manufacturing of a unit part. During simulation, the software can automatically count costs for every processed part. After the conducted simulation, such software generates a set of results, for example, costs for successive parts and for workplaces.
Thanks to simulation, it is possible to compare different parts from the point of view of their realization time and costs of the realized activities.
4. CONCLUSIONS
The introduced example proves that activity based costing can find application in analysis
of manufacturing processes together with the use of the modelling and simulation method. It improves the efficiency of research – designing and analysis of existing systems functioning. It gives us the possibility for designing a working system which is close to the optimum from the point of view of costs and time of task realization.
This paper is the part of research supported by: APVV SK-PL-0030-12.
References
[1] ANSARI, S.: Activity-based management. R. D., Irving 1997. [2] GREGOR, M., HALUŠKOVA, M., HROMADA, J., KOŠTURIAK, J., MATUSZEK, J.:
Simulation of Manufacturing System. Politechnika Łódzka Filia w Bielsku-Białej, Bielsko-Biała 1998.
[3] MATUSZEK, J.: Inżynieria produkcji. Wydawnictwo Politechniki Łódzkiej Filii w Bielsku-Białej, Bielsko-Biała 2000.
[4] MILLER, J., PNIEWSKI, K., POLAKOWSKI, M.: Zarządzanie kosztami działań. WIG - Press, Warszawa 2000.
[5] PALAJOVÁ, S., FIGA, Š., GREGOR, M.,: Simulation on manufacturing and logistics systems for the 21th century. In: Applied computer science : management of production processes. - ISSN 1895-3735. - Vol. 7, no. 2 (2011), s. 57-70.