morgan stanley mufg for the teleconference, 28th july · pdf file ·...
TRANSCRIPT

JFE GroupCapturing Growth Opportunities
in Greater East Asian Market
JFE Holdings, Inc.July 2010
1
Morgan Stanley MUFG for the Teleconference,Morgan Stanley MUFG for the Teleconference,2828thth July 2010July 2010

2
Contents
1. Financial Results for the First Quarter
ending March 31, 2011…………………………………….3
2. Financial Forecast for the FY10 …………………………6
3. Interim Dividends…………………………………………11
4. Capturing Growth Opportunities in Greater East Asian
Market……………………………………………………..13
5. Appendix……………………..……………………………40
This presentation material is for information and discussion purposes only.Any statements in the presentation which are not historical facts are future projections based on certain assumptions and currently available information. Please note that actual performance may vary significantly due to various factors.

1.Financial Results for the First Quarter ending March 31, 2011
3
JFE Holdings

4
Financial Results for the First Quarter ending March 31, 2011
JFE Holdings
(billion yen)FY2009 FY2010Apr-Jun Apr-Jun
Net Sales 589 755 166Ordinary Profit -61 53 115
Other loss -6 -2 4Ordinary Profit -67 51 119
Extraordinary loss 0 -5 -5Income before income taxesand minority interests(loss) -67 46 113Tax expense and Minority
Interest 26 -18 -44Net Income(loss) -42 28 69
Change

5
Financial Results for the First Quarter ending March 31, 2011Sales/Recurring Profit by Business Segment
(billion yen)FY2009 FY2010Apr-Jun Apr-Jun
Steel 476 657 181Engineering 51 46 -5Shipbuilding 68 53 -16Urban Development 5 5 0LSI 5 6 1Eliminations and Corporate -17 -13 4
589 755 166Steel -77 46 123Engineering 0 -1 -1Shipbuilding 7 7 1Urban Development -0 -1 -1LSI -0 0 1Eliminations and Corporate 3 -1 -4
-67 51 119
Change
Net Sales
Ordinary Income
JFE Holdings

6
2. Financial Forecast for FY10

77
Financial Forecast for FY10
(billion yen)Change
Full Year Full Year (Y/Y)
Steel 2,281 2,960 679
Net Sales 2,844 3,420 576
Operating Income 89 230 141Steel 32 200 168
Ordinary Income 69 220 151
Net Income 46 120 74
FY10(e)FY09(A)
88
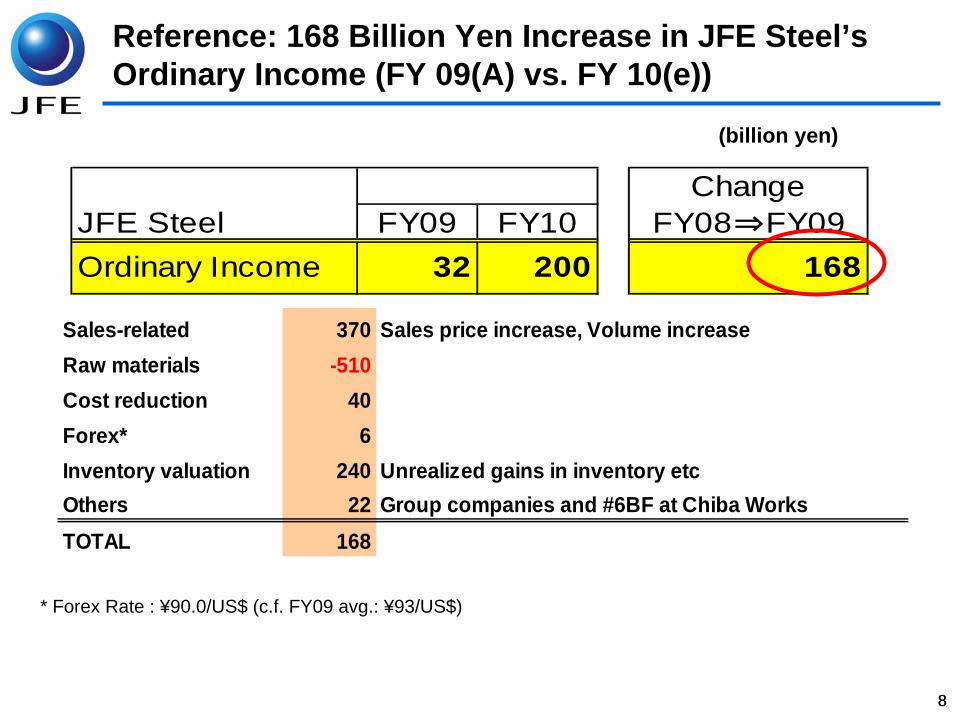
* Forex Rate : ¥90.0/US$ (c.f. FY09 avg.: ¥93/US$)
ChangeJFE Steel FY09 FY10 FY08⇒FY09Ordinary Income 32 200 168
Sales-related 370 Sales price increase, Volume increaseRaw materials -510Cost reduction 40Forex* 6Inventory valuation 240 Unrealized gains in inventory etcOthers 22 Group companies and #6BF at Chiba WorksTOTAL 168
Reference: 168 Billion Yen Increase in JFE Steel’s Ordinary Income (FY 09(A) vs. FY 10(e))
(billion yen)
9
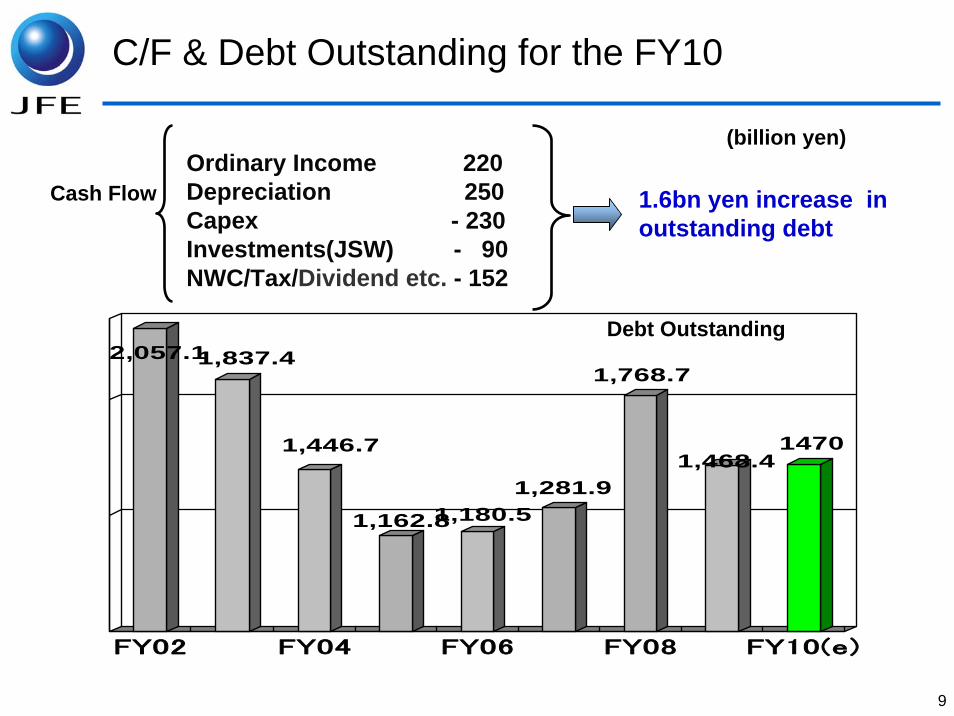
C/F & Debt Outstanding for the FY10
Ordinary Income 220Depreciation 250Capex - 230Investments(JSW) - 90NWC/Tax/Dividend etc. - 152
2,057.11,837.4
1,446.7
1,162.81,180.51,281.9
1,768.7
1,468.41470
FY02 FY04 FY06 FY08 FY10(e)
Cash Flow
Debt Outstanding
(billion yen)
1.6bn yen increase in outstanding debt
10
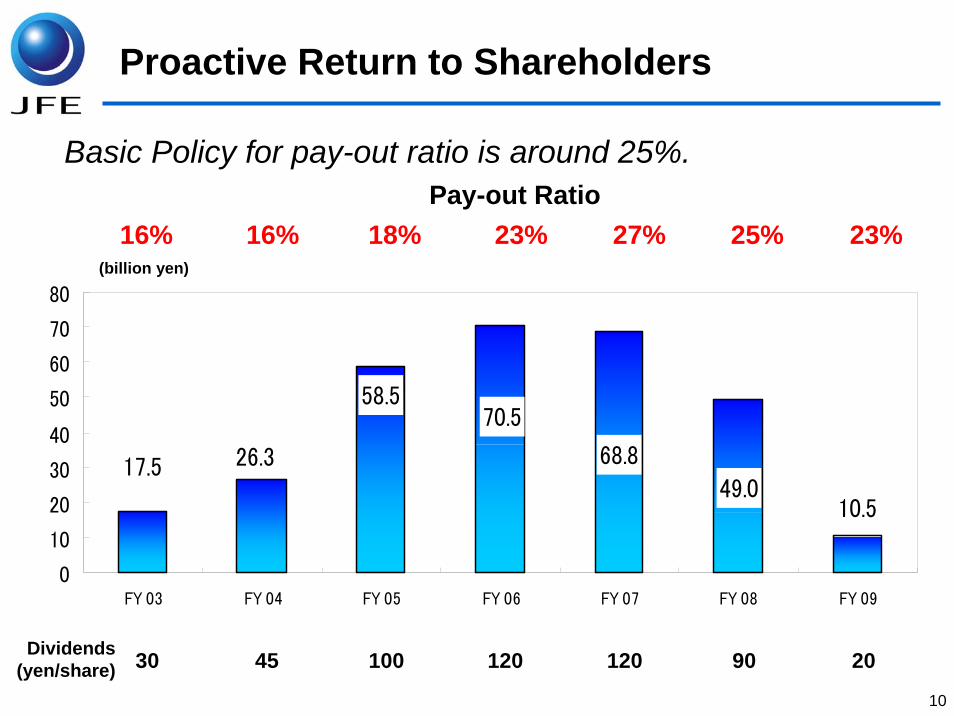
10.5
17.5 26.3
58.570.5
68.8
49.0
0
10
20
30
40
50
60
70
80
FY 03 FY 04 FY 05 FY 06 FY 07 FY 08 FY 09
Dividends(yen/share)
(billion yen)
30 45 100 120 120 90 20
Proactive Return to Shareholders
Pay-out Ratio16% 16% 18% 23% 27% 25% 23%
Basic Policy for pay-out ratio is around 25%.

3.Interim Dividend
11

12
Interim Dividend
The company intends to propose payment of an interim dividend of 20 yen per share for the current fiscal year.(Pay-out Ratio=21%)
Payment of an year-end dividend is not determined at this time.

13
4. Capturing Growth Opportunities in Greater East Asian Market
14
(1) Advantages of JFE Steel

1515
3.73.9
5.46.06.8
7.67.7
7.918.1
0.0 5.0 10.0 15.0 20.0
JFE Steel West Japan
Nippon Steel Kimitsu
JFE Steel East Japan
Nippon Steel Oita
Sumitomo Metals Kashima
Nippon Steel Nagoya
Kobe Steel Kakogawa
Sumitomo Wakayama
Nippon Steel Yawata
Million tons
Crude Steel Production by Steelworks in FY ended March 2010
Cost competitiveness of JFE Steel based on we have consolidated large steelworksat two location.
Sharing infrastructure, JFE’s steelworks are operated at energy-efficient way, need no transferring cost of slabs to the other works and fixed cost of those are relatively lower.
Advantages of JFE Steel (1):Economies of Scale
16
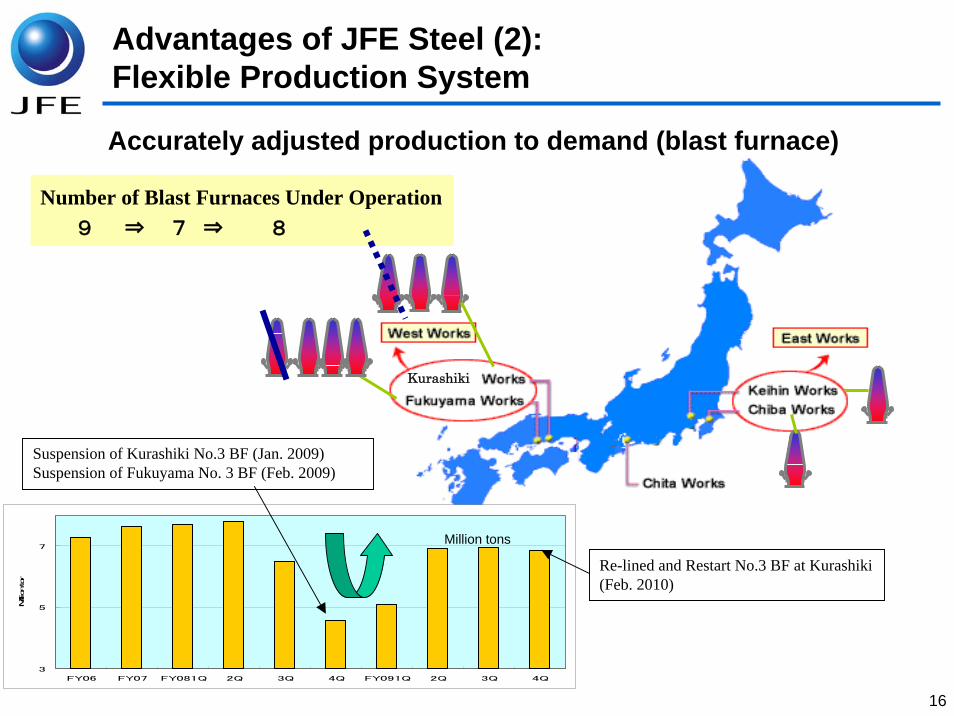
Number of Blast Furnaces Under Operation9 ⇒ 7 ⇒ 8
3
5
7
FY06 FY07 FY081Q 2Q 3Q 4Q FY091Q 2Q 3Q 4Q
Million ton
Suspension of Kurashiki No.3 BF (Jan. 2009)Suspension of Fukuyama No. 3 BF (Feb. 2009)
Kurashiki
Re-lined and Restart No.3 BF at Kurashiki (Feb. 2010)
Accurately adjusted production to demand (blast furnace)
Million tons
Advantages of JFE Steel (2):Flexible Production System

1717
Thailand10%
China18%
Other Asian22%
Other6%Americas
5%
S. Korea39%
Autos30%
Construction10%Shipbuilding
19%Machinery
8%
Containers 4%
Secondary processing
16%
Dealers13%
Advantages of JFE Steel (3): Stable Customer Bases both Domestic and Asia
FY 09
Domestic Shipments by Customer
Exports by Destination
Exports by Customer
Allied steelmakers43%
Contract customers(autos, appliances &
shipbuilding)32%
Only One and Number Oneproducts, etc. 25%
: Prices usually negotiated on annual basis. With the customer overseas, price negotiation be done mainly by semi-annual or quarterly basis.
Domestic45%
Exports 55%

18
Reference : Alliances with Overseas SteelmakersReference : Alliances with Overseas SteelmakersReference : Alliances with Overseas Steelmakers
GreeceGreece・・Corinth Corinth PipeworksPipeworks
CanadaCanada・・DJGDJG
U.S.A.U.S.A.・・CSICSI・・AK SteelAK Steel
South Korea・Dongkuk Steel・Hyundai HYSCO・Dongbu Steel
South KoreaSouth Korea・・DongkukDongkuk SteelSteel・・Hyundai HYSCOHyundai HYSCO・・DongbuDongbu SteelSteel
JFE SteelJFE Steel
ThailandThailand・・TCR, TCSTCR, TCS・・TTPTTP
ColombiaColombia・・HolasaHolasaIndonesiaIndonesia
・・SermaniSermani SteelSteel
MalaysiaMalaysia Vietnam Vietnam ・・PerstimaPerstima・・MycronMycron, , SunscoSunsco
GermanyGermany・・ThyssenKruppThyssenKrupp・・GeorgsmarienhuetteGeorgsmarienhuette
ChinaChina・・BohaiBohai NKK Drill PipeNKK Drill Pipe・・Fujian SinoFujian Sino--Japan MetalJapan Metal・・Hainan Hainan HaiwooHaiwoo TinplateTinplate・・Guangzhou JFE SheetGuangzhou JFE Sheet
Taiwan Taiwan ・・TonTon--yiyiIndiaIndia
・・JSW SteelJSW Steel

1919
Reference : Capturing growing demand for high-end steel in Asian markets.
80
90
100
110
120
130
140
FY03/1H
FY03/2H
FY04/1H
FY04/2H
FY05/1H
FY05/2H
FY06/1H
FY06/2H
FY07/1H
FY07/2H
FY08/1H
FY08/2H
FY09/1H
FY09/2H
Shipments to Allied Steelmakers (FY03/1H = 100)
Shipments to allied steelmakers, following a temporary decrease due to the global economic crisis triggered by the collapse of Lehman in FY2008, grew at solid half-year rates of 10–30% in FY 2009, as the company captured growing demand for high-end steel in Asian markets.

20
(2) Target Market Greater East Asia as our “Home Market”

21
China(6.79 mil tons)
South Western Asia(4.13 mil tons)
Middle and Near East(7.89 mil tons)
Hot-rolled sheet
Cold-rolled sheet
Plate
Regional Import Volumes in 2008(see legend)
2.74
1.28
3.87
0.64
1.382.12
Strategies to Expand ExportsOrganization
Make extended visits to develop sales
Restructure sales: 10 departments & 15 sections 13 departments & 18 sections
Strengthen overseas offices
Strengthen alliances
Export Expansion Focusing on Asia
6.84
4.15
4.23
East Asia(15.22 mil tons)
679240
1,522
537
413
789
0
500
1,000
1,500
2,000
2,500
3,000
3,500
Total imports Exports from Japan
34.03 mil tons 8.33 mil tons
China
Middle and Near East
South Western Asia
East Asia
Legend
1.340.92
4.53

22
Business Models that Respond to Each Market
Localization
Distance from Japan
Korea China Thai East Asia
India Middle East
North America
South America
Europe
Export
CSI
AK
Steel
Vertical Alliance(Export of semi-finished goods)
Dongkuk Hyundai
HyscoTongbu
GJSSTin
PlateMill
TCR
TCS
Tin PlateMill
Tin PlateMill
Localiza
tion
Study feasibility of Integrated Steel Work Projects
Study feasibility of Slab Projects
TKS
GMH
AKSteel
(USS)
Dongkuk
Hyundai Hysco
Technological
Alliance
(JSW)
Expanding Sales
◆Further Strengthen the established relationship ◆Seek New Alliance in New Market

2323
Equipment Shipments(operating) (1,000t/p.a.)
High-end SteelAuto (GA) 600
400Under Construction Electric (GI) 200
Auto (CRC) 500
1,800 400 Electric (CRC) 200
CRC 200
900
CAL
PL-TCM No.2 CGL
No.1 CGL
Expansion of Capacity in Guangzhou, China
Guangzhou JFE Steel Sheet (JFE ownership: 50%)Phase 1: Started operating #1 CGL (March 2006)Phase 2: Start operating expanded line (mid-2011)
Providing HRC
JFE Steel

24
Expansion of Alliances
Mycron Steel [announced Feb. 2010]Made 3% capital investment (179 million ringgits, or about 4.9 billion yen)Supply automotive technology and EG substrateIncrease supply of hot-rolled coil after Mycron’s introduction of new cold reduction mill Increase supply of hot rolled steel to 200,000 tons/year by around 2012
Mycron Steel [announced Feb. 2010]Made 3% capital investment (179 million ringgits, or about 4.9 billion yen)Supply automotive technology and EG substrateIncrease supply of hot-rolled coil after Mycron’s introduction of new cold reduction mill Increase supply of hot rolled steel to 200,000 tons/year by around 2012
SUNSCO [announced Feb. 2010]Made 8% capital investment (US$ 130 million, or about 11.7 billion yen). Major shareholder
is Maruichi Steel (64.3%).Increase hot rolled steel supply to 50,000 tons/year in 2010 and then 100,000–150,000
tons/year in 2011
SUNSCO [announced Feb. 2010]Made 8% capital investment (US$ 130 million, or about 11.7 billion yen). Major shareholder
is Maruichi Steel (64.3%).Increase hot rolled steel supply to 50,000 tons/year in 2010 and then 100,000–150,000
tons/year in 2011
Strategic collaboration with JSW Steel, India’s major steel maker [announced Nov. 2009]Help JSW Steel expand crude steel capacity from current 7.8 million tons to 11 million tons in
2011 and then to 32 million tons in 2020.Collaborate on steel products for automobiles (supply production technology, substrate
and cooperative services)Others (participate in West Bengal project, make joint capital investments, etc.)
IndiaIndia
MalaysiaMalaysia
VietnamVietnam
25
JFE Steel and JSW Steel Take First Concrete Steps in Strategic Cooperation
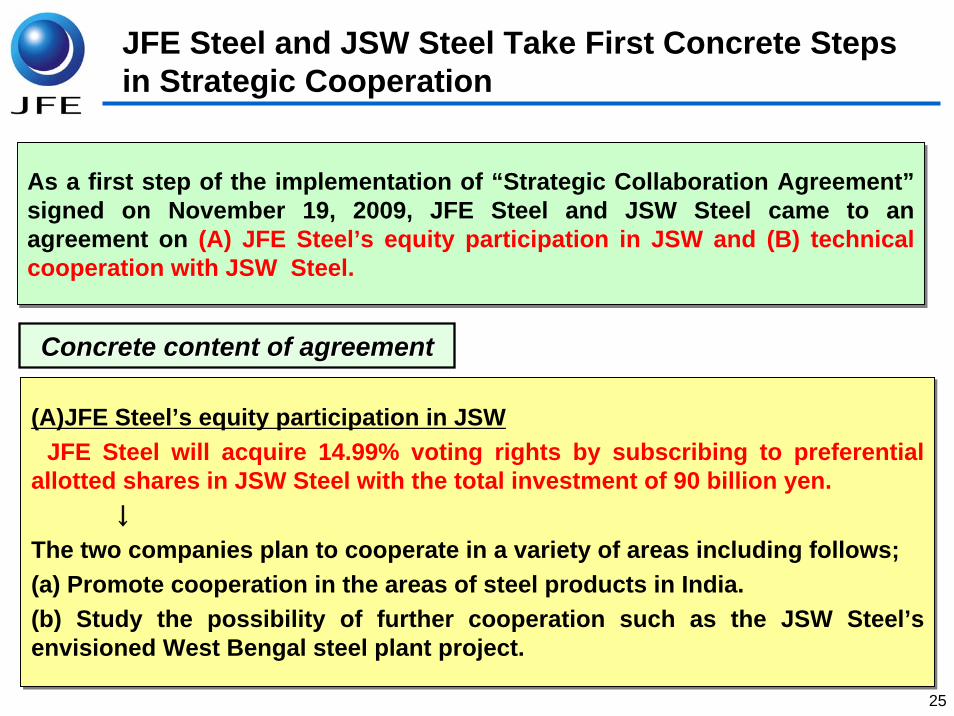
(A)JFE Steel’s equity participation in JSW JFE Steel will acquire 14.99% voting rights by subscribing to preferential allotted shares in JSW Steel with the total investment of 90 billion yen. ↓
The two companies plan to cooperate in a variety of areas including follows; (a) Promote cooperation in the areas of steel products in India.(b) Study the possibility of further cooperation such as the JSW Steel’s envisioned West Bengal steel plant project.
As a first step of the implementation of “Strategic Collaboration Agreement”signed on November 19, 2009, JFE Steel and JSW Steel came to an agreement on (A) JFE Steel’s equity participation in JSW and (B) technical cooperation with JSW Steel.
As a first step of the implementation of “Strategic Collaboration Agreement”signed on November 19, 2009, JFE Steel and JSW Steel came to an agreement on (A) JFE Steel’s equity participation in JSW and (B) technical cooperation with JSW Steel.
Concrete content of agreementConcrete content of agreement

26
(B) JFE Steel’s technical assistance for JSW
(a) Cooperation in the Automotive Steel
【Objective of Agreement】 Through newly announced agreements, JFE Steel looks forward to deepening its collaboration with JSW Steel to establish a solid base for production and sales and thereby grow its market in India.
【Essential point of Agreement】JFE Steel will provide JSW Steel with technology for the production of hot-rolled coils and
cold-rolled coils for automotive use,JFE Steel will supply JSW Steel with substrates, andThe two companies will jointly provide automotive customers with services including
engineering and product development.
JFE Steel and JSW Steel Take First Concrete Steps in Strategic Cooperation

27
(b) Technical Assistance for operational improvements of JSW’s Vijayanagar Works
The two companies agreed on the areas of JFE Steel’s technical assistance forJSW’s Vijayanagar Works’ operational improvements, such as
Energy reduction/ environmental protectionImprovement of production process quality and yieldProduction capacity analysis and indices benchmarking
JFE Steel and JSW Steel Take First Concrete Steps in Strategic Cooperation

28
(Reference) JFE STEEL & JSW STEEL COME TOGETHER IN A STRATEGIC COLLABORATION [announced on Nov. 19th , 2009]
○○・・・Concluded agreements in the equity participation and technical cooperation agreement signed July 27th , 2010
(A) Collaboration for Automotive Steel Production:・ Supply of substrate materials for hot rolled, cold rolled and galvanized products.
・Joint service activities including application engineering and product development for automotive customers.
(B) Further Collaboration in the near future: ・Production of steel products other than automotive steel.
・Energy reduction programmes ・Environmental programmes ・Quality and yield improvement programmes
・Performance audit of JSW facilities・Benchmarking of techno-economic parameters between the parties・Procurement of raw materials both in and outside of India ・Project for building and operating an integrated steel production facility in
JSW’s West Bengal Steel Project・Mutual Stockholding

(3) Expansion of Production Capacity

30
Production Capacity Expand to 33 million tons (JFE Steel non-consolidated basis)
27
30
2627
29
31
33
20
25
30
35
FY05 FY06 FY07 FY08 FY09 FY10(E) FY11(F)
Trends of Crude Steel Production(stand-alone basis)
Crude SteelProduction
(Consolidated)30 33 34 29 28 33
(Mt)
As JFE Steel re-lined and restart #3BF at Kurashiki, 11th Feb. 2010, production volume will increase to 30-31Mt in the FY2010. (Eight BF are under operation)
30
Nine BF were under operation
3
5
7
FY06 FY07 FY081Q 2Q 3Q 4Q FY091Q 2Q 3Q 4Q
Million ton
31
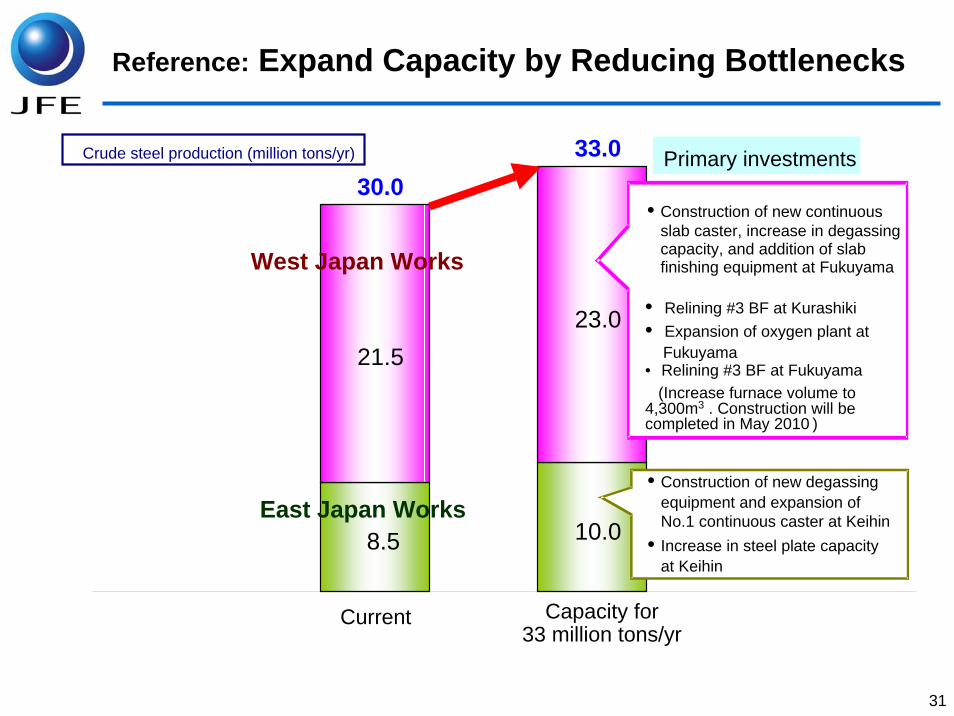
8.5 10.0
23.0
30.033.0
21.5
Current Capacity for33 million tons/yr
East Japan Works
West Japan Works
Crude steel production (million tons/yr)
• Construction of new continuousslab caster, increase in degassingcapacity, and addition of slabfinishing equipment at Fukuyama
• Relining #3 BF at Kurashiki• Expansion of oxygen plant at
Fukuyama• Relining #3 BF at Fukuyama
(Increase furnace volume to 4,300m3 . Construction will be completed in May 2010 )
Primary investments
• Construction of new degassingequipment and expansion ofNo.1 continuous caster at Keihin
• Increase in steel plate capacityat Keihin
Reference: Expand Capacity by Reducing Bottlenecks
32
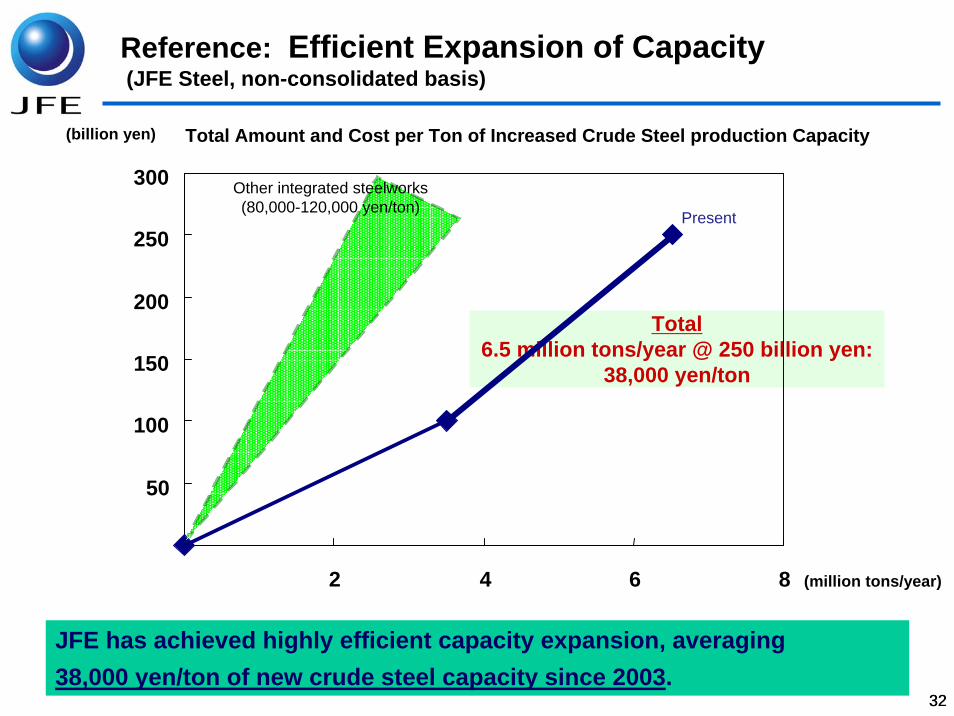
JFE has achieved highly efficient capacity expansion, averaging 38,000 yen/ton of new crude steel capacity since 2003.
Reference: Efficient Expansion of Capacity (JFE Steel, non-consolidated basis)
(billion yen)
Total6.5 million tons/year @ 250 billion yen:
38,000 yen/ton
(million tons/year)
50
100
150
200
250
300
2 4 6 8
Present
Other integrated steelworks(80,000-120,000 yen/ton)
Total Amount and Cost per Ton of Increased Crude Steel production Capacity
32

33
(4) Price Trends of Raw Materials
33

34
020406080
100120140160180200220240260280300
03 04 05 06 07 08 09 10-1Q 10-2Q SPOT
(US$/ton)
Australian premium hard coking coal
Australian fine ore (62% Fe)
300.0
89.7
Main Raw Material Prices
129
60.1
Raw Materials
Raw Materials
200(+55%)
120(+100%)
225(+12.5%)
147(+22.5%)
118
198
35
(5) More Self Sufficiency for Raw Materials
35

3636
Mining Interests & Operations Overseas
Philippine Sinter CorporationSinter
Minas da Serra Geral S/AJV with Vale
Iron ore
Nova Era Silicon S/AFerro-silicon
Erdos Manganese Alloys Co., Ltd.Silico-manganese
JFE Steel Corporation
Capital investment in 7 coal mines
(including JFE group companies)Coking coal
JFE Western 4 (Yandi)
JV with BHP BillitonIron ore
Cato Ridge Alloys (PTY) Ltd.Ferro-manganese
3737
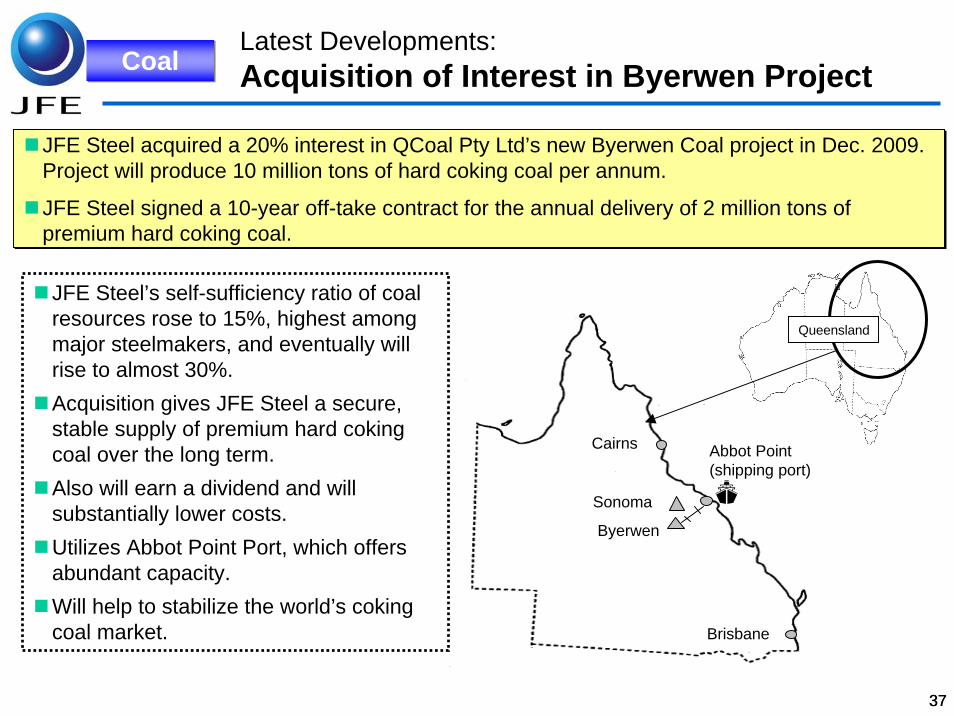
Latest Developments: Acquisition of Interest in Byerwen Project
JFE Steel acquired a 20% interest in QCoal Pty Ltd’s new Byerwen Coal project in Dec. 2009. Project will produce 10 million tons of hard coking coal per annum.
JFE Steel signed a 10-year off-take contract for the annual delivery of 2 million tons of premium hard coking coal.
JFE Steel acquired a 20% interest in QCoal Pty Ltd’s new Byerwen Coal project in Dec. 2009. Project will produce 10 million tons of hard coking coal per annum.
JFE Steel signed a 10-year off-take contract for the annual delivery of 2 million tons of premium hard coking coal.
Cairns
Brisbane
Sonoma
Byerwen
JFE Steel’s self-sufficiency ratio of coal resources rose to 15%, highest among major steelmakers, and eventually will rise to almost 30%.Acquisition gives JFE Steel a secure, stable supply of premium hard coking coal over the long term.Also will earn a dividend and will substantially lower costs. Utilizes Abbot Point Port, which offers abundant capacity.Will help to stabilize the world’s coking coal market.
Queensland
Abbot Point(shipping port)
CoalCoal

38
Latest Developments:
NAMISA Project in Brazil
Self-sufficiency ratio of 15% (Iron Ore)TOP-Ranked among competitors
• Investment: December 2008• Owners: CSN & Japan–Korea consortium• Projected sales: 38 MT/year in FY2013
Iron OreIron Ore

39
Increasing Self-Sufficiency Ratio
15%
30%
0%
10%
20%
30%
40%
Current In the Next Two Years
・A steady, secure supply of raw materials is a source of competitive strength.
・Consequently, JFE Steel acquires resource rights where there is a clear economic rationale for doing so. ・Aim at increasing the self-sufficiency ratio from 15% to 30% in some two years.

5. Appendix

41
(1) Steel Business Environment

42
58.1%
85.7% 83.4%
50.0%
55.0%
60.0%
65.0%
70.0%
75.0%
80.0%
85.0%
90.0%Ju
l-08
Sep-
08
Nov
-08
Jan-
09
Mar
-09
May
-09
Jul-0
9
Sep-
09
Nov
-09
Jan-
10
Mar
-10
Source :WSA
ExportExport World Steel Capacity Utilization Ratio
...recovering to the robust levels as before the “Lehman Shock”.

43
ExportExport
Source :WSA : World Steel Short Range Outlook Spring, 2010
Demand Increase in Asia Apparent Steel Use in Asia
0
100
200
300
400
500
600
700
800
900
1,000
CY07 CY08 CY09 CY10(f) CY11(f)
millio
n t
ons
Others
India
Korea
China
Japan
+64Mt(y/y)
Source : OECD*Figures converted to steel products
Capacity Increase in Asia(09⇒10)
0
200
400
600
800
1,000
1,200
CY09/3E CY10/3E(e)
millio
n t
ons
Crude SteelProduction
Othes
India
Korea
China
Japan
+67Mt(y/y)*
Utilization Ratio(77%)
Utilization Ratio(78%)
Demand and Supply Trends in Asia (2010)
Healthy demand and supply trends in Asia will continue throughout the year 2010

44
0.0
10.0
20.0
30.0
40.0
50.0
60.0
Ja
n-
08
Ap
r-0
8
Ju
l-0
8
Oc
t-0
8
Ja
n-
09
Ap
r-0
9
Ju
l-0
9
Oc
t-0
9
Ja
n-
10
Ap
r-1
0
mill
ion
tons
◆Quick estimate of world crude steel production in June : 118.8 million tons •Change from previous month: -5.4 million tons / Year-on-year change: + 18%
■ Production in China in June : 53.8 million tons•Change from previous month: -2.3 million tons / Year-on-year change: + 9%
Source :WSA
Crude Steel Production
China
EU27
Korea
USJapan
ExportExport

45
Auto Sales in Key Countries
Upward momentum continues in Asian Region. Keep rising y/y.
-40%
0%
40%
80%
120%
Apr
-Jun
Jul-S
ept
Oct
-Dec
Jan-
Mac
Apr
-Jun
Jul-S
ept
Oct
-Dec
Jan-
Mac
Apr
-Jun
Jul-S
ept
Oct
-Dec
Jan-
Mac
Apr
-Jun
Jul-S
ept
Oct
-Dec
Jan-
Mac
Apr
-May
Korea China
FY2006 FY2007 FY2008 FY2009
-60%
-40%
-20%
0%
20%
40%
60%
80%
100%
Apr
-Jun
Jul-S
ept
Oct
-Dec
Jan-
Mac
Apr
-Jun
Jul-S
ept
Oct
-Dec
Jan-
Mac
Apr
-Jun
Jul-S
ept
Oct
-Dec
Jan-
Mac
Apr
-Jun
Jul-S
ept
Oct
-Dec
Jan-
Mac
Apr
-May
Indonesia Thailand India
Automobile Sales in Key Countries (YoY changes)
* S. Korea figures include export sales
FY2006 FY2007 FY2008 FY2009
ExportExport
million unitsCY07 CY08 CY09 CY10
Jan-Mac Apr-Jun Jul-Set Oct-Dec Jan-Mac Apr-MayChina 8.8 9.4 2.7 3.4 3.6 4.0 4.6 3.0 0.73 32%Korea 4.1 3.8 0.7 0.9 0.9 1.1 0.9 0.7 0.19 35%Thailand 0.6 0.6 0.1 0.1 0.1 0.1 0.2 0.1 0.04 50%Indonesia 0.4 0.6 0.1 0.1 0.1 0.2 0.2 0.1 0.06 86%India 2.0 2.0 0.5 0.5 0.6 0.6 0.7 0.5 0.16 48%
y/y Change

46Source: General Administration of China Customs
China’s Export and Import of Steel Products (Including Semi-finished Products)(thousand tons)
China’s Export and Import of Steel Products
5680
1490
0
1,000
2,000
3,000
4,000
5,000
6,000
7,000
8,000
9,000
Jan-
08
Mar
-08
May
-08
Jul-0
8
Sep-
08
Nov
-08
Jan-
09
Mar
-09
May
-09
Jul-0
9
Sep-
09
Nov
-09
Jan-
10
Mar
-10
May
-10
ExportImport Last-minute shipment before the
abolishment of export tax rebate.
Export rebates will be scrapped for steel products after 15th July. (cf. Tax rebate for HRC will be reduced from 9% to zero)
ExportExport

47
0500
1,0001,5002,0002,5003,000
Jan
-0
8
Apr
-0
8
Ju
l-0
8
Oc
t-0
8
Jan
-0
9
Apr
-0
9
Ju
l-0
9
Oc
t-0
9
Jan
-1
0
Apr
-1
0
(thousand tons)Inventories of Steel Sheet in East China (Public Warehouses)
Hot rolled
Cold rolled
Hot dipped
Tin plate
Thin plate
Only inventory of hot rolled sheet is showing a rising trend.
China’s Steel Sheet InventoriesExportExport

48
Source: Production, exports and imports:-Japan Iron and Steel Federation, “China Steel Statistics”
Consumer Goods Production(Year-on-year growth)
Production in ChinaExport
Steel Production by Product
Export
0
5
10
15
20
25
30
35
Jan-
09
Apr
-09
Jul-0
9
Oct
-09
Jan-
10
Apr
-10
mill
ion
to
ns
0%
50%
100%
150%
200%
250%
Jan-
09
Apr
-09
Jul-0
9
Oct
-09
Jan-
10
Apr
-10
Automobiles(Sales, including commercial)
TV
Airconditioners
Refrigerators
Bar Steel
Steel Sheet
Plate & Thin plate
Pipe and etc.
49
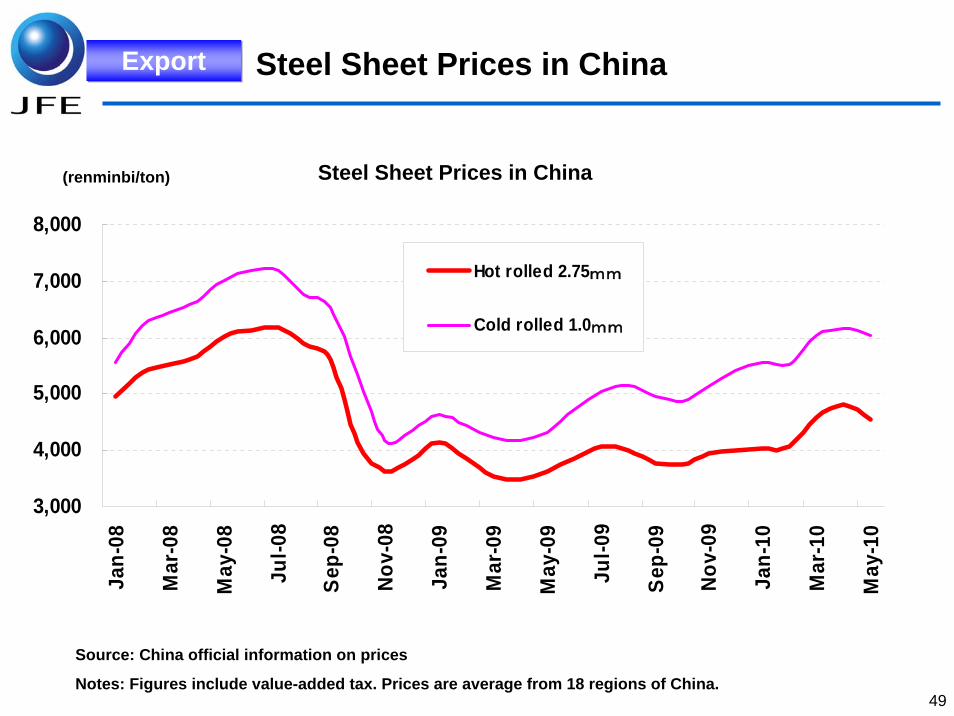
Steel Sheet Prices in China(renminbi/ton)
Source: China official information on prices
Notes: Figures include value-added tax. Prices are average from 18 regions of China.
Steel Sheet Prices in ChinaExportExport
3,000
4,000
5,000
6,000
7,000
8,000
Jan-
08
Mar
-08
May
-08
Jul-0
8
Sep
-08
Nov-
08
Jan-
09
Mar
-09
May
-09
Jul-0
9
Sep
-09
Nov-
09
Jan-
10
Mar
-10
May
-10
Hot rolled 2.75mm
Cold rolled 1.0mm

50
Production Volume of Automobiles
2.61 2.582.74
2.972.79
2.983.13 3.18
2.88 2.91
2.59
1.611.71
2.14
2.47 2.54
2.30
2.74 2.992.73 2.76
0.00
0.50
1.00
1.50
2.00
2.50
3.00
3.50
Apr-Jun Jul-Sept Oct-Dec Jan-Mac
milli
on u
nits
FY05(10.9M) FY06(11.5M) FY07(11.8M)FY08(10.0M) FY09(8.9M) FY10(9.3M)
DomesticDomestic

51
Combined Inventories of HR, CR and Surface-treated Steel Sheet
0
500
1,000
1,500
2,000
2,500
3,000
3,500
4,000
4,500
5,000Ja
n-08
Apr
-08
Jul-0
8
Oct
-08
Jan-
09
Apr
-09
Jul-0
9
Oct
-09
Jan-
10
Apr
-10
thou
sand
tons
Maker Wholesaler Coil center
DomesticDomestic

52
Inventory of Sheared plate
200
250
300
350
400
450
500
550
60005
/3 906
/3 907
/3 7 9 1108
/1 3 5 7 9 1109
/1 3 5 7 9 1110
/1 3 5
thou
sand
tons
1
1.5
2
2.5
3
mon
ths
Inventory of sheared plate
Inventory ratio
DomesticDomestic

53
Inventory of Wide Flange Shapes
0
50
100
150
200
250
300
Jun-
08
Aug
-08
Oct
-08
Dec
-08
Feb-
09
Apr
-09
Jun-
09
Aug
-09
Oct
-09
Dec
-09
Feb-
10
Apr
-10
Jun-
10
thou
sand
tons
0.0
0.5
1.0
1.5
2.0
2.5
3.0
3.5
mon
ths
Inventory (left axis) Shipment (left) Inventory Ratio (right)
DomesticDomestic

54
Business Environment
Overall: The gradual recovery since FY 2009 will continue, but demand from construction sector will remain at low levels.
DomesticDomestic
Steel Demand from Manufacturing Industry
0
1,000
2,000
3,000
4,000
5,000
6,000
7,000
8,000
9,000
10,000
FY08
/1Q
FY08
/2Q
FY08
/3Q
FY08
/4Q
FY09
/1Q
FY09
/2Q
FY09
/3Q
FY09
/4Q
FY10
/1Q
(e)
FY10
/2Q
(e)
FY10
/3Q
(e)
FY10
/4Q
(e)
thousand t
ons
Shipyards Automobiles Others
Steel Demand from Construction Sector
01,0002,0003,0004,0005,0006,0007,0008,0009,000
10,000
FY08
/1Q
FY08
/3Q
FY09
/1Q
FY09
/3Q
FY10
/1Q
(e)
FY10
/3Q
(e)
thousa
nd t
ons
Construction
Civil Construction

55
(2) Others

56
JFE Engineering Results: Changes between FY 2009 and FY 2010
Y on Y
Engineering
Notes: Main Factors behind Changes 3.5 billion yen decrease in earnings due to weaker sales, 7.8 billion yen decrease in gross margin due to lower sales prices, 3 billion yen increase by cost reduction, and 2 billion yen increase in equity method earnings, etc.
※1
(billion yen)Change
1H Total 1H Total
Orders 157 279 130 310 31
Net Sales 117 294 110 270 ▲ 24
Operating Income 3 13 △1 5 ▲ 8
Ordinary Income 3 13 0 7 ▲ 6
FY09 FY10(e)

57
Shipbuilding Business Results: Changes between FY 09 and FY 10
Shipbuilding
Y on Y
※
Notes: Main Factors behind Changes¥5.8 billion : Cost reductions ¥2.5 billion : Forex rates & steel price changes
- 19.3 billion : Difference caused by booking reversal of the allowance for losses on construction contracts.
(billion yen)Change
1H Total 1H Total
Orders 14 59 64 110 51
Net Sales 139 287 110 210 ▲ 77
Oprating Income 10 21 8 11 ▲ 11
Single year income/loss ▲ 3 4 9 13 8
Changes of allowance forlosses on constructioncontract
15 21 1 1 ▲ 19
Goodwill amotzaron ▲ 2 ▲ 4 ▲ 2 ▲ 4 0
Ordinary Income 10 22 8 11 ▲ 11
FY09 FY10(e)

58
020406080
100120140160180200220240260280300
03 04 05 06 07 08 09 10-1Q 10-2Q SPOT
(US$/ton)
Australian premium hard coking coal
Australian fine ore (62% Fe)
300.0
89.7
Main Raw Material Prices
129
60.1
200(+55%)
120(+100%)
225(+12.5%)
147(+22.5%)
118
198
Raw Materials
Raw Materials

59
10,000
20,000
30,000
40,000
50,000
60,000
70,000
Apr
-05
Jul-
05
Oct-
05
Jan
-06
Apr
-06
Jul-
06
Oct-
06
Jan
-07
Apr
-07
Jul-
07
Oct-
07
Jan
-08
Apr
-08
Jul-
08
Oct-
08
Jan
-09
Apr
-09
Jul-
09
Oct-
09
Jan
-10
Apr
-10
Jul-
10
(Yen/t)
Trends in Scrap Price Raw Materials
Raw Materials

Metals
Ferromanganese
400
800
1200
1600
2000
2400
2800
3200
3600
05/04
05/08
05/12
06/04
06/08
06/12
07/04
07/08
07/12
08/04
08/08
08/12
09/04
09/08
09/12
10/4
U$/T
Ferrosilicon
500
700
900
1100
1300
1500
1700
1900
2100
2300
2500
05/04
05/08
05/12
06/04
06/08
06/12
07/04
07/08
07/12
08/04
08/08
08/12
09/04
09/08
09/12
10/4
U$/T
Ferrochromium
30
50
70
90
110
130
150
170
190
210
230
05/04
05/08
05/12
06/04
06/08
06/12
07/04
07/08
07/12
08/04
08/08
08/12
09/04
09/08
09/12
10/4
¢/lb
Molybdenum
0
5
10
15
20
25
30
35
40
05/04
05/07
05/10
06/01
06/04
06/07
06/10
07/01
07/04
07/07
07/10
08/01
08/04
08/07
08/10
09/01
09/04
09/07
09/10
10/1
10/4
U$/lb
Raw Materials
Raw Materials

61
0
20
40
60
80
100
120
140
160
03/1
03/4
03/7
03/1
004
/104
/404
/704
/10
05/1
05/4
05/7
05/1
006
/106
/406
/706
/10
07/1
07/4
07/7
07/1
008
/108
/408
/708
/10
09/1
09/4
09/7
09/1
010
/110
/410
/7
50
150
250
350
450
550
650
750
850
WTI Crude Oil
Bunker oil
(Crude oil:$/bbl) (BUnker:$/T)
Crude Oil and Bunker OilRaw Materials
Raw Materials

62
0
50,000
100,000
150,000
200,000
250,000
05/4
05/7
05/10
06/1
06/4
06/7
06/10
07/1
07/4
07/7
07/10
08/1
08/4
08/7
08/10
09/1
09/4
09/7
09/10
10/1
10/4
10/7
Spot Prices for Vessel Chartering
($/day)
Raw Materials
Raw Materials
63
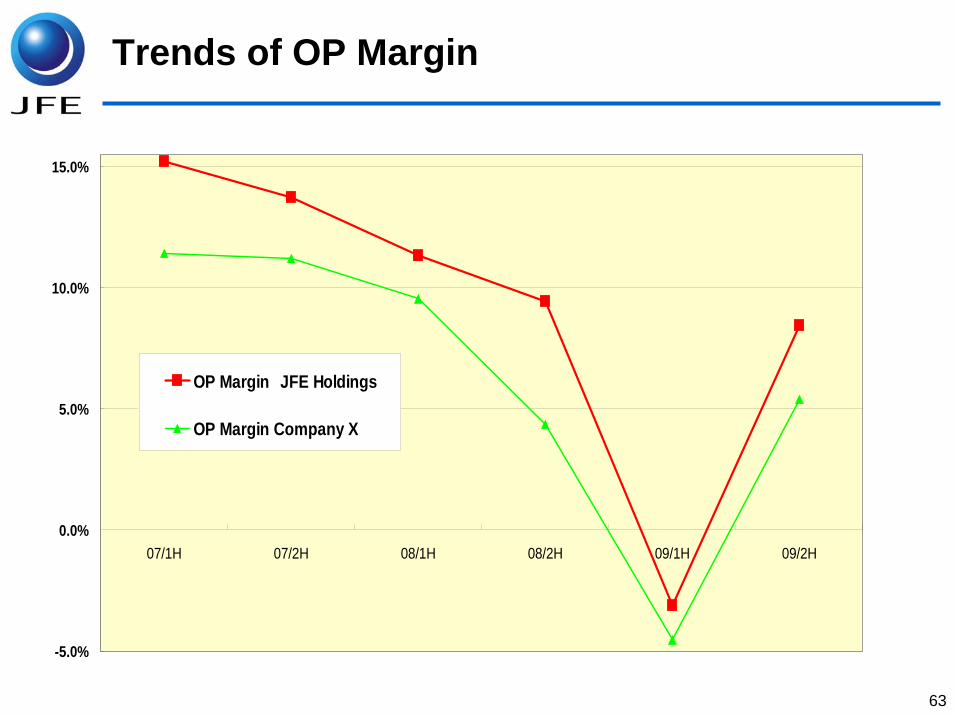
Trends of OP Margin
-5.0%
0.0%
5.0%
10.0%
15.0%
07/1H 07/2H 08/1H 08/2H 09/1H 09/2H
OP Margin JFE Holdings
OP Margin Company X

Main Financial Data
* For hybrid bonds issued in March 2008, 75% of the 300 billion yen issue price is deemed to be capital.
FY 2003 FY 2004 FY 2005 FY 2006 FY 2007 FY 2008 FY 2009 FY 2010(e)
Main financial indicators
Ordinary income(billion yen) 218 461 517 514 503 401 69 220
ROS 8.8% 16.4% 16.7% 15.8% 14.2% 10.2% 2.4% 6.4%
ROE 15.9% 18.7% 28.6% 21.3% 17.5% 13.7% 3.3% 8.2%
ROA 6.5% 13.1% 14.6% 14.1% 13.0% 10.0% 2.2% 6.0%
D/E ratio 246.2% 149.4% 88.7% 78.6% 85.7% 132.4% 103.2% 98.0%
D/E ratio * 61.4% 98.9% 75.5% 72.2%
Shares
Net income (yen/share) 185.8 274.0 555.0 513.6 450.6 355.6 86.4 227.0
Dividends (yen/share) 30 45 100 120 120 90 20 20

Contact:Finance and Investor Relations Dept., JFE Holdings, Inc.
Koji Matsunaga (Mr.)ManagerPhone: +81-3-3597-4381E-mail: [email protected]
Hiroyuki Kuriahra (Mr.)Staff ManagerPhone: +81-3-3597-4382E-mail: [email protected]