ocean acidification - global warming’s “evil twin”
TRANSCRIPT

Ocean acidification -Global warming’s “evil twin”
h"p://rsd.gsfc.nasa.gov/rsd/bluemarble/bluemarble2000.html
h"p://www.cc.gatech.edu/~cnieto6/presenta=on/images/CoralReef1.jpg
(quote attributed to R. Feely, NOAA)
Ocean acidification -Global warming’s “evil twin”
Recap from Tuesday:
(quote attributed to R. Feely, NOAA)
• Chemical consequences of adding CO2 tothe ocean– Depleted CO3=
– Define Ω as carbonate saturation– Ω declines as CO3= declines
– pH decreases, ocean becoming more acidic– 20th century decline by about 0.1
• Biological consequences of ocean chemistrychanges– Calcification declines in certain plankton– Biosphere 2 studies
Ocean acidification -Global warming’s “evil twin”
Recap from Tuesday:
(quote attributed to R. Feely, NOAA)Hoegh-Guldberg et al. 2007
CO2 increasing in oceanand atmosphere
IGBP Global ChangeNewsletter 73, 2008
Acidity
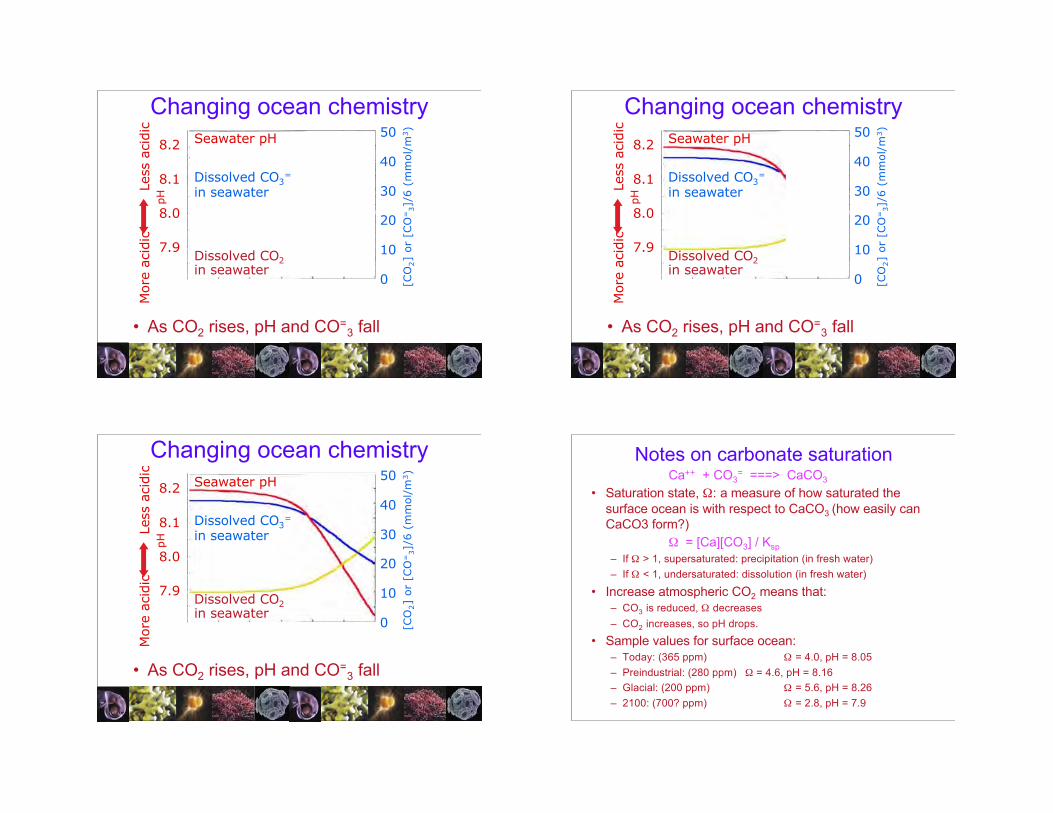
Changing ocean chemistry
• As CO2 rises, pH and CO=3 fall
1800 21001900 2000
8.2
8.1
8.0
7.9 10
50
40
30
20
0
pH
[CO
2]
or [
CO
=3]
/6 (
mm
ol/m
3 )
Year
Dissolved CO2in seawater
Seawater pH
Dissolved CO3=
in seawater
Mor
e ac
idic
L
ess
acid
ic
Acidity
Changing ocean chemistry
• As CO2 rises, pH and CO=3 fall
1800 21001900 2000
8.2
8.1
8.0
7.9 10
50
40
30
20
0
pH
[CO
2]
or [
CO
=3]
/6 (
mm
ol/m
3 )
Year
Dissolved CO2in seawater
Seawater pH
Dissolved CO3=
in seawater
Mor
e ac
idic
L
ess
acid
ic
Acidity
Changing ocean chemistry
• As CO2 rises, pH and CO=3 fall
1800 21001900 2000
8.2
8.1
8.0
7.9 10
50
40
30
20
0
pH
[CO
2]
or [
CO
=3]
/6 (
mm
ol/m
3 )
Year
Dissolved CO2in seawater
Seawater pH
Dissolved CO3=
in seawater
Mor
e ac
idic
L
ess
acid
ic
Notes on carbonate saturationCa++ + CO3
= ===> CaCO3
• Saturation state, Ω: a measure of how saturated thesurface ocean is with respect to CaCO3 (how easily canCaCO3 form?)
Ω = [Ca][CO3] / Ksp– If Ω > 1, supersaturated: precipitation (in fresh water)– If Ω < 1, undersaturated: dissolution (in fresh water)
• Increase atmospheric CO2 means that:– CO3 is reduced, Ω decreases– CO2 increases, so pH drops.
• Sample values for surface ocean:– Today: (365 ppm) Ω = 4.0, pH = 8.05– Preindustrial: (280 ppm) Ω = 4.6, pH = 8.16– Glacial: (200 ppm) Ω = 5.6, pH = 8.26– 2100: (700? ppm) Ω = 2.8, pH = 7.9

More on carbonate saturation state
• Nearly always positive, sowhy worry?– Organisms appear to care
about degree ofsupersaturation: calcdecreases even though Ω > 1
– Expanding regions where Ω <1 means inorganic dissolutionregions are growing.
• Calcification reduced underlower saturation state– coccoliths and other plankton
(90% of current calc), reeforganisms (10% of currentcalc)
Biological consequences: calcification• Many calcifying taxa (and two reef mesocosms*) have
been investigated• Most show decreased calcification• Range from 0-50% decrease (most 15-30%) under
doubled CO2
* Mesocosm: a controlled artificial reef system - e.g. Biosphere 2 ocean
Coccoliths• Visible from space in
large blooms• Chalky areas
http://www.nhm.ac.uk/nature-online/virtual-wonders/vrcocco_ehux.html
Examples of skeletal weakening
• CoccolithsNormal Exposed to seawater
low in CO=3
Riebesell et al. 2002

Examples of skeletal weakening• Coccoliths: calcification declines with
increasing CO2
pCO2 (ppmv)
Increasing pCO2 (ppmv)
Incr
easi
ng c
alci
ficat
ion
rate
Examples of skeletalweakening
• Pteropods (zooplankton)
NormalPteropod shell
Doney 2006
Exposed to seawater lowin CO=
3
Upper right:http://www.ucar.edu/communications/staffnotes/0607/images/pteropod.jpg
Marinefoodweb
Phytoplankton (coccoliths)
Zooplankton(pteropods,foraminifers)
Biosphere-2 mesocosm study
• Measure of community calcification, not individuals• Reef approaches net dissolution at Ω between 1-2.5
Kleypas and Yates 2009; Langdon et al. 1999

Coral calcification and acidification
• 8-day old coral reared from larvae under different pH• Reef approaches net dissolution at Ω between 1-2.5
Cohen and Holcomb 2009
Ω = 3.7
Ω = 1
Ω = 2.4
Ω = 0.2
Naked corals….!• Normal pH: corals in
skeletons– Here, Oculina patagonica
• Acidified seawater:skeletons dissolve; coralpolyps are independent(and giant!)
• Normal pH: corals regrowskeletons
• Does this mean reefs areNOT at risk?– (no!)
Fine and Tchernov 2007, summarized in Doney 2009
Impacts in deep sea• Deeper water naturally lower in saturation
state• Even though total inorganic carbon is
higher in deep ocean, CO3 is lower• (remember – most is HCO3, not CO3)
definition: total inorganic carbon = CO2 + CO3 + HCO3
Impacts in deep sea• Deeper water
naturally lower insaturation state
• Will approachundersaturationfaster as CO2rises
• Physicaldissolution ofcarbonates
• Greater impactson deep dwellers

Impacts in deep sea
• Large changes in chemistryat depth
• Organisms sensitive tochange: if pH drops by 0.3,calcification drops:– Deep sea coral Lophelia
pertusa: 50% decline• Major species structuring deep
ocean reefs
– Pteropod Limacina helicina:28% decline
http://www.noaaworld.noaa.gov/conservation/may2009_conservation_1.html;http://www.igbp.net/documents/resources/NL-73_for-web.pdf
Organisms at riskDoney et al. 2009
34 1
6 5 1
5
Organisms/processes sensitivesummary of previous slide
Doney et al. 2009
• Calcification responses generally negativeacross taxa– Occasional exceptions: some spp may outcompete others?
• Photosynthesis responses– positive in seagrasses– Flat in other spp
• N fixation responses– Generally positive or flat
• Reproduction– Echinoderms, molluscs: negatively affected– Fish:
Diverse impacts ofacidification
• Clownfish lose ability toorient by smell– Cannot find “home”– Orient towards predators
• Sound absorption decreases(a “noisier ocean”)
• Blood acidosis, leading toreduced metabolic activity,even asphyxiation– For organisms that get O2 from
seawater
• Poorly developed larvae foroysters, other invertebrates
http://blogs.nature.com/climatefeedback/2009/02/ocean_acidification_disorients_1.html

Diverse impacts ofacidification
Gazeau et al. 2007; adapted by Oceana.org
• Oysters, mussels ,andother calcifiers reducetheir calcification rates inmore acidic seawater
Ecology of a naturallyacidified system
(volcanic CO2 in Mediterranean)
• High pH:– Abundant calcifiers– Low non-calcifying algae
(seaweed)
• Low pH:– Calcifiers disappear– Fleshy algae dominate
• Suggests substantialchanges in communitystructure when pH changes.
Hall-Spencer et al. 2005
Community changesthrough predator-prey
interactions
• As thinshelled clams becomeless abundant, eiders eat otherspecies
• More work to eat these?• Second spp has a new threat?• What happens as acidification
proceeds and threatens widerbase of prey species?
Fabry et al. 2009
Ocean acidification• Depends on chemistry
(atmospheric CO2), notclimate– “geoengineering”
methods that coolclimate do not addressthis problem
• CO2 sequestration indeep ocean willworsen this problem
Carbon sequestra=on strategies
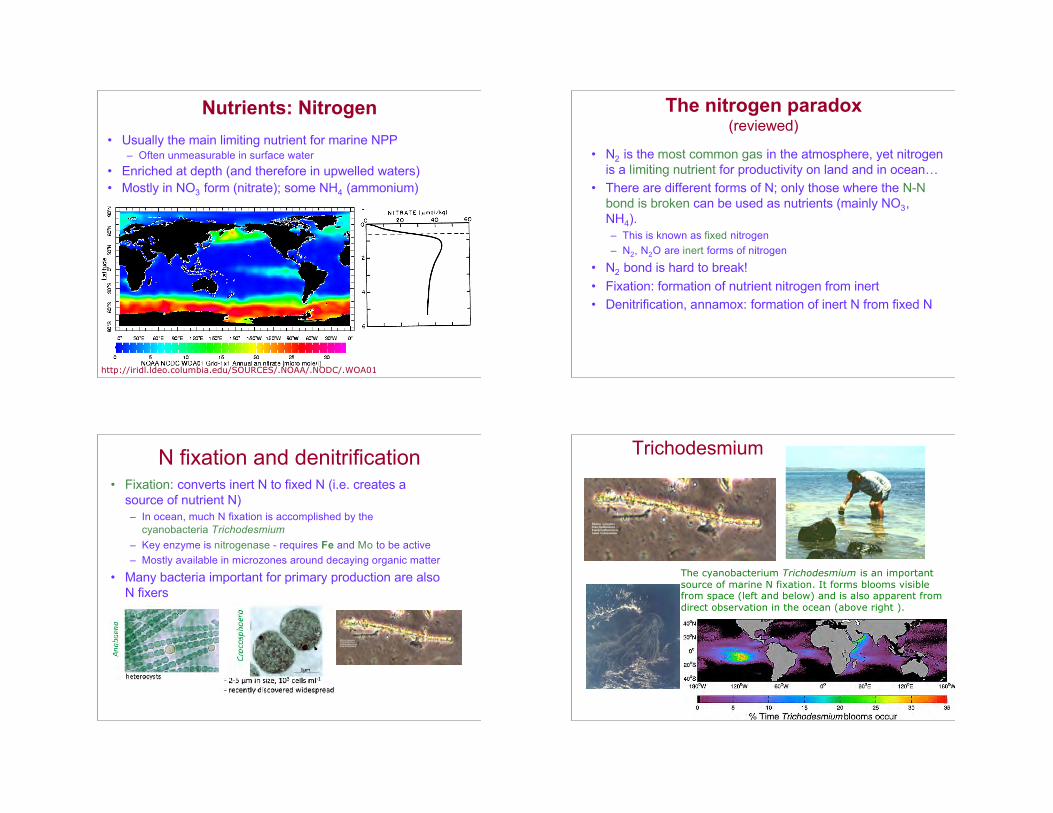
Nutrients: Nitrogen• Usually the main limiting nutrient for marine NPP
– Often unmeasurable in surface water• Enriched at depth (and therefore in upwelled waters)• Mostly in NO3 form (nitrate); some NH4 (ammonium)
http://iridl.ldeo.columbia.edu/SOURCES/.NOAA/.NODC/.WOA01
The nitrogen paradox(reviewed)
• N2 is the most common gas in the atmosphere, yet nitrogenis a limiting nutrient for productivity on land and in ocean…
• There are different forms of N; only those where the N-Nbond is broken can be used as nutrients (mainly NO3,NH4).– This is known as fixed nitrogen– N2, N2O are inert forms of nitrogen
• N2 bond is hard to break!• Fixation: formation of nutrient nitrogen from inert• Denitrification, annamox: formation of inert N from fixed N
N fixation and denitrification• Fixation: converts inert N to fixed N (i.e. creates a
source of nutrient N)– In ocean, much N fixation is accomplished by the
cyanobacteria Trichodesmium– Key enzyme is nitrogenase - requires Fe and Mo to be active– Mostly available in microzones around decaying organic matter
• Many bacteria important for primary production are alsoN fixers
Trichodesmium
The cyanobacterium Trichodesmium is an importantsource of marine N fixation. It forms blooms visiblefrom space (left and below) and is also apparent fromdirect observation in the ocean (above right ).

Loss of fixed N• Denitrification: converts NO3 to N2
(i.e. removes nutrient N)– In ocean, performed by
Pseudomonas bacteria– Requires anoxic environment;
occurs in O2 minima zones atdepth and in seds where O2depleted by decay
• Anammox (anaerobic ammoniumoxidation): Converts NH4 to N2 -also removes nutrient N– Not recognized until mid-90’s– Potential for large amount in ocean
anoxic regions
Is N cycle in balance?Does fixation balance loss?
Gruber and Sarmiento, Global Biogeochem. Cycles 1997
Marine N cycleWhat controls N in surface ocean?
“it may soon be time to start rewriting the textbooks”--Capone and Knapp, Nature 445, 2007
DECAY
SINKINGPARTICLES
PRIMARYPROD.
Duce et al. 2008
• Large increases sincepreindustrial
• Expect to accelerateregionally
• Large changes in oceanproductivity?
Duce et al. 2008Ratio of fluxes in 2030 compared to 2000
Reactive N deposition Is the picture complete? NO…
• Marine N budgets are not known to within20-50%
• Are fixation and loss processes in balance?Are they related?– May occur in same places
• What are basic controls on fixation anddenitrification?

Ocean phosphate• Most marine productivity relies on recycled PO4
– From decay of organic material in photic zone
• “New” PO4 sources:– upwelling– atmospheric dust– rivers
• PO4 sink (loss) is via burial in sediments
• May be limiting in some parts of the ocean– E.g. subtropical N Pacific: warming ocean becoming more stratified,
N fixing bacteria more abundant so N is more available, but noincrease in PO4.
– Is it a major limitation on N fixers?
Phosphate in the ocean
From NOAA’s World Ocean Atlas (2001), available athttp://iridl.ldeo.columbia.edu/SOURCES/.NOAA/.NODC/.WOA01/
Nutrient maps• If N is limiting (and P also
rare), why are theymeasurable anywhere?–Biological pump does notoperate at full potential!
• Other limiting factors cancome into play:–Grazing?–Intense vertical mixing -brings waters below photiczone with nutrients intact
–Other trace nutrients arelimiting (Fe) or co-limiting
PO4
NO3