oecd survey on knowledge management german pilot study Œ ... · livers additional results that can...
TRANSCRIPT

OECD Survey on Knowledge Management
German Pilot Study � Key Results andBullet Points for Discussion within the OECD Group
Focused Summary � Draftdo not quote
Jakob Edler1
Fraunhofer Institute for Systems and Innovation Research, Karlsruhe
March 2002
Content
In a nutshell ......................................................................................................... 3
Purpose 3
Methodology ....................................................................................................... 3
Tendencies in the Data: OECD Core Study........................................................ 4
Tendencies in the Data: Main Results of the German Add-on ........................... 5
Comments and Major Recommendations ........................................................... 6
1. Introduction: Context and Scope...................................................... 8
2. Methodology of the German Pilot Study: ........................................ 9
3 Usage of Knowledge Management Practices................................. 123.1 Practices currently in use................................................................ 123.2 Knowledge Management Practices not asked for? ........................ 14
3.2 Reasons to Introduce KM Practices ............................................... 14
3.3 Effectiveness of KM....................................................................... 17
3.4 Measurement of Effectiveness ....................................................... 18
1 Indispensable support with the statistical analysis was provided by my colleague Rainer Frietsch,
Fraunhofer ISI.
2
3.5 The Relation between Use of, Reasons for and Effects ofKM Practices .................................................................................. 19
3.5.1 Use of and Reasons for KM Practices............................................ 193.5.2 Use and Effectiveness of KM Practices ......................................... 203.5.3 Reasons for and Effects of KM Practices....................................... 213.5.4 Methodological Comment on Relations......................................... 22
3.6 Responsibility for KM Management.............................................. 22
3.7 Sources that Triggered Introduction of KM................................... 23
3.8 Budget for KM ............................................................................... 23
3.9 Resistance....................................................................................... 24
3.10 Reasons to Increase or Introduce KM ............................................ 24
3.11 Concluding Comments on Content and Technical Aspects ........... 243.11.1. Content ........................................................................................... 243.11.2 Some Technical Aspects ................................................................ 25
4. The German Add-on....................................................................... 27
4.1 Analysing the Absorption of External TechnologicalKnowledge:Aims and Rationale..................................................... 27
4.2 Key Results of Additional German Questions ............................... 28
4.2.1 Some Additional Characterisations of the Companies................... 28
4.2.3 The Importance and Sources of External (Technological)Knowledge ..................................................................................... 28
4.2.2 The Management of External Technological Knowledge.............. 29
4.3 General Comments on the German Add-on................................... 31
Annex 1: Preliminary List of Hypotheses...................................................... 33
Annexes
Annex 1: List of HypothesesAnnex 2: The German QuestionnaireAnnex 3: Correspondence Table: Core Questionnaire - German Add-on
Appendices:
Appendix A: Charts Core questionsAppendix B: Charts German add-on questions

3
In a nutshell
Purpose
This report contains the analysis and conclusions of the German pilot study con-ducted in the context of the OECD initiative to analyse knowledge management inindustry. The purpose of the pilot study is to test a questionnaire that was developedin the OECD expert group conducting the study. This report summarises tendenciesin the data on the basis of that questionnaire and gives some comments and recom-mendations for the possible improvement of the questionnaire.
The German pilot study had an add-on section focused on the detection, absorptionand integration of external "technological" knowledge � as opposed to knowledgeon market participants, clients or organisational features etc. While this add-on de-livers additional results that can stand alone, it enables also a further differentiationand deeper understanding of some major aspects of the core study as well. In thesecond section (chapter 4) this report summarises the results of the add-on as well.
Methodology
For the German pilot study, 400 companies from four traditional sectors chemistry,mechanical engineering, electronics/electrical engineering and vehicles were ran-domly selected and received a questionnaire. While in the main OECD study theservice sector should be included as well, this selection was based on the special fitfor the German add-on. 53 questionnaires were sufficiently filled in, the responserate is 13.25%. The responding sample was distributed very unevenly across sec-tors, but as regards size the distribution was rather even, allowing for sound differ-entiation in the dimension size. Furthermore (coming from the add-on section), 54%of the companies had an R&D department, and 55% were innovators (more than10% turnover with products introduced within the last 3 years). This also enabledsome differentiation as to innovative and R&D active companies.
In addition to the analysis of the questionnaires, six telephone interviews (ex post)were conducted with responding companies, the results of which are included in thecomments sections.
The statistical analysis at this stage is mainly descriptive, however, a list of 42 hy-potheses has been drawn up (annex 1) that were all tested with various statisticalmeasures. At this stage the results are not satisfactory for the majority of hypothe-ses. A higher responding number, however, will enable differentiated analysis of thequestionnaire.
4
The German pilot questionnaire is given in annex 2, accompanied by a table of cor-respondence with the OECD core questionnaire (annex 3). In addition, appendices 1and 2 give the relating figures for the data interpreted in this report.
Tendencies in the Data: OECD Core Study
Practices currently in use: all in all, practices of a more operational mode are morecommon than strategic activities (strategies, leadership, incentives), while incen-tives in the context of KM are the exception. While written KM strategies are notvery common, companies claim to have appropriate value systems. Acquiring ex-ternal knowledge seems to be the most common KM activity, followed by commu-nication measures (database, intranet) and training/mentoring. Big companies aremore likely to have a whole range of KM activities and to have some kind of ex-plicit or conscious KM strategy. Companies in which top management is responsi-ble and companies which are strong innovators, respectively which are active inR&D (this information stems from the German add-on) use KM practices more in-tensively and broadly. As a result of the question about activities not asked for, itseems that a more differentiated look at electronic devices (intranet etc.) would beworthwhile.
Reasons to introduce KM: overall, the three most important reasons are competi-tiveness, efficiency in production and protection from loss of knowledge. The leastimportant reasons are enabling collaborative work across distances and the sharingof knowledge with external partners. However, the variance of the reasons to useKM is very low, which might have methodological reasons, as the scale is onlyranging from 1 to 4 and all reasons are somewhat important for management activi-ties in general. Therefore, the differentiation according to size or other variablesalso results in low differences, with big companies indicating slightly higher valuesalong the whole set of reasons. Reasons were intellectually clustered in four differ-ent sets (internal knowledge integration, external knowledge interfaces, operativereasons, strategic reasons), however, variance remains low.
Effectiveness of KM: the most important effect is the improvement of worker skills,the adaptation of products and avoidance of duplicated R&D. There is no clear ten-dency as to what kind of effects are especially important. By the same token, thedifferences in size, top management responsibility or innovation activity withinfirms is negligible. Clustering the numerous variables intellectually into the samefour clusters as for reasons above, the effects are highest for "internal knowledgeintegration". Bigger companies also have high values for the improvement of "ex-ternal knowledge interfaces".
5
Measurement of effects: only a minority of companies measure effects and there isno single measurement practice that stands out. Interviews conducted confirm diffi-culties to grasp effectiveness methodologically.
Relations between use of, reasons for and effects of KM practices: for the variablesin question 1, 3 and 4 three correlation matrices have been tested, both for all vari-ables (question 3 and 4) and � in order to get more aggregated results - for the clus-ters of variables. While there are some correlations at this stage already that neednot be further interpreted here, a higher number of respondents will certainly deliverinteresting results at a later stage. What is striking looking at the correlation of thepractices (question 1) with the aggregate of all effects is the significant correlationof practices of knowledge capture and training/mentoring on the one hand with thetotal aggregate of effects on the other hand.
In slightly more than 50% of all companies the top management is responsible forKM, with negative correlation for size of the companies, since in big companiesKM is a sub-field of some other function (e.g. HRM). Therefore, it is not surprisingthat the management itself is the most important triggering source. As for budgetfor KM; the companies had difficulties to define one, only 29% indicated to have adedicated budget. Resistance to KM is generally very low, management being men-tioned most often. As for a possible increase or introduction of KM, the need tocontrol and retain the tacit knowledge of the company�s workforce would be theprime motivation.
Tendencies in the Data: Main Results of the German Add-on
The importance of external technological knowledge is rated to be very important (abit lower than internal knowledge, though), and in the future the vast majority ofcompanies expects it to become even more important. 70% of the companies occa-sionally use external technological knowledge, 15 % do this often.
Reasons to procure external technological knowledge: the major reason to procureexternal technological knowledge is speed and lack of in-house capacity. Innovativecompanies are more aware of the fact that their in-house capacity is too special andtoo expensive in order to generate knowledge to be absorbed from outside.
Importance of sources and instruments for capture: the classical codified sources(journals etc.) are still the most important sources, followed by interactive events(fair etc.) and Internet. Direct contacts with external experts is � across the board �less important for smaller companies (exception: Fraunhofer institutes and the like).As for instruments, beyond finding access to written documentation, vertical co-operation with market partners is the most important activity to absorb externaltechnological knowedge. Small companies seem to be disadvantaged, they do not
6
hire expertise and are not able to co-operate as intensively as bigger ones do, al-though they rate the importance of external technological knowledge as highly asbigger ones.
Definition of demand and supply: although external knowledge sourcing is impor-tant, only a third of the companies actively seek to define demand and supply for it.Interestingly, innovative companies are much more keen to do so than non-innovators. However, the majority of companies indicates plans to install a unit totake care of external technological knowledge in the future.
Information on external technological knowledge: the level of information on theknowledge provided by the public sector is significantly higher than on knowledgecoming from the private sector. Half of the sample indicate knowing the supplyfrom that source, again, bigger companies know more than smaller ones, and inno-vators (59%) know more than non-innovators (30%).
Obstacles for absorption: by far the most important obstacle is the fear of losingsensitive internal knowledge. For the whole range of obstacles, bigger companiesindicate higher values than smaller ones.
Comments and Major Recommendations
Following bullet points are some major conclusions for the German pilot study re-garding content:
- From the responses and the discussion with a couple of respondents it can beconcluded that, all in all, the questionnaire covers the range of KM very well.Since � like in all surveys � many companies have many different and contra-dicting problems with the questionnaire, the main problem seems to be to makecompanies fill in the questionnaire even if some (many) things are not extremelyrelevant for them. Here the accompanying letter is extremely important.
- The definition given seems to be understandable for the companies and �equally important � makes respondents think more broadly about their knowl-edge management than they would do without a definition or without a coupleof examples.
- The clusters given in question 1 seem sensible, they could be amended withmore detailed variables on IT measures, though.
- Questions 3 and 4 are crucial and, as far as the interviews and written commentsare concerned, cover all relevant aspects, no respondent asked to have additionalvariables (except for negative ones, see below). They give a mixture of variablesthat can be clustered in related families or factors. In order to avoid question or-der effects it seems functional that these variables are separated. However, onecould think of defining intellectual clusters to use for analysis in all countries.
7
- The questions on the characterisation of companies should be expanded tosome degree in order to sharpen analysis (e.g. part of a company group).
- Furthermore, beyond the question of resistance to KM, the questionnaire fullyignores the problem dimension, a sub-questions on drawbacks could be added.
- Budget is hard to define for companies, it should be clearer what we are askingfor (dedicated and labelled KM budget, or expenses for KM measures?).
As for the German add-on:
- The add-on questions are important for those interested in the external interfacesof KM.
- Some company characterisation as well as a set of hypotheses would furtherimprove the possibilities of analysing the core questions (especially for use ofpractices, reasons and effects).
- However, it remains to be seen how relevant these questions are in the servicesector.
As for methodology, the following is recommended:
- A separation of answering categories "do not know/not applicable" into �not inuse/not planned� and �do not know� would ease answering and analysing alike.
- In contras, the division �before 1999� and �since 1999� could be kept in orderto identify the dynamics of KM, it would be worthwhile to consider blurring thetime line ("in the last two to three years" instead of 1999).
- For statistical reasons and for the sake of uniformity in different languages, thescale for the questions asking for "importance" should be changed to a five- orseven-step scale, and only the extreme poles should be labelled.
- The question remains open how to try to detect the effects of KM better, beyondthe self-estimate.
8
1. Introduction: Context and Scope
The OECD has launched an initiative to conduct comparative studies in membercountries in order to learn about the existence, dynamics and effectiveness ofknowledge management practices in the private sector, and in order to systemisethese practices and their measurement. To do so, a group of country representativesfrom ministries and research bodies has been formed that aims at the formulation ofa core questionnaire to be used in each of the participating countries in the course of2002.
Since the analysis and measurement of knowledge management is a rather new ex-ercise, there is little knowledge available about how to design and conduct empiri-cal work in this field. In order to reduce this knowledge gap and to design a ques-tionnaire as relevant, reasonable and operational as possible, the group has decidedto conduct a few pilot studies, the results of which will be discussed in a groupmeeting in spring 2002. Researchers from three countries (Canada, Denmark, Ger-many) have volunteered to conduct these studies.
This report is the summary of the German pilot study conducted in autumn andwinter 2001/2002 by the Fraunhofer Institute for Systems and Innovation Research,Karlsruhe. This pilot study � as well as the main study later on � has been madepossible by the Donors� Association for the Promoting of Sciences and Humanitiesin Germany who fully fund it, and by the willingness of the German Federal Minis-try to officially support it.
This report has the character of a draft and is meant to be an internal basis for dis-cussion within the OECD group in the meeting at Karlsruhe, on March 25/26. Inorder to minimise redundancies within the group � and given the fact that the mem-bers of the group are well aware of the purpose of the whole endeavour as well as ofthe concepts, definitions and the core questionnaire used � this report exclusivelyfocuses on the characteristics and results of, as well as the conclusions from, theGerman pilot study.2
The structure of the report derives from this main purpose. In the following chapterthe operational details of the German pilot study are shortly introduced. This is fol-lowed by a presentation of the results of core questions, mainly based on descriptivestatistics. Since the number of respondents is somewhat limited in the German pilotstudy, so are the possibilities for more elaborate statistical analysis. However, some
2 Those readers who feel the need to put this pilot into the group context and to re-fresh the con-
cepts and definitions used will find all this in the excellent Danish summary report by WencheStrømsnes from the Center for Ledelse in Kopenhagen and the very detailed work by the Canadi-an group led by Louise Earl (StatCan) as well as in the report of the group meeting in Paris inummer 2001.

9
thoughts on possible analysis for the main study are presented. The key results areaccompanied by comments on the possible improvement of the questionnaire, basedon the analysis as well as written comments and comments given by a series of expost telephone interviews. Chapter four presents the additional analysis of a seriesof questions that were of special interest both for the supporters as well as the ana-lysts of the German pilot study. This is based on the possibility opened up by theOECD study group to add on questions to the common core questionnaire that areof a special interest to the country experts and funders. Therefore, the German pilotstudy added a series of questions relating to the management of (technological)knowledge external to the organisation. The report concludes with a summary ofrecommendations and some more general remarks.
In annex 1 at the end of this report there is a list of hypotheses given that indicateswhat kind of statistical and intellectual analysis could be done on the basis of thisquestionnaire. In addition, the German questionnaire and a list of amendments to itis given (Annex 2 and 3). The appendix gives the figures both for the Core Study(Appendix A) and the German Add-on (Appendix B).
2. Methodology of the German Pilot Study:
Sample:The German pilot study covers four sectors of traditional industries:
- Chemicals (Nace 24)- Mechanical Engineering (Nace 27-29)- Electronics/Electrical Engineering (Nace 30-32)- Vehicles and Transport Equipment (Nace 34-35)
It is obvious that this choice does not fully cover all sectors of interest; especiallythe service sectors are not represented and should be included in the main study.This choice for the pilot study was guided by the special interest in the German add-on section (see below, chapter 4), that is more relevant for traditional industry. Inaddition, this choice enables a cross comparison with existing studies with relatedtopics.3
For each sector 100 companies were randomly selected from the most comprehen-sive German company database Hoppenstedt.4 In early January, 400 questionnaires
3 However, this cannot be dealt with in this summary report.
4 Moreover, the selection of companies had to be compared with the sample of a large scale surveydone by the Fraunhofer ISI a year ago in order to minimise overlap in the field.
10
were sent to the companies. A reminder was sent by normal mail in early February.Altogether, 53 companies replied in a way that enabled analysis. 10 companies in-dicated that the questionnaire was not relevant for them, mainly because they weretoo small. A few indicated lack of time to answer. The overall response rate is13.25%, which is not fully satisfactory, but compared to similar surveys conductedin Germany (e.g. Community Innovation Survey), the response rate is much better.5
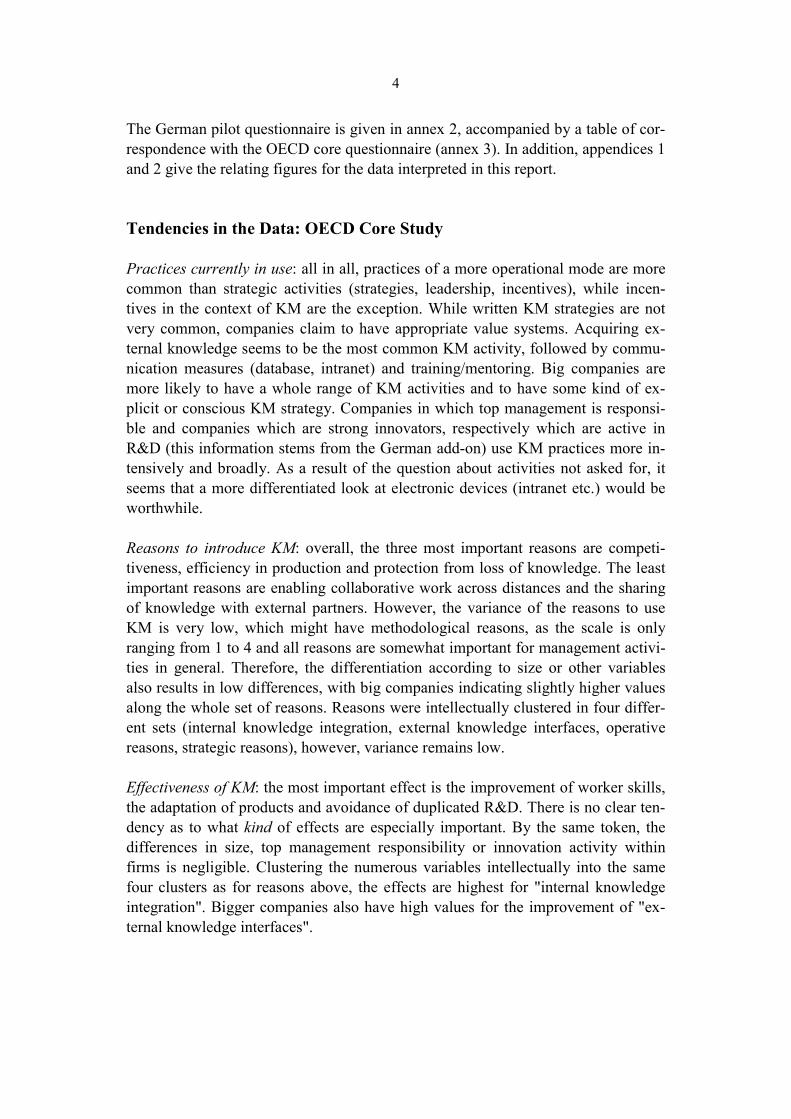
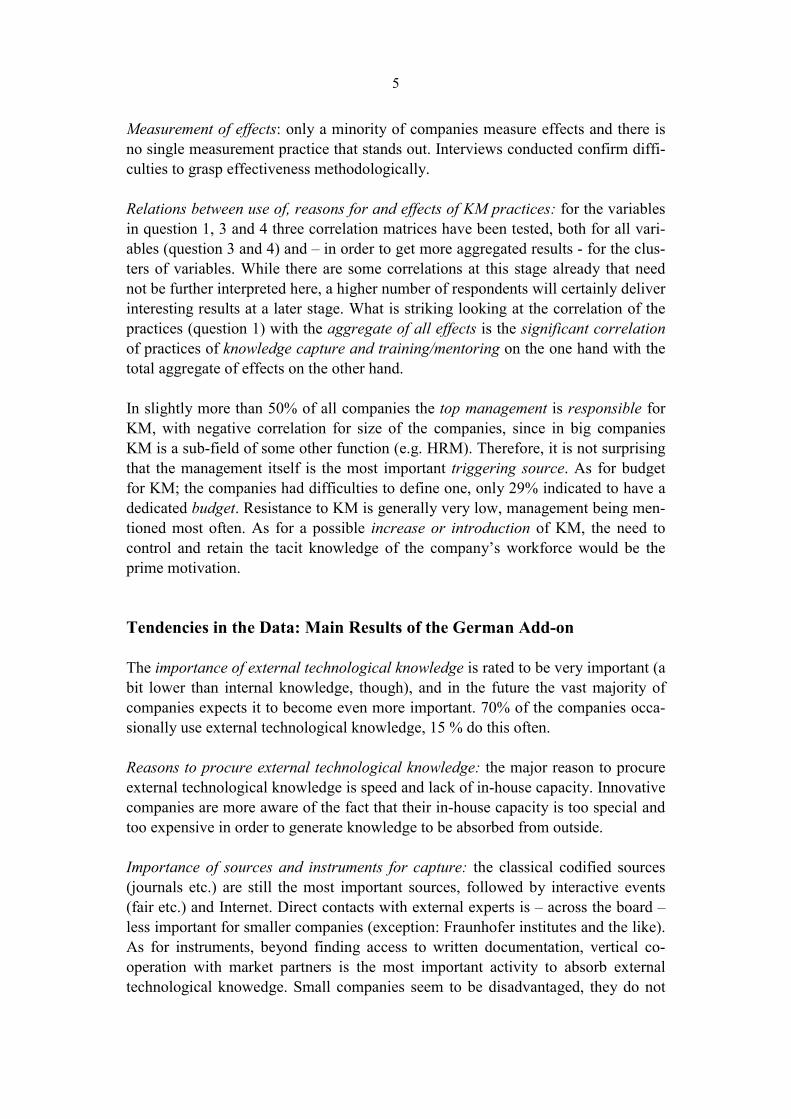
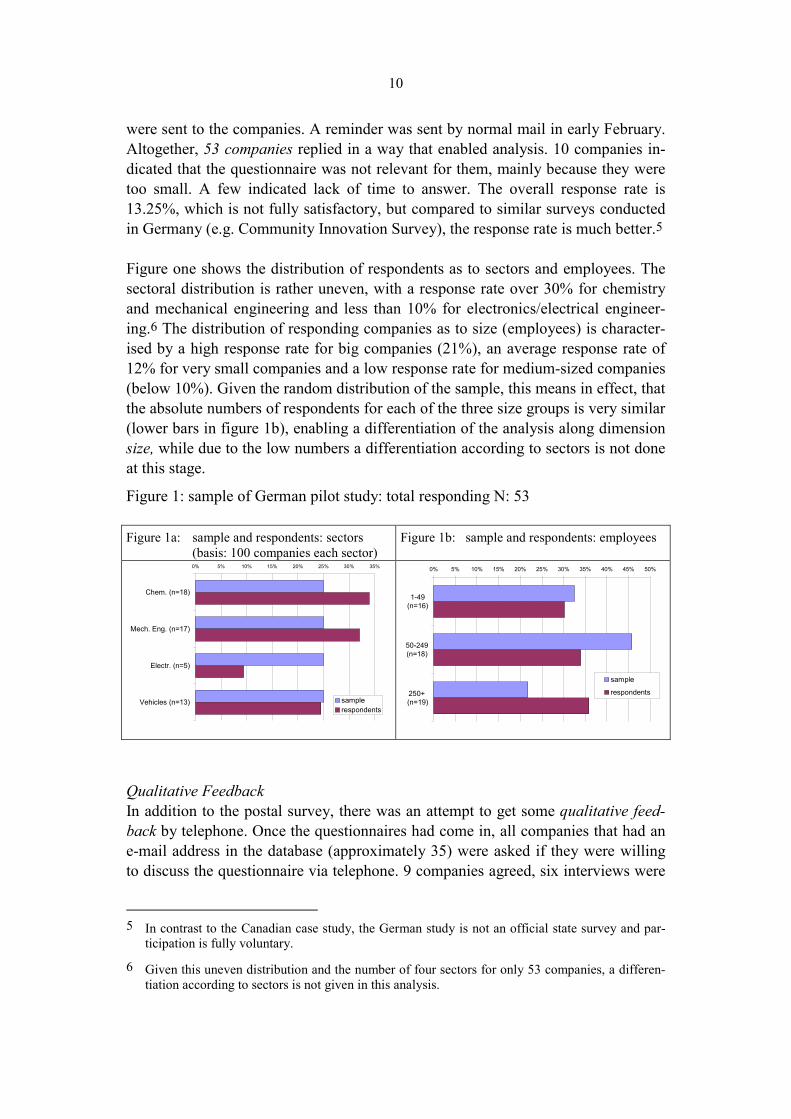
Figure one shows the distribution of respondents as to sectors and employees. Thesectoral distribution is rather uneven, with a response rate over 30% for chemistryand mechanical engineering and less than 10% for electronics/electrical engineer-ing.6 The distribution of responding companies as to size (employees) is character-ised by a high response rate for big companies (21%), an average response rate of12% for very small companies and a low response rate for medium-sized companies(below 10%). Given the random distribution of the sample, this means in effect, thatthe absolute numbers of respondents for each of the three size groups is very similar(lower bars in figure 1b), enabling a differentiation of the analysis along dimensionsize, while due to the low numbers a differentiation according to sectors is not doneat this stage.
Figure 1: sample of German pilot study: total responding N: 53
Figure 1a: sample and respondents: sectors(basis: 100 companies each sector)
Figure 1b: sample and respondents: employees
0% 5% 10% 15% 20% 25% 30% 35%
Chem. (n=18)
Mech. Eng. (n=17)
Electr. (n=5)
Vehicles (n=13) samplerespondents
0% 5% 10% 15% 20% 25% 30% 35% 40% 45% 50%
1-49(n=16)
50-249(n=18)
250+ (n=19)
sample
respondents
Qualitative FeedbackIn addition to the postal survey, there was an attempt to get some qualitative feed-back by telephone. Once the questionnaires had come in, all companies that had ane-mail address in the database (approximately 35) were asked if they were willingto discuss the questionnaire via telephone. 9 companies agreed, six interviews were
5 In contrast to the Canadian case study, the German study is not an official state survey and par-
ticipation is fully voluntary.
6 Given this uneven distribution and the number of four sectors for only 53 companies, a differen-tiation according to sectors is not given in this analysis.
11
finally realised by mid March. These comments are included in the comments sec-tions of the results.
Core Questionnaire � German Add-onRegarding the questions of the core questionnaire, the German pilot study has usedthe final version that was the result of the Paris group meeting and was � after somepolishing by Louise Earl from StatCan � used for the Canadian pilot study. Withinthis core questionnaire, no changes were made in the formulation of the questions7,the order of sub-questions within a block of questions, or the answering categories.The only changes in fact have been add-on questions. The numbers of the questionsthat are given in this report relate to the German questionnaire, which is given inAnnex 2. Annex 3 gives a table of correspondence with the original core question-naire.
Merit of Descriptive Analysis at this StageThis chapter presents some tendencies in the data based mainly on a descriptiveanalysis and some comments derived from these analyses, as well as from writtenand oral comments by respondents. This discussion serves three purposes:
(1) to indicate tendencies in the data,(2) to get a "feeling" for the kind of analysis that could be done and the kind of in-
formation we will get with the main study later on,(3) to improve the questionnaire for the main study.
DifferentiationIn addition to the aggregated data - and only in those cases where significant resultscan be seen - the questions are further differentiated along three dimensions (thefigures relating to this discussion are given in the appendix to this report):8
- size,- responsibility within the company (top management yes/no) respectively- the innovative activity (innovators vs. non-innovators) of companies, respec-
tively R&D activists and non-activists. This last distinction stems from a Ger-man add-on question. 9
7 That means that the translation tried to capture the English meaning as accurately as possible.
8 There is obviously some correlation between these three dimensions: size and top managementresponsibility are both (weakly) positively correlated with innovation activities, while size andtop management responsibility are weakly correlated in a negative direction.
9 Asked for the share of turnover with new products, 55% of the sample indicated to have obtainedmore than 10% of their turnover in 2001 with products that were newly introduced or remarka-bly improved within the last three years. This group is defined as �innovators�.

12
Re-aggregation through ClusteringIn order to derive more aggregated interpretation on the reasons and effects of KMpractices (questions 3 and 4), an attempt was made to cluster the numerous vari-ables intellectually and use aggregated mean values for descriptive analysis Thismakes it easier to handle correlations and more sophisticated analysis in a secondstep. With a higher number of respondents, this clustering could/should be donethrough a factor analysis to detect �types� of reasons and effects.
HypothesesIn addition to this descriptive analysis, a list of hypotheses has been formulated. It isgiven in Annex 1. Again, these serve the purpose of indicating what kind of infor-mation can be drawn from this questionnaire. A statistical test for all of these hy-potheses has been conducted, however, in most cases the number of respondents istoo low for significant results. Anyway, some results of the tests are included in thetext. Most importantly, these hypotheses serve as a basis for the analysis of the mainstudy later on.
3 Usage of Knowledge Management Practices
3.1 Practices currently in use
General tendencies: as to the use of KM practices (question 1), it is obvious thatpractices of a more concrete, operational mode (capture and acquisition, trainingand mentoring, communications) are far more widely-used than strategic practices;figure A1 in the appendix shows far higher average values for the various practicesin the more operational dimensions than in the more strategic dimensions. However,although KM practices are widely used operationally, incentives to promote the useof KM measures are still not very common.
Highlights of individual practices: when looking at the various practices within thestrategy/policy dimension in detail (figure A2), it appears that KM is not an objectof clear strategic and codified (written) planning yet. However, almost 40% claim tohave an appropriate value system and culture, and over 50% have retention schemesand use partnerships to acquire knowledge. As for the responsibility for KM (figureA3), it is interesting to note that KM seems to be a vague and horizontal conceptstill mainly overlooked by the top management, while distinct functionalities forKM are still the exception and are not even planned by many companies. The verylow value for "explicit criteria for assessment of workers" goes in line with the gen-erally very low values for incentive systems. While KM practices are widely used,non-monetary incentives are only in practice within a third of the companies, andnon-monetary incentives are a clear exception (figure A4). The values for the acqui-sition of external knowledge are very high for all four practices asked about (figure

13
A5). Adding both "in use" answers, the values are above 60% for all of them, withindustrial sources as the most important source. The most interesting developmentover time here is that there has been and still is a growing tendency for joint projectwork with external experts. Regarding training and mentoring practices (figure A6),the answers given show that companies have no formal or informal knowledgemanagement training as such, and do not even plan to implement it. But as soon asthey are asked for concrete KM practices, almost all companies do have trainingand mentoring practices. In this dimension, the dynamic (values for "in use since1999" or "planned") is very low. Finally, communication practices are also widelyused, and especially database management seems to be a standard tool (figure A7).
Differentiation: There are three distinct differences in the use of KM practices be-tween companies of a different size (figure A8.1). First, the big companies (morethan 250 employees) are more likely to have a distinct KM strategy and policy (al-most 40% of the big companies have a written KM strategy); second, these compa-nies at the same time have established more often KM functionalities below thelevel of top management, while small companies tend to have the sole responsibilityat the level of top management. Thirdly, small companies have much less organisa-tional capacity to draw on external knowledge sources than medium-sized or bigcompanies.
For all six dimensions of KM usage, the values are higher for those companies inwhich top management has the responsibility for KM (figure A8.2), respectivelythat are innovators (figure A8.3) or that are active in R&D (Figure A8.4). FigureA8.4 indicates the highest difference for the mean value shown in the dimensionexternal knowledge capture and acquisition for companies with an R&D departmentcompared to those without an R&D department, i.e. external knowledge acquisitionis � among other things � significantly research-driven. Some further statisticaltesting also indicates that the use of KM practices in the area of strategies/policiesand communication have a significant influence on innovative activities.
Comments on KM Definition and Practices:From the written response as well as from the telephone interviews there is no indi-cation that in general the questions are too complicated or cannot be understood.The telephone interviews indicate that the concept of knowledge management aspresented in the definition and the first set of questions can be well comprehended.Especially the explicit definition was important. Asked if a more concrete entry intothe questionnaire � as proposed by the Danish team � by giving examples of knowl-edge management or by starting off with the more operational questions the tele-phone partners denied that this was sensible. In contrast, they feared that therewould be the danger of influencing respondents and narrowing down the scope ofKM understanding.
14
One respondent indicated that for him the definition was crucial since he wouldhave answered the questionnaire much more in relation to IT KM tools (internaldatabase, intranet) rather than relating it to the broader concept, which, however, hefound equally legitimate. For example, in his personal definition, he would not haveincluded questions relating to "incentives" or "communication". Similarly, anotherrespondent would have limited KM to the management of knowledge that has beenobtained through project work, mainly in R&D projects.
Nevertheless, it must be kept in mind that the interview partners were all volunteerswith a special interest in KM-related questions or even with a special KM functionwithin their company, and very likely had a clearer understanding of KM than theaverage respondent.
3.2 Knowledge Management Practices not asked for?
Only eight out of 53 companies indicated the of use additional KM practices/ in-struments not asked for in question 1:- participation in KM project by a regional business federation- "smart hour", i.e. a regular brainstorming exercise including external experts- international project teams- innovation management (?)- standardisation- certified quality management system- internal training relating to specific products- intranet forum.
CommentsEspecially the last practice, "intranet", was emphasised in two telephone interviewsand might be considered to be more emphasised in question 1 also, possibly in thecontext of a more elaborate IT question. Moreover, as a result of telephone inter-views it seems that KM for many companies is related to one or two central instru-ments. Although the study seeks to explore the totality of KM in companies, in or-der to get a feeling for the most important tools actually in use, an additional ques-tion � just after question 1 - could be included on "your most important single toolfor KM".
3.2 Reasons to Introduce KM Practices
General tendencies: the variance in the meaning of reasons (question 3) for usingKM is not very high, almost all values are slightly above the medium value of 2.5(figure A9). Only one reason stands out, i.e. the improvement of future competi-tiveness, which should, however, be the aim of any management practice. At thelow end of meanings, it is interesting to note that the improvement of external
15
knowledge transfer gets a low value, although it has the highest level of usagewithin question 1, policies and strategies. By the same token, the improvement ofcollaboration with external experts has the lowest value of all reasons, but is awidely-used practice (question 1).
Differentiation: the difference in the significance of reasons relating to differentcompany size is also rather small. Only the big companies play a somewhat specialrole, they have higher values than medium-sized and smaller companies in almostall reasons, especially for the improvement of collaboration within alliances, re-spectively among physically separated teams and for the retention of workers (fig-ure A10). The influence of the dimensions Top management responsibility and In-novators are negligible here.
Further aggregation: since the reasons represent rather different dimensions, and inorder to further statistically analyse and connect this question to other variables(size, top management responsibility etc.) without becoming too complex, it ap-pears sensible to cluster the variables by factor analysis and/or intellectually. Afactor analysis was conducted, since the number of respondents is rather small andthe categories used (1 to 4) are not very differentiated, the results of the factoranalysis are not discussed here.10 Still, in the main study a factor analysis approachin questions 3 (and 4) would make sense.
Intellectually, four clusters of reasons were constructed that were used for furthercalculations.11 It is of course open for discussion if the following clustering makessense:
Internal Knowledge IntegrationB) to help integrate knowledge within your firm or organisationF) to protect your firm or organisation from loss of knowledge due to workers' de-
parturesJ) to identify and/or to protect strategic knowledge present in your firm or organisa-
tion
External Knowledge InterfacesC) to improve the capture and use of knowledge from sources outside your firm or
organisationD) to improve sharing or transferring knowledge with partners in strategic alliances,
joint ventures or consortia
10 For those interested, such a factor analysis resulted in the following factors: factor 1: variables B,
F, J (protection of knowledge), factor 2: H, I, L (employee related and market relations (?)), fac-tor 3: C, E (efficient (external) knowl. integration); factor 4: 4, 11 (ease co-operation); factor 5: 1,7 (strategy, competition).
11 This somehow resembles the approach in question 1, where from the beginning the questionswere clusters under six headings.
16
L) to promote sharing or transferring knowledge with clients or customers
Operative ReasonsE) to increase efficiency by using knowledge to improve production processesK) to ease collaborative work of projects or teams that are physically separated (i.e.
different work sites)
Strategic ReasonsA) to improve the competitive advantage of your firm or organisationG) to train workers to meet strategic objectives of your firm or organisationH) to increase worker acceptance of innovations
Since due to the small answering scale (1 to 4) the individual reasons show a lowvariance, so do the aggregated clusters (see comments below for a suggestion toimprove this situation). This low variance is also reflected when looking at compa-nies of different size. In general, the bigger companies show slightly higher valuesin all four clusters, especially in the cluster �internal knowledge integration� (figureA11). The differences for responsibility of top management as well as innovativeactivities are again negligible.
CommentsSince the alternatives given in this question are all more or less objectives of gen-eral management, KM also has some relevance in each of them (at least more thanthe medium value). This has also been confirmed by telephone interviews. In orderto better identify differences in significance of the various reasons, the scale shouldbe extended to 1-5 or even 1-7. This would also ease statistical analysis (e.g. factoranalysis). Moreover, only the poles should be defined as being "extremely" and "notat all" important, which would also lead respondents to implicitly attribute a metricscale between the poles. This is all the more important as the questionnaire must betranslated into many different languages and the various expressions used to indi-cate less and more importance might � unconsciously � indicate different distancesbetween the categories in each language.
One alternative to the current approach would be to ask the respondents for rank-ings of the three or five most important reasons. However, in order to do so, onewould have to reduce the number of (or aggregate) reasons somewhat.
Moreover, one respondent answered this question although the company onlyplanned to introduce most of the KM practices, indicating that these "reasons"would be the "aims" of a future KM activity. Therefore, one could think of re-phrasing the question and add "currently in use or soon to be introduced ...".
Finally, there is some redundancy between questions 3F ("loss of knowledge due todeparture of workers") and questions 3I ("increase worker retention)", 3F could bedispensed with.

17
3.3 Effectiveness of KM
General tendencies: the variance between the different variables for effectiveness(question 4) is higher than the one for the reasons to use KM. At the level of singlevariables, the improvement of worker�s skills is most important, followed by theadaptation of products and services and by the avoidance of duplication in R&D.The lowest values (below the medium value of 2.5) are attributed to involvement ofworkers in workplace activities, the increased ability to acquire knowledge fromexternal sources and the increase in markets. Obviously, both these most and leastimportant effects represent all very different dimensions of KM, which means thatthere is not one obvious dimension of effects most or least important.
Differentiation: size, top management responsibility and innovative activity makeno obvious difference for the effectiveness of KM on the basis of the respondingnumber 53. Figure A12 gives the answers as for size.
Further aggregation: just as for question 3 (reasons), the effect variables can alsobe clustered in order to aggregate information. A factor analysis was tried,12 how-ever, at this stage, the clusters used for analysis were constructed be done throughintellectual clustering. Following clusters can be defined (open for discussion):
Internal IntegrationA) increased our knowledge sharing horizontally (across departments, functions or
business units)B) increased our knowledge sharing vertically (up the organisational hierarchy)D) improved skills and knowledge of workersK) improved our corporate or organisational memory
External Knowledge InterfacesL) increased our ability to capture knowledge from public research institutions, incl.
universities and government laboratoriesM) increased our ability to capture knowledge from other business enterprises, in-
dustrial associations, technical literature, etc.
Operative EffectsC) improved worker efficiency or productivityI) increased flexibility in production and innovationJ) prevented duplicate research and developmentN) improved involvement of workers in the workplace activities
Strategic EffectsE) increased our number of markets (more geographic locations)
12 Results of this factor analysis: factor 1: variables G, H, I, L, M (products and external knowledge
integration); factor 2: E, F, K, N (market knowledge and organisational memory); factor 3: C, D(efficiency); factor 4: 1, 2 (knowledge sharing); factor 5: 10 (R&D).

18
F) improved client or customer relationsG) helped us add new products or servicesH) increased our adaptation of products or services to client requirements
As for the clustered effects, �Internal Knoweldge Integration� has the highest valuesfor the whole responding sample, followed by operational and strategic effects.While the top management responsibility makes no difference, size matters some-what in one cluster of effects (�External Knowedge Interfaces�), where bigger com-panies tend to have more positive effects than smaller ones (see figure A 13).Moreover, innovative companies see higher strategic effects than non-innovators.
CommentsThe variables for effect lack an operational basis, they rest solely on estimates andon the capability of respondents to isolate the KM effects from the effects of othermanagement practices. In order to facilitate this estimate � and with the same rea-soning as in question 3 - it is recommended to change the categories to a five orseven digit scale and to only label the extreme poles. Some interviewers indicatedthat the effects of knowledge management can also be partly negative (informationoverload, over-optimisation of tools etc.). Although it is not compelling to add pos-sible detrimental effects or pitfalls of KM to this question, the possibility should beconsidered of raising possible negative or problematic effects in the questionnaire.One place to do this could be the question on resistance (question 9 of the corequestionnaire, 15 in the German pilot), that could be split into �resistance� and�general problems, negative effects�.
3.4 Measurement of Effectiveness
Only 14% of the companies indicated that they measure the effectiveness of KM(question 6). The instruments mentioned were:
operative indicator analysis and quality and milestone controls, design review,audit, balanced scorecard, measurement of specific achievements (e.g. time to de-liver technical documentation) (twice), Lotus-Notes control of expert database,numbers of intranet entries.
CommentsThis is a complicated question, since KM in many companies still seems to be onefunction within different operative areas or one horizontal task of top managementamong many. Therefore, KM mostly complements traditional management activi-ties. To single out KM and to measure its success therefore is almost impossible formany companies. The same is true for the budgeting of KM (see below). In addi-tion, the operationality of effects is tricky and very dependent on the understandingand tools of KM. One respondent indicated that his unit has tried to define criteria
19
for a long time and not really succeeded. However, these difficulties necessitate tolearn more about sensible instruments and at this stage the question should be keptas it is.
3.5 The Relation between Use of, Reasons for and Effects of KMPractices
In order to determine the relationship between the use of KM practices, the reasonsfor and the effectiveness of KM, various correlation matrixes were calculated. Thecoefficients are rather low, and the results of this kind of correlation might not bevalid with only 50 respondents. Nevertheless, a first analysis on this basis gives anidea and a tendency, and it is planned to use this kind of calculation in the finalanalysis with a much higher number of respondents.
3.5.1 Use of and Reasons for KM Practices
Two correlation matrixes on the reasons to use KM practices have been calculated.For the first matrix, the answers in question one were dichotomised13 and clusteredaccording to the six groups given (average values within the possible range of 0 to1). Then they were correlated with all variables in question 3. Table A1 in the ap-pendix A shows this matrix.
The practice cluster �training/mentoring� shows three significant correlating rela-tionships. Each of four further clusters of practices have two corresponding �rea-sons� with which they show a correlation significant at the 5% level, while thecluster �knowledge capture and acquisition� shows no correlating relationship at all.The distribution of reasons showing significant correlation(s) with practices is muchmore concentrated, 8 out of 12 reasons have no correlation, whereas the �enablingof co-operation of physically separated teams� shows three correlations and �shar-ing of knowledge with external partners� has even four correlations (all correlationspositive).
In order to attain aggregated interpretation, a second, more dense matrix, was cal-culated with clustering the reasons also, using the four clusters defined above (seechapter 3.2.). Within this 24 field matrix, 5 relationships show a correlation with asignificance above 5%, distributed across only two sets of reasons: The reasonsrelating to �external knowledge interfaces� have three significant correlations, thereasons relating to �operative� motivations (efficiency etc.) have two. From the
13 In use before 1999 and since 1999 was recoded to �in use� with value 1, �planned� and �not
applicable/do not know� was recoded �not in use�, value 0.
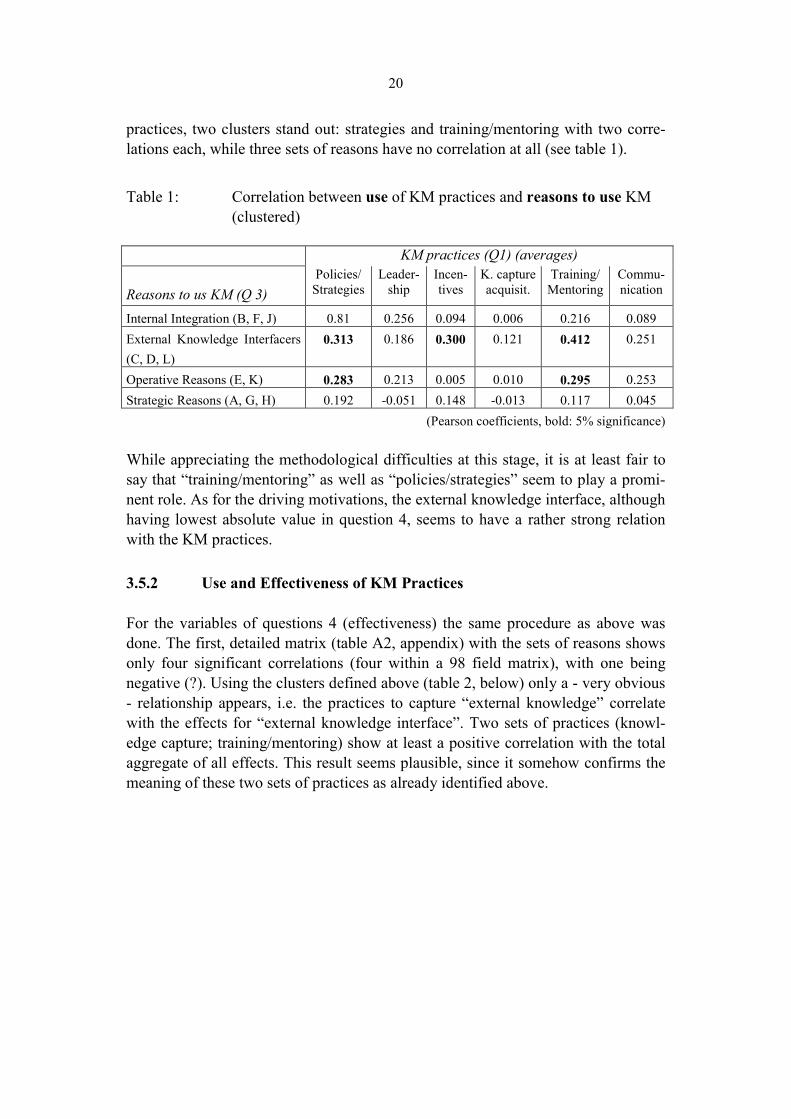
20
practices, two clusters stand out: strategies and training/mentoring with two corre-lations each, while three sets of reasons have no correlation at all (see table 1).
Table 1: Correlation between use of KM practices and reasons to use KM(clustered)
KM practices (Q1) (averages)
Reasons to us KM (Q 3)Policies/
StrategiesLeader-
shipIncen-tives
K. captureacquisit.
Training/Mentoring
Commu-nication
Internal Integration (B, F, J) 0.81 0.256 0.094 0.006 0.216 0.089External Knowledge Interfacers(C, D, L)
0.313 0.186 0.300 0.121 0.412 0.251
Operative Reasons (E, K) 0.283 0.213 0.005 0.010 0.295 0.253Strategic Reasons (A, G, H) 0.192 -0.051 0.148 -0.013 0.117 0.045
(Pearson coefficients, bold: 5% significance)
While appreciating the methodological difficulties at this stage, it is at least fair tosay that �training/mentoring� as well as �policies/strategies� seem to play a promi-nent role. As for the driving motivations, the external knowledge interface, althoughhaving lowest absolute value in question 4, seems to have a rather strong relationwith the KM practices.
3.5.2 Use and Effectiveness of KM Practices
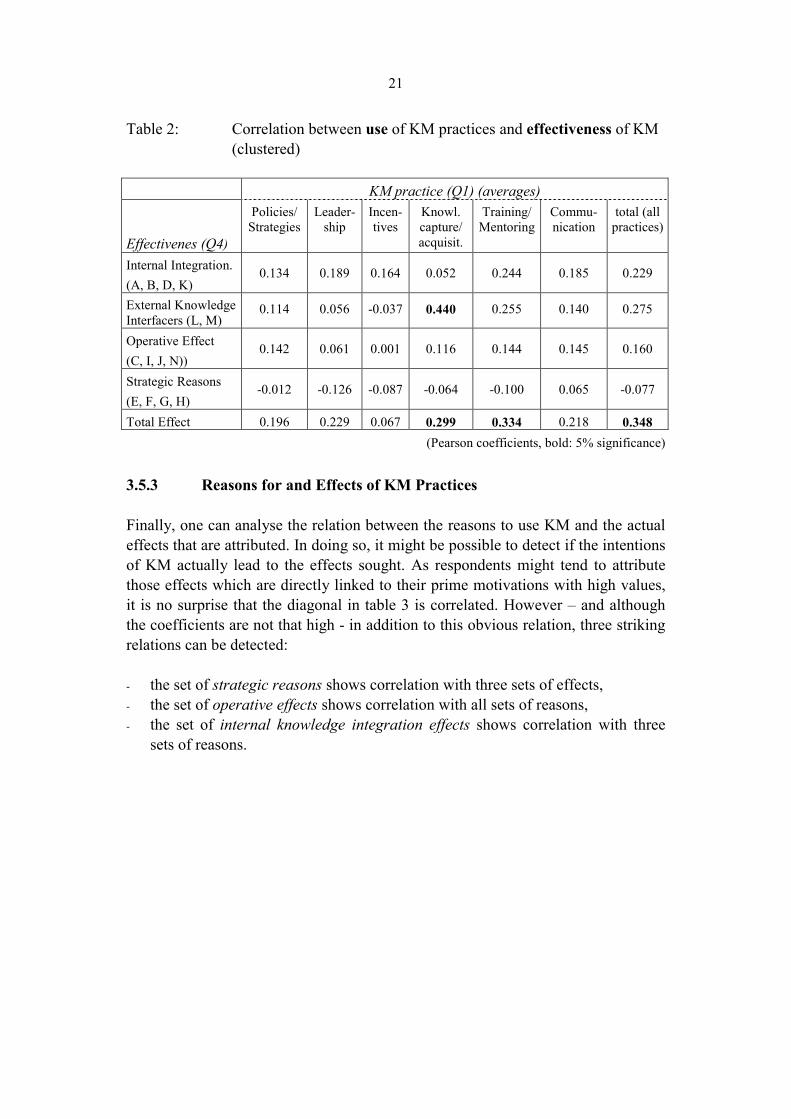
For the variables of questions 4 (effectiveness) the same procedure as above wasdone. The first, detailed matrix (table A2, appendix) with the sets of reasons showsonly four significant correlations (four within a 98 field matrix), with one beingnegative (?). Using the clusters defined above (table 2, below) only a - very obvious- relationship appears, i.e. the practices to capture �external knowledge� correlatewith the effects for �external knowledge interface�. Two sets of practices (knowl-edge capture; training/mentoring) show at least a positive correlation with the totalaggregate of all effects. This result seems plausible, since it somehow confirms themeaning of these two sets of practices as already identified above.
21
Table 2: Correlation between use of KM practices and effectiveness of KM(clustered)
KM practice (Q1) (averages)
Effectivenes (Q4)
Policies/Strategies
Leader-ship
Incen-tives
Knowl.capture/acquisit.
Training/Mentoring
Commu-nication
total (allpractices)
Internal Integration.(A, B, D, K)
0.134 0.189 0.164 0.052 0.244 0.185 0.229
External KnowledgeInterfacers (L, M)
0.114 0.056 -0.037 0.440 0.255 0.140 0.275
Operative Effect(C, I, J, N))
0.142 0.061 0.001 0.116 0.144 0.145 0.160
Strategic Reasons(E, F, G, H)
-0.012 -0.126 -0.087 -0.064 -0.100 0.065 -0.077
Total Effect 0.196 0.229 0.067 0.299 0.334 0.218 0.348(Pearson coefficients, bold: 5% significance)
3.5.3 Reasons for and Effects of KM Practices
Finally, one can analyse the relation between the reasons to use KM and the actualeffects that are attributed. In doing so, it might be possible to detect if the intentionsof KM actually lead to the effects sought. As respondents might tend to attributethose effects which are directly linked to their prime motivations with high values,it is no surprise that the diagonal in table 3 is correlated. However � and althoughthe coefficients are not that high - in addition to this obvious relation, three strikingrelations can be detected:
- the set of strategic reasons shows correlation with three sets of effects,- the set of operative effects shows correlation with all sets of reasons,- the set of internal knowledge integration effects shows correlation with three
sets of reasons.

22
Table 3: Correlation between reasons to use and effectiveness ofKM practices
Effectiveness (question 4)
Reasons to use (question 3)Internal Integration(A, B, D, K)
External Knowl.Interfaces (L, M)
Operative(C, I, J, N)
Strategic(E, F, G, H)
Internal Integration (B, F, J) 0.511 0.211 0.376 0.160External Knowledge Inter-faces (C, D, L)
0.373 0.354 0.348 0.229
Operative Reasons (E, K) 0.244 0.277 0.311 0.334Strategic Reasons (A, G, H) 0.361 0.210 0.352 0.543
(Pearson coefficients, bold: 5% significance)
3.5.4 Methodological Comment on Relations
It must be stressed that these tables only show correlations and no causalities, andthat the number of respondents is low. It remains to be seen what kind of results canbe obtained with a higher number of N. However, statistical analysis would be im-proved if one had 5 or even 7 digit scale for questions 3 and 4. The differentiationbetween pre-1999 and since 1999 is no problem and can be kept for descriptiveanalysis, however, the answers here must be aggregated for this kind of statisticalanalysis.
3.6 Responsibility for KM Management
In slightly more than half of the companies top management has the responsibilityfor KM (figure A14). However, the smaller a company, the more likely it is that topmanagement is responsible, whereas in 26% of the big companies KM is a sub-fieldof Human Resources Management. It is extremely interesting to note that manage-ment unit and library/documentation centre were only mentioned once.
Other responsibilities mentioned included:
management circle, development unit resp. R&D resp. corporate technology, In-formation Technology, each employee.
CommentsOne should think of changing �KM unit� into �KM unit or function� or �specificKM project, even if temporary�, since in many cases it seems that only one personis responsible. Moreover, one additional possibility could be R&D/technology unit,which was mentioned three times in the open field. In general, one could open up

23
the possibility of ranking up to three most responsible groups/persons or to allowmultiple responses.
3.7 Sources that Triggered Introduction of KM
By far the most important triggering source for the introduction of KM measures isthe companies� management (see figure A15). The second most important sourceare clients, which means that KM in many cases is a reaction to the needs to opti-mise downward market relationships. Interestingly, only few companies indicatedthat upward market relationships (suppliers) have been the trigger. One quarter ofall companies also mentioned competitors, indicating that KM is interpreted as atool that is directly important for competitiveness. Consultants or academics do notplay a significant role.
CommentsIn many cases IT units are in charge of KM activities. It would be interesting to findout if IT management is the trigger. Moreover, it would be necessary to know if thecompany asked is dependent on some (foreign) mother company and if this was thetrigger.
3.8 Budget for KM
Less than one third (29%) of all companies indicated having a budget for KM(question 8). Out of this group, only one company said budgets would decrease,while 45% indicated increases (the rest did not know). From the 71% who indicatednot having a budget, only 17% planned to introduce a budget for KM.
CommentsSince in most cases there is no specific KM unit (and KM cost centre) and KM ac-tivities complement activities in a range of ordinary management activities, respon-dents found it hard to specify a budget for KM although they know that their com-pany spends a lot of money on KM measures. In these cases the respondents seemto have indicated �no�. On the other hand, respondents who have indicated �yes�here often do this for a very specific KM tool - the most important one - withouttaking into account the totality of KM measures. In one case, a respondent indicatedthat he had given the budget for a specific project to introduce KM. It needs to bedecided if the study seeks to explore if companies have a budget specifically dedi-cated to KM and also labelled �KM Budget� or if it seeks to find out if companiesspend money on these measures at all.

24
3.9 Resistance
Resistance to KM activities is generally very low (question 15 in the German ques-tionnaire). Only 14% of the companies indicated to have experienced resistance atall. In five cases (less than 10% of the whole responding sample), the managementitself resisted, in three cases resistance come from the R&D department. Other re-sisting groups are mentioned twice or less.
Comments:The category "management" is too broad here and should differentiate between "topmanagement" and "mid-level management" or something similar.
3.10 Reasons to Increase or Introduce KM
The motivation to further increase or implement KM is in accordance with what onewould theoretically expect. KM is introduced if the tacit knowledge of theworkforce runs out of control and cannot sufficiently be used by the company as awhole. Secondly, and in relation to the first motivation, KM is increasingly seen asa reaction against loss of competency through worker retention. A somewhat con-tradictory conclusion must be drawn in relation to the low value for �difficulties toincorporate external knowledge�, since in the German add-on section of the ques-tionnaire, a high number of companies indicated that external knowledge will be-come more important for their innovation activities in the future (figure A16).
Comments:The difference between question 3 (reasons for KM) and question 16 (motivationsto increase, introduce KM; question 10 in the core questionnaire) are not fully clearand have a considerable overlap. For example, it is possible, though not compelling,that an under-performance in one of the reasons to use KM (question 3) might alsolead companies to increase their KM effort. Therefore, the analysis of the question16 (10 in core questionnaire) might be misleading since the main reasons to in-crease might be included in 3, but not asked for here.
3.11 Concluding Comments on Content and Technical Aspects
3.11.1. Content
As always, some companies indicated the questionnaire would be too detailed forsmall companies, would contain many questions that were only partly relevant tothis company, would be too broad for the manager asked or � only once � too aca-demic. From experience, this cannot be avoided and should not irritate the furtherpractice too much. The problem is rather how to make companies fill in the ques-

25
tionnaire even if some (many) things are not extremely relevant for them. Here theaccompanying letter is extremely important, it has to state very clearly that weknow that their company is structured in a unique way, has its own definitions andscope of KM etc. Companies need to understand that they are relevant even if theythink they are not.
The definition given seems to be understandable for the companies and � equallyimportant � makes respondents think more broadly about their knowledge manage-ment than they would without a definition or without a couple of examples.
The questions on reasons and effects (3 and 4) are crucial and, as far as the inter-views and written comments are concerned, cover all relevant aspects, no respon-dent asked to have additional variables (except for negative ones, see below). Theygive a mixture of variables that can be clustered in related families or factors. Inorder to avoid question order effects it seems functional that these variables areseparated. However, one could think of defining intellectual clusters to use foranalysis in all countries ex post.
The questions on the characterisation of companies should be expanded to somedegree in order to sharpen analysis. For example, it seems obvious that in manycases companies do KM because they are, or have become, part of a larger companygroup. The questionnaire could identify if KM is strictly for purposes of the organ-isational unit asked or if it is part of a broader integration process, e.g. as a part ofafter-merger integration, broader international activities and so on.
Beyond the question on resistance for KM, the questionnaire fully ignores theproblem dimension. However, KM might cause some negative effects that at leastcould be asked about in an open question � in full awareness that many of the re-spondents are the responsible persons and might not be willing to admit � or beaware of � problems.
3.11.2 Some Technical Aspects
Almost all respondents asked in the telephone interviews indicated that they wouldhave preferred a separation of answering categories "do not know/not applicable"into �not in use/not planned� and �do not know�. The analysis later on could stillaggregate if wanted, but respondents could differentiate better.
The written answers and the telephone interviews did not bring to the fore manydifficulties relating to the categories �before 1999� and �since 1999�. The purposeof this separation is sensible, i.e. to see how dynamic KM management is and if it isa recent phenomenon or a traditional one with a new stylish label. The same is truefor the category �planned�. Furthermore, in sticking to these categories, the effectscould be differentiated between those companies having more traditional KM and
26
those who introduced it more recently. Therefore, this division could be kept. Theonly problem indicated was that some respondents were irritated by differentiating,giving an exact date in the past. Maybe one could change this in �introduced withinthe last 2-3 years�, which would make it easier and reduce time to answer.
As indicated in the discussion of question 3 and question 4, the scale for the ques-tions asking for "importance" should be changed to a five- or seven-step scale, andonly the extreme poles should be labelled. This would avoid irritations in translatingthe expression for "not important at all", "less important", "important", "crucial"into many different languages. A uniform, quasi-metric scale could be much betterattained only by giving number 1 to 5 or 1 to 7. Moreover, this would ease statisti-cal analysis and result in better differentiation of mean values, especially for thequestion on reasons, where in effect all reasons are somewhat important for generalmanagement purposes and therefore for KM also.
27
4. The German Add-on
4.1 Analysing the Absorption of External TechnologicalKnowledge:Aims and Rationale
The add-on questions had one clearly defined focus, i.e. the management of externaltechnological knowledge, with technological knowledge simply defined as knowl-edge to be directly used for the innovation process of the company � as opposed, forexample, to market knowledge or knowledge on organisational aspects etc.. Thisinterest is shared by the institute responsible for the study as well as the financialand �symbolic� supporters of it, and its inclusion in the German study was a condi-tion sine qua non. It is based on the assumption that, in order to cope with thegrowing dynamics and complexity of knowledge development, companies increas-ingly have to rely on knowledge that cannot � for various reasons � be producedwithin the company itself. In fact, in some cases the acquisition of external knowl-edge has been defined as crucial for the persistence of an efficient innovative ca-pacity of companies. If this is so, and the study seeks to test this hypothesis, anotherhypothesis derives: knowledge management becomes even more complex, sinceimportant external knowledge needs to be detected, acquired and inserted into theinternal knowledge circulation of companies.14
In analysing external knowledge the study concentrates on external technologicalknowledge directly utilised for product or process innovations. Being fully awarethat knowledge on customer and supplier markets is of equal importance, thischoice was made in order to better understand the needs, practices and problems ofcompanies in the innovation process related to the growing need to find and absorbexternal knowledge. The reasoning behind this is that we know a lot about theknowledge transfer into companies from the perspectives of research institutes15.But what we know about companies� activities to absorb knowledge is mainly lim-ited to industrial complaints about the inertia of the research system. In order toimprove knowledge diffusion in all directions within the innovation systems, it isnecessary to know more about the scope of external knowledge needed, the role itplays for the knowledge stock in companies and the management of its detection,absorption and integration. On that basis, it is of highest interest to see the relationbetween internal and general KM practices on the one hand and the knowledge ab-
14 An early recognition of this has been given by Barabaschi , Sergio (1993): Managing the Growth
of Technological Information; in: Rosenberg et al. (ed.), Wealth of Nations; Stanford: StanfordUniversity Press; pp. 407-434. Barabaschi is a manager of a big Italian company in the electro-nics sector.
15 Schmoch, Ulrich et al. (2000) Wissens- und Technologietransfer in Deutschland (Knowledge andTechnology Transfer in Germany. Main Findings). Studie für das BMBF; Stuttgart: FraunhoferIRB-Verlag; Edler, Jakob/ Schmoch Ulrich (2001): Wissens- und Technologietransfer in öffent-lichen Einrichtungen; in: ifo-Schnelldienst, 4/54; pp. 18-27.

28
sorption activities and innovative activities on the other hand. Therefore, an analyti-cal link between the German add-on section and the core questionnaire of theOECD group is not only possible, it is crucial.
For the questionnaire, the add-on questions were included in the following way.After question 8 of the OECD core questionnaire, five questions� with some sub-questions � have been inserted that all deal with the KM practices relating to exter-nal technological knowledge. In order to relate these questions to the innovativecapabilities of the companies, three additional questions characterising the innova-tive activities and capabilities were added at the end of the core questionnaire, justbefore the number of employees are asked for (question 11). In Annex 2 of this re-port one can find the full questionnaire used for the German pilot study (in English).Annex 3 gives a correspondence table for both versions.
4.2 Key Results of Additional German Questions
4.2.1 Some Additional Characterisations of the Companies
In order to better understand the dimension �technological knowledge� and relatedcontacts with external sources, the companies were asked a couple of additionalcharacterising questions, the results of which are presented here briefly:
- R&D departments: slightly more than half of all companies (54%) had an R&Ddepartment (only 16% of the small companies).
- Innovators: 55% of the sample indicated to have obtained more than 10% oftheir turnover in 2001 with products that were newly introduced or remarkablyimproved within the last three years. This group is defined as �innovators� (herethe difference for size is rather small), and the following analysis will � in addi-tion to size - differentiate for this dimension.
- Contacts with public research institutes: 35% of the sample had/have oftencontact, 61% �seldom�, 4% never (the bigger companies much more often haveregular contacts with public research institutes than the small ones).
4.2.3 The Importance and Sources of External (Technological)Knowledge
To test the hypothesis that external knowledge becomes more important, companieswere asked how significant external and internal knowledge sources are for the in-novation activities and if the importance of external technological knowledge willincrease. On the scale between 1 and 4, the mean for the importance of internalknowledge is 3.48, and the mean for external technological knowledge is 3 (see
29
figure B1). However, external technological knowledge has gained importance inthe last years and for two thirds of the companies it will even become more impor-tant in the future (figure B2). Again, size matters here, the big companies attributemore importance to external technological knowledge than small and medium-sizedcompanies.
To qualify the demand for external technological knowledge, companies were askedif they use it in the core areas of their technological competence. 70% of the com-panies do this occasionally, 15% often and only 10% do not do this and do not evenplan to do so.
4.2.2 The Management of External Technological Knowledge
Reasons to procure external knowledge: the two most important reasons to procureexternal technological knowledge are first, the speed with which companies have toreact to changes in technological requirements posed by customers or suppliers thatcannot be delivered in-house quickly enough and second, the lack of in-house ca-pacity (figure B3). This picture can be further specified by differentiating accordingto innovative and non-innovative companies (definition see above). The data so farindicate that for innovative companies these two reasons are less important, whilethey recognise that the necessary knowledge generation in order to be innovative in-house is too expensive and too specialised (figure B4). Interestingly enough, sizedoes not make a significant difference here.
Importance of sources: in order to find external technological knowledge for theinnovation process (question 10), technical literature, special events (conferences,fairs etc.), database and Internet search are the most important sources (figure B5).As for systematic contact with external actors, public research institutes play a moreimportant role than other, non-associated enterprises or even private R&D providersor business consultants. In contrast to the dimension �innovators�, the dimensionsize makes a difference here. For smaller companies direct contacts with externalactors are much less important � with the notable exception of non-university insti-tutes (like Fraunhofer institutes) � and at the same time the Internet has not yet thesame importance for them as for bigger companies.
Instruments used to capture external technological knowledge: in order to captureexternal technological knowledge companies very much rely on written documen-tation and on vertical R&D co-operation with market participants (figure B6), whileR&D co-operation with public research institutes and awarding research contractsrank number 7 and 8 in the lists of instruments. The differences for innovators vs.non-innovators are rather small, innovators tend to have a higher rate of usage ofalmost all instruments, especially their rate of vertical co-operation with other en-terprises is significantly higher. The size of the companies makes a difference here,
30
the biggest companies are much more prone to higher expertise as they need it, theyco-operate much more with other market participants and at the same time they aremore active in co-operating with public research institutes. It is obvious that smallcompanies are disadvantaged � or less aware. While they rate the importance ofexternal knowledge as high as the bigger companies, their abilities (or awareness) toexploit the whole range of sources seem limited.
Activities to define needs and detect supply for external technological knowledge: inorder to exploit external knowledge sources, companies need to determine theirneeds, both in the long term and for specific projects. However, the percentage ofcompanies systematically determining these needs and keeping themselves in-formed about the external knowledge supply is only around 30 to 35%, with only11% investing in procedures to specify long-term external knowledge needs (figureB6). It is no surprise that again the bigger companies are more active and moreaware than smaller ones. However, the true dividing line here is innovation activi-ties: innovators have significantly higher values in all of these dimensions, aboveall, they spend more on keeping themselves informed about external knowledgesupply, more than 50% of the innovators invest (35%) or plan to invest (15%) innecessary procedures. What is striking is the determination of 70% of all companiesto install a unit or management function to manage external technological knowl-edge in the future. Statistical testing shows that the usage of procedures and organ-isational units to scan the supply of external technological knowledge (questions 12B, 12C) actually leads to the effect that companies utilise it more often (1d) andhave better information about the supply of external technological knowledge (13).
Information on external knowledge: interestingly enough, despite low investmentsin activities to get informed, almost half of the companies claim to be informedabout the external knowledge supply offered by the public research system (whileonly a bit less than 30% claim to be adequately informed about private knowledgeproviders) (figure B7). Not surprisingly, the values for innovators (59%) are almosttwice as high as for non-innovators (30%) relating to the adequate information onsupply at the national level. The same division can be seen as for size, with bigcompanies being much better informed than small ones. Although almost all com-panies indicate that external technological knowledge will become even more im-portant in the future, only a very small minority plans to improve their level of in-formation on knowledge supply!
Obstacles to appropriate and use external technological knowledge: for the aggre-gate of all companies, by far the most important obstacle is the fear of giving awaysensitive knowledge, pointing to problems of trust and intellectual property regula-tion in inter-organisational co-operations, while the supply of research institutes,often claimed as a bottleneck, seems not to be overly problematic (figure B8). Amore differentiated look at the data here shows not much difference between inno-vators and non-innovators, except that non-innovators sense a much higher unwill-

31
ingness on the part of other enterprises. The differences as for size are somewhatcounter-intuitive, since the values for the three most important obstacles (reserva-tion to give away sensitive knowledge, lack of procedures to discover externalknowledge and unwillingness of other firms to co-operate) are higher with biggercompanies (figure B9). By the same token, they have also much higher reservationsabout becoming dependent on external knowledge sources and, since big companieshave R&D departments more often than small companies, the �not invented here�effect is much bigger with big companies. Finally, top management responsibilityfor KM in general has a positive effect (figure B10). In companies in which topmanagement themselves care for KM, the three most important obstacles are ratedmuch lower than companies in which KM responsibility is exclusively in the handsof the lower hierarchies.
4.3 General Comments on the German Add-on
What is the importance of the dimension management of external technologicalknowledge? What is the relation between this dimension and KM in general? Fromthe written and oral comments on the questionnaire, very diverse answers weregiven. Most interviewees found that knowledge management for the innovationprocess is at the the core of knowledge management in general, therefore this di-mension has full legitimacy for this questionnaire. One respondent even indicatedthat for him KMK management is innovation management.
However, one respondent indicated that the focus on external technological knowl-edge was too strong, since this was only a minor side aspect. Another one statedthat external experts are only one less important component in the intranet and in-ternal database efforts to manage KM.
To include this dimension in the German pilot study is based on a complementaryinterest on the part of the institute and the sponsors alike. However, in addition tothe extra knowledge based on the add-on questions themselves, there are a couple ofpossible and sensible connections between the add-on questions and the core ques-tions. The hypothesis in italics listed in annex 1 show these and further connections.In conclusion, a preliminary list of those connections is given below (in brackets,the number of question in the German questionnaire). It is open for discussionwhich kind of relations might be of interest for the OECD core study:
- deeper knowledge and further differentiation and specification of those ques-tions that relate to external knowledge interfaces (1d) (3C) (3D) (4L) (4M);
- differentiation of core questions for the dimension innovator vs. non � innovator(17.4, 17.5), especially the relation between use of KM activities and innovationbehaviour;

32
- differentiation of core questions as to the (future) importance of internal andexternal knowledge sources (9) for the KM activities (1);
- the connection between explicit innovation strategies (12A) and KM strategiesand practices (1);
- the relationship between the meaning of information on external sources (9) forthe practices to actually seek and integrate it (1d);
- the relationship between R&D activities (17.1) and KM practices (1) (is KMresearch-driven?).
Finally, one could think of having more detailed questions on external knowledgefor the downstream and upstream market included in an add-on section in someother country that would be interested. This could complement the experiences ofthe German pilot study and could be used for future improvement of the externalknowledge dimension, as focus studies or related to future core questionnaires.

33
Annex 1: Preliminary List of Hypotheses
The following table comprises a list of possible hypotheses to analyse the question-naire. It was tested in the German pilot study. In many cases the tests are unsatis-factory because of too few respondents. This list can however make clear how thequestionnaire can be assessed in the second phase.
The numbers of the variables refer to the questionnaire of the German pilot study,which corresponds for the main part (questions 1 to 8) completely to the core ques-tionnaire. See Annex 2 for the German questionnaire and Annex 3 for a correspon-dence table.
Explanation• The hypotheses written in bold script are those which are based exclusively
on variables of the core questionnaire.• The hypotheses written in italic script contain a variable, which stems from the
additional German questions.• The hypotheses written neither in bold nor italic script are those which are based
exclusively on the German additional questions.
The variables are characterized as explanatory and dependent even if at the presenttime in some cases merely correlations (without direct causality??) could be deter-mined.
Hypothesis �ExplanatoryVariable�
�Dependent Variable�
1 The KM practices, and the reasons for and signifi-cance of them, differ according to the size and sectorof the organisation
Size (19) or sector all
2 The KM practices, and the reasons for and significanceof them, differ according to whether an organisation isan active innovator or not
(17.4, more than10%) vs. (17.3 noand 17.4 smallerthan 10%) or 17.5yes / no
all
3 The KM practices, and the reasons for and signifi-cance of them, differ according to whether the re-sponsibility for KM lies with top management or not
5, dichotomy: topmanagement yes �no
all
4 There are different types of KM utilization andattributing effectiveness to KM
Factor analysis for question 3 and question 4
5 The introduction of individual KM practices (1)depends very strongly on the kind of motivation
3 (A to L)or four factor setsee H 9)
(1a) � (1f)(with 1a = strate-gies/policies etc.)
6 The intensity of utilization of different types of KMpractices have different effects on KM
(1a) to (1f) 4 totalA to 4N4 (cluster:a) internal integration(A, B, D, K)b) ext. interface. (L, M)c) operative
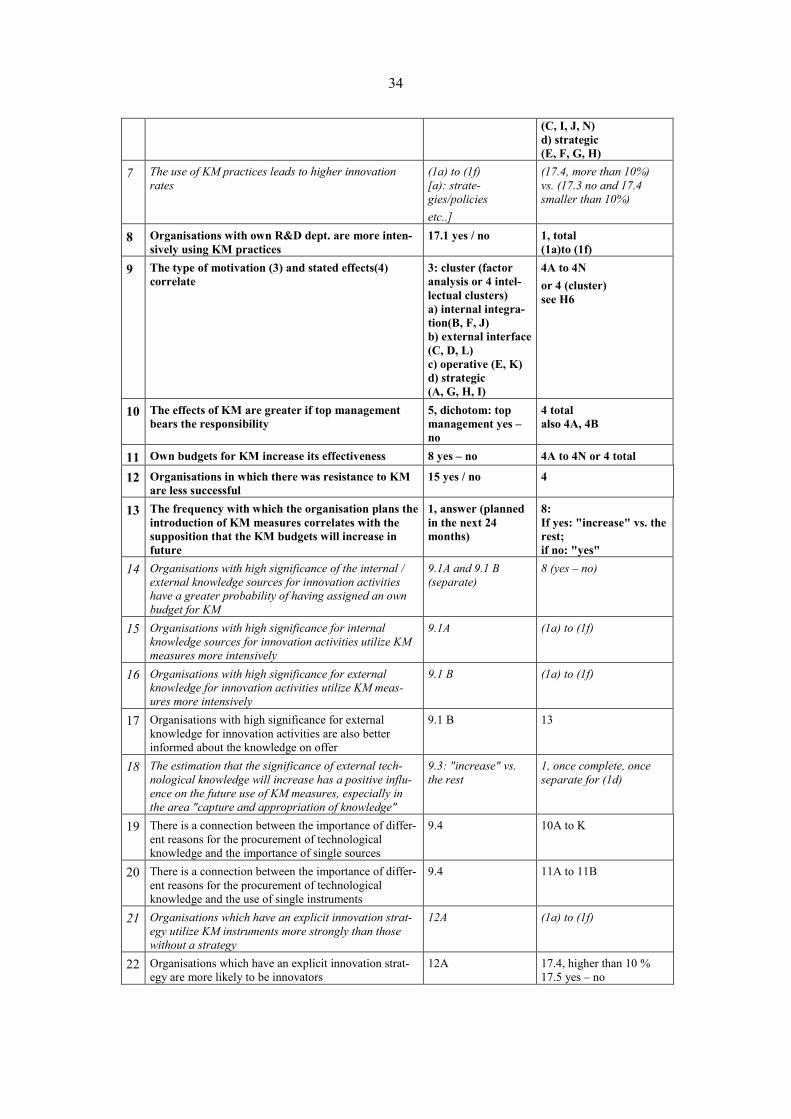
34
(C, I, J, N)d) strategic(E, F, G, H)
7 The use of KM practices leads to higher innovationrates
(1a) to (1f)[a): strate-gies/policiesetc..]
(17.4, more than 10%)vs. (17.3 no and 17.4smaller than 10%)
8 Organisations with own R&D dept. are more inten-sively using KM practices
17.1 yes / no 1, total(1a)to (1f)
9 The type of motivation (3) and stated effects(4)correlate
3: cluster (factoranalysis or 4 intel-lectual clusters)a) internal integra-tion(B, F, J)b) external interface(C, D, L)c) operative (E, K)d) strategic(A, G, H, I)
4A to 4Nor 4 (cluster)see H6
10 The effects of KM are greater if top managementbears the responsibility
5, dichotom: topmanagement yes �no
4 totalalso 4A, 4B
11 Own budgets for KM increase its effectiveness 8 yes � no 4A to 4N or 4 total
12 Organisations in which there was resistance to KMare less successful
15 yes / no 4
13 The frequency with which the organisation plans theintroduction of KM measures correlates with thesupposition that the KM budgets will increase infuture
1, answer (plannedin the next 24months)
8:If yes: "increase" vs. therest;if no: "yes"
14 Organisations with high significance of the internal /external knowledge sources for innovation activitieshave a greater probability of having assigned an ownbudget for KM
9.1A and 9.1 B(separate)
8 (yes � no)
15 Organisations with high significance for internalknowledge sources for innovation activities utilize KMmeasures more intensively
9.1A (1a) to (1f)
16 Organisations with high significance for externalknowledge for innovation activities utilize KM meas-ures more intensively
9.1 B (1a) to (1f)
17 Organisations with high significance for externalknowledge for innovation activities are also betterinformed about the knowledge on offer
9.1 B 13
18 The estimation that the significance of external tech-nological knowledge will increase has a positive influ-ence on the future use of KM measures, especially inthe area "capture and appropriation of knowledge"
9.3: "increase" vs.the rest
1, once complete, onceseparate for (1d)
19 There is a connection between the importance of differ-ent reasons for the procurement of technologicalknowledge and the importance of single sources
9.4 10A to K
20 There is a connection between the importance of differ-ent reasons for the procurement of technologicalknowledge and the use of single instruments
9.4 11A to 11B
21 Organisations which have an explicit innovation strat-egy utilize KM instruments more strongly than thosewithout a strategy
12A (1a) to (1f)
22 Organisations which have an explicit innovation strat-egy are more likely to be innovators
12A 17.4, higher than 10 %17.5 yes � no
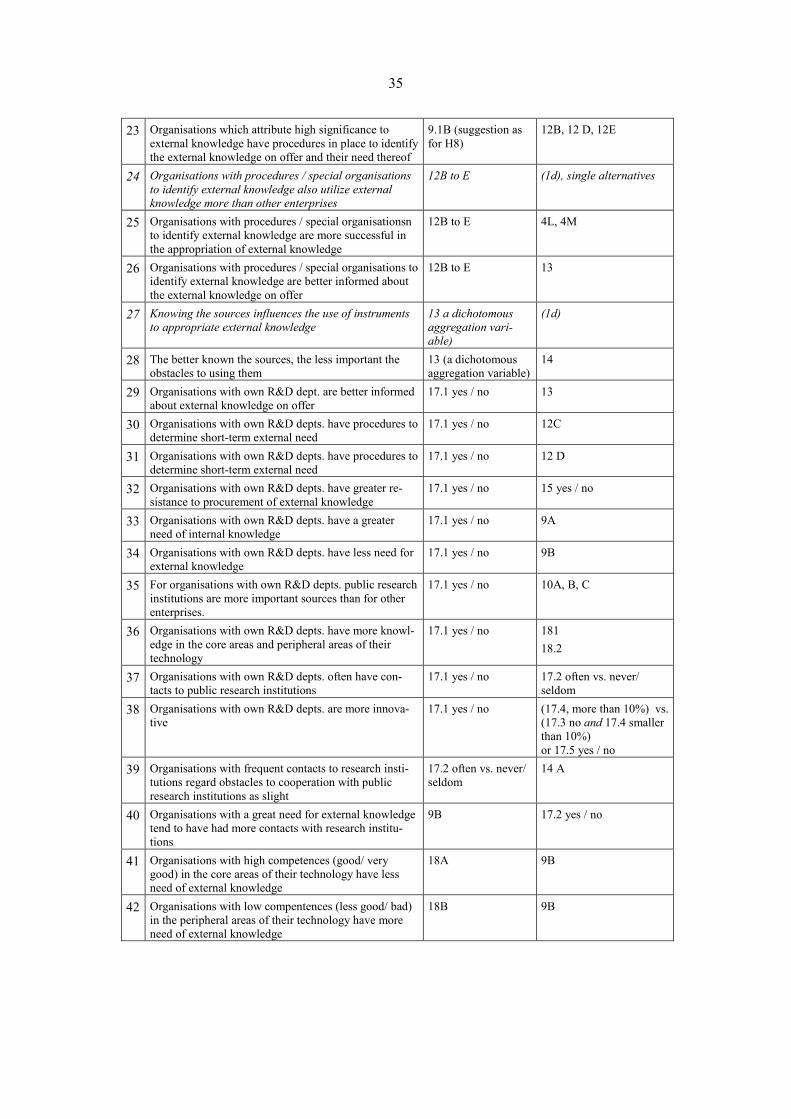
35
23 Organisations which attribute high significance toexternal knowledge have procedures in place to identifythe external knowledge on offer and their need thereof
9.1B (suggestion asfor H8)
12B, 12 D, 12E
24 Organisations with procedures / special organisationsto identify external knowledge also utilize externalknowledge more than other enterprises
12B to E (1d), single alternatives
25 Organisations with procedures / special organisationsnto identify external knowledge are more successful inthe appropriation of external knowledge
12B to E 4L, 4M
26 Organisations with procedures / special organisations toidentify external knowledge are better informed aboutthe external knowledge on offer
12B to E 13
27 Knowing the sources influences the use of instrumentsto appropriate external knowledge
13 a dichotomousaggregation vari-able)
(1d)
28 The better known the sources, the less important theobstacles to using them
13 (a dichotomousaggregation variable)
14
29 Organisations with own R&D dept. are better informedabout external knowledge on offer
17.1 yes / no 13
30 Organisations with own R&D depts. have procedures todetermine short-term external need
17.1 yes / no 12C
31 Organisations with own R&D depts. have procedures todetermine short-term external need
17.1 yes / no 12 D
32 Organisations with own R&D depts. have greater re-sistance to procurement of external knowledge
17.1 yes / no 15 yes / no
33 Organisations with own R&D depts. have a greaterneed of internal knowledge
17.1 yes / no 9A
34 Organisations with own R&D depts. have less need forexternal knowledge
17.1 yes / no 9B
35 For organisations with own R&D depts. public researchinstitutions are more important sources than for otherenterprises.
17.1 yes / no 10A, B, C
36 Organisations with own R&D depts. have more knowl-edge in the core areas and peripheral areas of theirtechnology
17.1 yes / no 18118.2
37 Organisations with own R&D depts. often have con-tacts to public research institutions
17.1 yes / no 17.2 often vs. never/seldom
38 Organisations with own R&D depts. are more innova-tive
17.1 yes / no (17.4, more than 10%) vs.(17.3 no and 17.4 smallerthan 10%)or 17.5 yes / no
39 Organisations with frequent contacts to research insti-tutions regard obstacles to cooperation with publicresearch institutions as slight
17.2 often vs. never/seldom
14 A
40 Organisations with a great need for external knowledgetend to have had more contacts with research institu-tions
9B 17.2 yes / no
41 Organisations with high competences (good/ verygood) in the core areas of their technology have lessneed of external knowledge
18A 9B
42 Organisations with low compentences (less good/ bad)in the peripheral areas of their technology have moreneed of external knowledge
18B 9B