olap technology for business process intelligence
TRANSCRIPT
OLAP Technology for Business Process Intelligence: Challenges and Solutions
Svetlana Mansmannl, Thomas Neumuth2
, and Marc H. Scholl l
1 University of Konstanz, P.O.Box D188, 78457 Konstanz, Germany {Svetlana.Mansmann,Marc.Scholl}@uni-konstanz.de
2 University of Leipzig, Innovation Center Computer Assisted Surgery (ICCAS), Philipp-Rosenthal-Str. 55, 04103 Leipzig, Germany
Abstract. The emerging area of business process intelligence aims at enhancing the analysis power of business process management systems by employing data warehousing and mining technologies. However, the differences in the underlying assumptions and objectives of the business process model and the multidimensional data model aggravate a straightforward solution for a meaningful convergence of the two concepts.
This paper presents the results of an ongoing project on providing OLAP support to business process analysis in the innovative application domain of Surgical Process Modeling. We describe the deficiencies of the conventional OLAP technology with respect to business process modeling and formulate the requirements for an adequate multidimensional presentation of process descriptions. The modeling extensions proposed at the conceptual level are verified by implementing them in a relational OLAP system, accessible via a state-of-the-art visual analysis tool. We demonstrate the benefits of the proposed analysis framework by presenting relevant analysis tasks from the domain of medical engineering and showing the type of the decision support provided by our solution.
1 Introduction
Modern enterprises increasingly integrate and automate their business processes with the objective of improving their efficiency and quality, reducing costs and human errors . However, the prevailing business process management systems focus on the design support and simulation functionalities for detecting performance bottlenecks, with rather limited, if any, analysis capabilities to quantify performance against specific business metrics [1] . The emerging field of Business Process Intelligence (BPI), defined as the application of performance-driven management techniques from Business Intelligence (BI) to business processes, claims that the convergence of BI and business process modeling (BPM) technologies will create value beyond the sum of their parts [2]. However, the task of unifying the flow-oriented process specification and the snapshot-based multidimensional design for quantitative analysis is by far not trivial due to very different and even partially incompatible prerequisites and objectives of the underlying approaches.

112
This research was inspired by practical data warehousing issues encountered in the medical domain. An emerging field of surgical process analysis fosters intelligent acquisition of process descriptions from surgical interventions for the purpose of their clinical and technical analysis [3]. A medical engineering term Suryical W orkflows descri bes the underlying methodological concept of this acquisition procedure. The process data is obtained manually and semi-automatically by monitoring and recording the course of a surgical intervention. Apparently, a well-defined formal recording scheme of the surgical process is required to support such data acquisition [4]. Surgical workflow use cases are manifold, ranging from the preoperative planning support by retrieving similar precedent cases to the postoperative workflow exploration, from discovering the optimization potential for instrument and device usage to verifying medical hypotheses, etc.
The prevailing process modeling standards, such as Business Process Modeling Notation (BPMN) [5] or the reference model of Workflow Management Coalition (WfMC) [6], tend to be too general to adequately address the domain-specific requirements. Multidimensional modeling seems a promising solution as it allows to view the data from different perspectives, define various business metrics and aggregate the data to the desired granularity.
To be admitted into an OLAP system, business process descriptions have to undergo the transformation imposed by the underlying multidimensional data model. This model categorizes the data into facts with associated numerical measures and descriptive dimensions characterizing the facts [7]. For instance, a surgical process can be modeled as a fact entry SURGERY characterized by the dimensions Location , Surgeon , Patient and Discipline. The values of a dimension are typically organized in a containment type hierarchy (e.g., location / hospital / city) to support multiple granularities.
1.1 Business Process Modeling
Business process models are employed to describe business activities in the real world. Basic BPM entities are objects, activities, and resources. Activities are the work units of a process that have an objective and change the state of the objects. Resources are consumed to perform activities . Relationships between the entities may be specified using control flow (consecutive, parallel, or alternative execution) and/or hierarchical decomposition. The differentiation between the notions business process and workflow consists in the levels of abstraction: business processes are mostly modeled in a high-level and informal way, whereas workflow specifications serve as a basis for the largely automated execution [8].
A process is "a co-ordinated (parallel and/or serial) set of process activity(s) that are connected in order to achieve a common goal. Such activities may consist of manual activity(s) and/or workflow activity(s)" [6]. Workflow refers to automation of business processes as a whole or in part, during which documents, information or tasks are passed from one participant to another for action, according to a set of procedural rules [6]. Different workflow specification methods coexist in practice, with net-based, or graph-based as the most popular ones. Activity and state charts are frequently used to specify a process as an oriented
113
graph with nodes representing the activities and arcs defining the ordering in which these are performed. Other popular approaches are logic-based, or temporal, methods and Event-Condition-Action rules. [9]
Surgical Process Modeling, classified as a specific domain of BPM [3], adopts the concepts from BPM and Workflow Modeling (WfM). The WfM approach of decomposing a workflow into activities is useful for providing a task-oriented surgery perspective. However, since surgical work steps are predominantly manual and involve extensive organizational context, such as participants and their roles, patients and treated structures, instruments, devices and other resources, high-level BPM abstractions are used to model such domain-specific elements.
The remainder of the paper is structured as follows: Section 2 provides an overview of the related work, Section 3 describes our approach to gaining a multidimensional perspective of a process scheme, followed by the conceptual design and its relational implementation in Section 4. Section 5 demonstrates a prototype implementation of the model in a visual frontend tool and presents an exemplary analysis task. Concluding remarks are given in Section 6.
2 Related Work
In this section we describe the related contributions in the fields of BPI data warehousing and discuss their relationships to our approach.
Grigori et al. present a BPI tool suite based on a data warehouse approach [10] . The process data is modeled according to the star schema, with process, service, and node state changes as facts and the related definitions as well as temporal and behavioral characteristics as dimensions . While this approach focuses on the analysis of process execution and state evolution, we pursue the task-driven decomposition, with activities as facts and their characteristics, corresponding to the factual perspectives (e.g., behavior, organization, information etc.) proposed in [11] as well as domain ontologies as dimension hierarchies.
An approach to visual analysis of business process performance is given in [12]. The proposed visualization tool Vislmpact is based on analyzing the schema and the instances of a process to identify business metrics, denoted impact factors. A metric along with its related process instances are mapped to a symmetric circular graph showing the relationships and the details of the process flows.
Pedersen et al. proposed an extended multidimensional data model for meeting the needs of non-standard application domains and used a medical application scenario as a motivating case study [13]. Jensen et al. formulated the guidelines for designing complex dimensions in the context of spatial data such as location-based services [14] . Our previous work [15] presents the limitations of current OLAP systems in handling complex dimensions and describes an extended formal model and its implementation in a visual analysis tool.
Interdisciplinary research in the field of surgical workflow modeling, analysis and visualization is carried out at the Innovation Center Computer Assisted Surgery (ICCAS) located in Leipzig, Germany [3,16,4].
114
3 Multidimensional Perspective of a Process
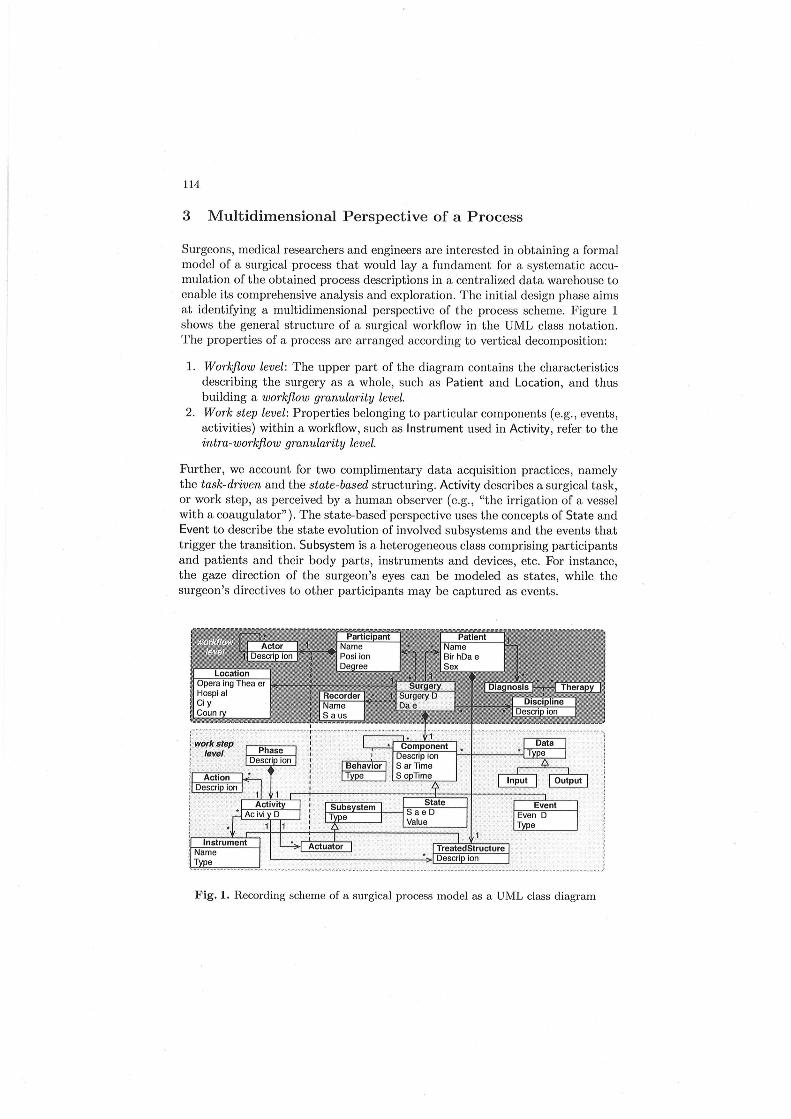
Surgeons, medical researchers and engineers are interested in obtaining a formal model of a surgical process that would lay a fundament for a systematic accumulation of the obtained process descriptions in a centralized data warehouse to enable its comprehensive analysis and exploration. The initial design phase aims at identifying a multidimensional perspective of the process scheme. Figure 1 shows the general structure of a surgical workflow in the UML class notation. The properties of a process are arranged according to vertical decomposition:
1. Workflow level: The upper part of the diagram contains the characteristics describing the surgery as a whole, such as Patient and Location , and thus building a workflow granularity level.
2. Work step level: Properties belonging to particular components (e.g., events, activities) within a workflow, such as Instrument used in Activity, refer to the intra-workflow granularity level.
Further, we account for two complimentary data acquisition practices, namely the task-driven and the state-based structuring. Activity describes a surgical task, or work step, as perceived by a human observer (e.g., "the irrigation of a vessel with a coaugulator" ). The state-based' perspective uses the concepts of State and Event to describe the state evolution of involved subsystems and the events that trigger the transition. Subsystem is a heterogeneous class comprising participants and patients and their body parts, instruments and devices, etc. For instance, the gaze direction of the surgeon's eyes can be modeled as states, while the surgeon's directives to other participants may be captured as events.
I
~~:,pT - '
: !
'~""'====!-------.----------.----------------------------------------_._---------------------------------------,
Fig. 1. Recording scheme of a surgical process model as a UML class diagram

1 Participant Description Phase TreatedStructure
1 I Action ......... A J . /' StartTime
"
Patient _ Surgery _ Discipline < - ctlvlty-/' "- I lnputData:::-- I --::::::- StopTime
1 Recorder Location i OutputData Instrument Actuator
~------~------~
InputComponent I
115
Behavior _ Type
OutPut~omponent
Fig. 2. Examples of the multidimensional views of a surgical process
Vertical decomposition is followed by a horizontal one according to the factual perspectives [11], similar to identifying the dimensions of a data cube. For example, Instrument refers to the operation perspective, Input and Output build the information perspective, etc, Figure 2 presents examples of multidimensional views of a surgery as a whole (left) and at work step level (right), as well as a behavioral perspective of the relationships between components (e.g., input component 'Event X' caused output component 'State Y').
3.1 Modeling Challenges
In addition to classical OLAP constraints, such as summarizability of dimension hierarchies and disallowance of NULL values in fact entries, the context of BPM confronts the data warehouse designer with the following modeling challenges:
- Many-to-many relationships between facts and dimensions are very common. For instance, within a single work step, multiple surgical instruments may be used by multiple actuators. Heterogeneity of fact entries. Processes consist of heterogeneous components. Modeling Component as one fact type leads to loss of subclass properties, while mapping subclasses to separate fact types disables treating all components as the same class in part of their common properties. Interchangeability of measure and dimension roles. In conventional data warehousing, the measure attributes of a data cube, which form the focus of the analysis, are known at design time. However, "raw" business process data may contain no explicit quantitative characteristics and the measures of interest vary from one query to another. Therefore, it is crucial to enable runtime measure specification from virtually any attribute. Interchangeability of fact and dimension roles. Surgery has dimensional characteristics of its own (Location, Patient, etc.) and therefore, deserves to be treated as a fact type. However, with respect to single work steps, Surgery clearly plays the role of a dimension (e.g., Event rolls-up to Surgery).
3.2 Formalization
In relational OLAP systems, facts and dimensions are stored in relational tables and, therefore, each entry is a tuple that adheres to the schema of its relation. Fact table schema F is a set of attributes AF = {Ai, i = 1, ... , k}, and dimension table schema D is a set of attributes AD = {Aj,j = 1, ... , I}.

116
An n-dimensional fact schema S is composed of the fact schema :F and a set of corresponding dimension schemata {Vi,i = 1, . .. ,n}.
A dimension schema V is obtained by grouping the attributes of AD into a set of hierarchical categories CV = {Crr" m = 1, ... , p} and the partial order ~v on those categories. A dimension has two distinguished categories Tv E CV
and -Lv E CV as its respective top and bottom levels. Tv serves as a root hierarchy element with the value' all'. -Lv represents the dimension's finest granularity, i.e., the one to which the fact entries are mapped. A category schema C is a subset of the dimension's attributes AC ~ AD including a distinguished hierarchy attribute Ac and property attributes, functionally dependent on the former: VAj E AC : Ac -> Aj .
A fact schema :F is derived from F by assigning each attribute to either the set of dimensional attributes DimF or to the set of measures M easF . In a standard measure definition, any measure attribute is functionally dependent on the set of the associated dimensional attributes: VAi E M easF : DimF -> Ai . We nullify this restriction to enable query-specific measure definition from any attribute. Instead, the measure is defined as a function M easure(Ai, Aggr) where Ai is any actual or derived attribute from Sand Aggr is an aggregation function from the set of SQL functions {SUM, COUNT, AVG, MIN, MAX}. By defining the measure as a function and not as a property, we enable symmetric treatment of fact and dimension roles as well as of measure and dimension attributes.
As the measure is specified at query time, the set of predefined measure attributes may be empty: M easF = 0, in which case the resulting fact schema is called measure-free. As long as no user-defined measures exist, the default measure COUNT(*), i.e. mere counting of the qualifying fact entries, is implied.
Optionally, :F disposes of a distinguished fact identifier attribute AF, AF E AF, which is a single-valued primary key of the respective fact table. For instance, Surgery fact entries are identified by SurgerylD. AF owes its existence to the fact of data warehousing non-cumulative data: fact entries in a business process scenario are not some derived measurements, but the actua1.process data. Formally, fact identifiers may be assigned neither to DimF nor to M easF .
4 Conceptual Design and Its Relational Mapping
The resulting structure of the surgical recording scheme in terms of facts ("boxed" nodes) and dimension hierarchies (upward directed graphs of "circular" category nodes) is presented in Figure 3 in the notation similar to the Dimensional Fact Model [17J. Solid arrows show the roll-up relationships while dashed arrows express the "is a" relationships between fact types, such as identity and generalization, explained later in this section. Shared categories are displayed without redundancy, thus helping to recognize valid aggregation and join paths in the entire scheme. The vertical ordering (bottom-up) of the facts and the category nodes corresponds to the descending order of their granularity.
Fact tables in our model have shared dimensional categories and, therefore, build a complex structure called fact consteliation[18J. As expected, different

117
/ , " Ttype /,," , 0,' i
I '" I " type6 :
I ::.t~i I
Fig. 3. The Dimensional Fact Model of a surgical workflow scheme
facts are potentially joinable to each other along their shared axes. In our scenario, apart from the shared dimensions, facts may be related to each other via fact identifiers. We define the following special cases of fact constellation:
Fact rollup, or fact hierarchy, reflects the vertical decomposition, as is the case with COMPONENT that rolls-up to SURGERY. Satellite fa ct is a special case of fact rollup and is a result of "extracting" each many-to-many relationship between a fact and a dimension into a subfact, or bridge table. This solution has been inspired by a related concept of dimensional modeling, namely mapping non-strict hierarchies to bridge tables [19] . For example, SURGERY_DISCIPLINE handles multidisciplinarity of surgeries by storing each value in a separate tuple. Fact generalization results from unifying heterogeneous fact types into a common superclass, as may be observed with ACTIVITY, STATE, and EVENT, generalized as COMPONENT. Thereby, multiple classes can be treated as the same class in part of their common characteristics. A further advantage is the ability to uniformly model the relationships between the heterogeneous components in form of a satellite fact COMPONENT _BEHAVIOR. The concept of fact generalization has also been inspired by the related approach in the dimensional modeling [20,15].
In part of dimensional hierarchy modeling, the major challenges lie in identifying various hierarchy types and normalizing them for correct aggregation. In literature, numerous guidances for handling complex dimensions may be found [13,14,20,15]' and, therefore, we skip the detailed description and proceed with presenting the implementation challenges.

118
,
~JJlitf){f;lnBl , reruiiPonenijp :
...... .'" ,', : Surgery 0 : ............ ' , / / ~ Oecnptlon i
I,' iStart Ime: "
A-'.IMMO Surgery D Decrlptlon Start Ime Stop Ime Action D Phase D
: \ : Stop Ime : 1/ ... '" _ ... ____ _
\ ' ...... i·~9.'!1.P.9!1.~~.t.y.I?~ .. 1 " " I I ,
I -
~ Surgery D Decription Start Ime Stop Ime Event ype D
- ~iBl " ~ " S1aldD \ ~ Surgery 0 \'., _____ _ Decription \I
Start Ime Stop Ime Subsystem D Value
. SIIl!liWm!JQ : Description : •. y.p.~ .. •.••...•
., .. ~ V
~1WI1IO
Description Name Position
Participant 0 DeQree BodvPart voe D ~ " :: " I;1I~ ~ Description
Description Structure ype D . , . Patient 0 -f.i!!.iw!lII2
Name Blrthdate'
- - llnstrumentiD Sex . Description : Grouo D !irwlRlQ
Description
Fig. 4. Implementing generalization in facts (left) and dimensions (right)
I
4.1 Relational Implementation
Star schema and snowflake schema are the two options of the relational data warehouse design. Star schema places the entire dimension hierarchy into a single relation by pre-joining all aggregation levels, while snowflake schema decomposes complex dimensions into separate tables according to the relational normalization rules. Snowflake schema becomes the only option when dimensional hierarchies are prone to irregularities, such as heterogeneity, non-strictness, missing values, mixed granularity etc. We extend the classical snowflake schema
LJJ STATE , h, DIMENSIONS
1> 0 Surgery ~ StatelD
:..:: Description
" 1'~ Start Time I> 11 Stop Time .., j,J Subsystem
I> tJ Actor
I> t1 Treated Structure
.., fJ,J Instrument
.., rj Instrument Group
" Instrument Name
" MEASURES S!f Value
r: FUNCTIONS S!f COUNT [] COUNT DISTINCT
Fig. 5. Navigation hierarchy of the data cube STATE
to include additional table types, such as satellite fact and generalization tables. Figure 4 shows the examples of creating a superclass fact table COMPONENT and a superclass dimension Subsystem as materialized views, defined as a union of all subclass tables, projected to the subset of their common attributes.
Another benefit of the "schema-aware" snowflake design is the ability to automatically retrieve the metadata by tracing the outgoing foreign key relationships. Notice how the navigation structure of Subsystem in Figure 5 corresponds to its relational structure in Figure 4. Metadata, such as the description of the fact tables, their dimensions and valid aggregation paths, applicable aggregation functions, etc., provides the input for generating a navigation hierarchy for a visual frontend. Figure 5 demonstrates the intuition behind the visual exploration approach at the example of the navigation fragment for the data cube STATE. To facilitate the translation of the
navigation events into database queries, we supplemented the snowflake schema by a star-schema view of each homogeneous subdimension.

5 Visual Analysis
Visual analysis and interactive exploration have grown to be the prevailing methods of modern data analysis at the end-user level. Therefore, the ultimate value of the proposed conceptual and relational model extensions is determined by the easiness of incorporating those extensions into visual OLAP tools. In this section we provide some insights into a prototypical implementation of an end-user interface for multidimensional business process analysis.
Visual query specification evolves in a predominantly "drill-down" fashion, i. e. gradually de-
Name I Number of hospitals
Function r SUM "'~ Attribute
119
Fig. 6. Defining a measure
scending from coarsely grained overviews towards the desired level of detail. Queries are specified interactively via a navigation hierarchy, as the one depicted in Figure 5. Compulsory elements of any analytical query are 1) a measure specified as an aggregation function (e.g., sum, average, maximum etc. ) and its input attribute, and 2) a set of dimension categories defining the granularity of the aggregation. In addition to the standard measures, i.e., those that have been pre-configured at. the metadata level, in our application scenario it is imperative to enable runtime measure specification.
Our prototype provides a wizard for specifying a user-definde measure as a 3-step procedure, depicted in Figure 6:
1. Selecting the aggregation function from the function list;
2. Specifying the measure attribute via a "drag&drop" of a category from the navigation, as shown in Figure 6 where Hospital category is being dragged into the measure window;
3. Specifying whether the duplicates should be eliminated from the aggregation by activating the DISTINCT option. This option is crucial in the presence of many-to-many relationships between facts and dimensions.
Optionally, the newly defined measure may be supplied with a user-friendly name. Once defined,
• SURGERY
oZ. DIMENSIONS ''''l SurgeryID
'" i:i Discipline .. I' Participant ~ Patient .. Date .. Recorder
Location
country
.. J City
III MEASURES IS1f Number of hospitals
Fig. 7. Navigation fragment with a user-defined measure
the measure is permanently added to the list of pre-configured measures . Let us consider an example of analyzing the number of hospitals,by choosing the category Hospital from Location as the measure attribute. Obviously, to support this measure, the data cube SURGERY needs to be aggregated to the Hospital level, Hospital category as well as the granularit ies below Hospital , Le., Room and Building, are removed from the navigation path of their dimension Location
120
because those granularities become invalid in the defined query context. The adapted navigation fragment of the affected data cube SURGERY is presented in Figure 7.
5.1 Experiments
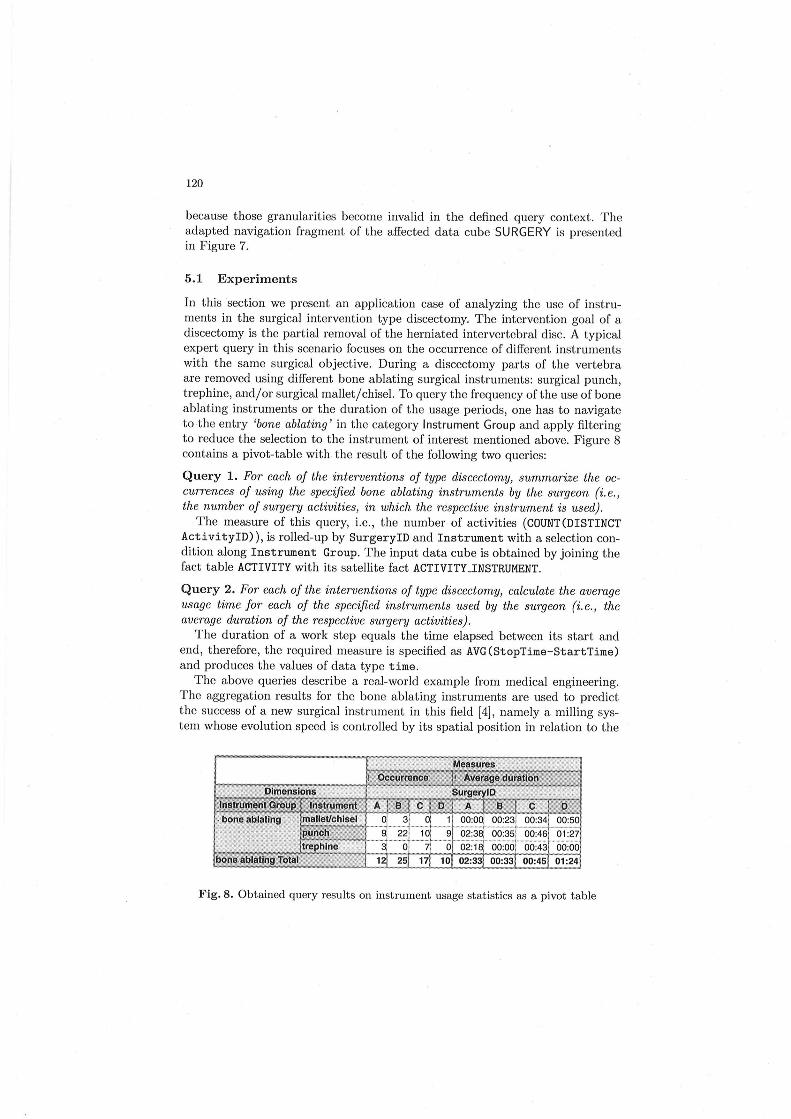
In this section we present an application case of analyzing the use of instruments in the surgical intervention type discectomy. The intervention goal of a discectomy is the partial removal of the herniated intervertebral disc. A typical expert query in this scenario focuses on the occurrence of different instruments with the same surgical objective. During a discectomy parts of the vertebra are removed using different bone ablating surgical instruments: surgical punch, trephine, and/or surgical mallet/chisel. To query the frequency of the use of bone ablating instruments or the duration of the usage periods, one has to navigate to the entry 'bone ablating' in the category Instrument Group and apply filtering to reduce the selection to the instrument of interest mentioned above. Figure 8 contains a pivot-table with the result of the following two queries:
Query 1. For each of the interventions of type discectomy, summarize the occurrences of using the specified bone ablating instruments by the surgeon (i. e., the number of surgery activities, in which the respective instrument is used) .
The measure of this query, i.e., the number of activities (COUNT(DISTINCT ActivityID)), is rolled-up by SurgeryID and Instrument with a selection condition along Instrument Group. The input data cube is obtained by joining the fact table ACTIVITY with its satellite fact ACTIVITY _INSTRUMENT.
Query 2. For each of the interventions of type discectomy, calculate the average usage time for each of the specified instruments used by the surgeon (i.e., the average duration of the respective surgery activities).
The duration of a work step equals the time elapsed between its start and end, therefore, the required measure is specified as AVG(StopTime-StartTime) and produces the values of data type time.
The above queries describe a real-world example from medical engineering. The aggregation results for the bone ablating instruments are used to predict the success of a new surgical instrument in this field [4], namely a milling system whose evolution speed is controlled by its spatial position in relation to the
Fig. 8. Obtained query results on instrument usage statistics as a pivot table

121
patient's body [21]. This system is intended to replace the conventional instruments surgical punch, trephine and mallet/chisel. To predict the chance of its success, the pre-development analysis of the instrument usage patterns is crucial.
6 Conclusions
Motivated by the growing research interest to the evolving area of business process intelligence, we attempted to provide OLAP support to business process analysis. Conventional BPM tools are rather limited in the types of supported analytical tasks, whereas th~ data warehousing techniques appear more suitable when it comes to managing large amounts of data, defining various business metrics and running complex queries. As a challenging real-world application scenario, we chose an innovative and promising domain of Surgical Process Modeling, concerned with designing a recording scheme for acquiring process descriptions from surgical interventions for their subsequent analysis and exploration.
We demonstrated the deficiencies of the standard relational OLAP approach with respect to the requirements of our case study and proposed an extended data model that addresses such challenges as non-quantitative and heterogeneous facts, many-to-many relationships between facts and dimensions, runtime definition of measures, and interchangeability of fact and dimension roles. We also described a prototypical implementation of the proposed model extensions in a relational OLAP system, in which the data is stored according to the fact constellation schema and can be queried with standard SQL.
The feasibility of the proposed modeling solution is presented by demonstrating the results of its incorporation in an advanced visual analysis tool that supports flexible measure definition at runtime. The work is concluded by presenting a relevant analysis scenario from the domain of medical engineering and demonstrating what type of decision support in the field of process analysis is provided by the presented data warehouse framework.
Acknowledgement
We would like to thank Oliver Burgert from ICCAS at the University of Leipzig as well as Christos 'Il'antakis and Juergen Meixensberger from the Neurosurgery Department at the University Hospital of Leipzig for the valuable domain expertise.
References
1. Dayal, U., Hsu, M., Ladin, R.: Business process coordination: State of the art, trends, and open issues. In: VLDB 2001: Proc. 27th International Conference on Very Large Data Bases, pp. 3- 13 (2001)
2. Smith, M.: Business process intelligence. Intelligent Enterprise (December, 5 2002) Retrieved 22.10.2006 from http://www.intelligententerprise.com/021205/ 601feat2_1.jhtml
3. Neumuth, T ., Strauil, G., Meixensberger, J., Lemke, H.U., Burgert, 0.: Acquisition of process descriptions from surgical interventions. In: Bressan, S., Kung, J., Wagner, R. (eds.) DEXA 2006. LNCS, vol. 4080, pp. 602- 611. Springer, Heidelberg (2006)

122
4. Neumuth, T., Trantakis, C., Eckhardt, F., Dengl, M., Meixensberger , J ., Burgert, 0.: Supporting the analysis of intervention courses with surgical process models on the example of fourteen microsurgical lumbar discectomies. In: CARS 2007: Proc . 218t International Conference on Computer Assisted Radiology and Surgery (to appear, 2007)
5. OMG (Object Management Group): BPMN (Business Process Modeling Notation) 1.0: OMG Final Adopted Specification (February 2006), Retrieved 15.03.2007 from http: //www.bpmn.org/
6. WfMC (Workflow Management Coalition): WfMC Standards: The Workflow Reference Model, Version 1.1. (January 1995), Retrieved 15.03.2007 from http ://www .wfmc.org/ standards/ docs / tc003vll.pdf
7. Pedersen, T.B. , Jensen, C.S.: Multidimensional database technology. IEEE Computer 34(12), 40- 46 (2001)
8. Muth, P., Wodtke, D., Wei13enfels, J., Weikum, G., Kotz-Dittrich, A.: Enterprisewide workflow management based on state and activity charts. In: Proc. NATO Advanced Study Institute on Workflow Management Systems and Interoperability, pp. 281- 303 (1997)
9. Matousek, P.: Verification of Business Process Models. PhD thesis, Technical University of Ostrava (2003)
10. Grigori, D., Casati, F., Castellanos, M., Dayal, U., Sayal, M., Shan, M.C. : Business process intelligence. Computers in Industry 53(3), 321- 343 (2004)
11. Jablonski, S., BussieI', C.: Workflow Management.' Modeling Concepts, Architecture and Implementation. International Thomson Computer Press, London et al (1996)
12. Hao, M.C, Keim, D.A, Dayal, U., Schneidewind, J.: Business process impact visualization and anomaly detection. Information Visualization 5, 15- 27 (2006)
13. Pedersen, T .B., Jensen, C.S., Dyreson, C.E.: A foundation for capturing and querying complex multidimensional data. Information Systems 26(5) , 383- 423 (2001)
14. Jensen, C.S., Kligys, A., Pedersen, T.B., Timko, 1.: Multidimensional data modeling for location-based services. The VLDB Journal 13(1), 1- 21 (2004)
15. Mansmann, S., Scholl, M.H.: Extending visual OLAP for handling irregular dimensional hierarchies. In: DaWaK 2006: Proc. 8th International Conference on Data Warehousing and Knowledge Discovery, pp. 95- 105 (2006)
16. Burgert , 0. , Neumuth, T ., Gessat, M., Jacobs, S., Lemke, H.U. : Deriving dicom surgical extensions from surgical workflows. In: SPIE MI 2007: Proc. of SPIE Medical Imaging 2007 - PACS and Imaging Informatics, cm 61450A (2007)
17. Golfarelli, M. , Maio, D., Rizzi, S.: The dimensional fact model: A conceptual model for data warehouses. International Journal of Cooperative Information Systems 7(2-3), 215- 247 (1998)
18. Chaudhuri, S., Dayal, U.: An overview of data warehousing and olap technology. SIGMOD Rec. 26(1), 65- 74 (1997)
19. Kimball, R. , Ross, M.: The Data Warehouse Toolkit: The Complete Guide to Dimensional Modeling. John Wiley & Sons, Inc. , New York, NY, USA (2002)
20. Malinowski , E., Zimanyi, E.: Hierarchies in a multidimensional model: From conceptual modeling to logical representation. Data & Knowledge Engineering 59(2), 348- 377 (2006)
21. Jank, E., Rose, A., Huth, S., Trantakis, C., Korb, W., Strauss, G., Meixensberger , J ., Krueger, J .: A new fluoroscopy based navigation system for milling procedures in spine surgery. In: CARS 2006: Proc. 208t International Conference on Computer Assisted Radiology and Surgery, pp. 196- 198 (2006)