optical stark spectroscopy of the (3,0) a1Σ+–x1Σ+ band system of barium sulfide, bas
TRANSCRIPT

Journal of Molecular Spectroscopy 281 (2012) 1–3
Contents lists available at SciVerse ScienceDirect
Journal of Molecular Spectroscopy
journal homepage: www.elsevier .com/ locate / jms
Note
Optical Stark spectroscopy of the (3,0) A1R+–X1R+ band system of barium sulfide,BaS
Chengbing Qin 1, Timothy C. Steimle ⇑Department of Chemistry and Biochemistry, Arizona State University, Tempe, AZ 85287-1604, United States
a r t i c l e i n f o
Article history:Received 21 August 2012In revised form 30 August 2012Available online 23 September 2012
Keywords:Barium sulfide (BaS)Permanent electric dipole momentStark effect
0022-2852/$ - see front matter � 2012 Elsevier Inc. Ahttp://dx.doi.org/10.1016/j.jms.2012.09.003
⇑ Corresponding author.E-mail address: [email protected] (T.C. Steimle).
1 Visiting from Hefei National Laboratory for PhysicDepartment of Chemical Physics, University of ScienHefei, Anhui 230026, China.
a b s t r a c t
The R(0) and R(1) lines of the (3,0) A1R+–X1R+ band of the major isotopologue of barium sulfide, 138Ba32S,were recorded at high resolution (full width at half maximum ffi35 MHz) and at a field strength of up to3100 V/cm. The observed Stark shifts were analyzed to produce permanent electric dipole moments, ~lel,of 10.765(8) D and 5.586(22) for the X1R+ (v = 0) and A1R+ (v = 3) states, respectively. The relative valuesof ~lel for barium monoxide, BaO, and BaS are discussed.
� 2012 Elsevier Inc. All rights reserved.
1. Introduction
The permanent electric dipole moment,~lel, is a particularly use-ful benchmark datum for assessing the performance of electronicstructure methodologies because it provides the most effectivemeasure of the electron density. Unlike many other experimentallyderived molecular properties, such as bond lengths, there is a widevariation in ~lel values [1]. ~lel for BaS (X1R+) is known to beamongst the largest of any diatomic molecule. The magnitude of~lel was measured many years ago [2] to be 10.86(2) D using molec-ular beam electric resonance techniques. There were three motiva-tions for the present optical Stark study of the (3,0) A1R+–X1R+
band of BaS. First, we want to to provide an independent determi-nation of the this unusually large~lel. Second, we sought to improvethe accuracy of the previously reported dipole moments which iswarranted because of the high predictability of modern electronicstructure calculations. Finally, like BaO [3] a determination of theoptical Stark effect for BaS provides a convenient calibration stan-dard for our optical Stark spectrometer. The desired properties ofBaS as a calibration standard include rapid Stark tuning, ease ofgeneration, and the absence of hyperfine structure, which resultsin a simple optical spectrum.
The spectroscopy of BaS has been recently reviewed by Li et al.[4] in a manuscript describing the global fit of numerous visibleband systems. This detailed analysis included the simultaneously
ll rights reserved.
al Sciences at the Microscale,ce and Technology of China,
fitting of more than 1000 precisely measured optical lines [4,5]and numerous X1R+ pure rotational transitions recorded byJanczyk and Zuirys [6]. Consequently, the field-free opticalspectrum for the major isotopologue, 138Ba32S, is very well charac-terized. There are no previous reports of spectroscopic studiesinvolving a supersonic molecular beam samples of BaS. There areno published theoretical predictions of ground or excited ~lel valuesfor BaS.
2. Experiment
The production of a cold molecular beam sample of BaS wassimilar to that used previously for BaO [3]. A rotating 6 mm diam-eter barium rod was ablated at 20 Hz with approximately 2 mJ of532 nm output from a Q-switched pulsed Nd:YAG laser in thesupersonic expansion of an Ar/CS2 gas mixture. A relatively highpressure of approximately 600 PSI and low ablation energy wasused to facilitate cold beam production. The partial pressure ofCS2 is estimated to approximately 8 PSI (i.e. the room temperaturevapor pressure). The supersonic free-jet expansion was skimmedto produce a well-collimated molecular beam in a differentiallypumped molecular beam machine. Approximately 50 mW of radi-ation derived from a single longitudinal mode, continuous wavedye laser was used to excite lines in the (3,0) A1R+–X1R+ band near653.5 nm. The resulting laser-induced fluorescence (LIF) wasviewed through a 750 nm long-wave pass filter. Off-resonancedetection was used to minimize background scattered laser light.The Stark shifts were measured by simultaneously recording thetransmission of two confocal etalons (free spectra ranges of74.5 MHz and 750.956 MHz). The static electric field strengths ofup to 3200 V/cm were generated by application of a voltage across
1 +X
1 +A
|M |J
0
01
-400 -200 0 200 400 600 800 1000
E=574.7V/cm
A) Field Free
C) Parallel
B) PerpendicularE=574.7V/cm
a
b
cJ =0
J =1
b ca
Stark Shift(MHz)
LIF
Sig
nal
Σ
Σ
(v =3)
(v =0)
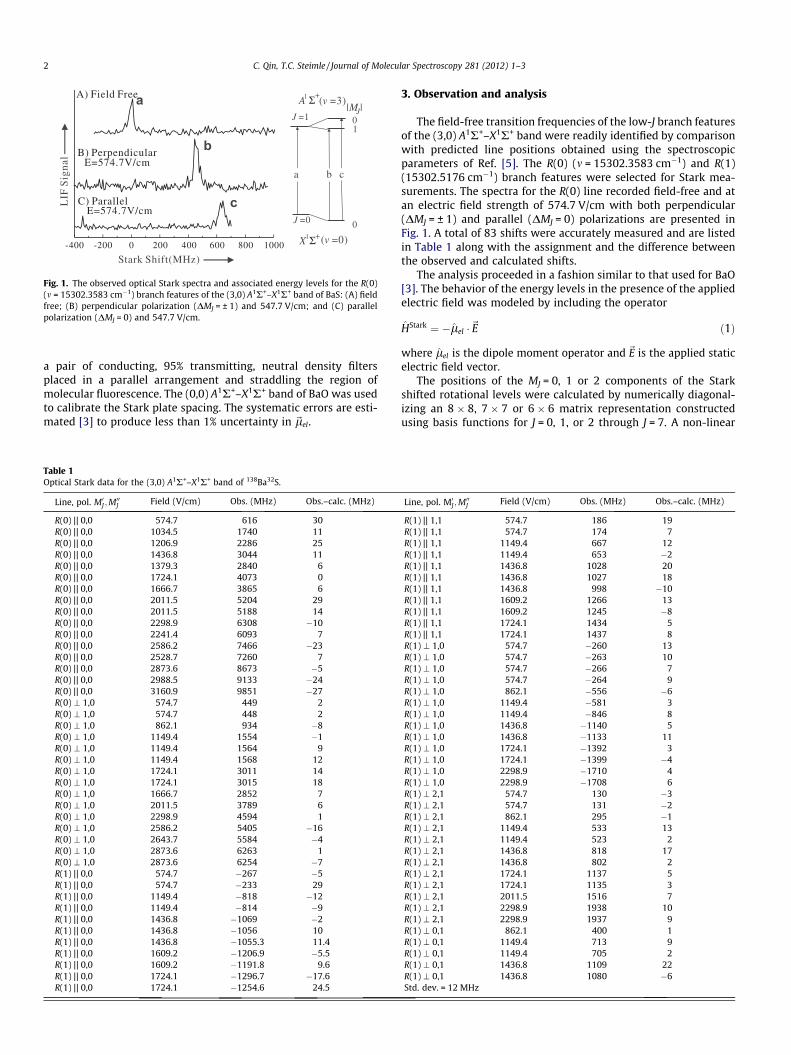
Fig. 1. The observed optical Stark spectra and associated energy levels for the R(0)(m = 15302.3583 cm�1) branch features of the (3,0) A1R+–X1R+ band of BaS: (A) fieldfree; (B) perpendicular polarization (DMJ = ± 1) and 547.7 V/cm; and (C) parallelpolarization (DMJ = 0) and 547.7 V/cm.
2 C. Qin, T.C. Steimle / Journal of Molecular Spectroscopy 281 (2012) 1–3
a pair of conducting, 95% transmitting, neutral density filtersplaced in a parallel arrangement and straddling the region ofmolecular fluorescence. The (0,0) A1R+–X1R+ band of BaO was usedto calibrate the Stark plate spacing. The systematic errors are esti-mated [3] to produce less than 1% uncertainty in ~lel.
Table 1Optical Stark data for the (3,0) A1R+–X1R+ band of 138Ba32S.
Line, pol. M0J ;M00J Field (V/cm) Obs. (MHz) Obs.–calc. (MHz)
R(0) || 0,0 574.7 616 30R(0) || 0,0 1034.5 1740 11R(0) || 0,0 1206.9 2286 25R(0) || 0,0 1436.8 3044 11R(0) || 0,0 1379.3 2840 6R(0) || 0,0 1724.1 4073 0R(0) || 0,0 1666.7 3865 6R(0) || 0,0 2011.5 5204 29R(0) || 0,0 2011.5 5188 14R(0) || 0,0 2298.9 6308 �10R(0) || 0,0 2241.4 6093 7R(0) || 0,0 2586.2 7466 �23R(0) || 0,0 2528.7 7260 7R(0) || 0,0 2873.6 8673 �5R(0) || 0,0 2988.5 9133 �24R(0) || 0,0 3160.9 9851 �27R(0) \ 1,0 574.7 449 2R(0) \ 1,0 574.7 448 2R(0) \ 1,0 862.1 934 �8R(0) \ 1,0 1149.4 1554 �1R(0) \ 1,0 1149.4 1564 9R(0) \ 1,0 1149.4 1568 12R(0) \ 1,0 1724.1 3011 14R(0) \ 1,0 1724.1 3015 18R(0) \ 1,0 1666.7 2852 7R(0) \ 1,0 2011.5 3789 6R(0) \ 1,0 2298.9 4594 1R(0) \ 1,0 2586.2 5405 �16R(0) \ 1,0 2643.7 5584 �4R(0) \ 1,0 2873.6 6263 1R(0) \ 1,0 2873.6 6254 �7R(1) || 0,0 574.7 �267 �5R(1) || 0,0 574.7 �233 29R(1) || 0,0 1149.4 �818 �12R(1) || 0,0 1149.4 �814 �9R(1) || 0,0 1436.8 �1069 �2R(1) || 0,0 1436.8 �1056 10R(1) || 0,0 1436.8 �1055.3 11.4R(1) || 0,0 1609.2 �1206.9 �5.5R(1) || 0,0 1609.2 �1191.8 9.6R(1) || 0,0 1724.1 �1296.7 �17.6R(1) || 0,0 1724.1 �1254.6 24.5
3. Observation and analysis
The field-free transition frequencies of the low-J branch featuresof the (3,0) A1R+–X1R+ band were readily identified by comparisonwith predicted line positions obtained using the spectroscopicparameters of Ref. [5]. The R(0) (m = 15302.3583 cm�1) and R(1)(15302.5176 cm�1) branch features were selected for Stark mea-surements. The spectra for the R(0) line recorded field-free and atan electric field strength of 574.7 V/cm with both perpendicular(DMJ = ± 1) and parallel (DMJ = 0) polarizations are presented inFig. 1. A total of 83 shifts were accurately measured and are listedin Table 1 along with the assignment and the difference betweenthe observed and calculated shifts.
The analysis proceeded in a fashion similar to that used for BaO[3]. The behavior of the energy levels in the presence of the appliedelectric field was modeled by including the operator
HStark ¼ �lel �~E ð1Þ
where lel is the dipole moment operator and~E is the applied staticelectric field vector.
The positions of the MJ = 0, 1 or 2 components of the Starkshifted rotational levels were calculated by numerically diagonal-izing an 8 � 8, 7 � 7 or 6 � 6 matrix representation constructedusing basis functions for J = 0, 1, or 2 through J = 7. A non-linear
Line, pol. M0J ;M00J Field (V/cm) Obs. (MHz) Obs.–calc. (MHz)
R(1) || 1,1 574.7 186 19R(1) || 1,1 574.7 174 7R(1) || 1,1 1149.4 667 12R(1) || 1,1 1149.4 653 �2R(1) || 1,1 1436.8 1028 20R(1) || 1,1 1436.8 1027 18R(1) || 1,1 1436.8 998 �10R(1) || 1,1 1609.2 1266 13R(1) || 1,1 1609.2 1245 �8R(1) || 1,1 1724.1 1434 5R(1) || 1,1 1724.1 1437 8R(1) \ 1,0 574.7 �260 13R(1) \ 1,0 574.7 �263 10R(1) \ 1,0 574.7 �266 7R(1) \ 1,0 574.7 �264 9R(1) \ 1,0 862.1 �556 �6R(1) \ 1,0 1149.4 �581 3R(1) \ 1,0 1149.4 �846 8R(1) \ 1,0 1436.8 �1140 5R(1) \ 1,0 1436.8 �1133 11R(1) \ 1,0 1724.1 �1392 3R(1) \ 1,0 1724.1 �1399 �4R(1) \ 1,0 2298.9 �1710 4R(1) \ 1,0 2298.9 �1708 6R(1) \ 2,1 574.7 130 �3R(1) \ 2,1 574.7 131 �2R(1) \ 2,1 862.1 295 �1R(1) \ 2,1 1149.4 533 13R(1) \ 2,1 1149.4 523 2R(1) \ 2,1 1436.8 818 17R(1) \ 2,1 1436.8 802 2R(1) \ 2,1 1724.1 1137 5R(1) \ 2,1 1724.1 1135 3R(1) \ 2,1 2011.5 1516 7R(1) \ 2,1 2298.9 1938 10R(1) \ 2,1 2298.9 1937 9R(1) \ 0,1 862.1 400 1R(1) \ 0,1 1149.4 713 9R(1) \ 0,1 1149.4 705 2R(1) \ 0,1 1436.8 1109 22R(1) \ 0,1 1436.8 1080 �6Std. dev. = 12 MHz
Table 2Dipole moments, bond lengths and reduced dipole moments for BaO and BaS.
BaS X1Rþ ðv ¼ 0Þ BaS A1Rþ ðv ¼ 3Þ BaO X1Rþ ðv ¼ 0Þ BaO A1Rþ ðv ¼ 0Þ
|~lel| (D) 10.765(8) 5.586(22) 7.869(17)a 3.125(16)a
rv (Å) 2.5092b 2.6657b 1.9419c 2.1359c
j~lel jrm
(D/Å) 4.290 2.095 4.052 1.463
a Ref. [3].b Ref. [5].c Ref. [7].
C. Qin, T.C. Steimle / Journal of Molecular Spectroscopy 281 (2012) 1–3 3
least square fitting program was written to fit the BaS Stark shiftsof Table 1. The determined j~lelj values are 10.765(8) D and5.586(22) D for the X1R+(v = 0) and A1R+(v = 3) states, respectively,with a correlation coefficient of �0.016. The errors represent a 2rstatistical estimate. The standard deviation of a fit is 12 MHz,which is commensurate with the measurement uncertainties.
4. Discussion and summary
The measured j~lelj values, bond lengths, rv, and reduced dipolemoments, j~lelj=rv , for the BaS and BaO are presented in Table 2. Thebond lengths for BaS and BaO are derived from the rotational con-stants of Refs. [5,7], respectively. Although the experiment can onlydetermine j~lelj; it is reasonable to assume that the charge distribu-tion in both the X1R+ and A1R+ states is Ba+dS�d. The experimentalvalues suggest that the point charge distribution are Ba+1S�1 andBa+1O�1, which predicts j~lelj values of �12 D and �9 D, respec-tively. Back donation of the O and S-centered charge into theempty d-orbitals and polarization of the metal-centered 6s orbitalreduces j~lelj [8] in comparison to this simple ‘‘zeroth-order’’ pic-ture. A comparison of the reduced dipole moments of BaS andBaO is more insightful than that of j~lelj because it focuses on thedifference in electronic contribution. The observation that j~lelj=rv
is slightly smaller for BaO (=4.052 D/Å) than for BaS (=4.290 D/Å)can be attributed to polarization effects of the Ba-metal centeredelectrons. Such effects are smaller in the case of BaS because ofthe longer bond distance. There is great reduction in j~lelj=rv uponexcitation to the A1R+ state. The primary configurations for theA1R+ and X1R+ states have been proposed [9] to be:
15r216r24p4 ! X1Rþ ð2Þ
15r216r14p417r1 ! A1Rþ and b3Rþ ð3Þ
where the 15r, 16r, and 4p orbitals are S-centered and the 17r isBa-centered. The large reduction (nearly ½) in j~lelj and j~lelj=rv uponX1R+ to A1R+ excitation is consistent with this molecular orbitaldescription because the 16r ? 17r promotion corresponds to a Sto Ba charge transfer.
In summary, the permanent electric dipole moments for theA1R+ (v = 3) and X1R+ (v = 0) states have been determined. Carehas been taken to minimize systematic sources of error whichare estimated to be <1%. The newly determined ~lel (X1R+ (v = 0))value is slightly smaller than the MBER value (=10.86(2) D) andsomewhat more precisely determined. The determined ~lel (A1R+)value is in qualitative agreement with a molecular orbital correla-tion description. A high level theoretical prediction of ~lel for theA1R+ and X1R+ states of BaS would be useful.
Acknowledgments
This research has been supported by a Grant from the NationalScience Foundation (CHE 1011996). Mr. Chengbing Qin thanks theState Scholarship Fund of China Scholarship Council for financialsupport.
References
[1] T.C. Steimle, Int. Rev. Phys. Chem. 19 (2000) 455–477.[2] C.A. Melendres, A.J. Herbert, K. Street, J. Chem. Phys. 51 (1969) 855–856.[3] F. Wang, T.C. Steimle, Chem. Phys. Lett. 484 (2010) 110–112.[4] G. Li, J.-G. Wang, P.F. Bernath, J. Mol. Spectrosc. 271 (2012) 10–14.[5] Z. Morbi, P.F. Bernath, J. Mol. Spectrosc. 171 (1995) 210–222.[6] A. Janczyk, L.M. Ziurys, J. Mol. Spectrosc. 236 (2006) 11–15.[7] R.F. Field, A.D. English, T. Tanaka, D.O. Harris, D.A. Jennings, J. Chem. Phys. 59
(1973) 2191–2203.[8] G. Pacchioni, F. Illas, Chem. Phys. 199 (1995) 155–162.[9] P.G. Cummins, R.W. Field, I. Renhorn, J. Mol. Spectrosc. 90 (1981) 327–352.