presentation4 -principles of economics
TRANSCRIPT

ENG. KAREEM H. MOKHTAR

SUPPLY AND DEMAND TOGETHER
Equilibrium: P has reached the level where quantity supplied equals quantity demanded

EQUILIBRIUM PRICE:
• the price that equates quantity supplied with quantity demanded
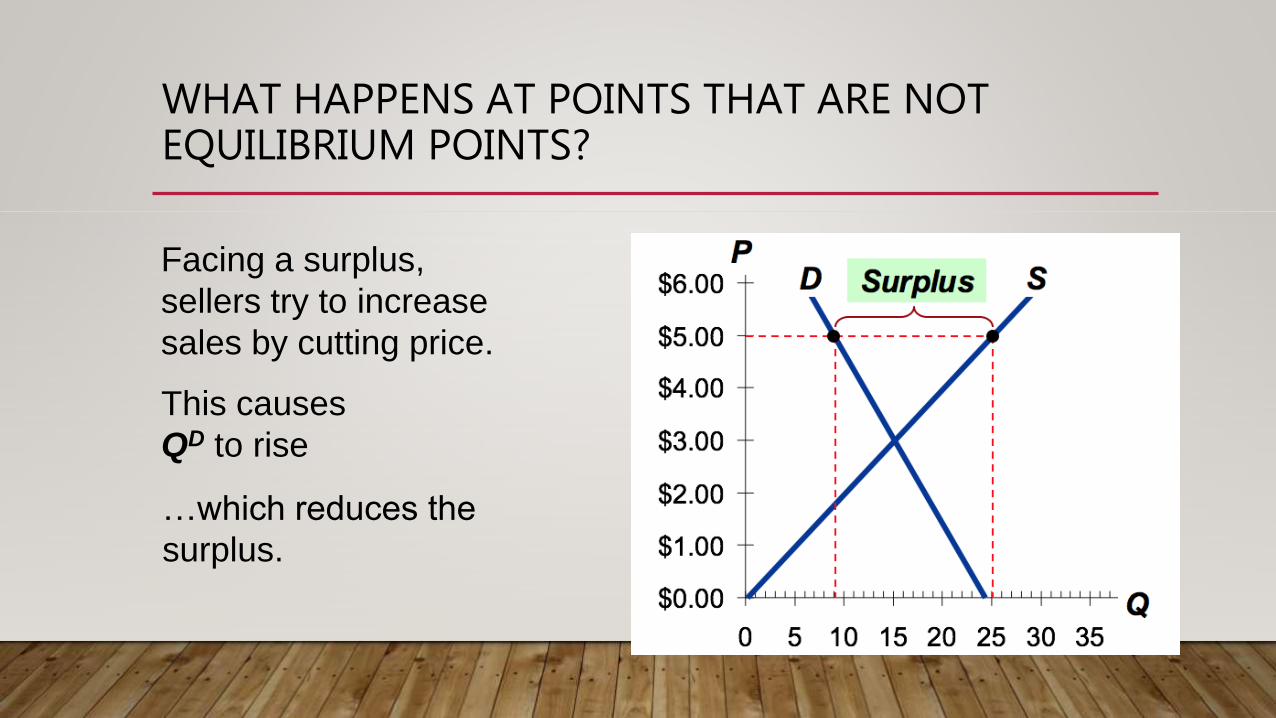
WHAT HAPPENS AT POINTS THAT ARE NOT EQUILIBRIUM POINTS?
Facing a surplus,
sellers try to increase
sales by cutting price.
This causes
QD to rise
…which reduces the
surplus.

WHAT HAPPENS AT POINTS THAT ARE NOT EQUILIBRIUM POINTS?
Facing a shortage,
sellers raise the price,
causing QD to fall
…which reduces the
shortage.
and QS to rise,
ANALYSIS
• To determine the effects of any event,
• 1. Decide whether event shifts S curve, D curve, or both.
• 2. Decide in which direction curve shifts.
• 3. Use supply-demand diagram to see how the shift changes equilibrium P
and Q
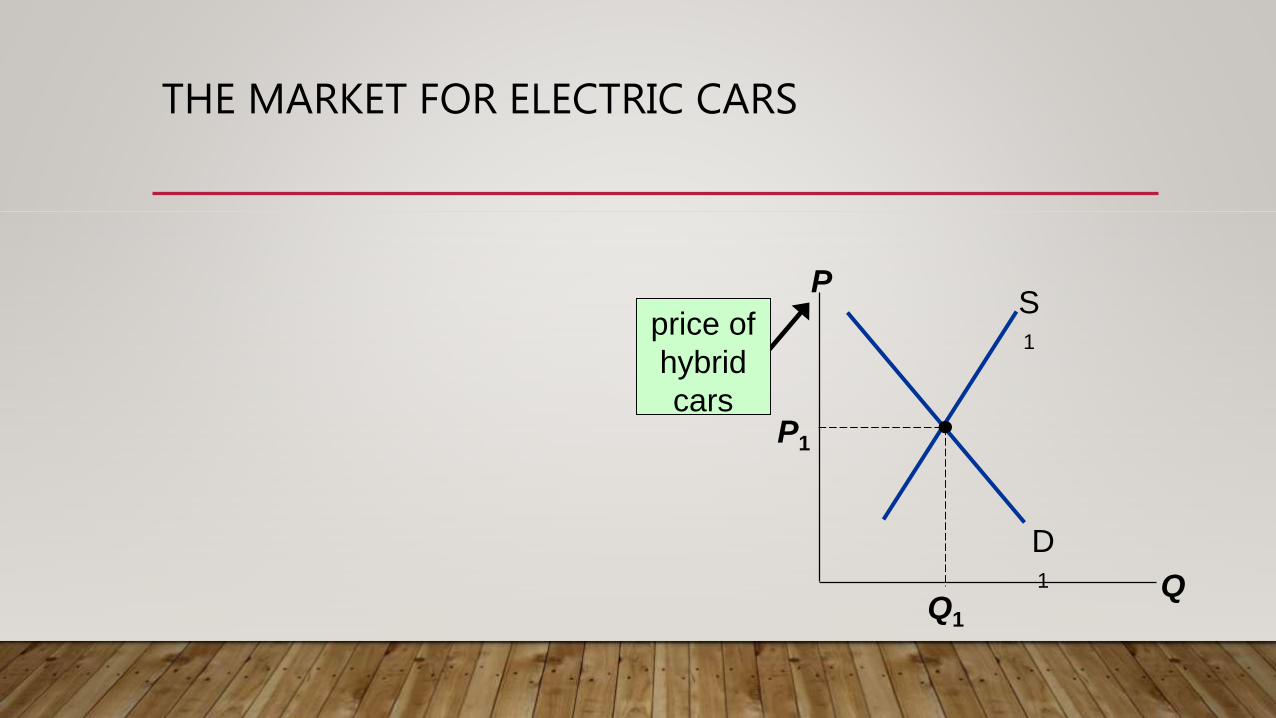
THE MARKET FOR ELECTRIC CARS
P
Q
D1
S1
P1
Q1
price of
hybrid
cars

INCREASE IN PRICE OF GASOLINE
P
Q
D1
S1
P1
Q1
D2
P2
Q2
D curve shifts because price of gas affects demand.
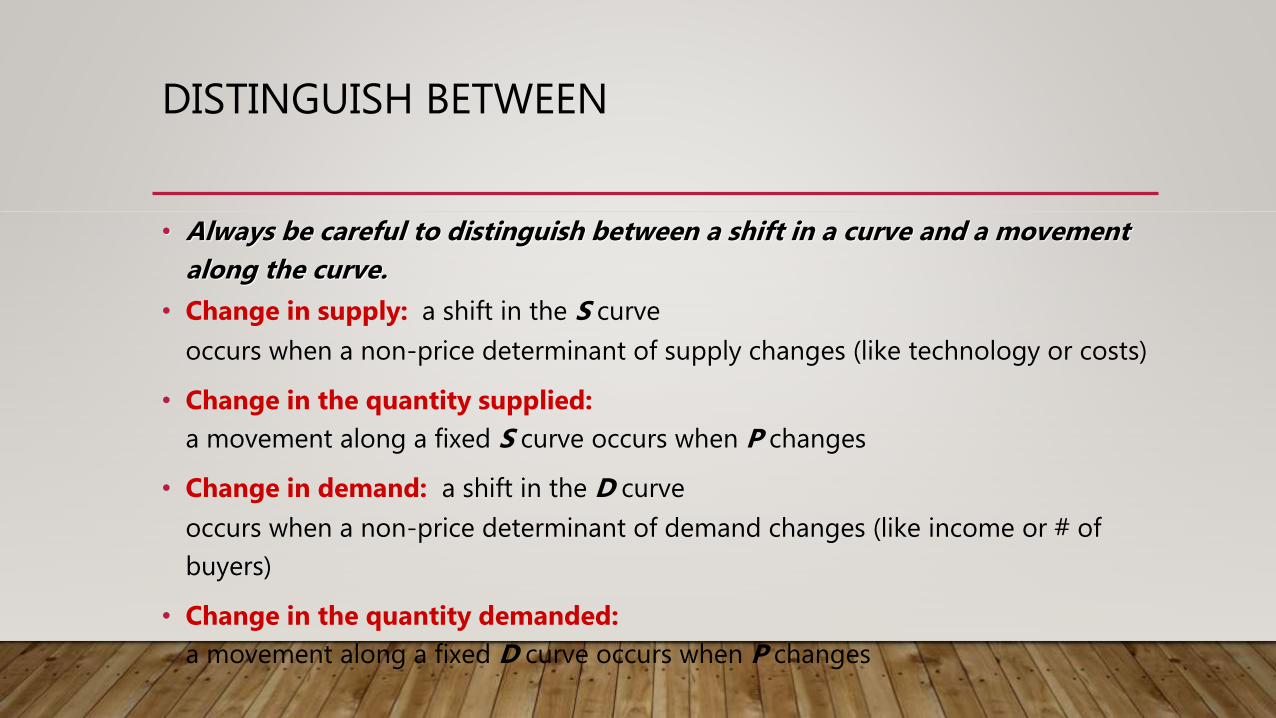
DISTINGUISH BETWEEN
• Always be careful to distinguish between a shift in a curve and a movement
along the curve.
• Change in supply: a shift in the S curve
occurs when a non-price determinant of supply changes (like technology or costs)
• Change in the quantity supplied:
a movement along a fixed S curve occurs when P changes
• Change in demand: a shift in the D curve
occurs when a non-price determinant of demand changes (like income or # of
buyers)
• Change in the quantity demanded:
a movement along a fixed D curve occurs when P changes
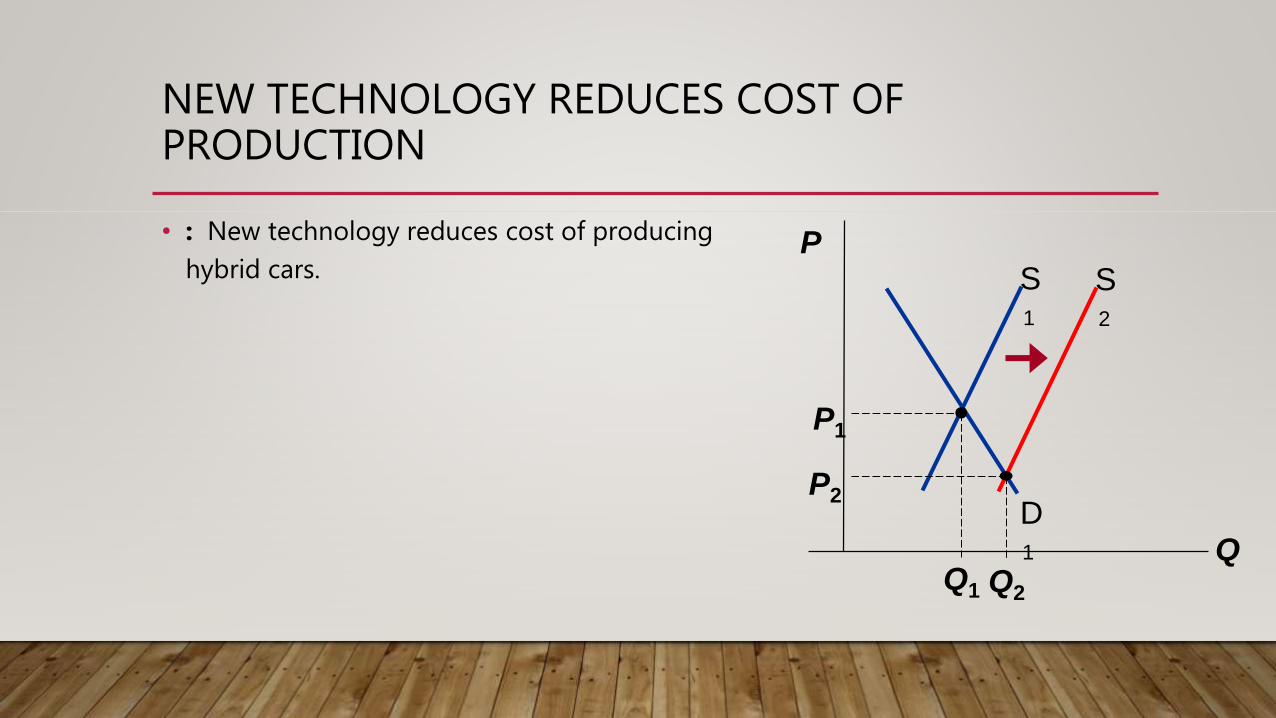
NEW TECHNOLOGY REDUCES COST OF PRODUCTION
• : New technology reduces cost of producing
hybrid cars.
D1
S1
P1
Q1
S2
P2
Q2
P
Q

PRICE OF GAS RISES AND NEW TECHNOLOGY REDUCES PRODUCTION COSTS
D1
S1
P1
Q1
S2
D2
P
Q
S2
P2
Q2
P3
Q3

EXERCISE
Use the three-step method to analyze the effects of each
event on the equilibrium price and quantity of music
downloads.
Event A: A fall in the price of CDs
Event B: Sellers of music downloads negotiate a
reduction in the royalties they must pay for each song
they sell.
Event C: Events A and B both occur

FALL IN PRICE OF CDS
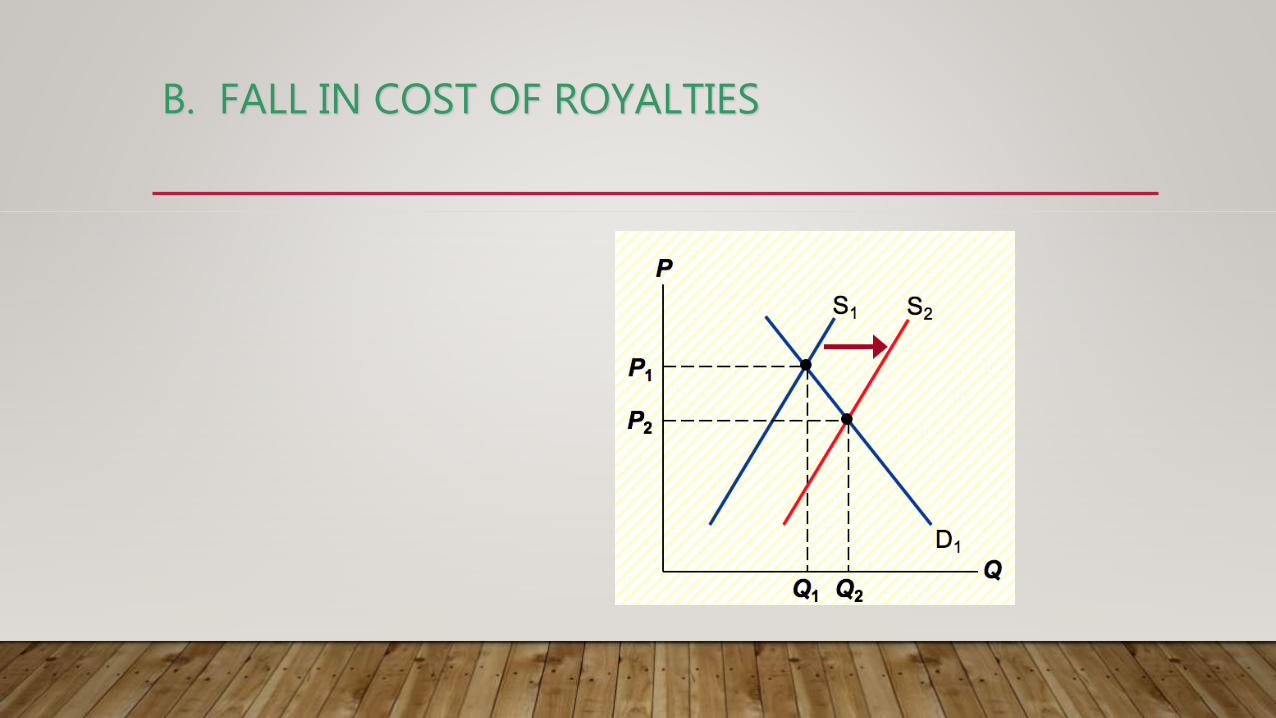
B. FALL IN COST OF ROYALTIES

A AND B TOGETHER