proton-switchable vapochromic behaviour of a … supporting information proton-switchable...
TRANSCRIPT

S1
Supporting Information
Proton-Switchable Vapochromic Behaviour of a Platinum(II)-Carboxy-Terpyridine Complex
Atsushi Kobayashi,* Shiori Oizumi, Yasuhiro Shigeta, Masaki Yoshida, and Masako Kato*
Department of Chemistry, Faculty of Science, Hokkaido University, North 10 West 8, Kita-ku,
Sapporo, Hokkaido 060-0810
Contents
Figure S1. The positions of disordered water molecules in 1·3.5H2O. Figure S2. IR spectrum of [1H]Cl·3H2O after exposing to MeCN vapour.
Figure S3. Thermogravimetric analysis for [1H]Cl·3H2O.
Figure S4. 1H NMR spectra of [1H]Cl·3H2O and after exposing it to MeCN vapour.
Figure S5. Change of luminescence spectrum of [1H]Cl·3H2O under exposure to MeCN vapour.
Figure S6. UV-Vis absorption spectra in DMSO of [1H]Cl·3H2O and after exposing it to MeCN
vapour.
Figure S7. Changes of PXRD pattern of [1H]Cl·3H2O by exposure to polar vapours.
Figure S8. Changes of PXRD pattern of [1H]Cl·3H2O by exposure to non-polar vapours.
Figure S9. Temperature dependence of the PXRD pattern of [1H]Cl·3H2O.
Figure S10. Changes of luminescence spectrum and PXRD pattern of 1·H2O by exposure to MeCN
or CH2Cl2 vapour.
Figure S11. Changes of PXRD pattern of 1·H2O of by exposing it to humid HCl vapour
Figure S12. 1H NMR spectrum of [1H]Cl·3H2O after exposing to triehtylamine vapour for 3 days at
30 °C.
Figure S13. Changes of PXRD pattern and IR spectrum of 1·H2O of by exposing it to humid HNO3
or CH3COOH vapour.
Electronic Supplementary Material (ESI) for Dalton Transactions.This journal is © The Royal Society of Chemistry 2016

S2
Figure S1. The positions of disordered water molecules between the adjacent two complex
molecules in 1·3.5H2O.
Figure S2. IR spectra of [1H]Cl·3H2O before and after exposure to MeCN vapour for 3 days at
room temperature.

S3
Figure S3. Thermogravimetric analysis for [1H]Cl·3H2O in N2 atmosphere. Observed weight loss
(8.8 % at 250 min heating) is quantitatively agreed with the amount of the three hydrated water
molecules (9.0 %) in the [1H]Cl3H2O.

S4
Figure S4. 1H NMR spectra (DMSO-d6) of as-synthesized [1H]Cl·3H2O (blue) and after exposure
to MeCN vapour for 3 days at room temperature (black). The inset shows the magnification of the
aromatic region from 7.5 to 9.5 ppm. The signal of OH proton of carboxylic acid group was not
observed probably due to the rapid exchange with protons of water molecules.

S5
Figure S5. Change of luminescence spectrum of [1H]Cl·3H2O before (black) and after (red)
exposure to MeCN vapour for 3 days at room temperature.
Figure S6. UV-Vis absorption spectra in DMSO of as-synthesized [1H]Cl·3H2O (blue) and after
exposure to MeCN vapour for 3 days at room temperature (black).

S6
Figure S7. Changes of PXRD pattern of [1H]Cl·3H2O under exposing to various organic solvent
vapours for 3 days at 30 °C. The top red line shows the simulation pattern calculated from the crystal
structure of the protonated monohydrate [1H]ClH2O.

S7
Figure S8. Changes of PXRD pattern of [1H]Cl·3H2O after exposure to Et2O or hexane vapour for
3 days at 30 °C.

S8
Figure S9. Temperature-dependence of PXRD pattern of [1H]Cl·3H2O.
S9
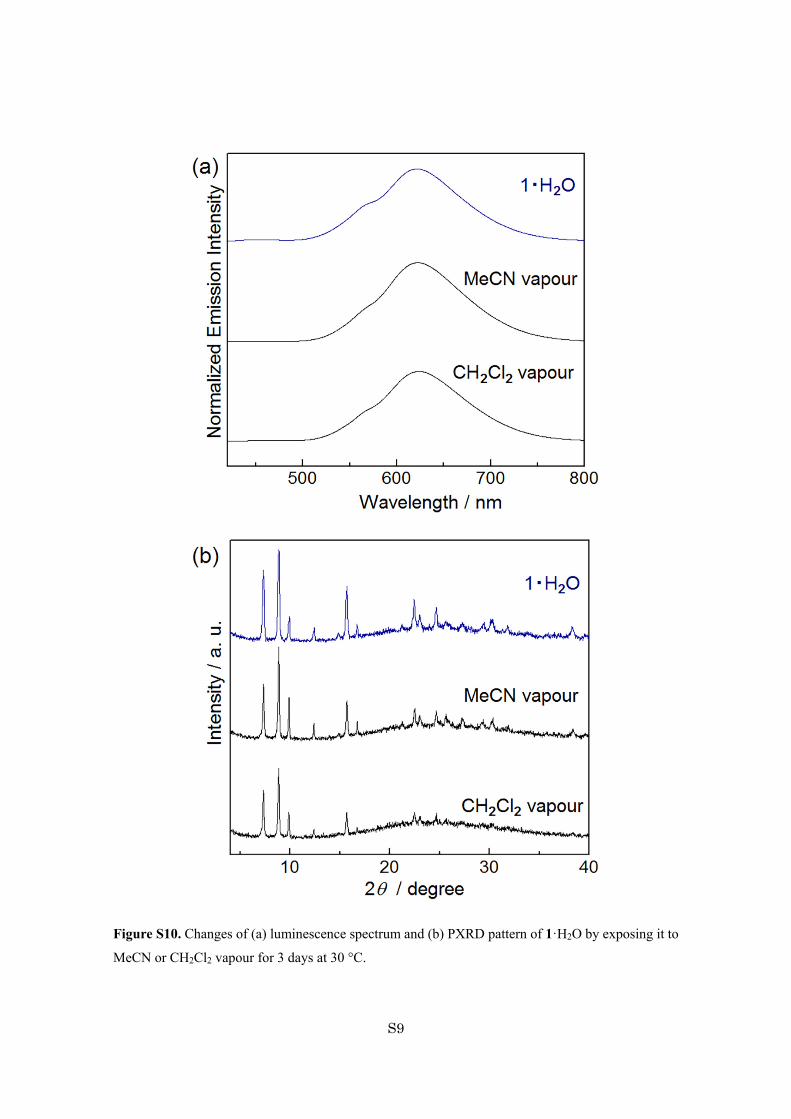
Figure S10. Changes of (a) luminescence spectrum and (b) PXRD pattern of 1·H2O by exposing it to
MeCN or CH2Cl2 vapour for 3 days at 30 °C.
S10
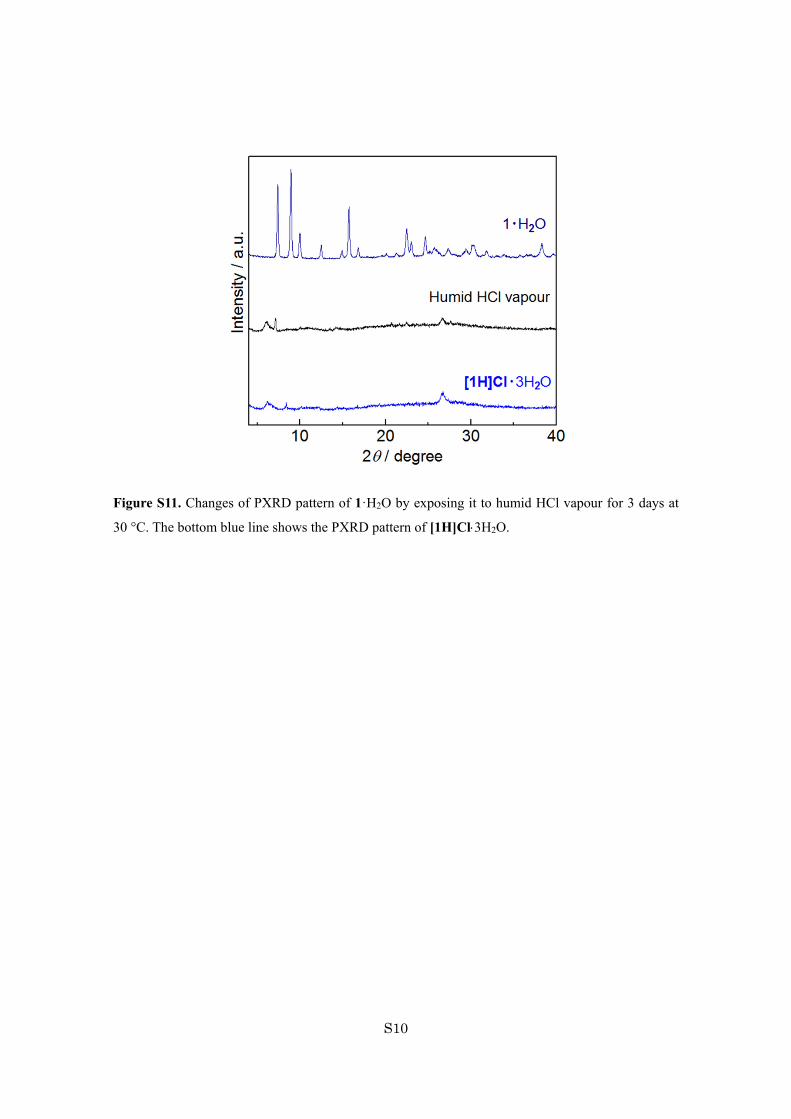
Figure S11. Changes of PXRD pattern of 1·H2O by exposing it to humid HCl vapour for 3 days at
30 °C. The bottom blue line shows the PXRD pattern of [1H]Cl3H2O.

S11
Figure S12. 1H NMR spectrum of [1H]Cl·3H2O after exposing it to triethylamine vapour (4%ND3 in
D2O). The inset shows the magnification of the aromatic region from 7.5 to 9.0 ppm. The ratio of
integral intensities of the signals B to b is 9 : 2, indicating the formation of the equimolar amount of
the complex 1 and [TEA-H]+Cl.

S12
Figure S13. Changes of (a) PXRD pattern and (b) IR spectrum of 1H2O under exposure to humid
HNO3 or CH3COOH vapour at room temperature. The bottom blues lines show the pattern and
spectrum of the dark-blue protonated form [1H]Cl3H2O. The blue and black dotted lines in (b)
indicate the positions of the (C=O) modes of carboxy groups of protonated [1H]Cl3H2O and
deprotonated 1H2O, respectively.