quantifying the contribution of climate and underlying
TRANSCRIPT
R E S E A R CH A R T I C L E
Quantifying the contribution of climate and underlying surfacechanges to alpine runoff alterations associated with glaciermelting
Jiali Xin1 | Xiaoyu Sun1 | Liu Liu1,2 | Hao Li1 | Xingcai Liu3 | Xiuping Li4 |
Lei Cheng5,6,7 | Zongxue Xu8,9
1College of Water Resources and Civil
Engineering, China Agricultural University,
Beijing, China
2Center for Agricultural Water Research in
China, China Agricultural University, Beijing,
China
3Institute of Geographic Sciences and Natural
Resources Research, Chinese Academy of
China, Beijing, China
4Institute of Tibetan Plateau Research,
Chinese Academy of China, Beijing, China
5State Key Laboratory of Water Resources and
Hydropower Engineering Science, Wuhan
University, Wuhan, China
6Hubei Provincial Collaborative Innovation
Center for Water Resources Security, Wuhan,
China
7Hubei Provincial Key Lab of Water System
Science for Sponge City Construction, Wuhan
University, Wuhan, China
8College of Water Sciences, Beijing Normal
University, Beijing, China
9Beijing Key Laboratory of Urban Hydrological
Cycle and Sponge City Technology, Beijing, China
Correspondence
Liu Liu, College of Water Resources and Civil
Engineering, China Agricultural University,
Beijing 100083, China.
Email: [email protected]
Funding information
National Natural Science Foundation of China,
Grant/Award Numbers: 51961145104,
91647202, 41890822; National Training
Program of Innovation and Entrepreneurship
for Undergraduates, Grant/Award Number:
202010019052
Abstract
Climate variability and underlying surface changes are strongly associated with runoff
alterations. The Yarlung Zangbo River Basin (YZRB) is a typical alpine region located in
the southeast Qinghai–Tibet Plateau, where runoff is particularly sensitive and vulnera-
ble to climate and environmental changes. Here, we conducted a quantitative assess-
ment of the contributions of climate variability and underlying surface changes to runoff
alterations from 1966 to 2015 in the upper, middle, and lower regions of the YZRB. The
year 1997 was identified as the runoff breakpoint in all three sub-regions, which divided
the runoff time series into the baseline period (1966–1997) and change period
(1998–2015). An adjusted Budyko framework accounting for glacier runoff was devel-
oped to conduct a runoff alteration attribution analysis. The results indicated that the
increase in runoff in the upper region was dominated by changes in the underlying sur-
face and glacier runoff, whose contribution accounted for 59.61 and 49.18%, respec-
tively. The runoff increase in the middle and lower regions was mainly attributed to the
increase in precipitation, accounting for 39.36 and 129.21% of the total runoff alteration,
respectively. Moreover, due to the little variation in vegetation and degradation of per-
mafrost in the upper region, increases in runoff might be largely attributed to increases
in subsurface runoff caused by the melting of permafrost. In the middle region, in addi-
tion to increased precipitation, vegetation degradation had positive effects on runoff
increases. The lower region exhibited far higher water consumption rates due to its
extensive and dense vegetation coverage accompanied by rising temperature, which
resulted in a negative contribution (−58.74%) to runoff alteration. Our findings may
therefore have important implications for water resource security and sustainable devel-
opment in alpine regions.
K E YWORD S
Budyko, climate change, glacier, permafrost, Qinghai–Tibet Plateau, runoff
1 | INTRODUCTION
Global climate change has significantly altered the hydrological cycle
by affecting associated hydrological variables such as precipitation,
evapotranspiration, and soil moisture (Allan & Soden, 2008; Fang
et al., 2018; Tong et al., 2018; Yang & Yang, 2012; Zhao, Ding,
et al., 2019; Zhao, Yang, et al., 2019). However, hydrological dynamics
are a complex nonlinear system, whose fluctuations could be
Received: 8 September 2020 Revised: 26 January 2021 Accepted: 27 January 2021
DOI: 10.1002/hyp.14069
Hydrological Processes. 2021;35:e14069. wileyonlinelibrary.com/journal/hyp © 2021 John Wiley & Sons Ltd 1 of 26
https://doi.org/10.1002/hyp.14069
attributed to climate change, and underlying surface changes (Wang
et al., 2008; Zhang, Shoemaker, et al., 2013). Runoff is considered a
basin-scale hydrological cycle outlet and plays an important role in
agricultural irrigation, ecological protection and economic develop-
ment. Importantly, characterizing this phenomenon is critical, to
understand hydrological cycle alterations caused by climate variability
and underlying surface change (Li et al., 2016). Although some studies
have conducted runoff attribution analyses in alpine regions, which
are typically the origin of river headwaters and represent an important
water resource for billions of people (Cong et al., 2017; Feng
et al., 2017; Liu, Chen, et al., 2019), spatio-temporal variations in run-
off and their causes remain unclear due to sparse on-site measure-
ments and the complexity of meltwater runoff generation
mechanisms (Fernández, 1998; Gabbi et al., 2014; Hock &
Holmgren, 2005; Tuteja & Cunnane, 1997; Xing & Zheng, 2003).
Several studies have conducted runoff alteration attribution ana-
lyses using various methods based on different theories. The most
widely used methods can be classified into three types: statistical
methods (Tang et al., 2010; Zhang et al., 2008, 2011; Zhang, Wei,
et al., 2012), hydrological models (Chen et al., 2005; Chiew
et al., 2009; Im et al., 2009; Zhang, Zhang, et al., 2012), and the paired
catchment method (Bi et al., 2009; Brown et al., 2005; Gafur
et al., 2003), each of which possesses its own unique limitations. For
instance, although statistical methods can be implemented relatively
easily, they are known to lack physical foundations and require large
and long-term hydrological and meteorological datasets for runoff
attribution quantitative analysis (Zeng et al., 2014). Hydrological
models facilitate rigorous physical interpretations and play an impor-
tant role in exploring the water cycle. However, due to their relatively
high forcing dataset requirements, conducting studies based on
hydrological models can be rather challenging when the necessary
data is not available (Wang et al., 2013). Moreover, due to the inher-
ent defects of calibration methods, model parameter calibration is not
always accurate, which increases the uncertainty of the simulation
results (Beven & Binley, 1992; Kirchner, 2006). The paired catchment
method is not suitable for large watersheds due to the regional size
restrictions inherent to this approach, which eliminates the effects of
climate change to allow for an effective assessment of the impact of
land cover changes on hydrological processes (Huang et al., 2003).
Compared with the above-described methods, the Budyko framework
requires fewer parameters, which facilitates the estimation of the con-
tributions of climate variability and underlying surface changes to run-
off alteration in a more intuitive way and with a clear physical basis.
According to the Budyko hypothesis (Budyko, 1974), the hydrother-
mal coupling equilibrium equation of the watershed was constructed
to evaluate individual elements of the hydrological cycle and discuss
their response to climate change and the underlying surface. Several
recent studies have validated the Budyko hypothesis and have con-
firmed its outstanding accuracy in large catchments and long-time
scales (He, Qiu, et al., 2019; He, Song, et al., 2019; Li, Su, et al., 2014;
Ning et al., 2016; Xu et al., 2014; Zuo et al., 2014). Therefore, the
Budyko framework was adopted in this study to conduct runoff alter-
ation attribution analyses in the Yarlung Zangbo River Basin (YZRB),
where hydro-meteorological data are scarce and the physical mecha-
nisms of runoff generation are complex (Li, Zhang, et al., 2014; Liu,
Xu, et al., 2019; Zhao et al., 2017). Some studies have applied the
Budyko framework to alpine regions by adjusting the framework
based on the distinctive mechanisms of runoff generation in these
sites, including precipitation, snow melting, and permafrost, among
others. Based on the Budyko framework, Zhang et al. (2015) devel-
oped a Budyko-type equation that accounted for the snow ratio and
water-energy balance to quantify the effects of snow ratios on runoff.
To analyse streamflow responses to frozen ground degradation in the
source region of the Yellow River, Wang et al. (2018) developed a
decomposition method that separated the runoff changes caused by
frozen ground degradation using the Budyko framework. Neverthe-
less, few studies have been conducted to explicitly investigate and
quantify the elasticity and contribution of glacier runoff to the total
runoff in alpine regions, and therefore this topic demands urgent
attention.
The Yarlung Zangbo River (YZR) is the largest river system in the
Qinghai–Tibet Plateau and represents an important channel for the
transportation of moisture (Tian et al., 2001). Thus, this river plays a
significant role in the hydrological cycle of the Asia high mountain
region, which is often referred to as the third pole. Moreover, the
Qinghai–Tibet Plateau is a typical alpine region with fragile ecology;
therefore, the river system in the YZRB is highly sensitive to climate
and environmental changes (Cao et al., 2006; Chaudhary &
Bawa, 2011; Immerzeel et al., 2009). Additionally, the hydro-
meteorological conditions in the YZRB are significantly elevation-
dependent, especially the effect of glacier melting and permafrost
degradation (Wang et al., 2018), which results in much more complex
runoff response mechanisms to climate change than those of other
basins. In recent years, several studies have focused on the changes in
water resources in the YZRB. For example, Cuo et al. (2019) analysed
the variation characteristics of runoff, precipitation, temperature, gla-
ciers, and other factors in the YZRB from 1979 to 2015 as well as the
relationship between each factor and runoff. In a study by
Chen (2012), changes in the YZRB flow from 1961 to 2000 were eval-
uated using the range of variable (RVA) approach. Additionally, due to
the complex topography and large altitude gradient of the YZRB, the
response of hydrological elements to climate change and underlying
surface changes in different regions of this basin are largely heteroge-
neous. Liu et al. (2014) divided the YZRB into five regions and pointed
out that the impacts of land use and climate change on runoff had sig-
nificant spatio-temporal variability. Wang (2015) investigated the tem-
poral and spatial characteristics of precipitation and runoff in the
YZRB from 1973 to 2013, revealing that there were obvious spatial
differences in the impacts of climate and geographical environmental
conditions on the water cycle in the basin. Nevertheless, most of
these studies are limited to the analyses of statistical characteristics
of hydrological and meteorological time series and therefore do not
provide insights into the potential variation mechanisms, making it dif-
ficult to comprehensively evaluate the response of YZRB runoff to cli-
mate variability and underlying surface changes. Therefore, exploring
the spatio-temporal heterogeneity and driving mechanism of runoff
2 of 26 XIN ET AL.
variation in the YZRB is critical to identify dominant influencing fac-
tors in different altitude zones.
Overall, the objectives of this study were: (a) to investigate the
long-term trends in the runoff, precipitation, and potential evapo-
transpiration of different YZRB regions from 1966 to 2015; (b) to
evaluate runoff sensitivity to climate changes (precipitation and
potential evapotranspiration) in different sub-regions, as well as gla-
cier runoff and underlying surface changes based on the adjusted
Budyko framework; and (c) to quantify the contributions of climate
variability and underlying surface changes to runoff variation and fur-
ther identify the driving mechanisms of runoff variation closely associ-
ated with significant altitude gradients. Our study, therefore, provides
important insights into the runoff variations in poorly gauged alpine
regions containing glaciers and permafrost, which may largely influ-
ence downstream water availability. Additionally, this study may shed
light on the impact of climate change on aquatic environments in
high-latitude regions.
2 | MATERIALS AND METHODS
2.1 | Study area
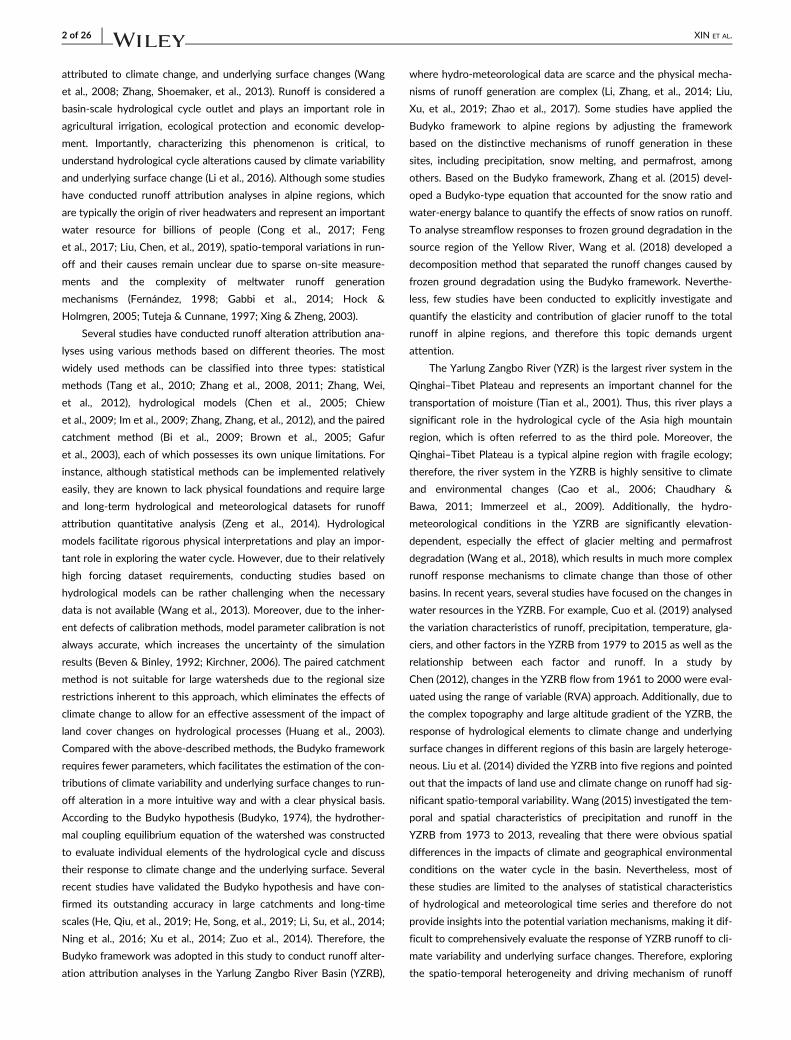
The Yarlung Zangbo River, located in the southern Qinghai–Tibet Pla-
teau (Figure 1a), originates from the glacier in the northern Himalayas
and it flows from west to east through southern Tibet (82–97.12�E
and 28–31.27�N), with a total length of approximately 2000 km and a
total area of �240 000 km2. The YZR is among the highest rivers in
the world, with an altitude span ranging from 133 m to over 7000 m
(Liu, Niu, et al., 2019). This river consists of many tributaries, including
F IGURE 1 Location of the YZRB (a); distribution of the hydrological stations and division of the sub-basins (b)
XIN ET AL. 3 of 26
five first-class tributaries with drainage areas greater than
10 000 km2, including the Lhasa, Nianchu, Parlung Zangbo, Nyang,
and Dogxung Zangbo rivers. In this study, the YZRB was divided into
four regions according to three hydrological stations distributed on
the YZR mainstream (Figure 1b). Due to a lack of in situ measure-
ments in the downstream of the Nuxia hydrological station, only three
regions defined as the upper, middle, and lower regions were selected
in this study (Figure 1b). Our study did not consider the region down-
stream of the Nuxia hydrological station. The runoff in each region
was determined by two adjacent hydrological stations, that is, runoff
in the upper region was determined by the Nugesha hydrological sta-
tion, whereas runoff in the middle and lower regions corresponded to
the differences between the Nugesha and Yangcun hydrological sta-
tions, and the Yangcun and Nuxia hydrological stations, respectively.
Due to the complex terrain and large altitude gradient in the YZRB,
the regional climate varies considerably from the upper region to the
lower region. The annual mean precipitation and runoff gradually
increased from the upper region to the lower region, indicating that the
gradual transition from the westerly region to the monsoon region domi-
nates the variation in precipitation. In the YZRB, significant differences in
climate also result in great spatial heterogeneities of vegetation, which is
closely related to runoff variation. The upper region exhibits the highest
average elevation (4994.2 m) in the entire basin and is therefore mostly
covered by alpine meadows. The middle region has the largest land
build-up in the YZRB and its vegetation is mostly comprised of grass-
lands. In contrast, the lower region receives the largest precipitation vol-
umes and is therefore mainly covered by forests and grasslands.
Furthermore, the YZRB is covered with extensive glaciers, with an area
of 4225 km2 accounting for approximately 2.1% of the total basin,
emphasizing the critical role of glacial meltwater in the basin's hydrologi-
cal dynamics (Yao et al., 2010).
2.2 | Data
Daily gridded data (0.25� × 0.25� spatial resolution) of downward surface
shortwaves, surface pressure, wind speed, and temperature during the
same period as the 1966 to 2015 runoff data collected from the Prince-
ton Global Forcings (http://hydrology.princeton.edu/data/) developed by
Sheffield et al. (2006). Daily precipitation data with a spatial resolution of
0.25� × 0.25� were extracted from the Long-term Land Surface Hydro-
logic Fluxes and States Dataset for China developed by Zhang
et al. (2014), which was verified by the gridded precipitation product of
the China Meteorological Data Service Center (CMA).
The permafrost distribution in the YZRB was obtained from the
National Tibetan Plateau/Third Pole Environment Data Center
(https://data.tpdc.ac.cn/en/data), which was based on the frozen gro-
und map of China and the Map of Glaciers, Frozen Ground, and
Deserts in China (1981–2006) (Wang et al., 2012).
The observed monthly runoff data from 1966 to 2015 at three
hydrological stations used in this study were provided by the Hydrol-
ogy and Water Resources Survey Bureau of the Tibet Autonomous
Region. The three hydrological stations, Nugesha, Yangcun, and Nuxia,
are located on the YZR mainstream from west to east, controlling over
80% of the total runoff in the entire YZRB.
The normalized difference vegetation index (NDVI) data used in this
study were obtained from the Global Inventory Monitoring and Modelling
System (GIMMS) (https://ecocast.arc.nasa.gov/data/pub/gimms/3g.v1/),
which spans from 1982 to 2015 with a spatial resolution of 8 km × 8 km.
Among numerous vegetation index datasets, the GIMMS-NDVI3g dataset
is regarded as one of the best datasets for estimating dynamic changes of
vegetation due to its wide geographical and temporal coverage (Beck &
Goetz, 2011). Moreover, the annual NDVI data used in this study were
obtained using the maximum value composite method (MVCs), which
retained the maximum value of each pixel in each year. The annual maxi-
mum NDVI in the study area is typically reached in summer when the
vegetation is most developed, thus highlighting the intra-annual vegeta-
tion changes in the study site (Holben, 1986; Lv et al., 2014).
2.3 | Methods
2.3.1 | Mann–Kendall nonparametric test formonotonic trend
The Mann–Kendall nonparametric test (Kendall, 1975; Mann, 1945) is
a commonly used nonparametric method to detect trends in hydro-
meteorological time series (He et al., 2017; He, Jiang, et al., 2019;
Sung et al., 2017). Another useful feature of the Mann–Kendall test is
the Kendall slope index, which is an unbiased estimator of the mono-
tonic trend magnitude that was originally developed by Sen (1968)
and later improved upon by Hirsch et al. (1982). Therefore, the runoff,
precipitation, and potential evapotranspiration trends in this study
were examined using the Mann–Kendall test. And the significance
levels of 0.05 and 0.01 were chosen in this study.
2.3.2 | Detection of abrupt change
The determination of change points is critical for the attribution analysis
of runoff variation in this study. For cross-validation and higher accuracy,
three classic methods, including the Pettitt test (Mavromatis &
Stathis, 2011; Pettitt, 1979; Zuo et al., 2014), moving t test (Yin
et al., 2015; Zheng et al., 2007), and the Mann–Kendall test (Goossens &
Berger, 1987; Sneyers, 1975), were used to detect changes in the runoff
in the lower, middle, and upper regions, respectively. Significance levels
of 0.05 and 0.5 were chosen for each method.
2.3.3 | Quantitative attribution of runoff variation
River basin-scale water balance
The long-term water balance equation for a watershed can be
expressed as follows (Yang et al., 2015):
P=R+ ET +ΔS, ð1Þ
4 of 26 XIN ET AL.

where P is the annual average precipitation (mm), R is the annual aver-
age runoff depth, which typically does not include glacier runoff (mm),
ET represents the annual average actual evapotranspiration (mm), and
ΔS is the annual average change of water storage (mm). On the multi-
year average scale (over 10 years), the value of ΔS is likely negligible
(Li, Wang, et al., 2014; Liu et al., 2016; Xue et al., 2013; Zuo
et al., 2014).
Budyko (1974) hypothesized that watershed evapotranspiration
was determined by the water supply (represented by precipitation)
and evaporation capacity (represented by potential evapotranspira-
tion). Several studies have recently begun to focus on implementing
the Budyko hypothesis to characterize the hydrothermal coupling
relationship in a watershed, and many scholars have proposed empiri-
cal equations (Choudhury, 1999; Fu, 1981; Wang & Tang, 2014; Yang
et al., 2008; Zhang et al., 2001, 2004). In this study, the Choudhury–
Yang equation was used to calculate the annual average evapotranspi-
ration as follows:
ET =P× ET0
Pn + ET0nð Þ1=n
, ð2Þ
where ET represents annual average evapotranspiration (mm), P is
annual average precipitation (mm), ET0 represents annual average
potential evapotranspiration (mm), and n is a parameter reflecting the
underlying surface characteristics of the watershed, which is generally
considered to be related to vegetation type and coverage, as well as
soil properties (Donohue et al., 2010; Milly, 1994; Xu et al., 2014). In
this study, the Penman–Monteith method (Allen et al., 1998) was used
for ET0 calculation.
Due to the unique mechanisms of runoff generation in the YZRB,
where the glacier runoff accounts for a non-negligible proportion (Jia
et al., 2008), conventional water balance equations that do not
account for glacier runoff are unsuitable for our study purposes. Thus,
the water balance equation (Equation (1)) was adjusted as follows:
P=Rt 1−rð Þ+ ET, ð3Þ
where Rt represents the total annual average runoff depth
observed by hydrological stations (mm), and r is a coefficient rep-
resenting the proportion of glacier runoff. Thus, Rt(1 − r) is equiva-
lent to R in Equation (1), in which the glacier runoff is subtracted.
Additionally, glacier runoff was defined in this study as a specific
proportion of the melting water from glaciers directly contributing
to the total runoff observed at the hydrological station, rather than
the water derived from glacial melting contributing to YZRB water
storage. Therefore, the annual average change in water storage (ΔS)
can still be neglected at the multi-year average scale. Determina-
tion of r values, which were closely related to temperature varia-
tions and showed significant spatial heterogeneity, is demonstrated
in Section 2.3.4. It should be noted that the runoff defined in the
middle region has already subtracted the runoff from the upper
region, and the runoff defined in the lower region also subtracted
the runoff from the upper and middle regions.
Therefore, by substituting Equation (2) into Equation (3), the
watershed water balance equation can be expressed as follows:
Rt = P−P× ET0
Pn + ET0nð Þ1n
!= 1−rð Þ: ð4Þ
Sensitivity of factors influencing runoff
According to Schaake (1990), the sensitivity of runoff-specific vari-
ables (i.e., P, ET0, r, and n in this study) could be quantified by the elas-
ticity coefficient, which is defined as follows:
εyi =∂Rt
∂yi×yiRt, ð5Þ
where εyi is the elasticity coefficient, and yi represents the specific
influencing factors, which are P, ET0, r, and n in this study.
Assuming that ϕ = ET0/P, the partial derivative of R for each vari-
able (∂Rt/∂yi) can be expressed as:
∂Rt
∂P= 1−
ϕ1+ n
1+ϕnð Þn+1n
!= 1− rð Þ, ð6Þ
∂Rt
∂ET0= −
1
1+ϕnð Þn+1n
!= 1− rð Þ, ð7Þ
∂Rt
∂n= −ET0 ×
nlnϕ+ 1+ϕnð Þln 1 +ϕ−nð Þn2 1 +ϕnð Þn+1n
!= 1− rð Þ, ð8Þ
∂Rt
∂r= P−
ET0
1 +ϕnð Þ1n
!= 1− rð Þ2, ð9Þ
Then, the elasticity coefficients of P, ET0, n, and r can be
expressed, respectively, as follows (Xu et al., 2014):
εP =1+ϕnð Þ 1
1+ n−ϕ1+ n
1+ϕnð Þ 1 +ϕnð Þ1n−ϕh i , ð10Þ
εET0 =1
1+ϕnð Þ 1− 1+ϕ−nð Þ1nh i , ð11Þ
εn =ln 1 +ϕnð Þ+ϕnln 1 +ϕ−nð Þn 1 +ϕnð Þ 1− 1+ϕ−nð Þ1n
h i , ð12Þ
εr =r � P− ET0
1 +ϕnð Þ1n
� �
1− rð Þ � P− P× ET0
Pn + ET0nð Þ1n
� � : ð13Þ
It should be noted that once the runoff breakpoint is determined,
the changes in the contribution of glacier runoff to the total runoff
XIN ET AL. 5 of 26

changes between the two periods could also be calculated by compar-
ing the glacier runoff in the two periods, which renders the same
results as those obtained with the Budyko framework (Equation (13)).
Attribution analysis of runoff variation
Based on the runoff breakpoint determined herein, the study period
was divided into the baseline period (period I) and the change period
(period II). The multi-year average runoff depth of period I is
expressed as R1, whereas that of period II is expressed as R2. The run-
off variation (ΔRt) between period I and period II can be expressed by
the difference in annual average runoff depth before and after the
breaking point (Yang et al., 2015), that is:
ΔRt =R2−R1: ð14Þ
Similarly, changes in multi-year average precipitation potential
(ΔP), evapotranspiration (ΔET0), underlying surface (Δn) , and propor-
tion of glacier runoff (Δr) between the two sub-periods can also be
expressed as follows (Yang et al., 2015):
ΔP=P2−P1, ð15Þ
ΔET0 = ET02−ET01, ð16Þ
Δn= n2−n1, ð17Þ
Δr = r2− r1: ð18Þ
Based on the definition of the elasticity coefficient, the total run-
off variation can be obtained by adding the runoff variations caused
by changes in each variable as follows:
ΔRt = εPRt
PΔP+ εET0
Rt
ET0ΔET0 + εn
Rt
nΔn+ εr
Rt
rΔr + δ: ð19Þ
For a brief demonstration, the previous equation (19) can be sim-
plified indicated below:
ORt =CP +CET0 +Cn +C rð Þ + δ, ð20Þ
where, C_(P), C_(ET0), C_(n),and C_(r) represent the contributions from
changes in climate (P, ET0), underlying surface (n), and glacial melting
(r) to runoff variation, respectively (mm); δ represents the bias
between observed and simulated runoff changes (mm); and O_(Rt) is
the observed change in runoff (mm).
The relative contribution of each variable to the variation in run-
off can be expressed as follows:
RCyi =C_ yið ÞO_ Rtð Þ ×100%, ð21Þ
where yi represents P, ET0, n or r; RC_(yi) represents the relative contri-
bution of yi.
2.3.4 | Determination of glacier runoff proportion
Given that the glacier runoff in the YZRB accounts for a non-
negligible proportion of the total runoff, a coefficient r representing
the proportion of glacier runoff was introduced into the water balance
equation (Equation (1)). It should be noted that the glacier runoff
defined in this study represented a portion of the melting water from
the glaciers, which contributed to the total runoff observed at the
hydrological station. Additionally, the spatio-temporal heterogeneity
of the coefficient r associated with the significant temperature
increases and complex topography of the study site should also be
taken into consideration. However, due to a lack of long-term in situ
measurements of glacier runoff in the YZRB, the values of r for the
three sub-regions were determined based on the glacier runoff simu-
lation results reported by Su et al. (2016) and Zhang, Su, et al. (2013),
using the variable infiltration capacity (VIC) land surface model
coupled with a simple degree-day glacier algorithm, which we will
henceforth refer to as the VIC-glacier model. The initial glacier distri-
bution dataset was obtained from the National Tibetan Plateau/Third
Pole Environment Data Center (http://westdc.westgis.ac.cn/en/data)
and the Randolph Glacier Inventory (http://www.glims.org/RGI/).
Information about the global climate models (GCMs) and a list of the
selected GCMs (Table A1) in the study of Su et al. (2016) are detailed
in Appendix.
Relationship between r and rising temperature
In order to determine the variation characteristics of glacier runoff
induced by rising temperatures closely associated with the upper and
lower region topography, the relationship between the change in tem-
perature (ΔT) and the change in the proportion of glacier runoff (Δr)
was fitted according to the simulation results of glacier runoff during
the 1971–2000, 2011–2040, and 2041–2070 periods (Su et al., 2016;
Zhang, Shoemaker, et al., 2013).The fitting results can be expressed as
follows:
Δr = aΔT + b, ð22Þ
where ΔT represents the temperature change during different
periods; Δr represents the corresponding change in the proportion of
glacier runoff; a represents the fitting coefficient and b represents the
fitting intercept.
Specifically, ΔT and Δr were defined as follows:
ΔT = Tfuture−Tbaseline, ð23Þ
Δr = rfuture−rbaseline, ð24Þ
where Tfuture represents the annual mean temperature during
2011–2040 and 2041–2070 under three representative concentra-
tion pathway (RCP) scenarios (RCP2.6, RCP4.5, RCP8.5) (�C); Tbaselinerepresents the annual mean temperature during 1971–2000 (�C);
rfuture and rbaseline are the future and baseline proportions of glacier
runoff, respectively.
6 of 26 XIN ET AL.

r coefficient calculation
In order to reflect the spatio-temporal heterogeneity of glacier runoff
in the YZRB, r values during periods I and II in the upper, middle, and
lower regions were calculated according to Equation (22) in this study.
Similar to the total runoff defined for the upper, middle, and lower
regions, the glacier runoff for the three sub-regions was defined as
follows:
RgM =RgY −RgU, ð25Þ
RgL =RgW−RgY , ð26Þ
where RgM represents the glacier runoff in the middle region (mm);
RgU represents the glacier runoff in the upper region (mm); RgY rep-
resents the glacier runoff in the region above the Yangcun hydro-
logical station (mm); RgL represents the glacier runoff in the lower
region (mm); RgW and represents the glacier runoff in the whole
basin (mm).
Furthermore, determining the temperature threshold for gla-
cier melting is of great importance for the study of alpine glacier
runoff (Matthews & Hodgkins, 2016). Additionally, due to the
diverse meteorological conditions that glaciers may encounter,
glacier melting can occur over a wide range of air temperatures
(Braithwaite, 1995). According to Ayala et al. (2017), an environ-
mental temperature of −1.5�C, which was adopted in this study
for the YZRB, is much more conducive to glacier ablation in
regions exceeding a 4000 m elevation. Consequently, the coeffi-
cient r in the upper, middle, and lower regions in different periods
could be obtained using the above equations (Equations (22),
(25), and (26)).
2.3.5 | Error estimation of the adjusted Budykoframework
Because the adjusted Budyko framework (Equation (4)) used in this
study is only a first-order approximation, error estimation was con-
ducted to assess its performance.
As described by Yang, Qi, et al. (2014), we wrote the complete
Taylor expansion of Equation (4) as follows:
Rt P1 +ΔP,ET01 +ΔET0,n1 +Δn,r1 +Δrð Þ=Rt P1,ET01 ,n1,r1ð Þ
+ ΔP∂
∂P+ΔET0
∂
∂ET0
∂
∂P+ΔET0
∂
∂ET0+Δn
∂
∂n+Δr
∂
∂r
� �2
Rt P1,ET01 ,n1, r1ð Þ+…,
ð27Þ
where P1 represents the annual average precipitation of period I (mm);
ET01 represents the annual average potential evapotranspiration of
period I (mm); n1 represents the underlying surface characteristics of
period I; r1 represents the proportion of glacier runoff for period I;
ΔP represents the variation of precipitation from period I to period II
(mm); ΔET0 represents the variation of potential evapotranspiration
from period I to period II (mm); Δn represents the variation of the
underlying surface from period I to period II; Δr represents the varia-
tion in glacier melting from period I to period II.
The runoff change caused by the precipitation according to Equa-
tion (27) (C_(ΔP)) can be expressed as follows:
C_ðΔPÞ=ΔP ∂
∂PRt P1,ET01,n1,r1ð Þ+ 1
2!ΔP
∂
∂P+ΔET0
∂
∂ET0+Δn
∂
∂n+Δr
∂
∂r
� �
ΔP∂
∂PRt P1,ET01,n1,r1ð Þ,
ð28Þ
where the third- and higher-order terms of Equation (27) neglected
for the third-order are equal to 3% of the second-order according to
Yang, Yang, and Hu (2014).
Similarly, the runoff change caused by the potential evapotranspi-
ration change (C_(ΔET0)), the underlying surface change (C_(Δn)), and
the glacier melting change (C_(Δr)) can be expressed as follows:
C_ðΔET0Þ=ΔET0∂
∂ET0Rt P1,ET01,n1, r1ð Þ+ 1
2!ΔP
∂
∂P+ΔET0
∂
∂ET0+Δn
∂
∂n+Δr
∂
∂r
� �
ΔET0∂
∂ET0Rt P1,ET01,n1, r1ð Þ,
ð29Þ
C_ðΔnÞ=Δn ∂
∂nRt P1,ET01,n1,r1ð Þ+ 1
2!ΔP
∂
∂P+ΔET0
∂
∂ET0+Δn
∂
∂n+Δr
∂
∂r
� �
Δn∂
∂nRt P1,ET01,n1,r1ð Þ,
ð30Þ
C_ðΔrÞ=Δr ∂∂rRt P1,ET01,n1, r1ð Þ+ 1
2!ΔP
∂
∂P+ΔET0
∂
∂ET0+Δn
∂
∂n+Δr
∂
∂r
� �
Δr∂
∂rRt P1,ET01,n1,r1ð Þ:
ð31Þ
The relative error of the contribution of precipitation change to
the runoff variation (REΔP) was estimated as follows:
REΔP =C_ ΔPð Þ−C_ Pð Þj j
C_ ΔPð Þj j , ð32Þ
where C_(P) represents the contribution of precipitation change to the
runoff variation obtained by the first-order approximation of the
adjusted Budyko framework (mm).
Similarly, the relative error of the contribution of potential evapo-
transpiration change (REΔET0 ), underlying surface change (REΔn), and
glacier melting change (REΔr) were estimated as:
REΔET0 =C_ ΔET0ð Þ−C_ ET0ð Þj j
C_ ΔET0ð Þj j , ð33Þ
REΔn =C_ Δnð Þ−C_ nð Þj j
C_ Δnð Þj j , ð34Þ
REΔr =C_ Δrð Þ−C_ rð Þj j
C_ Δrð Þj j , ð35Þ
XIN ET AL. 7 of 26

where C_(ET0), C_(n) and C_(n) represent the contribution of potential
evapotranspiration change, underlying surface change, and glacier
melting change to the runoff variation obtained by the first-order
approximation of the adjusted Budyko framework, respectively (mm).
3 | RESULTS
3.1 | r coefficient calculation results
According to the simulation results of glacier runoff during the
1971–2000, 2011–2040, and 2041–2070 periods (Su et al., 2016;
Zhang, Shoemaker, et al., 2013) shown in Table 1, the fitting results
were illustrated in Figure 2. The values of fitting coefficient a and
fitting intercept b in Equation (22) were 0.03184 and −0.01237,
respectively. Therefore, with Equations (22), (25), and (26), the coeffi-
cient r in the upper, middle, and lower regions during different periods
could be obtained, which were shown in Tables 2 and 4.
3.2 | Long-term runoff variations and associatedfactors
The statistical characteristics of the hydrological and meteorological
factors of the three regions in the YZRB from 1966 to 2015 are sum-
marized in Table 2. Previous studies have reported that these factors
have opposing impacts on runoff variation, that is, an increase in n,
which represents the characteristics of the underlying surface, includ-
ing vegetation, soil, and topography, would cause a reduction in run-
off, whereas P has the opposite effect (He, Jiang, et al., 2019; He, Qiu,
et al., 2019; Liu, Chen, et al., 2019).
To verify the reliability of the calculated ET0 in this study based
on the Princeton Global Forcings (PGF), a comparison with the ET0
product for China developed by Li et al. (2020) was conducted, which
was calculated based on the China Meteorological Forcing Dataset
(CMFD). As illustrated in Figure 3, the values of R2 of the two datasets
in the upper, middle, lower regions, as well as the entire study area,
were above 0.90. Moreover, the correlations between the two
datasets in the upper, middle, lower, and entire study area were all
statistically significant at a 0.05 level according to the F-test
(Figure 3). The aforementioned results were indicative of a reasonable
performance of calculated ET0 in this study. On the other hand, the
ET0 calculated in this study based on the PGF was generally higher,
especially in the lower region. Relevant studies have indicated that
the measurement of remote sensing data often has some uncer-
tainties in the area covered by glaciers (Lo Vecchio et al., 2018; Wu
et al., 2015), which results in differences between assimilation prod-
ucts. Compared with the CMFD, the downward shortwave radiation
and air temperature of the PGF used for ET0 calculation were both
higher, and the difference between them reached a maximum in the
lower region, which features the largest glacier coverage (Figures A1
and A2), explaining the differences in the estimated ET0 between the
two datasets.
As shown in Table 2, the n, r, and annual average P, Rt, and ET0 of
the upper region during 1966–2015 were 0.80, 0.0635, 400.46,
144.95, and 1294.16 mm, respectively. With decreasing elevation and
increasing temperature, the r, P, Rt, and ET0 values from the upper
region to the middle region showed a consistent increasing trend, with
values of 0.1134, 484.59, 297.04, and 1424.52 mm, respectively.
However, the underlying surface parameter n decreased from 0.80 to
0.56. Furthermore, compared with the 10.07% increase in ET0 and a
30% decrease in n, the r, P, and Rt exhibited much more consistent
and significant increasing magnitudes from the upper region to the
middle region, implying a close positive relationship between r, P, and
Rt in the middle region. With the same decreasing elevation trend and
increasing temperature trend from the upper region to the middle
region, r, P, Rt, and ET0 all exhibited an increasing trend from the
TABLE 1 Changes in temperature (ΔT) and correspondingchanges in glacier runoff proportion (Δr)
Period Scenario ΔT (�C) Δr r
1971–2000 — — — 0.1160
2011–2040 RCP2.6 1.4015 0.0303 0.1463
RCP4.5 1.5744 0.0338 0.1498
RCP8.5 1.6048 0.0338 0.1498
2041–2070 RCP2.6 1.9371 0.0478 0.1638
RCP4.5 2.6929 0.0756 0.1916
RCP8.5 3.5925 0.1035 0.2195
Note: Values of r for the three sub-regions were determined based on the
glacier runoff simulation results by Su et al. (2016).
F IGURE 2 Relationship between the proportion of glacier runoff(r) and temperature changes (ΔT). F represents the F-test statistic,where F > 7.71 represents a significance level of 0.05
8 of 26 XIN ET AL.
middle region to the lower region, with rates of 15.70, 37.27, 151.20,
and 1.61%, respectively, whereas n exhibited a decreasing trend, with
a rate of −69.64%. It is worth noting that, compared with runoff of
144.95 and 297.04 mm respectively in the upper and lower regions,
runoff in the lower regions increased significantly up to 746.15 mm
contributing to the runoff coefficient larger than 1.0, indicating that
glacier runoff in the lower region of the YZRB accounted for a consid-
erable proportion of the runoff, which is consistent with the results
obtained by Liu (1999). Additionally, although runoff and two associ-
ated climate factors (P and ET0) fluctuated slightly due to subtle coef-
ficient variations (<0.3), distinct differences among the variation
characteristics of these factors were observed in the upper, middle,
and lower regions. ET0 in the three regions was steadier than that of
the other elements, with values of 0.02, 0.03, and 0.03, respectively.
However, the P variation coefficients exhibited no differences from
upstream to downstream with a relatively higher value of 0.14,
whereas the variation coefficients of Rt reached a maximum value in
the middle region. Besides, n, r, and the annual average P, Rt, ET0 of
the whole YZRB during 1966–2015 are also summarized in Table 2 as
a reference. In the entire YZRB during 1966–2015, the values of
n and r were 0.60 and 0.1094 respectively, whereas the annual aver-
age P, Rt, and ET0 were 300.72, 516.76, and 1388.73 mm, respec-
tively. Therefore, it is crucial to conduct an in-depth investigation of
the variation trends of hydro-meteorological factors in the YZRB.
The results of the M–K trend test are also shown in Table 2, and
temporal variations in runoff (Rt), precipitation (P), and potential
evapotranspiration (ET0) of the upper, middle, lower regions, as well as
the entire basin, are illustrated in Figure 4, demonstrating that the ET0
of the middle and lower regions had a statistically non-significant
increasing trend (jZcj < 1.96), whereas the ET0 of the upper region
showed a statistically significant increasing trend (jZcj > 1.96).
According to previous studies, increases in vegetation would posi-
tively contribute to increases in ET, which ultimately results in a nega-
tive contribution to runoff. Some studies have indicated that the
vegetation in the entire YZRB has improved in recent decades,
whereas the improvement of vegetation in the middle region was rela-
tively significant, and variations of vegetation in the upper and lower
regions were slight (Li et al., 2019; Liu, Niu, et al., 2019). In the upper
region, the decreasing rate of P and the increasing rate of Rt was
−0.72 and 0.11 mm per year respectively, which were both statisti-
cally non-significant (jZcj < 1.96). Combined with the decrease in P,
increase in ET0, and vegetation improvement in the upper region, it
could be inferred that the increasing trend of Rt in the upper region
might be mainly attributed to glacier melting and permafrost degrada-
tion. In the middle region, P and Rt both exhibited a statistically non-
significant increasing trend (jZcj < 1.96) with the slope of 0.97 and
1.73 mm per year, respectively. Considering the increase of ET0 and
variation in vegetation, such a consistent increasing trend in P and Rt
implied that precipitation was among the dominant factors for the
runoff variation in the middle region. In contrast to the increasing Rt
trend in the upper and middle regions, Rt in the lower region exhibited
a slightly downward trend (jZcj < 1.96) with a negative slope of
−0.91 mm per year, which was opposite to the slight upward trend
(jZcj < 1.96) of P with a positive slope of 1.17 mm per year. The vege-
tation cover of the lower YZRB is mainly composed of grassland and
forest with intensive root systems, which retain water and preserve
the high water content of the underlying surface, positively contribut-
ing to the increase in evaporation and decrease in runoff (Chen
et al., 2014). Regarding the entire YZRB, the increasing Rt, P, and ET0
trends were not statistically significant (jZcj < 1.96).
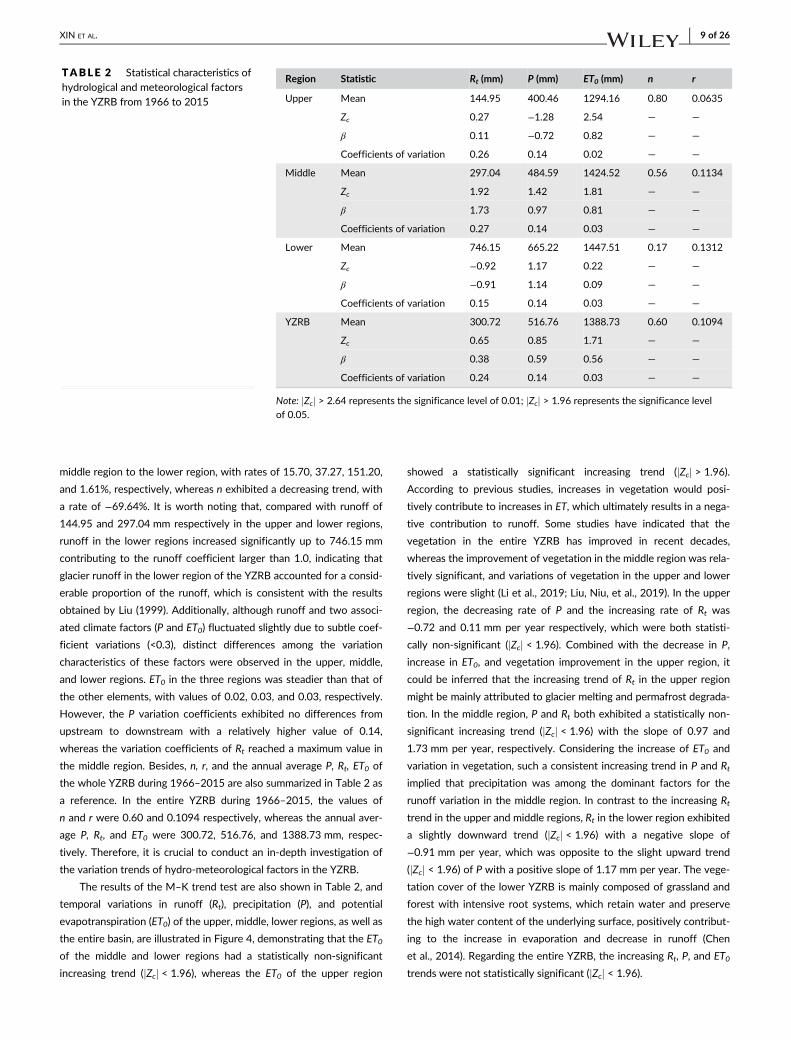
TABLE 2 Statistical characteristics ofhydrological and meteorological factorsin the YZRB from 1966 to 2015
Region Statistic Rt (mm) P (mm) ET0 (mm) n r
Upper Mean 144.95 400.46 1294.16 0.80 0.0635
Zc 0.27 −1.28 2.54 — —
β 0.11 −0.72 0.82 — —
Coefficients of variation 0.26 0.14 0.02 — —
Middle Mean 297.04 484.59 1424.52 0.56 0.1134
Zc 1.92 1.42 1.81 — —
β 1.73 0.97 0.81 — —
Coefficients of variation 0.27 0.14 0.03 — —
Lower Mean 746.15 665.22 1447.51 0.17 0.1312
Zc −0.92 1.17 0.22 — —
β −0.91 1.14 0.09 — —
Coefficients of variation 0.15 0.14 0.03 — —
YZRB Mean 300.72 516.76 1388.73 0.60 0.1094
Zc 0.65 0.85 1.71 — —
β 0.38 0.59 0.56 — —
Coefficients of variation 0.24 0.14 0.03 — —
Note: jZcj > 2.64 represents the significance level of 0.01; jZcj > 1.96 represents the significance level
of 0.05.
XIN ET AL. 9 of 26

In summary, runoff in the upper region exhibited an increasing
trend coupled with an improvement in vegetation and a decreasing
trend in P, indicating that there were other important factors causing
the increasing in runoff in the upper region. Runoff in the middle
region also exhibited an upward trend, and the simultaneous decreas-
ing vegetation cover and increasing P trends were suggestive of a syn-
ergistic relationship between the underlying surface conditions and
climate change in the middle region. However, Rt in the lower region
exhibited a downward trend, which contradicted the increasing
P trend. Nevertheless, a substantially increased vegetation coverage
consumes more water from the underlying surface (Yang et al., 2015),
which provides a reasonable explanation for the runoff decline and
suggests a more important role of the underlying surface conditions
on runoff variations in the lower region of the YZRB.
3.3 | Determination of the baseline period andchange period for runoff
The determination of the runoff breakpoint involves the rational divi-
sion of the baseline and change periods for attribution analysis of run-
off variation. Nevertheless, breakpoint detection typically entails large
F IGURE 3 Comparison between the ET0 values in the upper (a), middle (b), lower (c) regions, and the whole basin (d). ET0_1 represents theET0 results calculated in this study, whereas ET0_2 represents the ET0 values calculated by Li et al. (2020). F represents the F-test statistic, whereF > 3.86 represents a significance level of 0.05
10 of 26 XIN ET AL.
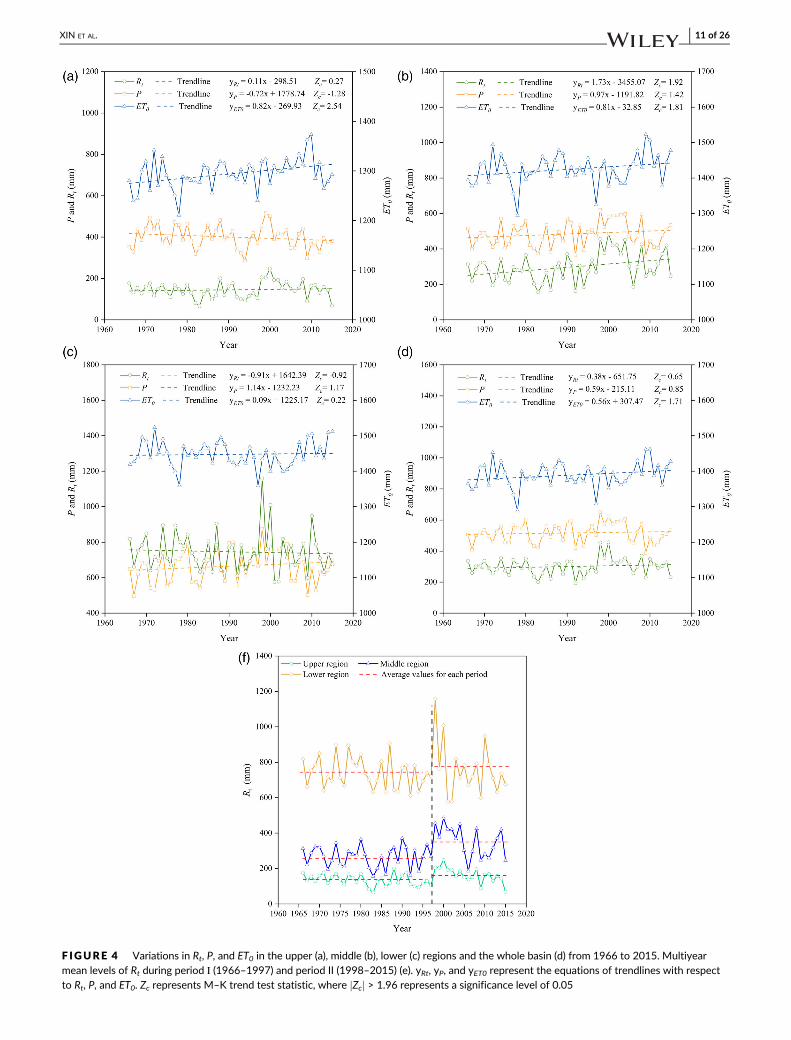
F IGURE 4 Variations in Rt, P, and ET0 in the upper (a), middle (b), lower (c) regions and the whole basin (d) from 1966 to 2015. Multiyearmean levels of Rt during period Ι (1966–1997) and period II (1998–2015) (e). yRt, yP, and yET0 represent the equations of trendlines with respectto Rt, P, and ET0. Zc represents M–K trend test statistic, where jZcj > 1.96 represents a significance level of 0.05
XIN ET AL. 11 of 26

uncertainties (Wong et al., 2006). Therefore, our study employed the
Pettitt test, moving t test, and Mann–Kendall test to detect abrupt
runoff changes in the three sub-regions of the YZRB. As shown in
Table 3, the abrupt change analysis in the upper region using the
Mann–Kendall test and moving t test were the same as the abrupt
change in annual runoff in 1997, whereas there was no abrupt change
detected by the Pettitt test. In the middle region, different change
points were detected using the three aforementioned methods. The
Pettitt and Mann–Kendall tests indicated that abrupt changes in
annual runoff in the middle region occurred in 1995, whereas the
change point detected by the moving t test occurred in 1997. More-
over, there was no abrupt change in annual runoff detected by any of
the three methods in the lower region. To identify runoff breakpoints
for attribution analysis, abrupt runoff change detection in the entire
YZRB was further conducted based on the measured time series of
runoff at the Nuxia hydrological station, which as identified as the
outlet of the study area. Regarding the moving t test, 1997 was identi-
fied as the change point, which was consistent with the results of Cuo
et al. (2019), Lv and Li (2013), whereas the change point detected by
the Mann–Kendall test appeared in 1996. However, according to the
Pettitt test, there was no abrupt change in the whole basin.
In order to analyse the effect of using different breakpoints on attri-
bution results, we conducted three attribution analyses on runoff alter-
ations when we chose the breakpoint at 1995, 1996, and 1997,
respectively. The attribution results were shown in Tables A2,A3,A4,
indicating that there was no significant impact of three breakpoints on
the results of attribution analysis. Hence, combined with abrupt changes
in runoff in the upper, middle, and entire regions, and to unify the impact
period of climate variability and underlying surface change on runoff vari-
ation in all three sub-regions of the YZRB, 1997 was selected as the
abrupt change point to determine the baseline period and change period
in this study, referring to period I from 1966 to 1997 and period II from
1998 to 2015, respectively.
According to the calculation framework proposed in Section 2.3.4,
the results of the proportions of glacier runoff represented by coeffi-
cient r in the upper, middle, and lower regions during period I and
period II could be quantified as shown in Table 4.
3.4 | Influencing factor sensitivity analysis
Based on the adjusted Budyko framework, the change in runoff cau-
sed by climate variability was decomposed into the impact of precipi-
tation and potential evapotranspiration changes, whereas the impact
of changes in the underlying surface characteristics and glacier melt-
ing on runoff were respectively represented by the integrated param-
eter n defined in Equation (4) and coefficient r. As shown in Table 4,
the statistical characteristics of P, ET0, n, and r during period I and
period II and their corresponding elasticity coefficients exhibited sig-
nificant heterogeneities in the upper, middle, and lower regions. In all
three regions, the Rt and Rt/P in period II were greater than those in
period I. Nevertheless, the value of Rt/P during the two periods in the
lower region was greater than 1.00, further implying that glacial melt-
water played a much more important role in runoff in the lower region
distributed with intensive glaciers. From a whole-basin perspective, a
decrease occurred in ET0/P from the upper region to the lower region,
although Rt/P and Rt exhibited opposite change directions, indicating
that the YZRB becomes gradually wetter with decreased elevation.
Specifically, in the upper region, the ET0/P values during the two
periods were both greater than 3.00, whereas the Rt and P values
were only 0.34 and 0.41, respectively. In addition to a precipitation
volume below 500 mm, the upper region of the YZRB is considered a
typical semi-arid region. From the upper region to the middle region,
the ET0/P values during period I and period II decreased to 3.02 and
2.81, whereas the Rt/P values rose to 0.57 and 0.69, respectively.
With a precipitation of 469.65 and 511.15 mm in periods I and II, the
TABLE 3 Change points detected by three statistical methods
Region Pettitt test Moving t test Mann–Kendall test
Upper — 1997** 1997**
Middle 1995** 1997** 1995**
Lower — — —
YZRB — 1997** 1996**
**Represents the significance level of 0.05.
TABLE 4 Hydro-meteorological characteristics and sensitivity of runoff (Rt) to precipitation (P), potential evapotranspiration (ET0), underlyingsurface (n), and glacier runoff (r) during period I (1966–1997) and period II (1998–2015)
Region Period Rt (mm) P (mm) ET0 (mm) n r Rt/P ET0/P
Elasticity coefficients
εP εET0 εn εr
Upper Period I 134.48 400.97 1285.18 0.82 0.0277 0.34 3.21 1.57 −0.57 −1.48 0.03
Period II 163.56 399.56 1310.13 0.76 0.1161 0.41 3.28 1.50 −0.51 −1.40 0.13
Middle Period I 266.15 469.65 1417.95 0.59 0.1008 0.57 3.02 1.33 −0.47 −1.05 0.11
Period II 351.95 511.15 1436.21 0.53 0.1632 0.69 2.81 1.27 −0.27 −0.91 0.20
Lower Period I 738.71 656.77 1445.89 0.17 0.1328 1.21 2.20 1.01 −0.01 −0.10 0.15
Period II 759.38 680.24 1450.37 0.19 0.1399 1.22 2.13 1.02 −0.02 −0.15 0.16
YZRB Period I 285.66 509.13 1383.01 0.61 0.0960 0.56 2.72 1.34 −0.34 −1.03 0.11
Period II 327.49 530.32 1398.9 0.59 0.1333 0.62 2.64 1.31 −0.31 −0.97 0.15
12 of 26 XIN ET AL.

middle region exhibited a much more typical semi-arid hydro-climatic
characteristics. Transitioning to the lower region from the middle
region, precipitation during the two periods continuously increased to
more than 600 mm, leading to a decrease in ET0/P with values of 2.20
and 2.13. Interestingly, the runoff in the lower region exceeded
700 mm in both periods, which was greater than the precipitation vol-
umes and resulted in a significant increase in R/P, with values of 1.21
and 1.22, respectively, This suggests that the lower region, where
considerable amounts of runoff were contributed by glacier melting, is
an area with typical semi-humid hydro-climatic characteristics. There-
fore, the division of the upper, middle, and lower regions in this study
can reasonably reflect the vertical zonality of the hydro-climate and
elevation dependency of the YZRB, which was the basis for further
analysis of runoff variation attribution in different elevation zones.
The elasticity coefficients of runoff for glacier melting, climate,
and underlying surface factors are also summarized in Table 4. Com-
pared with the relatively smaller elasticity coefficients of ET0, n, and r,
all εP values were the highest in three sub-regions during both two
periods, which translated to the highest runoff sensitivities to precipi-
tation in the entire YZRB. Moreover, the absolute values of εP, εET0,
and εn showed a decreasing trend from the upper region to the lower
region, indicating that runoff in the upper region with highest ET0/P
and lowest Rt/P was the most vulnerable to climate change and
underlying surface evolution. Moreover, although Rt and
P consistently increased from period I to period II in the upper and
middle regions, n opposite variation trend of εP was illustrated, dem-
onstrating that less precipitation corresponded to a higher runoff sen-
sitivity to precipitation in these regions. Although the effect of ET0
and n on runoff variation is opposite to P, εET0, and εn in all three sub-
regions during both two periods exhibited similar variation character-
istics to those of εP. It is worth noting that ET0 increased from period I
to period II in all three sub-regions, whereas the absolute values of
εET0 in the upper and middle regions decreased, indicating that less
potential evapotranspiration corresponded to a greater runoff sensi-
tivity to potential evapotranspiration in these regions. Regarding gla-
cier runoff, all r values maintained a consistent increasing trend with
εr, indicating a greater contribution of meltwater from glaciers induced
by rising temperature. However, the underlying surface changes
induced by parameter n exhibited a different influence on runoff. In
the upper and middle regions, the elasticity of the underlying surface
to runoff represented by εn exhibited a consistent decreasing trend
from period I to period II with that of n. Nonetheless, n and the abso-
lute value of εn in the lower region both increased from period I to
period II. Different changing patterns of εn from upper to lower
regions in the YZRB from period I to period II emphasized the impor-
tance of underlying surface conditions on runoff variations. Compared
with the upper and middle regions, the lower region exhibited larger
forest areas, whose effect on runoff might be amplified during periods
of more abundant precipitation (Wang et al., 2006). Additionally, the
elasticity coefficients of P, ET0, n, and r in the entire YZRB was also
assessed as a reference. The absolute values of εP, εET0, εn, and εr in
the entire YZRB during both periods exhibited similar variation char-
acteristics to those in the upper and middle regions. Specifically, the
absolute values of εP, εET0, and εn in the entire YZRB all decreased
from period I to period II in the same way as in the upper and middle
regions, whereas εr increased. By comprehensively accounting for
elasticity coefficients of precipitation, potential evapotranspiration,
underlying surface, and glacier runoff, the absolute value of εP was
the largest, followed by εn, εET0, and εr, suggesting that runoff in the
YZRB was more sensitive to variations in precipitation than those of
other factors. Additionally, the sensitivity of runoff to precipitation,
potential evapotranspiration, and underlying surface decreased in the
upper, middle, and lower regions, with a gradual decrease in elevation,
whereas the sensitivity of runoff to glacier runoff increased, empha-
sizing the significant role of elevation in alpine areas (Ohmura, 2012;
Yao et al., 2016).
3.5 | Runoff variation attribution analysis
Climate (P and ET0) variability, glacier runoff (r), and underlying surface
(n) changes had different impacts on runoff variation in the upper,
middle, and lower regions (Figure 5). Compared with runoff in
period I, the runoff in period II in the upper, middle, and lower regions
increased by 29.08, 85.80, and 20.67 mm, respectively. To evaluate
the performance of the adjusted Budyko framework in the YZRB, the
relative error between the calculated change in runoff (C_[Rt]) and the
observed change in runoff (O_[Rt]) was calculated and found to be
below 0.4% in all three sub-regions (Figure 5), indicating that the attri-
bution analysis method developed in this study was effective and
accurate for quantifying the impact of various factors on runoff. As
shown in Figure 5, the contributions to runoff in the upper region
associated with changes in precipitation (ΔP), potential evapotranspi-
ration (ΔET0), underlying surface (Δn), and glacier runoff (Δr) were
− 0.81, −1.54, 14.34, and 14.30 mm, which accounted for −2.78,
−5.3, 59.61, and 49.18% of the total runoff increase, respectively. The
corresponding contributions for increased runoff in the middle region
F IGURE 5 Contributions of climate variability (P, ET0), glacierrunoff (r), and underlying surface (n) change to runoff variation
XIN ET AL. 13 of 26

were 33.77, −1.16, 31.24, and 22.34 mm, accounting for 39.36,
−1.36, 36.4, and 26.04%, respectively. In the lower region, contribu-
tions of ΔP, ΔET0, Δn, and Δr to runoff increase were 26.71, −0.04,
−12.14, and 6.16 mm, with corresponding contribution rates of
129.21, −0.17, −55.74, and 29.8%, respectively. These results indi-
cate that changes in the underlying surface represented by n and
changes in glacier melting represented by r dominated the increase of
runoff in the upper region, whereas the change in precipitation had
the most significant impact on runoff increase in the middle and lower
regions, with a non-negligible contribution rate from glacier runoff
over 25%. Compared with the small contribution of ET0, it is worth
noting that the influence of the underlying surface changes was much
greater, with a contribution rate of over 35% in the three sub-regions.
As an important variable reflecting climate change, previous studies
have shown that ET0 plays a key role in the variation of runoff in
alpine areas (Han et al., 2017; Zhang et al., 2016), but some studies
have also pointed out that the underlying surface change showed
larger effects, which warrant closer attention (Feng et al., 2017). A
similar phenomenon highlighting the importance of the underlying
surface was also observed in our study. Specifically, the contribution
rate of the underlying surface change reached 59.61% in the upper
region, which was far more than the precipitation rate contributions.
Additionally, an attribution analysis of the total runoff in the entire
YZRB was also carried out as a reference. The contributions of ΔP,
ΔET0,Δn, and Δr to runoff increases in the entire basin accounted for
39.62, −2.74, 32.32, and 30.94%, which emphasizes the need to fur-
ther investigate the influence of underlying surface change and glacier
melting on alpine runoff.
Because the adjusted Budyko framework (Equation (4)) proposed in
this study is a first-order approximation, error estimation based on Taylor
expansion was further conducted to assess its performance. As shown in
Table 5, the relative errors of the adjusted Budyko framework associated
with precipitation change, potential evapotranspiration change, underly-
ing surface change, and glacier melting change were all small. In the
upper, middle, lower, and whole regions, the relative errors were all less
than 4%. Therefore, the proposed first-order approximation-adjusted
Budyko framework in this study was deemed reliable.
3.6 | Underlying surface variation characteristics
Variations in the underlying surface are mainly caused by changes in
topography, soil, vegetation, and human activities. From the perspec-
tive of a whole river basin-scale over several decades, topography and
TABLE 6 The categorized criteria of the trend of NDVI
Kendall slope Zc value Variation trend of NDVI
≥0.0003 >1.64 Significant improvement
≥0.0003 −1.64 to 1.64 Slight improvement
−0.0003 � 0.0003 −1.64 to 1.64 Stability
≤−0.0003 −1.64 to 1.64 Slight degradation
≤−0.0003 <−1.64 Significant degradation
Note: j Zcj > 1.64 represents the significance level of 0.1.
TABLE 5 Relative errors of adjusted Budyko framework withrespect to precipitation change (REΔP), potential evapotranspirationchange (REΔET0), underlying surface change (REΔn), and glacier meltingchange (REΔr)
Region REΔP (%) REΔET0 (%) REΔn (%) REΔr (%)
Upper 0.88 0.10 1.40 2.53
Middle 0.43 0.82 1.09 2.78
Lower 0.05 3.47 0.58 0.09
YZRB 0.14 0.11 0.33 0.78
F IGURE 6 Spatial variationtrend/significance tests andcorresponding NDVI areapercentage in the YZRB
14 of 26 XIN ET AL.
soil are generally stable, and the impact of human activities in the
YZRB can be neglected due to the pristine nature of this region
(Li et al., 2013; Xiong et al., 2006). Therefore, vegetation dynamics
dominate the variation of the underlying surface in the YZRB. NDVI
has been widely used to investigate dynamic vegetation variations
(Du et al., 2015; Jia et al., 2020; Jiang et al., 2017; Peng et al., 2012).
In this study, 1997 was identified as the runoff breakpoint and was
chosen as the datum point representing the baseline vegetation
period (period I), and the GIMMS-NDVI3g dataset from 1997 to 2015
was used to analyse the variations in vegetation during the change
period (period II) compared to the baseline period (period I) in the
upper, middle, and lower regions. An NDVI variation trend analysis
coupled with a significance test was implemented according to the
method proposed by Li et al. (2019), and the categorized criteria of
the NDVI trend are shown in Table 6. The spatial distribution of the
NDVI variation trend is shown in Figure 6.
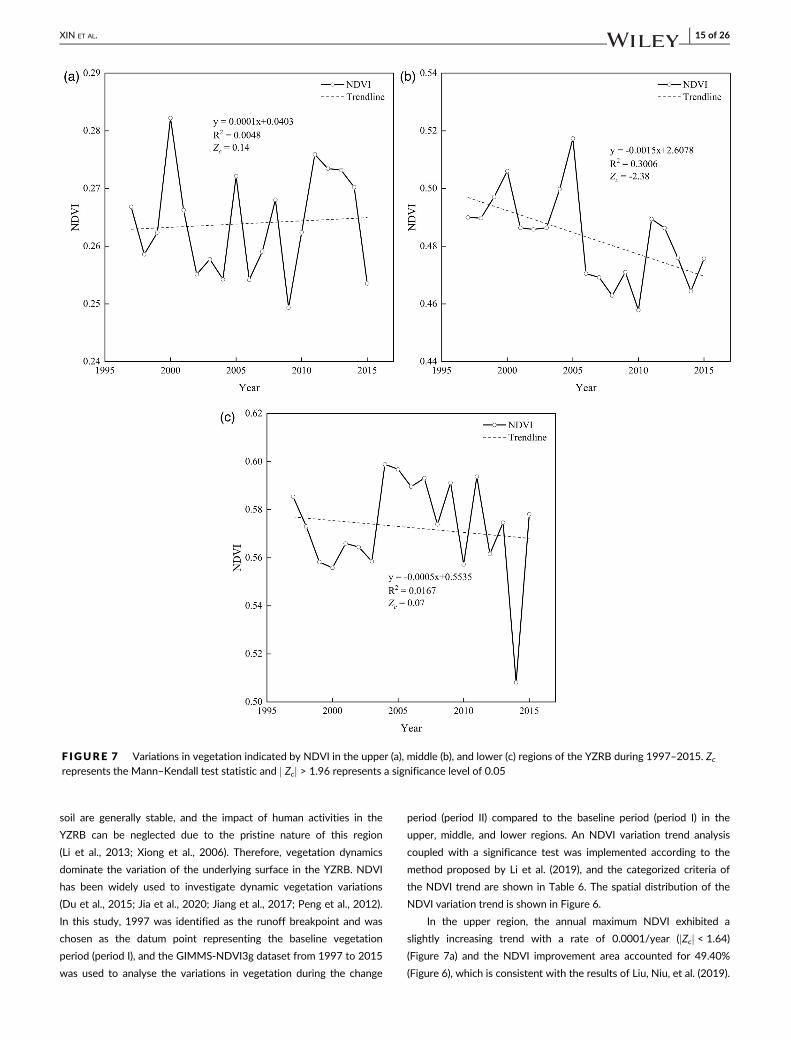
In the upper region, the annual maximum NDVI exhibited a
slightly increasing trend with a rate of 0.0001/year (jZcj < 1.64)
(Figure 7a) and the NDVI improvement area accounted for 49.40%
(Figure 6), which is consistent with the results of Liu, Niu, et al. (2019).
F IGURE 7 Variations in vegetation indicated by NDVI in the upper (a), middle (b), and lower (c) regions of the YZRB during 1997–2015. Zcrepresents the Mann–Kendall test statistic and j Zcj > 1.96 represents a significance level of 0.05
XIN ET AL. 15 of 26
Compared with the slightly increasing trend of NDVI in the upper
region, the average maximum NDVI in the middle region showed a
significant decreasing trend with a rate of −0.0015/year (jZcj > 1.64)
(Figure 7b), and the area occupied by vegetation degradation
accounted for 63.82% (Figure 6). In the lower region, the average
maximum NDVI showed a slightly downward trend with a rate of
−0.0005/year (jZcj < 1.64) (Figure 7c), and the area with vegetation
degradation indicated by NDVI occupied 53.03% of the lower region
(Figure 6).
4 | DISCUSSION
4.1 | Implications of climate, underlying surface,and runoff interactions
The upper region had the lowest vegetation coverage in the entire
basin (Jiang et al., 2014). However, according to the results of the
attribution analysis of runoff variation, compared with the middle
and lower regions, the contribution rate of the underlying surface
changes to the increased runoff in the upper region was the largest,
up to 59.61%, demonstrating that the change in the underlying sur-
face played a critical role in the runoff variation in the upper region.
However, according to Section 3.6, the annual maximum NDVI
exhibited a slightly increasing trend with a rate of 0.0001/year
(jZcj < 1.64) and the NDVI improvement area accounted for
49.40%. Obviously, due to slight changes in vegetation in the upper
region, other factors associated with the underlying surface in the
upper region must be responsible for such a great contribution to
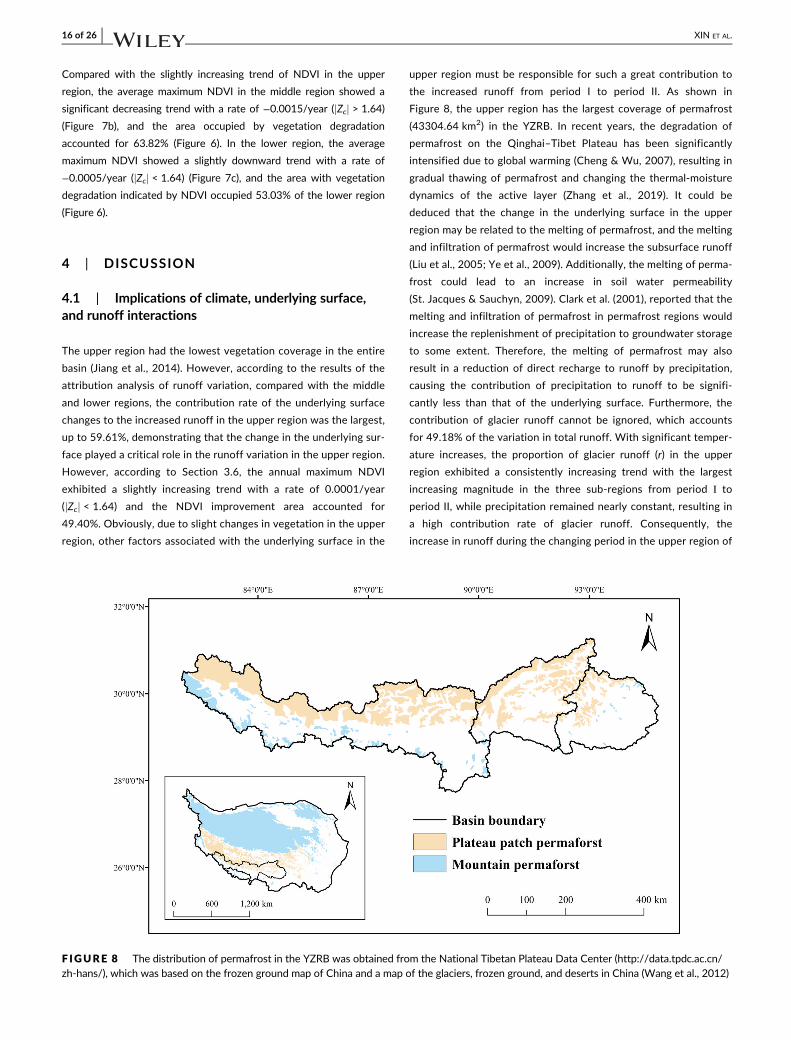
the increased runoff from period I to period II. As shown in
Figure 8, the upper region has the largest coverage of permafrost
(43304.64 km2) in the YZRB. In recent years, the degradation of
permafrost on the Qinghai–Tibet Plateau has been significantly
intensified due to global warming (Cheng & Wu, 2007), resulting in
gradual thawing of permafrost and changing the thermal-moisture
dynamics of the active layer (Zhang et al., 2019). It could be
deduced that the change in the underlying surface in the upper
region may be related to the melting of permafrost, and the melting
and infiltration of permafrost would increase the subsurface runoff
(Liu et al., 2005; Ye et al., 2009). Additionally, the melting of perma-
frost could lead to an increase in soil water permeability
(St. Jacques & Sauchyn, 2009). Clark et al. (2001), reported that the
melting and infiltration of permafrost in permafrost regions would
increase the replenishment of precipitation to groundwater storage
to some extent. Therefore, the melting of permafrost may also
result in a reduction of direct recharge to runoff by precipitation,
causing the contribution of precipitation to runoff to be signifi-
cantly less than that of the underlying surface. Furthermore, the
contribution of glacier runoff cannot be ignored, which accounts
for 49.18% of the variation in total runoff. With significant temper-
ature increases, the proportion of glacier runoff (r) in the upper
region exhibited a consistently increasing trend with the largest
increasing magnitude in the three sub-regions from period Ι to
period II, while precipitation remained nearly constant, resulting in
a high contribution rate of glacier runoff. Consequently, the
increase in runoff during the changing period in the upper region of
F IGURE 8 The distribution of permafrost in the YZRB was obtained from the National Tibetan Plateau Data Center (http://data.tpdc.ac.cn/zh-hans/), which was based on the frozen ground map of China and a map of the glaciers, frozen ground, and deserts in China (Wang et al., 2012)
16 of 26 XIN ET AL.
the YZRB should be mainly attributed to the increase in under-
ground runoff caused by the melting of permafrost and glaciers
associated with rising temperatures.
In the middle region, the vegetation types were mainly shrubs
and grasslands. What's more, in terms of Section 3.6, the average
maximum NDVI in the middle region showed a significant decreasing
trend with a rate of −0.0015/year (jZcj > 1.64), and the area occupied
by vegetation degradation accounted for 63.82%. Previous studies
have shown that the degradation of vegetation promotes the forma-
tion of surface runoff, which in turn increases the total runoff
(Bosch & Hewlett, 1982; Lin & Wei, 2008; Ruprecht &
Schofield, 1991a, 1991b). Furthermore, as shown in Table 2, precipita-
tion exhibited an upward trend in the middle region, which dominated
the increase in runoff with the largest contribution rate of 39.36%.
Moreover, glacier runoff in this region also played an important role in
the increase in runoff. However, compared with the upper region, the
contribution rate of glacier runoff decreased from 49.18% to 26.04
due to an increase in precipitation of up to 10% from period Ι to
period II. due to the relatively smaller cover area of permafrost in the
middle region (15426.61 km2), the contribution rate of the underlying
surface represented by n also decreased from 59.61 to 36.4%.
In the lower region, vegetation was mainly covered by forest and
grassland, with considerable water consumption from transpiration.
Combined with the vegetation variation results in Section 3.6, the
average maximum NDVI showed a slightly downward trend with a
rate of −0.0005/year (jZcj < 1.64), and the area with vegetation degra-
dation indicated by NDVI occupied 53.03% of the lower region. The
slight decline of NDVI reduced the water resistance of surface vegeta-
tion to some extent, which led to an increase in runoff. However,
compared to the upper and middle regions, the vegetation coverage
of the lower region was much larger and denser, leading to more
water consumption than water yield with increasing temperature due
to vegetation degradation. Additionally, the area of permafrost in the
lower region (5702.61 km2) was much smaller than that of forest and
grassland, indicating that the contribution of the underlying surface
change to runoff could be mainly attributed to the variations in vege-
tation. Therefore, the contribution rate of the underlying surface (n)
was negative, with a value of −58.74%. Similar to the upper and mid-
dle regions, the increase in glacier runoff made a positive contribution
to the total runoff, accounting for 29.8%. Moreover, the precipitation
in the lower region was the largest of all sub-regions and therefore
dominated the increase in runoff, with the greatest contribution rate
of up to 129.21%.
4.2 | Limitations and uncertainties
There were still some limitations and uncertainties in this study. First,
in terms of sensitivity analysis, lower climate variable values cor-
responded to greater runoff sensitivity in the lower, middle and upper
regions. Similar results were also obtained in other studies, but the
physical mechanisms for this phenomenon remain unclear. Wu
et al. (2017) reported that during the high-flow period, runoff was
more sensitive to precipitation in all 17 catchments of the Loess Pla-
teau. Lee and Yeh (2019) demonstrated that in the Lanyang River
basin, although the corresponding sensitivity of runoff was greater
with greater P, the sensitivity of runoff to ET0 exhibited the opposite
trend. Second, due to the complex vertical zonality of permafrost and
glacier melting mechanisms (Fernández, 1998; Gabbi et al., 2014;
Hock & Holmgren, 2005; Tuteja & Cunnane, 1997; Xing &
Zheng, 2003), the influence of meltwater from permafrost and glaciers
on runoff variation at different elevation zones should be elaborately
discussed in future. Third, the quantitative estimations in this study
were based on the assumption that the variations in climate and
underlying surface are independent. Nevertheless, in natural catch-
ments, these two factors are inter-related (Zeng et al., 2015; Zheng
et al., 2009). Furthermore, the simulation results by Su et al. (2016)
and Zhang, Su, et al. (2013) used in this study to derive the values of
r for the three sub-regions also had uncertainties associated with the
hydrologic model parameters. According to Zhang, Su, et al. (2013),
the model uncertainties associated with temperature change (from
0 to 1.1�C/100 m) were generally within 3%, whereas a 1 unit
(mm �C−1 day−1) increase in the degree-day factor for ice melt could
cause a 5% increase in glacier runoff. Given that the VIC-glacier model
has been calibrated and validated with forcing data and runoff data
based on long-term observations, the uncertainty of runoff prediction
caused by climate change prediction is much greater than that of the
hydrological model itself. Finally, the results of glacier runoff simula-
tion in the study of Su et al. (2016) and Zhang, Shoemaker,
et al. (2013) did not show an obvious tipping point and continued to
increase. According to Huss and Hock (2018), the tipping point for
glacier runoff in the YZRB will be reached in the near future (approxi-
mately by the 2030s). Zhao, Ding, et al. (2019) and Zhao, Yang,
et al. (2019) also projected a constant decrease in glacier runoff in the
study region from the 1970s to the 2090s. The reason why the glacier
runoff in the study of Su et al. (2016) continued to increase in the
future might be that they used the delta method to obtain future forc-
ing and did not continuously simulate future changes. This might
affect the accuracy of the results of r, which was derived from the
results of the glacier runoff simulation by Su et al. (2016) and Zhang,
Shoemaker, et al. (2013).
5 | CONCLUSIONS
In this study, long-term trends in the runoff, precipitation and poten-
tial evapotranspiration of the upper, middle and lower regions of the
YZRB from 1966 to 2015 were analysed, and the attribution analysis
within an adjusted Budyko framework, which subtracted the glacier
runoff from the total runoff, was applied to quantitatively estimate
the relative contributions of climate variability, glacier melting and
underlying surface change to runoff variation in each region. Based on
GIMMS NDVI data from 1997 to 2015, the spatial dynamic variations
of vegetation were investigated to further explore the driving mecha-
nism of runoff variation associated with hydro-meteorological factors.
The following are the key conclusions of this study:
XIN ET AL. 17 of 26
1. During the 1966–2015 period, runoff, precipitation and potential
evapotranspiration in all three sub-regions mostly exhibited an
increasing trend except for precipitation in the upper region and
runoff in the lower region, which exhibited a decreasing trend.
2. Runoff in all three sub-regions was most sensitive to precipitation,
followed by the underlying surface, potential evapotranspiration
and glacier runoff. Furthermore, consistent with the decrease in
elevation, the sensitivity of runoff to precipitation, potential
evapotranspiration and underlying surface all decreased along the
upper, middle and lower regions, whereas the sensitivity of runoff
to glacier melting represented by the coefficient r exhibited the
opposite trend.
3. To unify the impact period of climate variability and underlying
surface change on runoff, the year 1997 was selected as the
breakpoint to determine the baseline period and change period
according to the abrupt change detection results. From the base-
line period to the change period, the runoff increased in all three
sub-regions. According to the adjusted Budyko framework, the
dominant factor contributing to the increase in runoff in the upper
region was the underlying surface change, with a contribution of
59.61%. The runoff increase in the middle and lower regions was
mainly attributed to the increase in precipitation, accounting for
39.36 and 129.21%, respectively.
4. Due to the little variation in vegetation and the increasing degrada-
tion of permafrost in the upper region, the increase in runoff may
be mainly attributed to the increase in underground runoff caused
by the melting of permafrost. In the middle region, in addition to
the increase in precipitation, the significant decrease in vegetation
also had a positive effect on runoff increase. In the lower region,
the increase in runoff was mainly caused by the increase in precipi-
tation. Therefore, the positive contribution of glacial runoff to the
total runoff variation in the Yarlung Zangbo River Basin empha-
sizes the importance of investigating the mechanisms by which
glacier meltwater influences runoff variations in alpine regions.
ACKNOWLEDGEMENTS
This work was jointly supported by the National Natural Science
Foundation of China (Grant Nos. 51961145104, 91647202, and
41890822) and National Training Program of Innovation and Entre-
preneurship for Undergraduates (Grant No. 202010019052).
CONFLICT OF INTEREST
The authors declare no conflicts of interest.
DATA AVAILABILITY STATEMENT
The Princeton Global Forcings that support the findings of this study
are available in the Terrestrial Hydrology Research Group at Princeton
University at http://hydrology.princeton.edu/data/. Daily precipita-
tion data extracted from the Long-term Land Surface Hydrologic
Fluxes and States Dataset for China are available at the Institute of
Geographic Sciences and Natural Resources Research, Chinese Acad-
emy of Sciences, by contacting [email protected] or tangqh@igsnrr.
ac.cn. The distribution of permafrost in the YZRB is available in the
National Tibetan Plateau/Third Pole Environment Data Center at
https://data.tpdc.ac.cn/en//, with reference number DOI: https://doi.
org/10.11888/Geocry.tpdc.270038. The observed monthly runoff
data from the three hydrological stations are available from the
Hydrology and Water Resources Survey Bureau of the Tibet Autono
mous Region, which are not publicly available due to privacy
restrictions.
ORCID
Liu Liu https://orcid.org/0000-0002-4915-206X
Lei Cheng https://orcid.org/0000-0002-5298-9573
REFERENCES
Allan, R. P., & Soden, B. J. (2008). Atmospheric warming and the amplifica-
tion of precipitation extremes. Science, 321(5895), 1481–1484.https://doi.org/10.1126/science.1160787
Allen, R. G., Pereira, L. S., Raes, D., & Smith, M. (1998). Crop evapotranspira-
tion. Guidelines for computing crop water requirements (p. 300). United
Nations Food and Agriculture Organization, Irrigation and drainage
paper.
Ayala, A., Pellicciotti, F., MacDonell, S., McPhee, J., & Burlando, P. (2017).
Patterns of glacier ablation across North-Central Chile: Identifying the
limits of empirical melt models under sublimation-favorable conditions.
Water Resources Research, 53(7), 5601–5625. https://doi.org/10.
1002/2016WR020126
Beck, P. S. A., & Goetz, S. J. (2011). Satellite observations of high northern lati-
tude vegetation productivity changes between 1982 and 2008: Ecological
variability and regional differences. Environmental Research Letters, 6(4),
045501. https://doi.org/10.1088/1748-9326/6/4/045501
Beven, K., & Binley, A. (1992). The future of distributed models—Model
calibration and uncertainty prediction. Hydrological Processes, 6,
279–298. https://doi.org/10.1002/hyp.3360060305Bi, H., Liu, B., Wu, J., Yun, L., Chen, Z., & Cui, Z. (2009). Effects of precipi-
tation and land use on runoff during the past 50 years in a typical
watershed in Loess Plateau, China. International Journal of Sediment
Research, 24(3), 352–364. https://doi.org/10.1016/S1001-6279(10)
60009-1
Bosch, J. M., & Hewlett, J. D. (1982). A review of catchment experiments
to determine the effect of vegetation changes on water yield and
evapotranspiration. Journal of Hydrology, 55(1), 3–23. https://doi.org/10.1016/0022-1694(82)90117-2
Braithwaite, R. J. (1995). Positive degree-day factors for ablation on the
Greenland ice sheet studied by energy-balance modelling. Journal of
Glaciology, 41(137), 153–160. https://doi.org/10.3189/S0022143000017846
Brown, A. E., Zhang, L., McMahon, T. A., Western, A. W., & Vertessy, R. A.
(2005). A review of paired catchment studies for determining changes
in water yield resulting from alterations in vegetation. Journal of
Hydrology, 310(1–4), 28–61. https://doi.org/10.1016/j.jhydrol.2004.
12.010
Budyko, M. I. (1974). Climate and life. Academic Press.
Cao, J., Qin, D., Kang, E., & Li, Y. (2006). River discharge changes in the
Qinghai–Tibet Plateau. Chinese Science Bulletin 51, 5(594–600).https://dx.doi.org/10.1007/s11434-006-0594-6.
Chaudhary, P., & Bawa, K. S. (2011). Local perceptions of climate change
validated by scientific evidence in the Himalayas. Biology Letters, 7(5),
767–770. https://doi.org/10.1098/rsbl.2011.0269Chen, H. (2012). Assessment of hydrological alterations from 1961 to
2000 in the Yarlung Zangbo River, Tibet. Ecohydrology & Hydrobiology,
12(2), 93–103. https://doi.org/10.2478/v10104-012-0009-zChen, J., Li, X., & Zhang, M. (2005). Simulating the impacts of climate varia-
tion and land-cover changes on basin hydrology: A case study of the
18 of 26 XIN ET AL.

Suomo basin. Science in China Series D: Earth Sciences, 48(9),
1501–1509. https://doi.org/10.1360/03yd0269Chen, R., Yang, Y., Han, C., Liu, J., Kang, E., Song, Y., & Liu, Z. (2014). Field
experimental research on hydrological function over several typical
underlying surfaces in the cold regions of western China. Advances in
Earth Science, 29(4), 507–514.Cheng, G., & Wu, T. (2007). Responses of permafrost to climate change
and their environmental significance, Qinghai–Tibet Plateau. Journal ofGeophysical Research: Earth Surface, 112(F2). https://doi.org/10.1029/
2006JF000631
Chiew, F. H. S., Teng, J., Vaze, J., Post, D. A., Perraud, J. M.,
Kirono, D. G. C., & Viney, N. R. (2009). Estimating climate change
impact on runoff across Southeast Australia: Method, results, and
implications of the modeling method. Water Resources Research, 45
(10). https://doi.org/10.1029/2008WR007338
Choudhury, B. J. (1999). Evaluation of an empirical equation for annual
evaporation using field observations and results from a biophysical
model. Journal of Hydrology, 216(1–2), 99–110. https://doi.org/10.
1016/S0022-1694(98)00293-5
Clark, I. D., Lauriol, B., Harwood, L., & Marschner, M. (2001). Groundwater
contributions to discharge in a permafrost setting, Big Fish River,
N.W.T., Canada. Arctic, Antarctic, and Alpine Research, 33(1), 62–69.https://doi.org/10.2307/1552278
Cong, Z., Shahid, M., Zhang, D., Lei, H., & Yang, D. (2017). Attribution of
runoff change in the alpine basin: A case study of the Heihe Upstream
Basin, China. Hydrological Sciences Journal, 62(6), 1013–1028. https://doi.org/10.1080/02626667.2017.1283043
Cuo, L., Li, N., Liu, Z., Ding, J., Liang, L., Zhang, Y., & Gong, T. (2019).
Warming and human activities induced changes in the Yarlung
Tsangpo basin of the Tibetan plateau and their influences on
streamflow. Journal of Hydrology: Regional Studies, 25, 100625.
https://doi.org/10.1016/j.ejrh.2019.100625
Donohue, R. J., Roderick, M. L., & McVicar, T. R. (2010). Can dynamic veg-
etation information improve the accuracy of Budyko's hydrological
model? Journal of Hydrology, 390(1–2), 23–34. https://doi.org/10.
1016/j.jhydrol.2010.06.025
Du, J., Shu, J., Yin, J., Yuan, X., Jiaerheng, A., Xiong, S., … Liu, W. (2015).
Analysis on spatio-temporal trends and drivers in vegetation growth
during recent decades in Xinjiang, China. International Journal of
Applied Earth Observation and Geoinformation, 38, 216–228. https://doi.org/10.1016/j.jag.2015.01.006
Fang, J., Kong, F., Fang, J., & Zhao, L. (2018). Observed changes in hydrolog-
ical extremes and flood disaster in Yangtze River Basin: Spatial–temporal variability and climate change impacts. Natural Hazards, 93(1),
89–107. https://doi.org/10.1007/s11069-018-3290-3Feng, A., Li, Y., Gao, J., Wu, S., & Feng, A. (2017). The determinants of
streamflow variability and variation in Three-River Source of China:
Climate change or ecological restoration? Environmental Earth Sciences,
76(20), 696. https://doi.org/10.1007/s12665-017-7026-6
Fernández, A. (1998). An energy balance model of seasonal snow evolu-
tion. Physics and Chemistry of the Earth, 23(5), 661–666. https://doi.org/10.1016/S0079-1946(98)00107-4
Fu, B. (1981). On the calculation of the evaporation from land surface.
Scientia Atmospherica Sinica, 5(1), 23–31.Gabbi, J., Carenzo, M., Pellicciotti, F., Bauder, A., & Funk, M. (2014). A
comparison of empirical and physically based glacier surface melt
models for long-term simulations of glacier response. Journal of Glaci-
ology, 60(224), 1140–1154. https://doi.org/10.3189/2014JoG14J011Gafur, A., Jensen, J. R., Borggaard, O., & Petersen, L. (2003). Runoff and losses
of soil and nutrients from small watersheds under. Shifting cultivation
(Jhum) in the Chittagong Hill Tracts of Bangladesh. Journal of Hydrology,
279, 292–309. https://doi.org/10.1016/S0022-1694(03)00262-2Goossens, C., & Berger, A. (1987). How to recognize an abrupt climatic
change. In Abrupt climatic change: Evidence and implications
(pp. 31–46). Springer.
Han, L., Song, K., Zhang, W., Liu, L., & Jiang, H. (2017). Temporal and spa-
tial variations of hydrological factors in the source area of the Yangtze
River and its responses to climate change. Mountain Research, 35(2),
129–141.He, Y., Jiang, X., Wang, N., Zhang, S., Ning, T., Zhao, Y., & Hu, Y. (2019).
Changes in mountainous runoff in three inland river basins in the arid
Hexi Corridor, China, and its influencing factors. Sustainable Cities and
Society, 50, 101703. https://doi.org/10.1016/j.scs.2019.101703
He, Y., Qiu, H., Song, J., Zhao, Y., Zhang, L., Hu, S., & Hu, Y. (2019). Quanti-
tative contribution of climate change and human activities to runoff
changes in the Bahe River watershed of the Qinling Mountains, China.
Sustainable Cities and Society, 51, 101729. https://doi.org/10.1016/j.
scs.2019.101729
He, Y., Song, J., Hu, Y., Tu, X., & Zhao, Y. (2019). Impacts of different
weather conditions and land use change on runoff variations in the
Beiluo River Watershed, China. Sustainable Cities and Society, 50,
101674. https://doi.org/10.1016/j.scs.2019.101674
He, Y., Tian, P., Mu, X., Gao, P., Zhao, G., Wang, F., & Li, P. (2017). Changes
in daily and monthly rainfall in the Middle Yellow River, China. Theoret-
ical and Applied Climatology, 129(1–2), 139–148. https://doi.org/10.1007/s00704-016-1763-4
Hirsch, R. M., Slack, J. R., & Smith, R. A. (1982). Techniques of trend analy-
sis for monthly water-quality data. Water Resources Research, 18,
107–121.Hock, R., & Holmgren, B. (2005). A distributed surface energy-balance
model for complex topography and its application to Storglaciären,
Sweden. Journal of Glaciology, 51(172), 25–36. https://doi.org/10.
3189/172756505781829566
Holben, B. N. (1986). Characteristics of maximum-value composite images
from temporal AVHRR data. International Journal of Remote Sensing, 7
(11), 1417–1434. https://doi.org/10.1080/01431168608948945Huang, M., Zhang, L., & Gallichand, J. (2003). Runoff responses to affores-
tation in a watershed of the Loess Plateau, China. Hydrological Pro-
cesses, 17, 2599–2609. https://doi.org/10.1002/hyp.1281Huss, M., & Hock, R. (2018). Global-scale hydrological response to future
glacier mass loss. Nature Climate Change, 8(2), 135–140. https://doi.org/10.1038/s41558-017-0049-x
Im, S., Kim, H., Kim, C., & Jang, C. (2009). Assessing the impacts of land
use changes on watershed hydrology using MIKE SHE. Environmen-
tal Geology, 57, 231–239. https://doi.org/10.1007/s00254-008-
1303-3
Immerzeel, W. W., Droogers, P., De Jong, S. M., & Bierkens, M. F. P.
(2009). Large-scale monitoring of snow cover and runoff simulation in
Himalayan river basins using remote sensing. Remote Sensing of Envi-
ronment, 113(1), 40–49. https://doi.org/10.1016/j.rse.2008.08.010Jia, J., Lv, S., & Wang, Z. (2008). Characteristics of water resources in the
Yarlung Zangbo River Basin. Yangtze River, (17), 71–72+81.Jia, L., Li, Z., Xu, G., Ren, Z., Li, P., Cheng, Y., … Yu, S. (2020). Dynamic
change of vegetation and its response to climate and topographic fac-
tors in the Xijiang River Basin, China. Environmental Science and Pollu-
tion Research. 27, 11637–11648. https://doi.org/10.1007/s11356-
020-07692-w
Jiang, L., Feng, W., & Guo, B. (2014). Analysis of dynamic monitoring of
vegetation change and the correlation with precipitation factor in
Yarlung Tsangpo River Basin during the past 13 years. Resources and
Environment in the Yangtze Basin, 23(11), 1610–1619.Jiang, L., Jiapaer, G., Bao, A., Guo, H., & Ndayisaba, F. (2017). Vegetation
dynamics and responses to climate change and human activities in
Central Asia. Science of the Total Environment, 599–600, 967–980.https://doi.org/10.1016/j.scitotenv.2017.05.012
Kendall, M. G. (1975). Rank correlation measures. Charles Griffin.
Kirchner, J. W. (2006). Getting the right answers for the right reasons:
Linking measurements, analyses, and models to advance the science of
hydrology. Water Resources Research, 42(3). W03S04. https://doi.org/
10.1029/2005WR004362
XIN ET AL. 19 of 26

Lee, C., & Yeh, H. (2019). Impact of climate change and human activities
on streamflow variations based on the Budyko framework. Water, 11
(10). 2001. https://doi.org/10.3390/w11102001
Li, B., Su, H., Chen, F., Li, H., Zhang, R., Tian, J., … Rong, Y. (2014). Separa-
tion of the impact of climate change and human activity on streamflow
in the upper and middle reaches of the Taoer River, northeastern
China. Theoretical and Applied Climatology, 118(1–2), 271–283.https://doi.org/10.1007/s00704-013-1032-8
Li, F., Xu, Z., Feng, Y., Liu, M., & Liu, W. (2013). Changes of land cover in
the Yarlung Tsangpo River basin from 1985 to 2005. Environmental
Earth Sciences, 68(1), 181–188. https://doi.org/10.1007/s12665-012-1730-z
Li, F., Zhang, Y., Xu, Z., Liu, C., Zhou, Y., & Liu, W. (2014). Runoff predic-
tions in ungauged catchments in southeast Tibetan Plateau. Journal of
Hydrology, 511, 28–38. https://doi.org/10.1016/j.jhydrol.2014.01.014Li, H., Liu, L., Liu, X., Li, X., & Xu, Z. (2019). Greening implication inferred
from vegetation dynamics interacted with climate change and human
activities over the Southeast Qinghai–Tibet Plateau. Remote Sensing,
11(20), 2421. https://doi.org/10.3390/rs11202421
Li, Q., Cheng, L., Ye, L., Liu, P., & Xiong, L. (2020). Long-term land surface
evaporation and its changes estimated by the generalized complemen-
tary principle in China. Journal of Water Resources Research, 9(3),
259–269. https://doi.org/10.12677/JWRR.2020.93027
Li, X., Wang, L., Chen, D., Yang, K., & Wang, A. (2014). Seasonal evapo-
transpiration changes (1983–2006) of four large basins on the Tibetan
Plateau. Journal of Geophysical Research, 119, 13079–13095. https://doi.org/10.1002/2014JD022380
Li, Y., Liu, C., Zhang, D., Liang, K., Li, X., & Dong, G. (2016). Reduced runoff
due to anthropogenic intervention in the Loess Plateau, China. Water,
8(10). 458. https://doi.org/10.3390/w8100458
Lin, Y., & Wei, X. (2008). The impact of large-scale forest harvesting on
hydrology in the Willow watershed of Central British Columbia. Jour-
nal of Hydrology, 359(1), 141–149. https://doi.org/10.1016/j.jhydrol.2008.06.023
Liu, B., Yang, D., Ye, B., & Berezovskaya, S. (2005). Long-term open-water
season stream temperature variations and changes over Lena River
Basin in Siberia. Global and Planetary Change, 48(1), 96–111. https://doi.org/10.1016/j.gloplacha.2004.12.007
Liu, J., Chen, J., Xu, J., Lin, Y., Yuan, Z., & Zhou, M. (2019). Attribution of
runoff variation in the headwaters of the Yangtze River based on the
Budyko hypothesis. International Journal of Environmental Research and
Public Health, 16(14), 2506. https://doi.org/10.3390/ijerph16142506
Liu, L., Niu, Q., Heng, J., Li, H., & Xu, Z. (2019). Transition characteristics of
the dry-wet regime and vegetation dynamic responses over the
Yarlung Zangbo River Basin, Southeast Qinghai–Tibet Plateau. Remote
Sensing, 11(10), 1254. https://doi.org/10.3390/rs11101254
Liu, T. (1999). Hydrological characteristics of Yarlung Zangbo River. Acta
Geographica Sinica, S1, 157–164.Liu, W., Wang, L., Zhou, J., Li, Y., Sun, F., Fu, G., Li, X., & Sang, Y. (2016). A
worldwide evaluation of basin-scale evapotranspiration estimates
against the water balance method. Journal of Hydrology, 538, 82–95.https://doi.org/10.1016/j.jhydrol.2016.04.006
Liu, X., Xu, Z., Liu, W., & Liu, L. (2019). Responses of hydrological pro-
cesses to climate change in the Yarlung Zangbo River basin. Hydrologi-
cal Sciences Journal, 64(16), 2057–2067. https://doi.org/10.1080/
02626667.2019.1662908
Liu, Z., Yao, Z., Huang, H., Wu, S., & Liu, G. (2014). Land use and climate
changes and their impacts on runoff in the Yarlung Zangbo River
Basin, China. Land Degradation & Development, 25(3), 203–215.https://doi.org/10.1002/ldr.1159
Lo Vecchio, A., Lenzano, M., Durand, M., Lannutti, E., Bruce, R., &
Lenzano, L. (2018). Estimation of surface flow speed and ice surface
temperature from optical satellite imagery at Viedma glacier, Argen-
tina. Global and Planetary Change, 169, 202–213. https://doi.org/10.1016/j.gloplacha.2018.08.001
Lv, L., & Li, Z. (2013). Variability recognition of runoff in the middle and
lower reaches of Yarlung Zangbo River. Water Power, 39(5), 12–15.Lv, Y., Dong, G., Yang, S., Zhou, Q., & Cai, M. (2014). Spatio-temporal vari-
ation in NDVI in the Yarlung Zangbo River Basin and its relationship
with precipitation and elevation. Resources Science, 36(3), 603–611.Mann, H. B. (1945). Nonparametric tests against trend. Econometrica, 13
(3), 245–259.Matthews, T., & Hodgkins, R. (2016). Interdecadal variability of degree-day
factors on Vestari Hagafellsjökull (Langjökull, Iceland) and the impor-
tance of threshold air temperatures. Journal of Glaciology, 62(232),
310–322. https://doi.org/10.1017/jog.2016.21Mavromatis, T., & Stathis, D. (2011). Response of the water balance in
Greece to temperature and precipitation trends. Theoretical and
Applied Climatology, 104(1), 13–24. https://doi.org/10.1007/s00704-010-0320-9
Milly, P. C. D. (1994). Climate, interseasonal storage of soil water, and the
annual water balance. Advances in Water Resources, 17(1–2), 19–24.https://doi.org/10.1016/0309-1708(94)90020-5
Ning, T., Li, Z., & Liu, W. (2016). Separating the impacts of climate change
and land surface alteration on runoff reduction in the Jing River catch-
ment of China. CATENA, 147, 80–86. https://doi.org/10.1016/j.
catena.2016.06.041
Ohmura, A. (2012). Enhanced temperature variability in high-altitude cli-
mate change. Theoretical and Applied Climatology, 110(4), 499–508.https://doi.org/10.1007/s00704-012-0687-x
Peng, J., Liu, Z., Liu, Y., Wu, J., & Han, Y. (2012). Trend analysis of vegeta-
tion dynamics in Qinghai–Tibet Plateau using Hurst exponent. Ecologi-
cal Indicators, 14(1), 28–39. https://doi.org/10.1016/j.ecolind.2011.
08.011
Pettitt, A. N. (1979). A non-parametric approach to the change-point prob-
lem. Applied Statistics, 28(2), 126–135. https://doi.org/10.2307/
2346729
Ruprecht, J. K., & Schofield, N. J. (1991a). Effects of partial deforestation
on hydrology and salinity in high salt storage landscapes. I. Extensive
block clearing. Journal of Hydrology, 129(1), 19–38. https://doi.org/10.1016/0022-1694(91)90042-G
Ruprecht, J. K., & Schofield, N. J. (1991b). Effects of partial deforestation
on hydrology and salinity in high salt storage landscapes. II. Strip, soils
and parkland clearing. Journal of Hydrology, 129(1), 39–55. https://doi.org/10.1016/0022-1694(91)90043-H
Schaake, J. C. (1990). From climate to flow, in climate change and U.S. In
P. E. Waggoner (Ed.), Water resources (pp. 177–206). John Wiley.
Sen, P. K. (1968). Estimates of the regression coefficient based on
Kendall's tau. Journal of the American Statistical Association, 63(324),
1379–1389. https://doi.org/10.1080/01621459.1968.10480934Sheffield, J., Goteti, G., & Wood, E. F. (2006). Development of a 50-year
high-resolution global dataset of meteorological forcings for land sur-
face modeling. Journal of Climate, 19(13), 3088–3111. https://doi.org/10.1175/JCLI3790.1
Sneyers, R. (1975). Sur l'analyse statistique des séries d'observations. WMO.
St. Jacques, J., & Sauchyn, D. J. (2009). Increasing winter baseflow and
mean annual streamflow from possible permafrost thawing in the
Northwest Territories, Canada. Geophysical Research Letters, 36(1).
L01401. https://doi.org/10.1029/2008GL035822
Su, F., Zhang, L., Ou, T., Chen, D., Yao, T., Tong, K., & Qi, Y. (2016). Hydro-
logical response to future climate changes for the major upstream river
basins in the Tibetan Plateau. Global and Planetary Change, 136,
82–95. https://doi.org/10.1016/j.gloplacha.2015.10.012Sung, J. H., Chung, E., Kim, Y., & Lee, B. (2017). Meteorological hazard
assessment based on trends and abrupt changes in rainfall characteris-
tics on the Korean peninsula. Theoretical and Applied Climatology, 127
(1–2), 305–326. https://doi.org/10.1007/s00704-015-1581-0Tang, L., Zhang, Z., & Wang, X. (2010). Streamflow response to climate
and land use changes in Qingshui River watershed in the loess hilly–gully region of Western Shanxi Province, China. Chinese Journal of
20 of 26 XIN ET AL.

Plant Ecology, 34(7), 800–810. https://doi.org/10.3773/j.issn.1005-
264x.2010.07.005
Tian, L., Yao, T., Numaguti, A., & Duan, K. (2001). Relation between stable
isotope in monsoon precipitation in southern Tibetan Plateau and
moisture transport history. Science in China Series D: Earth Sciences, 44
(1), 267–274. https://doi.org/10.1007/BF02911996Tong, S., Lai, Q., Zhang, J., Bao, Y., Lusi, A., Ma, Q., … Zhang, F. (2018). Spa-
tiotemporal drought variability on the Mongolian Plateau from
1980–2014 based on the SPEI-PM, intensity analysis and Hurst expo-
nent. Science of the Total Environment, 615, 1557–1565. https://doi.org/10.1016/j.scitotenv.2017.09.121
Tuteja, N. K., & Cunnane, C. (1997). Modelling coupled transport of mass
and energy into the snowpack—Model development, validation and
sensitivity analysis. Journal of Hydrology, 195(1), 232–255. https://doi.org/10.1016/S0022-1694(96)03236-2
Wang, D., & Tang, Y. (2014). A one-parameter Budyko model for water
balance captures emergent behavior in Darwinian hydrologic models.
Geophysical Research Letters, 41(13), 4569–4577. https://doi.org/10.1002/2014GL060509
Wang, G., Zhang, J., He, R., Jiang, N., & Jing, X. (2008). Runoff reduction
due to environmental changes in the Sanchuanhe river basin. Interna-
tional Journal of Sediment Research, 23(2), 174–180. https://doi.org/10.1016/S1001-6279(08)60017-7
Wang, S., Zhang, Z., Sun, G., Zhang, M., & Zhang, X. (2006). Effects of land
use change on hydrological dynamics at watershed scale in the Loess
Plateau – A case study in the Luergou watershed, Gansu Province.
Journal of Beijing Forestry University, 1, 48–54.Wang, T., Shi, Y., & Guo, D. (2012). Frozen ground map of China based on a
map of the glaciers, frozen ground and deserts in China (1981–2006).National Tibetan Plateau Data Center. https://doi.org/10.11888/
Geocry.tpdc.270038
Wang, T., Yang, H., Yang, D., Qin, Y., & Wang, Y. (2018). Quantifying the
streamflow response to frozen ground degradation in the source region
of the Yellow River within the Budyko framework. Journal of Hydrology,
558, 301–313. https://doi.org/10.1016/j.jhydrol.2018.01.050Wang, W., Shao, Q., Yang, T., Peng, S., Xing, W., Sun, F., & Luo, Y. (2013).
Quantitative assessment of the impact of climate variability and
human activities on runoff changes: A case study in four catchments
of the Haihe River basin, China. Hydrological Processes, 27(8),
1158–1174. https://doi.org/10.1002/hyp.9299Wang, X. (2015). Study on the spatial and temporal characteristics of
water circulation in the Yalung Zangbo River Basin. Tibet Science and
Technology, 7, 8–12.Wong, H., Hu, B. Q., Ip, W. C., & Xia, J. (2006). Change-point analysis of
hydrological time series using grey relational method. Journal of
Hydrology, 324(1), 323–338. https://doi.org/10.1016/j.jhydrol.2005.
10.007
Wu, J., Miao, C., Wang, Y., Duan, Q., & Zhang, X. (2017). Contribution
analysis of the long-term changes in seasonal runoff on the Loess Pla-
teau, China, using eight Budyko-based methods. Journal of Hydrology,
545, 263–275. https://doi.org/10.1016/j.jhydrol.2016.12.050Wu, Y., Wang, N., He, J., & Jiang, X. (2015). Estimating mountain glacier
surface temperatures from Landsat-ETM + thermal infrared data: A
case study of Qiyi glacier, China. Remote Sensing of Environment, 163,
286–295. https://doi.org/10.1016/j.rse.2015.03.026Xing, S., & Zheng, X. (2003). The coupled numerical model of water and
heat transfer in snow layer. Journal of Taiyuan University of Technology,
6, 647–650.Xiong, D., Yang, Z., Chen, X., & Zhou, H. (2006). Analysis on landscape pat-
tern in the upper and middle reaches of Yarlung Zangbo River: Taking
Zhongba County, Angren County, Rikaze City as example. Wuhan Uni-
versity Journal of Natural Sciences, 11(4), 951–957. https://doi.org/10.1007/BF02830193
Xu, X., Yang, D., Yang, H., & Lei, H. (2014). Attribution analysis based on
the Budyko hypothesis for detecting the dominant cause of runoff
decline in Haihe basin. Journal of Hydrology, 510, 530–540. https://doi.org/10.1016/j.jhydrol.2013.12.052
Xue, B., Wang, L., Li, X., Yang, K., Chen, D., & Sun, L. (2013). Evaluation of
evapotranspiration estimates for two river basins on the Tibetan Pla-
teau by a water balance method. Journal of Hydrology, 492, 290–297.https://doi.org/10.1016/j.jhydrol.2013.04.005
Yang, D., Zhang, S., & Xu, X. (2015). Attribution analysis for runoff decline
in Yellow River Basin during past fifty years based on Budyko hypoth-
esis. Scientia Sinica Technologica, 45(10), 1024–1034.Yang, H., Qi, J., Xu, X., Yang, D., & Lv, H. (2014). The regional variation in
climate elasticity and climate contribution to runoff across China. Jour-
nal of Hydrology, 517, 607–615. https://doi.org/10.1016/j.jhydrol.
2014.05.062
Yang, H., & Yang, D. (2012). Climatic factors influencing changing pan
evaporation across China from 1961 to 2001. Journal of Hydrology,
414–415, 184–193. https://doi.org/10.1016/j.jhydrol.2011.10.043Yang, H., Yang, D., & Hu, Q. (2014). An error analysis of the Budyko
hypothesis for assessing the contribution of climate change to runoff.
Water Resources Research, 50, 9620–9629. https://doi.org/10.1002/2014WR015451
Yang, H., Yang, D., Lei, Z., & Sun, F. (2008). New analytical derivation of
the mean annual water-energy balance equation. Water Resources
Research, 44(3). W03410. https://doi.org/10.1029/2007WR006135
Yao, J., Yang, Q., Mao, W., Zhao, Y., & Xu, X. (2016). Precipitation trend–elevation relationship in arid regions of the China. Global and Planetary
Change, 143, 1–9. https://doi.org/10.1016/j.gloplacha.2016.05.007Yao, T., Li, Z., Yang, W., Guo, X., Zhu, L., Kang, S., Wu, Y. H., & Yu, W.
(2010). Glacial distribution and mass balance in the Yarlung Zangbo
River and its influence on lakes. Chinese Science Bulletin, 55(20),
2072–2078. https://doi.org/10.1007/s11434-010-3213-5Ye, B., Yang, D., Zhang, Z., & Kane, D. L. (2009). Variation of hydrological
regime with permafrost coverage over Lena Basin in Siberia. Journal of
Geophysical Research: Atmospheres, 114(D7). D07102. https://doi.org/
10.1029/2008JD010537
Yin, Y., Liu, H., Yi, X., & Liu, W. (2015). Spatiotemporal variation and abrupt
change analysis of temperature from 1960 to 2012 in the Huang-
Huai-Hai Plain, China. Advances in Meteorology (6), 1–11. https://doi.org/10.1155/2015/643493
Zeng, S., Xia, J., & Du, H. (2014). Separating the effects of climate change
and human activities on runoff over different time scales in the Zhang
River basin. Stochastic Environmental Research and Risk Assessment, 28
(2), 401–413. https://doi.org/10.1007/s00477-013-0760-8Zeng, S., Zhan, C., Sun, F., Du, H., & Wang, F. (2015). Effects of climate
change and human activities on surface runoff in the Luan River basin.
Advances in Meteorology, 2015, 1–12. https://doi.org/10.1155/2015/740239
Zhang, A., Zhang, C., Fu, G., Wang, B., Bao, Z., & Zheng, H. (2012). Assess-
ments of impacts of climate change and human activities on runoff
with SWAT for the Huifa River Basin, Northeast China. Water
Resources Management, 26, 2199–2217. https://doi.org/10.1007/
s11269-012-0010-8
Zhang, C., Shoemaker, C. A., Woodbury, J. D., Cao, M., & Zhu, X. (2013).
Impact of human activities on stream flow in the Biliu River basin,
China. Hydrological Processes, 27(17), 2509–2523. https://doi.org/10.1002/hyp.9389
Zhang, D., Cong, Z., Ni, G., Yang, D., & Hu, S. (2015). Effects of snow ratio
on annual runoff within the Budyko framework. Hydrology and Earth
System Sciences, 19(4), 1977–1992. https://doi.org/10.5194/hess-19-1977-2015
Zhang, L., Dawes, W. R., & Walker, G. R. (2001). Response of mean annual
evapotranspiration to vegetation changes at catchment scale. Water
Resources Research, 37(3), 701–708. https://doi.org/10.1029/
2000WR900325
Zhang, L., Hickel, K., Dawes, W. R., Chiew, F., Western, A. W., &
Briggs, P. R. (2004). A rational function approach for estimating mean
XIN ET AL. 21 of 26
annual evapotranspiration. Water Resources Research, 40(2). W02502.
https://doi.org/10.1029/2003WR002710
Zhang, L., Su, F., Yang, D., Hao, Z., & Tong, K. (2013). Discharge regime
and simulation for the upstream of major rivers over Tibetan Plateau.
Journal of Geophysical Research: Atmospheres, 118(15), 8500–8518.https://doi.org/10.1002/jgrd.50665
Zhang, M., Wei, X., Sun, P., & Liu, S. (2012). The effect of forest harvesting
and climatic variability on runoff in a large watershed: The case study
in the Upper Minjiang River of Yangtze River basin. Journal of Hydrol-
ogy, 464–465, 1–11. https://doi.org/10.1016/j.jhydrol.2012.05.050Zhang, M., Wen, Z., Dong, J., Wang, D., Hou, Y., Wang, B., … Wei, H.
(2019). Mechanism of climate warming on thermal-moisture dynamics
of active permafrost layer considering effect of rainfall. Rock and Soil
Mechanics, 40(5), 1983–1992.Zhang, W., Yi, Y., Song, K., Kimball, J., & Lu, Q. (2016). Hydrological
response of alpine wetlands to climate warming in the Eastern Tibetan
Plateau. Remote Sensing, 8(4), 336. https://doi.org/10.3390/
rs8040336
Zhang, X., Tang, Q., Pan, M., & Tang, Y. (2014). A long-term land surface
hydrologic fluxes and states dataset for China. Journal of Hydrometeo-
rology, 15(5), 2067–2084. https://doi.org/10.1175/JHM-D-13-0170.1
Zhang, X., Zhang, L., Zhao, J., Rustomji, P., & Hairsine, P. (2008). Responses
of streamflow to changes in climate and land use/cover in the Loess
Plateau, China. Water Resources Research, 44(7). W00A07. https://doi.
org/10.1029/2007WR006711
Zhang, Y., Guan, D., Jin, C., Wang, A., Wu, J., & Yuan, F. (2011). Analysis of
impacts of climate variability and human activity on streamflow for a
river basin in Northeast China. Journal of Hydrology, 410(3), 239–247.https://doi.org/10.1016/j.jhydrol.2011.09.023
Zhao, Q., Ding, Y., Wang, J., Gao, H., Zhang, S., Zhao, C., Xu, J., Han, H., &
Shangguan, D. (2019). Projecting climate change impacts on hydrologi-
cal processes on the Tibetan Plateau with model calibration against
the glacier inventory data and observed streamflow. Journal of Hydrol-
ogy, 573, 60–81. https://doi.org/10.1016/j.jhydrol.2019.03.043Zhao, Y., Yang, N., Wei, Y., Hu, B., Cao, Q., Tong, K., & Liang, Y. (2019).
Eight hundred years of drought and flood disasters and precipitation
sequence reconstruction in Wuzhou City, Southwest China. Water, 11
(2). 219. https://doi.org/10.3390/w11020219
Zhao, Z., Fu, Q., Gao, C., Zhang, X., & Xu, Y. (2017). Simulation of monthly
runoff considering flow components in Yarlung Zangbo River. Journal
of China Hydrology, 37(2), 26–30.Zheng, H., Zhang, L., Liu, C., Shao, Q., & Fukushima, Y. (2007). Changes in
stream flow regime in headwater catchments of the Yellow River basin
since the 1950s. Hydrological Processes, 21(7), 886–893. https://doi.org/10.1002/hyp.6280
Zheng, H., Zhang, L., Zhu, M., Zhu, R., Liu, C., Sato, Y., & Fukushima, Y.
(2009). Responses of streamflow to climate and land surface change in
the headwaters of the Yellow River Basin. Water Resources Research,
45. W00A19. https://doi.org/10.1029/2007WR006665
Zuo, D., Xu, Z., Wu, W., Zhao, J., & Zhao, F. (2014). Identification of
streamflow response to climate change and human activities in the
Wei River Basin, China. Water Resources Management, 28(3), 833–851.https://doi.org/10.1007/s11269-014-0519-0
How to cite this article: Xin J, Sun X, Liu L, et al. Quantifying
the contribution of climate and underlying surface changes to
alpine runoff alterations associated with glacier melting.
Hydrological Processes. 2021;35:e14069. https://doi.org/10.
1002/hyp.14069
22 of 26 XIN ET AL.
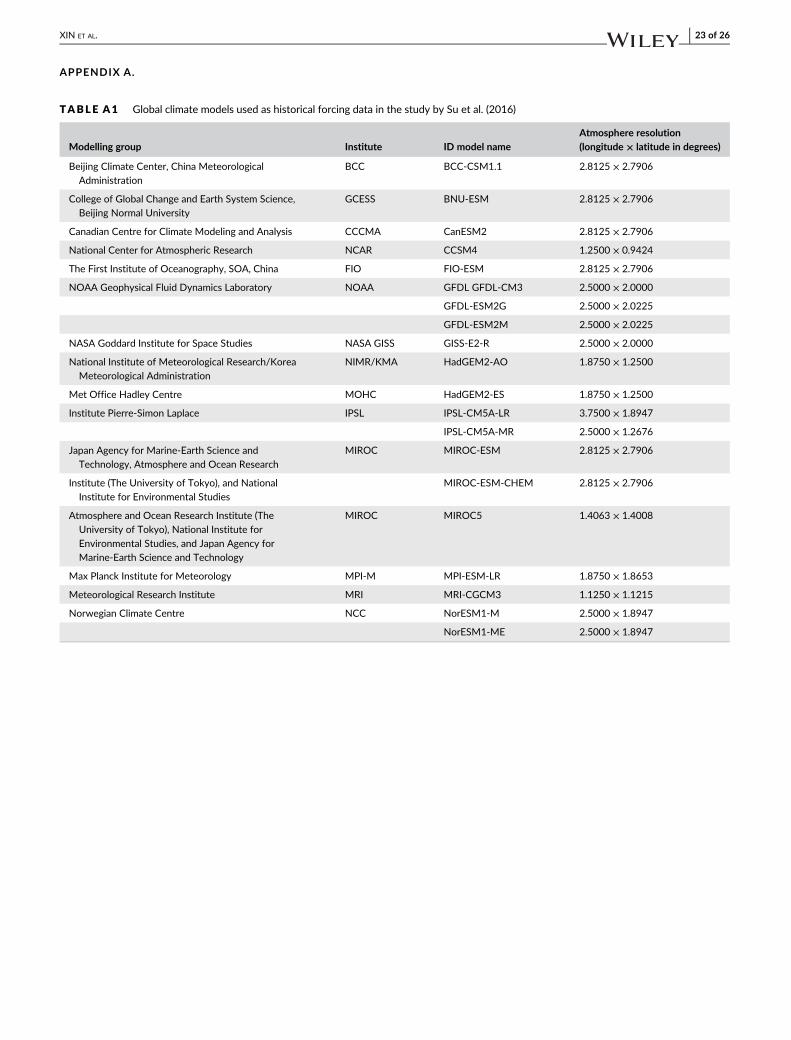
APPENDIX A.
TABLE A1 Global climate models used as historical forcing data in the study by Su et al. (2016)
Modelling group Institute ID model nameAtmosphere resolution(longitude × latitude in degrees)
Beijing Climate Center, China Meteorological
Administration
BCC BCC-CSM1.1 2.8125 × 2.7906
College of Global Change and Earth System Science,
Beijing Normal University
GCESS BNU-ESM 2.8125 × 2.7906
Canadian Centre for Climate Modeling and Analysis CCCMA CanESM2 2.8125 × 2.7906
National Center for Atmospheric Research NCAR CCSM4 1.2500 × 0.9424
The First Institute of Oceanography, SOA, China FIO FIO-ESM 2.8125 × 2.7906
NOAA Geophysical Fluid Dynamics Laboratory NOAA GFDL GFDL-CM3 2.5000 × 2.0000
GFDL-ESM2G 2.5000 × 2.0225
GFDL-ESM2M 2.5000 × 2.0225
NASA Goddard Institute for Space Studies NASA GISS GISS-E2-R 2.5000 × 2.0000
National Institute of Meteorological Research/Korea
Meteorological Administration
NIMR/KMA HadGEM2-AO 1.8750 × 1.2500
Met Office Hadley Centre MOHC HadGEM2-ES 1.8750 × 1.2500
Institute Pierre-Simon Laplace IPSL IPSL-CM5A-LR 3.7500 × 1.8947
IPSL-CM5A-MR 2.5000 × 1.2676
Japan Agency for Marine-Earth Science and
Technology, Atmosphere and Ocean Research
MIROC MIROC-ESM 2.8125 × 2.7906
Institute (The University of Tokyo), and National
Institute for Environmental Studies
MIROC-ESM-CHEM 2.8125 × 2.7906
Atmosphere and Ocean Research Institute (The
University of Tokyo), National Institute for
Environmental Studies, and Japan Agency for
Marine-Earth Science and Technology
MIROC MIROC5 1.4063 × 1.4008
Max Planck Institute for Meteorology MPI-M MPI-ESM-LR 1.8750 × 1.8653
Meteorological Research Institute MRI MRI-CGCM3 1.1250 × 1.1215
Norwegian Climate Centre NCC NorESM1-M 2.5000 × 1.8947
NorESM1-ME 2.5000 × 1.8947
XIN ET AL. 23 of 26
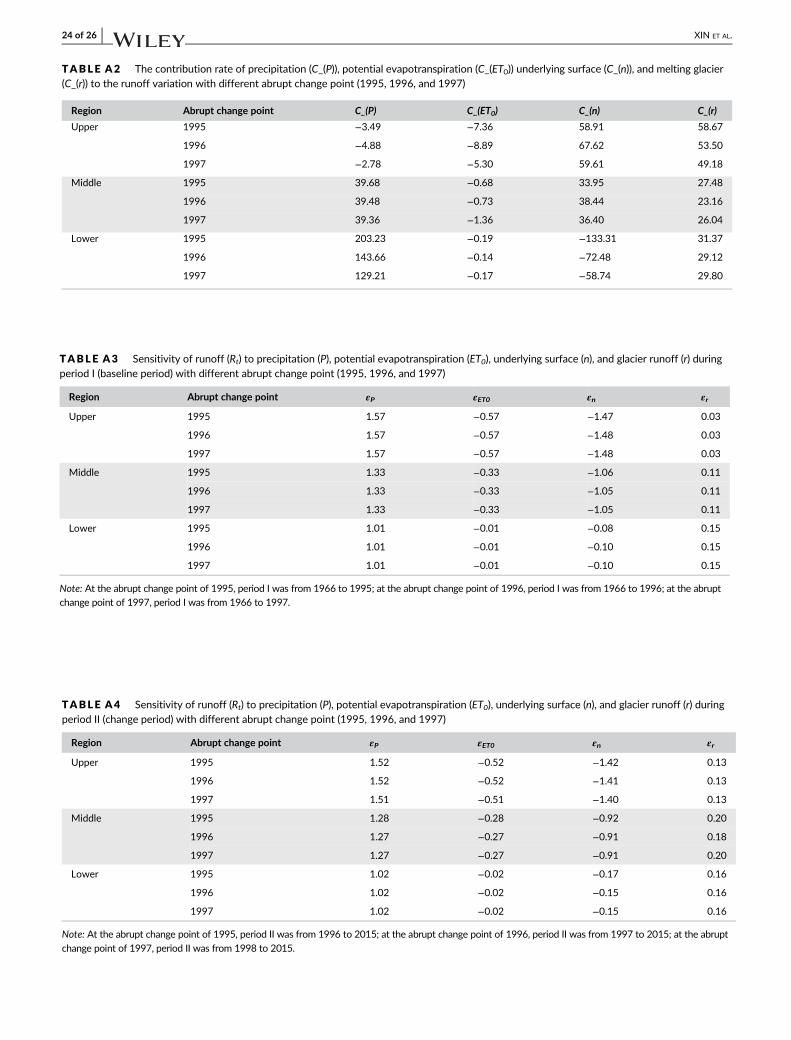
TABLE A3 Sensitivity of runoff (Rt) to precipitation (P), potential evapotranspiration (ET0), underlying surface (n), and glacier runoff (r) duringperiod I (baseline period) with different abrupt change point (1995, 1996, and 1997)
Region Abrupt change point εP εET0 εn εr
Upper 1995 1.57 −0.57 −1.47 0.03
1996 1.57 −0.57 −1.48 0.03
1997 1.57 −0.57 −1.48 0.03
Middle 1995 1.33 −0.33 −1.06 0.11
1996 1.33 −0.33 −1.05 0.11
1997 1.33 −0.33 −1.05 0.11
Lower 1995 1.01 −0.01 −0.08 0.15
1996 1.01 −0.01 −0.10 0.15
1997 1.01 −0.01 −0.10 0.15
Note: At the abrupt change point of 1995, period I was from 1966 to 1995; at the abrupt change point of 1996, period I was from 1966 to 1996; at the abrupt
change point of 1997, period I was from 1966 to 1997.
TABLE A4 Sensitivity of runoff (Rt) to precipitation (P), potential evapotranspiration (ET0), underlying surface (n), and glacier runoff (r) duringperiod II (change period) with different abrupt change point (1995, 1996, and 1997)
Region Abrupt change point εP εET0 εn εr
Upper 1995 1.52 −0.52 −1.42 0.13
1996 1.52 −0.52 −1.41 0.13
1997 1.51 −0.51 −1.40 0.13
Middle 1995 1.28 −0.28 −0.92 0.20
1996 1.27 −0.27 −0.91 0.18
1997 1.27 −0.27 −0.91 0.20
Lower 1995 1.02 −0.02 −0.17 0.16
1996 1.02 −0.02 −0.15 0.16
1997 1.02 −0.02 −0.15 0.16
Note: At the abrupt change point of 1995, period II was from 1996 to 2015; at the abrupt change point of 1996, period II was from 1997 to 2015; at the abrupt
change point of 1997, period II was from 1998 to 2015.
TABLE A2 The contribution rate of precipitation (C_(P)), potential evapotranspiration (C_(ET0)) underlying surface (C_(n)), and melting glacier(C_(r)) to the runoff variation with different abrupt change point (1995, 1996, and 1997)
Region Abrupt change point C_(P) C_(ET0) C_(n) C_(r)
Upper 1995 −3.49 −7.36 58.91 58.67
1996 −4.88 −8.89 67.62 53.50
1997 −2.78 −5.30 59.61 49.18
Middle 1995 39.68 −0.68 33.95 27.48
1996 39.48 −0.73 38.44 23.16
1997 39.36 −1.36 36.40 26.04
Lower 1995 203.23 −0.19 −133.31 31.37
1996 143.66 −0.14 −72.48 29.12
1997 129.21 −0.17 −58.74 29.80
24 of 26 XIN ET AL.

F IGURE A1 Comparison results of mean air temperature in the upper (a), middle (b), and lower (c) regions, and the entire basin (d). Temp_PGArepresents the average temperature of the Princeton Global Forcings (PGA) (Sheffield et al., 2006), Temp_CMFD represents the averagetemperature of the China meteorological forcing dataset (CMFD) (He et al., 2020). F represents the value of the F-test, and F > 3.86 represents asignificance level of 0.05
XIN ET AL. 25 of 26

F IGURE A2 Comparison results of mean downward shortwave radiation in the upper (a), middle (b), and lower (c) regions, and the entirebasin (d). Dsrad_PGA represents the downward shortwave radiation of the Princeton Global Forcings (PGA) (Sheffield et al., 2006), Dsrad_CMFDrepresents the downward shortwave radiation of the China meteorological forcing dataset (CMFD) (He et al., 2020). F represents the F-teststatistic, and F > 3.86 represents a significance level of 0.05
26 of 26 XIN ET AL.