quantitative 3d analysis of huge nanoparticle assemblies
TRANSCRIPT

Nanoscale
PAPER
Cite this: Nanoscale, 2016, 8, 292
Received 8th October 2015,Accepted 18th November 2015
DOI: 10.1039/c5nr06962a
www.rsc.org/nanoscale
Quantitative 3D analysis of huge nanoparticleassemblies†
Daniele Zanaga,a Folkert Bleichrodt,b Thomas Altantzis,a Naomi Winckelmans,a
Willem Jan Palenstijn,b Jan Sijbers,c Bart de Nijs,d Marijn A. van Huis,d
Ana Sánchez-Iglesias,e Luis M. Liz-Marzán,e Alfons van Blaaderen,d
K. Joost Batenburg,b Sara Bals*a and Gustaaf Van Tendelooa
Nanoparticle assemblies can be investigated in 3 dimensions using electron tomography. However, it is
not straightforward to obtain quantitative information such as the number of particles or their relative
position. This becomes particularly difficult when the number of particles increases. We propose a novel
approach in which prior information on the shape of the individual particles is exploited. It improves the
quality of the reconstruction of these complex assemblies significantly. Moreover, this quantitative Sparse
Sphere Reconstruction approach yields directly the number of particles and their position as an output of
the reconstruction technique, enabling a detailed 3D analysis of assemblies with as many as 10 000 par-
ticles. The approach can also be used to reconstruct objects based on a very limited number of projec-
tions, which opens up possibilities to investigate beam sensitive assemblies where previous
reconstructions with the available electron tomography techniques failed.
Introduction
Nanoparticle assemblies attract increasing interest because ofthe possibility of tuning their properties by adjusting theoverall size and shape, the stacking of the individual nano-particles, and the distances between them.1–5 However, as thesynthetized systems become more complex, an accuratecharacterization of the structure becomes more demanding.
Transmission electron microscopy is an important tech-nique to characterize materials at the nanometer scale andbelow.6–10 However, it conventionally only allows for the acqui-sition of two-dimensional (2D) projections of three-dimen-sional (3D) objects, which is not sufficient for a quantitativecharacterization of complex 3D nanostructures. Electron
tomography has therefore been developed to overcome thisstrict limitation, acquiring 2D projections over a large tiltrange and combining them through a mathematical recon-struction algorithm.11
Electron tomography is a versatile and powerful tool thathas been increasingly used in the field of materials science.12
It can be used to investigate the morphology and structure of abroad variety of nanomaterials.13,14 Tomography has further-more been combined with spectroscopic techniques such asElectron Energy Loss Spectroscopy (EELS) and Energy Disper-sive X-Ray spectroscopy (EDX) for the 3D investigation ofchemical composition,15–18 bonding nature19 and surface plas-mons20 of nanomaterials. Great effort has also been made inthe development of advanced reconstruction algorithms,21
enabling quantification of the 3D results22–24 and pushing theresolution of the technique to the atomic scale.25–27
Also for the characterization of nano-assemblies, electrontomography is nowadays a standard technique,28–32 yielding a3D description of the morphology and inner structure. In com-parison to diffraction techniques such as Small Angle X-rayScattering,33,34 one of the main advantages of electron tomog-raphy is that the technique also enables a detailed descriptionof non-periodic features such as defects and surface mor-phology. A quantitative description of the position of the indi-vidual nanoparticles furthermore allows a comparison withtheoretical models and a better understanding of the mecha-nisms which rule the self-assembling process.35–37
†Electronic supplementary information (ESI) available. See DOI: 10.1039/c5nr06962a
aEMAT, University of Antwerp, Groenenborgerlaan 171, B-2020 Antwerp, Belgium.
E-mail: [email protected] Wiskunde & Informatica, Science Park 123, NL-1098XG Amsterdam,
The NetherlandsciMinds-Visionlab, University of Antwerp, Universiteitsplein 1, B-2610 Antwerp,
BelgiumdSoft Condensed Matter, Debye Institute for Nanomaterials Science,
Utrecht University, Princetonplein 5, 3584 CC Utrecht, The NetherlandseBionanoplasmonics Laboratory, CIC biomaGUNE, Paseo de Miramón 182,
20009 Donostia – San Sebastián, Spain
292 | Nanoscale, 2016, 8, 292–299 This journal is © The Royal Society of Chemistry 2016
Ope
n A
cces
s A
rtic
le. P
ublis
hed
on 1
9 N
ovem
ber
2015
. Dow
nloa
ded
on 0
8/11
/201
6 16
:06:
19.
Thi
s ar
ticle
is li
cens
ed u
nder
a C
reat
ive
Com
mon
s A
ttrib
utio
n 3.
0 U
npor
ted
Lic
ence
.
View Article OnlineView Journal | View Issue

Despite the valuable information that can be obtained byelectron tomography, 3D reconstructions based on classicalalgorithms, such as Weighted Back-projection (WBP)38 and theSimultaneous Iterative Reconstruction Technique (SIRT),39
suffer from a number of restrictions. The narrow spacebetween the objective lens pole pieces restricts the tilt range ofthe sample to typically −80° to +80°. This causes “missingwedge artifacts”, which can be observed as an elongationalong the beam direction in the final reconstruction.40 Fur-thermore, degradation of the sample due to the electron doseoften occurs. As a consequence, the projections are mostlyacquired with tilt increments of 1°–5°, yielding an under-sampling of the higher frequencies and a consequent degra-dation of the resolution with a blurring of the sharperfeatures.11
For relatively small assemblies of closed-packed nano-particles (consisting of 100 particles or less), the number ofparticles can be determined and their coordinates can be esti-mated manually.41 However, if the number of particlesincreases and the distance between them is less than the 3Dresolution of the tomography experiment,42 manual segmenta-tion becomes subjective and quantification of the data isimpossible.
Here, we present a novel approach that enables us to deter-mine the coordinates of each nanoparticle in an assembly,even when the assembly consists of up to 10 000 (spherical)particles. This technique will have a major impact as it enablesa straightforward quantification of inter-particle distances and3D symmetry of the stacking. Furthermore, the outcome ofthese measurements can be used as an input for modelingstudies that predict the final 3D structure as a function of theparameters used during the synthesis.35
Results and discussionReconstruction algorithms principles
In a tomography reconstruction problem, the unknown objectis discretized on a grid of pixels, of width u and height h. Everypixel value is labeled as an unknown xi for i = 1,2,…, u × h.Probe rays travelling through the object give rise to a projectionbj that equals the sum of the intensities of the probed pixels,each weighted by a coefficient wij given by the area covered by
the ray traversing that pixel (Fig. 1), such that bj ¼XN
i¼1
wijxi.
The system of linear equations representing the tomographicproblem can be written in matrix notation, obtaining eqn (1):
Wx ¼ b ð1ÞThis system of equations is usually underdetermined due
to the limited number of projections, leading to an ill-posedinverse problem. To deal with noise in the projection data, thesystem is typically solved in a least squares sense, minimizingkWx − bk2. The addition of prior information,43,44 or penaltyfunctions23,24,45 can be used as strategies to obtain a less-underdetermined reconstruction problem. However, there are
a number of samples for which none of the current advancedapproaches work well since blurring always occurs11 and themissing wedge leads to a superposition of the particle bound-aries, hampering to distinguish them. This is particularly thecase for large assemblies of spherical (or nearly spherical) par-ticles or when only a limited number of projections are avail-able. It must be noted that during the 3D investigation of anassembly of nanoparticles, the exact shape of the individualparticles is often not of crucial interest and we can assumethat they correspond to perfect spheres. If the size of the par-ticles can be estimated, we can use discrete spheres as basiselements and the problem is reduced to the reconstruction ofthe center coordinates of these spheres. Now we can use thefollowing image transformation:
x ¼ Cy ð2Þwhere yi = 1 if a sphere center is located at pixel xi. C corre-sponds to a matrix that transforms the centers into pixelizedimages of spheres. Our tomography problem (eqn (1)) thenbecomes:
WCy ¼ b ð3ÞSince even for large assemblies, the number of particles is
small compared to the number of voxels, the coefficient vectory will be very sparse. To incorporate this sparsity assumptionin the reconstruction, we solve the following problem:
miny
jjyjj1subject tojjWCy� bjj2 � σ ð4Þ
where σ is the noise level. While the tomography problem ofeqn (1) typically does not have a unique solution, computing a
Fig. 1 Schematic representation of the formulation of an algebraicreconstruction problem.
Nanoscale Paper
This journal is © The Royal Society of Chemistry 2016 Nanoscale, 2016, 8, 292–299 | 293
Ope
n A
cces
s A
rtic
le. P
ublis
hed
on 1
9 N
ovem
ber
2015
. Dow
nloa
ded
on 0
8/11
/201
6 16
:06:
19.
Thi
s ar
ticle
is li
cens
ed u
nder
a C
reat
ive
Com
mon
s A
ttrib
utio
n 3.
0 U
npor
ted
Lic
ence
.View Article Online

solution of eqn (4) instead leads to a solution that containsrelatively few nonzero pixel values, corresponding to a sparseassembly of spheres. This concept is mathematically explainedin the ESI† and the implementation is presented in the Experi-mental section. In the remainder, we will refer to thisapproach as Sparse Sphere Reconstruction (SSR).
Quantitative electron tomography of nanoparticle assemblies
To demonstrate the power of SSR, two examples are presented.In the first example, close-packed assemblies of cobalt ironoxide nanoparticles with a diameter of about 9 nm are pre-sented. The spherical assemblies have a diameter up to300 nm and can contain more than 9000 particles. Typically,3D characterization of such an assembly is highly challenging.
The second example shows how SSR can be used for anaccurate reconstruction of assemblies even with a minimumnumber of projections, enabling the investigation of beam sen-sitive assemblies.
In the first study, the investigated assemblies (Fig. 2) havean increasing diameter and number of particles. The assem-
blies diameters are approximately 50 nm, 100 nm, 150 nm and300 nm and contain 70, 574, 1305 and 9301 particles respec-tively. The reconstructions obtained through the proposedapproach (SSR) are presented in Fig. 2. For comparison, theSIRT equivalent (same magnification, same point of view) ofthe figure is presented in the ESI (Fig. S1†).
Fig. 3a presents the SIRT reconstruction of the largerassembly of Co–Fe–O particles and provides a reasonablequalitative description of the shape and size of the assembly,however any quantitative analysis is hampered by the (missingwedge) artifacts and the poor resolution. Indeed, the infor-mation along the direction most affected by the missing wedge(red rectangle Fig. 3c) is insufficient to enable a manual seg-mentation. Fig. 3d presents an orthoslice through the SSRreconstruction at the same position as in Fig. 3c. It is clearthat information, lost because of the missing wedge, is re-covered by using the SSR reconstruction. This can be betterobserved for the smaller assemblies, for which projectionswere acquired over smaller tilt ranges (relative to the largerassembly – details in the Experimental section) causing moresevere missing wedge artifacts.
Another major advantage of our approach is that thenumber of particles and the coordinates are a direct output ofthe reconstruction without the need for segmentation. Fromour reconstruction, it can be deduced that the outer mor-
Fig. 2 SSR reconstructions of Fe–Co–O nanoparticles assemblies withdifferent size: (a) 50 nm diameter containing 70 particles. (b) 100 nmdiameter containing 574 particles. (c) 150 nm diameter containing 1305particles. The icosahedral symmetry of the particle is clear from thisview. (d) 300 nm diameter containing 9301 particles.
Fig. 3 (a) 3D visualization of the SIRT reconstruction of an assembly ofabout 9000 Co–Fe–O particles. (c) Orthoslice acquired through theSIRT reconstruction, missing wedge artifacts are highlighted by the redrectangle. (b, d) 3D visualization and orthoslice of the correspondingSSR reconstruction.
Paper Nanoscale
294 | Nanoscale, 2016, 8, 292–299 This journal is © The Royal Society of Chemistry 2016
Ope
n A
cces
s A
rtic
le. P
ublis
hed
on 1
9 N
ovem
ber
2015
. Dow
nloa
ded
on 0
8/11
/201
6 16
:06:
19.
Thi
s ar
ticle
is li
cens
ed u
nder
a C
reat
ive
Com
mon
s A
ttrib
utio
n 3.
0 U
npor
ted
Lic
ence
.View Article Online

phology of the assembly corresponds to a rhombicosidodeca-hedron (Fig. 4a). To investigate the crystallographic nature ofthe stacking of the nanoparticles, local bond order parameterswere calculated46,47 and clustered through a k-means algor-ithm.48 A careful analysis reveals that the assembly core corre-sponds to an icosahedron consisting of 20 tetrahedra (Fig. 4b).The particles in the tetrahedra are arranged according to alocal fcc stacking and form a Mackay icosahedron.49 The tetra-hedra are separated from each other and are arranged withfive-fold symmetry (Fig. 4b and d). Twinning planes are alsofound between the tetrahedra and the outer shell of the assem-bly which yields an hcp stacking. Fig. 4f presents an orthoslicethrough the reconstruction showing areas with hcp stacking,whereas Fig. 4c shows an orthoslice through areas with fccstacked particles. The outer shell is mostly composed by par-ticles in an fcc arrangement (Fig. 4e) forming a surface withanti-Mackay icosahedral termination. Interestingly, Fig. 4dshows all the particles arranged in an icosahedral packing. Itcan be seen that they extend along the tetrahedral edges high-lighting the icosahedral core structure. The five-fold icosa-hedral symmetry has been shown to be the most favorablegeometry in short-range ordered clusters composed of par-ticles with attractive interactions and is found in manysystems.50,51 It is a relatively new finding that icosahedralordering is the equilibrium structure also for hard particles,
for which entropy is the only deciding contribution to the freeenergy, that are made to self-assemble in a spherical confine-ment.37 Assemblies up to 700 particles are expected to carry anicosahedral structure, which changes to a rhombicosidodeca-hedral symmetry between 700 and 70 000 particles and finallypure bulk fcc for more than 70 000 particles.37 Here, with 9300particles, the structure observed is a rhombicosidodecahedronpresenting an inner distorted Mackay icosahedron, in perfectagreement with de Nijs et al.37 The distortion of the icosa-hedron is caused by defects in some of the tetrahedra. Thiscan be observed in Fig. 4c where, an orthoslice through the struc-ture shows two of the tetrahedra (red triangle) affected bydefects that alter the perfect tetrahedral shape, causinggeneral inhomogeneity in the size of all the other tetrahedra(this can be better observed in the online interactive visualiza-tion available at http://ematweb.uantwerpen.be/colouratoms/jsc3D/demos/FeCoO_Assembly_300nm.html).
The second example is a less complex structure consistingof an assembly of gold particles embedded in a polystyrenematrix. We will demonstrate the power of using SSR whenreconstructing beam sensitive assemblies. Long acquisitiontimes form a main drawback of tomography, limiting the tech-nique to beam resistant samples. Reducing the angularsampling frequency reduces the electron dose, but alsodeteriorates the quality of the final reconstruction. Fig. 5a
Fig. 4 (a) 3D visualization of the rhombicosidodecahedral outer structure. (b) Icosahedral core consisting of 20 tetrahedra with particles in an fccstacking (different colors are used to highlight separated tetrahedra and improve the visualization of the 3D structure). (c) Orthoslice through thereconstruction showing only the particles in an fcc stacking. The red triangle highlights a defect in two tetrahedra, which causes a deformation ofthe Mackay icosahedral core. (d) Particles with icosahedral packing, the tetrahedra visualized by the blue particles are arranged in five-fold symmetry.(e) fcc stacked particles composing part of the outer shell (different colors are used to highlight separated fcc clusters on the surface and improvethe visualization of the 3D structure). (f ) Orthoslice through a 3D visualization of the particles forming the twin planes (hcp stacking).
Nanoscale Paper
This journal is © The Royal Society of Chemistry 2016 Nanoscale, 2016, 8, 292–299 | 295
Ope
n A
cces
s A
rtic
le. P
ublis
hed
on 1
9 N
ovem
ber
2015
. Dow
nloa
ded
on 0
8/11
/201
6 16
:06:
19.
Thi
s ar
ticle
is li
cens
ed u
nder
a C
reat
ive
Com
mon
s A
ttrib
utio
n 3.
0 U
npor
ted
Lic
ence
.View Article Online

shows a 3D visualization of a SIRT reconstruction of an assem-bly of gold quasi-spherical particles embedded in a polystyrenematrix.41 The reconstruction is based on a series of 75 projec-tions (−70° to +78°, 2° tilt increment). Segmentation withdifferent colors is performed to enable a better visualization.Fig. 5b and c show the SIRT and SSR reconstructions based onthe same series, but using only 8 projections (−70° to +70°,20° tilt increment). Although the details about the shape ofevery individual particle are lost, valuable information con-cerning the structure (such as inter-particle distances andlocal symmetries or 3D stacking) is retrieved. The fact that wecan reduce the number of projection images by a factor of tenopens up the route to obtain 3D quantitative information forbeam sensitive systems.
The approach presented here, is currently limited toassemblies of monodispersed spherical particles. A logicalnext step is to apply the method to assemblies in which twoor more different particle diameters are considered. This canbe done by expanding the matrix C to contain spheres ofvarious diameters. We are currently working to implementthis possibility.
Furthermore, assemblies consisting of anisotropic particleshave recently obtained increasing attention as well.31,32
However, in the case of particles with more complex shapes(rods, cubes, etc.) a different approach has to be adopted. Weenvisage that a quantitative 3D characterization of such assem-blies will become possible by combining the presentedmethod with the possibility of using a pre-defined “dictionary”of particle features (e.g. edges, corners, etc.). Obviously, as thedictionary grows in size, more projections will be needed. Thepotential of such a methodology for electron tomography wasrecently demonstrated albeit for simulated images.52
ExperimentalImplementation of the SSR algorithm
The use of GPUs has become a widespread approach to tackleheavy computational problems.53 The recent release of theASTRA toolbox,54–56 an open source, GPU-accelerated libraryfor 3D image reconstruction in tomography, enables the devel-opment of custom algorithms and methods in Matlab. Wedeveloped the new approach described here, following themethod proposed by Bleichrodt et al.57 by combining theASTRA and the SPOT toolboxes58 to generate the problem inmatrix notation (in Matlab) and then use a general sparsesolver SPGL159 for the SSR problem. Technical details of theimplementation are presented in the following paragraph.
Sparse sphere reconstruction (SSR)
Nanoassemblies of spherical particles do not have a sparserepresentation on a voxel grid, which is used in the linearmodel in eqn (1). However, we can still employ sparsity pro-moting linear solvers by using a sparse image representation.If we assume that all particles are perfect spheres (no inhomo-geneity on the boundaries) and if the size of the particles canbe estimated, we can use discretized spheres as basis elementsand encode an image of spheres by the center coordinates ofthese spheres. This is done by applying the image transform-ation of eqn (2). (More technical details can be found in theESI.†)
Note that the matrix C could be seen as a convolution oper-ator, but forming the matrix explicitly is not practical due toits size. We can use image convolution of the sphere centers ywith a discretized sphere of size 2r × 2r × 2r by using one ofMatlab’s convolution routines such as imfilter (or implement-
Fig. 5 (a, d) 3D visualization of a SIRT reconstruction of an assembly of Au spheres (75 projections) and an orthoslice acquired through the recon-struction. (b, e) 3D visualization and orthoslice through the SIRT reconstruction of the same assembly where only 8 projections were used. (c, f ) 3Dvisualization and orthoslice through the SSR reconstruction of the same assembly where only 8 projections were used.
Paper Nanoscale
296 | Nanoscale, 2016, 8, 292–299 This journal is © The Royal Society of Chemistry 2016
Ope
n A
cces
s A
rtic
le. P
ublis
hed
on 1
9 N
ovem
ber
2015
. Dow
nloa
ded
on 0
8/11
/201
6 16
:06:
19.
Thi
s ar
ticle
is li
cens
ed u
nder
a C
reat
ive
Com
mon
s A
ttrib
utio
n 3.
0 U
npor
ted
Lic
ence
.View Article Online
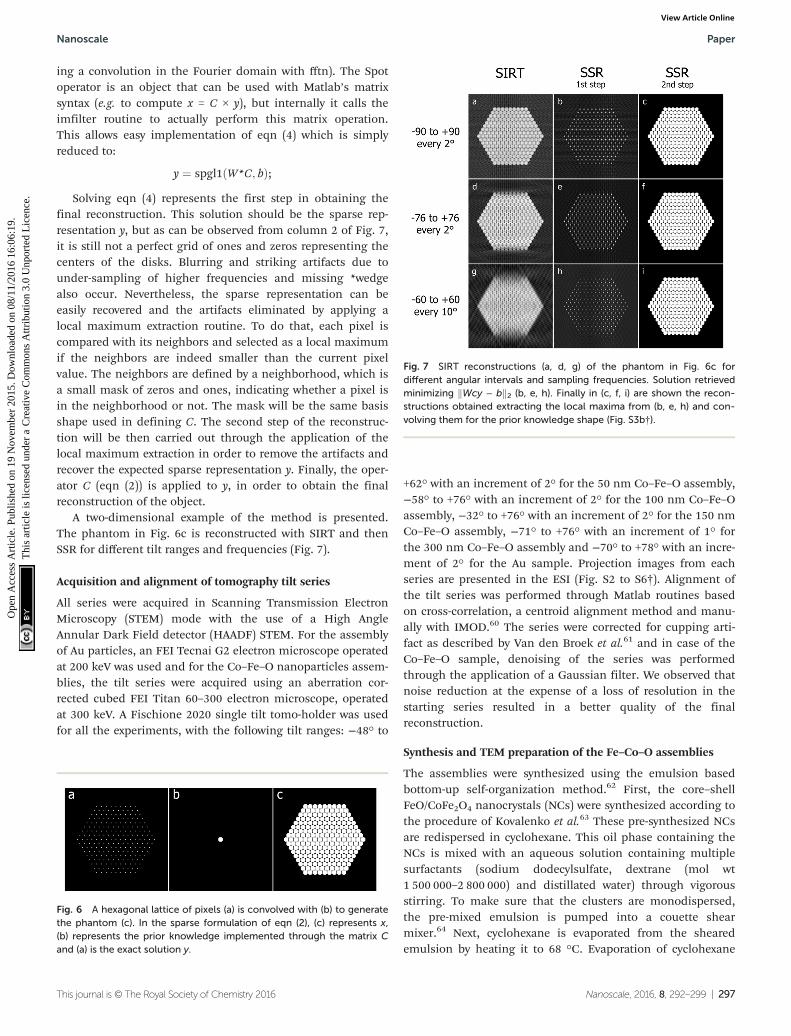
ing a convolution in the Fourier domain with fftn). The Spotoperator is an object that can be used with Matlab’s matrixsyntax (e.g. to compute x = C × y), but internally it calls theimfilter routine to actually perform this matrix operation.This allows easy implementation of eqn (4) which is simplyreduced to:
y ¼ spgl1ðW*C; bÞ;Solving eqn (4) represents the first step in obtaining the
final reconstruction. This solution should be the sparse rep-resentation y, but as can be observed from column 2 of Fig. 7,it is still not a perfect grid of ones and zeros representing thecenters of the disks. Blurring and striking artifacts due tounder-sampling of higher frequencies and missing *wedgealso occur. Nevertheless, the sparse representation can beeasily recovered and the artifacts eliminated by applying alocal maximum extraction routine. To do that, each pixel iscompared with its neighbors and selected as a local maximumif the neighbors are indeed smaller than the current pixelvalue. The neighbors are defined by a neighborhood, which isa small mask of zeros and ones, indicating whether a pixel isin the neighborhood or not. The mask will be the same basisshape used in defining C. The second step of the reconstruc-tion will be then carried out through the application of thelocal maximum extraction in order to remove the artifacts andrecover the expected sparse representation y. Finally, the oper-ator C (eqn (2)) is applied to y, in order to obtain the finalreconstruction of the object.
A two-dimensional example of the method is presented.The phantom in Fig. 6c is reconstructed with SIRT and thenSSR for different tilt ranges and frequencies (Fig. 7).
Acquisition and alignment of tomography tilt series
All series were acquired in Scanning Transmission ElectronMicroscopy (STEM) mode with the use of a High AngleAnnular Dark Field detector (HAADF) STEM. For the assemblyof Au particles, an FEI Tecnai G2 electron microscope operatedat 200 keV was used and for the Co–Fe–O nanoparticles assem-blies, the tilt series were acquired using an aberration cor-rected cubed FEI Titan 60–300 electron microscope, operatedat 300 keV. A Fischione 2020 single tilt tomo-holder was usedfor all the experiments, with the following tilt ranges: −48° to
+62° with an increment of 2° for the 50 nm Co–Fe–O assembly,−58° to +76° with an increment of 2° for the 100 nm Co–Fe–Oassembly, −32° to +76° with an increment of 2° for the 150 nmCo–Fe–O assembly, −71° to +76° with an increment of 1° forthe 300 nm Co–Fe–O assembly and −70° to +78° with an incre-ment of 2° for the Au sample. Projection images from eachseries are presented in the ESI (Fig. S2 to S6†). Alignment ofthe tilt series was performed through Matlab routines basedon cross-correlation, a centroid alignment method and manu-ally with IMOD.60 The series were corrected for cupping arti-fact as described by Van den Broek et al.61 and in case of theCo–Fe–O sample, denoising of the series was performedthrough the application of a Gaussian filter. We observed thatnoise reduction at the expense of a loss of resolution in thestarting series resulted in a better quality of the finalreconstruction.
Synthesis and TEM preparation of the Fe–Co–O assemblies
The assemblies were synthesized using the emulsion basedbottom-up self-organization method.62 First, the core–shellFeO/CoFe2O4 nanocrystals (NCs) were synthesized according tothe procedure of Kovalenko et al.63 These pre-synthesized NCsare redispersed in cyclohexane. This oil phase containing theNCs is mixed with an aqueous solution containing multiplesurfactants (sodium dodecylsulfate, dextrane (mol wt1 500 000–2 800 000) and distillated water) through vigorousstirring. To make sure that the clusters are monodispersed,the pre-mixed emulsion is pumped into a couette shearmixer.64 Next, cyclohexane is evaporated from the shearedemulsion by heating it to 68 °C. Evaporation of cyclohexane
Fig. 6 A hexagonal lattice of pixels (a) is convolved with (b) to generatethe phantom (c). In the sparse formulation of eqn (2), (c) represents x,(b) represents the prior knowledge implemented through the matrix Cand (a) is the exact solution y.
Fig. 7 SIRT reconstructions (a, d, g) of the phantom in Fig. 6c fordifferent angular intervals and sampling frequencies. Solution retrievedminimizing kWcy − bk2 (b, e, h). Finally in (c, f, i) are shown the recon-structions obtained extracting the local maxima from (b, e, h) and con-volving them for the prior knowledge shape (Fig. S3b†).
Nanoscale Paper
This journal is © The Royal Society of Chemistry 2016 Nanoscale, 2016, 8, 292–299 | 297
Ope
n A
cces
s A
rtic
le. P
ublis
hed
on 1
9 N
ovem
ber
2015
. Dow
nloa
ded
on 0
8/11
/201
6 16
:06:
19.
Thi
s ar
ticle
is li
cens
ed u
nder
a C
reat
ive
Com
mon
s A
ttrib
utio
n 3.
0 U
npor
ted
Lic
ence
.View Article Online

from the oil micro-emulsion droplets cause them to shrink,and the rising of NCs concentration promotes their self-assem-bly into 3D colloidal spheres.
In order to study the assemblies in the electron microscope,TEM grids need to be prepared. However, depositing a solutiondrop onto the grid and letting it dry at room temperaturewould cause the assemblies to deform because of the capillaryforces between the assemblies and the carbon coated grid.Therefore, the solution is deposited on the TEM grid, immedi-ately vitrified at liquid nitrogen temperature and then subli-mated in an Environmental Scanning Electron Microscope(ESEM) at a controlled temperature and pressure. This avoidscontact between the colloidal particles composed of the NCsand a drying liquid that is on the outside of the supraparticles,preventing the deformation of the assemblies.
Synthesis and TEM preparation of the Au assemblies
Colloidal gold superspheres were prepared using a recentlyreported procedure.32 Briefly, gold nanoparticle buildingblocks (20 nm diameter) were stabilized with a hydrophobicpolymer (thiolated polystyrene, molecular weight = 53 000 g mol−1).The length of the polymer chain was determined by dynamiclight scattering to be 39 nm. The polystyrene-stabilizedparticles spontaneously self-assembled upon slow addition ofwater to a dispersion in tetrahydrofuran, and the formedassemblies were subsequently stabilized within polymericmicelles of a di-block copolymer (polystyrene-block-poly acrylicacid). The final size of the assemblies in solution was160 ± 4 nm.41 TEM samples were prepared by drop casting theaqueous solution of the assemblies on holey, carbon-coatedcopper grids.
Conclusions
We present a new approach for the 3D reconstruction ofassemblies of spherical nanoparticles, based on a sparse refor-mulation of the tomographic problem derived from priorknowledge of the homogenous nature of the objects compos-ing the structure. It is clear that SSR is able to deliver an accu-rate reconstruction of complex nanoparticle assembliesconsisting of up to several thousands of particles. For electronbeam sensitive materials, where no extended *tilt series canbe obtained, the SSR method still allows one to reconstruct the3D assembly with a limited number of projections. Thismethodology opens up the route to a better understanding ofthe formation of these assemblies as the outcome of theseexperiments can be used as accurate input models forsimulation studies.
Acknowledgements
The authors acknowledge financial support from EuropeanResearch Council (ERC Starting Grant # 335078-COLOURA-TOMS, ERC Advanced Grant # 291667 HierarSACol and ERC
Advanced Grant 267867 – PLASMAQUO), the European Unionunder the FP7 (Integrated Infrastructure Initiative N. 262348European Soft Matter Infrastructure, ESMI and N. 312483ESTEEM2), and from the Netherlands Organisation for Scienti-fic Research (NWO), project number 639.072.005 and NWOCW 700.57.026. Networking support was provided by COSTAction MP1207.
References
1 N. A. Kotov and P. S. Weiss, ACS Nano, 2014, 8, 3101–3103.2 D. Vanmaekelbergh, L. K. Van Vugt, H. E. Bakker,
F. T. Rabouw, B. de Nijs, R. J. van Dijk-Moes, M. A. vanHuis, P. Baesjou and A. van Blaaderen, ACS Nano, 2015,3942–3950.
3 Y. Gao and Z. Tang, Small, 2011, 7, 2133–2146.4 Y. Xia and Z. Tang, Chem. Commun., 2012, 48, 6320–6336.5 M. Grzelczak, J. Vermant, E. M. Furst and L. M. Liz-
Marzán, ACS Nano, 2010, 4, 3591–3605.6 G. Van Tendeloo, S. Bals, S. Van Aert, J. Verbeeck and
D. Van Dyck, Adv. Mater., 2012, 24, 5655–5675.7 D. S. Su, B. Zhang and R. Schlögl, Chem. Rev., 2015, 115,
2818–2882.8 K. Sohlberg, T. J. Pennycook, W. Zhou and S. J. Pennycook,
Phys. Chem. Chem. Phys., 2015, 17, 3982–4006.9 W. Zhang and W. T. Zheng, Phys. Chem. Chem. Phys., 2015,
17, 14461–14469.10 H. Zheng, Y. S. Meng and Y. Zhu,MRS Bull., 2015, 40, 12–18.11 P. Midgley and M. Weyland, Ultramicroscopy, 2003, 96, 413–
431.12 P. A. Midgley and R. E. Dunin-Borkowski, Nat. Mater., 2009,
8, 271–280.13 S. Bals, B. Goris, L. M. Liz-Marzán and G. Van Tendeloo,
Angew. Chem., Int. Ed., 2014, 53, 10600–10610.14 H. Friedrich, P. E. de Jongh, A. J. Verkleij and K. P. de Jong,
Chem. Rev., 2009, 109, 1613–1629.15 G. Möbus, R. C. Doole and B. J. Inkson, Ultramicroscopy,
2003, 96, 433–451.16 A. Genç, H. Cheng, J. Winterstein, L. Pullan and B. Freitag,
Microsc. Anal., 2012, 116, 23–25.17 A. Genc, L. Kovarik, M. Gu, H. Cheng, P. Plachinda,
L. Pullan, B. Freitag and C. Wang, Ultramicroscopy, 2013,131, 24–32.
18 B. Goris, L. Polavarapu, S. Bals, G. Van Tendeloo andL. M. Liz-Marzán, Nano Lett., 2014, 14, 3220–3226.
19 B. Goris, S. Turner, S. Bals and G. Van Tendeloo, ACS Nano,2014, 8, 10878–10884.
20 O. Nicoletti, F. de La Peña, R. K. Leary, D. J. Holland,C. Ducati and P. A. Midgley, Nature, 2013, 502, 80–84.
21 B. Goris, T. Roelandts, K. Batenburg, H. H. Mezerji andS. Bals, Ultramicroscopy, 2013, 127, 40–47.
22 T. Roelandts, K. Batenburg, E. Biermans, C. Kübel, S. Balsand J. Sijbers, Ultramicroscopy, 2012, 114, 96–105.
23 B. Goris, W. Van den Broek, K. J. Batenburg, H. H. Mezerjiand S. Bals, Ultramicroscopy, 2012, 113, 120–130.
Paper Nanoscale
298 | Nanoscale, 2016, 8, 292–299 This journal is © The Royal Society of Chemistry 2016
Ope
n A
cces
s A
rtic
le. P
ublis
hed
on 1
9 N
ovem
ber
2015
. Dow
nloa
ded
on 0
8/11
/201
6 16
:06:
19.
Thi
s ar
ticle
is li
cens
ed u
nder
a C
reat
ive
Com
mon
s A
ttrib
utio
n 3.
0 U
npor
ted
Lic
ence
.View Article Online

24 Z. Saghi, D. J. Holland, R. Leary, A. Falqui, G. Bertoni,A. J. Sederman, L. F. Gladden and P. A. Midgley, Nano Lett.,2011, 11, 4666–4673.
25 B. Goris, S. Bals, W. Van den Broek, E. Carbó-Argibay,S. Gómez-Graña, L. M. Liz-Marzán and G. Van Tendeloo,Nat. Mater., 2012, 11, 930–935.
26 M. Scott, C.-C. Chen, M. Mecklenburg, C. Zhu, R. Xu,P. Ercius, U. Dahmen, B. Regan and J. Miao, Nature, 2012,483, 444–447.
27 S. Van Aert, K. J. Batenburg, M. D. Rossell, R. Erni andG. Van Tendeloo, Nature, 2011, 470, 374–377.
28 I. Florea, A. Demortiere, C. Petit, H. Bulou, C. Hirlimannand O. Ersen, ACS Nano, 2012, 6, 2574–2581.
29 T. Altantzis, B. Goris, A. Sánchez-Iglesias, M. Grzelczak,L. M. Liz-Marzán and S. Bals, Part. Part. Syst. Charact.,2013, 30, 84–88.
30 H. Friedrich, C. J. Gommes, K. Overgaag, J. D. Meeldijk,W. H. Evers, B. d. Nijs, M. P. Boneschanscher, P. E. deJongh, A. J. Verkleij, K. P. de Jong, A. van Blaaderen andD. Vanmaekelbergh, Nano Lett., 2009, 9, 2719–2724.
31 T. Besseling, M. Hermes, A. Kuijk, B. de Nijs, T. Deng,M. Dijkstra, A. Imhof and A. van Blaaderen, J. Phys.:Condens. Matter, 2015, 27, 194109.
32 M. Grzelczak, A. Sánchez-Iglesias, H. H. Mezerji, S. Bals,J. Pérez-Juste and L. M. Liz-Marzán, Nano Lett., 2012, 12,4380–4384.
33 H. P. Klug and L. E. Alexander, in X-ray diffractionprocedures, 1954.
34 O. Kratky, in Small angle X-ray scattering, 1982.35 J. E. Galván-Moya, T. Altantzis, K. Nelissen, F. M. Peeters,
M. Grzelczak, L. M. Liz-Marzán, S. Bals and G. VanTendeloo, ACS Nano, 2014, 8, 3869–3875.
36 W. H. Evers, H. Friedrich, L. Filion, M. Dijkstra andD. Vanmaekelbergh, Angew. Chem., Int. Ed., 2009, 48, 9655–9657.
37 B. de Nijs, S. Dussi, F. Smallenburg, J. D. Meeldijk,D. J. Groenendijk, L. Filion, A. Imhof, A. van Blaaderen andM. Dijkstra, Nat. Mater., 2015, 14, 56–60.
38 G. T. Herman, Fundamentals of computerized tomography:image reconstruction from projections, Springer Science &Business Media, 2009.
39 P. Gilbert, J. Theor. Biol., 1972, 36, 105–117.40 J. Frank, Electron tomography: methods for three-dimensional
visualization of structures in the cell, Springer Science &Business Media, 2008.
41 A. Sánchez-Iglesias, M. Grzelczak, T. Altantzis, B. Goris,J. Perez-Juste, S. Bals, G. Van Tendeloo, S. H. Donaldson Jr.,B. F. Chmelka and J. N. Israelachvili, ACS Nano, 2012, 6,11059–11065.
42 H. Heidari, W. Van den Broek and S. Bals, Ultramicroscopy,2013, 135, 1–5.
43 K. J. Batenburg and J. Sijbers, Image Processing, IEEETransactions on, 2011, 20, 2542–2553.
44 I. Loris, G. Nolet, I. Daubechies and F. Dahlen,Geophys. J. Int., 2007, 170, 359–370.
45 R. Leary, Z. Saghi, P. A. Midgley and D. J. Holland, Ultra-microscopy, 2013, 131, 70–91.
46 P. J. Steinhardt, D. R. Nelson and M. Ronchetti, Phys. Rev.B: Condens. Matter Mater. Phys., 1983, 28, 784.
47 Y. Wang, S. Teitel and C. Dellago, J. Chem. Phys., 2005, 122,214722.
48 D. Arthur and S. Vassilvitskii, Proceedings of theeighteenth annual ACM-SIAM symposium on Discretealgorithms, 2007, 1027–1035.
49 A. L. Mackay, Acta Crystallogr., 1962, 15, 916–918.50 J. H. Conway, N. J. A. Sloane, E. Bannai, J. Leech, S. Norton,
A. Odlyzko, R. Parker, L. Queen and B. Venkov, Spherepackings, lattices and groups, Springer-Verlag, New York,1993.
51 D. R. Nelson and B. I. Halperin, Science, 1985, 229, 233–238.
52 B. Liu, H. Yu, S. S. Verbridge, L. Sun and G. Wang,Scanning, 2014, 36, 377–383.
53 C. Messaoudil, T. Boudier, C. O. Sorzano and S. Marco,BMC Bioinf., 2007, 8, 288.
54 W. J. Palenstijn, K. J. Batenburg and J. Sijbers, J. Struct.Biol., 2011, 176, 250–253.
55 W. J. Palenstijn, K. J. Batenburg and J. Sijbers, 2013.56 W. van Aarle, W. J. Palenstijn, J. De Beenhouwer,
T. Altantzis, S. Bals, K. J. Batenburg and J. Sijbers, Ultra-microscopy, 2015, 157, 35–47.
57 F. Bleichrodt, T. Van Leeuwen, W. J. Palenstijn, W. VanAarle, J. Sijbers and K. J. Batenburg, Numer. Algorithms,2015, 1–25.
58 E. van den Berg and M. Friedlander, Spot-a linear-operatortoolbox, http://www.cs.ubc.ca/labs/scl/spot, (accessed June,accessed: June, 2015).
59 E. Van Den Berg and M. P. Friedlander, SIAM J. Sci.Comput., 2008, 31, 890–912.
60 J. R. Kremer, D. N. Mastronarde and J. R. McIntosh,J. Struct. Biol., 1996, 116, 71–76.
61 W. Van den Broek, A. Rosenauer, B. Goris, G. Martinez,S. Bals, S. Van Aert and D. Van Dyck, Ultramicroscopy, 2012,116, 8–12.
62 F. Bai, D. Wang, Z. Huo, W. Chen, L. Liu, X. Liang,C. Chen, X. Wang, Q. Peng and Y. Li, Angew. Chem., Int. Ed.,2007, 46, 6650–6653.
63 M. V. Kovalenko, M. I. Bodnarchuk, R. T. Lechner,G. Hesser, F. Schäffler and W. Heiss, J. Am. Chem. Soc.,2007, 129, 6352–6353.
64 T. Mason and J. Bibette, Langmuir, 1997, 13, 4600–4613.
Nanoscale Paper
This journal is © The Royal Society of Chemistry 2016 Nanoscale, 2016, 8, 292–299 | 299
Ope
n A
cces
s A
rtic
le. P
ublis
hed
on 1
9 N
ovem
ber
2015
. Dow
nloa
ded
on 0
8/11
/201
6 16
:06:
19.
Thi
s ar
ticle
is li
cens
ed u
nder
a C
reat
ive
Com
mon
s A
ttrib
utio
n 3.
0 U
npor
ted
Lic
ence
.View Article Online