report to the congress: impact of the fair sentencing … · section one section one of this report...
TRANSCRIPT

Report to the Congress: Impact of the Fair Sentencing Act of 2010

United States Sentencing Commission
Patti B. Saris Chair
Charles R. Breyer Vice Chair
Dabney L. Friedrich Commissioner
Rachel E. Barkow Commissioner
William H. Pryor, Jr. Commissioner
Jonathan J. Wroblewski Ex Officio
J. Patricia Wilson Smoot Ex Officio
August 2015

SECTION ONE………………………………………………….……1 Executive Summary……………………………………………………3
Historical Background…………….…………………………………4
SECTION TWO……………………….…………………...….…..…9 Cocaine Sentencing Disparity Reduction……………...……10
What has been the impact of the FSA on federalprosecutorial practices? …………….……………….…………11
Are crack cocaine sentences more similar to powdercocaine sentences? …………….……………….…………...……23
What has been the impact of the FSA on the federalprison population? …………….……………….…………...……26
Has there been an increase in use of crack cocaine afterthe FSA? …………….………………………….….…………...……27
SECTION THREE……………………………………...….…....…29 Elimination of Mandatory Minimum Sentence for Simple Possession ……...………….……………….…………...……30
SECTION FOUR…………………….…………………...….………31 Increased Fine Penalties for Major Drug Traffickers…32
SECTION FIVE……………………….…………………...….…..….33 Enhancements for Acts of Violence during the Course of a Drug Trafficking Offense …………….…………………...……34
Increased Emphasis on Defendant’s Role & Certain Aggravating Factors …………….…………………...………….…34
Increased Emphasis on Defendant’s Role & Certain Mitigating Factors …………….…………………...................……35
CONCLUSION …………….…………………..………………...……37
Endnotes …………………….…………………..………………...……39
Appendix ...………………….…………………..………………...……43
i
Table of Contents


Section One
Section One of this report highlights the Commission’s primary findings on the impact of the Fair Sentencing Act of 2010. This section also provides a historical overview of federal cocaine sentencing policy since 1985.
1Report to the Congress: Fair Sentencing Act of 2010

2 Report to the Congress: Fair Sentencing Act of 2010
The United States Sentencing Commission (“the Commission”) submits this report to Congress in response to a congressional directive contained in section 10 of the Fair Sentencing Act of 2010, Pub. L. No. 111–220, 124 Stat. 2372 (“FSA”), and pursuant to the Commission’s general authority under 28 U.S.C. §§ 994-995.
For more than twenty years, the Commission has consistently worked with the legislative, executive, and judicial branches of government and other interested parties to ensure that cocaine sentencing policy promotes the goals of the Sentencing Reform Act,1 including avoiding unwarranted sentence disparities among defendants with similar criminal records who have been found guilty of similar criminal conduct and promoting proportionate sentencing. Prior to the FSA, the Commission submitted four reports to Congress regarding cocaine sentencing, in 1995, 1997, 2002, and 2007, based on legislative history, scientific and medical literature, extensive analysis of the Commission’s own data, public comment, and expert testimony.2
Since 1995, the Commission consistently took the position that the 100-to-1 drug quantity ratio of crack to powder cocaine significantly undermined the congressional objectives set forth in the Sentencing Reform Act. The Commission reached this conclusion based on its core findings regarding crack cocaine penalties as they existed before the FSA:
• they overstated the relativeharmfulness of crack cocaine comparedto powder cocaine;
• they swept too broadly and appliedmost often to lower level offenders;
• they overstated the seriousness of mostcrack cocaine offenses and failed toprovide adequate proportionality; and
• their severity mostly impactedminorities.3
As a result of these findings, the Commission recommended that Congress reduce crack cocaine penalties so that the crack-to-powder drug quantity ratio was no more than 20-to-1, and that Congress repeal the mandatory minimum penalty for simple possession of crack cocaine.4 In 2007, the Commission reduced the crack cocaine guideline by two levels as an interim measure to alleviate some of the problems its reports identified.5
Consistent with the Commission’s recommendations, the FSA reduced the statutory penalties for crack cocaine offenses to produce an 18-to-1 crack-to-powder drug quantity ratio and eliminated the mandatory minimum sentence for simple possession of crack cocaine.6 The FSA also increased statutory fines and directed the Commission to amend the U.S. Sentencing Guidelines to account for specified aggravating and mitigating circumstances in drug trafficking offenses involving any drug type, not only crack cocaine.7
The FSA also directed the Commission to “study and submit to Congress a report
regarding the impact of the changes in Federal sentencing law under this Act and the amendments made by this Act.”8 The report generally follows the structure of the FSA, first analyzing the FSA’s changes to crack cocaine penalties, then turning to its changes to penalties for federal drug trafficking offenses more broadly.
The Commission’s study finds that the FSA reduced the disparity between crack and powder cocaine sentences, reduced the federal prison population, and appears to have resulted in fewer federal prosecutions for crack cocaine. All this occurred while crack cocaine use continued to decline.
Primary Observations 1. Many fewer crack cocaine offenders
have been prosecuted annually sincethe FSA, although the number is stillsubstantial;
2. The crack cocaine offenders who havebeen prosecuted since the FSA are, onaverage, not more serious offendersthan those prosecuted before the FSA;
3. Rates of crack cocaine offenderscooperating with law enforcementhave not changed despite changes inpenalties; and,
4. On average, crack cocaine sentencesare closer to powder cocaine sentences.
3 Report to the Congress: Fair Sentencing Act of 2010
Executive Summary

Federal Cocaine Sentencing Policy 1985 through 2000
4 Report to the Congress: Fair Sentencing Act of 2010
Historical Background

Federal Cocaine Sentencing Policy 2000 through 2015
5 Report to the Congress: Fair Sentencing Act of 2010
Historical Background
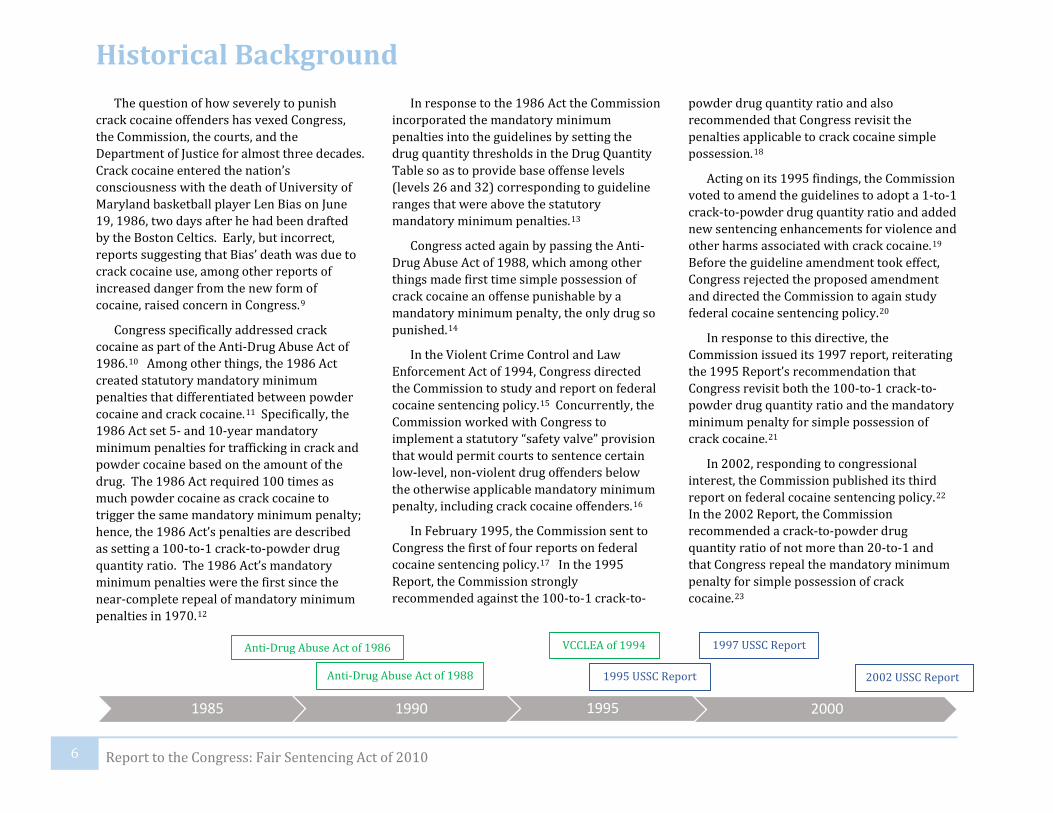
The question of how severely to punish crack cocaine offenders has vexed Congress, the Commission, the courts, and the Department of Justice for almost three decades. Crack cocaine entered the nation’s consciousness with the death of University of Maryland basketball player Len Bias on June 19, 1986, two days after he had been drafted by the Boston Celtics. Early, but incorrect, reports suggesting that Bias’ death was due to crack cocaine use, among other reports of increased danger from the new form of cocaine, raised concern in Congress.9
Congress specifically addressed crack cocaine as part of the Anti-Drug Abuse Act of 1986.10 Among other things, the 1986 Act created statutory mandatory minimum penalties that differentiated between powder cocaine and crack cocaine.11 Specifically, the 1986 Act set 5- and 10-year mandatory minimum penalties for trafficking in crack and powder cocaine based on the amount of the drug. The 1986 Act required 100 times as much powder cocaine as crack cocaine to trigger the same mandatory minimum penalty; hence, the 1986 Act’s penalties are described as setting a 100-to-1 crack-to-powder drug quantity ratio. The 1986 Act’s mandatory minimum penalties were the first since the near-complete repeal of mandatory minimum penalties in 1970.12
In response to the 1986 Act the Commission incorporated the mandatory minimum penalties into the guidelines by setting the drug quantity thresholds in the Drug Quantity Table so as to provide base offense levels (levels 26 and 32) corresponding to guideline ranges that were above the statutory mandatory minimum penalties.13
Congress acted again by passing the Anti-Drug Abuse Act of 1988, which among other things made first time simple possession of crack cocaine an offense punishable by a mandatory minimum penalty, the only drug so punished.14
In the Violent Crime Control and Law Enforcement Act of 1994, Congress directed the Commission to study and report on federal cocaine sentencing policy.15 Concurrently, the Commission worked with Congress to implement a statutory “safety valve” provision that would permit courts to sentence certain low-level, non-violent drug offenders below the otherwise applicable mandatory minimum penalty, including crack cocaine offenders.16
In February 1995, the Commission sent to Congress the first of four reports on federal cocaine sentencing policy.17 In the 1995 Report, the Commission strongly recommended against the 100-to-1 crack-to-
powder drug quantity ratio and also recommended that Congress revisit the penalties applicable to crack cocaine simple possession.18
Acting on its 1995 findings, the Commission voted to amend the guidelines to adopt a 1-to-1 crack-to-powder drug quantity ratio and added new sentencing enhancements for violence and other harms associated with crack cocaine.19 Before the guideline amendment took effect, Congress rejected the proposed amendment and directed the Commission to again study federal cocaine sentencing policy.20
In response to this directive, the Commission issued its 1997 report, reiterating the 1995 Report’s recommendation that Congress revisit both the 100-to-1 crack-to-powder drug quantity ratio and the mandatory minimum penalty for simple possession of crack cocaine.21
In 2002, responding to congressional interest, the Commission published its third report on federal cocaine sentencing policy.22 In the 2002 Report, the Commission recommended a crack-to-powder drug quantity ratio of not more than 20-to-1 and that Congress repeal the mandatory minimum penalty for simple possession of crack cocaine.23
1985 1990 1995 2000
Anti-Drug Abuse Act of 1986
Anti-Drug Abuse Act of 1988
VCCLEA of 1994
1995 USSC Report
1997 USSC Report
2002 USSC Report
6 Report to the Congress: Fair Sentencing Act of 2010
Historical Background

A 2005 Supreme Court decision rendering the guidelines advisory24 led to a series of cases addressing whether and to what degree the 100-to-1 crack-to-powder drug quantity ratio applied in a given case.25 Ultimately, the Supreme Court held that a sentencing judge may consider the disparity between the guidelines’ treatment of crack and powder cocaine when determining a sentencing range and that the sentencing judge has the authority to substitute a crack-to-powder drug quantity ratio different than 100-to-1 to avoid that disparity.26
In 2007, due to its ongoing concern about the 100-to-1 crack-to-powder drug quantity ratio, the Commission lowered the guideline for crack cocaine offenses.27 This reduction resulted in base offense levels for crack cocaine corresponding to guideline ranges that included, rather than exceeded, the statutory mandatory minimum penalties.28 Subsequently, the Commission made the reduction retroactive, allowing courts to reduce the sentences of incarcerated offenders whose sentences had been based on the higher guideline.29
Policies of the Department of Justice may also impact crack cocaine sentences. Since 2003, Department of Justice policy had directed prosecutors to charge the most
serious, readily provable offenses supported by the facts; the most serious offense was that which would result in the longest sentence.30 Subsequent guidance in 2010 shifted the focus of the charging decision to the prosecutor’s assessment of each individual case.31 This policy was further modified in 2013, when the Department of Justice specified criteria for the subset of drug cases in which prosecutors were to seek mandatory minimum sentences.32
On August 3, 2010, Congress enacted the FSA, which effectively reduced the 100-to-1 crack-to-powder drug quantity ratio to 18-to-1.33 The FSA also eliminated the mandatory minimum for simple possession of crack cocaine.34
Enactment of the FSA triggered responses from the Commission, the Department of Justice, and the Supreme Court. In 2011, the Commission implemented the FSA’s new penalties in the guidelines and subsequently made the changes retroactive.35 The Department of Justice issued guidance that the FSA’s new penalties applied to sentencings occurring on or after August 3, 2010, regardless of when the offense took place.36 Finally, the Supreme Court held that the FSA’s penalties applied to offenses committed prior to August 3, 2010, but sentenced after that date.37
In 2014, after the FSA was fully implemented, the Commission separately reduced the drug guidelines for all drugs, including crack cocaine, by two levels, and made this change retroactive.38 In order to accurately report the effect of the FSA, data that could be affected by this later Commission action is excluded. This exclusion is based on time; where data might be affected by the 2014 drug amendment, the report will include data only through fiscal year 2013.
Each year the Commission collects data regarding every felony and class A misdemeanor offense sentenced during that year and analyzes it to provide information to policy-makers and the federal criminal justice community. For this report the Commission primarily used data from these publicly-released data sets. This was augmented by data derived from a special coding project on the function cocaine offenders played in the offense. For specific information about methodology and further detail relating to any figure in this report, see the Appendix.
2005 2010
Booker v. United States
Kimbrough v. United States Spears v. United States
Crack -2 amendment Fair Sentencing Act
FSA guideline amendments
7 Report to the Congress: Fair Sentencing Act of 2010
Historical Background

8 Report to the Congress: Fair Sentencing Act of 2010
Section Two
Section Two of this report analyzes the impact of Section Two of the Fair Sentencing Act of 2010 related to Cocaine Sentencing Disparity Reduction.
9 Report to the Congress: Fair Sentencing Act of 2010

Section 2 of the FSA reduced the statutory mandatory minimum penalties for crack cocaine offenses involving manufacturing or trafficking in crack cocaine by increasing the quantity thresholds required to trigger a mandatory minimum term of imprisonment.39 The quantity threshold required to trigger the 5-year mandatory minimum term of imprisonment was increased from 5 grams to 28 grams, and the quantity threshold required to trigger the 10-year mandatory minimum term of imprisonment was increased from 50 grams to 280 grams.40
As directed by the FSA, the Commission conformed the drug guideline penalty structure for crack cocaine offenses to the amended statutory quantities.41 The base offense levels for crack cocaine were set in the Drug Quantity Table so that the statutory minimum penalties corresponded to levels 26 and 32.42 Accordingly, using the new drug quantities established by the FSA, offenses involving 28 grams or more of crack cocaine
were assigned a base offense level of 26, offenses involving 280 grams or more of crack cocaine were assigned a base offense level of 32, and other offense levels for other quantities were established by extrapolating upward and downward.43 Because of these amendments, the statutory changes in the FSA impacted the sentences of crack cocaine offenders sentenced after the FSA, regardless of whether a mandatory minimum applied. Therefore, even though the FSA itself only changed the two mandatory minimum penalties for crack cocaine trafficking offenses, studying the impact of the FSA requires studying all crack cocaine offenders.
Some possible impacts of the FSA’s reduction in crack cocaine penalties are beyond the scope of this report. For example, the FSA could have caused an increase in prosecutions of crack cocaine offenses by state and local governments. The Commission has not yet been able to find adequate information
to study this question due to the large number of state and local jurisdictions and their differing practices regarding data collection and reporting.
The Commission has observed in other populations of crack cocaine offenders that those released early as a result of retroactive guideline amendments did not show a statistically significant increase in the likelihood of recidivating.44 The Commission intends to separately study the group of crack cocaine offenders released early as a result of the FSA amendments to determine whether their recidivism rates follow the same pattern.
Public perceptions of fairness have also been and continue to be an important concern of Congress and the Commission. Although a study of perceptions of fairness is beyond the scope of this report, the Commission acknowledges the importance of the issue and encourages further study.
Pre-FSA Crack
Quantity
Post-FSA Crack
Quantity 21 U.S.C. § 841
5-yr min 5 g 28 g
10-yr min 50 g 280 g
21 U.S.C. § 960
5-yr min 5 g 28 g
10-yr min 50 g 280 g
Research Questions To study the impact of the FSA’s reduction in crack cocaine penalties, the Commission has asked the following questions:
What has been the impact of the FSA on federal prosecutorial practices?• On the number of cases prosecuted?• On the characteristics of the offenses prosecuted?• On the characteristics of the offenders prosecuted?
Are crack cocaine sentences more similar to powder cocaine sentences? What has been the impact of the FSA on the federal prison population? Has there been an increase in use of crack cocaine after the FSA?
10 Report to the Congress: Fair Sentencing Act of 2010
Cocaine Sentencing Disparity Reduction

Beginning just prior to the FSA and accelerating after it, there has been a steep reduction in the number of crack cocaine offenders sentenced in the federal system. Between 2010, the last year before the FSA took effect, and 2014, the number of crack cocaine offenders sentenced in the federal system decreased by half.
The number of crack cocaine offenders sentenced in the federal system increased dramatically during the 1990s, and saw
another increase between 2004 and 2008, but began to decrease after 2008, and decreased more steeply after the FSA.
As discussed in the Historical Background, a number of events which affected the sentences for crack cocaine offenders occurred in the years immediately preceding the FSA. For example, the Commission reduced the guidelines for crack cocaine offenders sentenced in 2008,45 and around this same time the Supreme Court held that sentencing judges could impose lower sentences based on their disagreement with the 100-to-1 crack-to-powder drug quantity ratio.46 The number of crack cocaine offenders sentenced began to fall
during this time period.
After the FSA, the number of crack cocaine offenders declined more steeply: 4,730 crack cocaine offenders were sentenced in 2010, and 2,366 crack cocaine offenders were sentenced in 2014. Despite the large decrease, crack cocaine was still the fourth-most commonly sentenced drug type in 2014, more common than heroin, but less common than methamphetamine, powder cocaine, and marijuana.47
What has been the impact of the FSA on federal prosecutorial
practices?
Figure 1A. Number of Powder Cocaine
and Crack Cocaine Trafficking Offenders,
Fiscal Years 1992-2014
SOURCE: U.S. Sentencing Commission, FSA Datafiles. For additional data and source information, see Appendix.
In 2014, approximately half as many crack cocaine
offenders were sentenced in the federal system as had been sentenced in 2010.
11 Report to the Congress: Fair Sentencing Act of 2010
Cocaine Sentencing Disparity Reduction
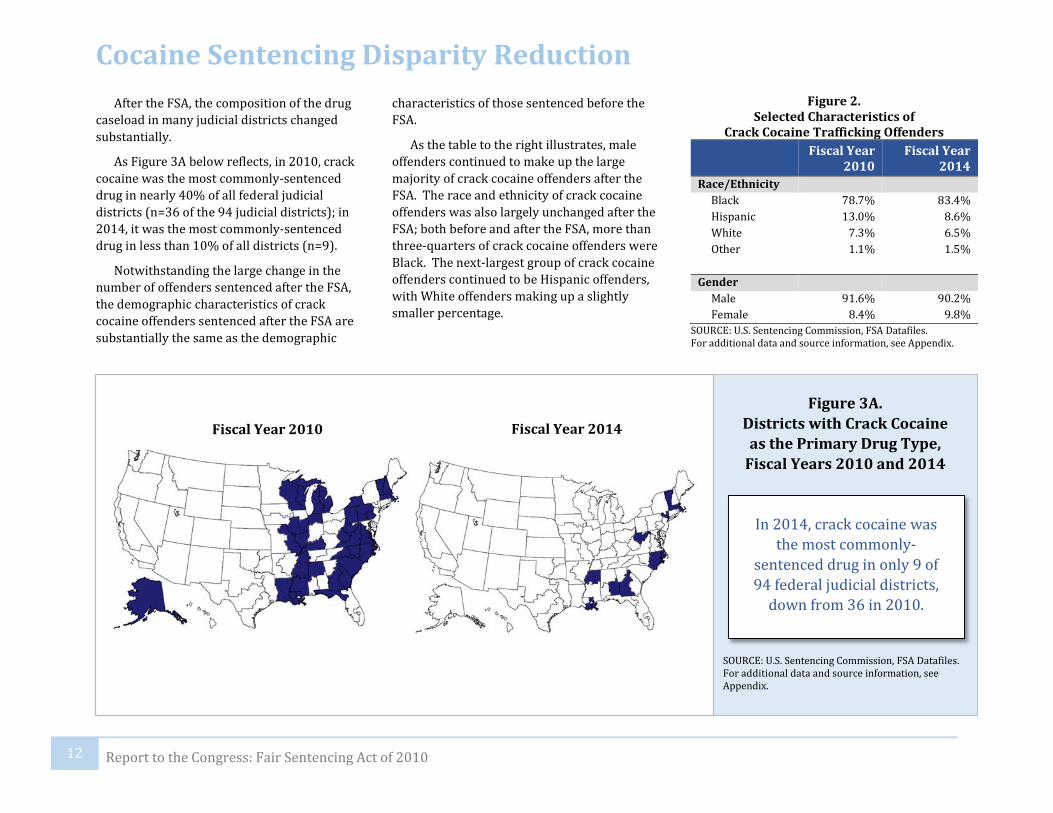
After the FSA, the composition of the drug caseload in many judicial districts changed substantially.
As Figure 3A below reflects, in 2010, crack cocaine was the most commonly-sentenced drug in nearly 40% of all federal judicial districts (n=36 of the 94 judicial districts); in 2014, it was the most commonly-sentenced drug in less than 10% of all districts (n=9).
Notwithstanding the large change in the number of offenders sentenced after the FSA, the demographic characteristics of crack cocaine offenders sentenced after the FSA are substantially the same as the demographic
characteristics of those sentenced before the FSA.
As the table to the right illustrates, male offenders continued to make up the large majority of crack cocaine offenders after the FSA. The race and ethnicity of crack cocaine offenders was also largely unchanged after the FSA; both before and after the FSA, more than three-quarters of crack cocaine offenders were Black. The next-largest group of crack cocaine offenders continued to be Hispanic offenders, with White offenders making up a slightly smaller percentage.
Figure 3A. Districts with Crack Cocaine
as the Primary Drug Type, Fiscal Years 2010 and 2014
SOURCE: U.S. Sentencing Commission, FSA Datafiles. For additional data and source information, see Appendix.
In 2014, crack cocaine was the most commonly-
sentenced drug in only 9 of 94 federal judicial districts,
down from 36 in 2010.
Fiscal Year 2010 Fiscal Year 2014
Figure 2. Selected Characteristics of
Crack Cocaine Trafficking Offenders Fiscal Year
2010 Fiscal Year
2014 Race/Ethnicity
Black 78.7% 83.4% Hispanic 13.0% 8.6% White 7.3% 6.5% Other 1.1% 1.5%
Gender Male 91.6% 90.2% Female 8.4% 9.8%
SOURCE: U.S. Sentencing Commission, FSA Datafiles. For additional data and source information, see Appendix.
12 Report to the Congress: Fair Sentencing Act of 2010
Cocaine Sentencing Disparity Reduction
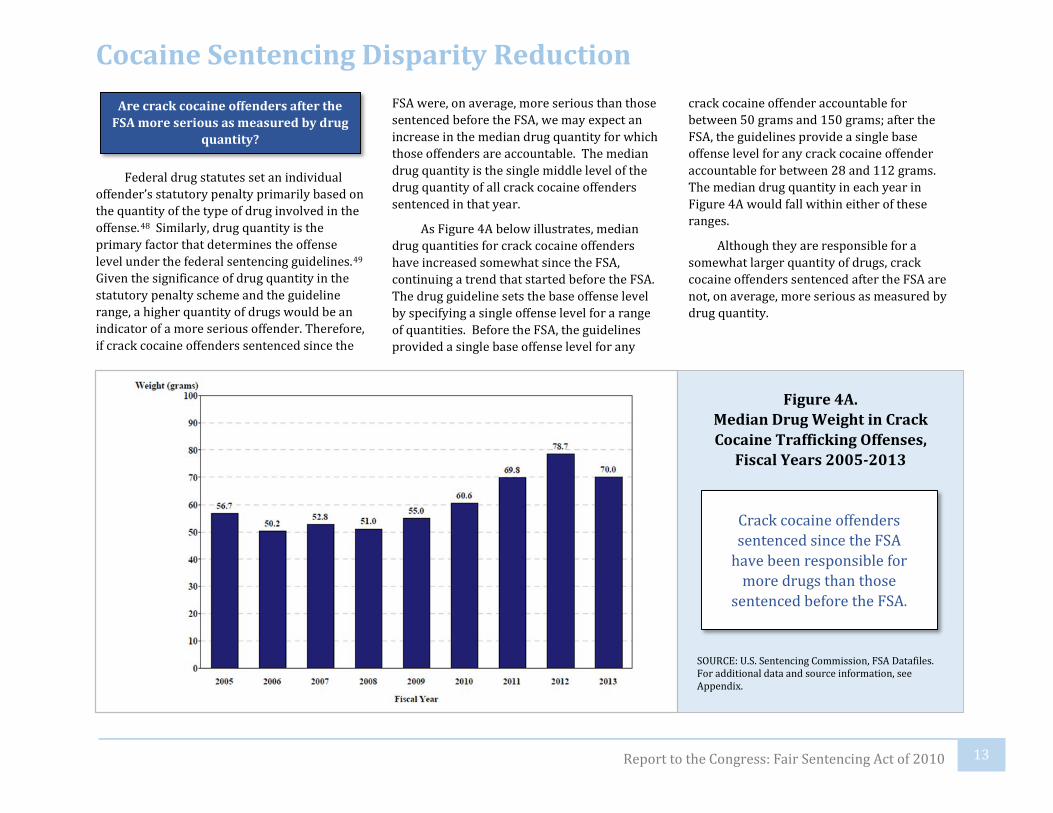
Federal drug statutes set an individual offender’s statutory penalty primarily based on the quantity of the type of drug involved in the offense.48 Similarly, drug quantity is the primary factor that determines the offense level under the federal sentencing guidelines.49 Given the significance of drug quantity in the statutory penalty scheme and the guideline range, a higher quantity of drugs would be an indicator of a more serious offender. Therefore, if crack cocaine offenders sentenced since the
FSA were, on average, more serious than those sentenced before the FSA, we may expect an increase in the median drug quantity for which those offenders are accountable. The median drug quantity is the single middle level of the drug quantity of all crack cocaine offenders sentenced in that year.
As Figure 4A below illustrates, median drug quantities for crack cocaine offenders have increased somewhat since the FSA, continuing a trend that started before the FSA. The drug guideline sets the base offense level by specifying a single offense level for a range of quantities. Before the FSA, the guidelines provided a single base offense level for any
crack cocaine offender accountable for between 50 grams and 150 grams; after the FSA, the guidelines provide a single base offense level for any crack cocaine offender accountable for between 28 and 112 grams. The median drug quantity in each year in Figure 4A would fall within either of these ranges.
Although they are responsible for a somewhat larger quantity of drugs, crack cocaine offenders sentenced after the FSA are not, on average, more serious as measured by drug quantity.
Are crack cocaine offenders after the FSA more serious as measured by drug
quantity?
Figure 4A. Median Drug Weight in Crack Cocaine Trafficking Offenses,
Fiscal Years 2005-2013
SOURCE: U.S. Sentencing Commission, FSA Datafiles. For additional data and source information, see Appendix.
Crack cocaine offenders sentenced since the FSA
have been responsible for more drugs than those
sentenced before the FSA.
13 Report to the Congress: Fair Sentencing Act of 2010
Cocaine Sentencing Disparity Reduction
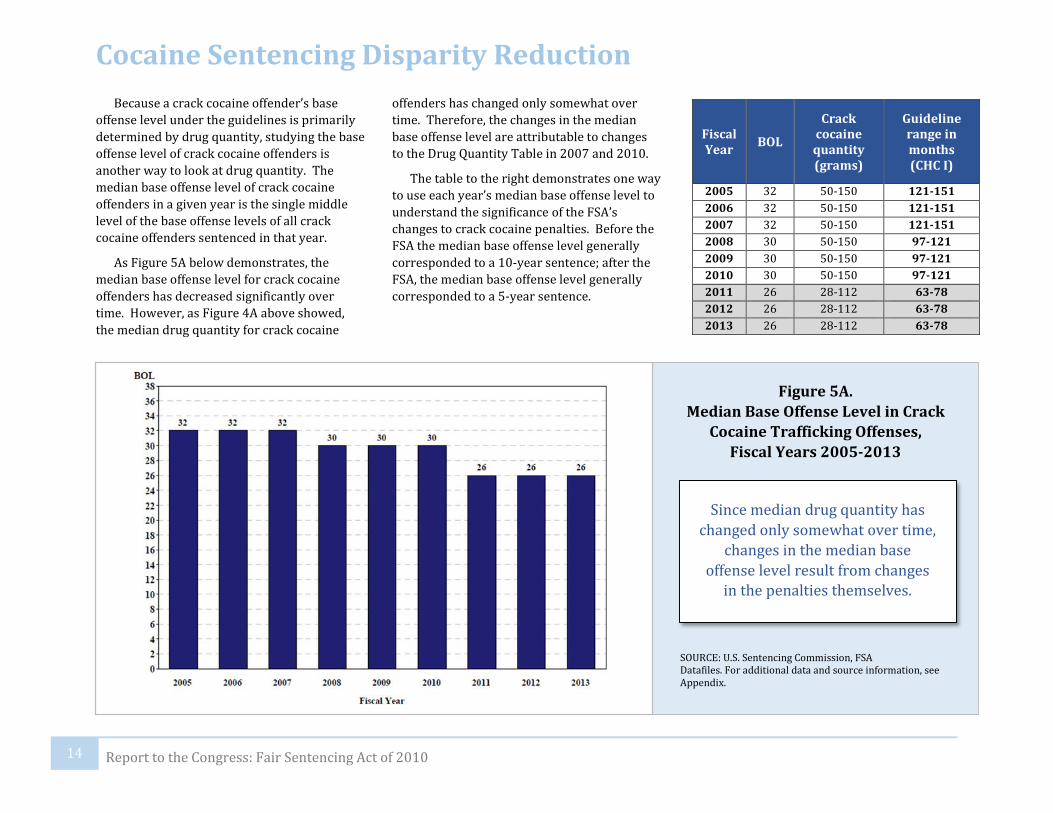
Because a crack cocaine offender’s base offense level under the guidelines is primarily determined by drug quantity, studying the base offense level of crack cocaine offenders is another way to look at drug quantity. The median base offense level of crack cocaine offenders in a given year is the single middle level of the base offense levels of all crack cocaine offenders sentenced in that year.
As Figure 5A below demonstrates, the median base offense level for crack cocaine offenders has decreased significantly over time. However, as Figure 4A above showed, the median drug quantity for crack cocaine
offenders has changed only somewhat over time. Therefore, the changes in the median base offense level are attributable to changes to the Drug Quantity Table in 2007 and 2010.
The table to the right demonstrates one way to use each year’s median base offense level to understand the significance of the FSA’s changes to crack cocaine penalties. Before the FSA the median base offense level generally corresponded to a 10-year sentence; after the FSA, the median base offense level generally corresponded to a 5-year sentence.
Figure 5A. Median Base Offense Level in Crack
Cocaine Trafficking Offenses, Fiscal Years 2005-2013
SOURCE: U.S. Sentencing Commission, FSA Datafiles. For additional data and source information, see Appendix.
Since median drug quantity has changed only somewhat over time,
changes in the median base offense level result from changes
in the penalties themselves.
Fiscal Year BOL
Crack cocaine quantity (grams)
Guideline range in months (CHC I)
2005 32 50-150 121-151 2006 32 50-150 121-151 2007 32 50-150 121-151 2008 30 50-150 97-121 2009 30 50-150 97-121 2010 30 50-150 97-121 2011 26 28-112 63-78 2012 26 28-112 63-78 2013 26 28-112 63-78
14 Report to the Congress: Fair Sentencing Act of 2010
Cocaine Sentencing Disparity Reduction

The Commission has periodically studied samples of the federal drug trafficking population to assess the function that those offenders performed in the drug trafficking offense by reviewing the offense conduct section of the presentence report and independently assessing the function the individual performed. The Commission assigned each offender to one of 21 separate function categories, listed in Appendix Figure 6C, and then grouped them into six categories
for purposes of presenting the data in Figure 6A below. The six categories are displayed from most serious to least serious, from left to right, in Figure 6A. The categories are:
• High-Level Suppliers (includingimporters) and Organizers/Leaders • Manufacturers• Wholesalers• Managers/Supervisors• Street-Level Dealers• Low Level (including brokers, couriers,mules, and others)
If an offender performed more than one function, the most serious function controlled.
A comparison between the two right-most bars in Figure 6A shows what percentage of offenders performed each function before and after the FSA (in 2009 and 2013). This comparison reveals little change in the functions performed by crack cocaine offenders. Street-level dealer continued to be the function most often performed by crack cocaine trafficking offenders after the FSA.
Do crack cocaine offenders after the FSA perform higher level functions in
the offense?
Figure 6A. Most Serious Function of Crack Cocaine Trafficking Offenders,
Select Fiscal Year Samples
SOURCE: U.S. Sentencing Commission, FSA Datafiles. For additional data and source information, see Appendix.
Crack cocaine offenders sentenced since the FSA have,
on the whole, performed largely the same functions as those sentenced before the
FSA.
15 Report to the Congress: Fair Sentencing Act of 2010
Cocaine Sentencing Disparity Reduction
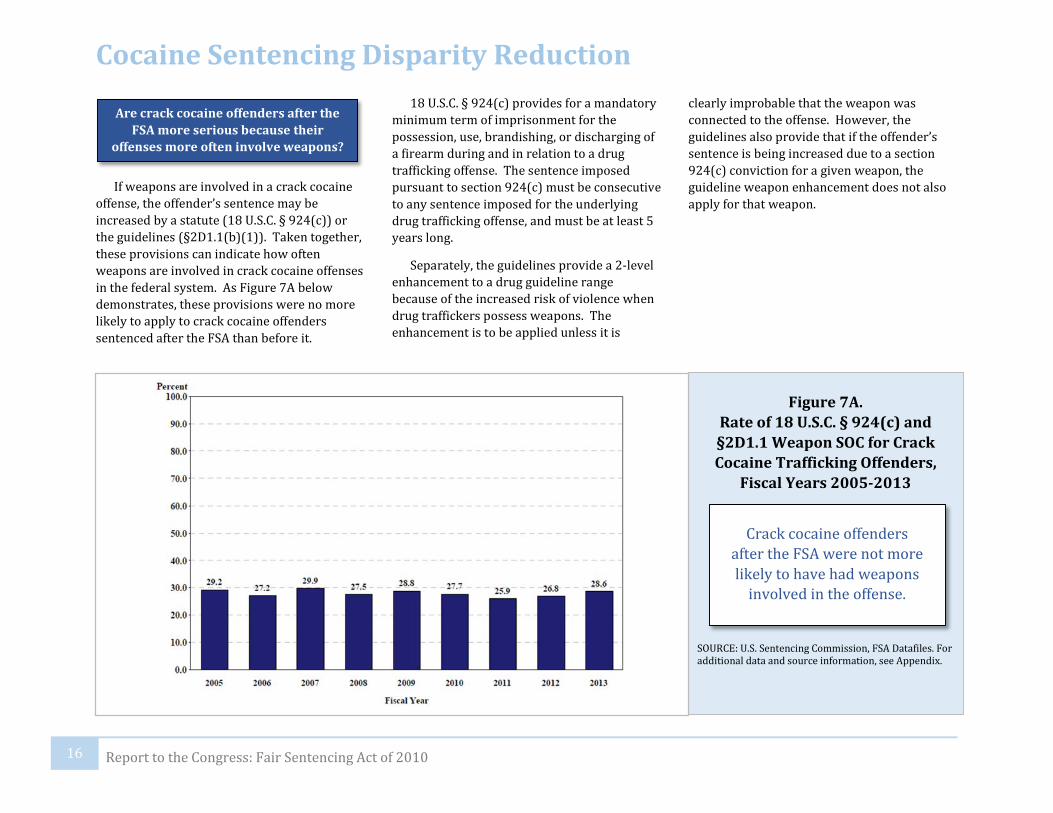
If weapons are involved in a crack cocaine offense, the offender’s sentence may be increased by a statute (18 U.S.C. § 924(c)) or the guidelines (§2D1.1(b)(1)). Taken together, these provisions can indicate how often weapons are involved in crack cocaine offenses in the federal system. As Figure 7A below demonstrates, these provisions were no more likely to apply to crack cocaine offenders sentenced after the FSA than before it.
18 U.S.C. § 924(c) provides for a mandatory minimum term of imprisonment for the possession, use, brandishing, or discharging of a firearm during and in relation to a drug trafficking offense. The sentence imposed pursuant to section 924(c) must be consecutive to any sentence imposed for the underlying drug trafficking offense, and must be at least 5 years long.
Separately, the guidelines provide a 2-level enhancement to a drug guideline range because of the increased risk of violence when drug traffickers possess weapons. The enhancement is to be applied unless it is
clearly improbable that the weapon was connected to the offense. However, the guidelines also provide that if the offender’s sentence is being increased due to a section 924(c) conviction for a given weapon, the guideline weapon enhancement does not also apply for that weapon.
Figure 7A. Rate of 18 U.S.C. § 924(c) and §2D1.1 Weapon SOC for CrackCocaine Trafficking Offenders,
Fiscal Years 2005-2013
Crack cocaine offenders after the FSA were not more likely to have had weapons
involved in the offense.
Are crack cocaine offenders after the FSA more serious because their
offenses more often involve weapons?
16 Report to the Congress: Fair Sentencing Act of 2010
SOURCE: U.S. Sentencing Commission, FSA Datafiles. For additional data and source information, see Appendix.
Cocaine Sentencing Disparity Reduction
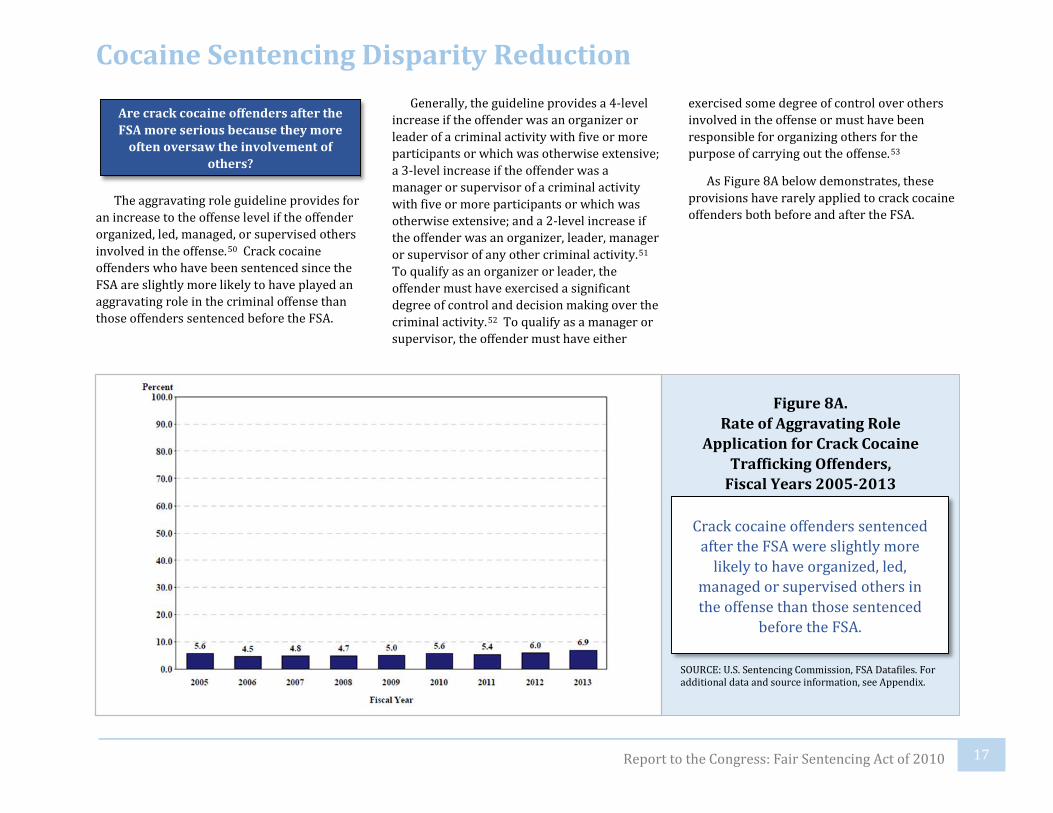
The aggravating role guideline provides for an increase to the offense level if the offender organized, led, managed, or supervised others involved in the offense.50 Crack cocaine offenders who have been sentenced since the FSA are slightly more likely to have played an aggravating role in the criminal offense than those offenders sentenced before the FSA.
Generally, the guideline provides a 4-level increase if the offender was an organizer or leader of a criminal activity with five or more participants or which was otherwise extensive; a 3-level increase if the offender was a manager or supervisor of a criminal activity with five or more participants or which was otherwise extensive; and a 2-level increase if the offender was an organizer, leader, manager or supervisor of any other criminal activity.51 To qualify as an organizer or leader, the offender must have exercised a significant degree of control and decision making over the criminal activity.52 To qualify as a manager or supervisor, the offender must have either
exercised some degree of control over others involved in the offense or must have been responsible for organizing others for the purpose of carrying out the offense.53
As Figure 8A below demonstrates, these provisions have rarely applied to crack cocaine offenders both before and after the FSA.
Are crack cocaine offenders after the FSA more serious because they more
often oversaw the involvement of others?
Figure 8A. Rate of Aggravating Role
Application for Crack Cocaine Trafficking Offenders,
Fiscal Years 2005-2013
SOURCE: U.S. Sentencing Commission, FSA Datafiles. For additional data and source information, see Appendix.
Crack cocaine offenders sentenced after the FSA were slightly more
likely to have organized, led, managed or supervised others in the offense than those sentenced
before the FSA.
17 Report to the Congress: Fair Sentencing Act of 2010
Cocaine Sentencing Disparity Reduction

The mitigating role guideline provides for a decrease to the offense level if an offender’s role makes him substantially less culpable than the average participant, based on the totality of the circumstances.54 The rate at which crack cocaine offenders received a decrease under this provision has remained relatively stable after the FSA.
Generally, the guideline provides that a court may apply a 4-level decrease if the offender was a “minimal” participant in a criminal activity; a 2-level decrease if the offender was a “minor” participant in a criminal activity; and a 3-level decrease if the offender’s role fell between minor and minimal.55 The guideline explains that a minimal participant is one who is “plainly among the least culpable of those involved in the conduct of the group” and may lack “knowledge or understanding of the scope and structure of the enterprise and of the activities of others.”56
A minor participant is one who is “less culpable than most other participants, but whose role cannot be described as minimal.”57
As Figure 9A below demonstrates, these provisions have rarely applied to crack cocaine offenders both before and after the FSA.
Are crack cocaine offenders after the FSA more serious because they are less
likely to have played a mitigating role?
Figure 9A. Rate of Mitigating Role Application
for Crack Cocaine Trafficking Offenders,
Fiscal Years 2005-2013
SOURCE: U.S. Sentencing Commission, FSA Datafiles. For additional data and source information, see Appendix.
Crack cocaine offenders sentenced after the FSA were equally likely to
have been among the least culpable in the offense as those
sentenced before the FSA.
18 Report to the Congress: Fair Sentencing Act of 2010
Cocaine Sentencing Disparity Reduction
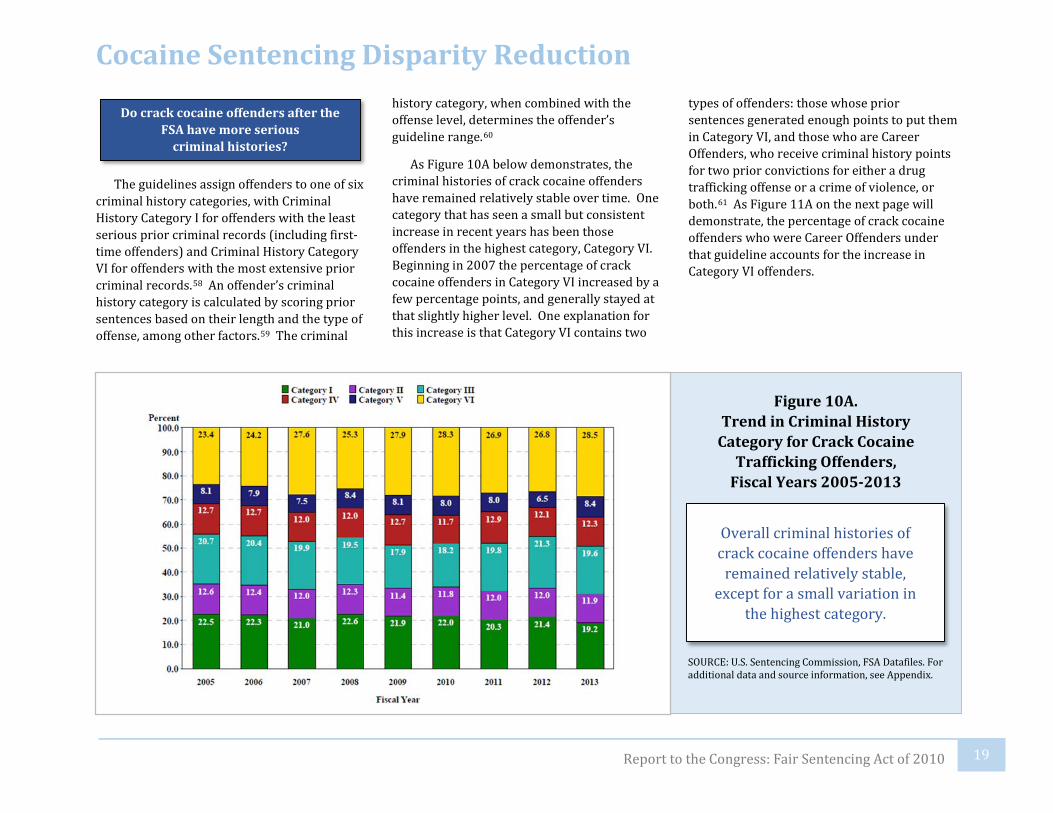
The guidelines assign offenders to one of six criminal history categories, with Criminal History Category I for offenders with the least serious prior criminal records (including first-time offenders) and Criminal History Category VI for offenders with the most extensive prior criminal records.58 An offender’s criminal history category is calculated by scoring prior sentences based on their length and the type of offense, among other factors.59 The criminal
history category, when combined with the offense level, determines the offender’s guideline range.60
As Figure 10A below demonstrates, the criminal histories of crack cocaine offenders have remained relatively stable over time. One category that has seen a small but consistent increase in recent years has been those offenders in the highest category, Category VI. Beginning in 2007 the percentage of crack cocaine offenders in Category VI increased by a few percentage points, and generally stayed at that slightly higher level. One explanation for this increase is that Category VI contains two
types of offenders: those whose prior sentences generated enough points to put them in Category VI, and those who are Career Offenders, who receive criminal history points for two prior convictions for either a drug trafficking offense or a crime of violence, or both.61 As Figure 11A on the next page will demonstrate, the percentage of crack cocaine offenders who were Career Offenders under that guideline accounts for the increase in Category VI offenders.
Do crack cocaine offenders after the FSA have more serious
criminal histories?
Figure 10A. Trend in Criminal History
Category for Crack Cocaine Trafficking Offenders,
Fiscal Years 2005-2013
Overall criminal histories of crack cocaine offenders have
remained relatively stable, except for a small variation in
the highest category.
19 Report to the Congress: Fair Sentencing Act of 2010
SOURCE: U.S. Sentencing Commission, FSA Datafiles. For additional data and source information, see Appendix.
Cocaine Sentencing Disparity Reduction

The Career Offender guideline provides that an offender convicted of a crime of violence or a drug trafficking offense who receives criminal history points for two prior convictions for either a crime of violence or a drug trafficking offense, or both, is automatically in Criminal History Category VI.62 It also provides an increased offense levelfor a Career Offender, meaning that the offender’s sentence will be at or near the statutory maximum.63 As such, the Career Offender provision typically results in a substantial increase in the offender’s guideline range.
The percentage of crack cocaine offenders who are Career Offenders, therefore, can be seen as a separate measure of the seriousness of crack cocaine offenders’ criminal histories, because the Career Offender guideline uses a different set of criteria from the criteria that set the Criminal History Category of a non-Career Offender.
The trend of increasing percentages of Career Offenders among crack cocaine offenders began in 2007, and continued after the FSA. This increase corresponds to the increase in offenders sentenced in Criminal
History Category VI, seen in Figure 10A.
The correspondence indicates that variation in the percentage of crack cocaine offenders in Criminal History Category VI sentenced after the FSA occurred because of differences in how many offenders had two qualifying prior crimes of violence or drug trafficking offenses, not because of a more general increase in offenders’ criminal histories.
Figure 11A. Rate of Career Offender
Application for Crack Cocaine Trafficking Offenders,
Fiscal Years 2005-2013
SOURCE: U.S. Sentencing Commission, FSA Datafiles. For additional data and source information, see Appendix.
Crack cocaine offenders have been more likely to be Career Offenders over time,
a trend that continued after the FSA.
20 Report to the Congress: Fair Sentencing Act of 2010
Cocaine Sentencing Disparity Reduction
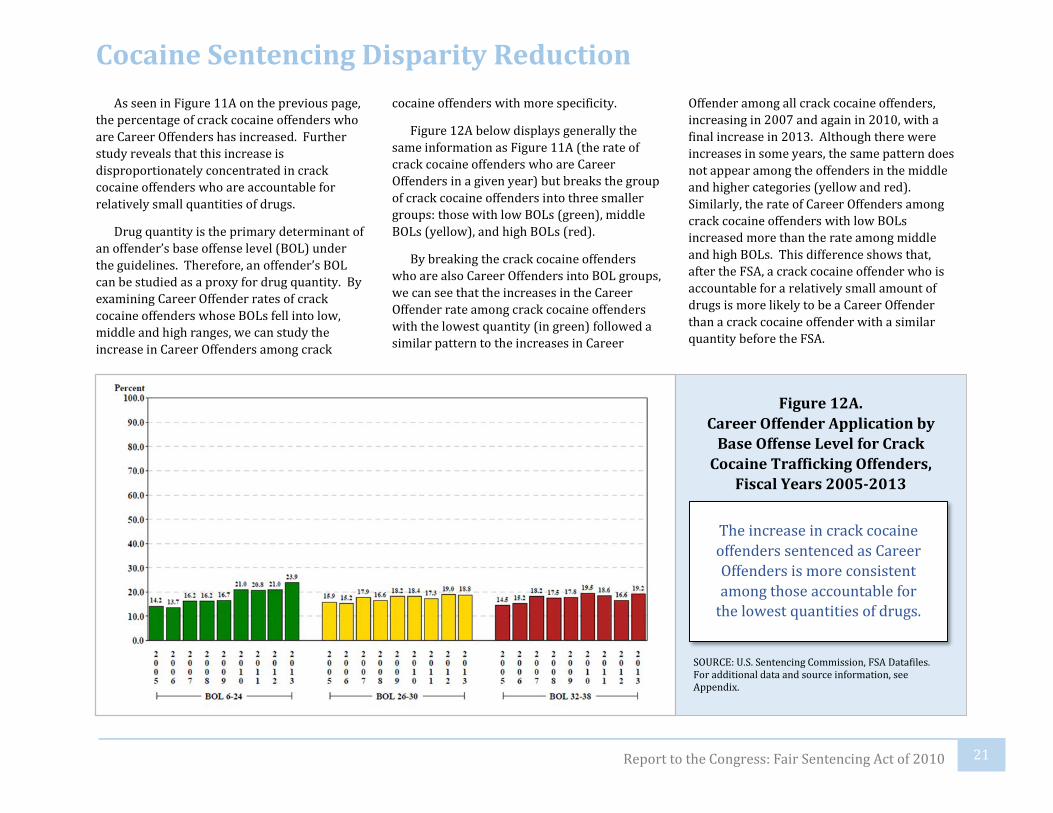
As seen in Figure 11A on the previous page, the percentage of crack cocaine offenders who are Career Offenders has increased. Further study reveals that this increase is disproportionately concentrated in crack cocaine offenders who are accountable for relatively small quantities of drugs.
Drug quantity is the primary determinant of an offender’s base offense level (BOL) under the guidelines. Therefore, an offender’s BOL can be studied as a proxy for drug quantity. By examining Career Offender rates of crack cocaine offenders whose BOLs fell into low, middle and high ranges, we can study the increase in Career Offenders among crack
cocaine offenders with more specificity.
Figure 12A below displays generally the same information as Figure 11A (the rate of crack cocaine offenders who are Career Offenders in a given year) but breaks the group of crack cocaine offenders into three smaller groups: those with low BOLs (green), middle BOLs (yellow), and high BOLs (red).
By breaking the crack cocaine offenders who are also Career Offenders into BOL groups, we can see that the increases in the Career Offender rate among crack cocaine offenders with the lowest quantity (in green) followed a similar pattern to the increases in Career
Offender among all crack cocaine offenders, increasing in 2007 and again in 2010, with a final increase in 2013. Although there were increases in some years, the same pattern does not appear among the offenders in the middle and higher categories (yellow and red). Similarly, the rate of Career Offenders among crack cocaine offenders with low BOLs increased more than the rate among middle and high BOLs. This difference shows that, after the FSA, a crack cocaine offender who is accountable for a relatively small amount of drugs is more likely to be a Career Offender than a crack cocaine offender with a similar quantity before the FSA.
Figure 12A. Career Offender Application by
Base Offense Level for Crack Cocaine Trafficking Offenders,
Fiscal Years 2005-2013
SOURCE: U.S. Sentencing Commission, FSA Datafiles. For additional data and source information, see Appendix.
The increase in crack cocaine offenders sentenced as Career Offenders is more consistent among those accountable for
the lowest quantities of drugs.
21 Report to the Congress: Fair Sentencing Act of 2010
Cocaine Sentencing Disparity Reduction

Certain drug offenders can be sentenced below the quantity-based statutory mandatory minimum penalty based on the so-called “safety valve” statute, 18 U.S.C. § 3553(f), and the guideline that implements it.64 In order to qualify for the safety valve, the offender must not have more than one criminal history point, must not have used violence or weapons, must not have been an organizer or leader, must not have engaged in a continuing criminal enterprise, and must have provided, in a timely
manner, all information about the offense to the government. In addition, the offense must not have resulted in death or serious bodily injury. Under the drug guideline, offenders meeting these criteria also receive a separate 2-level reduction in their drug offense level, even if they were not convicted of an offense carrying a mandatory minimum penalty.65
The rate at which crack cocaine offenders have received safety valve reductions has decreased after the FSA, continuing a trend that began in 2009. Because there are multiple requirements for safety valve relief, and failure to meet any one of the requirements will disqualify an offender, it is unlikely that a
single factor caused this decrease. As Figures 7A, 8A, and 11A illustrated, in some or all of the years during this period there were small increases in the rate of crack cocaine offenders who were Career Offenders, who received the aggravating role adjustment, and whose offenses involved weapons. Any of these factors could disqualify an offender from safety valve relief. Therefore, any one of these factors, or more likely some combination of them, likely caused the decrease in safety valve application.
Are crack cocaine offenders after the FSA less likely to receive safety valve
relief?
Figure 13A. Rate of Safety Valve Application for
Crack Cocaine Trafficking Offenders,
Fiscal Years 2005-2013
SOURCE: U.S. Sentencing Commission, FSA Datafiles. For additional data and source information, see Appendix.
Crack cocaine offenders received lower sentences due to the safety valve at slightly lower
rates after the FSA.
22 Report to the Congress: Fair Sentencing Act of 2010
Cocaine Sentencing Disparity Reduction
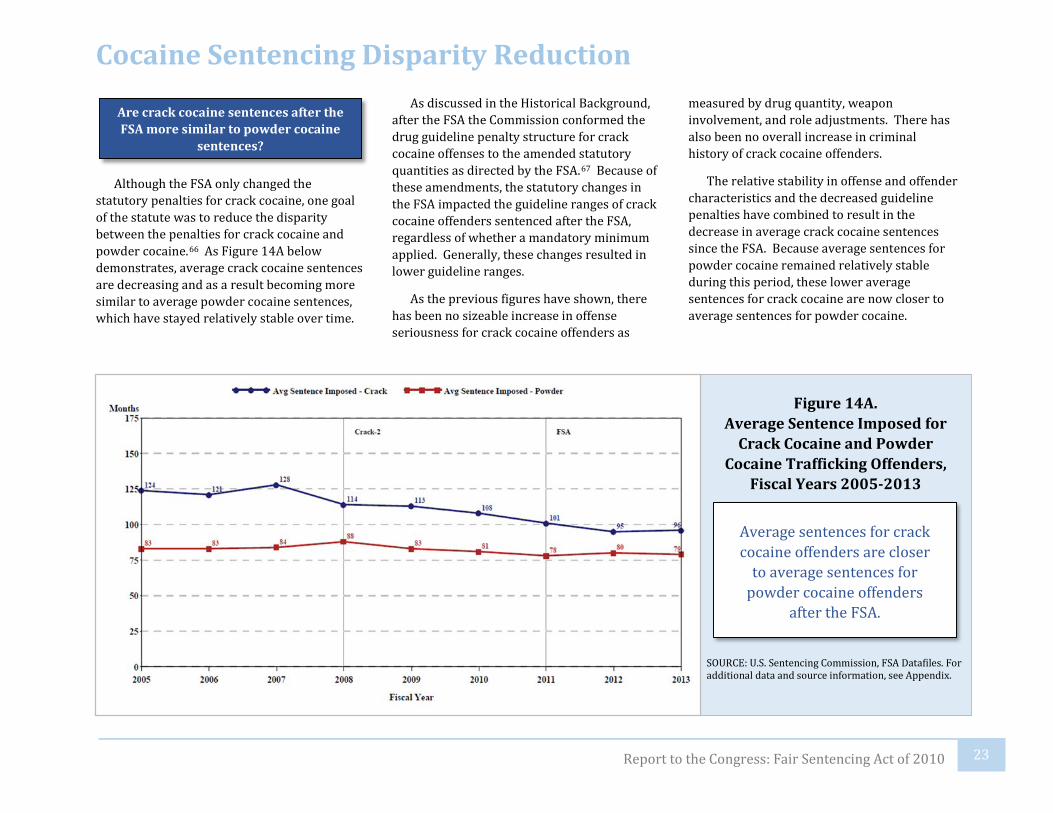
Although the FSA only changed the statutory penalties for crack cocaine, one goal of the statute was to reduce the disparity between the penalties for crack cocaine and powder cocaine.66 As Figure 14A below demonstrates, average crack cocaine sentences are decreasing and as a result becoming more similar to average powder cocaine sentences, which have stayed relatively stable over time.
As discussed in the Historical Background, after the FSA the Commission conformed the drug guideline penalty structure for crack cocaine offenses to the amended statutory quantities as directed by the FSA.67 Because of these amendments, the statutory changes in the FSA impacted the guideline ranges of crack cocaine offenders sentenced after the FSA, regardless of whether a mandatory minimum applied. Generally, these changes resulted in lower guideline ranges.
As the previous figures have shown, there has been no sizeable increase in offense seriousness for crack cocaine offenders as
measured by drug quantity, weapon involvement, and role adjustments. There has also been no overall increase in criminal history of crack cocaine offenders.
The relative stability in offense and offender characteristics and the decreased guideline penalties have combined to result in the decrease in average crack cocaine sentences since the FSA. Because average sentences for powder cocaine remained relatively stable during this period, these lower average sentences for crack cocaine are now closer to average sentences for powder cocaine.
Are crack cocaine sentences after the FSA more similar to powder cocaine
sentences?
Figure 14A. Average Sentence Imposed for
Crack Cocaine and Powder Cocaine Trafficking Offenders,
Fiscal Years 2005-2013
Average sentences for crack cocaine offenders are closer
to average sentences for powder cocaine offenders
after the FSA.
23 Report to the Congress: Fair Sentencing Act of 2010
SOURCE: U.S. Sentencing Commission, FSA Datafiles. For additional data and source information, see Appendix.
Cocaine Sentencing Disparity Reduction

One way the Commission assesses the impact of the guidelines is to compare the average sentence imposed for a given group of offenders to the bottom of the applicable guideline range for those offenders. Due to factors such as departures for substantial assistance to authorities, the average sentence imposed is typically lower than the bottom of the average guideline range. If the guidelines have an anchoring effect on sentences, then as the average guideline minimum increases, the
average sentence increases, and as the average guideline minimum decreases, the average sentence also decreases.
As Figure 14B below illustrates, before the Commission reduced the guidelines for crack cocaine in 2007, the relationship between the guidelines and sentences was relatively consistent. Generally, as the average guideline minimum increased, the average sentence increased, and as the average guideline minimum decreased, the average sentence also decreased.
Between 2008 and the FSA, the gap between the average guideline minimum and
the average sentence widened, suggesting that the guidelines’ influence was diminishing. This would be consistent with several events during this time period, including the Supreme Court’s decisions in Kimbrough and Spears, which could have contributed to sentences further from the guidelines. However, after the FSA, the relationship between the guidelines and sentences regained its consistency.
How do the guidelines affect crack cocaine sentences after the FSA?
Figure 14B. Average Guideline Minimum
and Average Sentence Imposed for Crack Cocaine
Trafficking Offenders, Fiscal Years 2005-2013
SOURCE: U.S. Sentencing Commission, FSA Datafiles. For additional data and source information, see Appendix.
After the FSA, the guidelines appear to have regained their relationship to crack cocaine
sentences.
24 Report to the Congress: Fair Sentencing Act of 2010
Cocaine Sentencing Disparity Reduction

The effect of the guidelines on sentences can also be seen by studying how often sentences are within, above or below the guideline range. Figure 15A below divides all crack cocaine sentences imposed in a given year into one of five categories: within the guideline range (red); above the guideline range (yellow); and below the guideline range for one of three reasons: due to a substantial assistance motion from the government (purple); due to another government-sponsored motion, such as an “Early Disposition Program” or a binding plea agreement to a sentence below the guideline range (blue); or for a reason not sponsored by
the government, such as a defense motion or the court’s own motion (green).
Figure 15A illustrates two trends in crack cocaine sentences. First, the rate of sentences that were below the guideline due to a government substantial assistance motion (purple) remained stable throughout the 2005-2013 period, indicating that the reductions in penalties during this period did not generally reduce the willingness of offenders to provide assistance to the government in the prosecution of others.
Second, between 2008 and 2010, the rate of within-guideline range sentences (red)
decreased. The decrease is explained primarily by an increase in the non-government sponsored below range sentences (green). There is also an increase in the rate of sentences below the guideline range that were sponsored by the government for reasons other than substantial assistance (blue). After the FSA, the rate of below-range sentences initiated by the defendant or the court (green) reduced and became stable, but the rate of sentences below the guideline range that were sponsored by the government for reasons other than substantial assistance (blue) increased.
Figure 15A. Position of Sentences Relative
to the Guideline Range for Crack Cocaine Trafficking
Offenders, Fiscal Years 2005-2013
SOURCE: U.S. Sentencing Commission, FSA Datafiles. For additional data and source information, see Appendix.
Substantial assistance rates appear to have been
unaffected by reductions in crack cocaine penalties,
including the FSA.
25 Report to the Congress: Fair Sentencing Act of 2010
Cocaine Sentencing Disparity Reduction
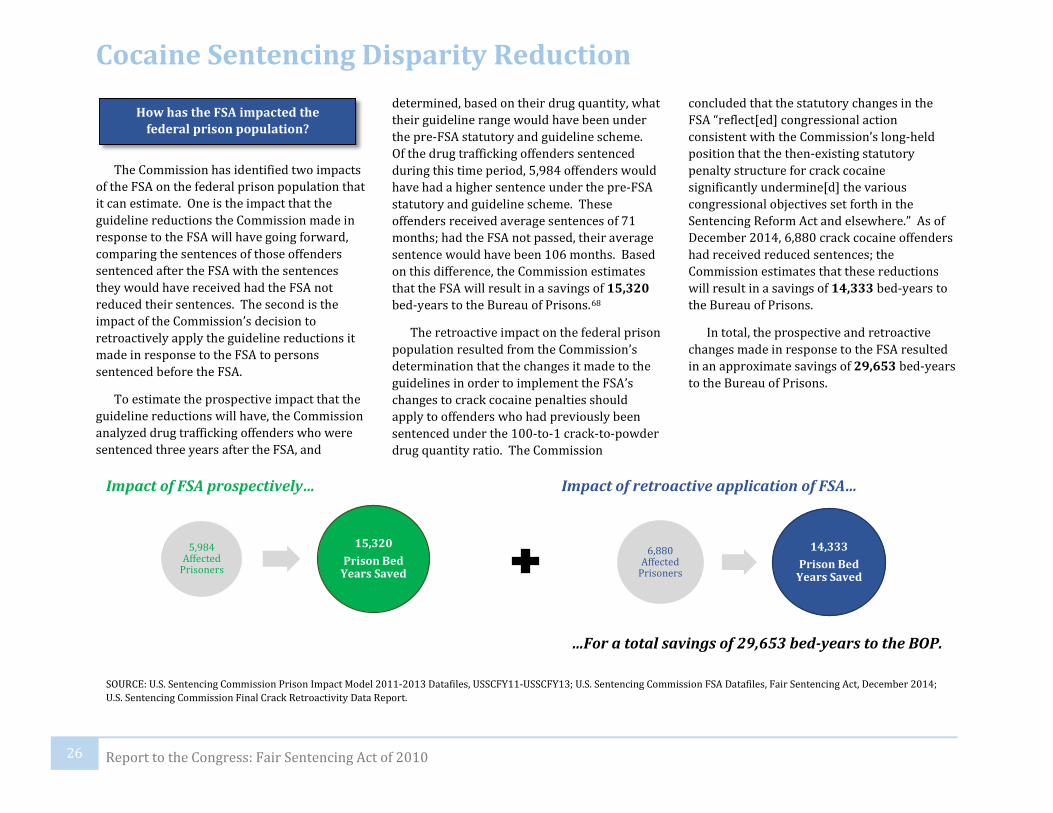
The Commission has identified two impacts of the FSA on the federal prison population that it can estimate. One is the impact that the guideline reductions the Commission made in response to the FSA will have going forward, comparing the sentences of those offenders sentenced after the FSA with the sentences they would have received had the FSA not reduced their sentences. The second is the impact of the Commission’s decision to retroactively apply the guideline reductions it made in response to the FSA to persons sentenced before the FSA.
To estimate the prospective impact that the guideline reductions will have, the Commission analyzed drug trafficking offenders who were sentenced three years after the FSA, and
determined, based on their drug quantity, what their guideline range would have been under the pre-FSA statutory and guideline scheme. Of the drug trafficking offenders sentenced during this time period, 5,984 offenders would have had a higher sentence under the pre-FSA statutory and guideline scheme. These offenders received average sentences of 71 months; had the FSA not passed, their average sentence would have been 106 months. Based on this difference, the Commission estimates that the FSA will result in a savings of 15,320 bed-years to the Bureau of Prisons.68
The retroactive impact on the federal prison population resulted from the Commission’s determination that the changes it made to the guidelines in order to implement the FSA’s changes to crack cocaine penalties should apply to offenders who had previously been sentenced under the 100-to-1 crack-to-powder drug quantity ratio. The Commission
concluded that the statutory changes in the FSA “reflect[ed] congressional action consistent with the Commission’s long-held position that the then-existing statutory penalty structure for crack cocaine significantly undermine[d] the various congressional objectives set forth in the Sentencing Reform Act and elsewhere.” As of December 2014, 6,880 crack cocaine offenders had received reduced sentences; the Commission estimates that these reductions will result in a savings of 14,333 bed-years to the Bureau of Prisons.
In total, the prospective and retroactive changes made in response to the FSA resulted in an approximate savings of 29,653 bed-years to the Bureau of Prisons.
How has the FSA impacted the federal prison population?
Impact of FSA prospectively… Impact of retroactive application of FSA…
…For a total savings of 29,653 bed-years to the BOP.
SOURCE: U.S. Sentencing Commission Prison Impact Model 2011-2013 Datafiles, USSCFY11-USSCFY13; U.S. Sentencing Commission FSA Datafiles, Fair Sentencing Act, December 2014; U.S. Sentencing Commission Final Crack Retroactivity Data Report.
5,984 Affected
Prisoners
15,320Prison Bed
Years Saved
6,880 Affected
Prisoners
14,333Prison Bed
Years Saved
26 Report to the Congress: Fair Sentencing Act of 2010
Cocaine Sentencing Disparity Reduction
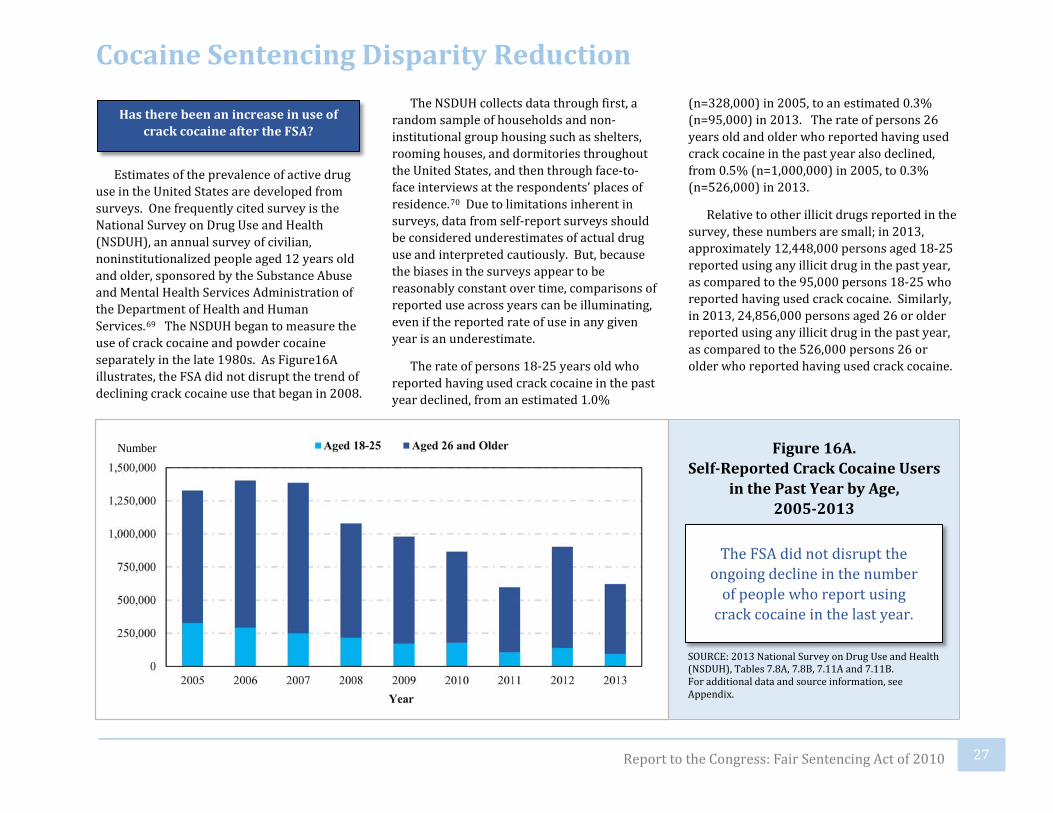
Estimates of the prevalence of active drug use in the United States are developed from surveys. One frequently cited survey is the National Survey on Drug Use and Health (NSDUH), an annual survey of civilian, noninstitutionalized people aged 12 years old and older, sponsored by the Substance Abuse and Mental Health Services Administration of the Department of Health and Human Services.69 The NSDUH began to measure the use of crack cocaine and powder cocaine separately in the late 1980s. As Figure16A illustrates, the FSA did not disrupt the trend of declining crack cocaine use that began in 2008.
The NSDUH collects data through first, a random sample of households and non-institutional group housing such as shelters, rooming houses, and dormitories throughout the United States, and then through face-to-face interviews at the respondents’ places of residence.70 Due to limitations inherent in surveys, data from self-report surveys should be considered underestimates of actual drug use and interpreted cautiously. But, because the biases in the surveys appear to be reasonably constant over time, comparisons of reported use across years can be illuminating, even if the reported rate of use in any given year is an underestimate.
The rate of persons 18-25 years old who reported having used crack cocaine in the past year declined, from an estimated 1.0%
(n=328,000) in 2005, to an estimated 0.3% (n=95,000) in 2013. The rate of persons 26 years old and older who reported having used crack cocaine in the past year also declined, from 0.5% (n=1,000,000) in 2005, to 0.3% (n=526,000) in 2013.
Relative to other illicit drugs reported in the survey, these numbers are small; in 2013, approximately 12,448,000 persons aged 18-25 reported using any illicit drug in the past year, as compared to the 95,000 persons 18-25 who reported having used crack cocaine. Similarly, in 2013, 24,856,000 persons aged 26 or older reported using any illicit drug in the past year, as compared to the 526,000 persons 26 or older who reported having used crack cocaine.
Has there been an increase in use of crack cocaine after the FSA?
Figure 16A. Self-Reported Crack Cocaine Users
in the Past Year by Age, 2005-2013
SOURCE: 2013 National Survey on Drug Use and Health (NSDUH), Tables 7.8A, 7.8B, 7.11A and 7.11B. For additional data and source information, see Appendix.
The FSA did not disrupt the ongoing decline in the number
of people who report using crack cocaine in the last year.
Number
27 Report to the Congress: Fair Sentencing Act of 2010
Cocaine Sentencing Disparity Reduction

28 Report to the Congress: Fair Sentencing Act of 2010

Section Three
Section Three of this report analyzes the impact of Section Three of the Fair Sentencing Act of 2010 related to the elimination of the mandatory minimum penalty for simple possession of crack cocaine.
29 Report to the Congress: Fair Sentencing Act of 2010

Prior to the FSA, crack cocaine was the only controlled substance with a mandatory minimum for simple possession.71 Section 3 of the FSA amended the statutory penalties for simple possession of controlled substances to eliminate the 5-year mandatory minimum for simple possession of more than 5 grams of crack cocaine.
The number of crack cocaine simple possession offenders has always been small,
and, following the enactment of the FSA, the generally declining trend continued. As Figure 17A shows, there have been fewer than 50 crack cocaine simple possession cases in every year since 2005, and in 2013 there were fewer than ten such cases.
Even within the small group of crack cocaine simple possession offenders, the mandatory minimum has applied relatively rarely and, as expected, the FSA’s elimination of the mandatory minimum has reduced that number to zero.
For the seven offenders sentenced in 2011 and 2012 to the mandatory minimum penalty,
it should be noted that each committed the offense before enactment of the FSA on August 3, 2010, but was sentenced after that date. After their original sentencings, these seven offenders appealed their sentences on the grounds that, because they were sentenced after the FSA’s enactment, the FSA’s more lenient penalties should apply. In each case, the offender’s 5-year mandatory minimum sentence was vacated and the offender was re-sentenced under the post-FSA statutory and guideline scheme.
Figure 17A. Number of Simple Possession
Crack Cocaine Offenders, Fiscal Years 2005-2013
SOURCE: U.S. Sentencing Commission, FSA Datafiles. For additional data and source information, see Appendix.
The number of offenders subject to the mandatory
minimum for simple possession of crack cocaine has always been small, and as expected,
after the FSA is zero.
What has been the impact of the FSA’s removal of the mandatory minimum
for simple possession of crack cocaine?
30 Report to the Congress: Fair Sentencing Act of 2010
Elimination of Mandatory Minimum for Simple Possession

Section Four
Section Four of this report analyzes the impact of Section Four of the Fair Sentencing Act of 2010 related to increased penalties for major drug traffickers, specifically fine penalties.
31 Report to the Congress: Fair Sentencing Act of 2010

Section 4 of the FSA increased the amount of the fine that a court may impose on a drug trafficking offender. As with the statutory maximum for sentences of imprisonment, the maximum fine depends on both the drug quantity and whether the offense is the offender’s first conviction under the statute or the offender’s second or subsequent conviction under the statute. There are no minimum fines.
Only a small percentage of drug trafficking offenders receive a fine of any amount, and the percentage of drug trafficking offenders receiving a fine has remained relatively stable after the FSA.
Among offenders whose sentence did include a fine, the average fine stayed relatively stable after the FSA.
Figure 18. Fines Imposed for Drug Trafficking Offenders
Fiscal Years 2005-2013
Fiscal Year
2005 2006 2007 2008 2009 2010 2011 2012 2013 Drug Trafficking Offenders Receiving Fines
11.0% 9.7% 9.9% 9.0% 9.1% 8.5% 8.0% 7.3% 7.8%
Average Fine Amount $7,972 $12,138 $8,039 $4,448 $8,061 $8,750 $13,673 $8,028 $9,978
SOURCE: U.S. Sentencing Commission, FSA Datafiles. For additional data and source information, see Appendix.
21 U.S.C. §§ 841 and 960 Pre-FSA Maximum Fine
Post-FSA Maximum Fine
First offense
5-yr min $2 million $5 million
10-yr min $4 million $10 million
Second or subsequent offense
5-yr min $4 million $8 million
10-yr min $8 million $20 million
32 Report to the Congress: Fair Sentencing Act of 2010
Increased Fine Penalties for Major Drug Traffickers

Section Five
Section Five of this report analyzes the impact of Sections Five through Seven of the Fair Sentencing Act of 2010 related to enhancements for violence as well as increased emphasis on other aggravating and mitigating factors.
33 Report to the Congress: Fair Sentencing Act of 2010

Sections 5, 6 and 7 of the FSA directed the Commission to add new provisions to the guidelines that would increase or decrease a drug trafficker’s sentence under certain circumstances. These provisions were to apply to all drug traffickers, not just crack cocaine offenders; therefore, the analysis in this section is based on a study of all drug trafficking offenders since the FSA. These provisions have applied rarely, although for most provisions the numbers have steadily increased.
Section 5 of the FSA directed the Commission to add “an additional penalty increase of at least 2 offense levels if the offender used violence, made a credible threat to use violence, or directed the use of violence during a drug trafficking offense.” Pursuant to this directive, the drug trafficking guideline provides such an increase.72
Section 6 of the FSA directed the Commission to add 2-level increases for a variety of conduct during a drug trafficking offense. Pursuant to this directive, the guidelines provide a 2-level increase for any drug trafficker who bribes a law enforcement official in connection with the offense.73 Also pursuant to this directive, the guidelines provide a separate 2-level increase if an offender maintained a premises (such as an apartment or warehouse) for manufacturing or distributing drugs.74
Section 6 also directed the Commission to provide another 2-level increase if a drug trafficker engaged in one of several other types of conduct during the offense, but only if the offender was separately found to have played an aggravating role in the offense (“super aggravating role”). Under the guidelines, an offender plays an aggravating role by
organizing, leading, managing or supervising other people involved in the offense.75 If one of these offenders used fear, impulse, friendship, and/or affection to involve another person who knew little about the enterprise and who received little or no compensation, the offender who involved that person would receive a 2-level increase pursuant to this directive. 76 Similarly, if an aggravating role offender distributed drugs to or involved in the offense a minor, a person 65 years or older, a pregnant person, or a person who was unusually vulnerable due to a physical or mental condition or otherwise particularly susceptible to criminal conduct, the 2-level increase would apply.77 Finally, if an aggravating role offender obstructed the investigation or prosecution of the offense or committed the offense as part of a criminal livelihood, the 2-level increase would apply.78
Application of Selected Aggravating Specific Offense Characteristics in Drug Trafficking Offenses Fiscal Years 2011-2014
Fiscal Year 2011
Fiscal Year 2012
Fiscal Year 2013
Fiscal Year 2014
Total # of Cases 18,536 23,833 21,960 20,977
N % N % N % N %
Violence 37 0.2% 98 0.4% 157 0.7% 141 0.7%
Bribery 1 0.0% 5 0.0% 13 0.1% 13 0.1%
Premises 145 0.8% 483 2.0% 814 3.7% 919 4.4%
Super AggRole 39 0.2% 106 0.4% 153 0.7% 159 0.8%
34 Report to the Congress: Fair Sentencing Act of 2010
Increased Emphasis on Certain Aggravating Factors

Section 7 of the FSA directed the Commission to decrease the guideline range for drug trafficking offenders who play a minimal role in the offense under certain circumstances. Under the guidelines, a minimal participant is among the least culpable and may not be aware of the overall enterprise or others’ involvement.79
Pursuant to the directive, a minimal participant’s base offense level is “capped” at 32; that is to say, if a minimal participant is accountable for a drug quantity that would result in a base offense level that is higher than 32, the base offense level must be reduced to 32.80 As Figure 19 reflects, the cap has operated to reduce a drug trafficking offender’s base offense level rarely, although the number has increased annually.
Separately, pursuant to section 7, a minimal participant would receive a 2-level decrease in offense level if he or she had little knowledge of the drug trafficking scheme, was not to receive monetary compensation, and was motivated to participate by an intimate or familial relationship or by threats or fear when he or she would otherwise have been unlikely to commit a drug trafficking offense (“super mitigating role”).81 As Figure 19 reflects, this reduction has also applied rarely, although the number has generally increased.
Application of Selected Mitigating Specific Offense Characteristics in Drug Trafficking Offenses Fiscal Years 2011-2014
Fiscal Year 2011
Fiscal Year 2012
Fiscal Year 2013
Fiscal Year 2014
Total # of Cases 18,536 23,833 21,960 20,977
N % N % N % N %
Minimal Role Cap 17 0.1% 29 0.1% 49 0.2% 68 0.3%
Super MitRole 32 0.2% 42 0.2% 41 0.2% 54 0.3%
Figure 19. Application of SOCs in
Drug Trafficking Offenses, Fiscal Years 2011-2014
SOURCE: U.S. Sentencing Commission, FSA Datafiles. For additional data and source information, see Appendix.
The guideline increases and decreases added in response to Sections 5, 6, and 7 of the FSA have all applied rarely.
35 Report to the Congress: Fair Sentencing Act of 2010
Increased Emphasis on Certain Mitigating Factors

36 Report to the Congress: Fair Sentencing Act of 2010

Conclusion
37 Report to the Congress: Fair Sentencing Act of 2010
For more than twenty years, the Commission has worked consistently with the legislative, executive, and judicial branches of government and other interested parties to ensure that cocaine sentencing policy promotes the goals of the Sentencing Reform Act. During this time, the Commission consistently took the position that the disparity between crack cocaine and powder cocaine penalties significantly undermined those goals. Therefore, the Commission recommended that Congress reduce crack cocaine penalties so that the crack-to-powder drug quantity ratio was no more than 20-to-1, and that Congress repeal the mandatory minimum penalty for simple possession of crack cocaine.
Consistent with the Commission’s recommendations, the FSA reduced the statutory penalties for crack cocaine offenses to produce an 18-to-1 crack-to-powder drug quantity ratio and eliminated the mandatory minimum sentence for simple possession of crack cocaine.
The Commission did not find a substantial change in the seriousness of crack cocaine offenders after the FSA as measured by drug quantity, weapon involvement, function performed, role in the offense, safety valve application, or criminal history generally. The Commission did find an increase in crack cocaine offenders sentenced as Career Offenders, and found that most of this increase was concentrated among crack cocaine offenders with lower drug quantities.
The Commission also observed that rates of cooperation with law enforcement did not change despite the changes in penalties, and that the guidelines regained their relationship to crack cocaine sentences.
Studying the effect of these changes, the Commission finds that the FSA reduced the disparity between crack and powder cocaine sentences, reduced the federal prison population, and has resulted in fewer federal prosecutions for crack cocaine. All this occurred while crack cocaine use continued to decline.
38 Report to the Congress: Fair Sentencing Act of 2010
Conclusion

Endnotes
39 Report to the Congress: Fair Sentencing Act of 2010

1 Title II, Comprehensive Crime Control Act of 1984, Pub. L. No. 98-473 (1984).
2 United States Sentencing Commission [hereinafter USSC or Commission], 2007 REPORT TO THE CONGRESS: COCAINE AND FEDERAL SENTENCING POLICY (May 2007) [hereinafter 2007 Commission Report]; USSC, 2002 REPORT TO THE CONGRESS: COCAINE AND FEDERAL SENTENCING POLICY (May 2002) [hereinafter 2002 Commission Report]; USSC, 1997 SPECIAL REPORT TO THE CONGRESS: COCAINE AND FEDERAL SENTENCING POLICY (AS DIRECTED BY SECTION 2 OF PUB. L. NO. 104–38) (April 1997) [hereinafter 1997 Commission Report]; USSC, 1995 SPECIAL REPORT TO THE CONGRESS: COCAINE AND FEDERAL SENTENCING POLICY (AS DIRECTED BY SECTION 280006 OF PUB. L. NO. 103–322) (February 1995) [hereinafter 1995 Commission Report].
3 USSC, 2007 Commission Report, at 8; USSC, 2002 Commission Report, at 93-103; USSC, 1997 Commission Report, at 9; USSC, 1995 Commission Report, at 195-98.
4 USSC, 2007 Commission Report, at 8.
5 USSG, App. C, amend. 706 (effective Nov. 1, 2007). 6 Fair Sentencing Act of 2010, Pub. L. No. 111–220, 124 Stat. 2372 (Aug. 3, 2010), at sections 2-3.
7 Id. at sections 5-7.
8 Id. at section 10.
9 Although the early reports implicated crack cocaine, witness testimony a year later revealed that the drug Bias used was powder cocaine. See USSC, 1995 Commission Report, at 122. 10 Pub. L. No. 99–570 (1986). 11 Id. 12 For a detailed history of mandatory minimums, see USSC, REPORT TO THE CONGRESS: MANDATORY MINIMUM PENALTIES IN THE FEDERAL CRIMINAL JUSTICE SYSTEM (October 2011), at Chapter 2.
13 USSC, 2002 Commission report, at 10-11. 14 Pub. L. No. 100–690 (1988). 15 Violent Crime Control and Law Enforcement Act of 1994, Pub. L. No. 103-322 (Sept. 13, 1994). 16 Id. 17 USSC, 1995 Commission Report. 18 Id. at 195-98. 19 60 Fed. Reg. 25074 (May 10, 1995) (listing the proposed amendment).
20 Pub. L. No. 104-38 (Oct. 30, 1995). 21 USSC, 1997 Commission Report, at 9. 22 USSC, 2002 Commission Report. 23 Id. at 93-103. 24 United States v. Booker, 543 U.S. 220 (2005). 25 United States v. Kimbrough, 552 U.S. 85 (2007); Spears v. United States, 555 U.S. 261 (2009). 26 Spears, 555 U.S. at 265-66. 27 USSG, App. C, amend. 706 (effective Nov. 1, 2007), as amended by amend. 711 (effective Nov. 1, 2007); Spears v. United States, 555 U.S. 261 (2009). 28 Id. 29 USSG, App. C, amend. 713 (effective March 3, 2008). Under 28 U.S.C. § 994(u), when the Commission reduces a guideline range, it is directed to specify whether, and in what circumstances, the reduction should apply to offenders who had been sentenced under the previous, higher version of the guideline. 30 U.S. Dept. of Justice, Attorney General John Ashcroft, Memorandum: Department Policy Concerning Charging Criminal Offenses, Disposition of Charges, and Sentencing (September 22, 2003).
40 Report to the Congress: Fair Sentencing Act of 2010
Endnotes

31 U.S. Dept. of Justice, Attorney General Eric Holder, Memorandum: Department Policy on Charging and Sentencing (May 19, 2010). 32 U.S. Dept. of Justice, Attorney General Eric Holder, Memorandum: Department Policy on Charging Mandatory Minimum Sentences and Recidivist Enhancements in Certain Drug Cases (August 12, 2013). 33 Fair Sentencing Act of 2010, Pub. L. No. 111–220 (Aug. 3, 2010).
34 Id. 35 USSG, App. C, amend. 750 (effective Nov. 1, 2011) (implementing as permanent the temporary, emergency amendment (USSG, App. C, amend. 748 (effective Nov. 1, 2010)) that implemented the FSA); USSG, App. C, Amend. 759 (effective Nov. 1, 2011).
36 U.S. Dept. of Justice, Attorney General Eric Holder, Memorandum: Application of the Statutory Mandatory Minimum Sentencing Laws for Crack Cocaine Offenses Amended by the Fair Sentencing Act of 2010 (July 15, 2011). 37 Dorsey v. United States, 132 S. Ct. 2321, 2335 (2013). 38 USSG, App. C, amend. 782 (effective Nov. 1, 2014) (reducing drug trafficking offense penalties across all drug types); USSG, App. C., Amend. 788 (effective Nov. 1, 2014) (making the 2-level reduction for all drug types retroactive with the proviso that no offender may be released before November 1, 2015).
39 Fair Sentencing Act of 2010, Pub. L. No. 111–220 (Aug. 3, 2010). 40 Id. 41 USSG, App. C, amend. 750 (effective Nov. 1, 2011) (implementing as permanent the temporary, emergency amendment (USSG, App. C, amend 748 (effective Nov. 1, 2010)) that implemented the FSA). 42 Id. 43 Id. 44 USSC, Recidivism Among Offenders Receiving Retroactive Sentence Reductions (May 2014), available at: http://www.ussc.gov/sites/default/files/pdf/research-and-publications/research-projects-and-surveys/miscellaneous/20140527_Recidivism_2007_Crack_Cocaine_Amendment.pdf.
45 USSG, App. C, amend. 706 (effective Nov. 1, 2007), as amended by amend. 711 (effective Nov. 1, 2007). 46 United States v. Kimbrough, 552 U.S. 85 (2007); Spears v. United States, 555 U.S. 261 (2009). 47 See Appendix Figure 1B. 48 See, e.g., 21 U.S.C. §§ 841 et seq. and 960 et seq. 49 USSG, §2D1.1(a)(5) (2014).
50 USSG, §3B1.1 (Aggravating Role) (effective Nov. 1, 2014). The FSA directed the Commission to amend the guidelines to increase sentences for these offenders when certain other offense conduct is present; for further discussion, see Section Five of this report. 51 Id. 52 USSG, §3B1.1, Cmt. n. 4 (2014). 53 USSG, §3B1.1, Cmt. n. 4 (2014). 54 USSG, §3B1.2 (Mitigating Role) (effective Nov. 1, 2014). The FSA directed the Commission to amend the guidelines to decrease sentences for these offenders when certain other offense conduct is present; for further discussion, see Section Five of this report. 55 Id. 56 USSG, §3B1.2, Cmt. n. 4 (2014). 57 USSG, §3B1.2, Cmt. n. 5 (2014). 58 USSG, §4A1.1 (Criminal History Category) (2014). 59 Id. 60 USSG, §1B1.1 (Application Instructions) (2014). 61 USSG, §4B1.1 (Career Offender) (2014). 62 Id.
41 Report to the Congress: Fair Sentencing Act of 2010
Endnotes

63 Id.; see also 28 U.S.C. 994(h) (directing that the guideline range for a career offender be at or near the statutory maximum). 64 USSG, §5C1.2 (Limitation on Applicability of Statutory Minimum Sentences in Certain Cases) (2014). 65 USSG, §2D1.1(b)(17) (2014). 66 FSA, at section 2 (entitled “Cocaine Sentencing Disparity Reduction). 67 USSG, App. C, amend. 750 (effective Nov. 1, 2011) (implementing as permanent the temporary, emergency amendment (USSG, App. C, amend. 748 (effective Nov. 1, 2010)) that implemented the FSA). 68 The methodology for this analysis is based on the Commission’s Prison Impact Model, which has been in use in some form since the guidelines were first developed. This model is used to estimate the impact of statutory and guideline amendments on federal offenders
and to project the future impact those amendments will have on bed space in the BOP. For this analysis, those offenders who appear to have received a lower sentence as a result of the FSA were hypothetically “resentenced” with the computer program as if the statutory and guideline changes resulting from the FSA had not been In effect. A new release date for each offender also was calculated in order to determine when the offender would be eligible for release if he or she were to receive the full reduction in sentence provided by the amendment. 69 In 2002, the name of the survey was changed from the National Household Survey on Drug Abuse (NHSDA). 70 Department of Health and Human Services, Substance Abuse and Mental Health Services, Results from the 2013 National Survey on Drug Use and Health Summary of Findings (NSDUH). Available at: http://www.samhsa.gov/data/sites/default/fil
es/NSDUHresultsPDFWHTML2013/Web/NSDUHresults2013.pdf. 71 Pub. L. No. 100–690 (1988). 72 USSG, §2D1.1(b)(2) (2014). 73 USSG, §2D1.1(b)(11) (2014). 74 USSG, §2D1.1(b)(12) (2014). 75 USSG, §3B1.1 (2014). 76 USSG, §2D1.1(b)(15) (2014). 77 USSG, §2D1.1(b)(15) (2014). 78 USSG, §2D1.1(b)(15) (2014). 79 USSG, §3B1.2 (2014). 80 USSG, §2D1.1(a)(5) (2014). 81 USSG, §2D1.1(b)(16) (2014).
42 Report to the Congress: Fair Sentencing Act of 2010
Endnotes

Report to the Congress: Fair Sentencing Act of 2010 43
Appendix

Number
0
500
1,000
1,500
2,000
2,500
3,000
3,500
4,000
4,500
5,000
5,500
6,000
6,500
7,000
7,500
Fiscal Year
1992 1993 1994 1995 1996 1997 1998 1999 2000 2001 2002 2003 2004 2005 2006 2007 2008 2009 2010 2011 2012 2013 2014
Crack-2 FSA
Figure 1A.Number of Powder Cocaine and Crack Cocaine Trafficking Offenders
Only offenders sentenced with complete guideline application information under USSG §§2D1.1 (Drug Trafficking), 2D1.2 (Protected Locations), 2D1.5 (Continuing Criminal Enterprise), 2D1.6 (Use of a Communication Facility), 2D1.8 (Rent/Manage Drug Establishment), 2D1.10 (Endangering Human Life), or 2D1.14 (Narco-Terrorism) with a primary drug type of powder or crack cocaine were included in this analysis.
SOURCE: U.S. Sentencing Commission, FSA Datafiles.
Fiscal Years 1992-2014
Crack Cocaine Powder Cocaine
Appendix
A-1

Figure 1B.Number of Drug Trafficking Offenders by Primary Drug Type
Fiscal Years 1992-2014
Fiscal Year Powder Cocaine Crack Cocaine Heroin Marijuana Methamphetamine Other Drug 1992 5,874 2,124 1,040 3,391 663 493 1993 5,351 3,194 1,400 3,963 725 529 1994 4,616 3,351 1,308 4,080 877 507 1995 3,900 3,506 1,192 3,418 1,025 267 1996 4,020 4,301 1,532 3,715 1,471 395 1997 4,311 4,328 1,589 4,699 1,804 456 1998 4,407 4,523 1,607 5,634 2,153 357 1999 4,595 4,816 1,611 6,441 2,675 500 2000 4,960 4,661 1,647 6,801 3,063 483 2001 4,891 4,599 1,590 7,440 3,177 670 2002 5,112 4,560 1,535 6,715 3,634 1,141 2003 5,426 5,022 1,589 5,594 4,130 1,299 2004 4,939 4,482 1,544 5,675 4,321 897 2005 5,174 4,965 1,526 5,604 4,521 929 2006 5,495 5,337 1,451 5,903 5,071 833 2007 5,949 5,230 1,278 5,847 4,812 834 2008 5,664 5,818 1,401 6,056 4,127 1,014 2009 5,782 5,473 1,551 5,904 3,947 1,193 2010 5,539 4,730 1,554 6,081 4,137 1,401 2011 5,895 4,229 1,765 6,762 4,423 1,476 2012 5,950 3,409 2,135 6,792 4,756 1,521 2013 5,358 2,912 2,168 4,768 5,333 1,676 2014 4,795 2,366 2,347 3,822 6,043 1,723
Only offenders sentenced with complete guideline application information under USSG §§2D1.1 (Drug Trafficking), 2D1.2 (Protected Locations), 2D1.5 (Continuing Criminal Enterprise), 2D1.6 (Use of a Communication Facility), 2D1.8 (Rent/Manage Drug Establishment), 2D1.10 (Endangering Human Life), or 2D1.14 (Narco-Terrorism) were included in this analysis.
SOURCE: U.S. Sentencing Commission, FSA Datafiles.
Appendix
A-2

AVERAGE AGE
GUILTY PLEA
RACE/ETHNICITY
White
Black
Hispanic
Other
GENDER
Male
Female
CITIZENSHIP
U.S. Citizen
Non-U.S. Citizen
97.3 97.8
2.7 2.2
Only offenders sentenced with complete guideline application under USSG §§2D1.1 (Drug Trafficking), 2D1.2 (Protected Locations), 2D1.5 (Continuing Criminal Enterprise),
2D1.6 (Use of a Communication Facility), 2D1.8 (Rent/Manage Drug Establishment), 2D1.10 (Endangering Human Life), or 2D1.14 (Narco-Terrorism) with a primary drug
type of crack cocaine were included in this analysis. Offenders missing information on a given analysis were excluded from that analysis.
1.1 1.5
91.6 90.2
8.4 9.8
7.3 6.5
78.7 83.4
13.0 8.6
32 34
% %
95.2 95.8
FY10 FY14
Figure 2.Selected Characteristics of Crack Cocaine Trafficking Offenders
Fiscal Years 2010 and 2014
Crack Cocaine
SOURCE: U.S. Sentencing Commission, FSA Datafiles.
Appendix
A-3

Fiscal Year 2010Fiscal Year 2014
Figure 3A.Districts with Crack Cocaine as the Primary Drug Type
Fiscal Years 2010 and 2014
Only offenders sentenced with complete guideline application information under USSG §§2D1.1 (Drug Trafficking), 2D1.2 (Protected Locations), 2D1.5 (Continuing Criminal Enterprise), 2D1.6 (Use of a Communication Facility), 2D1.8 (Rent/Manage Drug Establishment), 2D1.10 (Endangering Human Life), or 2D1.14 (Narco-Terrorism) were included in this analysis. Ties were assigned to a single primary drug type based on the following prioritization: Crack Cocaine, Powder Cocaine, Methamphetamine, Heroin, Marijuana, Other.
SOURCE: U.S. Sentencing Commission, FSA Datafiles.
Appendix
A-4

Figure 3B.Districts with Crack Cocaine as the Primary Drug Type
Fiscal Year 2010
Only offenders sentenced with complete guideline application information under USSG §§2D1.1 (Drug Trafficking), 2D1.2 (Protected Locations), 2D1.5 (Continuing Criminal Enterprise), 2D1.6 (Use of a Communication Facility), 2D1.8 (Rent/Manage Drug Establishment), 2D1.10 (Endangering Human Life), or 2D1.14 (Narco-Terrorism) were included in this analysis. Ties were assigned to a single primary drug type based on the following prioritization: Crack Cocaine, Powder Cocaine, Methamphetamine, Heroin, Marijuana, Other.
SOURCE: U.S. Sentencing Commission, FSA Datafiles.
Fiscal Year District
Number of
Crack Offenders
Total Number
of Drug
Offenders Percent 2010 Vermont 23 56 41.1 2010 Illinois, Southern 60 142 42.3 2010 North Carolina, Western 93 210 44.3 2010 Pennsylvania, Middle 82 184 44.6 2010 Wisconsin, Western 37 83 44.6 2010 North Carolina, Middle 86 176 48.9 2010 South Carolina 243 494 49.2 2010 Louisiana, Eastern 63 127 49.6 2010 Georgia, Middle 51 102 50.0 2010 North Carolina, Eastern 144 279 51.6 2010 Pennsylvania, Western 96 185 51.9 2010 Mississippi, Northern 28 53 52.8 2010 West Virginia, Southern 59 111 53.2 2010 Louisiana, Middle 23 43 53.5 2010 West Virginia, Northern 72 130 55.4 2010 Illinois, Central 98 175 56.0 2010 Puerto Rico 275 483 56.9
Fiscal Year District
Number of
Crack Offenders
Total Number
of Drug
Offenders Percent 2010 Kentucky, Western 42 176 23.9 2010 Michigan, Eastern 56 226 24.8 2010 Virginia, Western 55 204 27.0 2010 Florida, Northern 37 136 27.2 2010 Tennessee, Western 61 219 27.9 2010 Alabama, Northern 31 108 28.7 2010 New York, Western 67 221 30.3 2010 Wisconsin, Eastern 69 213 32.4 2010 Missouri, Eastern 101 311 32.5 2010 New Hampshire 30 92 32.6 2010 Pennsylvania, Eastern 102 311 32.8 2010 Indiana, Northern 53 161 32.9 2010 Michigan, Western 49 141 34.8 2010 Virginia, Eastern 161 426 37.8 2010 Mississippi, Southern 34 90 37.8 2010 Georgia, Southern 84 222 37.8 2010 Massachusetts 68 175 38.9 2010 Louisiana, Western 53 134 39.6 2010 Alaska 22 55 40.0
Appendix
A-5

Figure 3C.Districts with Crack Cocaine as the Primary Drug Type
Fiscal Year 2014
Only offenders sentenced with complete guideline application information under USSG §§2D1.1 (Drug Trafficking), 2D1.2 (Protected Locations), 2D1.5 (Continuing Criminal Enterprise), 2D1.6 (Use of a Communication Facility), 2D1.8 (Rent/Manage Drug Establishment), 2D1.10 (Endangering Human Life), or 2D1.14 (Narco-Terrorism) were included in this analysis. Ties were assigned to a single primary drug type based on the following prioritization: Crack Cocaine, Powder Cocaine, Methamphetamine, Heroin, Marijuana, Other.
SOURCE: U.S. Sentencing Commission, FSA Datafiles.
Fiscal Year District
Number of
Crack Offenders
Total Number
of Drug
Offenders Percent 2014 Massachusetts 35 151 23.2 2014 New York, Southern 173 583 29.7 2014 West Virginia, Northern 56 166 33.7 2014 North Carolina, Eastern 81 231 35.1 2014 Louisiana, Eastern 41 115 35.7 2014 Alabama, Middle 16 43 37.2 2014 Vermont 44 113 38.9 2014 Georgia, Middle 59 147 40.1 2014 Mississippi, Northern 33 77 42.9
Appendix
A-6

Figure 4A.Median Drug Weight in Crack Cocaine Trafficking Offenses
Fiscal Years 2005-2013
56.7
50.252.8 51.0
55.0
60.6
69.8
78.7
70.0
Weight (grams)
0
10
20
30
40
50
60
70
80
90
100
Fiscal Year
2005 2006 2007 2008 2009 2010 2011 2012 2013
Only offenders sentenced with complete guideline application information under USSG §§2D1.1 (Drug Trafficking), 2D1.2 (Protected Locations), 2D1.5 (Continuing Criminal Enterprise), 2D1.6 (Use of a Communication Facility), 2D1.8 (Rent/Manage Drug Establishment), 2D1.10 (Endangering Human Life), or 2D1.14 (Narco-Terrorism) with a primary drug type of crack cocaine were included in this analysis. Offenders with missing information on the exact weight of crack cocaine involved in the offense (including offenders with a range of weights) were excluded from the drug weight analysis.
SOURCE: U.S. Sentencing Commission, FSA Datafiles.
Appendix
A-7

Figure 4B.Median Drug Weight in Crack Cocaine Trafficking Offenses
Fiscal Years 2005-2013
Fiscal Year
Total Number
of Offenders
Number of
Offenders Missing Weight
Number of
Offenders in
Weight Analysis
Median Crack Weight
(in grams)
2005 4,965 1,114 3,851 56.7
2006 5,337 945 4,392 50.2
2007 5,230 882 4,348 52.8
2008 5,818 1,117 4,701 51.0
2009 5,473 907 4,566 55.0
2010 4,730 919 3,811 60.6
2011 4,229 684 3,545 69.8
2012 3,409 643 2,766 78.7
2013 2,912 678 2,234 70.0
Only offenders sentenced with complete guideline application information under USSG §§2D1.1 (Drug Trafficking), 2D1.2 (Protected Locations), 2D1.5 (Continuing Criminal Enterprise), 2D1.6 (Use of a Communication Facility), 2D1.8 (Rent/Manage Drug Establishment), 2D1.10 (Endangering Human Life), or 2D1.14 (Narco-Terrorism) with a primary drug type of crack cocaine were included in this analysis. Offenders with missing information on the exact weight of crack cocaine involved in the offense (including offenders with a range of weights) were excluded from the drug weight analysis.
SOURCE: U.S. Sentencing Commission, FSA Datafiles.
Appendix
A-8

Figure 5A.Median Base Offense Level in Crack Cocaine Trafficking Offenses
Fiscal Years 2005-2013
32 32 32
30 30 30
26 26 26
BOL
0
2
4
6
8
10
12
14
16
18
20
22
24
26
28
30
32
34
36
38
Fiscal Year
2005 2006 2007 2008 2009 2010 2011 2012 2013
Only offenders sentenced with complete guideline application information under USSG §§2D1.1 (Drug Trafficking), 2D1.2 (Protected Locations), 2D1.5 (Continuing Criminal Enterprise), 2D1.6 (Use of a Communication Facility), 2D1.8 (Rent/Manage Drug Establishment), 2D1.10 (Endangering Human Life), or 2D1.14 (Narco-Terrorism) with a primary drug type of crack cocaine were included in this analysis. Base Offense Level values reflect the BOL from the Drug Quantity Table (DQT) at USSG §2D1.1 prior to the application of the mitigating role cap or any adjustments under other guideline provisions. Offenders with BOLs determined by guideline provisions without reference to the DQT (e.g., §2D1.1(a)(1), §2D1.2(a)(4)) and offenders missing information required to determine the BOL prior to the application of the mitigating role cap were excluded from the median base offense level computation.
SOURCE: U.S. Sentencing Commission, FSA Datafiles.
Appendix
A-9
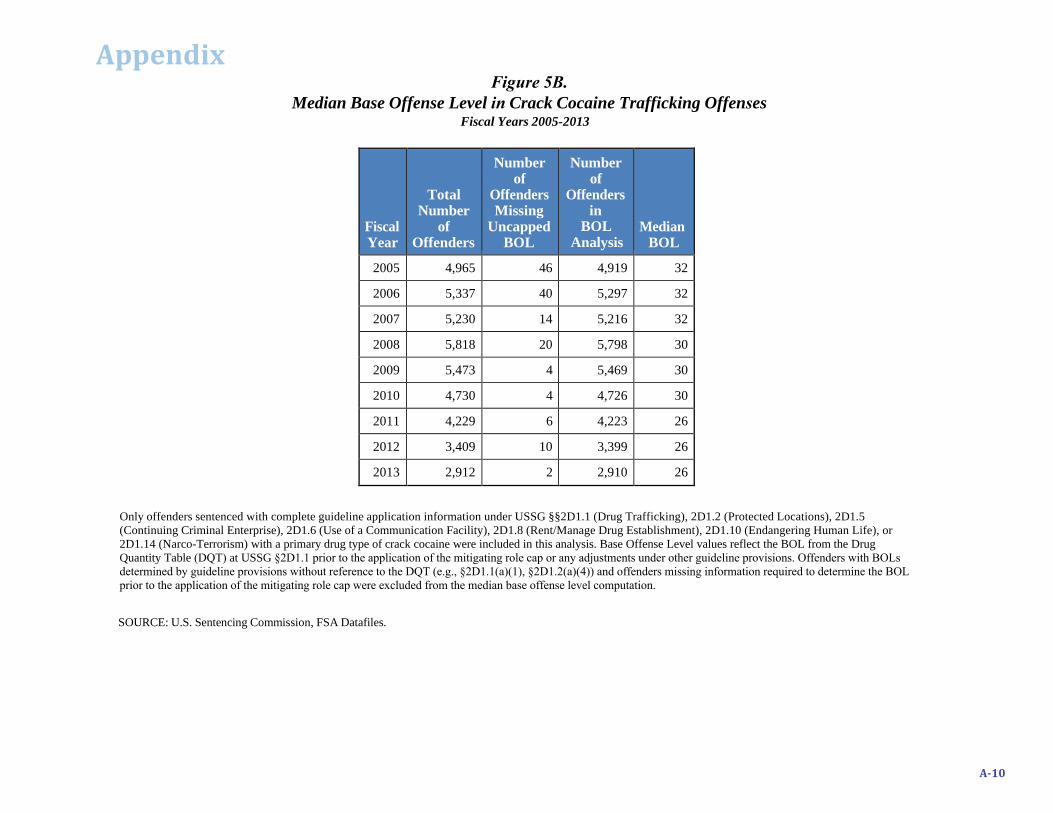
Figure 5B.Median Base Offense Level in Crack Cocaine Trafficking Offenses
Fiscal Years 2005-2013
Fiscal Year
Total Number
of Offenders
Number of
Offenders Missing
Uncapped BOL
Number of
Offenders in
BOL Analysis
Median BOL
2005 4,965 46 4,919 32
2006 5,337 40 5,297 32
2007 5,230 14 5,216 32
2008 5,818 20 5,798 30
2009 5,473 4 5,469 30
2010 4,730 4 4,726 30
2011 4,229 6 4,223 26
2012 3,409 10 3,399 26
2013 2,912 2 2,910 26
SOURCE: U.S. Sentencing Commission, FSA Datafiles.
Only offenders sentenced with complete guideline application information under USSG §§2D1.1 (Drug Trafficking), 2D1.2 (Protected Locations), 2D1.5 (Continuing Criminal Enterprise), 2D1.6 (Use of a Communication Facility), 2D1.8 (Rent/Manage Drug Establishment), 2D1.10 (Endangering Human Life), or 2D1.14 (Narco-Terrorism) with a primary drug type of crack cocaine were included in this analysis. Base Offense Level values reflect the BOL from the Drug Quantity Table (DQT) at USSG §2D1.1 prior to the application of the mitigating role cap or any adjustments under other guideline provisions. Offenders with BOLs determined by guideline provisions without reference to the DQT (e.g., §2D1.1(a)(1), §2D1.2(a)(4)) and offenders missing information required to determine the BOL prior to the application of the mitigating role cap were excluded from the median base offense level computation.
Appendix
A-10

Figure 6A.Most Serious Function of Crack Cocaine Trafficking Offenders
Select Fiscal Year Samples
2000 2005 2009 2013
4.96.8
4.1 3.60.0 1.6
6.69.6
12.7
22.7
27.9 26.5
4.92.0 1.2 1.3
64.5
55.4
47.0 47.6
13.0 11.6 13.211.4
Percent
0.0
10.0
20.0
30.0
40.0
50.0
60.0
70.0
80.0
90.0
100.0
HLS_Org/Lead Manufacturer Wholesaler Mgr/Sup SLD Low Level
For the Fiscal Year 2000, 2009, and 2013 Samples, only offenders sentenced with complete guideline application information under USSG §§2D1.1 (Drug Trafficking), 2D1.2 (Protected Locations), 2D1.5 (Continuing Criminal Enterprise), 2D1.6 (Use of a Communication Facility), 2D1.8 (Rent/Manage Drug Establishment), 2D1.10 (Endangering Human Life), or 2D1.14 (Narco-Terrorism) with a primary drug type of crack cocaine were included in this analysis. For the Fiscal Year 2005 Sample, only offenders sentenced under USSG §2D1.1 (Drug Trafficking) with a primary drug type of crack cocaine were included in the analysis. Cases missing information on most serious offender function were excluded from the analysis. The ‘Low Level Functions’ category includes offenders classified as: financier/money launderer, pilot/captain, bodyguard/strongman/debt collector, chemist/cook/chemical supplier, broker/go-between, courier, mule, renter/storer, money runner, off loader/loader, gopher/lookout/deckhand/employee, enabler, user only or “other” function.
SOURCE: U.S. Sentencing Commission, FSA Datafiles.
Appendix
A-11

Most Serious Fiscal Most Serious FiscalOffender Function Year N Percent Offender Function Year N Percent
Importer/High-Level Supplier 2000 4 0.4 Manager 2000 27 2.92005 21 1.8 2005 17 1.52009 4 0.5 2009 6 0.72013 0 0.0 2013 7 1.0
Organizer/Leader 2000 41 4.5 2000 10 1.12005 58 5.0 2005 6 0.52009 30 3.6 2009 4 0.52013 26 3.6 2013 5 0.7
Manufacturer 2000 0 0.0 Chemist/Cook/Chemical 2000 25 2.72005 18 1.6 2005 28 2.42009 54 6.6 2009 11 1.32013 69 9.6 2013 5 0.7
Financier/Money Launderer 2000 1 0.1 Supervisor 2000 18 2.02005 0 0.0 2005 6 0.52009 1 0.1 2009 4 0.52013 1 0.1 2013 2 0.3
Pilot/Captain 2000 0 n/a Street Level Dealer 2000 592 64.52005 0 n/a 2005 643 55.42009 0 n/a 2009 387 47.02013 0 n/a 2013 343 47.6
Wholesaler 2000 117 12.7 Broker/Go-Between 2000 23 2.52005 263 22.7 2005 29 2.52009 230 27.9 2009 26 3.22013 191 26.5 2013 27 3.8
Figure 6B.Most Serious Function of Crack Cocaine Trafficking Offenders
Select Fiscal Year Samples
Bodyguard/Strongman/ Debt Collector
Appendix
A-12

Most Serious Fiscal Most Serious FiscalOffender Function Year N Percent Offender Function Year N Percent
Courier 2000 20 2.2 Enabler 2000 5 0.52005 15 1.3 2005 4 0.32009 21 2.5 2009 4 0.52013 7 1.0 2013 1 0.1
Mule 2000 3 0.3 User Only 2000 2 0.22005 1 0.1 2005 8 0.72009 2 0.2 2009 1 0.12013 0 0.0 2013 0 0.0
Renter/Storer 2000 8 0.9 Other 2000 0 0.02005 7 0.6 2005 0 0.02009 12 1.5 2009 2 0.22013 9 1.3 2013 2 0.3
Money Runner 2000 6 0.72005 7 0.62009 1 0.12013 0 0.0
Off Loader/Loader 2000 0 0.02005 1 0.12009 0 0.02013 0 0.0
Gopher/Lookout/Deckhand/Employee
2000 16 1.72005 28 2.42009 24 2.92013 25 3.5
Figure 6B. (continued)Most Serious Function of Crack Cocaine Trafficking Offenders
Select Fiscal Year Samples
SOURCE: U.S. Sentencing Commission, FSA Datafiles.
For the Fiscal Year 2000, 2009, and 2013 Samples, only offenders sentenced with complete guideline application information under USSG §§2D1.1 (Drug Trafficking), 2D1.2 (Protected Locations), 2D1.5 (Continuing Criminal Enterprise), 2D1.6 (Use of a Communication Facility), 2D1.8 (Rent/Manage Drug Establishment), 2D1.10 (Endangering Human Life), or 2D1.14 (Narco-Terrorism) with a primary drug type of crack cocaine were included in this analysis. For the Fiscal Year 2005 Sample, only offenders sentenced under USSG §2D1.1 (Drug Trafficking) with a primary drug type of crack cocaine were included in the analysis. Cases missing information on most serious offender function were excluded from the analysis. The ‘Low Level Functions’ category includes offenders classified as: financier/money launderer, pilot/captain, bodyguard/strongman/debt collector, chemist/cook/chemical supplier, broker/go-between, courier, mule, renter/storer, money runner, off loader/loader, gopher/lookout/deckhand/employee, enabler, user only or “other” function. The sum of the individual function categories may not equal the percentages reported on Figure 6A due to rounding.
Appendix
A-13

Figure 6C.Drug Offender Function Codes
Special Coding Project, Select Fiscal Year Samples
The function codes are listed in descending order from most serious to least serious.
1 = Importer/High Level Supplier (Imports or otherwise supplies large quantities of drugs (1 kilogram or more); is near the top of the distribution chain; has ownership interest in drugs (not merely transporting drugs for another individual); usually supplies drugs to other drug distributors and generally does not deal in retail amounts; may employ no or very few subordinates.)
2 = Organizer/Leader (Organizes, leads, directs, or otherwise runs a drug distribution organization; has the largest share of the profits and the most decision-making authority.)
3 = Grower/Manufacturer (Grows, cultivates, or manufactures a controlled substance, and is the principal owner of the drugs.)
4 = Financier/Money Launderer (Provides money for purchase, importation, manufacture, cultivation, transportation, or distribution of drugs; launders proceeds of drugs sales or purchases. Not an individual who merely transports money for the organization.)
5 = Aircraft Pilot/Vessel Captain (Pilots vessel or aircraft; requires special skill; does not include offender who is only participant directing a small boat (e.g., a go-fast boat) onto which drugs had been loaded from a “mother ship” (such person is a courier).)
6 = Wholesaler (Sells more than retail/user-level quantities in a single transaction; sells at least 1 ounce (28 grams) but less than 1 kilogram at one time, possesses or buys at least 2 ounces (56 grams) at one time, sells any amount to another dealer.)
7 = Manager (Serves as a lieutenant to assist one of the above; manages all or a significant portion of a drug manufacturing, importation, or distribution operation; takes instructions from one of the above and conveys to subordinates; supervises directly at least one other co-participant in an organization of at least five co-participants.)
Appendix
A-14
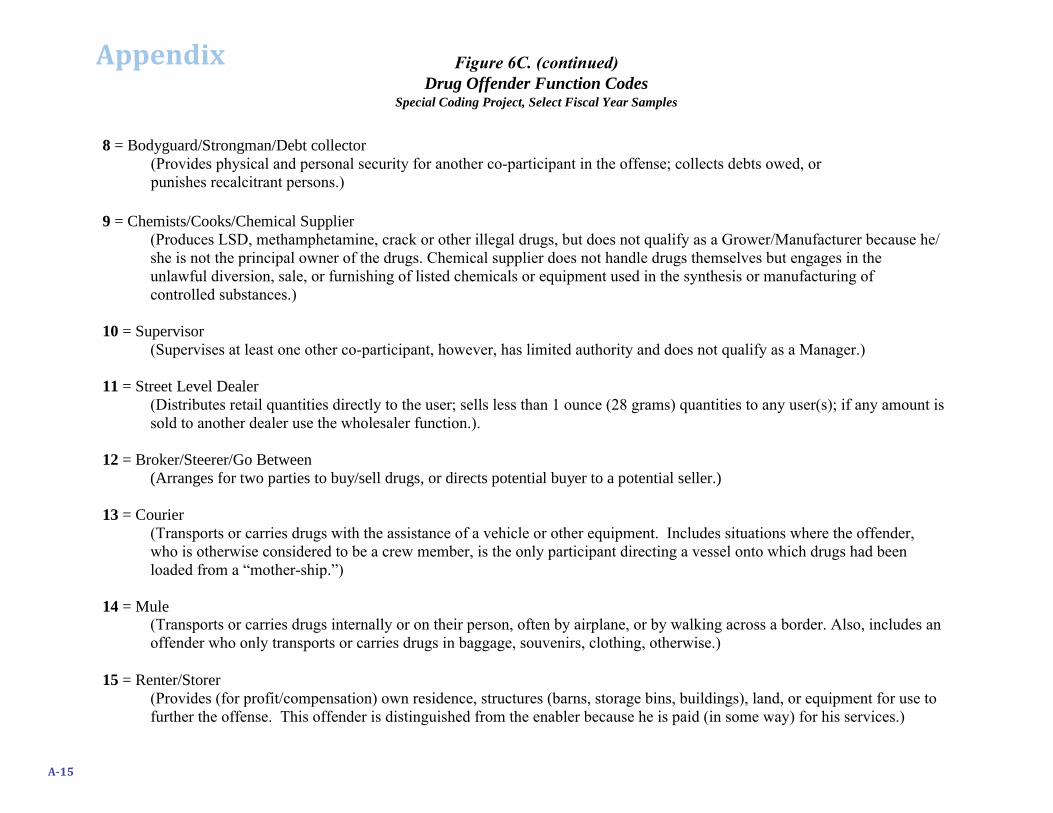
8 = Bodyguard/Strongman/Debt collector (Provides physical and personal security for another co-participant in the offense; collects debts owed, or punishes recalcitrant persons.)
9 = Chemists/Cooks/Chemical Supplier (Produces LSD, methamphetamine, crack or other illegal drugs, but does not qualify as a Grower/Manufacturer because he/she is not the principal owner of the drugs. Chemical supplier does not handle drugs themselves but engages in the unlawful diversion, sale, or furnishing of listed chemicals or equipment used in the synthesis or manufacturing of controlled substances.)
10 = Supervisor (Supervises at least one other co-participant, however, has limited authority and does not qualify as a Manager.)
11 = Street Level Dealer (Distributes retail quantities directly to the user; sells less than 1 ounce (28 grams) quantities to any user(s); if any amount is sold to another dealer use the wholesaler function.).
12 = Broker/Steerer/Go Between (Arranges for two parties to buy/sell drugs, or directs potential buyer to a potential seller.)
13 = Courier (Transports or carries drugs with the assistance of a vehicle or other equipment. Includes situations where the offender, who is otherwise considered to be a crew member, is the only participant directing a vessel onto which drugs had been loaded from a “mother-ship.”)
14 = Mule (Transports or carries drugs internally or on their person, often by airplane, or by walking across a border. Also, includes an offender who only transports or carries drugs in baggage, souvenirs, clothing, otherwise.)
15 = Renter/Storer (Provides (for profit/compensation) own residence, structures (barns, storage bins, buildings), land, or equipment for use to further the offense. This offender is distinguished from the enabler because he is paid (in some way) for his services.)
Appendix
A-15
Figure 6C. (continued)Drug Offender Function Codes
Special Coding Project, Select Fiscal Year Samples

16 = Money Runner (Transports/carries money and/or drugs to and from the street-level dealer.)
17 = Off Loader/Loader (Performs the physical labor required to put large quantities of drugs into storage, hiding, or onto some mode of transportation.)
18 = Gopher/Lookout/Deckhand/Worker/Employee (Performs very limited, low-level function in the offense (whether or not ongoing); includes running errands, answering the telephone, receiving packages, packaging the drugs, manual labor, acting as a lookout to provide early warnings during meetings, exchanges, or off-loading, or acting as a deckhand/crew member on vessel or aircraft used to transport large quantities of drugs.)
19 = Enabler (Passive) (Plays no more than passive role in the offense, knowingly permitting certain unlawful criminal activity to take place without affirmatively acting in any way to further such activity; may be coerced or unduly influenced to play such a function (e.g. a parent or grandparent threatened with displacement from a home unless they permit the activity to take place), or may do so as a “favor” (without compensation).)
20 = User Only (Possesses small amount of drugs apparently for personal use only; no apparent function in any conspiratorial criminal activity.)
77 = Other (specify) (Use this code if none of the codes above adequately describe the function of the offender. Provide a short description detailing the activities, responsibilities, or function of the offender.) Example: The police use an undercover agent to arrest offenders for participating in a larger conspiracy of planning to rob an individual who they believe is a high level drug importer. The offenders are all apprehended in the midst of approaching the house and there is no mention as to what they plan to do with the drugs once they stole them. There is no explanation as to how the police zeroed in on these defendants to begin with. These offenders could be coded as ‘Other’ with an explanation of ‘Drug Thief’ since they do not fit any other function definition.)
99 = Missing/Indeterminable
Appendix
A-16
Figure 6C. (continued)Drug Offender Function Codes
Special Coding Project, Select Fiscal Year Samples

Figure 7A.Rate of 18 U.S.C. § 924(c) and §2D1.1 Weapon SOC for Crack Cocaine Trafficking Offenders
Fiscal Years 2005-2013
29.227.2
29.927.5 28.8 27.7 25.9 26.8 28.6
Percent
0.0
10.0
20.0
30.0
40.0
50.0
60.0
70.0
80.0
90.0
100.0
Fiscal Year
2005 2006 2007 2008 2009 2010 2011 2012 2013
Only offenders sentenced with complete guideline application information under USSG §§2D1.1 (Drug Trafficking), 2D1.2 (Protected Locations), 2D1.5 (Continuing Criminal Enterprise), 2D1.6 (Use of a Communication Facility), 2D1.8 (Rent/Manage Drug Establishment), 2D1.10 (Endangering Human Life), or 2D1.14 (Narco-Terrorism) with a primary drug type of crack cocaine were included in this analysis. The analysis includes offenders with a conviction under 18 U.S.C. § 924(c) and/or the application of the weapon enhancement at USSG §2D1.1(b)(1). Offenders sentenced under guideline provisions without reference to USSG §2D1.1 and those with invalid values of USSG §2D1.1(b)(1) are missing information on the application of the weapon enhancement at USSG §2D1.1(b)(1).
SOURCE: U.S. Sentencing Commission, FSA Datafiles.
Appendix
A-17
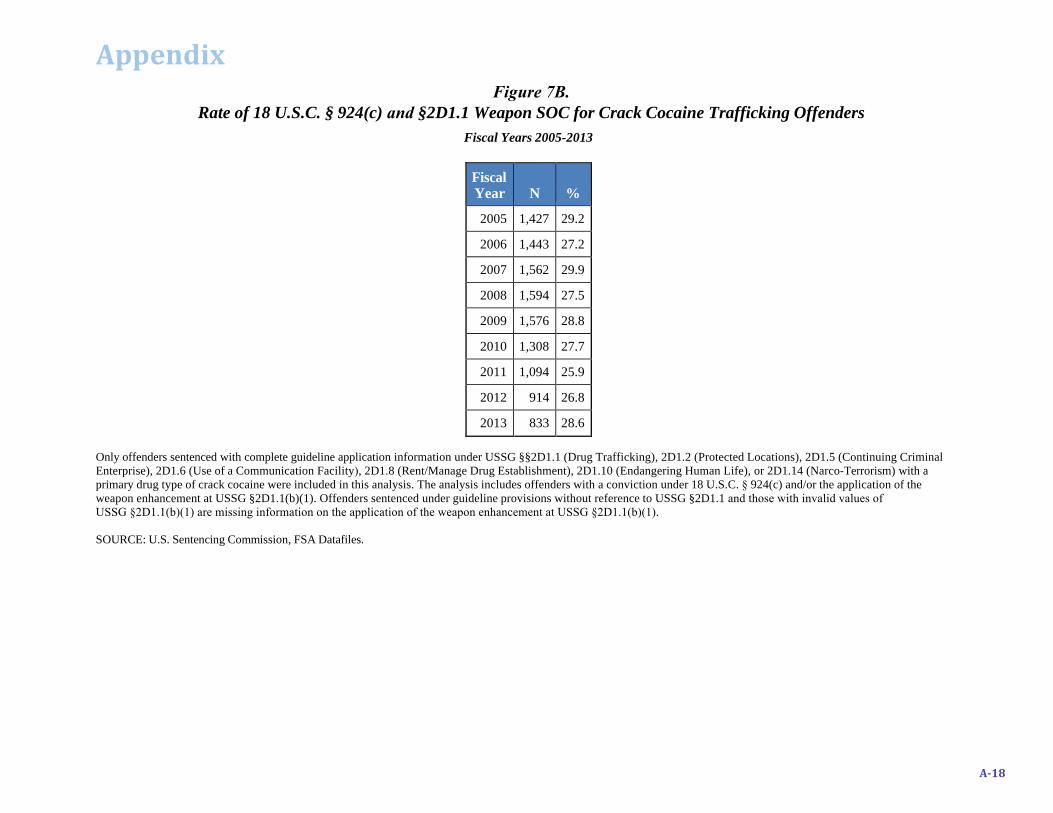
Figure 7B.Rate of 18 U.S.C. § 924(c) and §2D1.1 Weapon SOC for Crack Cocaine Trafficking Offenders
Fiscal Years 2005-2013
Fiscal Year N %
2005 1,427 29.2
2006 1,443 27.2
2007 1,562 29.9
2008 1,594 27.5
2009 1,576 28.8
2010 1,308 27.7
2011 1,094 25.9
2012 914 26.8
2013 833 28.6
Only offenders sentenced with complete guideline application information under USSG §§2D1.1 (Drug Trafficking), 2D1.2 (Protected Locations), 2D1.5 (Continuing Criminal Enterprise), 2D1.6 (Use of a Communication Facility), 2D1.8 (Rent/Manage Drug Establishment), 2D1.10 (Endangering Human Life), or 2D1.14 (Narco-Terrorism) with a primary drug type of crack cocaine were included in this analysis. The analysis includes offenders with a conviction under 18 U.S.C. § 924(c) and/or the application of the weapon enhancement at USSG §2D1.1(b)(1). Offenders sentenced under guideline provisions without reference to USSG §2D1.1 and those with invalid values of USSG §2D1.1(b)(1) are missing information on the application of the weapon enhancement at USSG §2D1.1(b)(1).
SOURCE: U.S. Sentencing Commission, FSA Datafiles.
Appendix
A-18
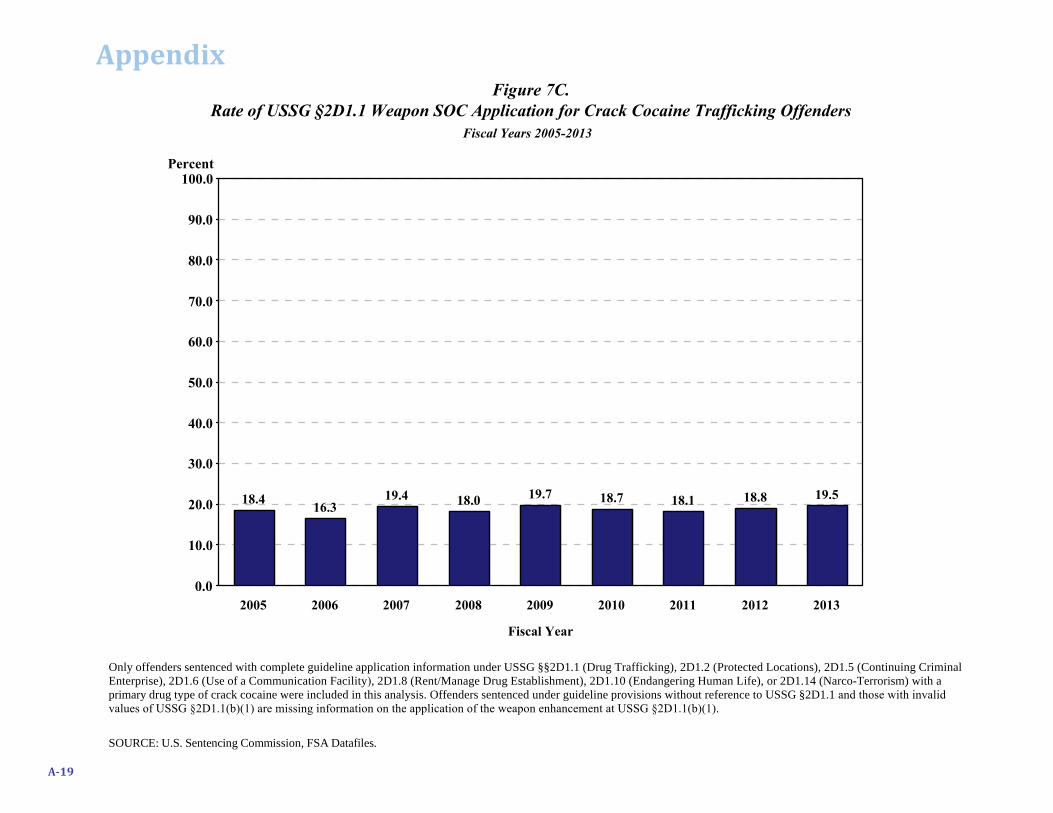
Figure 7C.Rate of USSG §2D1.1 Weapon SOC Application for Crack Cocaine Trafficking Offenders
Fiscal Years 2005-2013
18.416.3
19.4 18.0 19.7 18.7 18.1 18.8 19.5
Percent
0.0
10.0
20.0
30.0
40.0
50.0
60.0
70.0
80.0
90.0
100.0
Fiscal Year
2005 2006 2007 2008 2009 2010 2011 2012 2013
Only offenders sentenced with complete guideline application information under USSG §§2D1.1 (Drug Trafficking), 2D1.2 (Protected Locations), 2D1.5 (Continuing Criminal Enterprise), 2D1.6 (Use of a Communication Facility), 2D1.8 (Rent/Manage Drug Establishment), 2D1.10 (Endangering Human Life), or 2D1.14 (Narco-Terrorism) with a primary drug type of crack cocaine were included in this analysis. Offenders sentenced under guideline provisions without reference to USSG §2D1.1 and those with invalid values of USSG §2D1.1(b)(1) are missing information on the application of the weapon enhancement at USSG §2D1.1(b)(1).
SOURCE: U.S. Sentencing Commission, FSA Datafiles.
Appendix
A-19

Figure 7D. Rate of USSG §2D1.1 Weapon SOC Application for Crack Cocaine Trafficking Offenders
Fiscal Years 2005-2013
Fiscal Year N %
2005 897 18.4
2006 865 16.3
2007 1,013 19.4
2008 1,042 18.0
2009 1,080 19.7
2010 883 18.7
2011 764 18.1
2012 641 18.8
2013 568 19.5
Only offenders sentenced with complete guideline application information under USSG §§2D1.1 (Drug Trafficking), 2D1.2 (Protected Locations), 2D1.5 (Continuing Criminal Enterprise), 2D1.6 (Use of a Communication Facility), 2D1.8 (Rent/Manage Drug Establishment), 2D1.10 (Endangering Human Life), or 2D1.14 (Narco-Terrorism) with a primary drug type of crack cocaine were included in this analysis. Offenders sentenced under guideline provisions without reference to USSG §2D1.1 and those with invalid values of USSG §2D1.1(b)(1) are missing information on the application of the weapon enhancement at USSG §2D1.1(b)(1).
SOURCE: U.S. Sentencing Commission, FSA Datafiles.
Appendix
A-20

Figure 7E.Rate of 18 U.S.C. § 924(c) Application for Crack Cocaine Trafficking Offenders
Fiscal Years 2005-2013
10.8 11.0 10.7 9.6 9.1 9.1 8.0 8.3 9.2
Percent
0.0
10.0
20.0
30.0
40.0
50.0
60.0
70.0
80.0
90.0
100.0
Fiscal Year
2005 2006 2007 2008 2009 2010 2011 2012 2013
Only offenders sentenced with complete guideline application information under USSG §§2D1.1 (Drug Trafficking), 2D1.2 (Protected Locations), 2D1.5 (Continuing Criminal Enterprise), 2D1.6 (Use of a Communication Facility), 2D1.8 (Rent/Manage Drug Establishment), 2D1.10 (Endangering Human Life), or 2D1.14 (Narco-Terrorism) with a primary drug type of crack cocaine were included in this analysis.
SOURCE: U.S. Sentencing Commission, FSA Datafiles.
Appendix
A-21

Figure 7F.Rate of 18 U.S.C. § 924(c) Application for Crack Cocaine Trafficking Offenders
Fiscal Years 2005-2013
Fiscal Year N %
2005 537 10.8
2006 588 11.0
2007 557 10.7
2008 558 9.6
2009 499 9.1
2010 431 9.1
2011 339 8.0
2012 282 8.3
2013 269 9.2
Only offenders sentenced with complete guideline application information under USSG §§2D1.1 (Drug Trafficking), 2D1.2 (Protected Locations), 2D1.5 (Continuing Criminal Enterprise), 2D1.6 (Use of a Communication Facility), 2D1.8 (Rent/Manage Drug Establishment), 2D1.10 (Endangering Human Life), or 2D1.14 (Narco-Terrorism) with a primary drug type of crack cocaine were included in this analysis.
SOURCE: U.S. Sentencing Commission, FSA Datafiles.
Appendix
A-22

Figure 8A.Rate of Aggravating Role Application for Crack Cocaine Trafficking Offenders
Fiscal Years 2005-2013
5.6 4.5 4.8 4.7 5.0 5.6 5.4 6.0 6.9
Percent
0.0
10.0
20.0
30.0
40.0
50.0
60.0
70.0
80.0
90.0
100.0
Fiscal Year
2005 2006 2007 2008 2009 2010 2011 2012 2013
Only offenders sentenced with complete guideline application information under USSG §§2D1.1 (Drug Trafficking), 2D1.2 (Protected Locations), 2D1.5 (Continuing Criminal Enterprise), 2D1.6 (Use of a Communication Facility), 2D1.8 (Rent/Manage Drug Establishment), 2D1.10 (Endangering Human Life), or 2D1.14 (Narco-Terrorism) with a primary drug type of crack cocaine were included in this analysis. The analysis includes offenders with any positive value under USSG §3B1.1.
SOURCE: U.S. Sentencing Commission, FSA Datafiles.
Appendix
A-23

Figure 8B.Rate of Aggravating Role Application for Crack Cocaine Trafficking Offenders
Fiscal Years 2005-2013
Fiscal Year N %
2005 277 5.6
2006 241 4.5
2007 250 4.8
2008 272 4.7
2009 276 5.0
2010 266 5.6
2011 228 5.4
2012 206 6.0
2013 202 6.9
Only offenders sentenced with complete guideline application information under USSG §§2D1.1 (Drug Trafficking), 2D1.2 (Protected Locations), 2D1.5 (Continuing Criminal Enterprise), 2D1.6 (Use of a Communication Facility), 2D1.8 (Rent/Manage Drug Establishment), 2D1.10 (Endangering Human Life), or 2D1.14 (Narco-Terrorism) with a primary drug type of crack cocaine were included in this analysis. The analysis includes offenders with any positive value under USSG §3B1.1.
SOURCE: U.S. Sentencing Commission, FSA Datafiles.
Appendix
A-24

Figure 9A.Rate of Mitigating Role Application for Crack Cocaine Trafficking Offenders
Fiscal Years 2005-2013
6.6 6.7 6.0 5.8 5.7 4.4 3.9 5.2 4.5
Percent
0.0
10.0
20.0
30.0
40.0
50.0
60.0
70.0
80.0
90.0
100.0
Fiscal Year
2005 2006 2007 2008 2009 2010 2011 2012 2013
Only offenders sentenced with complete guideline application information under USSG §§2D1.1 (Drug Trafficking), 2D1.2 (Protected Locations), 2D1.5 (Continuing Criminal Enterprise), 2D1.6 (Use of a Communication Facility), 2D1.8 (Rent/Manage Drug Establishment), 2D1.10 (Endangering Human Life), or 2D1.14 (Narco-Terrorism) with a primary drug type of crack cocaine were included in this analysis. The analysis includes offenders with any negative value under USSG §3B1.2. In addition, offenders sentenced under USSG §2D1.8(a)(2) are included as receiving mitigating role.
SOURCE: U.S. Sentencing Commission, FSA Datafiles.
Appendix
A-25

Figure 9B.Rate of Mitigating Role Application for Crack Cocaine Trafficking Offenders
Fiscal Years 2005-2013
Fiscal Year N %
2005 329 6.6
2006 355 6.7
2007 313 6.0
2008 339 5.8
2009 311 5.7
2010 207 4.4
2011 164 3.9
2012 176 5.2
2013 130 4.5
Only offenders sentenced with complete guideline application information under USSG §§2D1.1 (Drug Trafficking), 2D1.2 (Protected Locations), 2D1.5 (Continuing Criminal Enterprise), 2D1.6 (Use of a Communication Facility), 2D1.8 (Rent/Manage Drug Establishment), 2D1.10 (Endangering Human Life), or 2D1.14 (Narco-Terrorism) with a primary drug type of crack cocaine were included in this analysis. The analysis includes offenders with any negative value under USSG §3B1.2. In addition, offenders sentenced under USSG §2D1.8(a)(2) are included as receiving mitigating role.
SOURCE: U.S. Sentencing Commission, FSA Datafiles.
Appendix
A-26

Figure 10A.Trend in Criminal History Category for Crack Cocaine Trafficking Offenders
Fiscal Years 2005-2013
Category I Category II Category III Category IV Category V Category VIPercent
0.0
10.0
20.0
30.0
40.0
50.0
60.0
70.0
80.0
90.0
100.0
Fiscal Year
2005 2006 2007 2008 2009 2010 2011 2012 2013
22.5
12.6
20.7
12.7
8.1
23.4
22.3
12.4
20.4
12.7
7.9
24.2
21.0
12.0
19.9
12.0
7.5
27.6
22.6
12.3
19.5
12.0
8.4
25.3
21.9
11.4
17.9
12.7
8.1
27.9
22.0
11.8
18.2
11.7
8.0
28.3
20.3
12.0
19.8
12.9
8.0
26.9
21.4
12.0
21.3
12.1
6.5
26.8
19.2
11.9
19.6
12.3
8.4
28.5
Only offenders sentenced with complete guideline application information under USSG §§2D1.1 (Drug Trafficking), 2D1.2 (Protected Locations), 2D1.5 (Continuing Criminal Enterprise), 2D1.6 (Use of a Communication Facility), 2D1.8 (Rent/Manage Drug Establishment), 2D1.10 (Endangering Human Life), or 2D1.14 (Narco-Terrorism) with a primary drug type of crack cocaine were included in this analysis.
SOURCE: U.S. Sentencing Commission, FSA Datafiles.
Appendix
A-27

Figure 10B.Trend in Criminal History Category for Crack Cocaine Trafficking Offenders
Fiscal Years 2005-2013
Fiscal Year
Number CHC I
Percent CHC I
Number CHC II
Percent CHC II
Number CHC
III
Percent CHC
III Number CHC IV
Percent CHC
IV Number CHC V
Percent CHC V
Number CHC VI
Percent CHC
VI
2005 1,116 22.5 624 12.6 1,027 20.7 632 12.7 404 8.1 1,161 23.4
2006 1,192 22.3 663 12.4 1,090 20.4 677 12.7 423 7.9 1,292 24.2
2007 1,099 21.0 625 12.0 1,041 19.9 630 12.0 394 7.5 1,441 27.6
2008 1,312 22.6 715 12.3 1,132 19.5 698 12.0 487 8.4 1,474 25.3
2009 1,200 21.9 625 11.4 982 17.9 697 12.7 442 8.1 1,527 27.9
2010 1,041 22.0 556 11.8 862 18.2 554 11.7 377 8.0 1,340 28.3
2011 858 20.3 507 12.0 839 19.8 547 12.9 339 8.0 1,139 26.9
2012 729 21.4 409 12.0 725 21.3 413 12.1 221 6.5 912 26.8
2013 559 19.2 346 11.9 572 19.6 358 12.3 246 8.4 831 28.5
Only offenders sentenced with complete guideline application information under USSG §§2D1.1 (Drug Trafficking), 2D1.2 (Protected Locations), 2D1.5 (Continuing Criminal Enterprise), 2D1.6 (Use of a Communication Facility), 2D1.8 (Rent/Manage Drug Establishment), 2D1.10 (Endangering Human Life), or 2D1.14 (Narco-Terrorism) with a primary drug type of crack cocaine were included in this analysis.
SOURCE: U.S. Sentencing Commission, FSA Datafiles.
Appendix
A-28

Figure 11A.Rate of Career Offender Application for Crack Cocaine Trafficking Offenders
Fiscal Years 2005-2013
14.9 15.017.9 16.7 17.7 19.4 18.5 18.8 20.2
Percent
0.0
10.0
20.0
30.0
40.0
50.0
60.0
70.0
80.0
90.0
100.0
Fiscal Year
2005 2006 2007 2008 2009 2010 2011 2012 2013
Only offenders sentenced with complete guideline application information under USSG §§2D1.1 (Drug Trafficking), 2D1.2 (Protected Locations), 2D1.5 (Continuing Criminal Enterprise), 2D1.6 (Use of a Communication Facility), 2D1.8 (Rent/Manage Drug Establishment), 2D1.10 (Endangering Human Life), or 2D1.14 (Narco-Terrorism) with a primary drug type of crack cocaine were included in this analysis. The analysis reflects the overall rate of career offender application under USSG §4B1.1 regardless of whether or not the application of career offender impacted the Final Offense Level or Criminal History Category.
SOURCE: U.S. Sentencing Commission, FSA Datafiles.
Appendix
A-29

Figure 11B.Rate of Career Offender Application for Crack Cocaine Trafficking Offenders
Fiscal Years 2005-2013
Fiscal Year N %
2005 739 14.9
2006 801 15.0
2007 936 17.9
2008 974 16.7
2009 967 17.7
2010 916 19.4
2011 782 18.5
2012 642 18.8
2013 589 20.2
Only offenders sentenced with complete guideline application information under USSG §§2D1.1 (Drug Trafficking), 2D1.2 (Protected Locations), 2D1.5 (Continuing Criminal Enterprise), 2D1.6 (Use of a Communication Facility), 2D1.8 (Rent/Manage Drug Establishment), 2D1.10 (Endangering Human Life), or 2D1.14 (Narco-Terrorism) with a primary drug type of crack cocaine were included in this analysis. The analysis reflects the overall rate of career offender application under USSG §4B1.1 regardless of whether or not the application of career offender impacted the Final Offense Level or Criminal History Category.
SOURCE: U.S. Sentencing Commission, FSA Datafiles.
Appendix
A-30
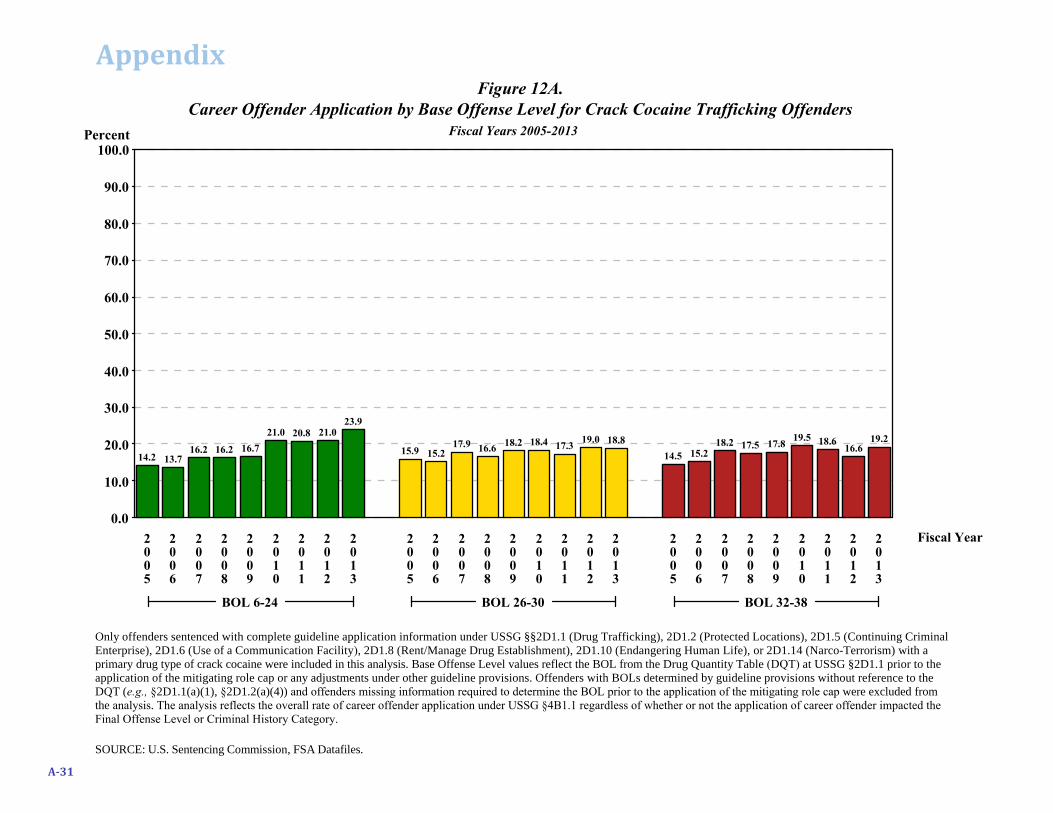
Figure 12A.Career Offender Application by Base Offense Level for Crack Cocaine Trafficking Offenders
Fiscal Years 2005-2013Percent
0.0
10.0
20.0
30.0
40.0
50.0
60.0
70.0
80.0
90.0
100.0
Fiscal Year
BOL 6-24 BOL 26-30 BOL 32-38
2005
2006
2007
2008
2009
2010
2011
2012
2013
2005
2006
2007
2008
2009
2010
2011
2012
2013
2005
2006
2007
2008
2009
2010
2011
2012
2013
14.2 13.716.2 16.2 16.7
21.0 20.8 21.023.9
15.9 15.217.9 16.6
18.2 18.4 17.319.0 18.8
14.5 15.218.2 17.5 17.8
19.5 18.616.6
19.2
Only offenders sentenced with complete guideline application information under USSG §§2D1.1 (Drug Trafficking), 2D1.2 (Protected Locations), 2D1.5 (Continuing Criminal Enterprise), 2D1.6 (Use of a Communication Facility), 2D1.8 (Rent/Manage Drug Establishment), 2D1.10 (Endangering Human Life), or 2D1.14 (Narco-Terrorism) with a primary drug type of crack cocaine were included in this analysis. Base Offense Level values reflect the BOL from the Drug Quantity Table (DQT) at USSG §2D1.1 prior to the application of the mitigating role cap or any adjustments under other guideline provisions. Offenders with BOLs determined by guideline provisions without reference to the DQT (e.g., §2D1.1(a)(1), §2D1.2(a)(4)) and offenders missing information required to determine the BOL prior to the application of the mitigating role cap were excluded from the analysis. The analysis reflects the overall rate of career offender application under USSG §4B1.1 regardless of whether or not the application of career offender impacted the Final Offense Level or Criminal History Category.
SOURCE: U.S. Sentencing Commission, FSA Datafiles.
Appendix
A-31

Figure 12B.Career Offender Application by Base Offense Level for Crack Cocaine Trafficking Offenders
Fiscal Years 2005-2013
Fiscal Year
Number BOL 6-24
Percent BOL 6-24
Number BOL 26-30
Percent BOL 26-30
Number BOL 32-38
Percent BOL 32-38
2005 63 14.2 281 15.9 392 14.5
2006 65 13.7 310 15.2 424 15.2
2007 63 16.2 357 17.9 515 18.2
2008 231 16.2 427 16.6 316 17.5
2009 244 16.7 438 18.2 284 17.8
2010 242 21.0 395 18.4 278 19.5
2011 232 20.8 358 17.3 192 18.6
2012 169 21.0 318 19.0 153 16.6
2013 177 23.9 261 18.8 150 19.2
Only offenders sentenced with complete guideline application information under USSG §§2D1.1 (Drug Trafficking), 2D1.2 (Protected Locations), 2D1.5 (Continuing Criminal Enterprise), 2D1.6 (Use of a Communication Facility), 2D1.8 (Rent/Manage Drug Establishment), 2D1.10 (Endangering Human Life), or 2D1.14 (Narco-Terrorism) with a primary drug type of crack cocaine were included in this analysis. Base Offense Level values reflect the BOL from the Drug Quantity Table (DQT) at USSG §2D1.1 prior to the application of the mitigating role cap or any adjustments under other guideline provisions. Offenders with BOLs determined by guideline provisions without reference to the DQT (e.g., §2D1.1(a)(1), §2D1.2(a)(4)) and offenders missing information required to determine the BOL prior to the application of the mitigating role cap were excluded from the analysis. The analysis reflects the overall rate of career offender application under USSG §4B1.1 regardless of whether or not the application of career offender impacted the Final Offense Level or Criminal History Category.
SOURCE: U.S. Sentencing Commission, FSA Datafiles.
Appendix
A-32
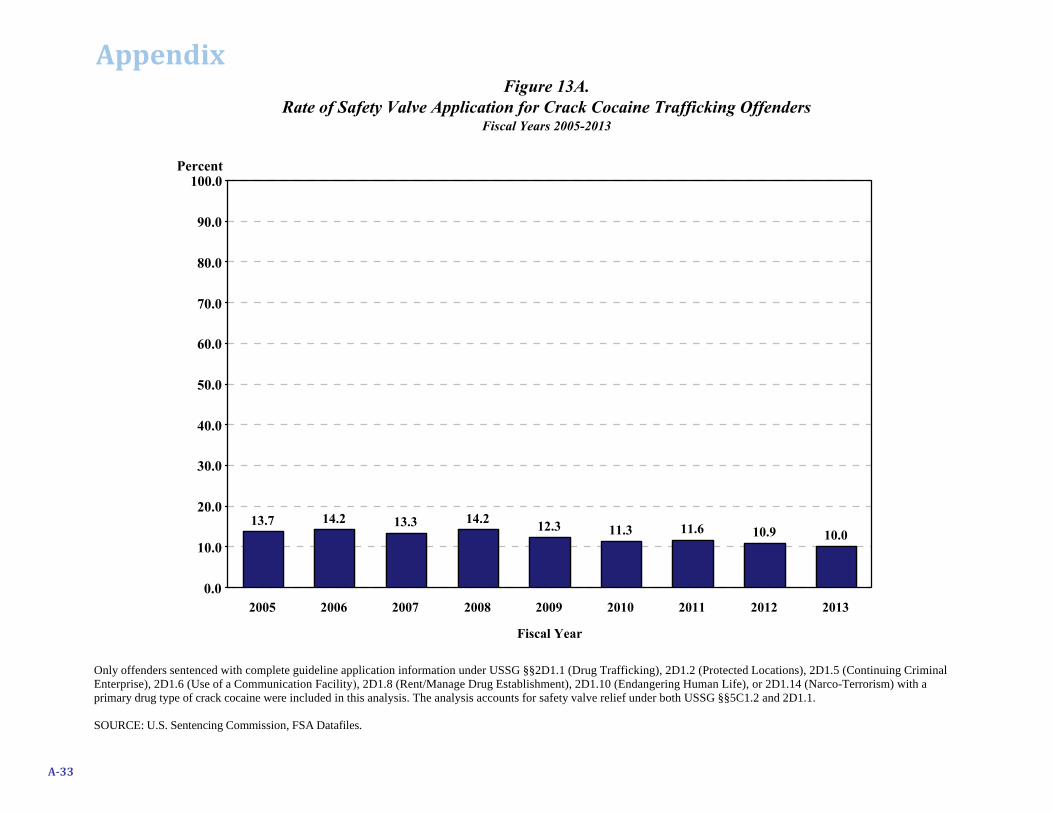
Figure 13A.Rate of Safety Valve Application for Crack Cocaine Trafficking Offenders
Fiscal Years 2005-2013
13.7 14.2 13.3 14.212.3 11.3 11.6 10.9 10.0
Percent
0.0
10.0
20.0
30.0
40.0
50.0
60.0
70.0
80.0
90.0
100.0
Fiscal Year
2005 2006 2007 2008 2009 2010 2011 2012 2013
Only offenders sentenced with complete guideline application information under USSG §§2D1.1 (Drug Trafficking), 2D1.2 (Protected Locations), 2D1.5 (Continuing Criminal Enterprise), 2D1.6 (Use of a Communication Facility), 2D1.8 (Rent/Manage Drug Establishment), 2D1.10 (Endangering Human Life), or 2D1.14 (Narco-Terrorism) with a primary drug type of crack cocaine were included in this analysis. The analysis accounts for safety valve relief under both USSG §§5C1.2 and 2D1.1.
SOURCE: U.S. Sentencing Commission, FSA Datafiles.
Appendix
A-33

Figure 13B.Rate of Safety Valve Application for Crack Cocaine Trafficking Offenders
Fiscal Years 2005-2013
Fiscal Year N %
2005 678 13.7
2006 754 14.2
2007 696 13.3
2008 827 14.2
2009 673 12.3
2010 534 11.3
2011 489 11.6
2012 372 10.9
2013 291 10.0
Only offenders sentenced with complete guideline application information under USSG §§2D1.1 (Drug Trafficking), 2D1.2 (Protected Locations), 2D1.5 (Continuing Criminal Enterprise), 2D1.6 (Use of a Communication Facility), 2D1.8 (Rent/Manage Drug Establishment), 2D1.10 (Endangering Human Life), or 2D1.14 (Narco-Terrorism) with a primary drug type of crack cocaine were included in this analysis. The analysis accounts for safety valve relief under both USSG §§5C1.2 and 2D1.1.
SOURCE: U.S. Sentencing Commission, FSA Datafiles.
Appendix
A-34

Months
0
25
50
75
100
125
150
175
Fiscal Year
2005 2006 2007 2008 2009 2010 2011 2012 2013
Crack-2 FSA
Figure 14A. Average Sentence Imposed for Crack Cocaine and Powder Cocaine Trafficking Offenders
Fiscal Years 2005-2013
Avg Sentence Imposed - Crack Avg Sentence Imposed - Powder
124121
128
114 113108
10195 96
83 83 8488
83 8178 80 79
Only offenders sentenced with complete guideline application information under USSG §§2D1.1 (Drug Trafficking), 2D1.2 (Protected Locations), 2D1.5 (Continuing Criminal Enterprise), 2D1.6 (Use of a Communication Facility), 2D1.8 (Rent/Manage Drug Establishment), 2D1.10 (Endangering Human Life), or 2D1.14 (Narco-Terrorism) with a primary drug type of powder cocaine or crack cocaine were included in this analysis. Offenders with sentences of probation or sentences exceeding 470 months (including life) were included in the average sentence computations as 0 months and 470 months, respectively. The analysis includes time of confinement as described in §5C1.1.
SOURCE: U.S. Sentencing Commission, FSA Datafiles.
Appendix
A-35

Months
0
25
50
75
100
125
150
175
Fiscal Year
2005 2006 2007 2008 2009 2010 2011 2012 2013
Crack-2 FSA
Figure 14B.Average Guideline Minimum and Average Sentence Imposed for Crack Cocaine Trafficking Offenders
Fiscal Years 2005-2013
Avg Guideline Minimum - Crack Avg Sentence Imposed - Crack
151146
153
135141 142
130
123 125124121
128
114 113108
10195 96
Only offenders sentenced with complete guideline application information under USSG §§2D1.1 (Drug Trafficking), 2D1.2 (Protected Locations), 2D1.5 (Continuing Criminal Enterprise), 2D1.6 (Use of a Communication Facility), 2D1.8 (Rent/Manage Drug Establishment), 2D1.10 (Endangering Human Life), or 2D1.14 (Narco-Terrorism) with a primary drug type of crack cocaine were included in this analysis. Offenders with sentences of probation or sentences exceeding 470 months (including life) were included in the average sentence computations as 0 months and 470 months, respectively. The analysis includes time of confinement as described in §5C1.1. Guideline minimums account for statutory mandatory minimum penalties. Guideline minimums exceeding 470 months (including life) were included in the average guideline minimum computation as 470 months.
SOURCE: U.S. Sentencing Commission, FSA Datafiles.
Appendix
A-36

Figure 14C.Average Guideline Minimum, Average Sentence Imposed, and Their Percent Difference
for Powder Cocaine and Crack Cocaine Trafficking Offenders Fiscal Years 2005-2013
Fiscal Year
Powder Cocaine Average
Guideline Minimum (in months)
Powder Cocaine Average
Sentence Imposed (in months)
Powder Cocaine Percent Difference
Crack Cocaine Average
Guideline Minimum (in months)
Crack Cocaine Average
Sentence Imposed (in months)
Crack Cocaine Percent Difference
2005 100 83 -17.0 151 124 -17.9
2006 101 83 -17.8 146 121 -17.1
2007 102 84 -17.6 153 128 -16.3
2008 108 88 -18.5 135 114 -15.6
2009 105 83 -21.0 141 113 -19.9
2010 104 81 -22.1 142 108 -23.9
2011 98 78 -20.4 130 101 -22.3
2012 104 80 -23.1 123 95 -22.8
2013 102 79 -22.5 125 96 -23.2
Only offenders sentenced with complete guideline application information under USSG §§2D1.1 (Drug Trafficking), 2D1.2 (Protected Locations), 2D1.5 (Continuing Criminal Enterprise), 2D1.6 (Use of a Communication Facility), 2D1.8 (Rent/Manage Drug Establishment), 2D1.10 (Endangering Human Life), or 2D1.14 (Narco-Terrorism) with a primary drug type of powder cocaine or crack cocaine were included in this analysis. Offenders with sentences of probation or sentences exceeding 470 months (including life) were included in the average sentence computations as 0 months and 470 months, respectively. The analysis includes time of confinement as described in §5C1.1. Guideline minimums account for statutory mandatory minimum penalties. Guideline minimums exceeding 470 months (including life) were included in the average guideline minimum computation as 470 months.
SOURCE: U.S. Sentencing Commission, FSA Datafiles.
Appendix
A-37
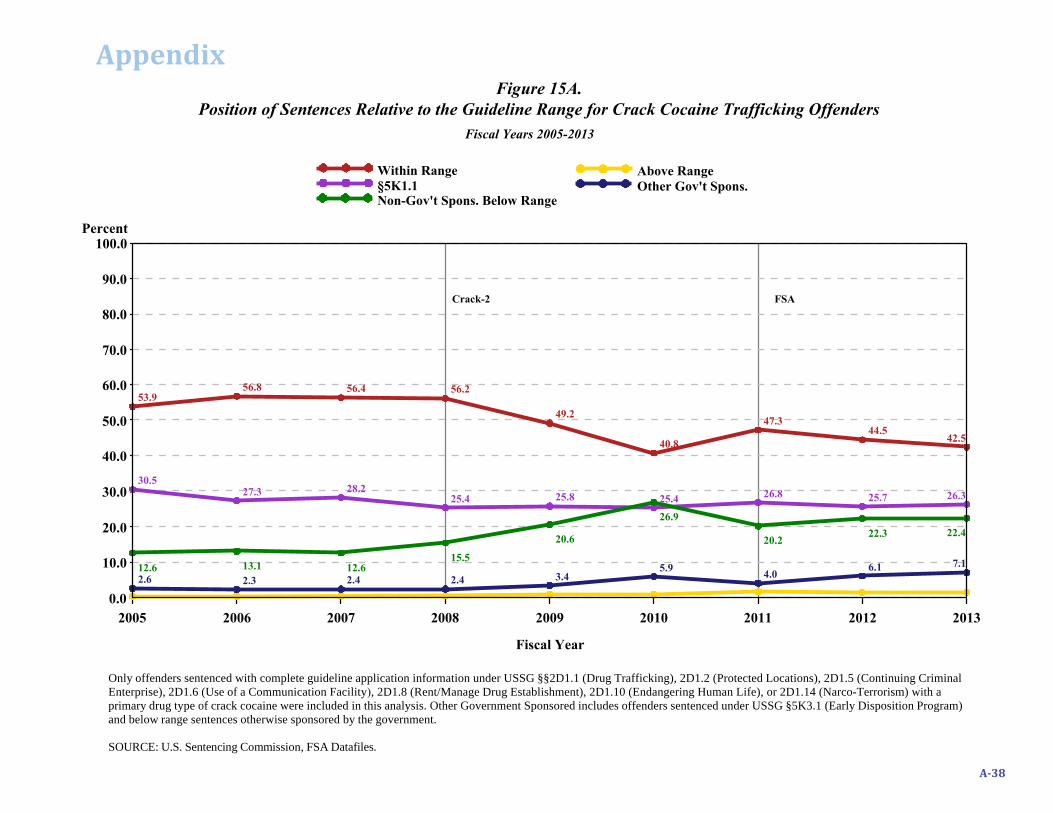
Percent
0.0
10.0
20.0
30.0
40.0
50.0
60.0
70.0
80.0
90.0
100.0
Fiscal Year
2005 2006 2007 2008 2009 2010 2011 2012 2013
Crack-2 FSA
Figure 15A.Position of Sentences Relative to the Guideline Range for Crack Cocaine Trafficking Offenders
Fiscal Years 2005-2013
Within Range Above Range§5K1.1 Other Gov't Spons.Non-Gov't Spons. Below Range
53.956.8 56.4 56.2
49.2
40.8
47.344.5
42.5
30.527.3 28.2
25.4 25.8 25.4 26.8 25.7 26.3
2.6 2.3 2.4 2.4 3.45.9
4.06.1 7.112.6 13.1 12.6
15.5
20.6
26.9
20.222.3 22.4
Only offenders sentenced with complete guideline application information under USSG §§2D1.1 (Drug Trafficking), 2D1.2 (Protected Locations), 2D1.5 (Continuing Criminal Enterprise), 2D1.6 (Use of a Communication Facility), 2D1.8 (Rent/Manage Drug Establishment), 2D1.10 (Endangering Human Life), or 2D1.14 (Narco-Terrorism) with a primary drug type of crack cocaine were included in this analysis. Other Government Sponsored includes offenders sentenced under USSG §5K3.1 (Early Disposition Program) and below range sentences otherwise sponsored by the government.
SOURCE: U.S. Sentencing Commission, FSA Datafiles.
Appendix
A-38

Figure 15B.Position of Sentences Relative to the Guideline Range for Crack Cocaine Trafficking Offenders
Fiscal Years 2005-2013
Fiscal Year
Within Range
N
Within Range
%
Above Range
N
Above Range
% §5K1.1
N §5K1.1
%
Other Gov't
Sponsored N
Other Gov't
Sponsored %
Non-Gov't Sponsored
Below Range
N
Non-Gov't Sponsored
Below Range
%
2005 2,664 53.9 22 0.4 1,509 30.5 131 2.6 621 12.6
2006 3,031 56.8 23 0.4 1,458 27.3 125 2.3 700 13.1
2007 2,950 56.4 24 0.5 1,473 28.2 126 2.4 657 12.6
2008 3,267 56.2 37 0.6 1,477 25.4 137 2.4 899 15.5
2009 2,692 49.2 54 1.0 1,414 25.8 186 3.4 1,127 20.6
2010 1,930 40.8 49 1.0 1,200 25.4 277 5.9 1,274 26.9
2011 2,000 47.3 70 1.7 1,135 26.8 170 4.0 854 20.2
2012 1,516 44.5 49 1.4 876 25.7 207 6.1 761 22.3
2013 1,239 42.5 45 1.5 767 26.3 208 7.1 653 22.4
Only offenders sentenced with complete guideline application information under USSG §§2D1.1 (Drug Trafficking), 2D1.2 (Protected Locations), 2D1.5 (Continuing Criminal Enterprise), 2D1.6 (Use of a Communication Facility), 2D1.8 (Rent/Manage Drug Establishment), 2D1.10 (Endangering Human Life), or 2D1.14 (Narco-Terrorism) with a primary drug type of crack cocaine were included in this analysis. Other Government Sponsored includes offenders sentenced under USSG §5K3.1 (Early Disposition Program) and below range sentences otherwise sponsored by the government.
SOURCE: U.S. Sentencing Commission, FSA Datafiles.
Appendix
A-39

Figure 16A.Self-Reported Crack Cocaine Users in the Past Year by Age
2005-2013
The Commission created this table using select data from Tables 7.8A, 7.8B, 7.11A, and 7.11B in the Department of Health and Human Services, Substance Abuse and Mental Health Services Results from the 2013 National Survey on Drug Use and Health: National Findings.
SOURCE: Tables 7.8A, 7.8B, 7.11A, and 7.11B, SAMHSA, Center for Behavioral Health Statistics and Quality, National Survey on Drug Use and Health, 2002-2013.
0
250,000
500,000
750,000
1,000,000
1,250,000
1,500,000
2005 2006 2007 2008 2009 2010 2011 2012 2013
Year
Aged 18-25 Aged 26 and Older
Appendix
A-40

Figure 16B.Self-Reported Drug Use in the Past Year by Age of User
2005-2013
Number in Thousands 2005
N 2006
N 2007
N 2008
N 2009
N 2010
N 2011
N 2012
N 2013
N Illicit Drugs1
Age 18-25 11,117 11,267 10,889 11,090 12,186 11,990 12,067 12,551 12,448 Age 26 and older 18,883 19,565 20,163 19,801 21,099 22,174 21,485 24,460 24,856
Crack Cocaine Age 18-25 328 293 249 217 172 180 107 140 95
Age 26 and older 1,000 1,111 1,138 862 807 686 490 762 526
Percentage % % % % % % % % % Illicit Drugs
Age 18-25 34.2 34.4 33.3 33.7 36.3 35.2 35.2 36.3 35.8 Age 26 and older 10.2 10.4 10.6 10.3 10.9 11.4 10.8 12.2 12.3
Crack Cocaine Age 18-25 1.0 0.9 0.8 0.7 0.5 0.5 0.3 0.4 0.3
Age 26 and older 0.5 0.6 0.6 0.4 0.4 0.4 0.2 0.4 0.3
The Commission created this table using select data from Tables 7.8A, 7.8B, 7.11A, and 7.11B in the Department of Health and Human Services, Substance Abuse and Mental Health Services Results from the 2013 National Survey on Drug Use and Health: National Findings. 1 Illicit Drugs include marijuana/hashish, cocaine (including crack), heroin, hallucinogens, inhalants, or prescription-type psychotherapeutics used nonmedically.
SOURCE: Tables 7.8A, 7.8B, 7.11A , and 7.11B, SAMHSA, Center for Behavioral Health Statistics and Quality, National Survey on Drug Use and Health, 2002-2013.
Appendix
A-41

Figure 17A.Number of Simple Possession Crack Cocaine Offenders
Fiscal Years 2005-2013
# with 60 Month Drug Mandatory Minimum Total # of Simple Possession Offenders
48
37
27
23
30
21 20
25
7
Number
0
10
20
30
40
50
60
Fiscal Year
2005 2006 2007 2008 2009 2010 2011 2012 2013
23
12
1 1
5
2 0
Only offenders sentenced with complete guideline application information under USSG §2D2.1 (Simple Possession) with a primary drug type of crack cocaine were included in this analysis.
SOURCE: U.S. Sentencing Commission, FSA Datafiles.
Appendix
A-42

Figure 18.Fines Imposed for Drug Trafficking Offenders
Fiscal Years 2005 –2013
Only offenders with complete guideline application information sentenced under USSG §§2D1.1 (Drug Trafficking), 2D1.2 (Protected Locations), 2D1.5 (Continuing Criminal Enterprise), 2D1.6 (Use of a Communication Facility), 2D1.8 (Rent/Manage Drug Establishment), 2D1.10 (Endangering Human Life) or 2D1.14 (Narco-Terrorism) were included in this analysis. Offenders with missing fine information, a fine of $0, or with a fine imposed in an unspecified amount were excluded from the average fine computation.
SOURCE: U.S. Sentencing Commission, FSA Datafiles.
N % N % N % N % N % N % N % N % N %
Drug TraffickingOffenders Receiving Fines
2,504 11.0 2,340 9.7 2,376 9.9 2,153 9.0 2,177 9.1 1,988 8.5 1,966 8.0 1,800 7.3 1,721 7.8
$9,978Average Fine Amount $7,972
FY12 FY13
$12,138 $8,039 $4,448 $8,061 $8,750 $13,673 $8,028
FY05 FY06 FY07 FY08 FY09 FY10 FY11
Appendix
A-43

Total # of Cases
N % N % N % N %
Minimal Role Cap 17 0.1 29 0.1 49 0.2 68 0.3
Violence 37 0.2 98 0.4 157 0.7 141 0.7
Bribery 1 0.0 5 0.0 13 0.1 13 0.1
Premises 145 0.8 483 2.0 814 3.7 919 4.4
Role + Aggravating Factors 39 0.2 106 0.4 153 0.7 159 0.8
Fear, Impulse, Friendship 3 0.0 9 0.0 9 0.0 9 0.0
Involved Ind. < 18 years 7 0.0 22 0.1 28 0.1 22 0.1
Involved Ind. >= 65 years 2 0.0 3 0.0 2 0.0 3 0.0
Involved Pregnant Ind. 1 0.0 0 0.0 1 0.0 5 0.0
Involved Vulnerable Ind. 0 0.0 0 0.0 3 0.0 5 0.0
Importation 7 0.0 39 0.2 51 0.2 49 0.2
Obstruction 5 0.0 8 0.0 21 0.1 12 0.1
Criminal Livelihood 14 0.1 25 0.1 38 0.2 54 0.3
Role + Mitigating Factors 32 0.2 42 0.2 41 0.2 54 0.3
Figure 19.Application of Selected Specific Offense Characteristics in Drug Trafficking Offenses
Fiscal Years 2011 - 2014
FY11 FY12 FY13 FY14
23,833 21,960 20,977
Only offenders sentenced with complete guideline application under USSG §§2D1.1 (Drug Trafficking), 2D1.2 (Protected Locations), 2D1.5 (Continuing Criminal Enterprise),
2D1.6 (Use of a Communication Facility), 2D1.8 (Rent/Manage Drug Establishment), 2D1.10 (Endangering Human Life), or 2D1.14 (Narco-Terrorism) with a Guidelines
Manual effective November 1, 2010, or later were included in this analysis. Offenders sentenced under provisions of the specified guidelines without reference to USSG
§2D1.1 were excluded from this analysis.
SOURCE: U.S. Sentencing Commission, FSA Datafiles.
18,536
Appendix
A-44