representation and its relationship with -
TRANSCRIPT
Vol. 28, No. 1 1
RReepprreesseennttaattiioonn aanndd iittss rreellaattiioonnsshhiipp wwiitthh ccaarrttooggrraapphhiiccvviissuuaalliizzaattiioonn:: aa rreesseeaarrcchh aaggeennddaa
David Fairbairn, Gennady Andrienko, Natalia Andrienko, Gerd Buziekand Jason Dykes
ABSTRACT
A research agenda is presented whichaddresses the current role and potentialof map displays. By considering thegeospatial data used in visualization,the form and design of maps, thepurposes for which map displays arecreated, the nature of the map usercommunity, and the technologyemployed to visualize geospatial data, athorough overview of the nature ofcartographic visualization is given.Under the same themes, and sourced incartographic tradition, cartographicpractice and technologicalopportunities, a series of possibleresearch avenues are highlighted. Theimportant links between representationand the user interface, map usercognition and the geospatial databaseare stressed.
Introduction
Graphical presentation of information has along history, and some of the earliest extantgraphical presentations are maps. Cartographyhas had, and continues to have, an importantrole to play in the graphical presentation ofgeospatial information, such as that concerningthe Earth, its people and environment, andother more abstract information for whichgeographic location is an important component.Graphical information representation andhandling methods, including those defined as‘cartographic’, are changing. As cartography’srole and applications widen (in itself adevelopment worthy of significant attention), wesuggest that a) there are new things torepresent; b) that there are new methods ofrepresentation; and c) that there is a need for anunderstanding of these – a new semiotics of
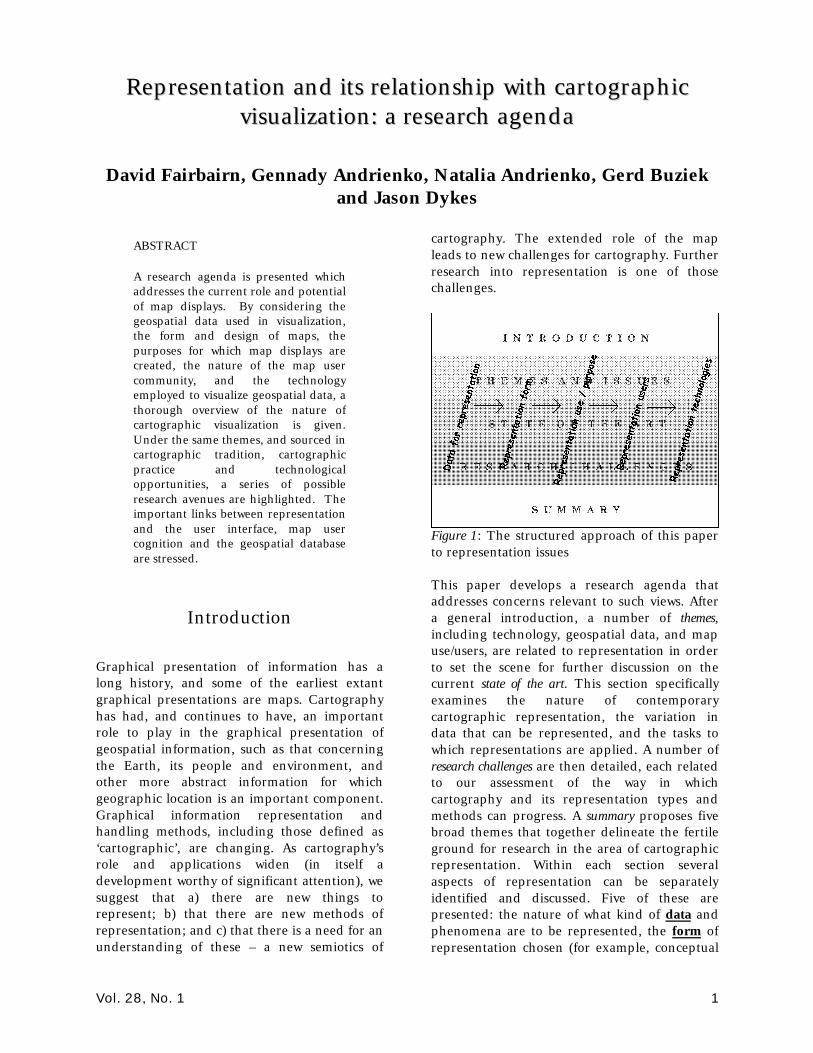
cartography. The extended role of the mapleads to new challenges for cartography. Furtherresearch into representation is one of thosechallenges.
Figure 1: The structured approach of this paperto representation issues
This paper develops a research agenda thataddresses concerns relevant to such views. Aftera general introduction, a number of themes,including technology, geospatial data, and mapuse/users, are related to representation in orderto set the scene for further discussion on thecurrent state of the art. This section specificallyexamines the nature of contemporarycartographic representation, the variation indata that can be represented, and the tasks towhich representations are applied. A number ofresearch challenges are then detailed, each relatedto our assessment of the way in whichcartography and its representation types andmethods can progress. A summary proposes fivebroad themes that together delineate the fertileground for research in the area of cartographicrepresentation. Within each section severalaspects of representation can be separatelyidentified and discussed. Five of these arepresented: the nature of what kind of data andphenomena are to be represented, the form ofrepresentation chosen (for example, conceptual
2 Cartography and Geographic Information Science
model, database ‘representation’, perceptualartifact), the purpose for which representation isundertaken and used, the users for (or by)whom representation is undertaken, and themethods and the technologies that enablerepresentation to be accomplished. Theseaspects have provided the structure for eachsection within this paper (Figure 1).
Information modelingA viable data model of the real world thatencapsulates the essence of the phenomenaunder study is a pre-requisite for the efficientmanagement, use and communication ofgeospatial information. In order to handle andview this information, a suitable means oftransforming it into recognizable graphicalentities is required. The possibilities forachieving these transformations for the digitaland graphical representation of spatialinformation are developing rapidly. In thecontext of visualization we need to advance waysof transforming information about the worldinto models suitable for digital and cartographicrepresentations that are designed for, andfacilitate, effective visualization. Such modelsshould ensure fitness for use; should draw onresearch into the cognitive issues that surroundincreasingly personalized and flexiblepossibilities for map use with an expandedrange of map forms; should respond to the stateof the art in the realm of interfaces; and shoulddrive (and respond to) developments in the fieldof databases and geocomputation. The modelsthat meet these requirements are changingsignificantly themselves.
Defining representation and methodsof representationIt is possible to regard modeling itself as a formof representation, although for this discussion itis assumed to be the data-handling step prior tosubsequent representation. Modeling of spatialdata is undertaken to ensure that data arecaptured, held, managed and manipulated in asuitable way for the application in hand. Theapplication may involve representation of alltypes, for archival, communication and/oranalytical purposes. The visual representation ofspatial data is the focus of this paper and, in
particular, the interaction of contemporaryaspects of visualization (broadly) and geospatialvisual representation is addressed. Allsubsequent references to representation shouldbe interpreted as referring to visualrepresentation unless otherwise qualified.
Cartographic representation is defined (for thepurposes of this paper) as the transformationthat takes place when information is depicted ina way that can be perceived, encouraging thesenses to exploit the spatial structure of theportrayal as it is interpreted. Theserepresentations are usually graphical, but mayalso be haptic or audible, or involve elementsthat mix other senses with sight.
Cartographic representation encompasses thetotality of the [Cartography]3 structuredeveloped by MacEachren (1994a) – thus, allmappings of geospatial information intoperceptible forms. The emphasis of the agendaput forward in this paper is on the part of thecube labeled ‘visualization’: the representationsdiscussed here are, therefore, primarily visual,tailored to specific users rather than for anunspecified ‘public’, intended for exploringunknowns, and highly interactive (possessingpossibilities for manipulation by the viewer).Such representations differ substantially fromconventional maps and there is a need toresearch these new methods of geospatialinformation exploration and presentation.
Although each visual experience based ongraphics is unique to the user1 and theinformation portrayed, we are able to usegraphics effectively to learn about the world bystructuring, and making connections among,our previous experiences (both with graphicsand in the world). We recognize patterns andobtain insights from graphical representations ina ‘non-serial’ way, and use visualization as a non-linear means of obtaining knowledge (Lloyd,1997). There is a connection, therefore, betweenthe real world and its iconic representation inmap and more schematic forms – an inherent
1 Robinson and Petchenik (1976) distinguish a (map) ‘percipient’ - one
who obtains information by looking at a map - from map ‘users’ or map
‘readers’ who use maps for a specific purpose. We employ the term
(map) ‘use’ here, however, to refer to the broader scope of all
interactivity with a cartographic representation; and therefore a ‘user’ is
one who engages in such interaction.
Vol. 28, No. 1 3
‘spatialization’ experienced by all humans.There is value in researching geographical andassociated visualization methods that addressinformation exploration and presentation in thespatial environment. Of concern to such researchis the central role of cartography as a corecomponent in the visualization of this spatialdomain and also across the wider realms ofscientific enquiry and exploration.
Themes and Issues
Issues in representing spatial dataAssociated with geospatial informationrepresentation and exploration are issues relatedto the nature of the underlying geospatial data –its differing types (e.g. multivariate, spatio-temporal, uncertain), its differing properties(e.g. scale, meaning), and its differing methodsof collection and storage (e.g., satellite remotesensing, mail survey, field GPS). We may requiredifferent representations for different types ofdata. For example, the use of Levels of Detail(LOD) as a cartographic concept similar togeneralization, is now accepted (Reddy et al.,1999). Progressive meshes for landscaperepresentation (Hoppe, 1997), variableresolution (‘pyramid-layered’) bitmaps for imagerepresentation (Pavlidis, 1982), methods ofcombining surfaces and images for rapidrepresentation in an interactive environment(including novel data compression techniquessuch as wavelets) (Muchaxo et al, 1999) andtechniques for streaming spatial data across anetwork so that representations can changeseamlessly as and when required (Schroeder etal., 1997), all take advantage of particular datastructures.
Sonic data, time-dependent data, dynamic andanimated data also each require specialconsideration and an examination of optimalmethods for incorporating them intorepresentations for visualization. It is necessary,as well, to consider the portrayal of some of theinherent characteristics of data, notably theirquality or uncertainty: Davis and Keller, (1997)Pang et al., (1997) and Buttenfield and Beard(1994) describe some techniques of quality
representation for conventional mapping. Thisis of considerable importance when data arebeing incorporated into the representation froma range of sources, both known and unknown(Mahoney, 1999).
The types of phenomena that are beingrecorded, data that are being collected andmechanisms used for their storage, arechanging. The models upon which many mapshave traditionally been based are also changing.Automated collection techniques allow us torepresent additional phenomena in new ways,and the masses of data that are beingaccumulated are ripe for representation usingcartographic techniques and investigation withvisualization. Examples include loggedpositional data from global positioning systemsand automatically captured digital imagery. Asthe US FCC considers requiring that all cellulartelephones be equipped with GPS receivers wehave new opportunities for recording, storingand analyzing information about geographicallocation and behavior at the individual level.Potentially this can provide far more informationabout the geography of the population thaneven the precisely geo-coded address model.Locations are likely to be time dependent,cyclical, multi-scale and predictable with varyingaccuracy and levels of confidence over space andtime. Examples of how such ‘time-geographies’are addressed using space-time visualization aregiven in Hedley et al. (1999). A furtherapplication is the use of permanent videostations to study traffic congestion in cities orcoastal processes across the globe. With thelatter, oblique (from a coastal tower) digitalimagery of wave patterns approaching a beachcan be averaged, and rectified for interpretation.Series of such images can be used to createmovies showing changing wave patterns thatrelate to the changing underlying topography ofthe nearshore zone, whilst the ‘stacking’ ofhorizontal sections of oblique images of theshoreline allows for the monitoring of temporalchanges in the behavior of the coastline(Aarninkhof and Holman, 1999). But how do westore such data in order that we can manage itefficiently, portray it efficiently, interactivelyvisualize it, re-configure, re-express it, andcombine it with other sources, and what are thebest methods for representing itcartographically?
4 Cartography and Geographic Information Science
It would be useful to have access to acomprehensive typology of ‘mappable things’ –phenomena which can be represented on maps.A distinction to note here is between data(measurable occurrences) and phenomena(underlying concepts or real world objects, suchas a traffic jam or hurricane). Although datacharacterize phenomena and form the basis ofour representation, they can look identicalwithin databases (consider the <x,y,value>triple which could refer to point sources oftemperature measurement, or could measurethe intensity of an earthquake at a point). Wecannot consider a representation method for thedata until we have fully comprehended thephenomenon. The establishment of formalmetadata standards is a step toward linksbetween data and phenomena, but morecomprehensive approaches to semanticframeworks for managing the meaningassociated with geospatial information areneeded.
The form of representation and theimpact of semioticsThe publication of Robinson’s seminal work‘The Look of Maps’ in 1952 stimulated wide-ranging, scientific research into the effectivenessand aesthetics of cartographic design. Suchresearch suggested that an understanding of the‘language of representation’ and its effect on thelook of maps was necessary. Much of thesubsequent work developed by Bertin (1967),Tufte (1983), Mackinlay (1986) and Cleveland(1993) for graphics, and extended by Krygier(1994) for sound, and by MacEachren (1994b;1995) for time dependence, addressed the‘variables’ or ‘building blocks’ of such languageand their associated semiotics. In many cases,the new media and tools that cartography isutilizing, for example virtual reality (VR) andmultimedia, possess semiotic relationships thatcan be and are different to those traditionallyapplicable in conventional map display.Cartographic representations, therefore, are evermore variable; they can use differingcomponents and methods, and the impact ofdata modeling and the effect on those utilizingthe maps, can vary considerably. Thevisualization of spatial data in its widest sensetherefore involves issues of what form
representations should take and howrepresentations are used.
The impact of cartographic representations isoften (some would contend must be) based uponconventional interpretative aids such as legendsand scales. Kraak et al. (1997) and Buziek(2000a) have examined legends and scales inanimations and other visualizations. In somecases such elements must be reactive (changingwith a zoom operation, for example) orinteractive (legend content changing dependenton user choice of display and map contentchanging dependent on user manipulation ofthe legend parameters). Legends and scalesneed to reflect the graphical variables used inrepresentations, but a form of ‘legend’ may alsobe required to assist in interpretation of datarepresented using non-visual methods. Here,therefore, is another issue associated withrepresentation: the whole area of design mustaddress the development of non-visual methodsof representation. Research is, therefore, neededon perceptualization, considering multi-sensorymethods for data and informationrepresentation.
In addition, contemporary representations oftendisplay ‘non-conventional graphics’, movingbeyond traditional static, two-dimensionalmapping. A whole range of map behaviors arepossible in the evolving world of dynamicmapping where the previously universal practiceof representing both static and dynamicinformation by unchanging symbolism on paperhas been replaced by temporally varyingdisplays for both types of information on screen.This situation is potentially confusing, requiringanalysis of the types and roles of dynamicdisplay that are appropriate for visualization inorder that ‘good practice’ can be identified andformalized. In order to design effective graphics,we need to understand the role and nature ofdynamic displays.
Shepherd (1995) notes that temporal variationcan arise from several sources including the data(e.g. using temporal symbolism to portray datacharacteristics); the software; the observer (e.g.changing representations with a viewer’sdeveloping train of thought); agents (e.g.symbolizing agent behavior for analyticalpurposes); the intrinsic relationship betweenmap elements (e.g. entity-related behaviors can
Vol. 28, No. 1 5
be used to change map elements when certainrelationships occur between them); and thedesigner (arbitrary behaviors can be introducedby the designer to add cosmetic interest ordynamic embellishment). Classifying distinctmap behaviors in this way is useful, providing aframework upon which research can be built tohelp us deploy new methods of representationeffectively and efficiently.
Representation and the purpose ofmappingCartographers have addressed and will continueto address the role of map-based representationsfor a wide range of tasks (e.g. depicting datauncertainty or three-dimensional scenes) and fordiffering use contexts, many of which arerelevant to and have been addressed fromdifferent perspectives by researchers in otherfields. Whatever the task or context, the mode ofrepresentation should be under user control anda classification of representation methods andtheir potential application areas should bereadily available to those exploring spatial data.Associated with the application of anappropriate representation method, it isimportant to ensure that the appropriate level ofdata abstraction for that representation isdisplayed. Further, it is critical that, oncedisplayed, we are also able to navigate andeffectively link to other data from within therepresentation.
A variety of problem solving and dataexploration tasks is addressed usingcartographic representations. Therefore, formallinks between visual analysis and statisticalanalysis, and between hypothesis generation andhypothesis checking need to be established(topics addressed in Gahegan et al., 2000). Suchlinks have the potential to result in visualizationmethods that produce added value in scientificresearch, thus to move visualization away froman operation that merely gives rise to wonderand/or uncritical speculation, towards a role thatachieves new insights and supports criticalinquiry.
Such insights are, of course, very much underthe control of the user. The major differencebetween traditional methods of spatial datarepresentations and our goal of insightful
visualization, supported by future methods ofrepresentation, is the potential to enable a pro-active role for the user (Buttenfield, 1993). Thisis exemplified in the possibilities of choosing,changing and interacting with representations asdiverse as ‘worlds’ created and coded using theVirtual Reality Modeling Language (VRML),graphics derived from exploratory data analysis(EDA), and avatar-based ‘theatre stages’.Although direct user manipulation is possible,there are circumstances where interaction withspatial data may be undertaken by novices or ina tentative manner: automated techniques ofdata mining may be implemented here to aidexploration and analysis. In addition,knowledge discovery techniques, decisionmaking strategies and artificial intelligence canaid, somewhat more interactively, initial choicesand subsequent manipulation of appropriaterepresentations: these methods seem likely toprovoke renewed interest in visualization.
The ability to perform multi-scale analysis iscritical for an increasing array of business andscientific problems. Current visualization toolsseem to support one scale at a time, or at bestallow us to move from one scale to anotherwithout any real support for investigating howpatterns and processes at one scale relate tothose at others. Cartographers have solutions tooffer to this difficult problem. As explained laterin this paper, the practical outcome ofcartographic practice relies on the abstraction ofspatial data, its graphical representation and thesubsequent design of map-based products.These are presented at differing scales and levelsof detail: cartographers have significantexpertise in handling spatial data at multiplescales and for varying purposes. The experienceof addressing problems of map generalizationprovides approaches through whichcartographers can efficiently create multi-scalerepresentations of spatial data in a variety offorms.
Aspects of representation and mapusersA further issue in considering representation isthe user community itself. As interaction is suchan important component of representations forvisualization and virtual environments, study ofthe impact of new media displays, interaction of

6 Cartography and Geographic Information Science
users with them, and the reaction of users tothem will be helpful in determining appropriaterepresentations. We also need to examine theeffects of developing techniques for portrayingspatial information, such as positioned sound,truly three-dimensional methods of projectionand the ways in which these methods work incombination and relate to multi-user modes ofinteraction and traditional map elements such assymbology and the provision of legends andscales. In addition, we should be able to sensethe feedback and interactivity involved. Howdoes the user interact with sonification and withdynamic displays? What type of interactivity isappropriate in which types of representationand how useful and effective is it? Shepherd’s(1995) typology of dynamism in maps, and hisrange of 'observer-related' map behaviorsprovide a useful framework and starting point.How do we ensure that all these developingpossibilities link data, user and task in anappropriate and beneficial manner? Finally weneed to ascertain the role of user insight inaccessing, using and gaining 'added-value' fromnew representations.
The interaction of users with animated displaysdeserves specific attention, as it is of relevancealso to issues of data for, form of, and use ofrepresentation. To support creative explorationof highly multivariate spatio-temporalinformation, we need to move well beyond thevideo-player metaphor for interacting withanimations. In addition, the role of VR and itsdynamic nature when used with representationsis worthy of further investigation, in particularthe impact on the viewer of realistic andinteractive representations. The effect of multi-user environments is also of considerableinterest as these are very recent in developmentand application. An important issue here is todevelop approaches for matching newrepresentation forms to tasks and use contexts.
In considering the users of cartographicrepresentation, it is necessary (and standardpractice) to recognize different competencies ofusers, distinguishing (for example) betweennovice, or casual, users and experts. Adaptiverepresentations are needed that take account ofthese differences. In addition, perceptualdeficiencies, such as color deficiencies, may leadto the need to consider alternativerepresentations. Also relevant to the
visualization corner of [Cartography]3 (althoughnot stressed in the original presentation of thatmodel), is the distinction betweenrepresentations for single users and those formultiple, group viewing. It is clear that therenow exist collaborative tools that allow groups tocollectively construct personalizedrepresentations, so it is not the number of userswhich is of most relevance, but the tasks to whichthe resultant representations are applied.
Research and development in studiesinvestigating user/representation interactions isalso covered in other papers in this volume thatdeal with interfaces and with cognitive aspects.One result of the combined attention to thisissue should be a paradigm for understandingthe cognitive implications of new representationforms, for assessing their usability, and fordeveloping guidelines to match representationforms with tasks and contexts. A specificrepresentational goal is to extend past efforts toautomate the mapping from data to display.
Technological themes andrepresentationIt is important to have knowledge of thepotential developments in the actual technologyon which many new cartographic media rely; arange of technologies is being applied tovisualization. We are now able to represent datadynamically, or with sound, or over the Web, orusing mobile communications (such asdevelopments in wireless applications protocol -WAP), or within a virtual environment, orattached to a wider GIS database or in ways thatallow abstract representations to besuperimposed on our view of the real world(through augmented reality using head-mounted displays). From a practical viewpoint,it is necessary to determine quickly the scenariosin which these representation methods andforms are a valuable addition to visualization,and subsequently how we best incorporate them.
The critical issue is to ensure that the methodmatches the task and the data. In addition,cartographers and others trying to visualizegeospatial data will rely increasingly on multiplerepresentations in multimedia environmentswhere the linkages between displays of the samedata in different forms need to be established
Vol. 28, No. 1 7
and active. Similarly, we will employtechnological means to combine differentdatasets (for example terrain data, sound dataand navigational and gravity sensors) in thesame display device.
Themes and issues summaryThe themes and issues detailed above in fivesections identify multiple aspects of therelationship between representation andvisualization that are changing and require aresearch response. To re-iterate, we consider themost critical issues to be those concerned withthe characteristics of the data to be handled(including issues of its generalisation,organisation and its inherent attributes); theappearance and form of representation (visualdesign and the user interface); representationpurpose (including matching the representationwith generic or specific data handling tasks); theimpact of representation form on bothunderstanding and task outcomes (in particular,user interaction with dynamic representationsand with other users); and the changingtechnology to support new forms ofrepresentation (how representations can beaccessed and enhanced).
Dramatic changes in technologies have led tochanges in the forms of representation availableto the spatial data handling and relatedinformation science and technologycommunities and the potential of theserepresentation forms for productive use. Theresearch agenda outlined in this paper,generated by the international cartographiccommunity, can help address the issues raisedby such developments and encourage astructured and focused response to this rapidlychanging domain.
State of the Art
In order to address the general issues raised inthe last section it is necessary to describe thecontemporary nature of representation and itslinks with visualization and the role of both inmapping and cartography. Recent work in thediscipline of cartography has expanded the
range of representational methods andtechnologies available: an overview of currenttechnology is central to a survey ofrepresentation possibilities. These new forms ofrepresentation all possess the elements thatcharacterise cartographic visualization(interactivity, investigation of unknowns, privatestudy). The implications of this expandedcartographic ‘toolbox’ are inextricably related tothe other issues addressed in this volume -interface design, cognitive research and othermethodologies such as data mining, geo-computation and GIS, demonstrating the needfor close communication between those with awhole range of skills and interests invisualization research, and a structuredapproach from the community as a whole.
This section does not, therefore, explicitlyaddress the five central issues so far defined,although these are introduced and underlined asappropriate. Instead, there is a concentration onthe map as a representation device and anoverview of the current state of cartographicrepresentations.
Role of cartography and the mapRepresentation is intimately connected withinteraction, visualization and the human-computer interface. In aiming to identify acoherent and comprehensive research agendafor the community, we address theserelationships by examining a wide range offorms of representation, of both physical (andvisible) and intangible phenomena, and toexamine a variety of possible methods ofrepresentation, not merely visual methods. Wedo so within the paradigm of a generalcartographic modeling theory that describes theinfluences of abstraction and design on the onehand and the influence of individuals (as users)on the other.
Maps have long been regarded by cartographictheorists as models (Board, 1967) and such aviewpoint led to the dominant paradigm ofwestern cartography in the late twentiethcentury, characterizing the map as acommunication model using abstraction,representation and design to convey a messageto a community of users. From this perspectiveon cartography, the role of representation inmapping is as a means for communicating
8 Cartography and Geographic Information Science
spatial data effectively and efficiently. Further,and ongoing, investigation has addressed theappropriateness of particular representationsand the efficiency of those representations(Ogrissek, 1982; Freitag, 1993). Research overthe past decade, however, has modified theparadigm (DiBiase, 1990; MacEachren, 1995) toconsider broader issues, particularly thoseassociated with how map-based displays enablecreative thinking and problem solving (theresults of which might then be communicated,also with a map-based display). Cartography andcartographic research are also being expandedby the new types of representation discussedabove and are extending into new areas as webecome able to usefully map new types of data.
The use of representations in scientific andgeographical enquiry relies on the distillationand portrayal of data. Cartography has a centralrole to play in such data handling, whenevergeospatial data are involved: it allows us toportray raw data, the graphical combination ofdisparate data sets, and the graphics-led probingand exploration of data and the presentation ofresults. As a combination of abstraction andrepresentation, cartography is a data-handlingand data-communicating method par excellence.The primary representation of cartography – themap – forms a powerful and extremely popularmetaphor for the exploration, extraction andsummary of all types of data, not merely spatialdata. Most of the techniques used incontemporary scientific visualization have reliedon mapping methods to provide their initialmodel (Collins, 1993).
The map as a representation and othermetaphorsBeyond its role as a tool for representation, themap can often be seen as a metaphor for thepresentation and representation of all types ofdata, spatial and non-spatial. Other metaphorsexist by which spatial data handling can becharacterised (Cartwright, 1997): some of theseare narrative (The Guide, The Sage), others aremore numerical (The Factbook, The Toolbox).While these metaphors provide importantsupplements, the map metaphor is central tocartographic visualization and pervasive withinscientific and information visualization. Itsupports the representation and exploration of a
wide variety of complex information that can bemapped to display ‘space’. Today, data andinformation that have traditionally beendescribed, enumerated, tabulated andsummarised are being mapped.
An example of how the map metaphor is beingapplied beyond cartography is ThemeScape –implemented in software entitled SPIRE (Wise etal., 1995) – a technique that illustrates thedensity and strength of relationships amongnon-spatial data, such as stories in the on-linepress (Figure 2: at end of paper), using terrain-likeplotting methods. These spatialization methodshave subsequently been applied togeoinformation contexts (Fabrikant, 2000). Alsoin the virtual world, the visualization andunderstanding of web connections in cyberspacehas benefited from use of mapping tools(Dodge, 1999). Even within the spatial datahandling community, features such astopographic slope and aspect and surfaceartifacts (borrowed from the physical landscapemap metaphor) have been used in the mappingof other types of spatial data such as socio-economic variables (Wood et al., 1999).
The map metaphor is potentially broad in itsderivation and application. Maps can becharacterised by the degree of abstractionpossible in the representation of geographicdata (MacEachren and Ganter, 1990). From acartographic perspective, at the lowest degree ofabstraction, equivalent to the 'realistic' end of acontinuum, are terrain renderings such as thoseof Imhof (1982). At the other end of thecontinuum are 'schematic' views such as those ofChernhoff, whose facial representations usingparameters of eyes, nose, mouth and ears can beused symbolically as individual map elements(Dorling, 1994). Both of these representationstransform the data to take advantage of themethods of cartographic representation that wehave available, our cognitive and perceptualskills and our experience in interacting withreality to represent geospatial data in ways thatallow us to interpret it effectively. The level ofabstraction required to successfully achieve thisvaries: Imhof applies subtle local variations inlighting angles to accentuate relief, Dorling’smaps of Chernhoff faces necessitate moreabstract transformation (Dykes et al., 1999)(Figure 3). Further extremes of the continuumoccupied by 'non-cartographic' representations

Vol. 28, No. 1 9
such as diagrams, graphs, pictures andphotographs, also use abstraction to aid efficientinterpretation of reality.
Figure 3: Continuum of realism with Imhof andChernoff representations (from Dykes et al.,1999)
Developments of the map metaphorThe continuum of representations is constantlyexpanding, thus the map metaphor(traditionally derived from our understanding ofstatic paper maps) is also evolving. The generaldevelopment of virtual environments, and theincorporation of cartographic effort into theirexposition, has led to an expectation ofevermore-realistic cartographic representations.This is enhanced by contemporary tools,including three-dimensional computer graphicstoolboxes such as UNIRAS, AVS (Rhyne, 1994),IBM Data Explorer (Treinish, 1995), VisAD(Hibbard, 1998) and NAG Explorer (Wood et al.,1997) and graphic specifications, such as VRML,which interface to such representation buildingtoolboxes. The virtual reality (VR) that theyoffer, with both spatial and temporal realism, isbecoming a standard cartographic method ofperforming representations of spatial data(Wheless et al., 1996). Representations withinVR are attractive for concrete, complex, data-rich, real world phenomena such as landscapes,urban scenes and terrain (Bishop andKaradaglis, 1996). In such environments,contemporary VR can often require an intensityof representation, more concentrated thaneveryday nature - in effect, ‘more real than real’(Gillings, 1997). However, we should note that,like a map, such representations are still basedon abstraction and design. Whether therepresentation used in a virtual environment isrealistic or abstract, the interpretive load put onthe user may be minimized by providing realisticinteraction with the representation. Even ifrealism is an objective of the representation, andthe representation and forms of interaction arerealistic, the experience with ‘reality’ is indirect(relying upon the cartographic transformationsimplicit in the representation). Research into the
creation, specification, use, and assessment ofsuch modern maps will rely upon manydeveloping aspects of cartography..
Buziek (2000b) has listed further related aspectsthat affect map representations and the user'sresponse and these can be profitably examinedto determine the factors that should be borne inmind when constructing representations andconsidering their use. We have already specifiedlevel of interaction as active in characterizinggeographical visualization (or ‘geovisualization’),although clearly for most traditionalrepresentations it is passive. Dependent on thedata modeling process, representations canportray 2, 2.5 or 3 dimensions. The dynamism ofrepresentations is a further parameter, rangingfrom static to moving or animated displays. Thesensory channels used to access the representationcan vary, including visual, acoustic and hapticmethods. The user can also access therepresentation from within differingenvironments, for example immersively, orremotely. Connected to this, the media throughwhich the representation is conveyed can vary -for example, using paper, screen, projectivedisplay (as with augmented reality) or computerassisted virtual environments (CAVEs). Some ofthese environments and media allow for multi-user access. Clearly, a number of enhancementsto the map representation can be brought tostudy of the map as a metaphor for accessingspatial data. The development of the map as anartifact parallels the development of spatial datacharacteristics: thus ensuring that the traditionaliconic role of the 2D, static, visually perceivedmap representing a visually perceived, two-dimensional, static landscape is changing. As thenature of the spatial data we are handlingchanges, so the map representations which areused to visualize it changes also.
MacEachren et al. (1999) outline a usefulclassification of representation form, based oncartographic design practice, which refers to the‘iconicity’ of the display. This is the extent towhich display dimensions match the spatialdimensions of the world, and to a certain degreematches the continuum introduced above in thecontext of virtual reality displays. The realisticmap is regarded as spatially iconic, creating aspace-to-space mapping between the real worldand the display. As MacEachren et al. point outthis “does not require that virtual environments
10 Cartography and Geographic Information Science
replicate reality (that they be representationallyiconic in all respects) - any more than traditionalmaps need to look just like a view from above totake advantage of the space-to-space mapping in2D”. They further point out that whilst arealistic rendering of a tornado in three-dimensional VR might be visually compelling,enhancement may be necessary: “true insight (ofthe tornado) can only be gained when winddirection, speed, and temperature arerepresented through abstract visual symbology”.
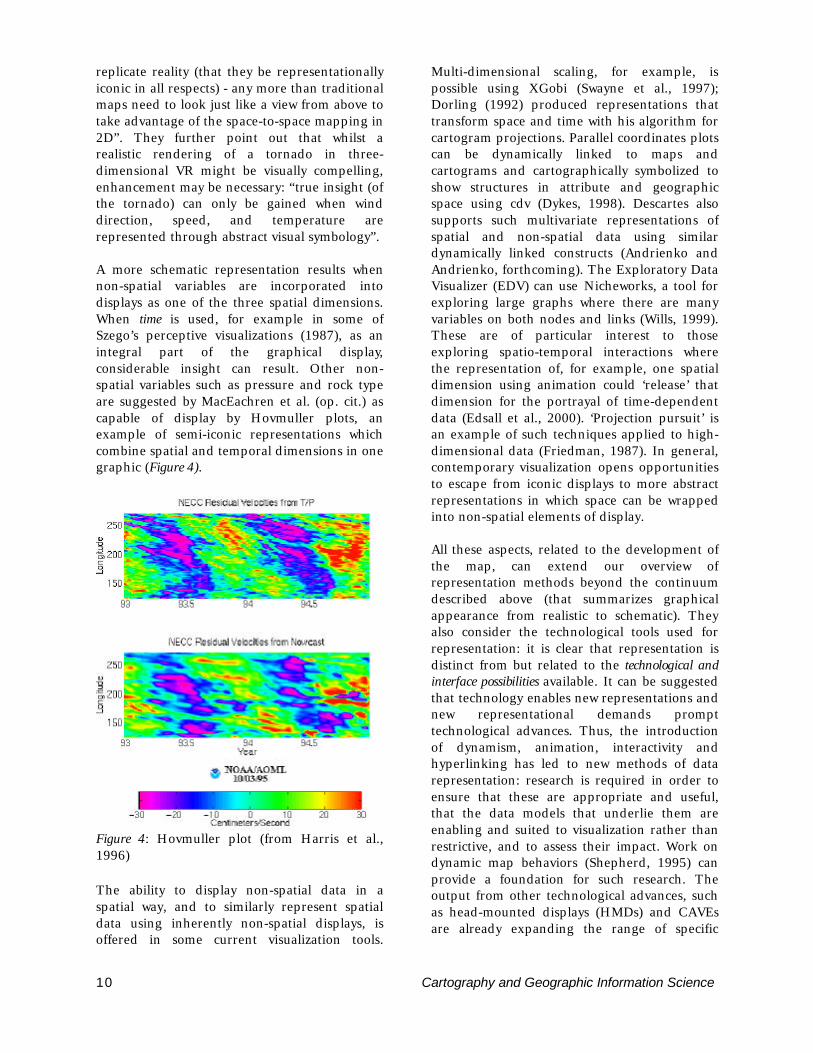
A more schematic representation results whennon-spatial variables are incorporated intodisplays as one of the three spatial dimensions.When time is used, for example in some ofSzego’s perceptive visualizations (1987), as anintegral part of the graphical display,considerable insight can result. Other non-spatial variables such as pressure and rock typeare suggested by MacEachren et al. (op. cit.) ascapable of display by Hovmuller plots, anexample of semi-iconic representations whichcombine spatial and temporal dimensions in onegraphic (Figure 4).
Figure 4: Hovmuller plot (from Harris et al.,1996)
The ability to display non-spatial data in aspatial way, and to similarly represent spatialdata using inherently non-spatial displays, isoffered in some current visualization tools.
Multi-dimensional scaling, for example, ispossible using XGobi (Swayne et al., 1997);Dorling (1992) produced representations thattransform space and time with his algorithm forcartogram projections. Parallel coordinates plotscan be dynamically linked to maps andcartograms and cartographically symbolized toshow structures in attribute and geographicspace using cdv (Dykes, 1998). Descartes alsosupports such multivariate representations ofspatial and non-spatial data using similardynamically linked constructs (Andrienko andAndrienko, forthcoming). The Exploratory DataVisualizer (EDV) can use Nicheworks, a tool forexploring large graphs where there are manyvariables on both nodes and links (Wills, 1999).These are of particular interest to thoseexploring spatio-temporal interactions wherethe representation of, for example, one spatialdimension using animation could ‘release’ thatdimension for the portrayal of time-dependentdata (Edsall et al., 2000). ‘Projection pursuit’ isan example of such techniques applied to high-dimensional data (Friedman, 1987). In general,contemporary visualization opens opportunitiesto escape from iconic displays to more abstractrepresentations in which space can be wrappedinto non-spatial elements of display.
All these aspects, related to the development ofthe map, can extend our overview ofrepresentation methods beyond the continuumdescribed above (that summarizes graphicalappearance from realistic to schematic). Theyalso consider the technological tools used forrepresentation: it is clear that representation isdistinct from but related to the technological andinterface possibilities available. It can be suggestedthat technology enables new representations andnew representational demands prompttechnological advances. Thus, the introductionof dynamism, animation, interactivity andhyperlinking has led to new methods of datarepresentation: research is required in order toensure that these are appropriate and useful,that the data models that underlie them areenabling and suited to visualization rather thanrestrictive, and to assess their impact. Work ondynamic map behaviors (Shepherd, 1995) canprovide a foundation for such research. Theoutput from other technological advances, suchas head-mounted displays (HMDs) and CAVEsare already expanding the range of specific
Vol. 28, No. 1 11
virtual environment and data representationsthat require investigation.
It is noteworthy that the categories ofrepresentation developed from this classificationcan be affected by externalities and dataproperties (e.g. the nature of data reveals anintrinsic dimensionality, the contents of the datahave an effect on the sensory channels that canbe used, the meaning of the data has an effecton user task). As well as being influenced bytechnology and the user, representation is bothdata- and task-dependent, something longrecognised by cartographers.
Schematic representations and EDAExploratory data analysis (EDA) techniquesrooted in statistical data handling (Tukey, 1977)allow for representations that are generallyschematic, yet still of interest to cartographers.Developed initially to assist in automated datamining and interactive data exploration, there isconsiderable potential in using techniques suchas brushing and focusing (Carr et al., 1987), andthese have been applied and extended bycartographic researchers to developrepresentations of multivariate datasets. Work byMonmonier (1989), MacDougal (1992) andDykes (1996) has led the way in opening upcartography to such possibilities. Monmonier'sexploratory techniques link statistical andgeographical views of data to great advantage,examining the nature of scatterplots and theinformation contained within them, forexample. The graphical scripting methods, usedby Dykes, demonstrate the direct links betweenrepresentation and interface and explicitlydocument the cartography, dynamism andbehaviors contained in maps for exploration.Edsall (1999) proposed an extension ofbrushing, termed ‘strumming’, as an interactionmethod for use with parallel coordinate plotsthat are dynamically linked to maps. Thecontemporary results of such work includeaccessible software such as cdv (Dykes, 1997,1998), Descartes (Andrienko and Andrienko,1997, 1999a) and GeoVISTA Studio (Gahegan etal., 2000) (Figures 5 and 6: at end of paper).Further work, both technical and conceptual isneeded to extend and fully explore the range,consequences and suitability of these new,dynamic representations of geographic
information. The techniques used by Dykes (op.cit.) and Andrienko and Andrienko (op. cit.) areespecially suited to the evolving cartographicmilieu, as their inherent flexibility (takingadvantage of high-level scripts and Java librariesrespectively) mean they are specificallyextensible and can support rapid prototyping.GeoVISTA Studio is also a Java-basedenvironment, providing a Java Beans-basedvisual programming to allow for easy combiningof components written by users.
The importance of task-drivenrepresentation The Themes and Issues section above stressedthe importance of taking into account the mapuse and the map user when creating andinteracting with representations. This sectionnotes some further issues related to task-drivenrepresentation and the purposes for whichrepresentations are created. A perceived oractual community of users or the demands of anindividual spatial data user drive therepresentations so far described, as true for allcartographic products. The representation ofscientific hypotheses (for example, in sketchform), of scientific data (for example, inarchiving and for communication purposes) andof scientific results (for example, in pictorial orgraphical summary) is undertaken for a numberof purposes and to meet the functionalrequirements of a number of tasks. Theexploration of complete scientific datasets willrequire a different form of representation to thecomparison of a couple of individualobservations. The summarizing of a completescientific investigation will be rendered in adifferent form to the highlighting of a datasetoutlier. Summarizing, exploring, extracting,feature identification, feature comparison andfeature interpretation (attaching meaning) areexamples of tasks in scientific work, all of whichcan lead to various types of representation.Clearly, delineating the functions ofrepresentation, matching of representation typeto differing tasks and assessing theappropriateness and efficiency ofrepresentations are as important, if not more so,than merely cataloguing the techniques thatexist to create such representations.
12 Cartography and Geographic Information Science
Realistic dataThe development of EDA techniques has led toan engagement of representation methods withstatistical analysis. Multivariate data handlingand multi-temporal analysis can be used tounderstand the opportunities and limitationsalready explored by scientists whose main aim isthe handling of numerical, as opposed tospatial, data. A substantial research effort hasalso been directed towards the realisticrepresentation of physical phenomena, ratherthan the more schematic representationsmentioned above. (MacEachren et al., 1999). Increating such representations of the ‘real world’,researchers have used geovisualization alongwith knowledge of how human beings interactwith and view their surroundings and theelements within their environment. In addition,these representations can make use of all humansenses, including audio and haptic interactionsas well as visual contact with a representation.Beyond this, we can imagine a human beingaddressing and reacting to more than the visiblecharacteristics of geographic environments:instead to “experience ‘super environments’ inwhich users can not only see what would bevisible in the real world, but also experience thenormally invisible and control what is usuallybeyond human control” (MacEachren et al., op.cit).
Technological possibilitiesAs indicated above, the map metaphor is wellembedded in the mind-set of the majority of thepublic, and also of dedicated scientificresearchers. New representations that havedeveloped from these roots are less familiar. Thepossibilities afforded by contemporarytechnology, along with interaction of users withthe subsequent representations and the linkageswith wider scientific endeavor, will broaden thescope of cartography in user communities. Thedevelopment of these new data handlingenvironments and technologies means that a re-assessment of cartographically familiar tools andparameters needs to be undertaken.
Color, for example, is an interesting tool andvisual variable that has been subject to recentscrutiny within the new paradigm ofcartographic visualization. Choropleth mapping
is a central instrument of graphical exploratorydata analysis of enumerated georeferencedstatistics (for counties, nations, etc.), and colorvariation is the symbolization of choice for suchdisplays. The detection of spatial pattern,regionalization and assessment of relative valueare all spatial data analysis techniques that areenhanced by the portrayal of data throughattributes of color. Brewer’s research (1994), forexample, has extended the overall view of coloras a visual variable initially developed from acartographic perspective by Robinson (1952)and in a wider graphic sense by Bertin (1967).Such work has resulted in the standardapplication of three color variables – hue, valueand saturation – in the representation ofdifferent types of data (for example nominal orordinal data). Broader examination of the roleof color in geovisualization has been undertakenby Levkowitz (1991), Levkowitz et al. (1992) andRheingans (1997). Further uses of color and the‘packing’ of more information into colorrepresentation must be researched asopportunities and demands develop.
Another example of how technologicaldevelopment can stimulate modified and newrepresentations is in the area of animation anddynamism. The wider range of visual variablesinherent in such displays can allow for a moreefficient allocation of variables to the spatial,symbolic and temporal dimensions. It may bepossible to use temporal variables to representnon-temporal phenomena (Openshaw et al.,1994) and the semantics of such animationsneed examining. In addition, there are positivebenefits in using multiple screens to addresssimultaneous change, and transparency andblending tools to address comparison within onedisplay. The addition of visual navigation toolsand temporal legends (Buziek, 2000a) can alsoease the interpretation of animated and dynamicsequences.
Applications areas for new cartographic mediaare constantly widening. It is only recently thatcorporate business, for example, has appreciatedthe role of maps and map-like objects; it is onlyrecently that spatial data has been incorporatedinto financial and insurance applications; it isonly recently that the widespread availability ofmapping over the Internet has led to high userexpectation of map representations delivered bythe web. It is only recently that we have been

Vol. 28, No. 1 13
able to geo-locate ourselves with a high degreeof accuracy using an affordable device that fits inthe pocket (and that we need to re-acquaintourselves with the limitations of mapping on thelow resolution, monochrome LCD screen thatsuch pocket devices use). As the realm of humanendeavor to which spatial data can contributeexpands, so the range of representations and methodsof portrayal widens and so the need to develop and testthe most appropriate techniques continues. Theresearch challenges outlined in the next sectiontherefore address both representational theoryand the development and testing of techniqueswhich are supported by such theory.
Research Challenges
The major research challenges that we identifyin the visualization of geospatial data eachinvolve rationalizing the wide range of factorsaffecting and affected by contemporary andfuture methods of representation. We feel thatthe cartographic community, working withothers, can (and should) play a leading role inthe search for solutions to these tasks which bestserve the requirements of contemporary spatialdata handling. Some of the central researchtasks we propose here have been introduced inthe preceding sections ‘Themes and Issues’ and‘State of the Art’. Here we expand further uponthe range of issues and structure our agenda in amore formal manner. We delineate challengesrelated to the five aspects of representation wehave stressed already: 1) the methods andpractices of representation that are affected bydata; 2) conceptual issues in creatingrepresentations and the subsequent form ofrepresentation; 3) the tasks and purpose towhich they are applied; 4) the interaction that isinvolved in accessing representations and theimpact of the user; and 5) the tools andtechnology that are used in representation. Theaim in promoting the research challenges is toattain successful understanding of each of theseissues: 1) to fully appreciate how representationis affected by spatial data; 2) to be aware of thebackground issues relating to representation andits methods and develop a theory forformalizing these; 3) to know the possibilities,applications and limitations of representation; 4)
to comprehend the nature of the human inputinto representations and the effect ofrepresentations on human beings; and 5) to becompletely familiar with the range oftechnological opportunities available. Successfulundertaking of the research agenda will deliveran expansion of conceptual and practicalknowledge in this important area of spatial datahandling.
The impact of data on representationThis section considers some research tasks in thearea of the spatial data used to createrepresentations, the inherent meaning of thatdata and linking such meaning to the form ofrepresentation, and the impact of data attributeson the representation method.• Firstly we need to address issues related to
the size of the dataset. Visualization of verylarge (terabyte and bigger) data sets hasbeen identified by the scientific communityas a critical research issue (for example, inthe NSF Program Announcement 99-105 onLarge Scientific and Software DatasetVisualization). -. Most of the very large datasets being considered have geospatialcomponents (e.g., those from the EarthObserving System, telecommunicationsrecords, national census and healthdatabases, those generated byenvironmental process models). Thechallenge related to geospatial datarepresentation is to move fromrepresentation methods developed in an eraof data scarcity to new methods that dealwith data glut.
• A further common characteristic ofcontemporary data is its dynamic nature.Clearly animated and vibrant forms ofrepresentation can adequately address theproblems of integrating time-dependentdata into geovisualization systems. Suchdynamic display may provide part of theanswer when tackling a geovisualizationchallenge critical to applications inenvironmental science, transportationengineering, and other domains in whichchanges in both space and time are relevant– the challenge of representing process. Theproblem is not how to represent ‘temporaldata’ but how to represent ‘processesoccurring over time’. We believe that a focus
14 Cartography and Geographic Information Science
on representing temporal data has limitedthinking about how process might berepresented – it seems to constrainrepresentations to displays such as snapshotviews typical in GIS databases, if theyinclude time at all. The possibilities ofdetecting and evaluating changes, showingstates at particular moments, displayingtrends, evaluation of time dependency (arephenomena permanent, transient, periodic,renewable? do they split, merge, spread,move?) all need closer scrutiny.
• A representation of uncertainty may supplementexisting data or may be an item of display inits own right. Making information availableabout data uncertainty, stored metadataparameters and/or the suitability of arepresentation for a particular task isessential, if users are to make informeddecisions and we are to extend thevisualization toolkit. Most of the criticalproblems relevant to science and societytoday for which geospatial data arefundamental, involve (as indicated above)change and process. Methods developedthus far to represent data, datainterpretation, and decision uncertainty,however, do not consider change or process.Thus scientists and decision-makers arefaced with analysis tools and decision-making aids that often ignore uncertaintyentirely – leading to wasted scientific effortand bad decisions. A comprehensiveprogram of research is needed to ensure thedevelopment and test (in a variety ofcircumstances) the efficiency of quality oruncertainty indicators for new methods ofrepresentation.
• There is clearly a wide range of furtherexogenous information, both qualitative andquantitative, which can be (and often needsto be) assimilated into the analysis ofgeospatial data and its representation.Mechanisms such as XML can be used toformalize this and assist in the addition ofmore contextual information to ourrepresentations.
• Choosing a method of representation that isappropriate to the task and data to beportrayed is crucial. To this end, ourinvestigations should move beyond theconsideration of variables of representation– and associated syntactics or rules formatching them to data types (which are
important) – to an examination of thesemantics within the data. Full comprehensionof the nature of the data and phenomena tobe mapped is necessary beforerepresentation can be undertaken. Furtherdevelopment of the visual variablesexemplar for representation design hasconcentrated on matching the nature of thedata portrayed with the representationdisplayed. Some work attempted to embedthis into expert systems for cartographicdesign (Zhan and Buttenfield, 1995; Forrest,1991; Muller and Wang, 1990). In addition,Mackinlay (1986) demonstrated thefeasibility of using such technologies forrepresenting non-spatial data. More recentlycreated visualization software has offeredintelligent graphical representation of datausing metadata and a cartographic rule base(for example, Vizard (Jung, 1995); Descartes(Andrienko and Andrienko, 1997)), but suchextensions into interactive display haverevealed the shortcomings of previousexpert system tools for map display. It islikely that, in addition to using dynamicvisual variables, a further range ofrepresentation techniques needs to bedeveloped specifically for interactivity. It isvaluable to study map use strategies in thisrespect (Andrienko and Andrienko, 1999c):understanding the role of map displays invisual thinking and the tasks involved inusing maps for exploratory analysis maylead to a new assessment of the potential ofexpert systems in contemporary displays.
Forms of representation andrepresentation theoryAs we extend the definition of cartographicrepresentations we need to be aware of thelimitations of traditional cartographic methodsand designs, along with the possibilities of newrepresentation methods and the nature of theirimplementation.• Research is needed into the fundamental
representational primitives that can becombined to support creative visualization.Visual, sound, dynamic and tactile variableshave been discussed already, but anassessment must be made of the relativestrengths and effectiveness of each, how theyare isolated as variables in their own right,
Vol. 28, No. 1 15
and when they might be suitable to apply. Inaddition, a theory-based approach to thecombining variables for complex multi-dimensional visualization is needed. Theimpact of technology on newer possibilitiesin representation (e.g. the use of dynamicsymbols that vary rhythmically) also needsinvestigation.
• While past research has delineated theprimitives (variables) of dynamic display, amajor challenge for cartography is toproduce a standardized approach to the useof such variables in contemporary dynamicand animated representations. Further, it isimportant to determine the nature ofanimation as a tool for exploratory analysis,beyond its straightforward display function.Shepherd (1995) suggested that “wheneverdynamic features are added to maps [weshould] ask the question ‘WHY’?” (p.184).Further research into the use of dynamicrepresentations for visualization should bedirected towards addressing this questionand also explaining ‘HOW?’ and ‘WHEN?’dynamic graphics can be used appropriatelyand successfully.As cartographers engaged in experimentingwith animations we know that there areproblems in viewing these ‘as a whole’(Morrison et al., 2000). We still do not knowwhat makes animated displays too complete,too busy, or too spatially and/or-temporallydistracting (Shepherd, 1995). Often manyre-runs of an animation sequence arenecessary to pick up the full picture; usersinteracting with animated sequences areunable to view different portions of thedisplay simultaneously; there are difficultiesin locating a point in the temporal sequencewith the same accuracy that a point in spaceon a static display can be remembered andmoved to (Slocum et al., in press). Whilst wehave managed to develop more exciting,impressive, busier, faster graphics we havenot advanced our knowledge of dynamicrepresentation. By addressing mapbehaviors and thinking clearly about thedistinct roles played by temporal variationsin map display we may identify conflicts andbegin to address these issues. Thesebehaviors provide a wide range ofrepresentational possibilities with evidentbenefits for visualization that can (andshould) be dependent upon the user, their
experience and preferences, and the task inhand, as well as the data, the medium usedand the hardware configuration.
In the most successful displays, the speed ofanimation can be controlled to examinepossible periodicities in the data, differentstarting points can be chosen forsimultaneous displays and pattern analyzerscan be employed (Blok et al, 1999). Theultimate aim is for what we term ‘analyticalanimation’, whereby interactive tools forexploration and controls for playing throughmultiple scenes are combined, allowing forefficient data extraction and understanding.This may be developed using noveltechniques such as those afforded by theMPEG-7 format, which can be used toaddress video representations of data withspatio-temporal properties. Extractinginformation from video and exploitinginteractive video requires new data modelsand interfaces and novel graphicalrepresentations. Video representations ofproperties, shoppers and vehicles will soonbe interactive so that details about theobjects in the video can be investigated.
• The application of ‘non-conventionalgraphics’ for representation covers a rangeof techniques which need further study. Theuse of superimposition (such as overlappingand integrating graphics withsimultaneously sensed reality or imagery),multiple viewpoints (simultaneouslydisplaying three dimensional phenomenafrom a number of viewing positions),morphing and animation (which can help inportraying change) and highly schematic orhighly realistic representations (dependenton the data, the user and the task involvedin representation) require fundamentalresearch enquiry to determine theireffectiveness. A focussed research programwill help to assess their potential role asstandard tools for the creation of maps.
• The specific issue of the desirable level ofrealism in varying cartographicrepresentations is of immediate importanceas spatial data (especially image data)becomes available at ever-higher levels ofresolution and as the complementary needto abstract a simplified representation fromcomplex data becomes apparent. Whilstrecognizing that maps are abstractions ofreality, rather than faithful reproductions of
16 Cartography and Geographic Information Science
it, the increasing use of VR raises questionsregarding human interaction with the spatialrepresentation. There is a potential difficultyin rendering VR scenes as more real thanreal. The extraction of graphical data fromthe imagery of an aerial photograph, forexample, can yield a more useful product –the map – than the original. Similarly, amore generalized display may be moreeffective for interpreting spatial data than ahighly detailed and complex virtual world.Examination of the tornado model byMacEachren et al. indicated that it may bepreferable to show additional, abstractvariables in generalized, rather than realisticform. An assessment of the relative benefitsof using either realistic or schematic displaysto represent a range of data, both tangibleand non-visible, can help in the efficient useof cartographic representations.Current methods used to display terraindata and contemporary practice incomputer graphics and computer gamingcan exhibit striking levels of realism: but therealistic rendering of terrain in virtualenvironments needs to be reconsidered. Itis vital, in a cartographic context, to ensurethat appropriate abstraction of detail isundertaken, ensuring that humaninteraction can proceed efficiently. Further,as we increasingly utilize technology whichcan merge the abstraction rendered bycartographers with the realism presented bycomputer graphics scientists we need todetermine the relative levels of each for thetask in hand.
• As is clear from the ability of individualswith visual impairment to interactindependently with their environment,senses other than vision are capable of rapidprocessing of complex information. Still,sound is seldom considered as afundamental component of visualization,generally limited to use in enhancingrealism of virtual environments via naturalsounds. Its potential as a complement tovision for representing complex geospatialinformation is virtually unexplored Sound,like vision, is multivariate and capable ofbeing spatialized, for example in VRML andJava 3D where a co-ordinate position, rangeand direction can be specified. Whilstpreliminary tests suggest some success inusing sound to extract patterns from
multivariate data, there are further criticalareas of concern which are integral to theincorporation of sound within visualization:the sound variables and their inter-relationships; the link between sound andtime; the use of sound as a spatial locationmechanism; the reaction of users to sounds(‘psycho-acoustics’); the role of conceptualand realistic sounds; and the incorporationof the human voice in spatial informationsystems. Each of these is a crucial issue inthe development of effective visualizationsystems which utilize the richness ofcontemporary spatial data.Research into sound as a cartographicvariable (either as an accentuatingsupplement to visual representation or as anindependent means of encoding spatial datawhich is not depicted visually) is necessary.In which scenarios can sound be combinedwith other representations? How does theuser react to sound? More fundamentally weneed to determine how sound research isundertaken - how can we test theapplications in which we suspect that soundmay be valuable? (Shiffer, 1995). Somevirtual worlds can be experienced withadditional haptic (touch) techniques. This is anarea of importance to cognitive scientists(Yokokohji et al., 1996) which can play asubstantial role in some means ofrepresentation. The portrayal of stimuliusing physical forces rendered throughkinesthetic gloves or pressure-sensitiveclothing is intimately connected in VR withnavigation, balance and machine-responseto user control. Haptic communication ofspatial variables and environmental aspectsare areas yet to be researched in depth, andit is clear that such methods are used morefor interacting with spatial data rather thanrepresenting it. Technology already exists toportray resistance in a tactile manner -which could be used to representattractiveness, gravity models, or theoreticallocation-planning scenarios (for example,feeling the competing pressures for facilitysiting) - but whether further tactile variablessuch as temperature, texture/roughness orhumidity can be effectively used to representgeographic information is less clear.As well as sound and sonification, furtherenhancement of traditional mapping withincontemporary visualization systems can

Vol. 28, No. 1 17
make use of voice interactivity andrecognition along with natural gestures(Sharma et al., 1999). Expanded multimediainterfaces and their multi-sensoryrepresentations (visual, auditory, haptic) arenow commonplace: once again theopportunities for and mechanisms ofinformation representation and transfer tothe user must be studied.
• We have established that distinct methods ofrepresentation exist on the abstractioncontinuum discussed above (Figure 3). Theremay well be multiple solutions to theproblem of how to efficiently represent aspecific data set such that differing views ofthe same data (varying, for example, inscale, level of realism, dimensionality,dynamism) can be created. . Data handlingand analysis may be improved further byestablishing relationships between suchseparate representations. Possible mechanismsfor transferring data, edits and informationbetween representations have not beenexplored thoroughly. It is technicallypossible, using existing standards and toolssuch as HTML and Java, to ensure thepropagation of changes through differentand separate representation methods. Asimulated landslip in a realistic terrain-viewing package could dynamically alter thecontour pattern on a two-dimensionaltopographic map of the same area, renderedin a separate window. Such relationships canrely on object-based computing technologiesthat embed behavior into objects rather thaninto representations. Currently, althoughmultiple representations of spatialinformation are becoming standard, thesetend to be loosely coupled data streams,which may refer to the same informationcontent but are not capable of dynamicallylinking the representations. As was indicatedearlier in this section, cartography hasborrowed and modified many of thegraphical tools of exploratory data analysis,some of which (such as ‘brushing’) do allowfor user interaction in one view that hassimultaneous impact on linked objects/placesin other views. At a human interface level, itis important to note that the capacity torespond to differing types of changes indiffering representations may be limited.There may, for example, be conceptualproblems involved in assessing the depth of
the human understanding of the linkagesdisplayed by brushing. Even existing issuessuch as the impact on the viewer of varyingrepresentations of the same object,landscape or feature from multiple viewpointshave not been sufficiently examined.
• Deriving meaning from geospatial dataoften requires complex data processingoperations that data users may notunderstand, resulting in misinterpretation ofdata and subsequent bad decisions. Thevisualization of spatial data processingoperations can ease their interpretation andsupport effective and appropriate dataapplication. This may extend to a method of‘programming’ which involve symbols orwidgets representing software and datacomponents that are graphically connected.The graphics are converted into computercode or scripts and the processes run, withthe interactions and operation visualized.Such graphics often permit feedback intothe computational process and sovisualization of its progress and outcomes.AVS, and IBM Data Explorer provide suchrepresentations, as does the ERDAS Imaginesoftware where the Model Maker toolprovides a visual approach to creatingprocedures for processing satellite imagery.Such visual methods can be further appliedto processes of data querying and thedevelopment of spatial data models andstructures. Our experience with these visualprogramming techniques indicates thatrelationships between them andcartographic visualization require furtherinvestigation. The key challenge here is tointegrate geovisualization and these visualprogramming methods in ways that supportunderstanding of complex geospatial dataprocessing operations.
Tasks and applications – the purposesof representationThe issue of interaction with representations canbe expanded to consider the relativeappropriateness of various types of spatial datadisplay. The fundamental question to beanswered is ‘what is a suitable method ofrepresentation for this particular task?’ Thisarea is particularly difficult to examine, relying,
18 Cartography and Geographic Information Science
as it does, on unquantifiable factors such as anassessment of knowledge acquisition and theefficiency of data exploration. Cartographic andgraphical representations, including thoseoffered by EDA, can assist significantly inproviding a framework for such exploration: theDescartes mapping tool, for example, can act asthe spatial data display extension to aknowledge discovery device, Kepler (Andrienkoand Andrienko, 1999b). It is difficult to answerthe question of whether insight results from theindividual expertise of the user or the effectiverendering and use of visualization.• The use of graphical editing tools into
practical visualization tasks can besupplemented by also integrating the type ofstatistical tools used in EDA and datamining. These can clearly affect the methodand look of visualization, although they arecurrently used mainly for static, two-dimensional representations. The creationof animated and multi-media visualizationsas a result of data mining has not been fullyexplored. Further, there is a need to developdata mining techniques for the initialexploration of graphical data.
• The effectiveness of representation isinextricably linked with the behavior of theuser in interacting with the display: we needto determine the purposes of usingvisualization – for summarizing, exploring,extracting etc.
• Basic research questions therefore mightinclude ‘What is the relationship betweenknowledge discovery and representations?’ ‘Dorepresentations change how decisions arearrived at?’ ‘At what stages in knowledgediscovery can visualization be used?’
• Although some recent experiments on theuse of particular maps in some spatialdecision making processes have not beenparticularly successful (Jankowski andNyerges, 2000), it is expected that maps ingeneral will still prove to be of significantuse in such decision making. We should notein particular the important potential role ofvisualization in integrating multivariatedatasets and in facilitating therepresentations of environmental scenarios,problems and solutions. DiBiase et al.(1994), for example, suggest thatpractitioners prefer univariate smallmultiples, rather than single multivariatemaps – but the relative advantages and
disadvantages of small multiples andcomposite views for different applicationsremains an important open researchquestion. Multi-criteria analysis couldbenefit considerably from such displays(Carver, 1999), but clearly there is need todevelop appropriate and task-specificrepresentations. We contend here thatinteractive representations show mostpromise in this particular spatial decisionmaking process.
• Representations that incorporate dynamic,three-dimensional interfaces providerealistic display for a range ofenvironmental and other workers. If suchtechniques are supplemented by augmentedreality, whereby the real world can be seenthrough a superimposed image, perhapswith sound amplification also, militarypersonnel in training, fire-fighters, miningengineers and utility workers could allbenefit from representations, mainly of aschematic nature. Augmented displays allowusers to cope with both the complexity ofthe real world and the integration ofinformation that is difficult or impossible tosense whilst within that world. The moreintangible representation would contrastwith the ‘real world’ viewed simultaneously,and thus further research is required todetermine exactly what is required fromthese superimposed portrayals.
Users’ responses to representationsand implications for interactivityWhether accessed in multi- or single-userenvironments, representation can be enhancedwith the incorporation of supplementarytechniques.
• Multi-user environments are of importancefor a variety of researchers and decision-makers who are engaged in group work. Inpractical terms, these environments could beuseful for ‘virtual workbenches’, as shown inFigure 7, (Ottoson, 1999) where missioncritical handling of dynamic, three-dimensional spaces (for example for airtraffic control) requires the input andparticipation of a number of users. Again,such constructs require investigation todetermine effective methods of

Vol. 28, No. 1 19
representation and interactivity to ensureefficient use of spatial data. A related issue isthat virtually all past work on visualrepresentation (whether the representationsare static or dynamic, interactive andanimated) has been directed torepresentations to be used by one individualat a time. A conceptual as well as practicalapproach is needed to developrepresentation forms explicitly designed tobe shared.
Figure 7: The Immersive Workbench and theobserver with stereoscopic glasses, trackingsystem and stylus (the grid can be seen in stereowith anaglyph glasses) (from Ottoson, 1999)
• The efficiency of representation may begoverned by user reaction to the data beingportrayed. It may be possible for the samedata, for example some terrain information,to be represented by a DTM mesh, arendered perspective view, or a planimetricmap. User perception may be directed bypreference and experience. The competenceof users must be addressed and appropriaterepresentations created for differing usercommunities. The role of visualization in airtraffic control (as indicated above) is clearlyof considerable importance, as is therepresentation of the route of a tourist hikefor adventure holiday participants. Theseuser groups are likely, however, to havediffering experiences for using, expectationsfrom and interactions with, therepresentations presented.
• Facilitating navigation in complexgeoinformation spaces represented byvirtual environments and through virtualrepresentations of datasets is a researchchallenge. Investigations into interactivitywill clearly play a role in approaching thischallenge, as will work on interfaces anduser cognition. In terms of representation,there are issues such as displaying currentposition within the environment, routespreviously followed, and possibilities for
movement, which need addressing to ensureefficient navigation. Methods are alreadyestablished to initiate ‘external interactivity’from within cartographic visualizationsoftware: access to web sites, linkages toexternal databases through brushing, andtriggering of statistical analysis from within arepresentation are all possible. Furtherdevelopment is required to establish a moreuseful method, which we term ‘internalinteractivity’, whereby traditional mapdisplays can be altered in themselves(Andrienko and Andrienko, 1999a) inresponse to user input; or automatedmethods of determining parameters foranalysis could be invoked. This mightextend to detecting and measuring eye-movement parameters or finding new waysof identifying, selecting or concentrating ondata within a map. In effect, the interactionbetween the human user and the automateddata mining tool needs to be morespecifically examined in the context ofgraphical display. Methods of doing this willincorporate research into intelligent agentsand other automated tools which allow for‘smartness’ to be included within the mapdisplay.
Tools and technology forrepresentationA range of display technology methods isalready used for cartographic representationand embedded into visualization systems forhandling spatial data. There is considerablescope, however, to further research into therepresentation methods which take advantage ofnew technologies, particularly those which makenew kinds of representation possible (such asenvironments completely experienced throughsound, tactile and kinaesthetic feedback, ratherthan merely visually ).
Hardware• An increasingly important technology
associated with spatial data handling is‘wearable computers’ (Mann, 1997). Inrelation to the representation of geospatialdata, these provide mechanisms wherebysuch data can be presented to an outdooruser to supplement the real world(‘augmented reality’) or by which such data can
20 Cartography and Geographic Information Science
surround a user’s senses within the confinesof a head-mounted display. Questionsremain regarding the interface between theartificial world as superimposed on a filterover the eyes and the real world viewedthrough it: what kinds of representation areappropriate for tasks where such constructsare used? What representations can beemployed in head mounted displays toimprove a user’s experiences of reality? Theterm 'wearable computers' can also coverdistinctly different technologies such asmobile communications. In this context, animportant research challenge is to developnew (perhaps multi-modal) representationsthat are effective on mobile communicationsdevices with restricted graphical capabilities.Cartographic research has already beeninitiated in this area (Hardy, 2000).
• Immersive environments have been furtherdeveloped recently, from the initialbeginnings of ‘video-walls’, giving large-scalerepresentations of spatial environments, tofully enclosed CAVEs in which realisticimages of spatial representation canengender natural and added-valueresponses to data. What is the role ofabstract data representations in immersiveenvironments and how is visualization bestundertaken?
• We have already discussed the conceptualnature of designing representations forshared use: the technology of such multi-userenvironments is also of importance. Thesemethods of display, which can also beimmersive, allow for social interaction andshared experiences. These can involve anassembly inside a CAVE; group viewing ofvisualization monitors; web-based multi-userinteraction; and the use of avatars and othersurrogates within a scene. Such interactioncan occur simultaneously or separately intime and/or place, and is of considerablebenefit during the course of co-operativeproblem solving and decision making in aspatial context (for example, inenvironmental management or in cityplanning). Here, ideas can be discussed,opinions harmonized and solutions agreed.Do collaborative multi-user environmentsrequire different forms of representationand how do we achieve these in avisualization context? How can we representcomplex, multivariate, multi-scale geospatial
data to groups of users (who may bringdifferent disciplinary perspectives of socialconcerns to the task) in ways that facilitatecollaboration among individuals on taskssuch as finding relevant information in vastdata warehouses and making subsequentdecisions based upon those data? How dowe represent the existence, actions,relationships and viewpoints of the eachuser in a group of collaborators mosteffectively?
Data formats and coding methods• As has been indicated, software tools for
creating VR scenes (such as VRML, OpenGLand Java 3D) can form the basis foraccessing new, possibly hyper-realistic,representations of spatial reality. Each ofthese tools shares a core goal of cross-platform compatibility – particularlyimportant for supporting the extension ofgeovisualization methods and techniques(developed to facilitate scientific research)into an increasing array of new domains thatincludes business, education, planning anddecision making applications. The existenceof the GeoVRML working group isindicative of the potential role of co-operation between cartographers and thewider computer graphics community inaddressing concerns in representing spatialdata. Certainly, the format and scope ofVRML has been positively developed by theGeoVRML group (Reddy et al., 1999). Thesetechniques allow for the enhanced anddetailed representation of data projectedinto three-dimensional views of geographicspace within environments that respond atspeed in real time. They act as naturalinterfaces to cartographic data beyond thetwo-dimensional static map.
• Research into the means of rendering suchrepresentations must address concepts thatcartographic researchers have addressed inresponse to previous technological advances.Research focused on the portrayal of text,the possibilities of color and shading andthe techniques of legend creation are a fewexamples of standard cartographic concernsthat take on a new urgency, in the context ofrapidly evolving technologies forrepresentation, interaction withrepresentations and dissemination of thoserepresentations. These traditional, if
Vol. 28, No. 1 21
expanded, concerns are matched in three-dimensional environments by questions suchas: how should navigational aids and pathsthrough immersive three-dimensionalspaces be represented; what is the nature ofdata best suited to such display; are designissues for immersive environments differentto those of two-dimensional static maps; towhat extent should levels of detail (LOD) beincorporated with representations; and howdo we stream such data from the datamodel, through communication links to arealistic and data-rich representation?
• Web-initiated novel techniques for codingand structuring data, such as XML(eXtensible Markup Language), GML (thegeographic XML implementation) andSMIL (Synchronized Multimedia IntegrationLanguage), will provide means for handlingspatial data (Bosak and Bray, 1999).Developing these specifications to containmethods for portraying and interacting withgeospatial information for visualizationshould prove beneficial. Ultimately‘stylesheets’ for visualization that encodeknowledge about exploratory techniques forspatial information might be developed andapplied based upon the data, user and taskin hand. Transformation is fundamental torepresentation for visualization and theXSLT specification provides a means fortransforming between differentrepresentations defined in XML.
Synthesis and linkagesThe volume in which this paper appearsaddresses the work of the ICA Commission onVisualization and Virtual Environments from anumber of perspectives. Research onrepresentation underpins many of the otherissues addressed in accompanying papers,exploring as it does the fundamental nature ofcartographic display using new media. From theoutset we have addressed the intrinsic links withthe other areas considered. Initially, thestructure and content of the spatial databasesfrom which the representation is drawn, andcomputational methods applied to those dataprior to or in concert with visualization, willclearly have an impact on the nature of thevisualization process. Further, and implicit in thereview of technology outlined above, the role of
the user or viewer in perceiving the resultantrepresentation is important. Many new (orunderstudied) cognitive issues are raised whendynamism, senses such as hearing and touch,immersive displays and avatars are incorporatedinto the cartographic representation. Theimplied role of interactivity is a vital part of thedisplay. Another paper in this volume addressesthe impact of navigational control, user inputand behavior when representations aresupplemented (using whatever means) byfeedback loops. Similarly, the representation ofspatial data needs to be addressed within thewider context of the overall interface betweensystem and user: for example, the visualprogramming paradigm demonstrates anevident and useful overlap between interfaceand representation. Means of conveyingrepresentations (by vision, sound or touch),methods of displaying extra information (suchas legends and scale), and techniques ofinforming the user of interactivity possibilities,are all part of the design and implementation ofan effective human interface.
Research work in all these areas depends on theproduction of prototypes that advance the fieldand allow for testing - of the expanding range ofrepresentation methods, of the technologicaltools used to portray representations within acartographic system, and of the effectiveness ofsuch representations for real-world applicationsand real-world users.
Summary
The previous sections of this paper haveaddressed some of the large number of researchissues associated with contemporary progress incartographic representation. This summarypresents five broad themes that we propose as astructure through which to approach proposedresearch work in this area.
• Characteristics of data. Which datacharacteristics are important fordetermining appropriate representations forvisualization? Effectively, we must determinewhat we need to know about the data torepresent it successfully. It may be possibleto develop some rules (based on semantics
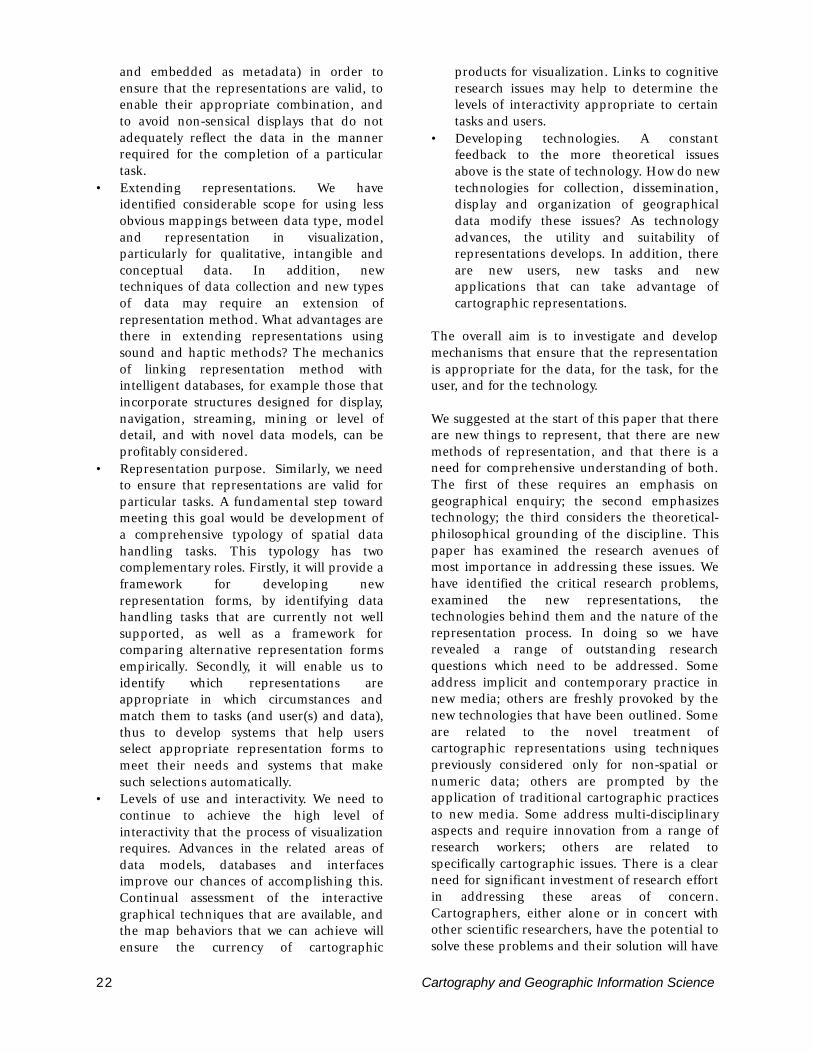
22 Cartography and Geographic Information Science
and embedded as metadata) in order toensure that the representations are valid, toenable their appropriate combination, andto avoid non-sensical displays that do notadequately reflect the data in the mannerrequired for the completion of a particulartask.
• Extending representations. We haveidentified considerable scope for using lessobvious mappings between data type, modeland representation in visualization,particularly for qualitative, intangible andconceptual data. In addition, newtechniques of data collection and new typesof data may require an extension ofrepresentation method. What advantages arethere in extending representations usingsound and haptic methods? The mechanicsof linking representation method withintelligent databases, for example those thatincorporate structures designed for display,navigation, streaming, mining or level ofdetail, and with novel data models, can beprofitably considered.
• Representation purpose. Similarly, we needto ensure that representations are valid forparticular tasks. A fundamental step towardmeeting this goal would be development ofa comprehensive typology of spatial datahandling tasks. This typology has twocomplementary roles. Firstly, it will provide aframework for developing newrepresentation forms, by identifying datahandling tasks that are currently not wellsupported, as well as a framework forcomparing alternative representation formsempirically. Secondly, it will enable us toidentify which representations areappropriate in which circumstances andmatch them to tasks (and user(s) and data),thus to develop systems that help usersselect appropriate representation forms tomeet their needs and systems that makesuch selections automatically.
• Levels of use and interactivity. We need tocontinue to achieve the high level ofinteractivity that the process of visualizationrequires. Advances in the related areas ofdata models, databases and interfacesimprove our chances of accomplishing this.Continual assessment of the interactivegraphical techniques that are available, andthe map behaviors that we can achieve willensure the currency of cartographic
products for visualization. Links to cognitiveresearch issues may help to determine thelevels of interactivity appropriate to certaintasks and users.
• Developing technologies. A constantfeedback to the more theoretical issuesabove is the state of technology. How do newtechnologies for collection, dissemination,display and organization of geographicaldata modify these issues? As technologyadvances, the utility and suitability ofrepresentations develops. In addition, thereare new users, new tasks and newapplications that can take advantage ofcartographic representations.
The overall aim is to investigate and developmechanisms that ensure that the representationis appropriate for the data, for the task, for theuser, and for the technology.
We suggested at the start of this paper that thereare new things to represent, that there are newmethods of representation, and that there is aneed for comprehensive understanding of both.The first of these requires an emphasis ongeographical enquiry; the second emphasizestechnology; the third considers the theoretical-philosophical grounding of the discipline. Thispaper has examined the research avenues ofmost importance in addressing these issues. Wehave identified the critical research problems,examined the new representations, thetechnologies behind them and the nature of therepresentation process. In doing so we haverevealed a range of outstanding researchquestions which need to be addressed. Someaddress implicit and contemporary practice innew media; others are freshly provoked by thenew technologies that have been outlined. Someare related to the novel treatment ofcartographic representations using techniquespreviously considered only for non-spatial ornumeric data; others are prompted by theapplication of traditional cartographic practicesto new media. Some address multi-disciplinaryaspects and require innovation from a range ofresearch workers; others are related tospecifically cartographic issues. There is a clearneed for significant investment of research effortin addressing these areas of concern.Cartographers, either alone or in concert withother scientific researchers, have the potential tosolve these problems and their solution will have

Vol. 28, No. 1 23
a significant impact on the nature and practiceof cartography, scientific visualization and theapplications domains that use ourrepresentation methods.
References
Aarninkhof, S. and Holman, R., 1999,Monitoring the nearshore with video, Backscatter,10 (2), 8-11.
Andrienko, N. and Andrienko, G., 1997,Intelligent cartographic visualization forsupporting data exploration in the IRIS system,Programming and Computer Software, 23 (5), 268-282.
Andrienko, N. and Andrienko, G., 1999a,Interactive maps for visual data exploration,International Journal of GIS, 13 (4), 355-374.
Andrienko, N. and Andrienko, G., 1999b, Datacharacterization schema for intelligent supportin visual data analysis, in Spatial InformationTheory – Cognitive and Computational Foundationsof GIS COSIT’99 (Springer-Verlag Lecture Notesin Computer Science 1661), 349-366.
Andrienko, N. and Andrienko, G., 1999c,Knowledge-based visualization to support spatialdata mining, in Advances in Intelligent DataAnalysis, Proceedings of the Third InternationalSymposium IDA-99, Amsterdam (Springer-VerlagLecture Notes in Computer Science 1642), 149-160.
Andrienko, G. and Andrienko, N. (forthcoming),Exploring spatial data with dominant attributemap and parallel coordinates, Computers,Environment and Urban Systems, 25.
Bertin, J., 1967, Semiologie Graphique, Mouton,Paris, 431pp.
Bishop, I. and Karadaglis, C., 1996, Use ofinteractive immersive visualization techniquesfor natural resources management, SPIEElectronic Imaging, 2656, 128-139.
Blok, C., Kobben, B., Cheng, T., and Kuterema,A., 1999, Visualization of relationships between
spatial patterns in time by cartographicanimation, Cartography and GeographicInformation Science, 26 (2), 139-151.
Board, C., 1967, Maps as models, in Chorley, R.and Haggett, P. (eds.), Models in Geography,Methuen, London, 671-725.
Bosak, J. and Bray, T., 1999, XML and thesecond generation web, Scientific American, May1999.
Brewer, C.A., 1994, Colour use guidelines formapping and visualization, in MacEachren, A.and Taylor, D. (eds.), Visualization in ModernCartography, Pergamon, Oxford, 123-147.
Buttenfield, B., 1993, Proactive graphics andGIS: prototype tools for query, modeling anddisplay, Proceedings of Auto Carto 11, Minneapolis,377-385.
Buttenfield, B. and Beard, K., 1994, Graphicaland geographical components of data quality, inHearnshaw, H. and Unwin, D. (eds.),Visualization in Geographical Information Systems,Wiley, Chichester, 150-157.
Buziek, G., 1997, The design of a cartographicanimation – experiences and results, Proceedingsof the 18th International Cartographic Conference,Stockholm, 1344-1351.
Buziek, G., 2000a, Legend design for non-interactive cartographic animations, Computersand Geosciences, 26 (1), 21-28.
Buziek, G., 2000b, Contributions to the concept ofcartographic visualization, Habilitation Thesis,Wissenschaftliche Arbeiten der FachrichtungVermessungswesen der Universitat Hannover.
Carr, D., Littlefield, R., Nicholson, W. andLittlefield, J., 1987, Scatterplot matrixtechniques for large N, Journal of the AmericanStatistical Association, 82 (398), 424-436.
Cartwright, W., 1997, The application of a newmetaphor set to depict geographic informationand associations, Proceedings of the 18thInternational Cartographic Conference, Stockholm,654 – 662.

24 Cartography and Geographic Information Science
Carver, S., 1999, Developing web-basedGIS/MCE: improving access to data and spatialdecision support tools, in Thill, J-C. (ed.), SpatialMulti-criteria Decision Making and Analysis,Ashgate, Aldershot, 394pp.
Cleveland, W., 1993, Visualizing data, HobartPress, Summit, New Jersey, 360pp.
Collins, B.M. (1993). Data visualization – has itall been done before? in Earnshaw, R.A. and D.Watson (eds.), Animation and ScientificVisualization: Tools and Applications, AcademicPress, New York.
Davis, T. and Keller, C.P., 1997, Modelling andvisualizing multiple spatial uncertainties,Computers and Geosciences, 23(4), 397-408.
DiBiase, D., 1990, Visualization in the earthsciences, Earth and Mineral Sciences, Bulletin of theCollege of Earth and Mineral Sciences, Penn StateUniversity, 59(2) 13-18 (online atwww.geovista.psu.edu/publications/others/dibiase90/swoopy.html).DiBiase, D., Reeves, C., Krygier, J., MacEachren,A.M., von Weiss, M., Sloan, J. and Detweiller, M.,1994, Multivariate display of geographic data:applications in earth system science, inMacEachren, A. and Taylor, D. (eds.),Visualization in Modern Cartography, Pergamon,Oxford, 287-312.
Dodge, M., 1999, Measuring and mapping thegeographies of cyberspace: a research note,NETCOM - Networks and Communications Studies,13 (1/2), 53-67.
Dykes J., 1996, Dynamic maps for spatialscience: a unified approach to cartographicvisualization, in Parker D. (ed.), Innovations inGeographical Information Systems 3, Taylor &Francis, 171-181.
Dykes, J., 1997a, cdv: A flexible approach toESDA with free demonstration software, inProceedings of the 34th Annual Symposium, BritishCartographic Society, Leicester, 100-107.
Dykes J., 1997b, Techniques for adding spatialinformation to statistical plots of geographicaldata, in New Technologies and Techniques forStatistics II, IOS Press, 261-278.
Dykes, J., 1998, Cartographic visualization:exploratory spatial data analysis with localindicators of spatial association using Tcl/Tk andcdv, The Statistician, 47(3), 485-497.
Dykes, J., Moore, K. and Fairbairn, D., 1999,From Chernhoff to Imhof and beyond: VRMLand cartography, VRML '99, Proceedings of theFourth ACM SIGGRAPH Symposium on the VirtualReality Modeling Language, Paderborn, Germany,99-104.
Edsall, R., 1999, Development of interactivetools for the exploration of large geographicdatabases, Proceedings of the 19th InternationalCartographic Conference, Ottawa, 667-675.
Edsall, R., Harrower, M. and Mennis, J., 2000,Visualizing properties of temporal and spatialperiodicity in geographic data, Computers andGeosciences, 26 (1) 109-118.
Fabrikant, S., 2000, Spatialized browsing in largedata archives, Transactions in GIS, 4, 65-78.
Fisher, P., 1994, Hearing the reliability inclassified remotely sensed images, Cartographyand Geographic Information Systems, 21, 31-36.
Forrest, D., 1991, Classifying cartographicrepresentations for cartographic design expertsystems, Proceedings of the 15th InternationalCartographic Conference, Bournemouth, 450-454.
Freitag, U., 1993, Map functions, in Kanakubo,T. (ed.), The selected main theoretical issues facingcartography, reprinted in Cartographica 30 (4), 1-6.
Friedman, J., 1987, Exploratory projectionpursuit, Journal of the American StatisticalAssociation, 82 (397), 249-266.
Gahegan, M., 1999, Four barriers to thedevelopment of effective exploratoryvisualization tools for the geosciences,International Journal of Geographic InformationScience, 13 (4), 289-310.
Gahegan, M., Takatsuka, M. Wheeler, M., andHardisty, F. 2000, GeoVISTA Studio: ageocomputational workbench, Proceedings,
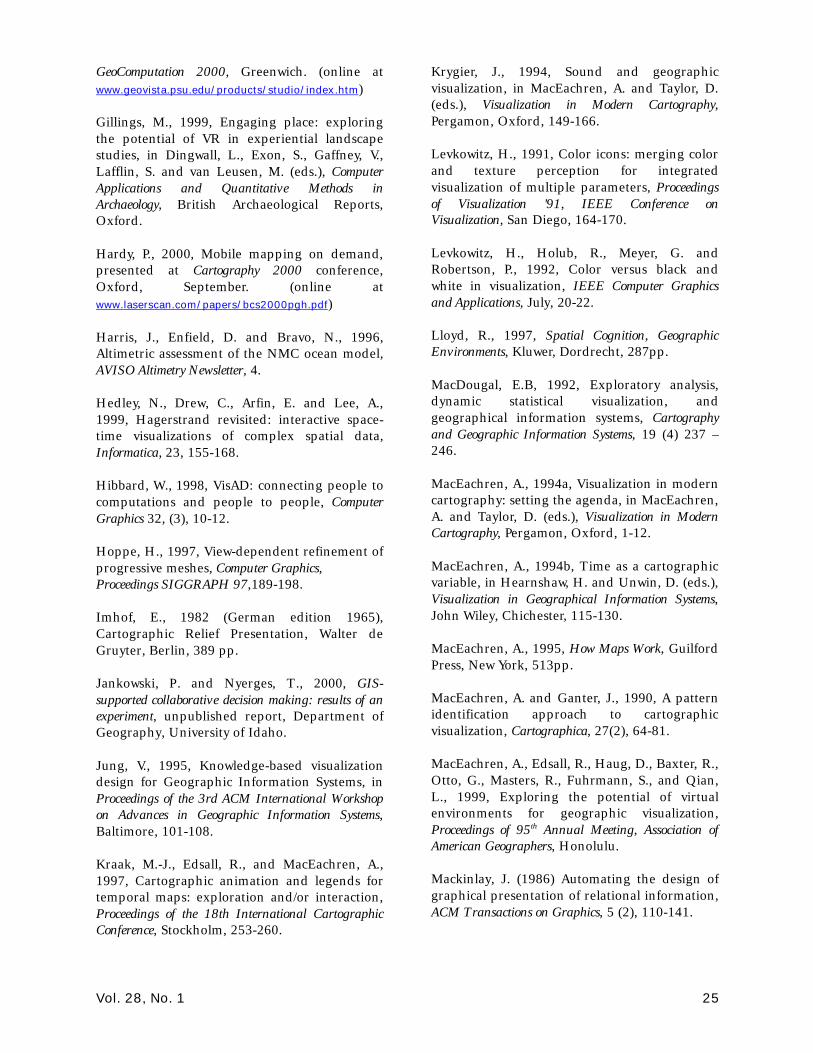
Vol. 28, No. 1 25
GeoComputation 2000, Greenwich. (online atwww.geovista.psu.edu/products/studio/index.htm)
Gillings, M., 1999, Engaging place: exploringthe potential of VR in experiential landscapestudies, in Dingwall, L., Exon, S., Gaffney, V.,Lafflin, S. and van Leusen, M. (eds.), ComputerApplications and Quantitative Methods inArchaeology, British Archaeological Reports,Oxford.
Hardy, P., 2000, Mobile mapping on demand,presented at Cartography 2000 conference,Oxford, September. (online atwww.laserscan.com/papers/bcs2000pgh.pdf)
Harris, J., Enfield, D. and Bravo, N., 1996,Altimetric assessment of the NMC ocean model,AVISO Altimetry Newsletter, 4.
Hedley, N., Drew, C., Arfin, E. and Lee, A.,1999, Hagerstrand revisited: interactive space-time visualizations of complex spatial data,Informatica, 23, 155-168.
Hibbard, W., 1998, VisAD: connecting people tocomputations and people to people, ComputerGraphics 32, (3), 10-12.
Hoppe, H., 1997, View-dependent refinement ofprogressive meshes, Computer Graphics,Proceedings SIGGRAPH 97,189-198.
Imhof, E., 1982 (German edition 1965),Cartographic Relief Presentation, Walter deGruyter, Berlin, 389 pp.
Jankowski, P. and Nyerges, T., 2000, GIS-supported collaborative decision making: results of anexperiment, unpublished report, Department ofGeography, University of Idaho.
Jung, V., 1995, Knowledge-based visualizationdesign for Geographic Information Systems, inProceedings of the 3rd ACM International Workshopon Advances in Geographic Information Systems,Baltimore, 101-108.
Kraak, M.-J., Edsall, R., and MacEachren, A.,1997, Cartographic animation and legends fortemporal maps: exploration and/or interaction,Proceedings of the 18th International CartographicConference, Stockholm, 253-260.
Krygier, J., 1994, Sound and geographicvisualization, in MacEachren, A. and Taylor, D.(eds.), Visualization in Modern Cartography,Pergamon, Oxford, 149-166.
Levkowitz, H., 1991, Color icons: merging colorand texture perception for integratedvisualization of multiple parameters, Proceedingsof Visualization '91, IEEE Conference onVisualization, San Diego, 164-170.
Levkowitz, H., Holub, R., Meyer, G. andRobertson, P., 1992, Color versus black andwhite in visualization, IEEE Computer Graphicsand Applications, July, 20-22.
Lloyd, R., 1997, Spatial Cognition, GeographicEnvironments, Kluwer, Dordrecht, 287pp.
MacDougal, E.B, 1992, Exploratory analysis,dynamic statistical visualization, andgeographical information systems, Cartographyand Geographic Information Systems, 19 (4) 237 –246.
MacEachren, A., 1994a, Visualization in moderncartography: setting the agenda, in MacEachren,A. and Taylor, D. (eds.), Visualization in ModernCartography, Pergamon, Oxford, 1-12.
MacEachren, A., 1994b, Time as a cartographicvariable, in Hearnshaw, H. and Unwin, D. (eds.),Visualization in Geographical Information Systems,John Wiley, Chichester, 115-130.
MacEachren, A., 1995, How Maps Work, GuilfordPress, New York, 513pp.
MacEachren, A. and Ganter, J., 1990, A patternidentification approach to cartographicvisualization, Cartographica, 27(2), 64-81.
MacEachren, A., Edsall, R., Haug, D., Baxter, R.,Otto, G., Masters, R., Fuhrmann, S., and Qian,L., 1999, Exploring the potential of virtualenvironments for geographic visualization,Proceedings of 95th Annual Meeting, Association ofAmerican Geographers, Honolulu.
Mackinlay, J. (1986) Automating the design ofgraphical presentation of relational information,ACM Transactions on Graphics, 5 (2), 110-141.

26 Cartography and Geographic Information Science
Mahoney, D., 1999, The picture of uncertainty,Computer Graphics World, 22 (11).
Mann, S., 1997, Wearable computing: a first stepto personal imaging, IEEE Computer, 30(February) 25-31.
Monmonier, M., 1989, Geographic brushing:enhancing exploratory analysis of the scatterplotmatrix, Geographical Analysis, 21, 81-84.
Morrison, J.B, Tversky, B. and Betrancourt, M.,2000, Animation: does it facilitate learning?Proceedings of Smart Graphics 2000: AAAI SpringSymposium, Stanford.
Muchaxo, J., Neves, J.N. and Câmara, A.S.,1999, A real-time, level of detail editablerepresentation for phototextured terrains withcartographic coherence, in Câmara, A.S. andRaper, J.F. (eds.), Spatial Multimedia and VirtualReality, Taylor & Francis, London, 137-146.
Muller, J.-C. and Wang, Z, 1990, A knowledge-based system for cartographic symbol design,The Cartographic Journal, 27 (1), 24-30.
Ogrissek, R., 1982, ErkenntnistheoretischeGrundlagen und Erkenntniegewinnung in derKartographie, Kartographische Bausteine 3, TUDresden, 78pp.
Openshaw, S., Waugh, D., and Cross, A., 1994,Some ideas about use of map animation as aspatial analysis tool, in Hearnshaw, H. andUnwin, D. (eds.), Visualization in GeographicalInformation Systems, John Wiley, Chichester, 131-138.
Ottoson, P., 1999, Virtual reality in visualization,planning and design of roads, in Proceedings ofthe 19th International Cartographic Conference,Ottawa, Session 19-D.
Pang, A., Wittenbrink, C. and Lodha, S., 1997,Approaches to uncertainty visualization, VisualComputer, 13, 370-390.
Pavlidis, T., 1982, Algorithms for graphics andimage processing, Computer Science Press,Rockville, Maryland, 416pp.
Reddy, M., Iverson, L. and Leclerc, Y., 1999,Enabling geographic support in virtual reality
modeling with GeoVRML, Cartography andGeographic Information Science, 26 (3), 180.
Rheingans, P., 1997, Dynamic color mapping ofbivariate qualitative data, Proceedings Visualization'97 IEEE Conference on Visualization, Phoenix,159-166.
Rhyne, T.M., 1994, The application visualizationsystem (AVS) as a tool for visualizing geographicdata sets, in MacEachren, A. and Taylor, D.(eds.), Visualization in Modern Cartography,Pergamon, London, 106-112.
Robinson, A., 1952, The Look of Maps, Universityof Wisconsin Press, Madison, 105pp.
Schroeder, W., Martin, K. and Lorensen, B.,1997, The Visualization Toolkit: an object orientedapproach to 3D graphics, Prentice Hall, 646pp.
Sharma, R., Poddar, I., Ozyildiz, E., Kettebekov,S., Kim, H. and Huang, T., 1999, Towardinterpretation of natural speech/gesture: spatialplanning on a virtual map, Proceedings of ARLAdvanced Displays 3rd Annual Symposium, Adelphi,MD, 35-39.
Shepherd, I., 1995, Putting time on the map:dynamic displays in data visualization and GIS,in Fisher, P.F. (ed.), Innovations in GIS 2, Taylor &Francis, London, 169-187.
Shiffer, M., 1995, Environmental Review withHypermedia Systems, Environment and PlanningB: Planning and Design, 22, 359-372.
Slocum, T., Yoder, S., Kessler, F. and Sluter, R (inpress), MapTime: software for exploring spatio-temporal data, Cartographica.
Swayne, D., Cook, D. and Buja, A., 1997, XGobi:interactive dynamic data visualization in the Xwindow system, Journal of Computational andGraphical Statistics, 7 (1), 113-130.
Szego, J., 1987, Human cartography: mapping theworld of man, Swedish Council for BuildingResearch, Stockholm, 237pp.
Treinish, L.A., 1995, Visualization of scatteredmeterological data, IEEE Computer Graphics andApplications, 15 (4), 6.

Vol. 28, No. 1 27
Tufte, E., 1983, The Visual Display of QuantitativeInformation, Graphics Press, Cheshire,Connecticut, 197pp.
Tukey, J., 1977, Exploratory Data Analysis,Addison Wesley, Reading, Massachusetts, 688pp.
Wheless, G., Lascara, C., Valle-Levinson, A.,Brutzman, D., Sherman, W., Hibbard, W. andPaul, B., 1996, Virtual Chesapeake Bay:interacting with a coupled physical/biologicalmodel, IEEE Computer Graphics and Applications,16 (4), 52-57.
Wills, G., 1999, NicheWorks - interactivevisualization of very large graphs, Journal ofComputational and Graphical Statistics, 8 (2), 190-212.
Wise, J., Thomas, J., Pennock, K., Lantrip, D.,Pottier, M., Schur, A. and Crow, V., 1995,Visualizing the non-visual: spatial analysis andinteraction with information from textdocuments, Proceedings of the IEEE 1995
Symposium on Information Visualization, Atlanta,51-58.
Wood, J., Wright, H., and Brodlie, K., 1997,Collaborative visualization, in Yagel, R. andHagen, H. (eds.), Proceedings, IEEE InformationVisualization 1997, Phoenix, 253-260.
Wood, J.D., Fisher, P.F., Dykes, J.A., Unwin, D.J.and Stynes, K., 1999, The use of the landscapemetaphor in understanding population data,Environment and Planning B: Planning and Design,26, 281-295.
Yokokohji, Y., Hollis, R. and Kanade, T., 1996,What you can see is what you can feel:development of a visual/haptic interface tovirtual environments, in IEEE Virtual RealityAnnual International Symposium, 46-53.
Zhan, F. and Buttenfield, B., 1995, Object-oriented knowledge-based symbol selection forvisualizing statistical information, InternationalJournal of Geographical Information Systems, 9 (3),293-315.
David Fairbairn is on the staff of the Department of Geomatics, University of Newcastle upon Tyne,Newcastle NE1 7RU, United Kingdom ([email protected]); Gennady and Natalia Andrienko areboth researchers at the GMD National Research Center for Information Technology, SchloßBirlinghoven, D-53754 Sankt Augustin, Germany ([email protected]); Gerd Buziek works forSICAD Geomatics, Otto-Hahn-Ring 6, D-81739 München, Germany ([email protected]); JasonDykes is at the Department of Information Science, City University, London EC1V 0HB([email protected]).
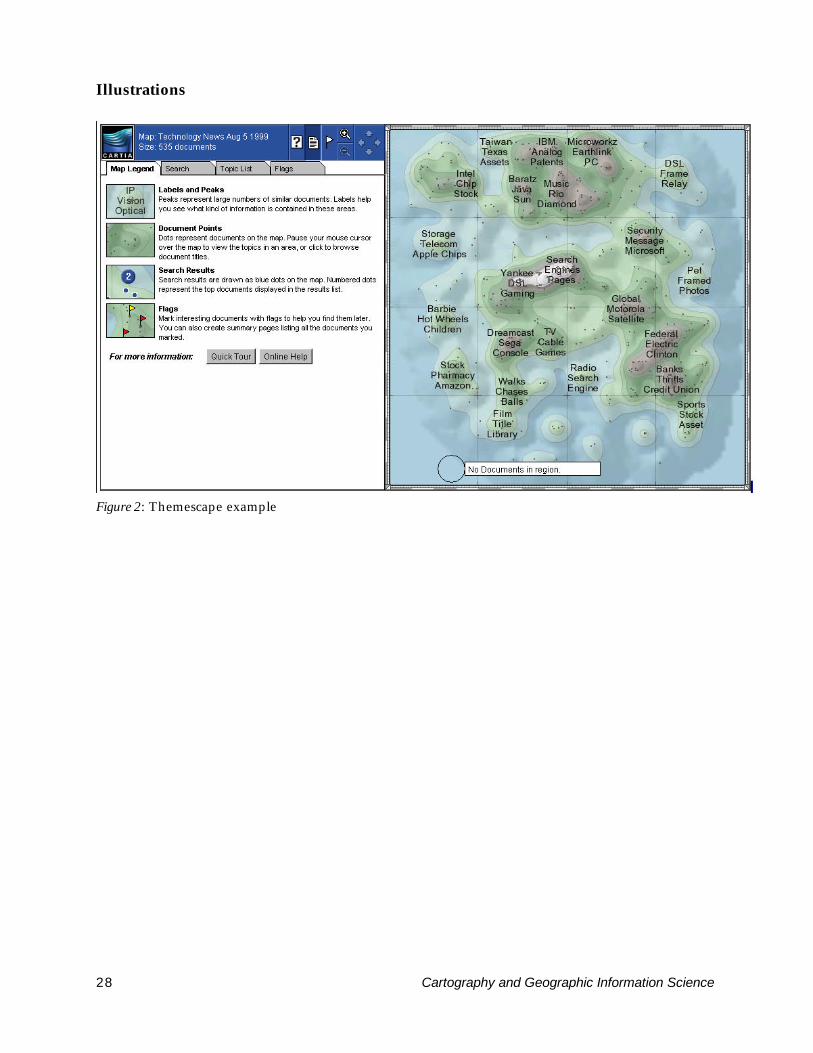
28 Cartography and Geographic Information Science
Illustrations
Figure 2: Themescape example
Vol. 28, No. 1 29
Figure 5: Screen shot of cdv (described in Dykes, 1997a)
Figure 6: Screen shot of Descartes (described in Andrienko and Andrienko, 1999a)