republic of indonesia - jica報告書pdf版(jica...
TRANSCRIPT

Republic of Indonesia
Republic of Indonesia Preparatory Survey on
Intelligent Transport System Project to mitigate Traffic Congestion in Jakarta
(PPP Infrastructure Project) Final Report
March, 2015
Mitsubishi Heavy Industries, Ltd
Mitsubishi Research Institute, Inc. OS
JR(先)
15-019
Japan International Cooperation Agency(JICA)

Currency exchange rate (March, 2015):
1.0 IDR = 0.00927 JPY
1.0 USD = 119.03 JPY

Table of Contents
Summary Preface Background and Aim of the Study ................................................................................................... 1
Pre.1. Study Background ............................................................................................................................................ 1 Pre.2. Purpose of the Study ........................................................................................................................................ 2 Pre.3. Outline of the Project ........................................................................................................................................ 2 Pre.4. Administrative organization having jurisdiction over the transportation sector ............................................ 3 Pre.5. Flowchart of the Study ..................................................................................................................................... 4
Chapter 1. Overview of Socioeconomic Condition of DKI Jakarta ..................................................... 6 1.1 Demography .......................................................................................................................................................... 6 1.2 Economy ................................................................................................................................................................ 8 1.3 Transportation ...................................................................................................................................................... 11 1.4 Necessity of the introduction of ERP in DKI Jakarta ........................................................................................ 23
Chapter 2. Comprehensive Urban Transport Planning .......................................................................... 24 2.1 Framework of the Comprehensive Urban Transport Planning........................................................................ 24 2.2 Basic Policy on Modal Shift ................................................................................................................................ 26 2.3 Current Status Survey of BRT ............................................................................................................................ 30 2.4 Reviews on Traffic Control Measure .................................................................................................................. 41 2.5 Plan for increase of public transport capacity.................................................................................................... 42 2.6 Improvement of Transportation services ........................................................................................................... 47
Chapter 3. ITS related Measures ....................................................................................................................... 59 3.1 Overview of ITS ................................................................................................................................................... 60 3.2 Current ITS Status in Indonesia ......................................................................................................................... 62 3.3 Current ITS Status in DKI Jakarta ...................................................................................................................... 67 3.4 ITS Services Contributing Reduction of Congestion
and Improvement of Public Transport ............................................................... 73
Chapter 4.Review of the Legal Framework .................................................................................................. 78 4.1 Legal Structure for ERP Project Implementation .............................................................................................. 78 4.2 Legal basis of Imposition of ERP ....................................................................................................................... 85 4.3 Institutional Framework on Retribution, Regional Government Revenue and Expenditure ......................... 92 4.4 Legal Framework on Project Scheme ............................................................................................................... 96 4.5 Others ................................................................................................................................................................. 104
Chapter 5.Review of ERP Project Scheme ................................................................................................. 106 5.1 Public-Private-Partnership Project Scheme .................................................................................................... 106 5.2 The Legal Feasibility of ERP Project Scheme ................................................................................................ 116 5.3 Organization Framework, Operation, and Maintenance of ERP Project ...................................................... 116 5.4 Response to Risks on ERP Project ................................................................................................................. 126 5.5 Legal Issues for Implementation of Project ..................................................................................................... 135
Chapter 6.Traffic Condition Survey ............................................................................................................... 138 6.1 Survey Outline ................................................................................................................................................... 138

6.2 Traffic Counting Survey ..................................................................................................................................... 138 6.3 Travel Speed Survey ........................................................................................................................................ 142 6.4 WTP (Willingness To Pay) Survey ................................................................................................................... 149 6.5 Jockey Interview ................................................................................................................................................ 163
Chapter 7.Traffic Demand Forecast .............................................................................................................. 170 7.1 Procedure of Forecast ...................................................................................................................................... 170 7.2 Assumptions ...................................................................................................................................................... 170 7.3 Traffic Demand Forecast .................................................................................................................................. 178
Chapter 8.Preliminary Design of ERP System ......................................................................................... 189 8.1 Overview of the ERP system ........................................................................................................................... 189 8.2 Operational policy of ERP system ................................................................................................................... 195 8.3 Configuration of the ERP system ..................................................................................................................... 229 8.4 Outline specifications of OBU ........................................................................................................................... 233 8.5 Outline specifications of ERP center system .................................................................................................. 235 8.6 Outline specifications of the roadside system ................................................................................................. 236 8.7 Outline specifications of other ERP system components .............................................................................. 238 8.8 Comparison of ERP Technologies ................................................................................................................... 238
Chapter 9. Operation and Management of ERP ....................................................................................... 242 9.1 Estimate of ERP Project Cost .......................................................................................................................... 242 9.2 Revenue of ERP Project ................................................................................................................................... 244 9.3 Financing Plan for Public and Private Sector .................................................................................................. 244 9.4 Financial Analysis .............................................................................................................................................. 245 9.5 Economic Analysis ............................................................................................................................................ 252 9.6 Project Schedule ............................................................................................................................................... 254 9.7 Environmental and Social Considerations ...................................................................................................... 259

Acronyms
ATCS Area Traffic Control System
BRT Bus Rapid Transit
CCTV Closed Circuit TeleVision
DKI Daerah Khusus Ibukota EPC Engineering, Procurement, Construction
ERP Electronic Road Pricing
ETC Electronic Toll Collection System
GDP Gross Domestic Products
GPS Global Positioning Service
IC Integrated Circuit
IDR InDonesia Rupiah
IIGF Indonesian Infrastructure Guarantee Fund
ITS Intelligent Transport Systems
JETRO Japan External TRade Organization
JABODETABEK Jakarta, Bogor, Depok、Tangeran, Bekasi
JICA Japan International Coordination Agency
LTA Land Transport Authority in Singapore
METI (Japanese) Ministry of Economic, Trade and Industry
MOF Ministry of Finance
MOT Ministry of Transport
MPA Metropolitan Priority Area for investment and industry
MRT Mass Rapid Transit
OBU On-Board-Unit
ODA Official Development Aid
PCU Passenger Car Unit
PFI Private Finance Initiative
PPP Public-Private Partnership
PSIF Private Sector Investment Finance
R&D Research and Development
SPC Special Purpose Company

Preparatory Survey on Intelligent Transport System Project to mitigate Traffic Congestion in Jakarta (PPP Infrastructure Project) Final Report Summary
Preface Background and Aim of the Study Pre.1. Study Background (1) Challenges and Achievements (as of today) of Urban Transport Sector in
Republic of Indonesia The population of Jakarta metropolitan area (hereafter JABODETABEK area) in Republic of Indonesia
has extended to approximately 1.6-fold in the last 20 years that is to say the growth was approximately
28 million people in 2010 from about 17 million in 1990. JABODETABEK area is a economoic growth
center, in which population accounts for about 10% of the entire Indonesia, the size of the economy
reaches about 30% of GDP and 40% of foreign investment has been concentrated.
With the economic growth and population growth, vehicle registration number in JABODETABEK area
has soared to almost 5 times to about 14 million units in 2012 from about 3 million units in 2000. On the
other hand, since road infrastructure is not keeping up with the rappid increase of the number of vehicle,
there is serious traffic congestion in JABODETABEK area, and it has caused major economic loss. In
particular, congestion of morning and evening commuting hours is occurring regularly in the 13 km
section, which is located in the heart of JABODETABEK area, between Block-M as a business and
resdidential area in the southern Jakarta, and Kota as an business destrict and old town in the northern
half. In order to improve the above-mentioned situation, the Provicnial Government of DKI Jakarta
(hereafter refered as DKI Jakarta Gov.) has introduced a Bus Rapid Transport system (hereafter refered
as BRT or Transjakarta). In addition, the Government of DKI Jakarta introduced a policy so-called as “3
in 1” regulation, which is vehicle less than 3 passengers per car are not allowed to pass in the certain
road in morning and evening rush hour in order to suppress the flow of vehicles to the city. However,
there are people called “Jockey” on the street who are available when the the number of passenger is
less than 3 that will help to avoid the restrciton of “3 in 1” regulation. Therefore, the effect of the
regulation is remained to be limited, and further measures for the traffic congestion in necessary.
(2) Positioning of this Project and Development Policy of Urban Transport Sector in Republic of Indonesia
According to DKI Jakarta ordinance (Regional Regulation No.12/2002and Governor Regulation
No.103/2007), aiming toward the easing of road traffic congestion in Jakarta metropolitan area,
implementation of Electronic Road Pricing (ERP) policy utiliing Intelligent Transport Systems (ITS) is
planned as an alternative to “3 in 1”regulation, in addition to such policy implementation as the
development of mass transit system including the construction of the subway, the strengthening of traffic
regulations and the expansion of the road network. By implementing the ERP, the inflow restriction of the
vehicle into the city is expected to be strengthened. Furthermore, by encouraging simultaneous shift to
public transport such as a BRT or subway which is now being constructed, further effcte of easing traffic
congestion can be expected. The ITS project including introdction of ERP system to be introduced in the
seriously congested roads for restriction of inflow traffic into the city along the above-menthioned
-1-

Preparatory Survey on Intelligent Transport System Project to mitigate Traffic Congestion in Jakarta (PPP Infrastructure Project) Final Report Summary
ordinance and easing traffic congestion, was positioned as the prioritized project which is to be
completed by 2020 under the agreement between Japan Government and Indonesian Government in
MPA in December in 2010.
(3) Aid Policy of Japan and JICA for Urban Transport Sector In the JICA country analysis paper for Republic of Indonesia, it is analyzed that support of strengthening
of transportation through public-private partnership, and major metropolitan transportation development
with a focus on the JABODETABEK area is a prioritized issue. Moreover, support for further economic
growth as a prioritized support field and support for improvement of business and investment
environment through infrastructure development around JABODETABEK area are specified in the aid
policy for Republic of Indonesia published in April in 2012.
Pre.2. Purpose of the Study The purpose of this study is to conduct feasibility study on implementation of the investment to be done
by Japanese enterprises in the field of ITS and ERP, which can be considered one of the efficient
measures to ease traffic congestion in DKI Jakarta and formulate the proper business plan based on the
public-private-partnership including application of the JICA PSIF financial scheme.
Pre.3. Outline of the Project (1) Study Target Study target area is “JABODETABEK area” in Republic of Indonesia. Target area for project
implementation is DKI (Daerah Khusus Ibukota) Jakarta. Furthermore, ERP introductory target routes
are Corridor 1 (between Blok M and Kota), and Corridor 6 (between Ragunan and Bundaran HI).
Figure Pre.-1 Study target area
Pre.4. Flowchart of the Study
Flowchart of the study is shown as below.
-2-

Preparatory Survey on Intelligent Transport System Project to mitigate Traffic Congestion in Jakarta (PPP Infrastructure Project) Final Report Summary
Table Pre.-1 Study Flowchart
Year/Month 2013 2014 2015
Nov. Dec. Jan. Feb. Mar. Apr. May June July Aug. Sept. Nov. Dec. Jan. Feb. Mar.
Reports
Survey Item
s and Procedures
Basic policy on the survey etc.
Preparation of ITS framework (draft) and institutional design
Development of business plan for ERP project
Economic and financial analysis, Project funding planning, Environment and Social consideration
Major meetings with JICA
Major meetings with Indonesian officials
Review of basic implementation policy
Inception Report P
reparation, Presentation and D
iscussion
Study on the current situations and the
Suggestion of project proponent and O&M framework
Outline design for system
Review on PPP schemes
Final Report
S
ubmission
Collecting Information
Interim R
eport
Economic and financial analysis, Project funding planning
Environment and Social consideration
Confirmation and support on relevant laws, regulations, and
Demand forecast
Development of system design conditions
DF/R IC/R IT/R F/R
IC/R IT/R DF/R
DF/R IT/R IC/R
Review of ITS framework (draft)
Development of construction plan
Calculation of the approximate operating
t
Draft Final R
eport P
resentation and Discussion
Com
ments
Review and suggestion of institutional design etc.
-3-
Preparatory Survey on Intelligent Transport System Project to mitigate Traffic Congestion in Jakarta (PPP Infrastructure Project) Final Report Summary
Chapter 1. Overview of Socioeconomic Condition
of DKI Jakarta 1.1 Transportation 1.1.1 Public Transportation 1.1.1.1 Bus and taxi The number of buses of Transjakarta Busway is shown in the table below. The number of buses has increased
up to 565 in 2012. The number of taxies and other buses in DKI Jakarta is shown as below. The number of
taxies is around 25,000, and the number of bus of intercity and interprovincial is around 3,000. The revenue and
the number of passengers of Transjakarta are shown in the table below. Both the revenue and the passengers
have increased about 1.5 times from 2008 to 2012. In 2012, the annual revenue is around 364 billion Rupiah
and the annual passengers reached 111 million people.
1.1.1.2 Railway The ratio of travel ranging from inside DKI Jakarta and outside DKI Jakarta (Bogor, Depok, Tangeran, Bekasi
area) is overwhelmingly high. The number of passengers in the above section is about 130 million and accounts
for 84% of annual passengers in 2012 which is 160 million.
1.1.2 Number of Registered Motor Vehicles The number of registered motor vehicles in DKI Jakarta is shown as below. The total number has increased 5
times from 3 million in 2000 to 14 million in 2012. The growth of motor cycles is prominent and the number of
motor cycles has increased from 1.6 million in 2000 to 10.8 million in 2012. The average annual growth rate is
around 17.2%. However, the average annual growth rate tends to decrease from around 23.5% of year
2000-2005, to 13.5% of year 2005-2010 to 11.1% of year 2010 -2012. The number of registered motor
vehicles in DKI Jakarta has increased 2.6 times from1.05 million in 2000 to 2.74 million in 2012. The average
annual growth rate is 8.3%.
1.1.3 Current Status of Road Development The paved road length and area of 2012 in DKI Jakarta is shown as below. The total road length is 6,955.8km
and the total road area is 48.5km2 in 2012. The road area is nearly equivalent to 7.3% of the total area of DKI
Jakarta. The growth rate of the paved road length is 0.01% per year which indicates slow pace for improvement.
The DKI Jakarta’s road length per population (,000) is 0.7km and the area per population (,000) is 0.005km2. In
comparison with the data of Tokyo as of the end of 2012, the level is less than half those of Tokyo. The DKI
Jakarta’s road length per number of vehicle (excluding motor cycle) (,000) is 1.8km and the area per number of
vehicle (excluding motor cycle) (,000) is 0.013km2. As compared to the data of Tokyo as of the end of 2012, the
-4-

Preparatory Survey on Intelligent Transport System Project to mitigate Traffic Congestion in Jakarta (PPP Infrastructure Project) Final Report Summary level is equivalent to one-quarter of those of Tokyo and the paved road length does not reach an adequate level.
1.1.4 Public Transport Network 1.1.4.1 Present status of public transport There are various kinds of road based public transport systems in JABODETABEK area. Namely, TransJakarta
in DKI Jakarta, transPakuan in Bogor and so forth. Big buses with more than 50 seats such as Patas AC, Patas
Non-AC and Regular buses, midium-sized buses with 24 seats like Metro Mini and Kopaja, mini-buses with 9 to
14 seats like Microlet, Angkot, are in operation. Taxi, bajaj and bike-taxi (ojek) are serving individual transport
service. Tricycle such as Beca is a short-distance traffic measues, which has not been allowed in operation in
DKI Jakarta since 1990s, because it causes traffic congestion.
Figure1-1-1 Transjakarta network Source:Transjakarta web site
1.2 Necessity of the introduction of ERP in DKI Jakarta As discussed in prior, macroeconomic indicators and population are shown and socio-economic status of DKI
Jakarta, maintenance plans, current status of transport, transport infrastructure and the like were described.
-5-
Preparatory Survey on Intelligent Transport System Project to mitigate Traffic Congestion in Jakarta (PPP Infrastructure Project) Final Report Summary Further deepening on the road traffic congestion in DKI Jakarta can be envisaged in the future even by looking
at any of them. One strategy to halt the further deepening of these road traffic congestion is the expansion of
public transportation, including the city bus and train. Urban development projects to encourage commuting
patterns of peoples behavior that does not depend on the car is also important. In addition, in order to alleviate
road traffic congestion, which currently become obvious already, the introduction of appropriate automobile
traffic management measures is also important.
Another measures to encourage these traffic measures is the reduction of economic policy incentives for car.
Namely raising the economic compensation for vehicle use can be a measure to reduce the relative
attractiveness of motor vehicle. ERP can be positioned in such category of measures. In addition to this, as a
measure to induce a higher cost that occurs with vehicle use, increase of the parking tarrif and raising the price
of gasoline are also placed on the same level of ERP.
By the increase in cost measures associated with vehicle use and raising measures of public transport service
levels being operated concurrently, road traffic congestion in DKI Jakarta will be managed properly. It can be
said that in this context, for the alleviation of serious road traffic congestion in DKI Jakarta today, introduction of
ERP is an essential measure.
-6-
Preparatory Survey on Intelligent Transport System Project to mitigate Traffic Congestion in Jakarta (PPP Infrastructure Project) Final Report Summary
Chapter 2. Comprehensive Urban Transport
Planning 2.1 Framework of the Comprehensive Urban Transport Planning (1) Basic principle The ERP can be considered a tool aiming at urban road traffic congestion mitigation. On the other hand, ERP
alone cannot be expected to sufficiently work as a tool to mitigate urban road traffic congestion. Similarly ITS
alone also cannot be expected to be enough measure to alleviate urban road traffic congestion.
Measures contributing to alleviation of urban road traffic congestion need to be combined with various measures
to be comprehensive. They are, for instance: 1) land-use adjustment policy which maintains proper level of trip
generation based on wide range and long term perspective, 2) economic disincentive policy for road users, 3)
raise of level of service of public transport.
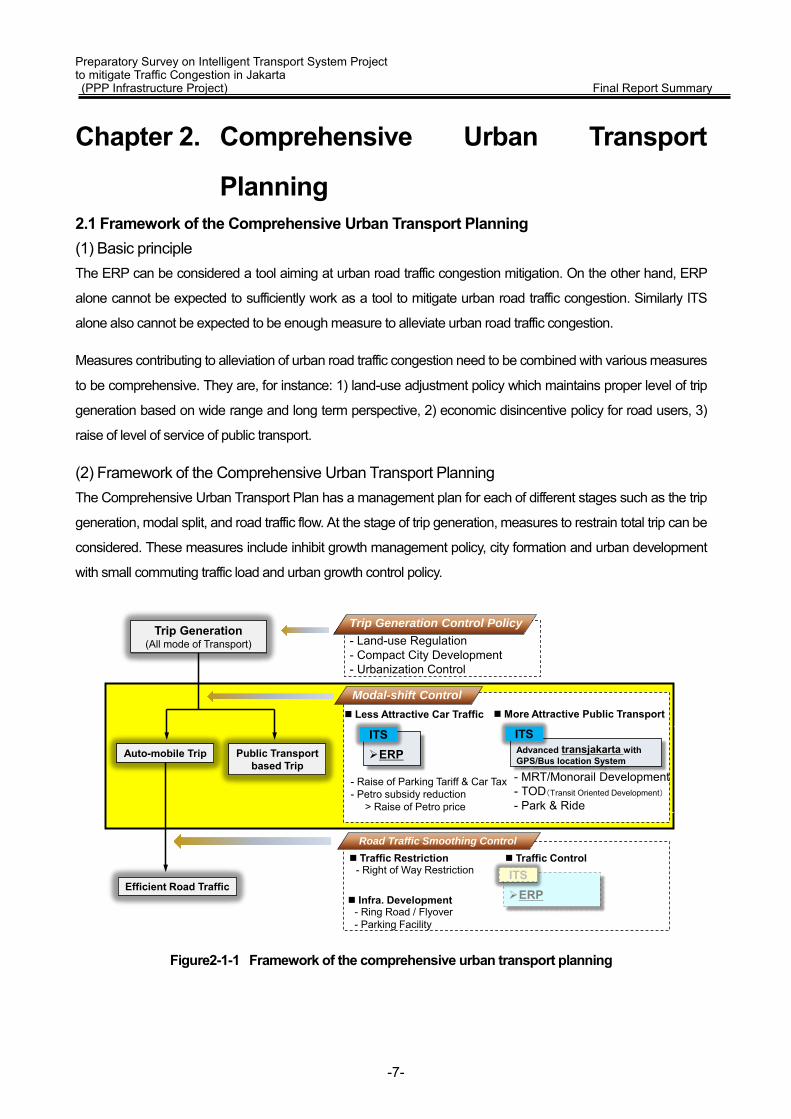
(2) Framework of the Comprehensive Urban Transport Planning The Comprehensive Urban Transport Plan has a management plan for each of different stages such as the trip
generation, modal split, and road traffic flow. At the stage of trip generation, measures to restrain total trip can be
considered. These measures include inhibit growth management policy, city formation and urban development
with small commuting traffic load and urban growth control policy.
Figure2-1-1 Framework of the comprehensive urban transport planning
- Land-use Regulation- Compact City Development- Urbanization Control
Auto-mobile Trip
- MRT/Monorail Development- TOD(Transit Oriented Development)- Park & Ride
Trip Generation Control Policy
Public Transport based Trip
Modal-shift Control
- Raise of Parking Tariff & Car Tax- Petro subsidy reduction
> Raise of Petro price
Road Traffic Smoothing Control
More Attractive Public Transport Less Attractive Car Traffic
Efficient Road Traffic
Traffic Control
ERP
Traffic Restriction- Right of Way Restriction
Infra. Development- Ring Road / Flyover- Parking Facility
ITS
Advanced transjakarta with GPS/Bus location System
ITS
Trip Generation (All mode of Transport)
ERPITS
-7-
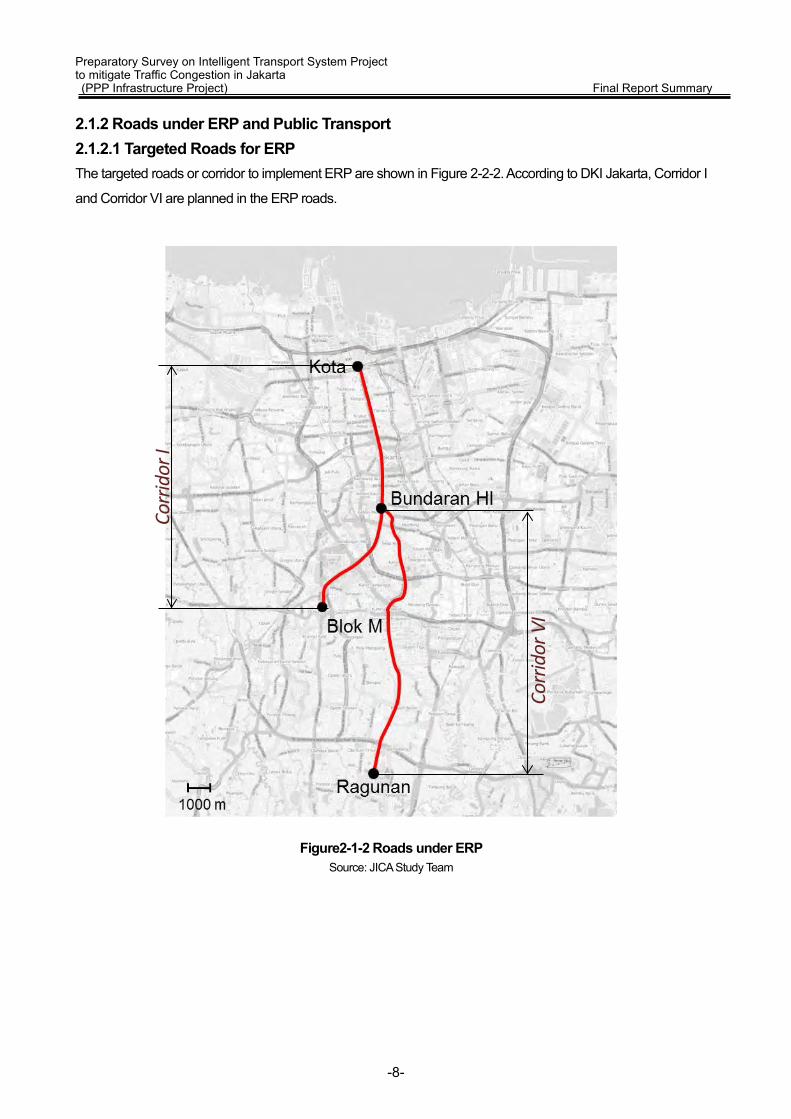
Preparatory Survey on Intelligent Transport System Project to mitigate Traffic Congestion in Jakarta (PPP Infrastructure Project) Final Report Summary 2.1.2 Roads under ERP and Public Transport 2.1.2.1 Targeted Roads for ERP The targeted roads or corridor to implement ERP are shown in Figure 2-2-2. According to DKI Jakarta, Corridor I
and Corridor VI are planned in the ERP roads.
Figure2-1-2 Roads under ERP Source: JICA Study Team
Corri
dor I
Corri
dor V
I
-8-
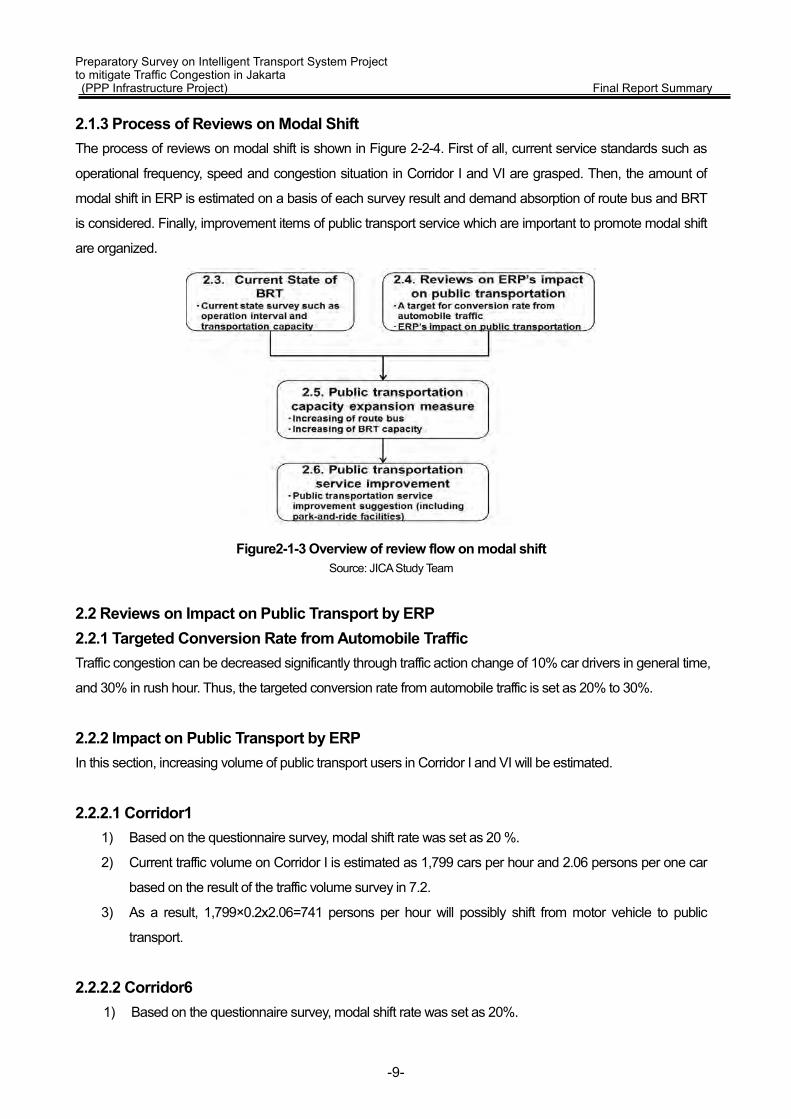
Preparatory Survey on Intelligent Transport System Project to mitigate Traffic Congestion in Jakarta (PPP Infrastructure Project) Final Report Summary 2.1.3 Process of Reviews on Modal Shift The process of reviews on modal shift is shown in Figure 2-2-4. First of all, current service standards such as
operational frequency, speed and congestion situation in Corridor I and VI are grasped. Then, the amount of
modal shift in ERP is estimated on a basis of each survey result and demand absorption of route bus and BRT
is considered. Finally, improvement items of public transport service which are important to promote modal shift
are organized.
Figure2-1-3 Overview of review flow on modal shift Source: JICA Study Team
2.2 Reviews on Impact on Public Transport by ERP 2.2.1 Targeted Conversion Rate from Automobile Traffic Traffic congestion can be decreased significantly through traffic action change of 10% car drivers in general time,
and 30% in rush hour. Thus, the targeted conversion rate from automobile traffic is set as 20% to 30%.
2.2.2 Impact on Public Transport by ERP In this section, increasing volume of public transport users in Corridor I and VI will be estimated.
2.2.2.1 Corridor1 1) Based on the questionnaire survey, modal shift rate was set as 20 %.
2) Current traffic volume on Corridor I is estimated as 1,799 cars per hour and 2.06 persons per one car
based on the result of the traffic volume survey in 7.2.
3) As a result, 1,799×0.2x2.06=741 persons per hour will possibly shift from motor vehicle to public
transport.
2.2.2.2 Corridor6 1) Based on the questionnaire survey, modal shift rate was set as 20%.
-9-
Preparatory Survey on Intelligent Transport System Project to mitigate Traffic Congestion in Jakarta (PPP Infrastructure Project) Final Report Summary
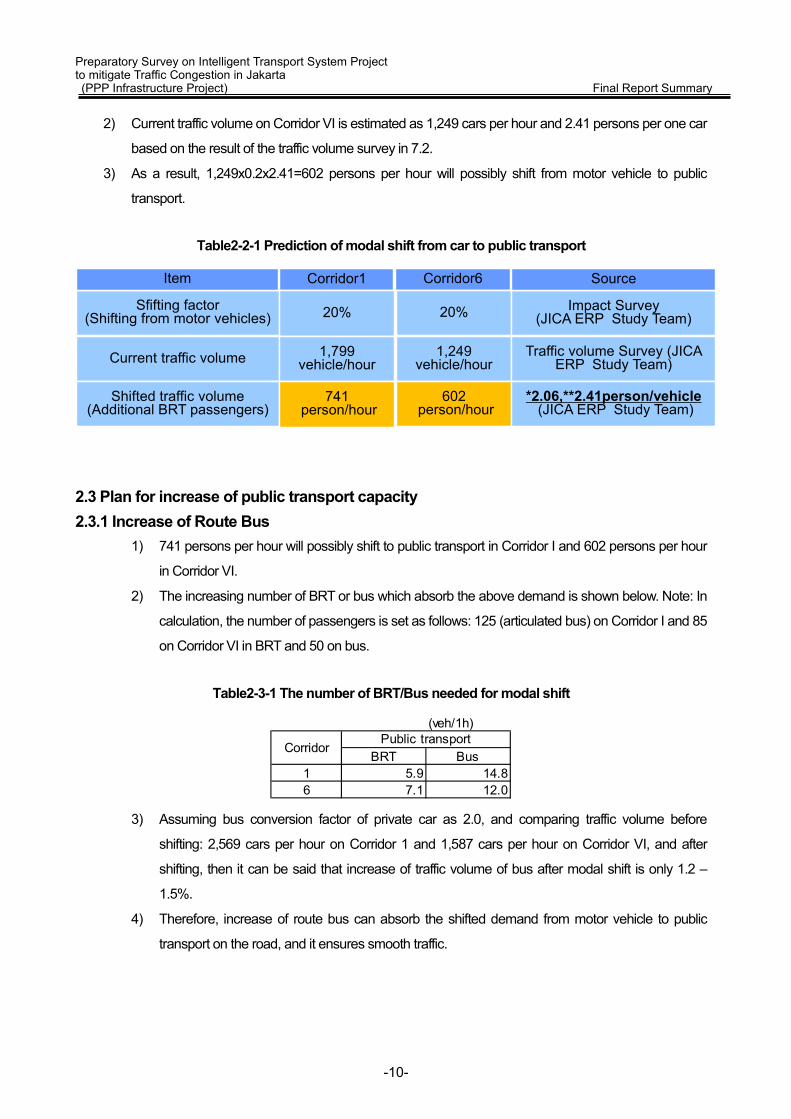
2) Current traffic volume on Corridor VI is estimated as 1,249 cars per hour and 2.41 persons per one car
based on the result of the traffic volume survey in 7.2.
3) As a result, 1,249x0.2x2.41=602 persons per hour will possibly shift from motor vehicle to public
transport.
Prediction of modal shift from car to public transport Table2-2-1
2.3 Plan for increase of public transport capacity 2.3.1 Increase of Route Bus
1) 741 persons per hour will possibly shift to public transport in Corridor I and 602 persons per hour
in Corridor VI.
2) The increasing number of BRT or bus which absorb the above demand is shown below. Note: In
calculation, the number of passengers is set as follows: 125 (articulated bus) on Corridor I and 85
on Corridor VI in BRT and 50 on bus.
The number of BRT/Bus needed for modal shift Table2-3-1
3) Assuming bus conversion factor of private car as 2.0, and comparing traffic volume before
shifting: 2,569 cars per hour on Corridor 1 and 1,587 cars per hour on Corridor VI, and after
shifting, then it can be said that increase of traffic volume of bus after modal shift is only 1.2 –
1.5%.
4) Therefore, increase of route bus can absorb the shifted demand from motor vehicle to public
transport on the road, and it ensures smooth traffic.
Sfifting factor(Shifting from motor vehicles)
Current traffic volume
Shifted traffic volume(Additional BRT passengers)
Corridor6Corridor1Item
20% 20%
1,799vehicle/hour
1,249vehicle/hour
741person/hour
602person/hour
Impact Survey(JICA ERP Study Team)
Traffic volume Survey (JICA ERP Study Team)
*2.06,**2.41person/vehicle(JICA ERP Study Team)
Source
(veh/1h)
BRT Bus1 5.9 14.86 7.1 12.0
CorridorPublic transport
-10-

Preparatory Survey on Intelligent Transport System Project to mitigate Traffic Congestion in Jakarta (PPP Infrastructure Project) Final Report Summary
Chapter 3. ITS related Measures Inthis survey, the development of ITS master plan was initially considered as the study framework of automobile
traffic congestion mitigation measures in DKI Jakarta. ERP was also supposed to be positioned in the ITS
master plan. However, in consultation with DKI Jakarta, many officials had the opinion that the study on ITS was
not enough for considering road traffic congestion mitigation measures.
With this background, the study on ITS master plan has been slightly less meaningful while the meaning and the
importance of considering comprehensive urban road traffic congestion mitigation measures has been
recognized again. Then, it has developed the recognition between the survey team and DKI Jakarta officials that
the interactive development of ITS through ERP could solve traffic congestion and significantly reduce CO2.
In addition, MOT published “Laporan Akhir – Grand Design Penembangan Intelligent Transport System (ITS)”
(final report – grand design of ITS) in 2012. Based on that, this survey provides indirect support for MOT and
therefore it creats ITS master plan centering on ERP in order to support the concretization of MOT’s ITS master
plan.
3.1 Overview of ITS
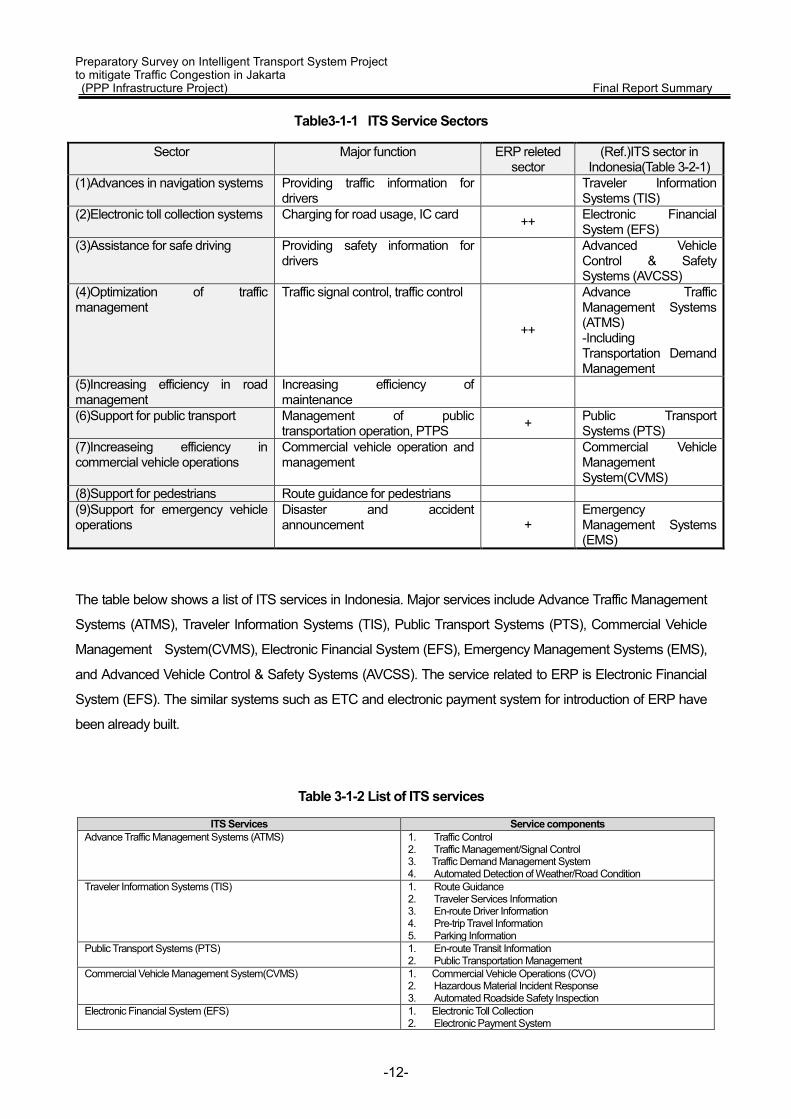
3.1.1 ITS Services To review ITS services in DKI Jakarta, ITS services need to be categorized into possible types. There are 9
service sectors in the early stage of ITS in Japan as Table 3-1-1.
In these ITS service sectors, ERP can be positioned as one of comprehensive ITS measures with utilizing (2)
electronic toll collection systems and (4) optimizing traffic management to reduce traffic congestion. There
arealso desired functions and measures such as (6) support for public transportation and (9) support for
emergency vehicle operations at the same time as ERP. In addition, the functin is expected to bring other function
and measures and have majorripple effect.
ERP and the related measures are one of extremely valuable and high-level ITS measures because those not
only resolve traffic congestion but also become a foundation of various ITS services in DKI Jakarta, Indonesia.
-11-
Preparatory Survey on Intelligent Transport System Project to mitigate Traffic Congestion in Jakarta (PPP Infrastructure Project) Final Report Summary
ITS Service Sectors Table3-1-1
Sector Major function ERP releted sector
(Ref.)ITS sector in Indonesia(Table 3-2-1)
(1)Advances in navigation systems Providing traffic information for drivers Traveler Information
Systems (TIS) (2)Electronic toll collection systems Charging for road usage, IC card ++ Electronic Financial
System (EFS) (3)Assistance for safe driving Providing safety information for
drivers Advanced Vehicle Control & Safety Systems (AVCSS)
(4)Optimization of traffic management
Traffic signal control, traffic control
++
Advance Traffic Management Systems (ATMS) -Including Transportation Demand Management
(5)Increasing efficiency in road management
Increasing efficiency of maintenance
(6)Support for public transport Management of public transportation operation, PTPS + Public Transport
Systems (PTS) (7)Increaseing efficiency in commercial vehicle operations
Commercial vehicle operation and management
Commercial Vehicle Management System(CVMS)
(8)Support for pedestrians Route guidance for pedestrians (9)Support for emergency vehicle operations
Disaster and accident announcement +
Emergency Management Systems (EMS)
The table below shows a list of ITS services in Indonesia. Major services include Advance Traffic Management
Systems (ATMS), Traveler Information Systems (TIS), Public Transport Systems (PTS), Commercial Vehicle
Management System(CVMS), Electronic Financial System (EFS), Emergency Management Systems (EMS),
and Advanced Vehicle Control & Safety Systems (AVCSS). The service related to ERP is Electronic Financial
System (EFS). The similar systems such as ETC and electronic payment system for introduction of ERP have
been already built.
Table 3-1-2 List of ITS services
ITS Services Service components Advance Traffic Management Systems (ATMS) 1. Traffic Control
2. Traffic Management/Signal Control 3. Traffic Demand Management System 4. Automated Detection of Weather/Road Condition
Traveler Information Systems (TIS) 1. Route Guidance 2. Traveler Services Information 3. En-route Driver Information 4. Pre-trip Travel Information 5. Parking Information
Public Transport Systems (PTS) 1. En-route Transit Information 2. Public Transportation Management
Commercial Vehicle Management System(CVMS)
1. Commercial Vehicle Operations (CVO) 2. Hazardous Material Incident Response 3. Automated Roadside Safety Inspection
Electronic Financial System (EFS) 1. Electronic Toll Collection 2. Electronic Payment System
-12-
Preparatory Survey on Intelligent Transport System Project to mitigate Traffic Congestion in Jakarta (PPP Infrastructure Project) Final Report Summary
ITS Services Service components Emergency Management Systems (EMS) 1. Incident Management
2. Emergency Notification 3. Personal Mayday Support 4. Emergency Vehicle Management 5. Public Mayday Support
Advanced Vehicle Control & Safety Systems (AVCSS) 1. Safety Readiness 2. Pre-crash Restraint Deployment 3. Driving Safety Warning
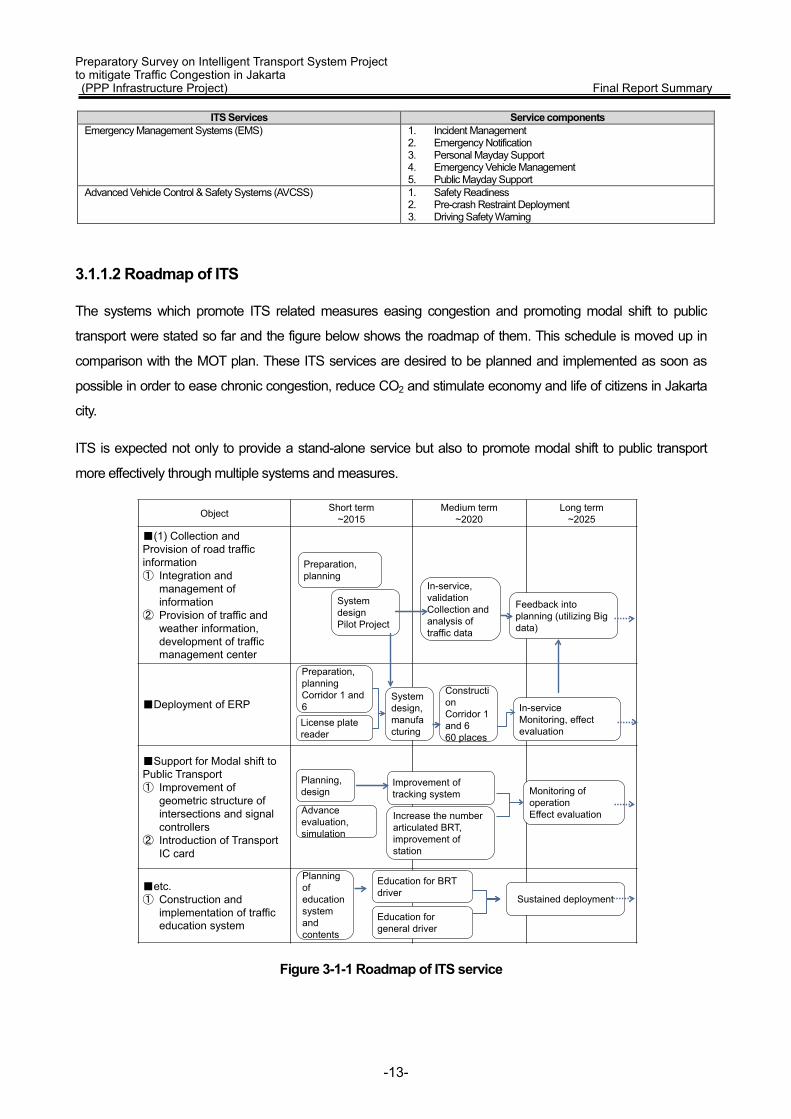
3.1.1.2 Roadmap of ITS
The systems which promote ITS related measures easing congestion and promoting modal shift to public
transport were stated so far and the figure below shows the roadmap of them. This schedule is moved up in
comparison with the MOT plan. These ITS services are desired to be planned and implemented as soon as
possible in order to ease chronic congestion, reduce CO2 and stimulate economy and life of citizens in Jakarta
city.
ITS is expected not only to provide a stand-alone service but also to promote modal shift to public transport
more effectively through multiple systems and measures.
Figure 3-1-1 Roadmap of ITS service
Object Short term~2015
Medium term~2020
Long term~2025
■(1) Collection and Provision of road traffic information① Integration and
management of information
② Provision of traffic and weather information, development of traffic management center
■Deployment of ERP
■Support for Modal shift to Public Transport① Improvement of
geometric structure of intersections and signalcontrollers
② Introduction of Transport IC card
■etc.① Construction and
implementation of traffic education system
Preparation, planning
System designPilot Project
Preparation, planningCorridor 1 and 6
In-service, validationCollection and analysis of traffic data
System design, manufacturing
In-serviceMonitoring, effect evaluation
Feedback into planning (utilizing Big data)
Planning, design
Advance evaluation, simulation
Improvement of tracking system
Planning of education system and contents
Education for BRT driver
Increase the number articulated BRT, improvement of station
Monitoring of operationEffect evaluation
Education for general driver
Sustained deployment
ConstructionCorridor 1 and 660 places
License plate reader
-13-
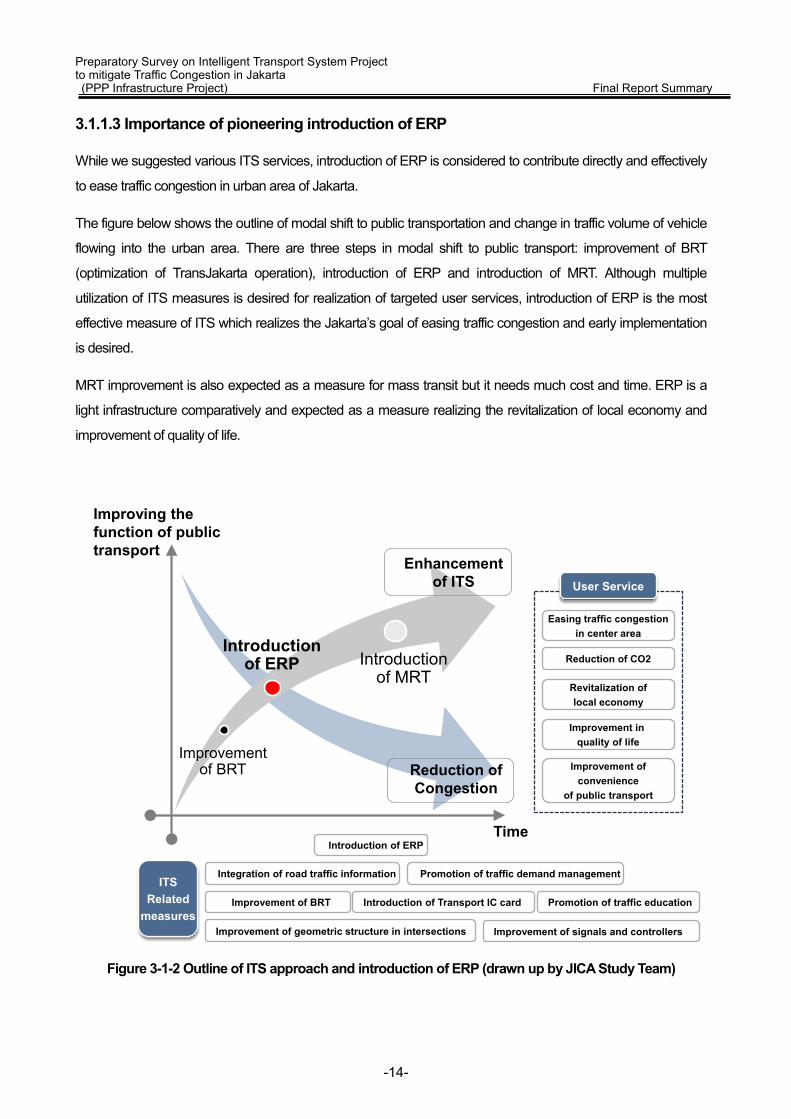
Preparatory Survey on Intelligent Transport System Project to mitigate Traffic Congestion in Jakarta (PPP Infrastructure Project) Final Report Summary 3.1.1.3 Importance of pioneering introduction of ERP
While we suggested various ITS services, introduction of ERP is considered to contribute directly and effectively
to ease traffic congestion in urban area of Jakarta.
The figure below shows the outline of modal shift to public transportation and change in traffic volume of vehicle
flowing into the urban area. There are three steps in modal shift to public transport: improvement of BRT
(optimization of TransJakarta operation), introduction of ERP and introduction of MRT. Although multiple
utilization of ITS measures is desired for realization of targeted user services, introduction of ERP is the most
effective measure of ITS which realizes the Jakarta’s goal of easing traffic congestion and early implementation
is desired.
MRT improvement is also expected as a measure for mass transit but it needs much cost and time. ERP is a
light infrastructure comparatively and expected as a measure realizing the revitalization of local economy and
improvement of quality of life.
Figure 3-1-2 Outline of ITS approach and introduction of ERP (drawn up by JICA Study Team)
Introduction of ERP
Improvement of signals and controllers
Improvement of BRT
User Service
Easing traffic congestionin center area
Revitalization oflocal economy
Reduction of CO2
Improvement ofconvenience
of public transport
Improvement of geometric structure in intersections
Integration of road traffic information
Introduction of Transport IC card
Promotion of traffic demand management
Promotion of traffic education
Improvement in quality of life
ITSRelated
measures
Improvement of BRT
Introduction of ERP Introduction
of MRT
Enhancement of ITS
Time
Reduction of Congestion
Improving the function of public transport
-14-

Preparatory Survey on Intelligent Transport System Project to mitigate Traffic Congestion in Jakarta (PPP Infrastructure Project) Final Report Summary
Chapter 4. Review of the Legal Framework 4.1 Legal Structure for ERP Project Implementation
Major legal structure for ERP project implementation is shown as the figure below.
The legal system for ERP project implementation can be categorized into 5 groups: road traffic, retribution,
local government, project scheme and others (spatial planning, environment, information communication). For
ERP implementation, PP (Government Regulation) 32/2011 on road traffic management and PP 97/2012 on
Traffic Control Retribution are the key regulations in the legal structure.
Figure4-1-1 Legal Structure for ERP (1/2) Source: Created by JICA ERP Study Team
For project scheme, ERP project is not included in the scope of PPP in Presidential Regulation 67 of 2005
(partially amended by Presidential Regulation 13/2010, 56/2011, and 66/2013) for PPP infrastructure of
Indonesian central government. Thus, ERP project scheme has to be reviewed based on regulations of regional
partnership project of local government such as widely applicable PP50/2007 (See 4.4).
4.2 Legal Basis of Imposition of ERP 4.2.1 Imposition of ERP
In Article 60 (2) of PP 32/2011, traffic demand management can be conducted by the traffic restriction shown
as below. Article 60 (3) and Article 79(1) of PP 32/2011 also stipulate that traffic restriction on private vehicle and
goods vehicle can be done by the imposition of Traffic Control Retribution.
Based on Article 1(2) of PP 97/2012, Traffic Control Retribution is a collection on the use of certain road
segments, certain corridors, certain areas at certain time, and certain density level.
-15-

Preparatory Survey on Intelligent Transport System Project to mitigate Traffic Congestion in Jakarta (PPP Infrastructure Project) Final Report Summary
In addition, Article 8 of PP 97/2012 stipulates that the system and equipment for ERP the regional government
must provide is required to be an electronic system.
As stated above, ERP Charge could be considered as Traffic Control Retribution based on current regulations
and be introduced on private vehicle and goods vehicle.
4.2.2 Implementation Body Article 2(2) of PP 97/2012 stipulates that the collection of Traffic Control Retribution shall be conducted by the
provincial government in the provincial road segments. Article 2 of PP 32/2011 also stipulates that management
and traffic engineering activities are the responsibility of Governor and Head of Police of the Republic of
Indonesia for provincial road. Based on current regulations shown as the table below, local government is
responsible for introducing system and equipment necessary for Traffic Control Retribution.
4.2.3 Targeted Roads Article 79(3) of PP 32/2011 stipulates that traffic restriction on private vehicle and goods vehicle may not be
conducted on national roads. So the applicable roads of ERP are all roads excluding national roads.
4.2.4 Charged Classes of Vehicle Article 3 of PP 97/2012 stipulates as the following table. ERP charged classes of Vehicle are limited (e.g.
motorcycles excluded).
4.2.5 Formulation of Regional Regulations on ERP (Traffic control Retribution) UU 28/2009, PP97/2012 and PP 32/2011 do not regulate the details of imposition of Traffic Control Retribution.
Shown as below, UU 28/2009, PP97/2012 and PP 32/2011 stipulates that the details shall be regulated by
regional regulation.
4.2.6 ERP Violation and Enforcement Measures of payment failure of ERP charge and vehicles without on-board unit need to be stipulated.
Especially, in case payment failure of retribution is considered as unpaid money, it’s possible to demand it,
however, the unpaid status is not within “illegal action” and it may be hard to make an arrest on the spot.
In the existing legal framework, UU22/2009 stipulates the definition of road traffic violation and the
enforcement procedure as below. Therefore, the definition of ERP violation should be shown on road signs and
others to road users and any violation of ERP should be sanctioned within the scope of UU22/2009. In the 3 in 1
traffic control, the enforcement of violation is in accordance with UU 22/2009.
Although UU28/2009 also regulates violation of retribution, it is a penalty for direct retribution collectors who
fail to pay collected retribution to the local government. Like entrance fee for zoo, retribution from citizens is
based on the assumption that public service is provided to them at the same time, so there is no penalty for
citizens who violate retribution.
-16-

Preparatory Survey on Intelligent Transport System Project to mitigate Traffic Congestion in Jakarta (PPP Infrastructure Project) Final Report Summary 4.3 Institutional Framework on Retribution, Regional Government Revenue and
Expenditure 4.3.1 Legal Basis of Traffic Control Retribution
Article 80 (1) of PP32/2011 stipulates that Traffic Control Retribution is a public service retribution. Public
service retribution is not a kind of tax but a payment for public service. Retribution is considered as revenue of
regional government.
Article 3 (1) of PP97/2012 stipulates that the object of traffic control retribution is the use of specific roads,
specific corridors, or specific areas on a specific time by private or freight motored vehicle. Therefore, in terms of
PP32/2011, it is supposed that Traffic Control Retribution is considered as a payment by road users for usage of
public service such as provision of public road, however, it becomes revenue of regional government directly
and it is not tariff as toll road tariff.
Article 160 of UU28/2009 also regulates that collection of retribution is done through the issuance of a letter
stating the payable retribution or other documents. Other documents can be in the form of ticket, coupon, and
subscription cards. No current laws and regulations explicitly regulate electronic charge of retribution.
4.3.2 Usage of income received from Traffic Control Retribution According to Article 9 (1) of PP 97/2012 and Article 80 (2) of PP32/2011, income received from Traffic Control
Retribution must be utilized to increase the traffic performance and public transport services.
4.3.3 Overview of Institution on Regional Government Revenues and Expenditures Budgetary (APBD)
Article 26(1) of MOHA Regulation 13/2006 (as lastly amended by MOHA Regulation 21/2011) stipulates that
income received from the collection of retribution is classified as regional government revenue. According to
Article 122 of MOHA Regulation 13/2006, all regional government revenues and expenditures for the
implementation of local government affairs shall be managed within Regional Government Revenues and
Expenditures Budgetary (APBD).
In addition, according to Article 15 of MOHA Regulation 13/2006, under the framework of Regional
Government Revenues and Expenditures Budgetary (APBD), changes of Regional Government Revenues and
Expenditures, and implementation of Regional Government Revenues and Expenditures each year is set by
regional government regulations.
In order to use the income received from collection of Traffic Control Retribution, such expenses must be
formulated in Regional Government Revenues and Expenditures Budgetary (APBD) which is determined
annually under regional regulation as well.
Regional regulation on Regional Revenues and Expenditure (APBD) shall be formulated in accordance with
the following flowchart. For formulation of Regional Revenues and Expenditure (APBD), regional regulation on
APBD must be stipulated annually with approval of DPRD (Dewan Perwakilan Rakyat Daerah: Regional
Parliament) and evaluation of MOHA. The purpose of evaluation of MOHA is to ensure whether the draft of
-17-
Preparatory Survey on Intelligent Transport System Project to mitigate Traffic Congestion in Jakarta (PPP Infrastructure Project) Final Report Summary regional regulation is in accordance with higher hierarchy laws and regulations.
In case approval by DPRD and/or evaluation by MOHA for draft regional regulation on APBD are delayed,
there is a possibility that annual expenditure for traffic performance activity improvement from income of traffic
control retribution not conducted as scheduled.
-18-

Preparatory Survey on Intelligent Transport System Project to mitigate Traffic Congestion in Jakarta (PPP Infrastructure Project) Final Report Summary
Chapter 5. Review of ERP Project Scheme 5.1 Public-Private-Partnership Project Scheme
As stated in Chapter 4, Presidential Regulation 67/2005 (Presreg 67/2005) (partially amended in Presidential
Regulation 13/2010, 56/2011, and 66/2013) and Regional Partnership 50/2007 are regulations related to PPP in
Indonesia. The difference between each regulation is Presreg 67/2005 is related to cooperation between central
government and private entity and PPP 50/2007 is related to cooperation between regional government and
private entity.
Since ERP is not explicitly included in the scope of PPP (Presreg 67/2005), ERP project cannot be a PPP
project which is done with central government. In other words ERP project cannot be implemented as PPP
project under Presidential Regulation 67/2005.
On the other hand, ERP project in DKI Jakarta can be considered as a project under the authority of DKI
Jakarta Gov. Which means ERP can be implemented under the “cooperation agreement” between DKI Jakarta
Gov, and private entities in accordance with PP 50/2007.
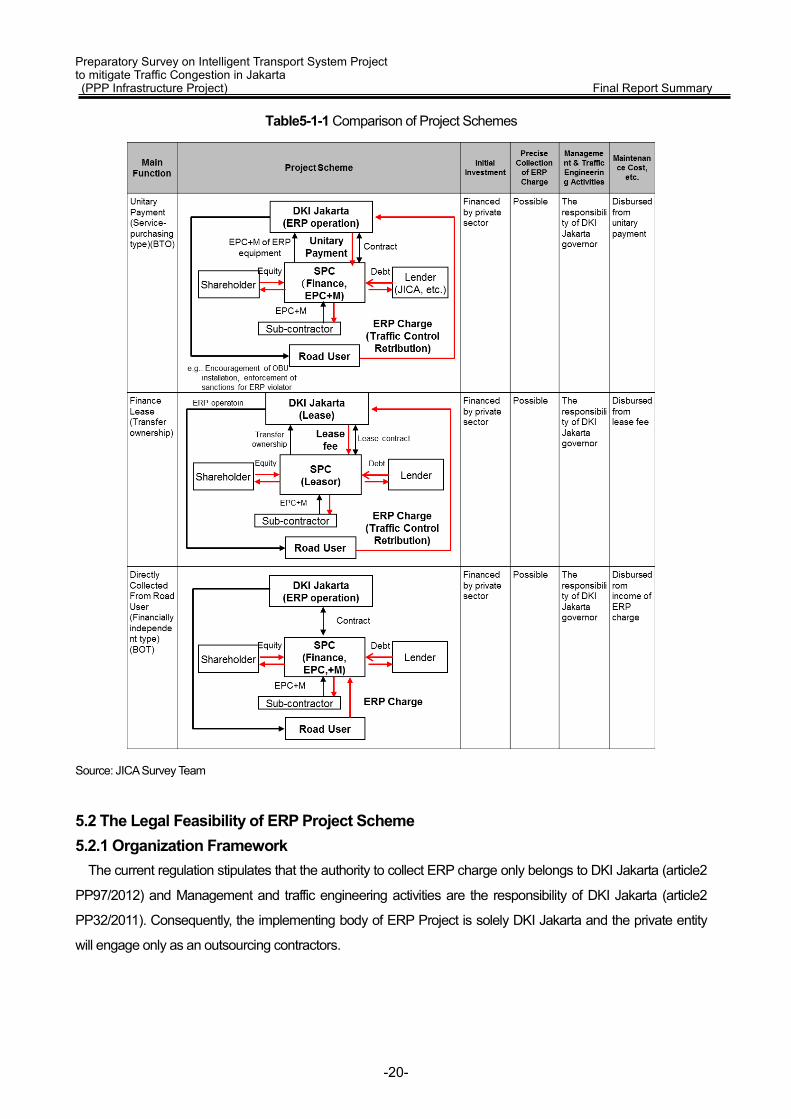
5.1.1 Comparison of Project Schemes The comparison of major functions among the 3 project schemes reviewed in the previous section is shown in
the table as below. Either the unitary payment (BTO) scheme or the finance lease can fulfil the same function as
Directly Collected From Road User (BOT) including initial investment by private entity (no fund provided by DKI
Jakarta Gov.).
-19-
Preparatory Survey on Intelligent Transport System Project to mitigate Traffic Congestion in Jakarta (PPP Infrastructure Project) Final Report Summary
Comparison of Project Schemes Table5-1-1
Source: JICA Survey Team
5.2 The Legal Feasibility of ERP Project Scheme 5.2.1 Organization Framework
The current regulation stipulates that the authority to collect ERP charge only belongs to DKI Jakarta (article2
PP97/2012) and Management and traffic engineering activities are the responsibility of DKI Jakarta (article2
PP32/2011). Consequently, the implementing body of ERP Project is solely DKI Jakarta and the private entity
will engage only as an outsourcing contractors.
-20-
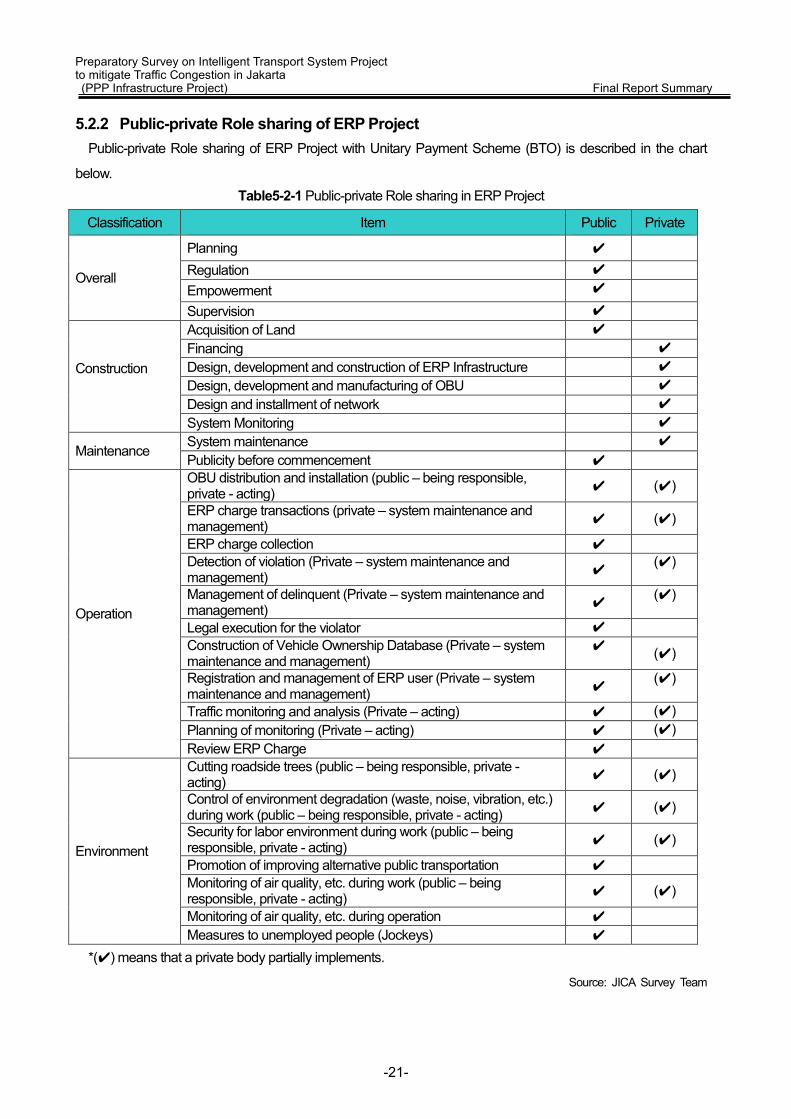
Preparatory Survey on Intelligent Transport System Project to mitigate Traffic Congestion in Jakarta (PPP Infrastructure Project) Final Report Summary 5.2.2 Public-private Role sharing of ERP Project
Public-private Role sharing of ERP Project with Unitary Payment Scheme (BTO) is described in the chart
below. Public-private Role sharing in ERP Project Table5-2-1
Classification Item Public Private
Overall
Planning ✔
Regulation ✔ Empowerment ✔ Supervision ✔
Construction
Acquisition of Land ✔ Financing ✔ Design, development and construction of ERP Infrastructure ✔ Design, development and manufacturing of OBU ✔ Design and installment of network ✔ System Monitoring ✔
Maintenance System maintenance ✔ Publicity before commencement ✔
Operation
OBU distribution and installation (public – being responsible, private - acting) ✔ (✔)
ERP charge transactions (private – system maintenance and management) ✔ (✔)
ERP charge collection ✔ Detection of violation (Private – system maintenance and management) ✔ (✔)
Management of delinquent (Private – system maintenance and management) ✔ (✔)
Legal execution for the violator ✔ Construction of Vehicle Ownership Database (Private – system maintenance and management)
✔ (✔)
Registration and management of ERP user (Private – system maintenance and management) ✔ (✔)
Traffic monitoring and analysis (Private – acting) ✔ (✔) Planning of monitoring (Private – acting) ✔ (✔) Review ERP Charge ✔
Environment
Cutting roadside trees (public – being responsible, private - acting) ✔ (✔)
Control of environment degradation (waste, noise, vibration, etc.) during work (public – being responsible, private - acting) ✔ (✔)
Security for labor environment during work (public – being responsible, private - acting) ✔ (✔)
Promotion of improving alternative public transportation ✔ Monitoring of air quality, etc. during work (public – being responsible, private - acting) ✔ (✔)
Monitoring of air quality, etc. during operation ✔ Measures to unemployed people (Jockeys) ✔
*(✔) means that a private body partially implements.
Source: JICA Survey Team
-21-

Preparatory Survey on Intelligent Transport System Project to mitigate Traffic Congestion in Jakarta (PPP Infrastructure Project) Final Report Summary 5.2.3 Operation of ERP 5.2.3.1 ERP Charge Collection ERP charge is collected automatically by vehicle equipped with on-board-unit (OBU) are passing the gantry
and ERP charge being deducted from the account opened. The account could be pre-paid account where
ERP users can top up at convenience store or internet banking. The details are described in Chapter 6.
5.2.3.2 Violation and Enforcement (1) Legal system for violation and enforcement
ERP violators could be enforced by road traffic sign board likewise regulation of 3 in 1 based on Road Traffic
Law. However, the unpaid ERP charge itself has no legal basis through existing laws, because ERP charge is
“traffic retribution” and there has no regulation regulating the status of unpaid retribution. Therefore, another
provincial regulations needs to be newly developed.
Source: JICA Survey Team
Figure5-2-1 Scheme of Regulation of ERP Violator
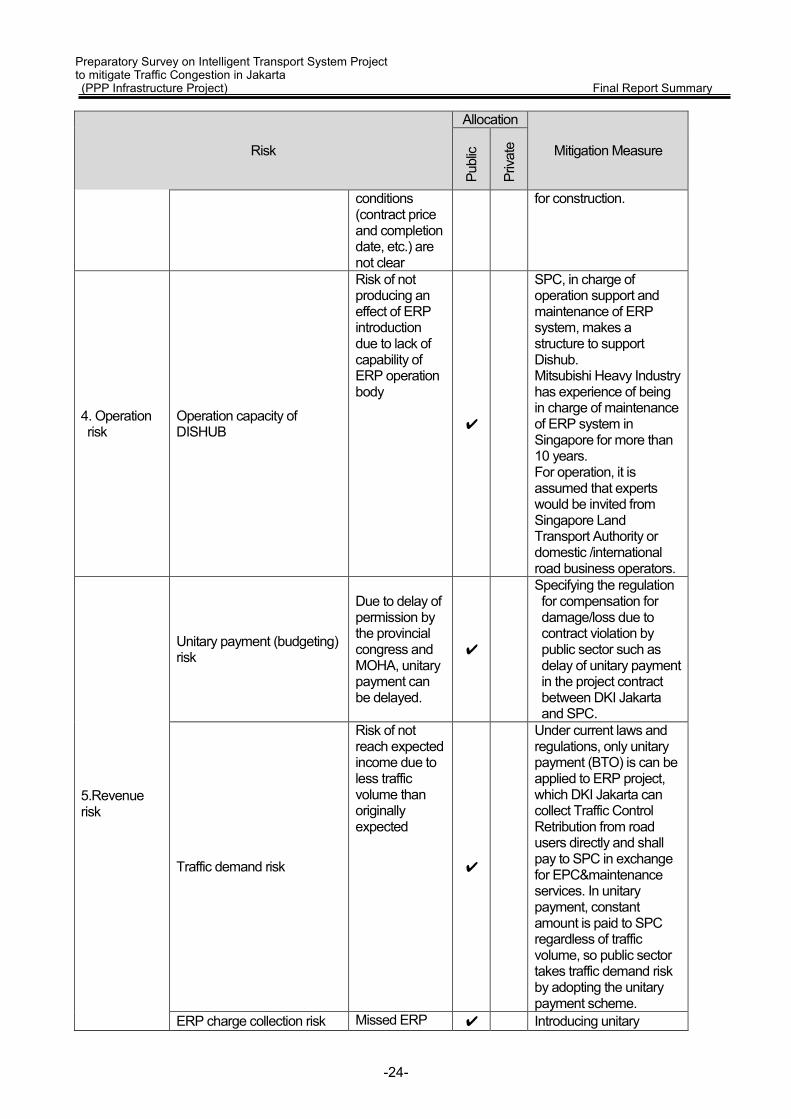
5.3 Response to risks on ERP project 5.3.1 Overview of major risks on ERP project The below table shows main assumed risks on ERP project and its risk allocation for public and private sector.
For stable operation, measures against the risk of unitary payment (failure or delay of unitary payment due to
delay in government’s budget process) is the most important among the following risks.
-22-

Preparatory Survey on Intelligent Transport System Project to mitigate Traffic Congestion in Jakarta (PPP Infrastructure Project) Final Report Summary
Major risks on ERP project Table5-3-1
Risk
Allocation
Mitigation Measure
Publ
ic
Priva
te
1. Sponsor risk (evaluation of sponsor)
Project interruption due to lack of financial and technical capability of sponsor, etc.
✔
On the stage of creating a project, selecting private entities as partners, which have local construction experience, enough structure for implementation and financial capacity.
2. Financing risk
Delay of financial closure, risk of not getting an investment from a sponsor and/or a loan from lender as originally planned
✔
It’s important to coordinate with investors and lenders on project (details of contract, government guarantee and anticipated income and payout) and receive a firm commitment from them on the stage of creating a project.
3.Construction/ Technical risk
Applied technology
Risk of not producing an effect of ERP introduction due to applied technology not matching the road situation for ERP
✔
Mitsubishi Heavy Industry has much experience of introducing ERP system within and outside country.
Cost and construction schedule, etc.
Risk of requiring more project cost and construction period than expected due to the situation of construction site
✔ ✔
It is necessary to coordinate with public sector (such as Dishub, police) for technical matter and to make a project plan.
Content of EPC contract
Risk of SPC taking responsibility of the damage of cost increase and delay in completion due to lack of capability of EPC contractor in case that contract
✔
EPC contractor is responsible for design and construction risk. For a contract between SPC and EPC contractor, full tern key contract (with fixed lump sum and data certain) is assumed. EPC contractor is obligated to provide performance guarantee and enter into insurance
-23-
Preparatory Survey on Intelligent Transport System Project to mitigate Traffic Congestion in Jakarta (PPP Infrastructure Project) Final Report Summary
Risk
Allocation
Mitigation Measure
Publ
ic
Priva
te
conditions (contract price and completion date, etc.) are not clear
for construction.
4. Operation risk
Operation capacity of DISHUB
Risk of not producing an effect of ERP introduction due to lack of capability of ERP operation body
✔
SPC, in charge of operation support and maintenance of ERP system, makes a structure to support Dishub. Mitsubishi Heavy Industry has experience of being in charge of maintenance of ERP system in Singapore for more than 10 years. For operation, it is assumed that experts would be invited from Singapore Land Transport Authority or domestic /international road business operators.
5.Revenue risk
Unitary payment (budgeting) risk
Due to delay of permission by the provincial congress and MOHA, unitary payment can be delayed.
✔
Specifying the regulation for compensation for damage/loss due to contract violation by public sector such as delay of unitary payment in the project contract between DKI Jakarta and SPC.
Traffic demand risk
Risk of not reach expected income due to less traffic volume than originally expected
✔
Under current laws and regulations, only unitary payment (BTO) is can be applied to ERP project, which DKI Jakarta can collect Traffic Control Retribution from road users directly and shall pay to SPC in exchange for EPC&maintenance services. In unitary payment, constant amount is paid to SPC regardless of traffic volume, so public sector takes traffic demand risk by adopting the unitary payment scheme.
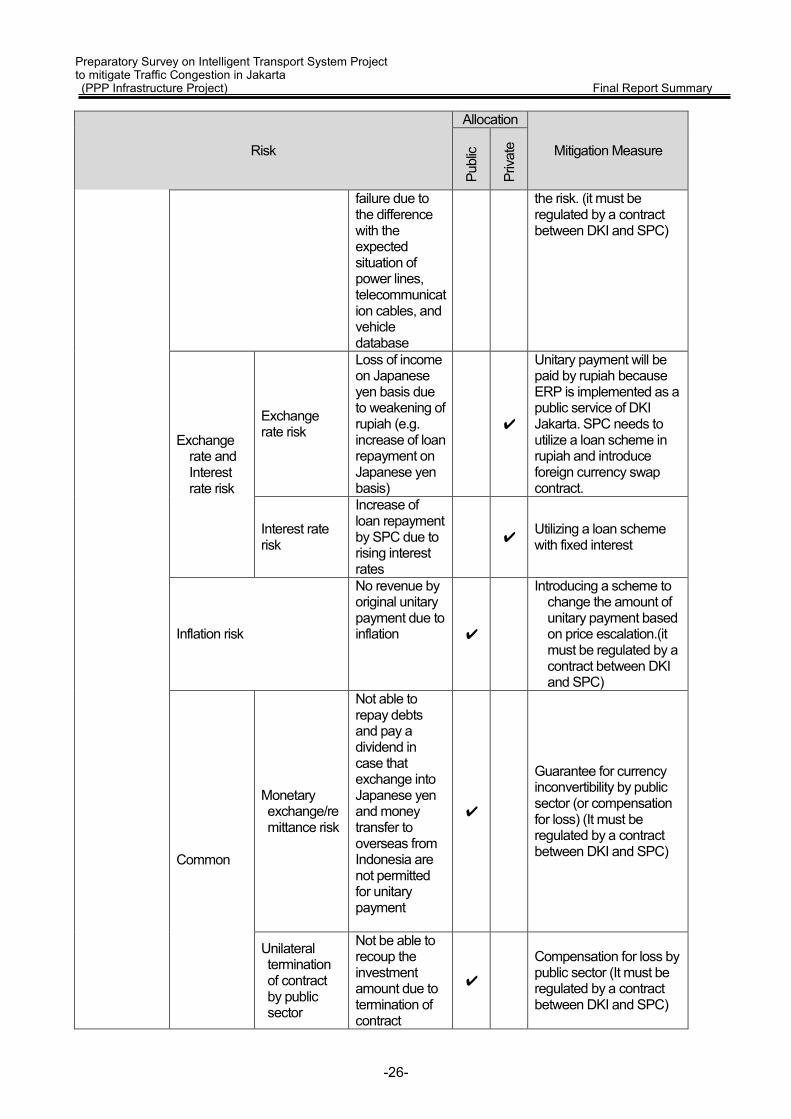
ERP charge collection risk Missed ERP ✔ Introducing unitary
-24-

Preparatory Survey on Intelligent Transport System Project to mitigate Traffic Congestion in Jakarta (PPP Infrastructure Project) Final Report Summary
Risk
Allocation
Mitigation Measure
Publ
ic
Priva
te
charge collection from OBU non-installed vehicle, unofficial OBU installed vehicle, and ERP violating vehicle
payment scheme which provides constant payment in exchange for services regardless of charge amount (it must be regulated by a contract between DKI and SPC. Public sector takes ERP charge collection risk excluding insufficient design, installation and maintenance of ERP system.)
ERP charge amount revision risk
Risk of not reaching expected income due to change of ERP charge amount
✔
Adopting unitary payment scheme which provides constant payment in exchange for services regardless of change of the charge amount.
6. Others
Permission risk
Criteria fulfillment for ERP imposition
Risk of not implementing ERP project as planned due to failure of acquiring necessary permissions
✔
As an implementation body, public sector takes the risk. (it must be regulated by a contract between DKI and SPC)
Approval on ERP regional regulations
✔
Permission on using wireless radio frequency spectrum
✔
Certification of electronic equipment and/or system for ERP
✔
Support for smooth obtaining certification by appealing Japan’s experiences and superiority in ERP system.
Permission on usage of radio wave
✔ (✔)
As an implementation body, public sector becomes an applicant but SPC pre-coordinates radio wave interference.
Permission on environment
✔ No necessary to acquire AMDAL under current laws and regulations.
Land acquisition risk
Project delay due to delay of land acquisition for ERP project
✔
Basically, land acquisition will not be needed for the ERP project.
Related infrastructure/utility risk
Risk of project delay and ✔
As an implementation body, public sector takes
-25-
Preparatory Survey on Intelligent Transport System Project to mitigate Traffic Congestion in Jakarta (PPP Infrastructure Project) Final Report Summary
Risk
Allocation
Mitigation Measure
Publ
ic
Priva
te
failure due to the difference with the expected situation of power lines, telecommunication cables, and vehicle database
the risk. (it must be regulated by a contract between DKI and SPC)
Exchange rate and Interest rate risk
Exchange rate risk
Loss of income on Japanese yen basis due to weakening of rupiah (e.g. increase of loan repayment on Japanese yen basis)
✔
Unitary payment will be paid by rupiah because ERP is implemented as a public service of DKI Jakarta. SPC needs to utilize a loan scheme in rupiah and introduce foreign currency swap contract.
Interest rate risk
Increase of loan repayment by SPC due to rising interest rates
✔ Utilizing a loan scheme with fixed interest
Inflation risk
No revenue by original unitary payment due to inflation ✔
Introducing a scheme to change the amount of unitary payment based on price escalation.(it must be regulated by a contract between DKI and SPC)
Common
Monetary exchange/remittance risk
Not able to repay debts and pay a dividend in case that exchange into Japanese yen and money transfer to overseas from Indonesia are not permitted for unitary payment
✔
Guarantee for currency inconvertibility by public sector (or compensation for loss) (It must be regulated by a contract between DKI and SPC)
Unilateral termination of contract by public sector
Not be able to recoup the investment amount due to termination of contract
✔
Compensation for loss by public sector (It must be regulated by a contract between DKI and SPC)
-26-
Preparatory Survey on Intelligent Transport System Project to mitigate Traffic Congestion in Jakarta (PPP Infrastructure Project) Final Report Summary
Risk
Allocation
Mitigation Measure
Publ
ic
Priva
te
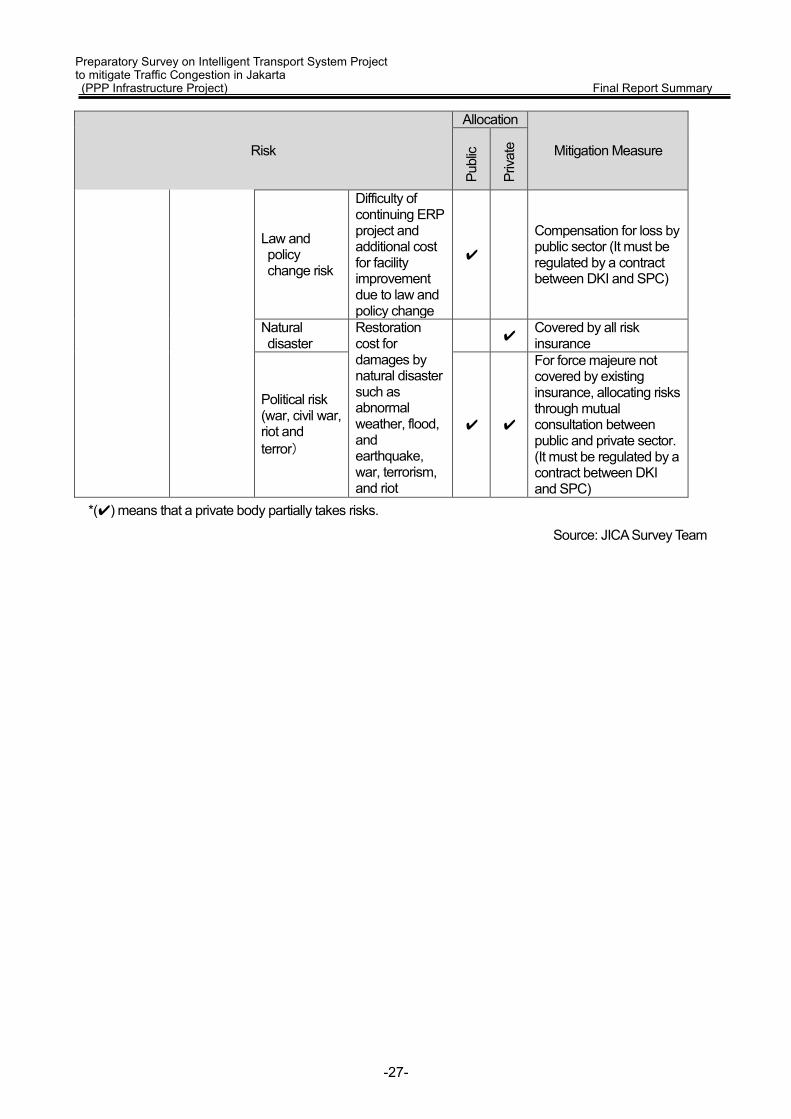
Law and policy change risk
Difficulty of continuing ERP project and additional cost for facility improvement due to law and policy change
✔
Compensation for loss by public sector (It must be regulated by a contract between DKI and SPC)
Natural disaster
Restoration cost for damages by natural disaster such as abnormal weather, flood, and earthquake, war, terrorism, and riot
✔ Covered by all risk insurance
Political risk (war, civil war, riot and terror)
✔ ✔
For force majeure not covered by existing insurance, allocating risks through mutual consultation between public and private sector. (It must be regulated by a contract between DKI and SPC)
*(✔) means that a private body partially takes risks.
Source: JICA Survey Team
-27-

Preparatory Survey on Intelligent Transport System Project to mitigate Traffic Congestion in Jakarta (PPP Infrastructure Project) Final Report Summary
Chapter 6. Traffic Condition Survey 6.1 Survey Outline The traffic condition surveys as shown in the Table 6-1-1 were conducted in this study.
Traffic Condition Survey Outline Table6-1-1 Title Purpose Survey Location/Target Note 1 Traffic
counting Obtain the information of current traffic volume on ERP corridor to forecast the traffic demand when ERP is introduced Grasp the current situation of BRT (Transjakarta) operation
Corridor 1:9 locations Corridor 6:8 locations
Two weekdays 6:00~22:00
2 Travel speed
Obtain the information of travel speed by section and time period to set ERP-charging sections and hours and to evaluate the impact of ERP
Corridor 1:between Blok M and Kota Corridor 6:between Ragunan and Budaran HI
Three weekdays 6:00~22:00
3 WTP (Willingness To Pay)
Grasp the attitude and behavior change of car users when ERP is introduced in Jakarta and consider the appropriate charge price Forecast traffic demand of the target road based on the survey results, estimate the number of people shifting to public transport, and verify the capacity of public transport service
Car users on Corridor 1 and Corridor 6
1,200 samples
4 Jockey interview
Grasp the price drivers pay to Jockeys to consider the price into account for ERP charge setting
Jockeys on 3-in-1 restriction road
120 samples
6.2 Travel Speed Survey 6.2.1 Outline
Survey period and survey day
・ Survey period:from 6:00 to 22:00
・ Survey day:Corridor 1:Wed 19, Thu 20 and Tue 25 March, 2014
Corridor 6:Tue 25, Wed 26 and Thu 27 March, 2014
Survey method
GPS log data was obtained by a GPS logger mounted on a survey vehicle which made a round trip to the target
road as many as possible during the survey period except a small rest.
Survey route
The survey routes are Corridor 1 and 6 of Transjakarta.
-28-
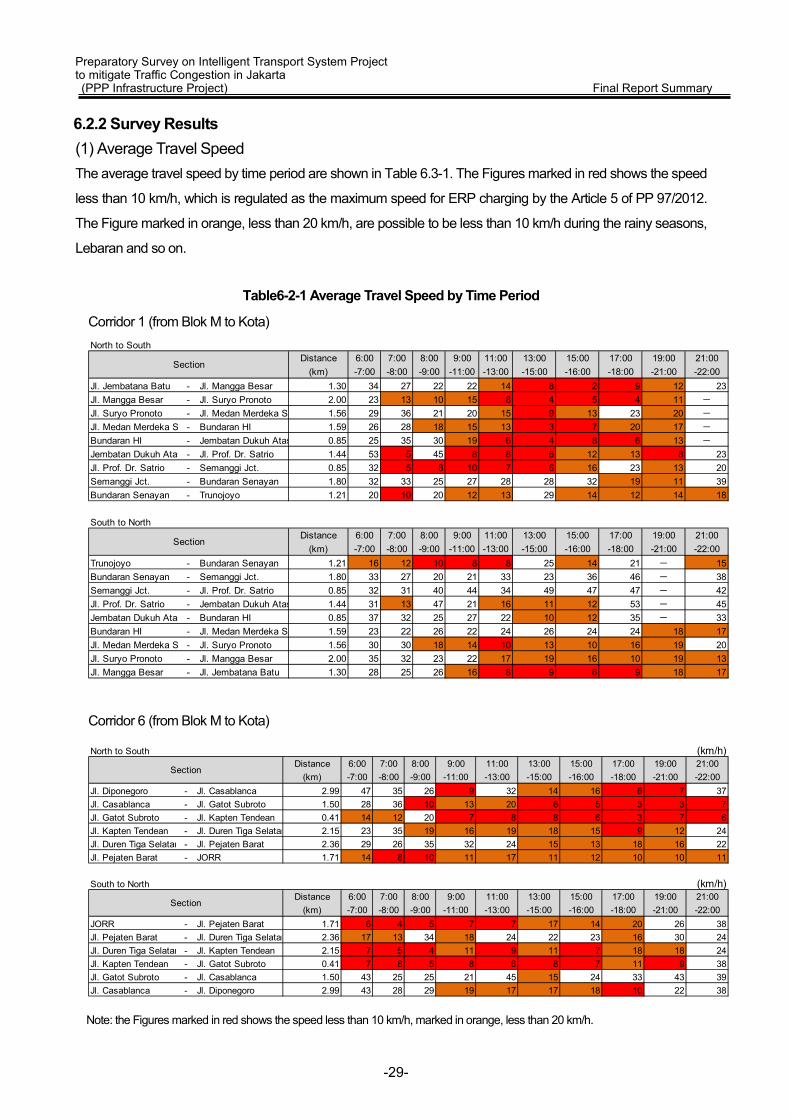
Preparatory Survey on Intelligent Transport System Project to mitigate Traffic Congestion in Jakarta (PPP Infrastructure Project) Final Report Summary 6.2.2 Survey Results (1) Average Travel Speed The average travel speed by time period are shown in Table 6.3-1. The Figures marked in red shows the speed
less than 10 km/h, which is regulated as the maximum speed for ERP charging by the Article 5 of PP 97/2012.
The Figure marked in orange, less than 20 km/h, are possible to be less than 10 km/h during the rainy seasons,
Lebaran and so on.
Average Travel Speed by Time Period Table6-2-1
Corridor 1 (from Blok M to Kota)
Corridor 6 (from Blok M to Kota)
Note: the Figures marked in red shows the speed less than 10 km/h, marked in orange, less than 20 km/h.
North to SouthDistance 6:00 7:00 8:00 9:00 11:00 13:00 15:00 17:00 19:00 21:00
(km) -7:00 -8:00 -9:00 -11:00 -13:00 -15:00 -16:00 -18:00 -21:00 -22:00Jl. Jembatana Batu - Jl. Mangga Besar 1.30 34 27 22 22 14 8 2 9 12 23Jl. Mangga Besar - Jl. Suryo Pronoto 2.00 23 13 10 15 8 4 5 4 11 -
Jl. Suryo Pronoto - Jl. Medan Merdeka Se 1.56 29 36 21 20 15 9 13 23 20 -
Jl. Medan Merdeka S - Bundaran HI 1.59 26 28 18 15 13 3 7 20 17 -
Bundaran HI - Jembatan Dukuh Atas 0.85 25 35 30 19 6 4 8 6 13 -
Jembatan Dukuh Atas - Jl. Prof. Dr. Satrio 1.44 53 5 45 8 8 6 12 13 8 23Jl. Prof. Dr. Satrio - Semanggi Jct. 0.85 32 5 8 10 7 6 16 23 13 20Semanggi Jct. - Bundaran Senayan 1.80 32 33 25 27 28 28 32 19 11 39Bundaran Senayan - Trunojoyo 1.21 20 10 20 12 13 29 14 12 14 18
South to NorthDistance 6:00 7:00 8:00 9:00 11:00 13:00 15:00 17:00 19:00 21:00
(km) -7:00 -8:00 -9:00 -11:00 -13:00 -15:00 -16:00 -18:00 -21:00 -22:00Trunojoyo - Bundaran Senayan 1.21 16 12 10 8 8 25 14 21 - 15Bundaran Senayan - Semanggi Jct. 1.80 33 27 20 21 33 23 36 46 - 38Semanggi Jct. - Jl. Prof. Dr. Satrio 0.85 32 31 40 44 34 49 47 47 - 42Jl. Prof. Dr. Satrio - Jembatan Dukuh Atas 1.44 31 13 47 21 16 11 12 53 - 45Jembatan Dukuh Atas - Bundaran HI 0.85 37 32 25 27 22 10 12 35 - 33Bundaran HI - Jl. Medan Merdeka Se 1.59 23 22 26 22 24 26 24 24 18 17Jl. Medan Merdeka S - Jl. Suryo Pronoto 1.56 30 30 18 14 10 13 10 16 19 20Jl. Suryo Pronoto - Jl. Mangga Besar 2.00 35 32 23 22 17 19 16 10 19 13Jl. Mangga Besar - Jl. Jembatana Batu 1.30 28 25 26 16 8 9 6 9 18 17
Section
Section
North to South (km/h)Distance 6:00 7:00 8:00 9:00 11:00 13:00 15:00 17:00 19:00 21:00
(km) -7:00 -8:00 -9:00 -11:00 -13:00 -15:00 -16:00 -18:00 -21:00 -22:00Jl. Diponegoro - Jl. Casablanca 2.99 47 35 26 9 32 14 16 6 7 37Jl. Casablanca - Jl. Gatot Subroto 1.50 28 36 10 13 20 6 5 3 3 7Jl. Gatot Subroto - Jl. Kapten Tendean 0.41 14 12 20 7 8 8 6 3 7 6Jl. Kapten Tendean - Jl. Duren Tiga Selatan 2.15 23 35 19 16 19 18 15 9 12 24Jl. Duren Tiga Selatan - Jl. Pejaten Barat 2.36 29 26 35 32 24 15 13 18 16 22Jl. Pejaten Barat - JORR 1.71 14 8 10 11 17 11 12 10 10 11
South to North (km/h)Distance 6:00 7:00 8:00 9:00 11:00 13:00 15:00 17:00 19:00 21:00
(km) -7:00 -8:00 -9:00 -11:00 -13:00 -15:00 -16:00 -18:00 -21:00 -22:00JORR - Jl. Pejaten Barat 1.71 6 4 5 7 7 17 14 20 26 38Jl. Pejaten Barat - Jl. Duren Tiga Selatan 2.36 17 13 34 18 24 22 23 16 30 24Jl. Duren Tiga Selatan - Jl. Kapten Tendean 2.15 7 5 4 11 9 11 7 18 18 24Jl. Kapten Tendean - Jl. Gatot Subroto 0.41 7 8 5 8 6 8 7 11 9 38Jl. Gatot Subroto - Jl. Casablanca 1.50 43 25 25 21 45 15 24 33 43 39Jl. Casablanca - Jl. Diponegoro 2.99 43 28 29 19 17 17 18 10 22 38
Section
Section
-29-
Preparatory Survey on Intelligent Transport System Project to mitigate Traffic Congestion in Jakarta (PPP Infrastructure Project) Final Report Summary
6.3 WTP (Willingness To Pay) Survey 6.3.1 Survey Method 6.3.1.1 Outline In order to grasp the attitude and behavior change of car users when ERP is introduced in Jakarta and to
consider the appropriate charge price, WTP (Willingness To Pay) survey based on CVM (Contingent Valuation
Method) was conducted to the car users on Corridor 1 and Corridor 6. The survey was an interview method
that surveyors conducted interviews to respondents and filled in the questionnaire. Furthermore, based on the
survey results, estimation of the number of people shifting to public transport such as Transjakarta, verification
of the capacity of public transport service, the traffic demand forecast of the target road will be conducted. The
pre-survey was taken before the main survey in order to verify the extraction method of the samples, the
setting of the presented charge and the validity of the questions.
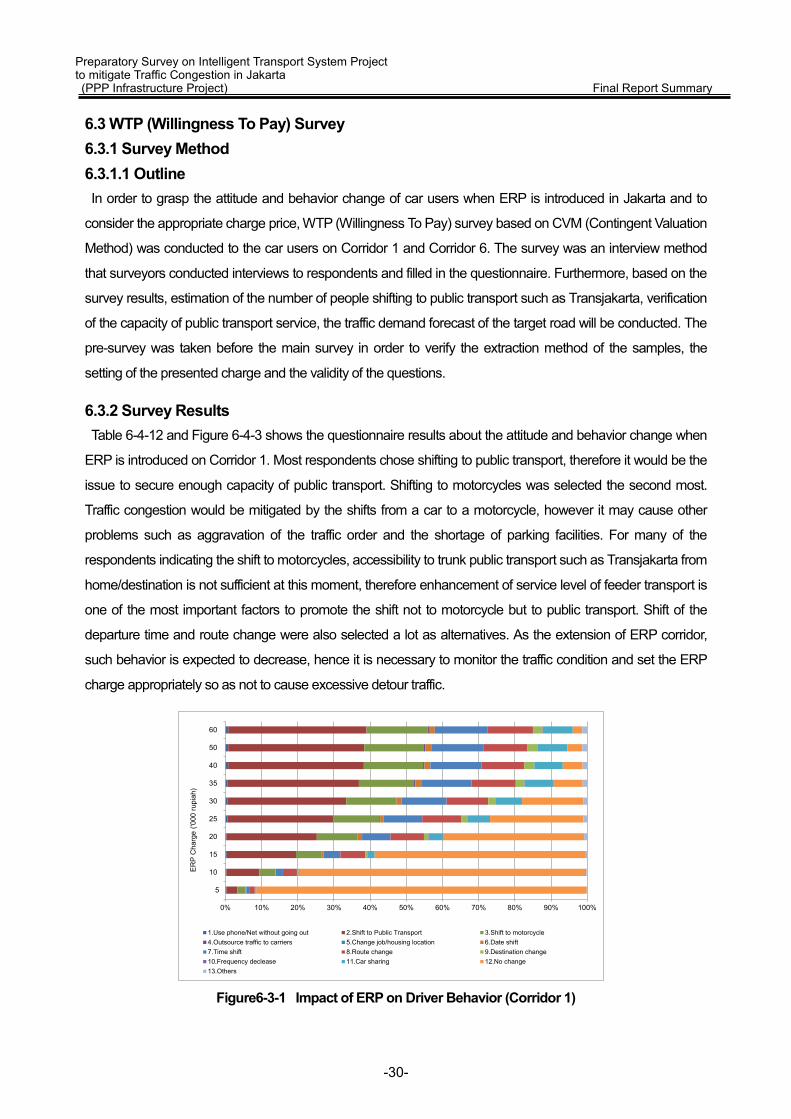
6.3.2 Survey Results Table 6-4-12 and Figure 6-4-3 shows the questionnaire results about the attitude and behavior change when
ERP is introduced on Corridor 1. Most respondents chose shifting to public transport, therefore it would be the
issue to secure enough capacity of public transport. Shifting to motorcycles was selected the second most.
Traffic congestion would be mitigated by the shifts from a car to a motorcycle, however it may cause other
problems such as aggravation of the traffic order and the shortage of parking facilities. For many of the
respondents indicating the shift to motorcycles, accessibility to trunk public transport such as Transjakarta from
home/destination is not sufficient at this moment, therefore enhancement of service level of feeder transport is
one of the most important factors to promote the shift not to motorcycle but to public transport. Shift of the
departure time and route change were also selected a lot as alternatives. As the extension of ERP corridor,
such behavior is expected to decrease, hence it is necessary to monitor the traffic condition and set the ERP
charge appropriately so as not to cause excessive detour traffic.
Figure6-3-1 Impact of ERP on Driver Behavior (Corridor 1)
0% 10% 20% 30% 40% 50% 60% 70% 80% 90% 100%
5
10
15
20
25
30
35
40
50
60
ERP
Cha
rge
('000
rupi
ah)
1.Use phone/Net without going out 2.Shift to Public Transport 3.Shift to motorcycle4.Outsource traffic to carriers 5.Change job/housing location 6.Date shift7.Time shift 8.Route change 9.Destination change10.Frequency declease 11.Car sharing 12.No change13.Others
-30-

Preparatory Survey on Intelligent Transport System Project to mitigate Traffic Congestion in Jakarta (PPP Infrastructure Project) Final Report Summary
Table 6-4-13 and Figure 6-4-4 shows the questionnaire results in terms of the attitude and behavior change
when ERP is introduced on Corridor 6. The conversion ratios to public transport are similar to those of Corridor
1. The biggest difference with the case of Corridor 1 is very high conversion intention to motorcycles. In this
regard, it is considered as the reason that the service level of Transjakarta is lower than that of the Corridor 1,
transit to other Transjakarta lines is inconvenience and the feeder transport is not substantial. 3-in-1 regulation
has not been introduced in Corridor 6. Therefore, the Corridor-6-users may not know well how to deal with
such restriction comparing to the users of Corridor 1 where 3-in-1 regulation has already been introduced and
the users has taken several measures, and it may led such answer.
Figure6-3-2 Impact of ERP on Driver Behavior (Corridor 6)
6.4 Jockey Interview 6.4.1 Methodology 6.4.1.1 Outline Some drivers who do not have enough passengers to legally use 3-in-1 corridor use Jockey in order to meet
the minimum number of passengers and cheat the rule. The objective of this survey is to grasp the price
drivers pay to Jockeys and consider the price into account for ERP charge setting. The survey was the
interview method that surveyors conducted interviews to respondents, to fill in the questionnaire answers.
6.4.2 Survey Results 6.4.2.1 Jockey Price The Jockey price for each section was asked in the interview. Table 6-4-1 shows the tabulation result and
Figure 6-4-1 illustrates the Jockey price for the major sections. The result shows that the Jockey price is based
on distance however it is not a direct proportion to distance. Meanwhile, the proportion of Jockey user is not
0% 10% 20% 30% 40% 50% 60% 70% 80% 90% 100%
5
10
15
20
25
30
35
40
50
60
ERP
Cha
rge
('000
rupi
ah)
1.Use phone/Net without going out 2.Shift to Public Transport 3.Shift to motorcycle4.Outsource traffic to carriers 5.Change job/housing location 6.Date shift7.Time shift 8.Route change 9.Destination change10.Frequency declease 11.Car sharing 12.No change13.Others
-31-

Preparatory Survey on Intelligent Transport System Project to mitigate Traffic Congestion in Jakarta (PPP Infrastructure Project) Final Report Summary
high, 13% as shown in Figure 6-4-1. Therefore, it can be said that when setting the ERP charge it is not highly
necessary to consider the Jockey price.
Average Jockey Price (rupiahs) Table6-4-1
Note: The Jockey price which was interviewed is not an expected price by Jockeys but the actual income they earn.
Figure6-4-1 Jockey Price for Major Section (rupiahs)
1 2 3 4 5 6 7 8 9 10
1. BlokM/Senayan - 18,000 19,000 21,000 23,000 23,500 28,000 33,500 21,500 23,500
2.GBK
- 17,500 19,500 21,000 22,500 27,000 36,000 16,500 22,500
3. Semanggi/ Karet
- 18,500 19,500 21,500 25,500 29,500 18,000 21,000
4. Dukuh Atas
- 17,500 18,500 22,000 33,000 20,000 27,000
5. Bundaran HI
- 18,000 20,000 30,500 21,000 26,500
6. Bank Indonesia
- 18,500 29,000 22,500 31,000
7. Harmoni
- 29,000 28,500 35,500
8. Kota
- 34,000 51,000
9. TVRI
- 24,000
10. Kuningan
-
1. B
lok
M/ B
unda
ran
Sena
yan
3. S
eman
ggi/K
aret
4. D
uku
Ata
s
5. B
unda
ran
HI
6. B
ank
Indo
nesi
a
2. G
BK
7. H
arm
oni
8. K
ota
9. T
VRI
(T
aman
Ria
Fly
over
)
10. K
unin
gan
Average Jockey Price by Section (IDR) N=144
33,500 (Previous 3 in 1 )
30,500 23,000
28,000 (Current 3 in 1)22,000
(Section A)21,000
(Section B)
-32-
Preparatory Survey on Intelligent Transport System Project to mitigate Traffic Congestion in Jakarta (PPP Infrastructure Project) Final Report Summary
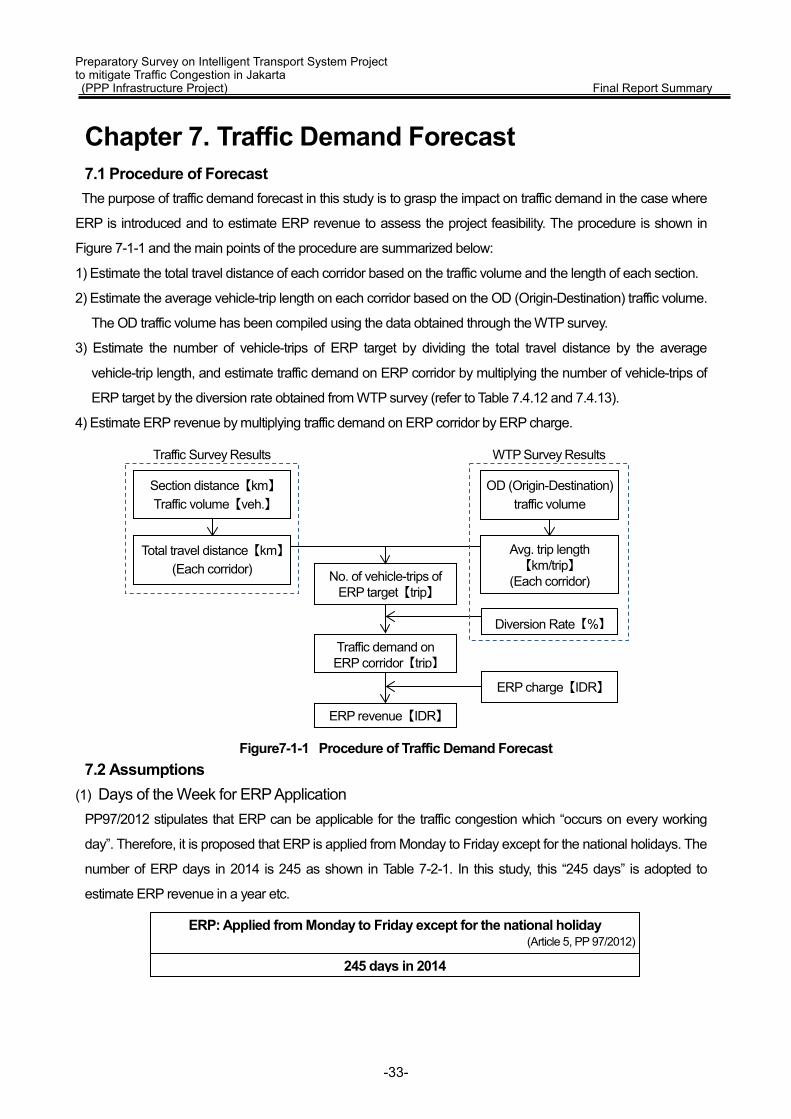
Chapter 7. Traffic Demand Forecast 7.1 Procedure of Forecast The purpose of traffic demand forecast in this study is to grasp the impact on traffic demand in the case where
ERP is introduced and to estimate ERP revenue to assess the project feasibility. The procedure is shown in
Figure 7-1-1 and the main points of the procedure are summarized below:
1) Estimate the total travel distance of each corridor based on the traffic volume and the length of each section.
2) Estimate the average vehicle-trip length on each corridor based on the OD (Origin-Destination) traffic volume.
The OD traffic volume has been compiled using the data obtained through the WTP survey.
3) Estimate the number of vehicle-trips of ERP target by dividing the total travel distance by the average
vehicle-trip length, and estimate traffic demand on ERP corridor by multiplying the number of vehicle-trips of
ERP target by the diversion rate obtained from WTP survey (refer to Table 7.4.12 and 7.4.13).
4) Estimate ERP revenue by multiplying traffic demand on ERP corridor by ERP charge.
Figure7-1-1 Procedure of Traffic Demand Forecast 7.2 Assumptions
(1) Days of the Week for ERP Application PP97/2012 stipulates that ERP can be applicable for the traffic congestion which “occurs on every working
day”. Therefore, it is proposed that ERP is applied from Monday to Friday except for the national holidays. The
number of ERP days in 2014 is 245 as shown in Table 7-2-1. In this study, this “245 days” is adopted to
estimate ERP revenue in a year etc.
ERP: Applied from Monday to Friday except for the national holiday (Article 5, PP 97/2012)
245 days in 2014
Traffic Survey Results WTP Survey Results
Diversion Rate 【%】
No. of vehicle-trips of ERP target 【trip】
Section distance 【km】 Traffic volume 【veh.】
OD (Origin-Destination) traffic volume
Total travel distance 【km】 (Each corridor)
Traffic demand on ERP corridor 【trip】
ERP revenue 【IDR】
Avg. trip length 【km/trip】
(Each corridor)
ERP charge 【IDR】
-33-
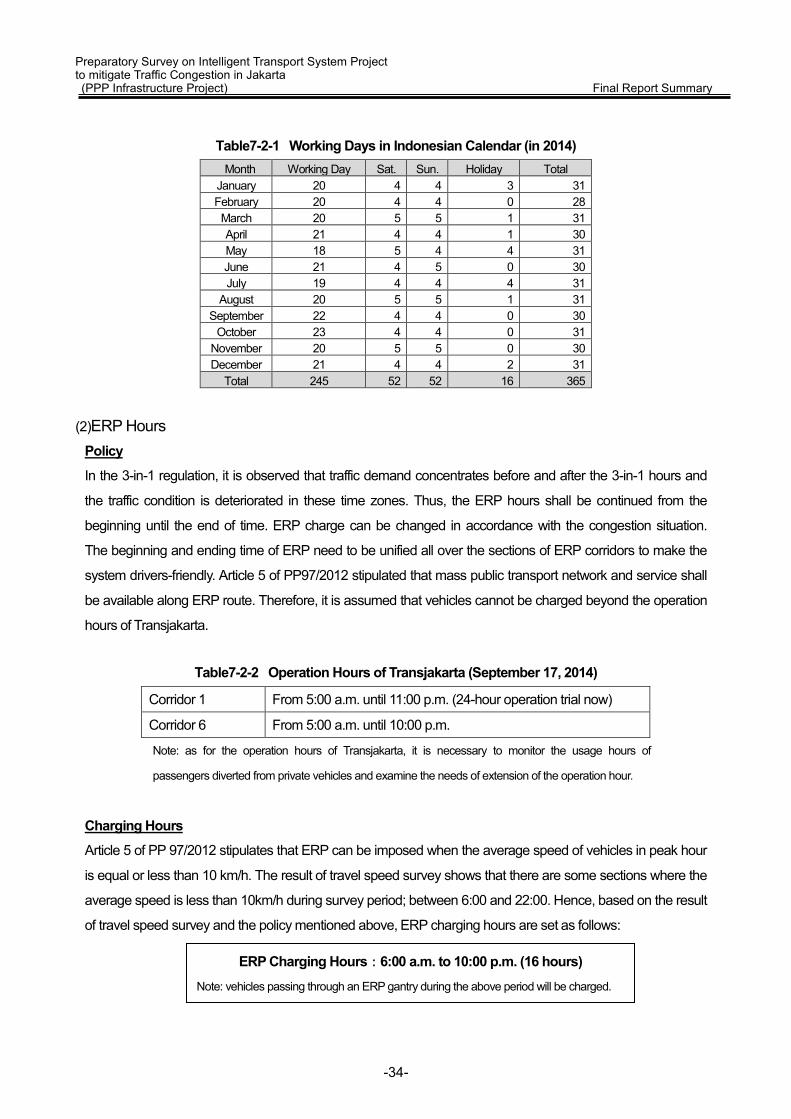
Preparatory Survey on Intelligent Transport System Project to mitigate Traffic Congestion in Jakarta (PPP Infrastructure Project) Final Report Summary
Working Days in Indonesian Calendar (in 2014) Table7-2-1 Month Working Day Sat. Sun. Holiday Total January 20 4 4 3 31 February 20 4 4 0 28 March 20 5 5 1 31 April 21 4 4 1 30 May 18 5 4 4 31 June 21 4 5 0 30 July 19 4 4 4 31
August 20 5 5 1 31 September 22 4 4 0 30
October 23 4 4 0 31 November 20 5 5 0 30 December 21 4 4 2 31
Total 245 52 52 16 365
(2)ERP Hours
Policy
In the 3-in-1 regulation, it is observed that traffic demand concentrates before and after the 3-in-1 hours and
the traffic condition is deteriorated in these time zones. Thus, the ERP hours shall be continued from the
beginning until the end of time. ERP charge can be changed in accordance with the congestion situation.
The beginning and ending time of ERP need to be unified all over the sections of ERP corridors to make the
system drivers-friendly. Article 5 of PP97/2012 stipulated that mass public transport network and service shall
be available along ERP route. Therefore, it is assumed that vehicles cannot be charged beyond the operation
hours of Transjakarta.
Operation Hours of Transjakarta (September 17, 2014) Table7-2-2
Corridor 1 From 5:00 a.m. until 11:00 p.m. (24-hour operation trial now)
Corridor 6 From 5:00 a.m. until 10:00 p.m.
Note: as for the operation hours of Transjakarta, it is necessary to monitor the usage hours of
passengers diverted from private vehicles and examine the needs of extension of the operation hour.
Charging Hours
Article 5 of PP 97/2012 stipulates that ERP can be imposed when the average speed of vehicles in peak hour
is equal or less than 10 km/h. The result of travel speed survey shows that there are some sections where the
average speed is less than 10km/h during survey period; between 6:00 and 22:00. Hence, based on the result
of travel speed survey and the policy mentioned above, ERP charging hours are set as follows:
ERP Charging Hours:6:00 a.m. to 10:00 p.m. (16 hours) Note: vehicles passing through an ERP gantry during the above period will be charged.
-34-
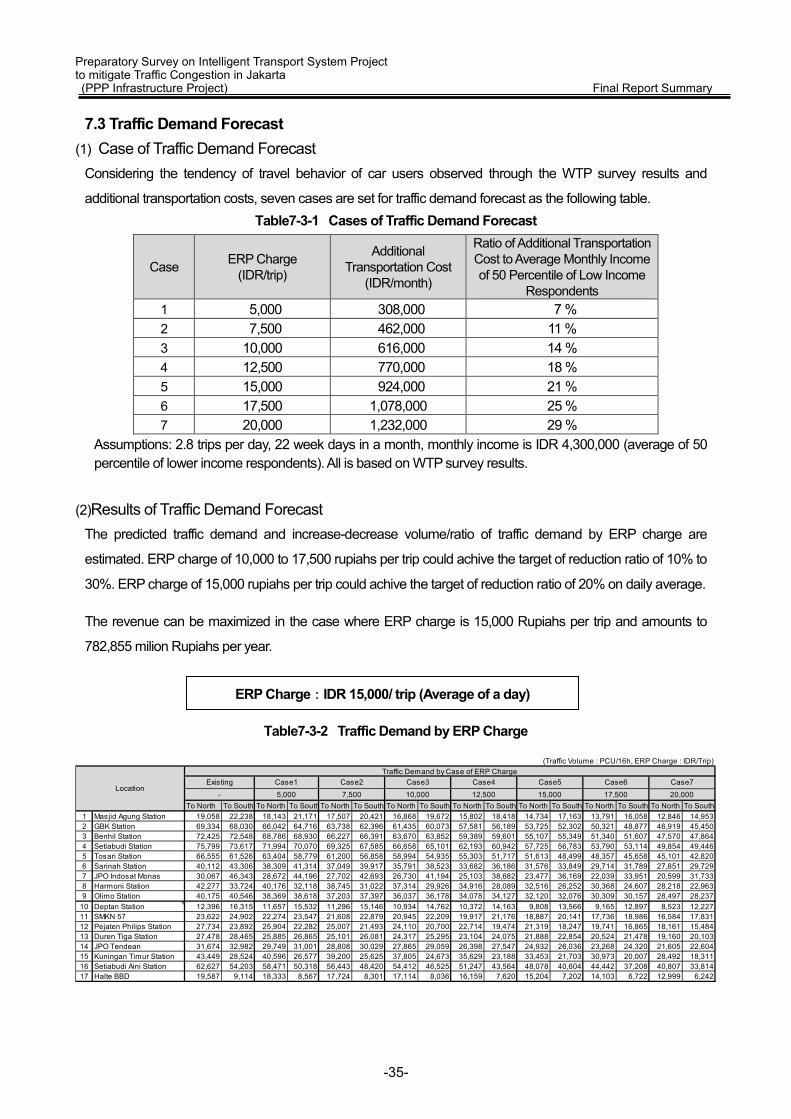
Preparatory Survey on Intelligent Transport System Project to mitigate Traffic Congestion in Jakarta (PPP Infrastructure Project) Final Report Summary
7.3 Traffic Demand Forecast (1) Case of Traffic Demand Forecast
Considering the tendency of travel behavior of car users observed through the WTP survey results and
additional transportation costs, seven cases are set for traffic demand forecast as the following table. Cases of Traffic Demand Forecast Table7-3-1
Case ERP Charge (IDR/trip)
Additional Transportation Cost
(IDR/month)
Ratio of Additional Transportation Cost to Average Monthly Income of 50 Percentile of Low Income
Respondents 1 5,000 308,000 7 % 2 7,500 462,000 11 % 3 10,000 616,000 14 % 4 12,500 770,000 18 % 5 15,000 924,000 21 % 6 17,500 1,078,000 25 % 7 20,000 1,232,000 29 %
Assumptions: 2.8 trips per day, 22 week days in a month, monthly income is IDR 4,300,000 (average of 50 percentile of lower income respondents). All is based on WTP survey results.
(2)Results of Traffic Demand Forecast The predicted traffic demand and increase-decrease volume/ratio of traffic demand by ERP charge are
estimated. ERP charge of 10,000 to 17,500 rupiahs per trip could achive the target of reduction ratio of 10% to
30%. ERP charge of 15,000 rupiahs per trip could achive the target of reduction ratio of 20% on daily average.
The revenue can be maximized in the case where ERP charge is 15,000 Rupiahs per trip and amounts to
782,855 milion Rupiahs per year.
Traffic Demand by ERP Charge Table7-3-2
(Traffic Volume : PCU/16h, ERP Charge : IDR/Trip)
To North To South To North To SouthTo North To South To North To South To North To South To North To South To North To South To North To South1 Masjid Agung Station 19,058 22,238 18,143 21,171 17,507 20,421 16,868 19,672 15,802 18,418 14,734 17,163 13,791 16,058 12,846 14,9532 GBK Station 69,334 68,030 66,042 64,716 63,738 62,396 61,435 60,073 57,581 56,189 53,725 52,302 50,321 48,877 46,919 45,4503 Benhil Station 72,425 72,548 68,786 68,930 66,227 66,391 63,670 63,852 59,389 59,601 55,107 55,349 51,340 51,607 47,570 47,8644 Setiabudi Station 75,799 73,617 71,994 70,070 69,325 67,585 66,658 65,101 62,193 60,942 57,725 56,783 53,790 53,114 49,854 49,4465 Tosari Station 66,555 61,526 63,404 58,779 61,200 56,858 58,994 54,935 55,303 51,717 51,613 48,499 48,357 45,658 45,101 42,8206 Sarinah Station 40,112 43,306 38,309 41,314 37,049 39,917 35,791 38,523 33,682 36,186 31,576 33,849 29,714 31,789 27,851 29,7297 JPO Indosat Monas 30,067 46,343 28,672 44,196 27,702 42,693 26,730 41,194 25,103 38,682 23,477 36,169 22,039 33,951 20,599 31,7338 Harmoni Station 42,277 33,724 40,176 32,118 38,745 31,022 37,314 29,926 34,916 28,089 32,516 26,252 30,368 24,607 28,218 22,9639 Olimo Station 40,175 40,546 38,369 38,618 37,203 37,397 36,037 36,178 34,078 34,127 32,120 32,076 30,309 30,157 28,497 28,237
10 Deptan Station 12,396 16,315 11,657 15,532 11,296 15,146 10,934 14,762 10,372 14,163 9,808 13,566 9,165 12,897 8,523 12,22711 SMKN 57 23,622 24,902 22,274 23,547 21,608 22,879 20,945 22,209 19,917 21,176 18,887 20,141 17,736 18,986 16,584 17,83112 Pejaten Philips Station 27,734 23,892 25,904 22,282 25,007 21,493 24,110 20,700 22,714 19,474 21,319 18,247 19,741 16,865 18,161 15,48413 Duren Tiga Station 27,478 28,465 25,885 26,865 25,101 26,081 24,317 25,295 23,104 24,075 21,888 22,854 20,524 21,478 19,160 20,10314 JPO Tendean 31,674 32,982 29,749 31,001 28,808 30,029 27,865 29,059 26,398 27,547 24,932 26,036 23,268 24,320 21,605 22,60415 Kuningan Timur Station 43,449 28,524 40,596 26,577 39,200 25,625 37,805 24,673 35,629 23,188 33,453 21,703 30,973 20,007 28,492 18,31116 Setiabudi Aini Station 62,627 54,203 58,471 50,318 56,443 48,420 54,412 46,525 51,247 43,564 48,078 40,604 44,442 37,208 40,807 33,81417 Halte BBD 19,587 9,114 18,333 8,567 17,724 8,301 17,114 8,036 16,159 7,620 15,204 7,202 14,103 6,722 12,999 6,242
Traffic Demand by Case of ERP Charge
LocationCase1 Case2 Case3 Case4 Case5 Case6 Case7
5,000 7,500 10,000 12,500 15,000 17,500 20,000-
Existing
ERP Charge:IDR 15,000/ trip (Average of a day)
-35-
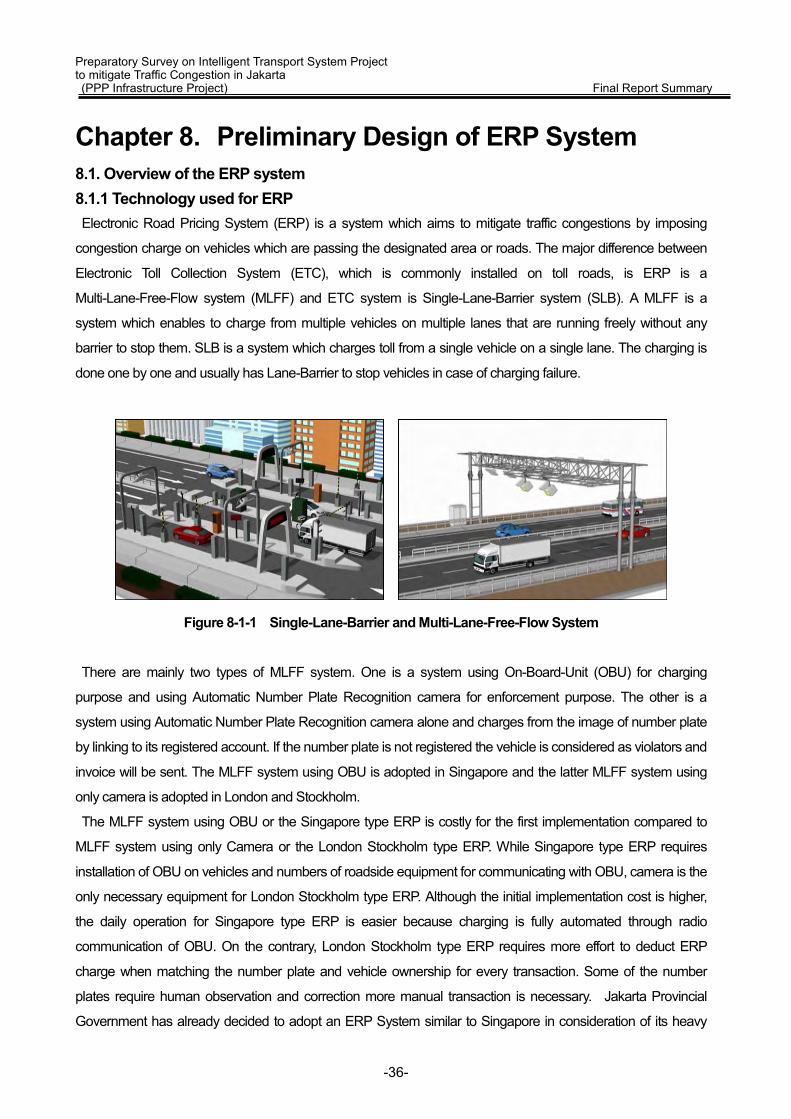
Preparatory Survey on Intelligent Transport System Project to mitigate Traffic Congestion in Jakarta (PPP Infrastructure Project) Final Report Summary
Chapter 8. Preliminary Design of ERP System 8.1. Overview of the ERP system 8.1.1 Technology used for ERP Electronic Road Pricing System (ERP) is a system which aims to mitigate traffic congestions by imposing
congestion charge on vehicles which are passing the designated area or roads. The major difference between
Electronic Toll Collection System (ETC), which is commonly installed on toll roads, is ERP is a
Multi-Lane-Free-Flow system (MLFF) and ETC system is Single-Lane-Barrier system (SLB). A MLFF is a
system which enables to charge from multiple vehicles on multiple lanes that are running freely without any
barrier to stop them. SLB is a system which charges toll from a single vehicle on a single lane. The charging is
done one by one and usually has Lane-Barrier to stop vehicles in case of charging failure.
Figure 8-1-1 Single-Lane-Barrier and Multi-Lane-Free-Flow System
There are mainly two types of MLFF system. One is a system using On-Board-Unit (OBU) for charging
purpose and using Automatic Number Plate Recognition camera for enforcement purpose. The other is a
system using Automatic Number Plate Recognition camera alone and charges from the image of number plate
by linking to its registered account. If the number plate is not registered the vehicle is considered as violators and
invoice will be sent. The MLFF system using OBU is adopted in Singapore and the latter MLFF system using
only camera is adopted in London and Stockholm.
The MLFF system using OBU or the Singapore type ERP is costly for the first implementation compared to
MLFF system using only Camera or the London Stockholm type ERP. While Singapore type ERP requires
installation of OBU on vehicles and numbers of roadside equipment for communicating with OBU, camera is the
only necessary equipment for London Stockholm type ERP. Although the initial implementation cost is higher,
the daily operation for Singapore type ERP is easier because charging is fully automated through radio
communication of OBU. On the contrary, London Stockholm type ERP requires more effort to deduct ERP
charge when matching the number plate and vehicle ownership for every transaction. Some of the number
plates require human observation and correction more manual transaction is necessary. Jakarta Provincial
Government has already decided to adopt an ERP System similar to Singapore in consideration of its heavy
-36-

Preparatory Survey on Intelligent Transport System Project to mitigate Traffic Congestion in Jakarta (PPP Infrastructure Project) Final Report Summary traffic and number plate database which still needs improvement.
In Singapore type ERP, the system needs to deal with two separate results which come from separate
equipment. One is the communication result taken from Roadside equipment and OBU and the other is the
captured image of Number Plate taken by camera. Consequently the controlling technology to match these two
results and link to the proper vehicle is utmost important. In Singapore, ERP system maintains its high standard
operation by utilizing high level controlling technology and also utilizing one of the highest quality devices for
OBUs, sensors, and cameras.
8.1.2 Main operational functions of the ERP system Until now, Diverse types of ERP system have been introduced in Singapore and several Cities in Europe.
Althouht the detail specification of each system differs to eachother, it is possible to say that the six operational
fucntions of ERP are common, which are Charging, Enforcement, OBU management, Information management,
Traffic management, and Operation & Maintenance.
The Outline of the six operational functions are shown in Figure 8-1-2 and Table 8-1-1.
Figure 8-1-2 Six operational functions of ERP system
Table 8-1-1 Outline of six operational functions of ERP system
No. Operational Function Outline
1 Collect ERP charge Function to Collect ERP charge from users
2 Enforcement Function to control violators of ERP
3 OBU Management Function to manage authorized OBU for ERP
4 Information Management Function to manage all kinds of necessary information for ERP
5 Traffic Management Function to monitor the traffic condition and evaluate the effect of
NO.1 Collect charging fee NO.2 Enforcement
NO.3 OBU Management NO.4 Information Management
NO.5 Traffic Management NO.6 Operation and Maintenance
-37-
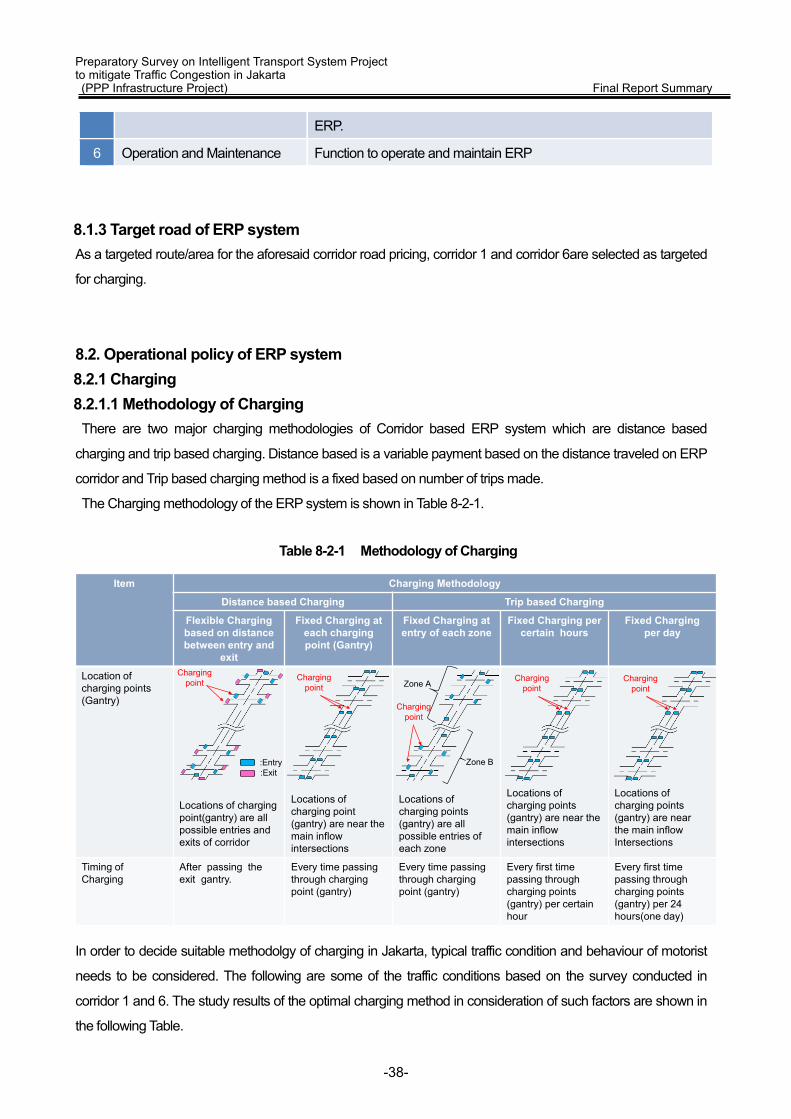
Preparatory Survey on Intelligent Transport System Project to mitigate Traffic Congestion in Jakarta (PPP Infrastructure Project) Final Report Summary
ERP.
6 Operation and Maintenance Function to operate and maintain ERP
8.1.3 Target road of ERP system As a targeted route/area for the aforesaid corridor road pricing, corridor 1 and corridor 6are selected as targeted
for charging.
8.2. Operational policy of ERP system 8.2.1 Charging 8.2.1.1 Methodology of Charging
There are two major charging methodologies of Corridor based ERP system which are distance based
charging and trip based charging. Distance based is a variable payment based on the distance traveled on ERP
corridor and Trip based charging method is a fixed based on number of trips made.
The Charging methodology of the ERP system is shown in Table 8-2-1.
Table 8-2-1 Methodology of Charging
In order to decide suitable methodolgy of charging in Jakarta, typical traffic condition and behaviour of motorist
needs to be considered. The following are some of the traffic conditions based on the survey conducted in
corridor 1 and 6. The study results of the optimal charging method in consideration of such factors are shown in
the following Table.
Item Charging Methodology
Distance based Charging Trip based Charging
Flexible Charging based on distance between entry and
exit
Fixed Charging at each charging point (Gantry)
Fixed Charging at entry of each zone
Fixed Charging percertain hours
Fixed Charging per day
Location of charging points(Gantry)
Locations of charging point(gantry) are all possible entries and exits of corridor
Locations of charging point (gantry) are near the main inflow intersections
Locations of charging points(gantry) are all possible entries of each zone
Locations of charging points (gantry) are near the main inflow intersections
Locations of charging points (gantry) are near the main inflowIntersections
Timing of Charging
After passing the exit gantry.
Every time passing through charging point (gantry)
Every time passing through charging point (gantry)
Every first time passing throughcharging points (gantry) per certain hour
Every first time passing throughcharging points (gantry) per 24 hours(one day)
Charging point
:Entry:Exit
Charging point
Charging point
Zone A
Zone B
Charging point
Charging point
-38-
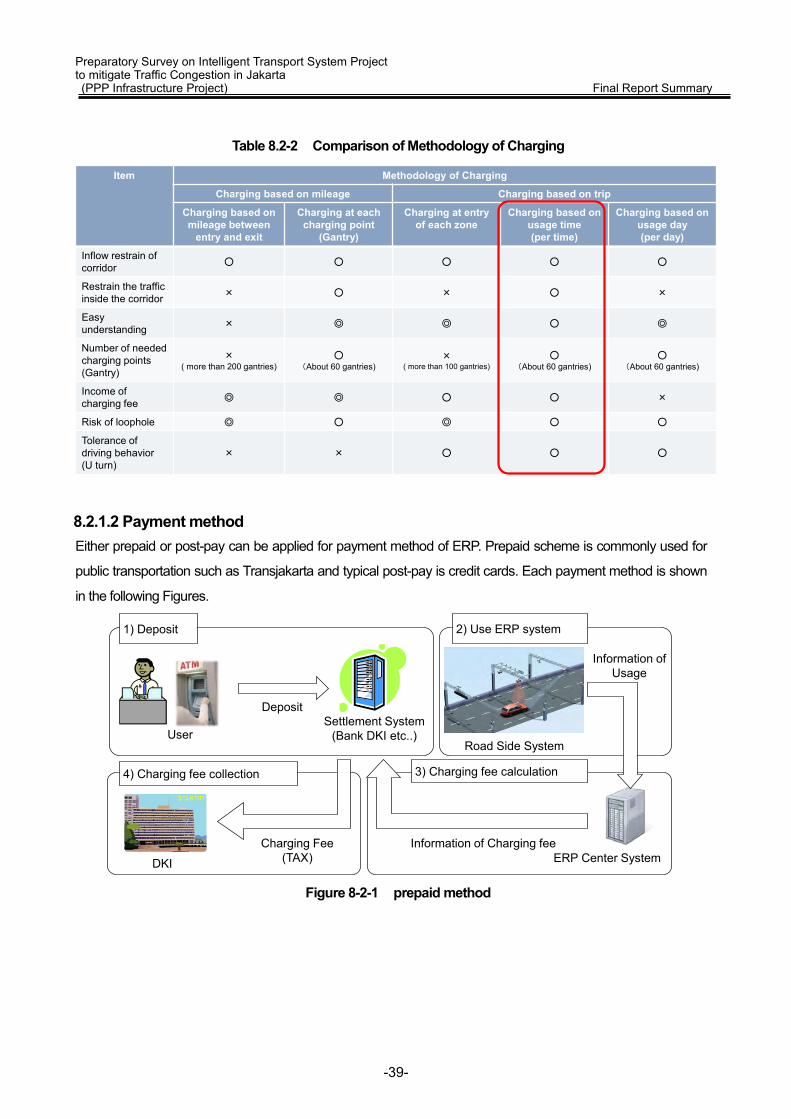
Preparatory Survey on Intelligent Transport System Project to mitigate Traffic Congestion in Jakarta (PPP Infrastructure Project) Final Report Summary
Table 8.2-2 Comparison of Methodology of Charging
8.2.1.2 Payment method Either prepaid or post-pay can be applied for payment method of ERP. Prepaid scheme is commonly used for
public transportation such as Transjakarta and typical post-pay is credit cards. Each payment method is shown
in the following Figures.
Figure 8-2-1 prepaid method
Item Methodology of Charging
Charging based on mileage Charging based on trip
Charging based on mileage between
entry and exit
Charging at each charging point
(Gantry)
Charging at entryof each zone
Charging based on usage time (per time)
Charging based on usage day (per day)
Inflow restrain of corridor ○ ○ ○ ○ ○
Restrain the traffic inside the corridor × ○ × ○ ×
Easy understanding × ◎ ◎ ○ ◎
Number of needed charging points (Gantry)
×( more than 200 gantries)
○(About 60 gantries)
×( more than 100 gantries)
○(About 60 gantries)
○(About 60 gantries)
Income of charging fee ◎ ◎ ○ ○ ×
Risk of loophole ◎ ○ ◎ ○ ○
Tolerance of driving behavior (U turn)
× × ○ ○ ○
Deposit
1) Deposit
Settlement System(Bank DKI etc..)User
Road Side System
2) Use ERP system
Information of Usage
ERP Center System
3) Charging fee calculation4) Charging fee collection
DKI
Charging Fee(TAX)
Information of Charging fee
-39-

Preparatory Survey on Intelligent Transport System Project to mitigate Traffic Congestion in Jakarta (PPP Infrastructure Project) Final Report Summary
Figure 8-2-2 post-pay method
8.2.1.3 Charging flow The optimal charging flow in Jakarta using the Trip based charging method (per certain hours) by prepaid
method is shown in Figure 8-2-3.
Figure 8-2-3 Charging flow
Charging fee
4) Post pay for ERP account
Settlement System(Bank DKI etc..)
User
Road Side System
1) Use ERP system
ERP Center System
3) Charging fee collection
DKI
Charging Fee(TAX)
Information of Charging fee
2) Charging fee calculation
Demand of charging fee
Information of Usage
Deposit
1) Open the ERP account / purchase of public transportation card, deposit
Settlement System(Bank DKI etc..)Bank (Bank DKI etc..)
Road Side system
3) Use ERP system
Information of UsageERP Center
System
4) Charging fee calculation5) Charging fee collection
DKI
Charging fee(TAX)
2) OBU Registration/ Issue/ installation
OBU registration system
OBU / user information
Information of Charging fee
-40-

Preparatory Survey on Intelligent Transport System Project to mitigate Traffic Congestion in Jakarta (PPP Infrastructure Project) Final Report Summary 8.2.2 Violation detection 8.2.2.1 Definition of violation The definition of violations in the ERP system is shown in Table 8-2-3.
Table 8-2-3 Definition of violation
8.2.3 OBU management 8.2.3.1 Objective of OBU management It is necessary to be able to identify whether the information of the vehicle installation device which is provided
when a user used an ERP system and vehicle information are authorized to realize detection of the violation and
the control based on a definition of the violation. Therefore, when OBU is distributed, regular user information
and vehicle information are registered.
8.2.3.2 OBU management flow (1)New registration of user and vehicle User and vehicle information at the time of new registration flow shown in Figure 8-2-4 is advanced in the
following steps.
-41-

Preparatory Survey on Intelligent Transport System Project to mitigate Traffic Congestion in Jakarta (PPP Infrastructure Project) Final Report Summary
Figure 8-2-4 The flow of registration of new user and vehicle
(2) Change of registered contents User and vehicle information when changing flow shown in Figure 8-2-5 proceed with the following steps.
Figure 8-2-5 The flow of change of registered contents
1) Request of OBU issue
2) Registration of user / vehicle information4) OBU issue6) Registration of OBU test result
OBU IssueEquipment
User/ vehicleinformation
User
OBU Registration/ Issue / installation center
Operator
Registration
OBU test result
OBU issue
3) OBU issue process5) OBU installation and test
OBU installation and test are performed by operator ERP Center System
1) Registered content change request
2) Re-registration of user / vehicle information4) OBU issue (if vehicle changed)6) Registration of OBU test result (if vehicle changed)
OBU IssueEquipment
User / Vehicleinformation
User
OBU registration / issue / installation center
Operator
Registration
OBU test result
OBU issue
3) Re-registration process of user / vehicle information
5) OBU installation and test
OBU installation and test are performed by operator.(If vehicle changed)
ERP Center System
-42-
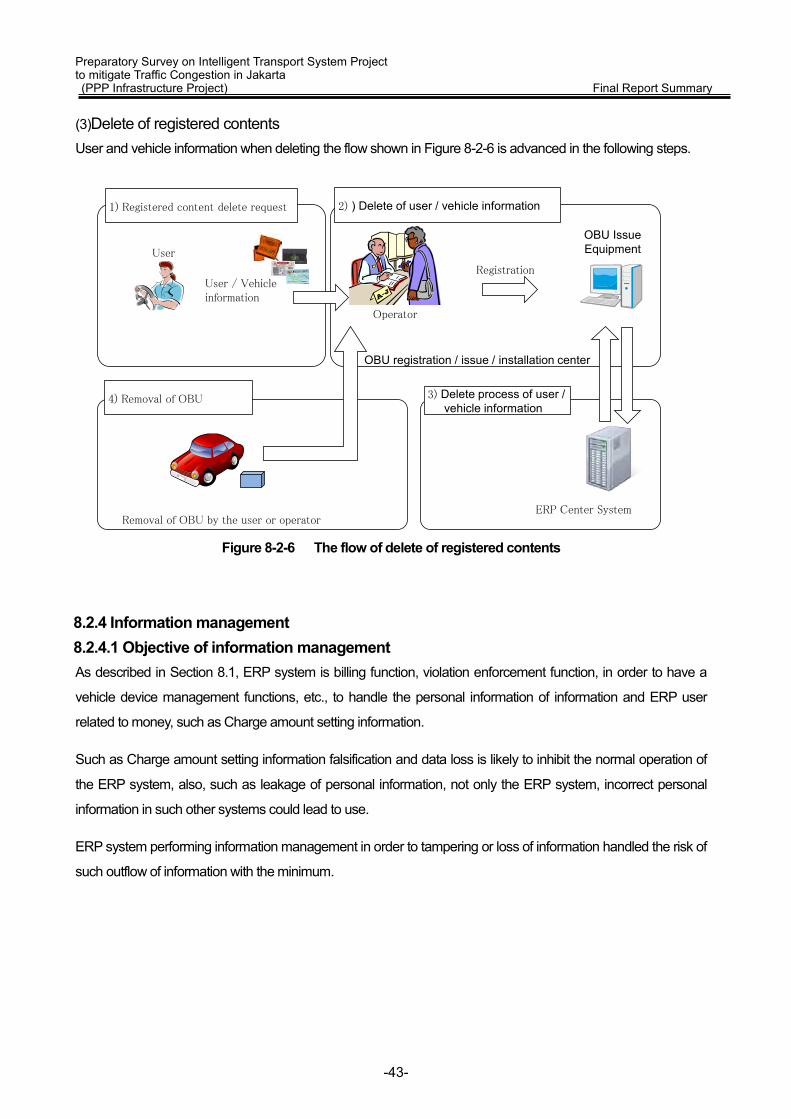
Preparatory Survey on Intelligent Transport System Project to mitigate Traffic Congestion in Jakarta (PPP Infrastructure Project) Final Report Summary (3)Delete of registered contents User and vehicle information when deleting the flow shown in Figure 8-2-6 is advanced in the following steps.
Figure 8-2-6 The flow of delete of registered contents
8.2.4 Information management 8.2.4.1 Objective of information management As described in Section 8.1, ERP system is billing function, violation enforcement function, in order to have a
vehicle device management functions, etc., to handle the personal information of information and ERP user
related to money, such as Charge amount setting information.
Such as Charge amount setting information falsification and data loss is likely to inhibit the normal operation of
the ERP system, also, such as leakage of personal information, not only the ERP system, incorrect personal
information in such other systems could lead to use.
ERP system performing information management in order to tampering or loss of information handled the risk of
such outflow of information with the minimum.
1) Registered content delete request
ERP Center System
2) ) Delete of user / vehicle information
OBU IssueEquipment
User / Vehicleinformation
User
OBU registration / issue / installation center
Operator
Registration
3) Delete process of user / vehicle information
4) Removal of OBU
Removal of OBU by the user or operator
-43-
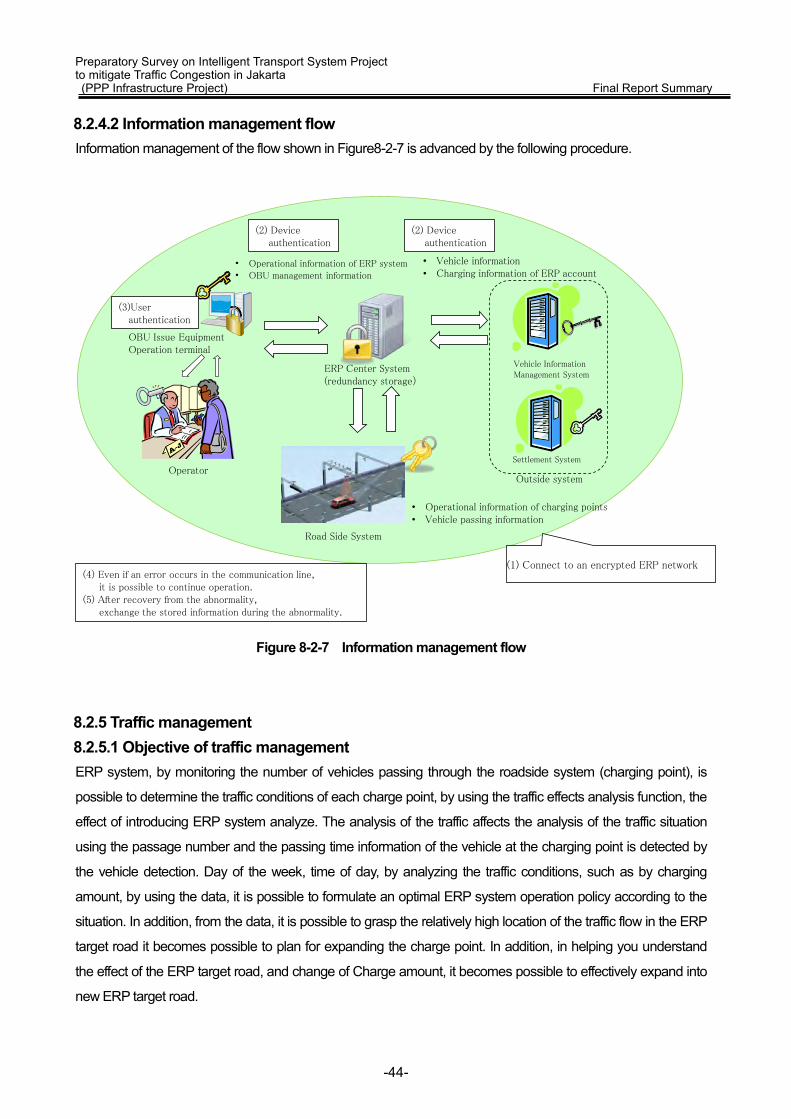
Preparatory Survey on Intelligent Transport System Project to mitigate Traffic Congestion in Jakarta (PPP Infrastructure Project) Final Report Summary 8.2.4.2 Information management flow Information management of the flow shown in Figure8-2-7 is advanced by the following procedure.
Figure 8-2-7 Information management flow
8.2.5 Traffic management 8.2.5.1 Objective of traffic management ERP system, by monitoring the number of vehicles passing through the roadside system (charging point), is
possible to determine the traffic conditions of each charge point, by using the traffic effects analysis function, the
effect of introducing ERP system analyze. The analysis of the traffic affects the analysis of the traffic situation
using the passage number and the passing time information of the vehicle at the charging point is detected by
the vehicle detection. Day of the week, time of day, by analyzing the traffic conditions, such as by charging
amount, by using the data, it is possible to formulate an optimal ERP system operation policy according to the
situation. In addition, from the data, it is possible to grasp the relatively high location of the traffic flow in the ERP
target road it becomes possible to plan for expanding the charge point. In addition, in helping you understand
the effect of the ERP target road, and change of Charge amount, it becomes possible to effectively expand into
new ERP target road.
• Operational information of ERP system• OBU management information
(1) Connect to an encrypted ERP network
• Operational information of charging points• Vehicle passing information
• Vehicle information• Charging information of ERP account
Outside system
Road Side System
ERP Center System(redundancy storage)
Vehicle Information Management System
Settlement System
Operator
OBU Issue EquipmentOperation terminal
(2) Deviceauthentication
(3)User authentication
(4) Even if an error occurs in the communication line, it is possible to continue operation.
(5) After recovery from the abnormality, exchange the stored information during the abnormality.
(2) Deviceauthentication
-44-

Preparatory Survey on Intelligent Transport System Project to mitigate Traffic Congestion in Jakarta (PPP Infrastructure Project) Final Report Summary 8.3. Configuration of the ERP system 8.3.1 System configuration The system configuration of the ERP system is shown in Figure 8-3-1.
Figure 8-3-1 System configuration
1. Monitor status of operation2. Check result of charging3. Check violator and violation4. Check OBU information5. Renew user’s portal site6. Check user’s complaint etc.
Road Side SystemERP Center System
Internet Cloud
Utilize ERP System
1. Detect user2. Get user’s information
1. Open ERP bank account2. Deposit currency3. Provide user’s information4. Use ERP System
Utilization information
ERP User
Require O&M
1. Charge2. Detect violation3. Manage OBU4. Manage information5. Manage traff ic6. Operate and maintain
ERP Center SystemBack Office
Require several information
Several information
Call Center
Maintenance Center
User’s Portal Site1. Issue usage history2. Issue usage detail3. Show balance of account4. Inform status of operation5. Inform charging fee etc.
Several requirements
Open ERP bank accountDeposit currency
1. Answer user’s question2. Resolve user’s complaint
Answer
Question
Bank
Settlement System (Bank)
1. Open ERP bank account2. Receipt depositing
Account informationDepositing informationOBU Registration/ Issue/
installation CenterUser information
Issue OBUInstall OBU
Several requirements
Several information
DKI
OBU information
1. Register OBU2. Issue OBU3. Install OBU
Require chargeCheck balance
Charging result / balance
1. Collect charging fee2. Manage ERP bank account3. Manage balance4. Transfer retribution to DKI
Transfer retribution
Vehicle Information Management System
(Police)Regulator(Police)
1. Maintain ERP System2. Examine ERP System3. Change and repair equipment
Require maintenance
Result of maintenance
Charging resultTraff ic effect
1. Regulate violator 1. Manage vehicle information
Require vehicleinformationVehicle
information
Result of regulationViolator information
1. Receive retribution2. Reset charging fee3. Spread ERP road
Several information
Several information
-45-

Preparatory Survey on Intelligent Transport System Project to mitigate Traffic Congestion in Jakarta (PPP Infrastructure Project) Final Report Summary
Chapter 9. Operation and Management of ERP 9.1. Estimate of ERP Project Cost We have estimated the Project Cost as below:
Project Cost (Implementation): 1.3 trillion Rupiah
Operation & Maintenance: 130 billion Rupiah
The details of Project cost are described in Table 9-1-1.
Table 9-1-1 Items for Revenue Estimation
-46-
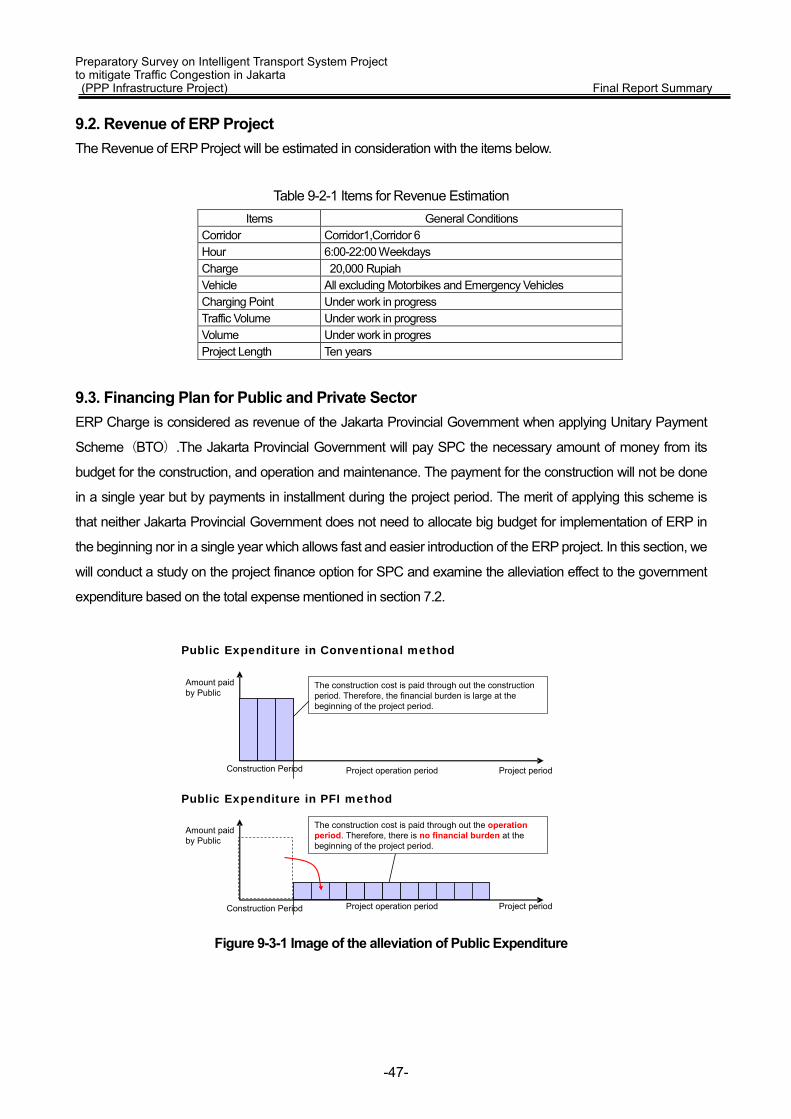
Preparatory Survey on Intelligent Transport System Project to mitigate Traffic Congestion in Jakarta (PPP Infrastructure Project) Final Report Summary 9.2. Revenue of ERP Project The Revenue of ERP Project will be estimated in consideration with the items below.
Table 9-2-1 Items for Revenue Estimation
Items General Conditions Corridor Corridor1,Corridor 6 Hour 6:00-22:00 Weekdays Charge 20,000 Rupiah Vehicle All excluding Motorbikes and Emergency Vehicles Charging Point Under work in progress Traffic Volume Under work in progress Volume Under work in progres Project Length Ten years
9.3. Financing Plan for Public and Private Sector ERP Charge is considered as revenue of the Jakarta Provincial Government when applying Unitary Payment
Scheme(BTO).The Jakarta Provincial Government will pay SPC the necessary amount of money from its
budget for the construction, and operation and maintenance. The payment for the construction will not be done
in a single year but by payments in installment during the project period. The merit of applying this scheme is
that neither Jakarta Provincial Government does not need to allocate big budget for implementation of ERP in
the beginning nor in a single year which allows fast and easier introduction of the ERP project. In this section, we
will conduct a study on the project finance option for SPC and examine the alleviation effect to the government
expenditure based on the total expense mentioned in section 7.2.
Figure 9-3-1 Image of the alleviation of Public Expenditure
Project operation period Project period
Public Expenditure in Conventional method
Construction Period
Public Expenditure in PFI method
The construction cost is paid through out the construction period. Therefore, the financial burden is large at the beginning of the project period.
Project operation period Project periodConstruction Period
Amount paid by Public
Amount paid by Public
The construction cost is paid through out the operation period. Therefore, there is no financial burden at the beginning of the project period.
-47-
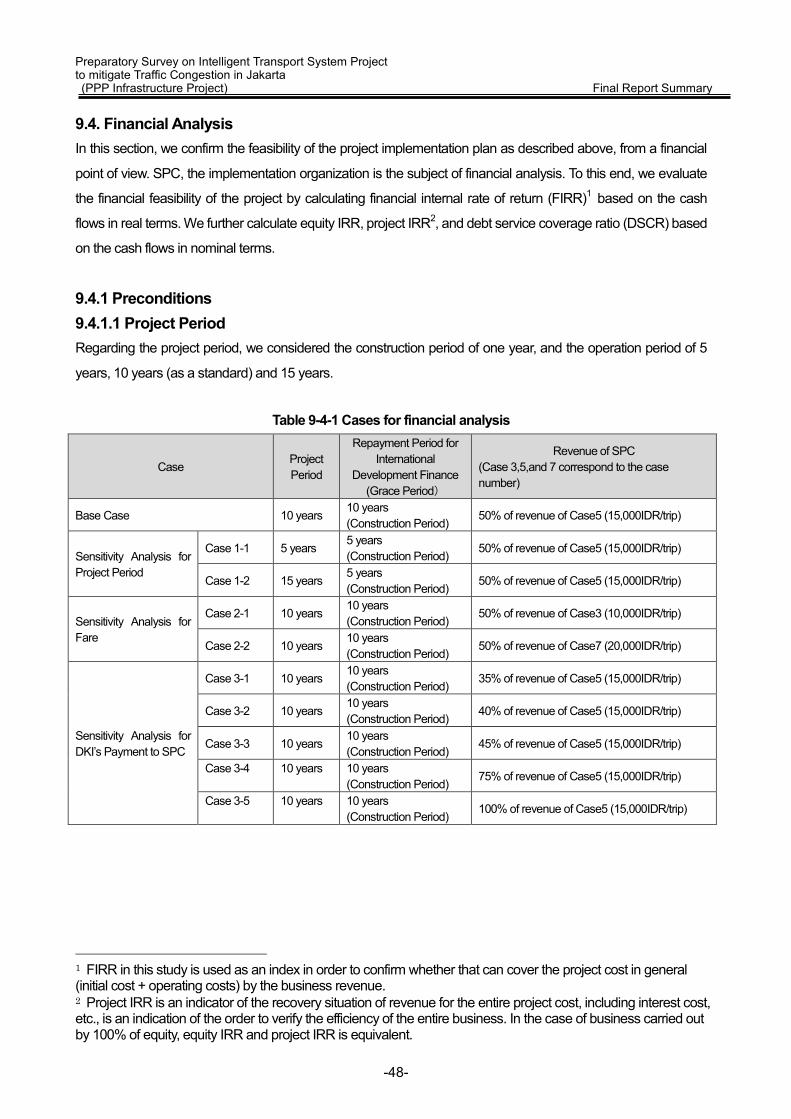
Preparatory Survey on Intelligent Transport System Project to mitigate Traffic Congestion in Jakarta (PPP Infrastructure Project) Final Report Summary 9.4. Financial Analysis In this section, we confirm the feasibility of the project implementation plan as described above, from a financial
point of view. SPC, the implementation organization is the subject of financial analysis. To this end, we evaluate
the financial feasibility of the project by calculating financial internal rate of return (FIRR)1 based on the cash
flows in real terms. We further calculate equity IRR, project IRR2, and debt service coverage ratio (DSCR) based
on the cash flows in nominal terms.
9.4.1 Preconditions 9.4.1.1 Project Period Regarding the project period, we considered the construction period of one year, and the operation period of 5
years, 10 years (as a standard) and 15 years.
Table 9-4-1 Cases for financial analysis
Case Project Period
Repayment Period for International
Development Finance (Grace Period)
Revenue of SPC (Case 3,5,and 7 correspond to the case number)
Base Case 10 years 10 years (Construction Period)
50% of revenue of Case5 (15,000IDR/trip)
Sensitivity Analysis for Project Period
Case 1-1 5 years 5 years (Construction Period)
50% of revenue of Case5 (15,000IDR/trip)
Case 1-2 15 years 5 years (Construction Period)
50% of revenue of Case5 (15,000IDR/trip)
Sensitivity Analysis for Fare
Case 2-1 10 years 10 years (Construction Period)
50% of revenue of Case3 (10,000IDR/trip)
Case 2-2 10 years 10 years (Construction Period)
50% of revenue of Case7 (20,000IDR/trip)
Sensitivity Analysis for DKI’s Payment to SPC
Case 3-1 10 years 10 years (Construction Period)
35% of revenue of Case5 (15,000IDR/trip)
Case 3-2 10 years 10 years (Construction Period)
40% of revenue of Case5 (15,000IDR/trip)
Case 3-3 10 years 10 years (Construction Period)
45% of revenue of Case5 (15,000IDR/trip)
Case 3-4 10 years 10 years (Construction Period)
75% of revenue of Case5 (15,000IDR/trip)
Case 3-5 10 years 10 years (Construction Period)
100% of revenue of Case5 (15,000IDR/trip)
1 FIRR in this study is used as an index in order to confirm whether that can cover the project cost in general (initial cost + operating costs) by the business revenue. 2 Project IRR is an indicator of the recovery situation of revenue for the entire project cost, including interest cost, etc., is an indication of the order to verify the efficiency of the entire business. In the case of business carried out by 100% of equity, equity IRR and project IRR is equivalent.
-48-

Preparatory Survey on Intelligent Transport System Project to mitigate Traffic Congestion in Jakarta (PPP Infrastructure Project) Final Report Summary 9.4.2 Financial Analysis 9.4.2.1 Base Case
We calculated the FIRR for the base case of 10 years project periods with 50% payment arising from Case 5
income (15,000 IDR/trip). The resultant FIRR was 20.32%. In this case, the financial feasibility of this project is
considered to be fine.
Table 9-4-2 Cash Flow for FIRR (Base Case, Unit: billion IDR)
Year Revenue (Without Inflation)
Initial (including tax)
O&M (Without Inflation) FIRR(20.32%)
0 0 -1,287 0 -1,287 1 391 0 -81 310 2 391 0 -81 310 3 391 0 -81 310 4 391 0 -81 310 5 391 0 -81 310 6 391 0 -81 310 7 391 0 -81 310 8 391 0 -81 310 9 391 0 -81 310 10 391 0 -81 310
Total 3,914 -1,287 -811 1,816
9.5. Economic Analysis 9.5.1 Result With aforementioned preconditions we derived economic-analysis-related indexes in the case of 15,000IDR
fare. With EIRR of 103.34%, NPV of 5.5 trillion Rupiah and B/C being 6.25, we can find that the economic
viability of the project is sufficient.
Table 9-5-1 Cash Flow for Economic Analysis (Base Case, Unit: billion IDR)
Year Benefit Initial
(Without tax)
O&M (Without inflation)
EIRR(103.34%) Discounted
Benefit Discounted
Cost NPV
0 0 -1,138 0 -1,138 0 -1,138 -1,138
1 1,258 0 -81 1,177 1,123 0 1,051
2 1,258 0 -81 1,177 1,003 0 938
3 1,258 0 -81 1,177 895 0 838
4 1,258 0 -81 1,177 800 0 748
5 1,258 0 -81 1,177 714 0 668
6 1,258 0 -81 1,177 637 0 596
7 1,258 0 -81 1,177 569 0 532
8 1,258 0 -81 1,177 508 0 475
-49-
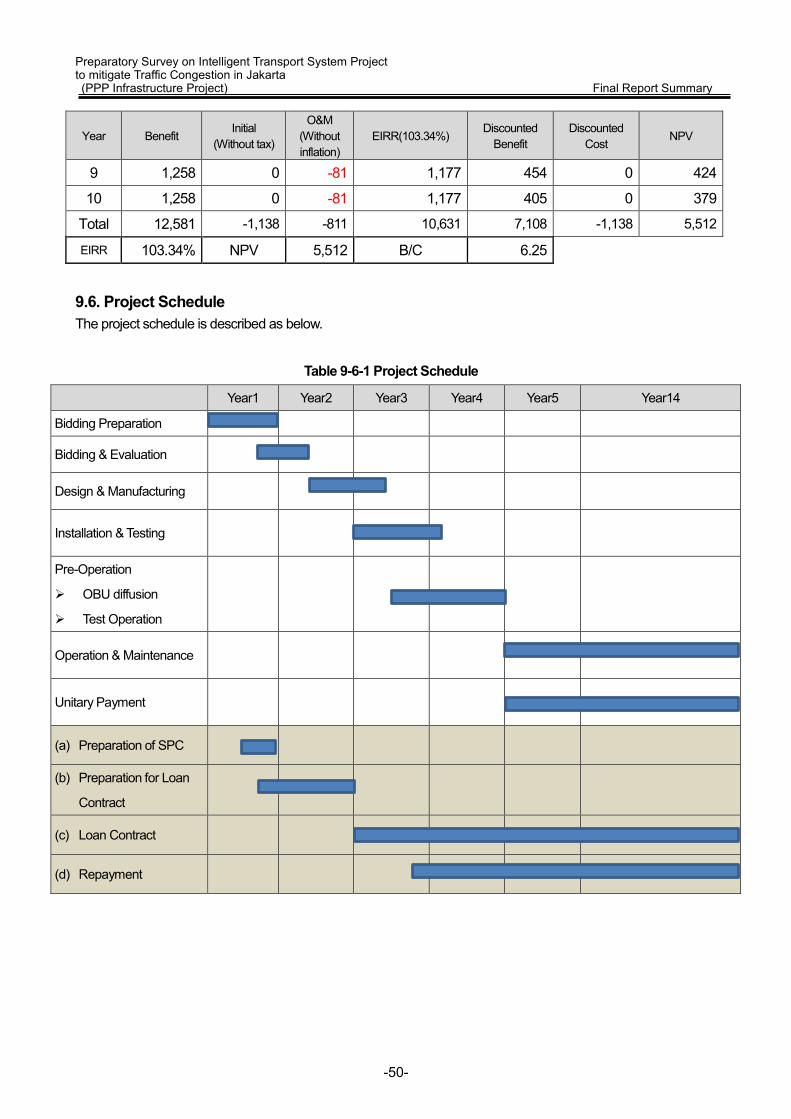
Preparatory Survey on Intelligent Transport System Project to mitigate Traffic Congestion in Jakarta (PPP Infrastructure Project) Final Report Summary
Year Benefit Initial
(Without tax)
O&M (Without inflation)
EIRR(103.34%) Discounted
Benefit Discounted
Cost NPV
9 1,258 0 -81 1,177 454 0 424
10 1,258 0 -81 1,177 405 0 379
Total 12,581 -1,138 -811 10,631 7,108 -1,138 5,512
EIRR 103.34% NPV 5,512 B/C 6.25
9.6. Project Schedule The project schedule is described as below.
Table 9-6-1 Project Schedule
Year1 Year2 Year3 Year4 Year5 Year14
Bidding Preparation
Bidding & Evaluation
Design & Manufacturing
Installation & Testing
Pre-Operation
OBU diffusion
Test Operation
Operation & Maintenance
Unitary Payment
(a) Preparation of SPC
(b) Preparation for Loan
Contract
(c) Loan Contract
(d) Repayment
-50-
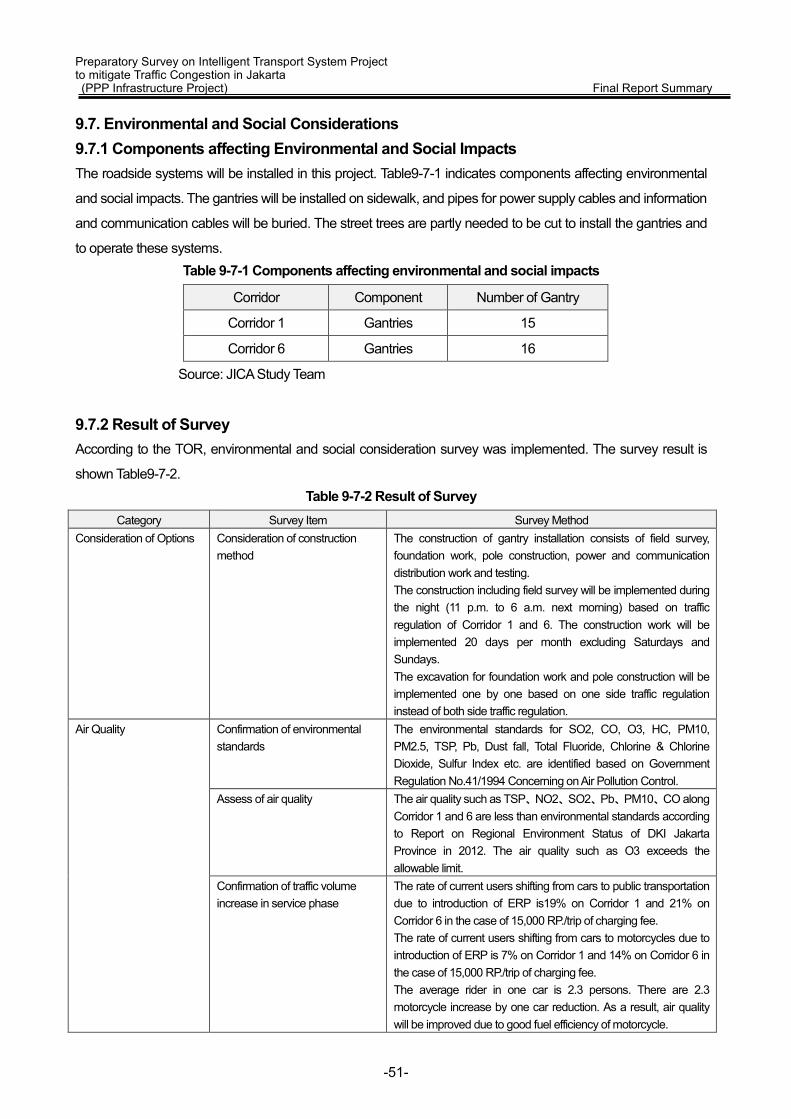
Preparatory Survey on Intelligent Transport System Project to mitigate Traffic Congestion in Jakarta (PPP Infrastructure Project) Final Report Summary 9.7. Environmental and Social Considerations 9.7.1 Components affecting Environmental and Social Impacts The roadside systems will be installed in this project. Table9-7-1 indicates components affecting environmental
and social impacts. The gantries will be installed on sidewalk, and pipes for power supply cables and information
and communication cables will be buried. The street trees are partly needed to be cut to install the gantries and
to operate these systems. Table 9-7-1 Components affecting environmental and social impacts
Corridor Component Number of Gantry
Corridor 1 Gantries 15
Corridor 6 Gantries 16
Source: JICA Study Team
9.7.2 Result of Survey According to the TOR, environmental and social consideration survey was implemented. The survey result is
shown Table9-7-2. Table 9-7-2 Result of Survey
Category Survey Item Survey Method Consideration of Options Consideration of construction
method The construction of gantry installation consists of field survey, foundation work, pole construction, power and communication distribution work and testing. The construction including field survey will be implemented during the night (11 p.m. to 6 a.m. next morning) based on traffic regulation of Corridor 1 and 6. The construction work will be implemented 20 days per month excluding Saturdays and Sundays. The excavation for foundation work and pole construction will be implemented one by one based on one side traffic regulation instead of both side traffic regulation.
Air Quality Confirmation of environmental standards
The environmental standards for SO2, CO, O3, HC, PM10, PM2.5, TSP, Pb, Dust fall, Total Fluoride, Chlorine & Chlorine Dioxide, Sulfur Index etc. are identified based on Government Regulation No.41/1994 Concerning on Air Pollution Control.
Assess of air quality
The air quality such as TSP、NO2、SO2、Pb、PM10、CO along Corridor 1 and 6 are less than environmental standards according to Report on Regional Environment Status of DKI Jakarta Province in 2012. The air quality such as O3 exceeds the allowable limit.
Confirmation of traffic volume increase in service phase
The rate of current users shifting from cars to public transportation due to introduction of ERP is19% on Corridor 1 and 21% on Corridor 6 in the case of 15,000 RP./trip of charging fee. The rate of current users shifting from cars to motorcycles due to introduction of ERP is 7% on Corridor 1 and 14% on Corridor 6 in the case of 15,000 RP./trip of charging fee. The average rider in one car is 2.3 persons. There are 2.3 motorcycle increase by one car reduction. As a result, air quality will be improved due to good fuel efficiency of motorcycle.
-51-

Preparatory Survey on Intelligent Transport System Project to mitigate Traffic Congestion in Jakarta (PPP Infrastructure Project) Final Report Summary
Category Survey Item Survey Method On the other hand, usage of diversionary channel and changing destination will be attributive, 8% of current users on Corridor 1 and 3% on Corridor 6. Hence, no air quality deterioration will be expected.
Confirmation of residences, schools and hospitals in the project site and the surrounding area
The medical facilities, schools and residence area are identified along Corridor 1 and 6, 1km each side. There are 14 medical (see Table9-7-9) facilities and 47 schools (see Table9-7-10) along Corridor 1 and 6 medical facilities (see Table9-7-9) and 30 schools (see Table9-7-10) along Corridor 6. There so many residence area along both corridor.
Impacts during construction The construction of gantry installation consists of field survey, foundation work, pole construction, power and communication distribution work and testing. ●Field survey: 2 days each site Boring investigation will be implemented each site. ●Foundation work: 10 days each site 1 backhoe, 1 truck and 1 rough terrain crane for tree cutting, if necessary. 1 backhoe and 1 truck for excavation 1 vibrohammer, 1 rough terrain crane (9.9t), 1 truck (10t) and 1 auger for piling 1 truck and 1 concrete mixer truck for formwork, reinforcing steel and blinding concrete 1 concrete mixer truck for depositing concrete ●Pole construction: 6 days each site 1 rough terrain crane (9.9t) and 1 truck (10t) for pole construction 1 rough terrain crane (9.9t), 1 truck (10t) and 2 lift type for joist construction 1 lift type for other construction ●Power and communication distribution work: 5 days each site 1 lift type and 1 unique vehicle (4t) ●Testing: 5 days each site There is no necessity to prepare construction vehicles. Air quality deterioration such as NO2, CO, CO2, HC and PM will be expected because of exhaust gases from construction vehicles.
Waste Disposal method for construction waste soil and scrap wood
The construction waste soil, waste concrete and scrap wood are needed to discard according to regulation of DKI Jakarta.
Soil Contamination Measures to prevent soil contamination due to spill of fuel oil and lubrication oil from construction vehicles during construction
The construction vehicles will not park on the soil to prevent soil contamination
Noise and Vibration Confirmation of environmental standards
The noise level is stipulated according to KEP-48/MENLH/11/1996 as follows; Residential zone: 55 dB Office building: 65 dB Medical facility: 55 dB School :55 dB The vibration level is stipulated according to
-52-
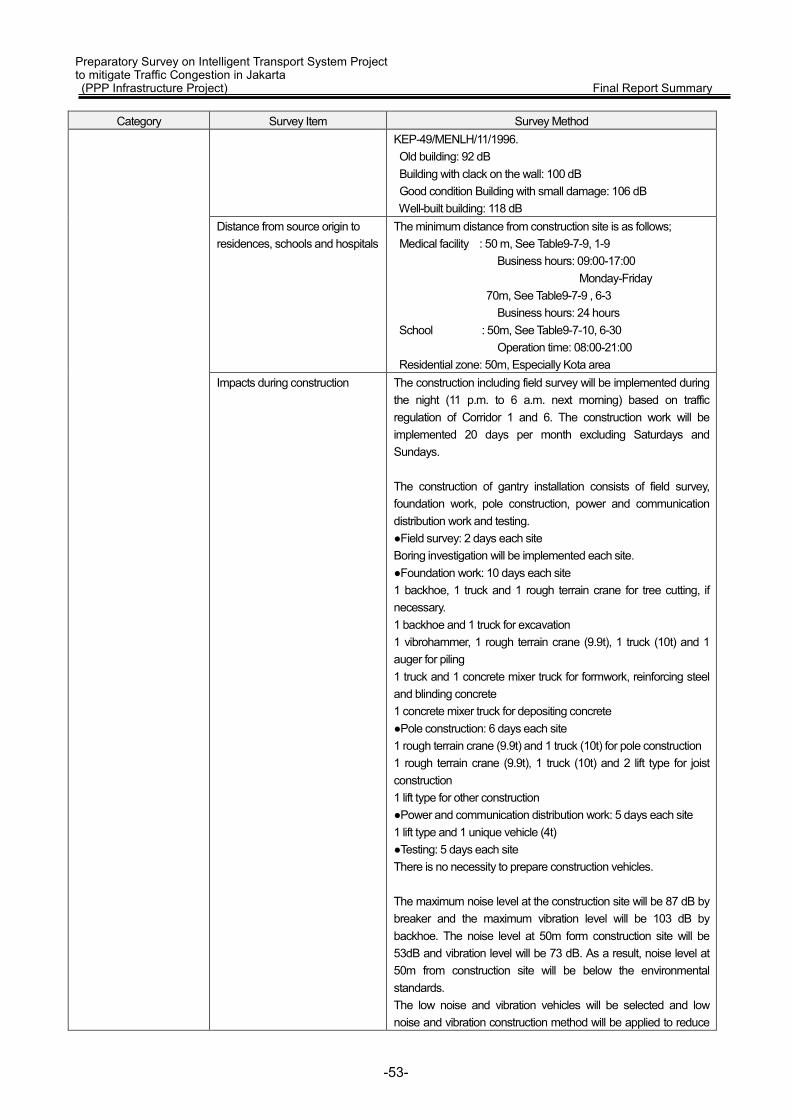
Preparatory Survey on Intelligent Transport System Project to mitigate Traffic Congestion in Jakarta (PPP Infrastructure Project) Final Report Summary
Category Survey Item Survey Method KEP-49/MENLH/11/1996. Old building: 92 dB Building with clack on the wall: 100 dB Good condition Building with small damage: 106 dB Well-built building: 118 dB
Distance from source origin to residences, schools and hospitals
The minimum distance from construction site is as follows; Medical facility : 50 m, See Table9-7-9, 1-9 Business hours: 09:00-17:00 Monday-Friday 70m, See Table9-7-9 , 6-3 Business hours: 24 hours School : 50m, See Table9-7-10, 6-30 Operation time: 08:00-21:00 Residential zone: 50m, Especially Kota area
Impacts during construction The construction including field survey will be implemented during the night (11 p.m. to 6 a.m. next morning) based on traffic regulation of Corridor 1 and 6. The construction work will be implemented 20 days per month excluding Saturdays and Sundays. The construction of gantry installation consists of field survey, foundation work, pole construction, power and communication distribution work and testing. ●Field survey: 2 days each site Boring investigation will be implemented each site. ●Foundation work: 10 days each site 1 backhoe, 1 truck and 1 rough terrain crane for tree cutting, if necessary. 1 backhoe and 1 truck for excavation 1 vibrohammer, 1 rough terrain crane (9.9t), 1 truck (10t) and 1 auger for piling 1 truck and 1 concrete mixer truck for formwork, reinforcing steel and blinding concrete 1 concrete mixer truck for depositing concrete ●Pole construction: 6 days each site 1 rough terrain crane (9.9t) and 1 truck (10t) for pole construction 1 rough terrain crane (9.9t), 1 truck (10t) and 2 lift type for joist construction 1 lift type for other construction ●Power and communication distribution work: 5 days each site 1 lift type and 1 unique vehicle (4t) ●Testing: 5 days each site There is no necessity to prepare construction vehicles. The maximum noise level at the construction site will be 87 dB by breaker and the maximum vibration level will be 103 dB by backhoe. The noise level at 50m form construction site will be 53dB and vibration level will be 73 dB. As a result, noise level at 50m from construction site will be below the environmental standards. The low noise and vibration vehicles will be selected and low noise and vibration construction method will be applied to reduce
-53-
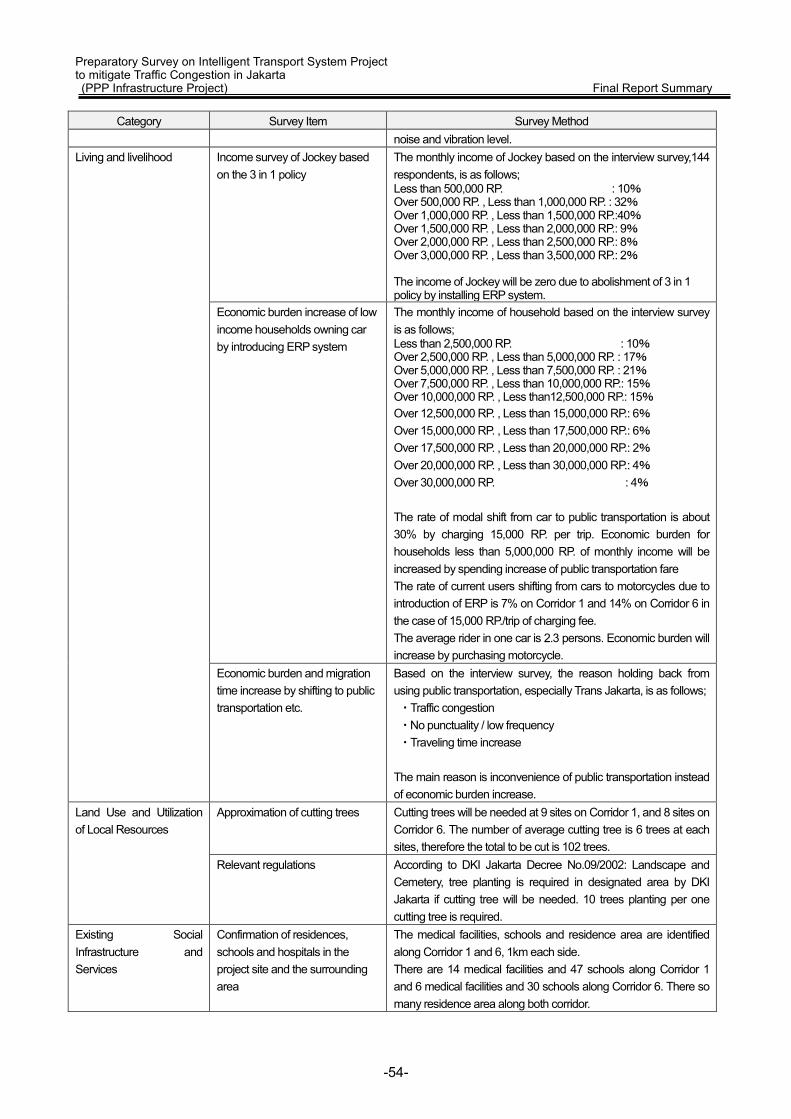
Preparatory Survey on Intelligent Transport System Project to mitigate Traffic Congestion in Jakarta (PPP Infrastructure Project) Final Report Summary
Category Survey Item Survey Method noise and vibration level.
Living and livelihood Income survey of Jockey based on the 3 in 1 policy
The monthly income of Jockey based on the interview survey,144 respondents, is as follows; Less than 500,000 RP. : 10% Over 500,000 RP. , Less than 1,000,000 RP. : 32% Over 1,000,000 RP. , Less than 1,500,000 RP.:40% Over 1,500,000 RP. , Less than 2,000,000 RP.: 9% Over 2,000,000 RP. , Less than 2,500,000 RP.: 8% Over 3,000,000 RP. , Less than 3,500,000 RP.: 2% The income of Jockey will be zero due to abolishment of 3 in 1 policy by installing ERP system.
Economic burden increase of low income households owning car by introducing ERP system
The monthly income of household based on the interview survey is as follows; Less than 2,500,000 RP. : 10% Over 2,500,000 RP. , Less than 5,000,000 RP. : 17% Over 5,000,000 RP. , Less than 7,500,000 RP. : 21% Over 7,500,000 RP. , Less than 10,000,000 RP.: 15% Over 10,000,000 RP. , Less than12,500,000 RP.: 15% Over 12,500,000 RP. , Less than 15,000,000 RP.: 6% Over 15,000,000 RP. , Less than 17,500,000 RP.: 6% Over 17,500,000 RP. , Less than 20,000,000 RP.: 2% Over 20,000,000 RP. , Less than 30,000,000 RP.: 4% Over 30,000,000 RP. : 4% The rate of modal shift from car to public transportation is about 30% by charging 15,000 RP. per trip. Economic burden for households less than 5,000,000 RP. of monthly income will be increased by spending increase of public transportation fare The rate of current users shifting from cars to motorcycles due to introduction of ERP is 7% on Corridor 1 and 14% on Corridor 6 in the case of 15,000 RP./trip of charging fee. The average rider in one car is 2.3 persons. Economic burden will increase by purchasing motorcycle.
Economic burden and migration time increase by shifting to public transportation etc.
Based on the interview survey, the reason holding back from using public transportation, especially Trans Jakarta, is as follows; ・Traffic congestion ・No punctuality / low frequency ・Traveling time increase The main reason is inconvenience of public transportation instead of economic burden increase.
Land Use and Utilization of Local Resources
Approximation of cutting trees Cutting trees will be needed at 9 sites on Corridor 1, and 8 sites on Corridor 6. The number of average cutting tree is 6 trees at each sites, therefore the total to be cut is 102 trees.
Relevant regulations According to DKI Jakarta Decree No.09/2002: Landscape and Cemetery, tree planting is required in designated area by DKI Jakarta if cutting tree will be needed. 10 trees planting per one cutting tree is required.
Existing Social Infrastructure and Services
Confirmation of residences, schools and hospitals in the project site and the surrounding area
The medical facilities, schools and residence area are identified along Corridor 1 and 6, 1km each side. There are 14 medical facilities and 47 schools along Corridor 1 and 6 medical facilities and 30 schools along Corridor 6. There so many residence area along both corridor.
-54-

Preparatory Survey on Intelligent Transport System Project to mitigate Traffic Congestion in Jakarta (PPP Infrastructure Project) Final Report Summary
Category Survey Item Survey Method Impacts during construction The construction including field survey will be implemented during
the night (11 p.m. to 6 a.m. next morning) based on traffic regulation of Corridor 1 and 6. The construction work will be implemented 20 days per month excluding Saturdays and Sundays. Hence, the impacts during construction will not be expected.
Gender Confirmation of traffic volume increase in service phase
Usage of diversionary channel and changing destination will be attributive, 8% of current users on Corridor 1 and 3% on Corridor 6. Hence, the impacts for gender will not be expected by traffic congestion increase.
Impacts of modal shift Based on the interview survey, the reason holding back from using public transportation, especially Trans Jakarta, is as follows; ・Traffic congestion ・No punctuality / low frequency ・Traveling time increase The impacts for gender will be expected because of traveling time increase by using public transportation. The rate of current users changing from cars to motorcycles due to introduction of ERP is 7% on Corridor 1 and 14% on Corridor 6. The average rider in one car is 2.3 persons. The impacts for gender will be expected because of economic burden increase by buying motorcycle.
Infection including HIV/AIDS and Others
Disease rate of HIV/AIDS in the project site and the surrounding area.
According to Ministry of Health, number of disease for HIV/AIDS in DKI Jakarta as of 2013 was as follows; DKI Jakarta Indonesia HIV 28,790 127,416 AIDS 7,477 52,348 The rate of disease in DKI Jakarta is calculated as follows; HIV : 0.3% AIDS: 0.08%
Organization conducting Related activities
The policy of DKI Jakarta to prevent transmission of disease is as follows; ・Institution of No.5/2008 ・Prevention measure is consist of 12 components ・Voluntary Counseling Test (VCT) is implemented in corporation with NGO
Working Conditions Safety measures for labor The below items will be conducted as safety measures for labor. ・Obeying Indonesian laws and regulations ・Preparing implementation plan including accident prevention and safety management ・Safety institution to workers ・Pre maintenance of construction vehicles ・Fall prevention of construction vehicles by wind speed monitoring ・Nasty fall prevention of workers ・Prevention of heat stroke
Source: JICA study team
-55-

Preparatory Survey on Intelligent Transport System Project to mitigate Traffic Congestion in Jakarta (PPP Infrastructure Project) Final Report Summary 9.7.3 Evaluation of Survey result Based on the survey result, Table9-7-11, scoping and survey result is prepared by evaluating environmental and
social impacts. The environmental items evaluated as A, B or C as of scoping phase are reevaluated and the
reason for reevaluated environmental items as D is clarified. Table 9-7-3 Scoping and Survey result
Category No.
Environmental Items
Evaluation as of scoping Evaluation based on survey result
Reason of Evaluation Before and During
Construction In Service
Before and During
Construction In Service
Pollution Control
1 Air Quality B- C- B- B+
DC: The environment deterioration of air quality will be expected by operation of construction vehicles during the night(from 11 p.m. to 6 a.m. next morning) DO: The modal shift and shift from cars to motorcycles will be expected by ERP systems installation, charging 15,000 RP. /trip. This shift rate is totally about 30% of current users. On the other hand, usage of diversionary channel and changing destination will be attributive, 8% of current users. Hence, air quality improvement will be expected .
2 Waste B- D B- D
DC: Construction waste soil and scrap wood generation will be expected due to ERP system installation. DO: No construction waste soil and scrap wood generation will be expected.
3 Soil Contamination B- D D D
DC: Soil contamination will not be expected due to placement of construction vehicles outside soil. DO: Soil contamination will not be expected.
4 Noise and Vibration B- C- B- D
DC: The noise level for medical facilities, schools and residential area is 55 dB. Some medical facilities and residential area are located within 50m from construction site .The impacts will be limited due to damping of noise level with enough distance between construction site and medical facilities and/or residential area. The impacts of vibration will be attributive due to 73 dB less than regulation level. Do: The usage of diversionary channel and changing destination will be attributive. Hence, noise and vibration deterioration will not be expected .
Social Environment
5 Living and livelihood D C- D B-
DC: The impacts will not be expected. DO: The major monthly income of Jockey is between 1,000,000 Rp. and 1,500,000 Rp. The 3 in 1 policy will repeal at the same time as installation of ERP
-56-
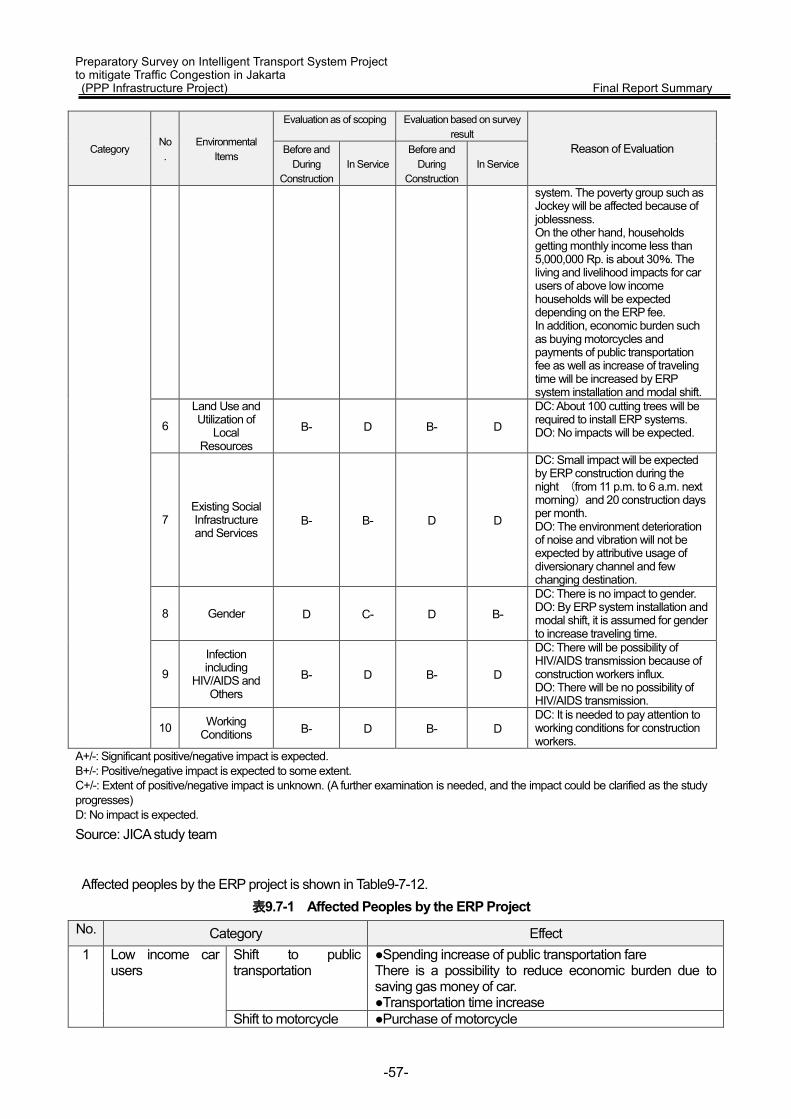
Preparatory Survey on Intelligent Transport System Project to mitigate Traffic Congestion in Jakarta (PPP Infrastructure Project) Final Report Summary
Category No.
Environmental Items
Evaluation as of scoping Evaluation based on survey result
Reason of Evaluation Before and During
Construction In Service
Before and During
Construction In Service
system. The poverty group such as Jockey will be affected because of joblessness. On the other hand, households getting monthly income less than 5,000,000 Rp. is about 30%. The living and livelihood impacts for car users of above low income households will be expected depending on the ERP fee. In addition, economic burden such as buying motorcycles and payments of public transportation fee as well as increase of traveling time will be increased by ERP system installation and modal shift.
6
Land Use and Utilization of
Local Resources
B- D B- D
DC: About 100 cutting trees will be required to install ERP systems. DO: No impacts will be expected.
7 Existing Social Infrastructure and Services
B- B- D D
DC: Small impact will be expected by ERP construction during the night (from 11 p.m. to 6 a.m. next morning)and 20 construction days per month. DO: The environment deterioration of noise and vibration will not be expected by attributive usage of diversionary channel and few changing destination.
8 Gender D C- D B-
DC: There is no impact to gender. DO: By ERP system installation and modal shift, it is assumed for gender to increase traveling time.
9
Infection including
HIV/AIDS and Others
B- D B- D
DC: There will be possibility of HIV/AIDS transmission because of construction workers influx. DO: There will be no possibility of HIV/AIDS transmission.
10 Working Conditions B- D B- D
DC: It is needed to pay attention to working conditions for construction workers.
A+/-: Significant positive/negative impact is expected. B+/-: Positive/negative impact is expected to some extent. C+/-: Extent of positive/negative impact is unknown. (A further examination is needed, and the impact could be clarified as the study progresses) D: No impact is expected.
Source: JICA study team
Affected peoples by the ERP project is shown in Table9-7-12. 表9.7-1 Affected Peoples by the ERP Project
No. Category Effect 1 Low income car
users Shift to public transportation
●Spending increase of public transportation fare There is a possibility to reduce economic burden due to saving gas money of car. ●Transportation time increase
Shift to motorcycle ●Purchase of motorcycle
-57-
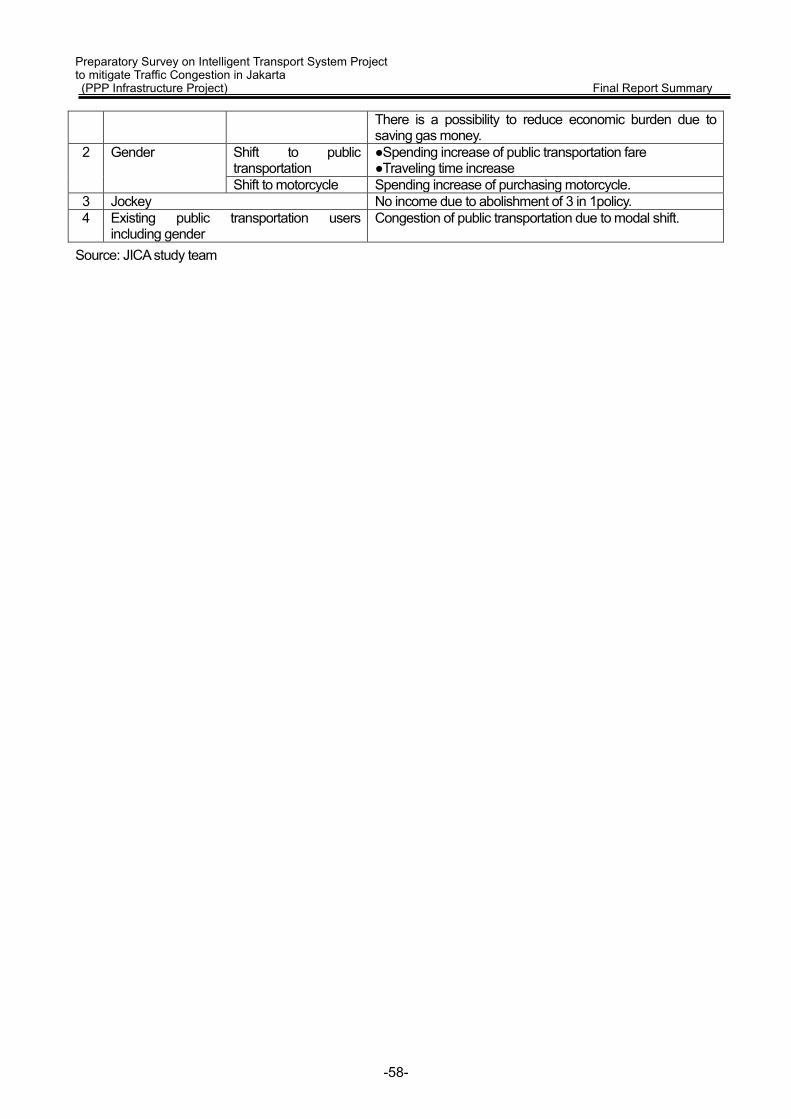
Preparatory Survey on Intelligent Transport System Project to mitigate Traffic Congestion in Jakarta (PPP Infrastructure Project) Final Report Summary
There is a possibility to reduce economic burden due to saving gas money.
2 Gender Shift to public transportation
●Spending increase of public transportation fare ●Traveling time increase
Shift to motorcycle Spending increase of purchasing motorcycle. 3 Jockey No income due to abolishment of 3 in 1policy. 4 Existing public transportation users
including gender Congestion of public transportation due to modal shift.
Source: JICA study team
-58-
Preparatory Survey on Intelligent Transport System Project to mitigate Traffic Congestion in Jakarta (PPP Infrastructure Project) Draft Final Report Preface
Preface Background and Aim of the Study Pre.1. Study Background (1) Challenges and Achievements (as of today) of Urban Transport Sector in
Republic of Indonesia The population of Jakarta metropolitan area (hereafter JABODETABEK area) in Republic of Indonesia
has extended to approximately 1.6-fold in the last 20 years that is to say the growth was approximately
28 million people in 2010 from about 17 million in 1990. JABODETABEK area is a economoic growth
center, in which population accounts for about 10% of the entire Indonesia, the size of the economy
reaches about 30% of GDP and 40% of foreign investment has been concentrated.
With the economic growth and population growth, vehicle registration number in JABODETABEK area
has soared to almost 5 times to about 14 million units in 2012 from about 3 million units in 2000. On the
other hand, since road infrastructure is not keeping up with the rappid increase of the number of vehicle,
there is serious traffic congestion in JABODETABEK area, and it has caused major economic loss. In
particular, congestion of morning and evening commuting hours is occurring regularly in the 13 km
section, which is located in the heart of JABODETABEK area, between Block-M as a business and
resdidential area in the southern Jakarta, and Kota as an business destrict and old town in the northern
half. In order to improve the above-mentioned situation, the Provicnial Government of DKI Jakarta
(hereafter refered as DKI Jakarta Gov.) has introduced a Bus Rapid Transport system (hereafter refered
as BRT or Transjakarta). In addition, the Government of DKI Jakarta introduced a policy so-called as “3
in 1” regulation, which is vehicle less than 3 passengers per car are not allowed to pass in the certain
road in morning and evening rush hour in order to suppress the flow of vehicles to the city. However,
there are people called “Jockey” on the street who are available when the the number of passenger is
less than 3 that will help to avoid the restrciton of “3 in 1” regulation. Therefore, the effect of the
regulation is remained to be limited, and further measures for the traffic congestion in necessary.
(2) Positioning of this Project and Development Policy of Urban Transport Sector in Republic of Indonesia
According to DKI Jakarta ordinance (Regional Regulation No.12/2002and Governor Regulation
No.103/2007), aiming toward the easing of road traffic congestion in Jakarta metropolitan area,
implementation of Electronic Road Pricing (ERP) policy utiliing Intelligent Transport Systems (ITS) is
planned as an alternative to “3 in 1”regulation, in addition to such policy implementation as the
development of mass transit system including the construction of the subway, the strengthening of traffic
regulations and the expansion of the road network. By implementing the ERP, the inflow restriction of the
vehicle into the city is expected to be strengthened. Furthermore, by encouraging simultaneous shift to
public transport such as a BRT or subway which is now being constructed, further effcte of easing traffic
congestion can be expected. The ITS project including introdction of ERP system to be introduced in the
-1-

Preparatory Survey on Intelligent Transport System Project to mitigate Traffic Congestion in Jakarta (PPP Infrastructure Project) Draft Final Report Preface
seriously congested roads for restriction of inflow traffic into the city along the above-menthioned
ordinance and easing traffic congestion, was positioned as the prioritized project which is to be
completed by 2020 under the agreement between Japan Government and Indonesian Government in
MPA in December in 2010.。
(3) Aid Policy of Japan and JICA for Urban Transport Sector In the JICA country analysis paper for Republic of Indonesia, it is analyzed that support of strengthening
of transportation through public-private partnership, and major metropolitan transportation development
with a focus on the JABODETABEK area is a prioritized issue. Moreover, support for further economic
growth as a prioritized support field and support for improvement of business and investment
environment through infrastructure development around JABODETABEK area are specified in the aid
policy for Republic of Indonesia published in April in 2012.
Pre.2. Purpose of the Study The purpose of this study is to conduct feasibility study on implementation of the investment to be done
by Japanese enterprises in the field of ITS and ERP, which can be considered one of the efficient
measures to ease traffic congestion in DKI Jakarta and formulate the proper business plan based on the
public-private-partnership including application of the JICA PSIF financial scheme.
Pre.3. Outline of the Project
(1) Study Target
Study target area is “JABODETABEK area” in Republic of Indonesia. Target area for project
implementation is DKI (Daerah Khusus Ibukota) Jakarta. Furthermore, ERP introductory target routes
are Corridor 1 (between Blok M and Kota), and Corridor 6 (between Ragunan and Bundaran HI).
Figure Pre.-1 Study target area
-2-
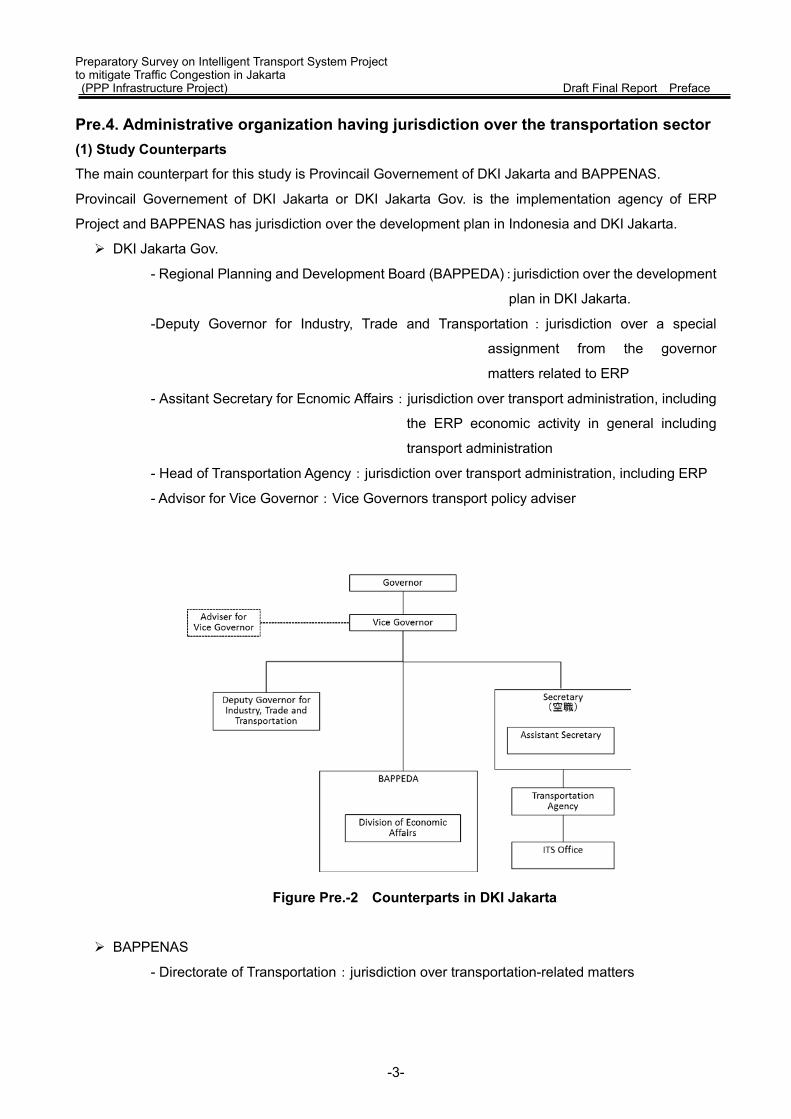
Preparatory Survey on Intelligent Transport System Project to mitigate Traffic Congestion in Jakarta (PPP Infrastructure Project) Draft Final Report Preface
Pre.4. Administrative organization having jurisdiction over the transportation sector (1) Study Counterparts
The main counterpart for this study is Provincail Governement of DKI Jakarta and BAPPENAS.
Provincail Governement of DKI Jakarta or DKI Jakarta Gov. is the implementation agency of ERP
Project and BAPPENAS has jurisdiction over the development plan in Indonesia and DKI Jakarta.
DKI Jakarta Gov.
- Regional Planning and Development Board (BAPPEDA):jurisdiction over the development
plan in DKI Jakarta.
-Deputy Governor for Industry, Trade and Transportation: jurisdiction over a special
assignment from the governor
matters related to ERP
- Assitant Secretary for Ecnomic Affairs:jurisdiction over transport administration, including
the ERP economic activity in general including
transport administration
- Head of Transportation Agency:jurisdiction over transport administration, including ERP
- Advisor for Vice Governor:Vice Governors transport policy adviser
Figure Pre.-2 Counterparts in DKI Jakarta
BAPPENAS
- Directorate of Transportation:jurisdiction over transportation-related matters
-3-
Preparatory Survey on Intelligent Transport System Project to mitigate Traffic Congestion in Jakarta (PPP Infrastructure Project) Draft Final Report Preface
In addition to the above-mentioned main counterparts, the following organizations are collaborating as
supporting organizations in the study.
Ministry of Transport:jurisdiction over transportation related institutions and policies
-Directorate of Urban Transportation System Development, Directorate General of Land
Transportation:jurisdiction over transportation related policies
- Research and Development Agency:jurisdiction over transportation related laboratories
BAPPENAS
- Directorate of Public Private Partnership Development:jurisdiction over
Public-Private-Partnership in Indonesia
Ministry of Finance
- Directorate of Local Taxes and Regional Retribution:jurisdiction over charging business by
local government
Pre.5. Flowchart of the Study Flowchart of the study is shown as below.
-4-
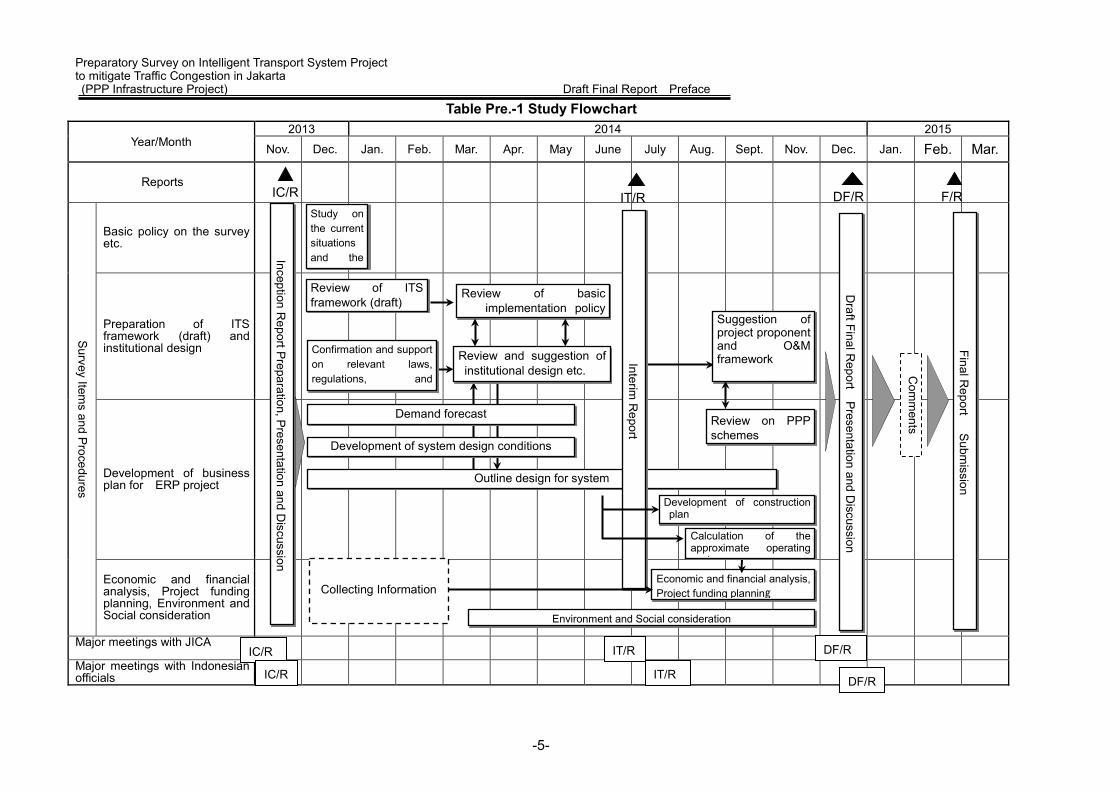
Preparatory Survey on Intelligent Transport System Project to mitigate Traffic Congestion in Jakarta (PPP Infrastructure Project) Draft Final Report Preface
Table Pre.-1 Study Flowchart
Year/Month 2013 2014 2015
Nov. Dec. Jan. Feb. Mar. Apr. May June July Aug. Sept. Nov. Dec. Jan. Feb. Mar.
Reports
Survey Item
s and Procedures
Basic policy on the survey etc.
Preparation of ITS framework (draft) and institutional design
Development of business plan for ERP project
Economic and financial analysis, Project funding planning, Environment and Social consideration
Major meetings with JICA
Major meetings with Indonesian officials
Review of basic implementation policy
Inception Report P
reparation, Presentation and D
iscussion
Study on the current situations and the
Suggestion of project proponent and O&M framework
Outline design for system
Review on PPP schemes
Final Report
S
ubmission
Collecting Information
Interim R
eport
Economic and financial analysis, Project funding planning
Environment and Social consideration
Confirmation and support on relevant laws, regulations, and
Demand forecast
Development of system design conditions
DF/R IC/R IT/R F/R
IC/R IT/R DF/R
DF/R IT/R IC/R
Review of ITS framework (draft)
Development of construction plan
Calculation of the approximate operating
t
Draft Final R
eport P
resentation and Discussion
Com
ments
Review and suggestion of institutional design etc.
-5-
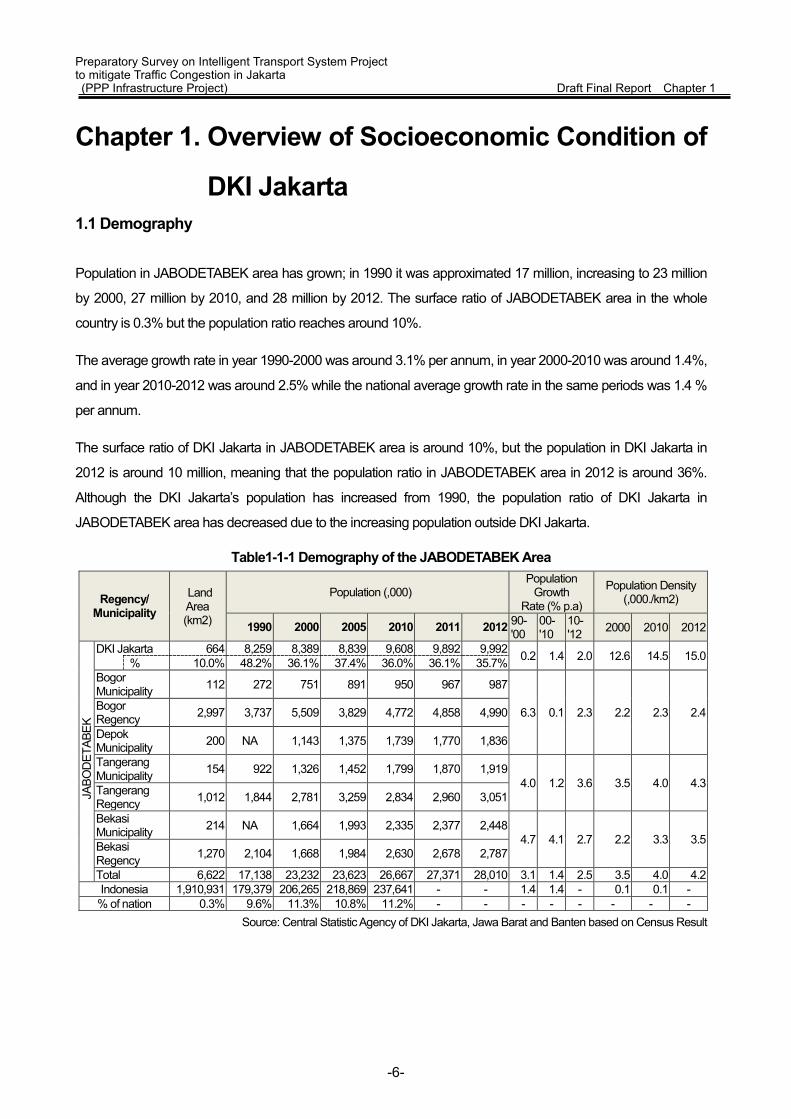
Preparatory Survey on Intelligent Transport System Project to mitigate Traffic Congestion in Jakarta (PPP Infrastructure Project) Draft Final Report Chapter 1
Chapter 1. Overview of Socioeconomic Condition of
DKI Jakarta 1.1 Demography
Population in JABODETABEK area has grown; in 1990 it was approximated 17 million, increasing to 23 million
by 2000, 27 million by 2010, and 28 million by 2012. The surface ratio of JABODETABEK area in the whole
country is 0.3% but the population ratio reaches around 10%.
The average growth rate in year 1990-2000 was around 3.1% per annum, in year 2000-2010 was around 1.4%,
and in year 2010-2012 was around 2.5% while the national average growth rate in the same periods was 1.4 %
per annum.
The surface ratio of DKI Jakarta in JABODETABEK area is around 10%, but the population in DKI Jakarta in
2012 is around 10 million, meaning that the population ratio in JABODETABEK area in 2012 is around 36%.
Although the DKI Jakarta’s population has increased from 1990, the population ratio of DKI Jakarta in
JABODETABEK area has decreased due to the increasing population outside DKI Jakarta.
Table1-1-1 Demography of the JABODETABEK Area
Regency/ Municipality
Land Area (km2)
Population (,000) Population
Growth Rate (% p.a)
Population Density (,000./km2)
1990 2000 2005 2010 2011 2012 90- '00
00- '10
10- '12 2000 2010 2012
JAB
OD
ETAB
EK
DKI Jakarta 664 8,259 8,389 8,839 9,608 9,892 9,992 0.2 1.4 2.0 12.6 14.5 15.0 % 10.0% 48.2% 36.1% 37.4% 36.0% 36.1% 35.7% Bogor Municipality 112 272 751 891 950 967 987
6.3 0.1 2.3 2.2 2.3 2.4 Bogor Regency 2,997 3,737 5,509 3,829 4,772 4,858 4,990
Depok Municipality 200 NA 1,143 1,375 1,739 1,770 1,836
Tangerang Municipality 154 922 1,326 1,452 1,799 1,870 1,919
4.0 1.2 3.6 3.5 4.0 4.3 Tangerang Regency 1,012 1,844 2,781 3,259 2,834 2,960 3,051
Bekasi Municipality 214 NA 1,664 1,993 2,335 2,377 2,448
4.7 4.1 2.7 2.2 3.3 3.5 Bekasi Regency 1,270 2,104 1,668 1,984 2,630 2,678 2,787
Total 6,622 17,138 23,232 23,623 26,667 27,371 28,010 3.1 1.4 2.5 3.5 4.0 4.2 Indonesia 1,910,931 179,379 206,265 218,869 237,641 - - 1.4 1.4 - 0.1 0.1 -
% of nation 0.3% 9.6% 11.3% 10.8% 11.2% - - - - - - - - Source: Central Statistic Agency of DKI Jakarta, Jawa Barat and Banten based on Census Result
-6-
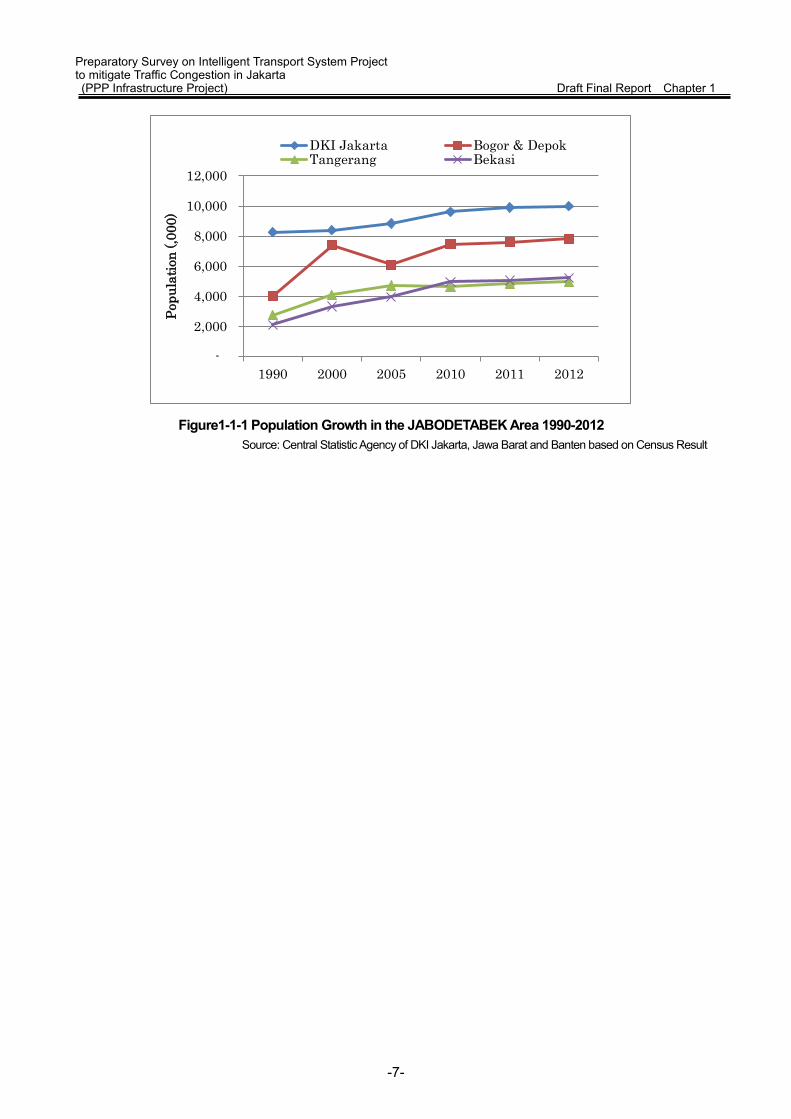
Preparatory Survey on Intelligent Transport System Project to mitigate Traffic Congestion in Jakarta (PPP Infrastructure Project) Draft Final Report Chapter 1
Figure1-1-1 Population Growth in the JABODETABEK Area 1990-2012 Source: Central Statistic Agency of DKI Jakarta, Jawa Barat and Banten based on Census Result
-
2,000
4,000
6,000
8,000
10,000
12,000
1990 2000 2005 2010 2011 2012
Popu
latio
n (,0
00)
DKI Jakarta Bogor & DepokTangerang Bekasi
-7-

Preparatory Survey on Intelligent Transport System Project to mitigate Traffic Congestion in Jakarta (PPP Infrastructure Project) Draft Final Report Chapter 1 1.2 Economy 1.2.1 GRDP (Gross Regional Domestic Product) The GRDP in year 2000 constant price of JABODETABEK area is shown as below. The GRDP in
JABODETABEK area has doubled from 335 trillion Rupiah in 2001 to 633 trillion Rupiah in 2012. The growth
rate is around 6%.
The GRDP in year 2000 constant price of DKI Jakarta has doubled as well. The ratio of DKI Jakarta in total
JABODETABEK is around 70% and the growth rate in DKI Jakarta is almost the same as JABODETABEK.
Table1-2-1 GRDP of the JABODETABEK Area
YEAR GRDP at 2000 constant price (Trillions of Rupiah) Growth Rate (% p.a) 2001 2005 2010 2011 2012 01-05 05-10 10-12
DKI Jakarta 239 295 396 422 450 5.5% 6.0% 6.6% % 71.1% 70.6% 70.9% 71.0% 71.0% Bogor Municipality 3 4 5 5 5
7.0% 5.6% 6.1% Bogor Regency 19 25 33 34 37 Depok Municipality 4 5 7 7 7 Tangerang Municipality 17 22 29 31 33 5.5% 6.8% 6.6% Tangerang Regency 13 15 18 20 21 Bekasi Municipality 10 12 15 17 18 6.2% 5.8% 6.4% Bekasi Regency 32 41 55 58 62 Total JABODETABEK 335 418 558 595 633 5.7% 5.9% 6.6%
Source: Central Statistic Agency (BPS) of DKI Jakarta, Central Statistic Agency (BPS) of Banten, Central Statistic Agency (BPS) of Jawa Barat
Figure1-2-1 GRDP at 2000 constant price of the JABODETABEK Area Source: Central Statistic Agency (BPS) of DKI Jakarta, Central Statistic Agency (BPS) of Banten, Central Statistic Agency (BPS) of
Jawa Barat
0
100
200
300
400
500
600
700
2001 2005 2010 2011 2012
(Tril
lions
of R
upia
h)
DKI Jakarta
Total JABODETABEK
-8-
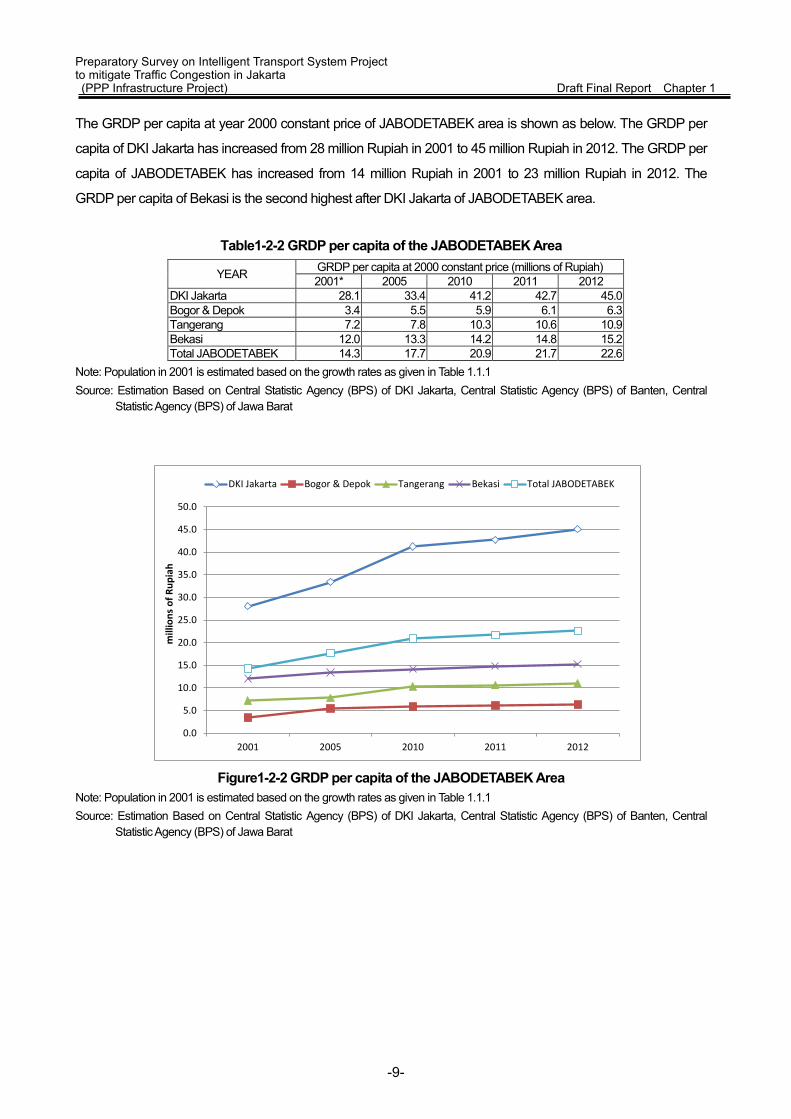
Preparatory Survey on Intelligent Transport System Project to mitigate Traffic Congestion in Jakarta (PPP Infrastructure Project) Draft Final Report Chapter 1 The GRDP per capita at year 2000 constant price of JABODETABEK area is shown as below. The GRDP per
capita of DKI Jakarta has increased from 28 million Rupiah in 2001 to 45 million Rupiah in 2012. The GRDP per
capita of JABODETABEK has increased from 14 million Rupiah in 2001 to 23 million Rupiah in 2012. The
GRDP per capita of Bekasi is the second highest after DKI Jakarta of JABODETABEK area.
Table1-2-2 GRDP per capita of the JABODETABEK Area
YEAR GRDP per capita at 2000 constant price (millions of Rupiah) 2001* 2005 2010 2011 2012
DKI Jakarta 28.1 33.4 41.2 42.7 45.0 Bogor & Depok 3.4 5.5 5.9 6.1 6.3 Tangerang 7.2 7.8 10.3 10.6 10.9 Bekasi 12.0 13.3 14.2 14.8 15.2 Total JABODETABEK 14.3 17.7 20.9 21.7 22.6
Note: Population in 2001 is estimated based on the growth rates as given in Table 1.1.1 Source: Estimation Based on Central Statistic Agency (BPS) of DKI Jakarta, Central Statistic Agency (BPS) of Banten, Central
Statistic Agency (BPS) of Jawa Barat
Figure1-2-2 GRDP per capita of the JABODETABEK Area
Note: Population in 2001 is estimated based on the growth rates as given in Table 1.1.1 Source: Estimation Based on Central Statistic Agency (BPS) of DKI Jakarta, Central Statistic Agency (BPS) of Banten, Central
Statistic Agency (BPS) of Jawa Barat
0.0
5.0
10.0
15.0
20.0
25.0
30.0
35.0
40.0
45.0
50.0
2001 2005 2010 2011 2012
mill
ions
of R
upia
h
DKI Jakarta Bogor & Depok Tangerang Bekasi Total JABODETABEK
-9-
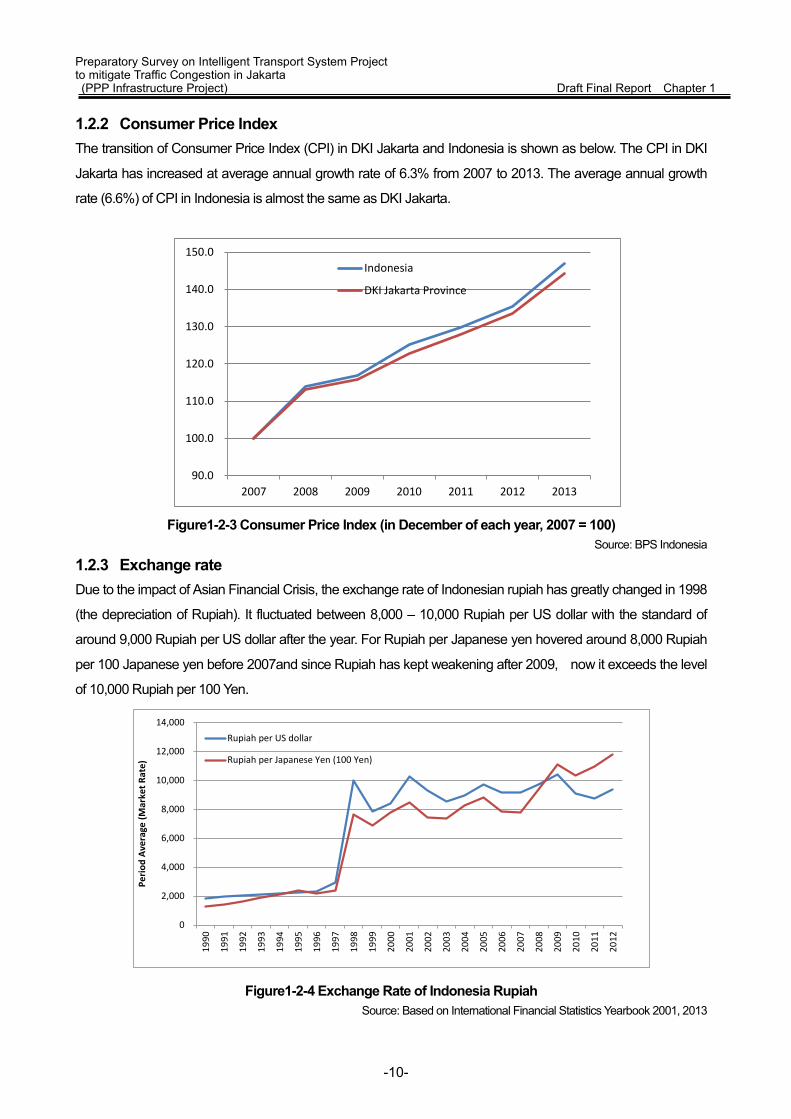
Preparatory Survey on Intelligent Transport System Project to mitigate Traffic Congestion in Jakarta (PPP Infrastructure Project) Draft Final Report Chapter 1 1.2.2 Consumer Price Index The transition of Consumer Price Index (CPI) in DKI Jakarta and Indonesia is shown as below. The CPI in DKI
Jakarta has increased at average annual growth rate of 6.3% from 2007 to 2013. The average annual growth
rate (6.6%) of CPI in Indonesia is almost the same as DKI Jakarta.
Figure1-2-3 Consumer Price Index (in December of each year, 2007 = 100)
Source: BPS Indonesia
1.2.3 Exchange rate Due to the impact of Asian Financial Crisis, the exchange rate of Indonesian rupiah has greatly changed in 1998
(the depreciation of Rupiah). It fluctuated between 8,000 – 10,000 Rupiah per US dollar with the standard of
around 9,000 Rupiah per US dollar after the year. For Rupiah per Japanese yen hovered around 8,000 Rupiah
per 100 Japanese yen before 2007and since Rupiah has kept weakening after 2009, now it exceeds the level
of 10,000 Rupiah per 100 Yen.
Figure1-2-4 Exchange Rate of Indonesia Rupiah Source: Based on International Financial Statistics Yearbook 2001, 2013
90.0
100.0
110.0
120.0
130.0
140.0
150.0
2007 2008 2009 2010 2011 2012 2013
Indonesia
DKI Jakarta Province
0
2,000
4,000
6,000
8,000
10,000
12,000
14,000
1990
1991
1992
1993
1994
1995
1996
1997
1998
1999
2000
2001
2002
2003
2004
2005
2006
2007
2008
2009
2010
2011
2012
Perio
d Av
erag
e (M
arke
t Rat
e)
Rupiah per US dollar
Rupiah per Japanese Yen (100 Yen)
-10-
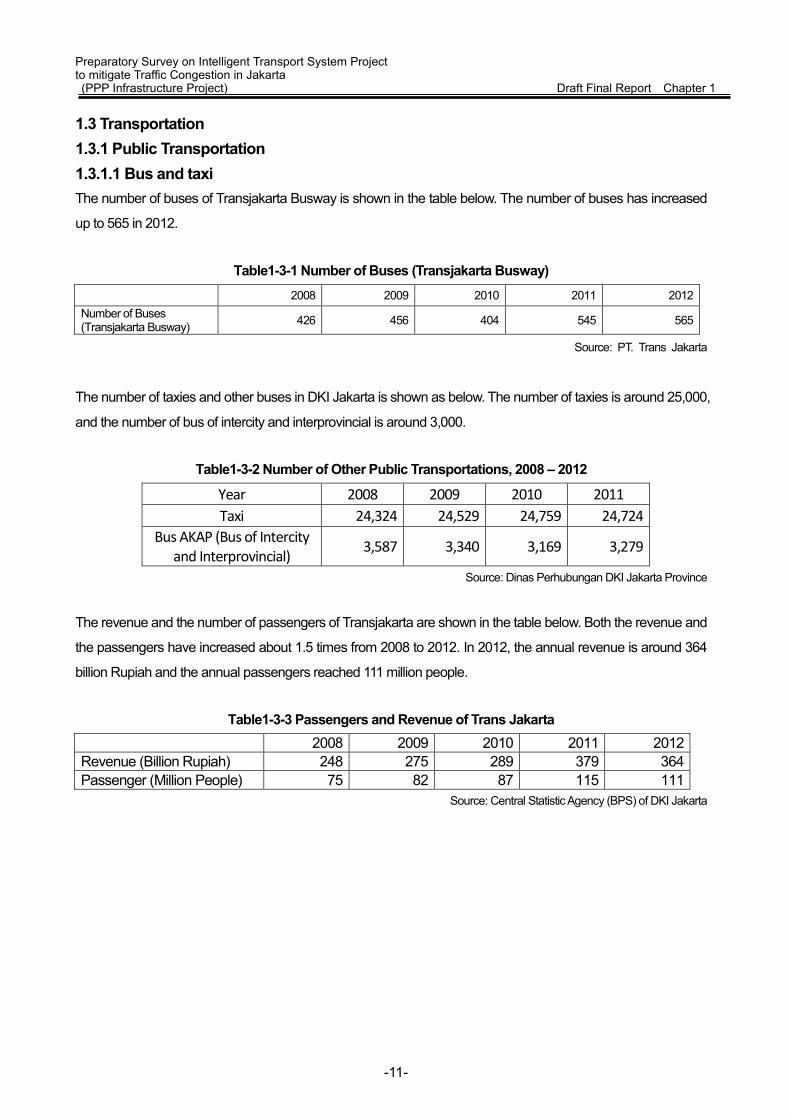
Preparatory Survey on Intelligent Transport System Project to mitigate Traffic Congestion in Jakarta (PPP Infrastructure Project) Draft Final Report Chapter 1 1.3 Transportation 1.3.1 Public Transportation 1.3.1.1 Bus and taxi The number of buses of Transjakarta Busway is shown in the table below. The number of buses has increased
up to 565 in 2012.
Table1-3-1 Number of Buses (Transjakarta Busway)
2008 2009 2010 2011 2012 Number of Buses (Transjakarta Busway) 426 456 404 545 565
Source: PT. Trans Jakarta
The number of taxies and other buses in DKI Jakarta is shown as below. The number of taxies is around 25,000,
and the number of bus of intercity and interprovincial is around 3,000.
Table1-3-2 Number of Other Public Transportations, 2008 – 2012
Year 2008 2009 2010 2011 Taxi 24,324 24,529 24,759 24,724
Bus AKAP (Bus of Intercity and Interprovincial) 3,587 3,340 3,169 3,279
Source: Dinas Perhubungan DKI Jakarta Province
The revenue and the number of passengers of Transjakarta are shown in the table below. Both the revenue and
the passengers have increased about 1.5 times from 2008 to 2012. In 2012, the annual revenue is around 364
billion Rupiah and the annual passengers reached 111 million people.
Table1-3-3 Passengers and Revenue of Trans Jakarta
2008 2009 2010 2011 2012 Revenue (Billion Rupiah) 248 275 289 379 364 Passenger (Million People) 75 82 87 115 111
Source: Central Statistic Agency (BPS) of DKI Jakarta
-11-
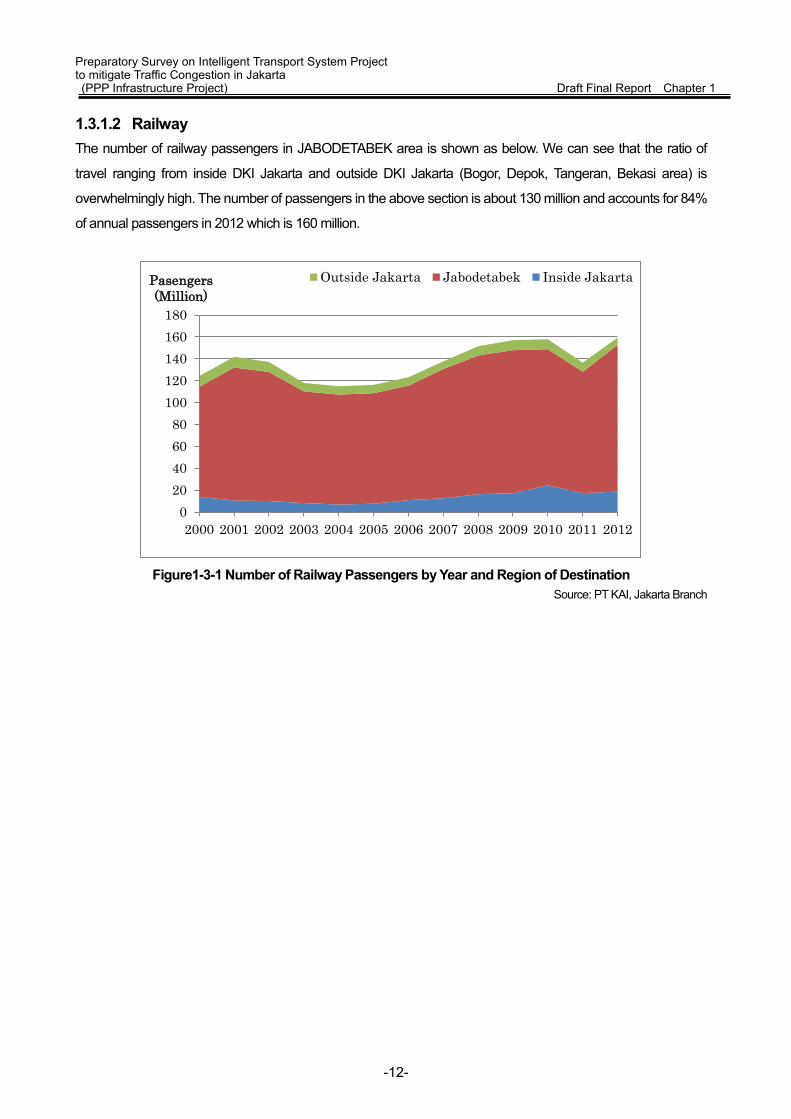
Preparatory Survey on Intelligent Transport System Project to mitigate Traffic Congestion in Jakarta (PPP Infrastructure Project) Draft Final Report Chapter 1 1.3.1.2 Railway The number of railway passengers in JABODETABEK area is shown as below. We can see that the ratio of
travel ranging from inside DKI Jakarta and outside DKI Jakarta (Bogor, Depok, Tangeran, Bekasi area) is
overwhelmingly high. The number of passengers in the above section is about 130 million and accounts for 84%
of annual passengers in 2012 which is 160 million.
Figure1-3-1 Number of Railway Passengers by Year and Region of Destination
Source: PT KAI, Jakarta Branch
020406080
100120140160180
2000 2001 2002 2003 2004 2005 2006 2007 2008 2009 2010 2011 2012
Pasengers (Million)
Outside Jakarta Jabodetabek Inside Jakarta
-12-

Preparatory Survey on Intelligent Transport System Project to mitigate Traffic Congestion in Jakarta (PPP Infrastructure Project) Draft Final Report Chapter 1 1.3.2 Number of Registered Motor Vehicles The number of registered motor vehicles in DKI Jakarta is shown as below. The total number has increased 5
times from 3 million in 2000 to 14 million in 2012. The growth of motor cycles is prominent and the number of
motor cycles has increased from 1.6 million in 2000 to 10.8 million in 2012. The average annual growth rate is
around 17.2%. However, the average annual growth rate tends to decrease from around 23.5% of year
2000-2005, to 13.5% of year 2005-2010 to 11.1% of year 2010 -2012.
The number of registered motor vehicles in DKI Jakarta has increased 2.6 times from1.05 million in 2000 to 2.74
million in 2012. The average annual growth rate is 8.3%.
Figure1-3-2 Number of Registered Motor Vehicles by Kind of Type Motor Vehicles in DKI Jakarta
Note: Excluding Army, Police and CD Source: Ditlantas Polda Metro Jaya
0
2,000
4,000
6,000
8,000
10,000
12,000
14,000
16,000
2000 2001 2002 2003 2004 2005 2006 2007 2008 2009 2010 2011 2012
,000Others (Bus and Truck etc) Motor Cycles Passenger Cars
-13-

Preparatory Survey on Intelligent Transport System Project to mitigate Traffic Congestion in Jakarta (PPP Infrastructure Project) Draft Final Report Chapter 1 1.3.3 Current Status of Road Development The paved road length and area of 2012 in DKI Jakarta is shown as below. The total road length is 6,955.8km
and the total road area is 48.5km2 in 2012. The road area is nearly equivalent to 7.3% of the total area of DKI
Jakarta. The growth rate of the paved road length is 0.01% per year which indicates slow pace for improvement.
The DKI Jakarta’s road length per population (,000) is 0.7km and the area per population (,000) is 0.005km2. In
comparison with the data of Tokyo as of the end of 2012, the level is less than half those of Tokyo. The DKI
Jakarta’s road length per number of vehicle (excluding motor cycle) (,000) is 1.8km and the area per number of
vehicle (excluding motor cycle) (,000) is 0.013km2. As compared to the data of Tokyo as of the end of 2012, the
level is equivalent to one-quarter of those of Tokyo and the paved road length does not reach an adequate level.
Table1-3-4 Length, Area and Status by Kind of Roads, 2012
Type of Roads Length (km) Area (km2) 1.Toll 123.7 3.00
2.National 2-1. Primary Arterial 128.9 2.48 2-2. Primary Collector 23.7 0.27
3. Province 3-1. Secondary Arterial 535.3 8.80
3-2. Secondary Collector 1,027.0 7.33
4. Municipality 5,117.3 26.63 Total 6,955.8 48.50 per population (,000) 0.7 0.005
Ref. Tokyo (2013.3) 1.8 0.014
per number of vehicle (,000) (excld motor cycle)
1.8 0.013 Ref. Tokyo (2013.3) 6.2 0.047
Source: Created based on the data of Sub Dinas Bina Program, Dinas Pekerjaan Umum Provinsi DKI Jakarta, MLIT(Japan) and Tokyo Metropolitan Government
-14-
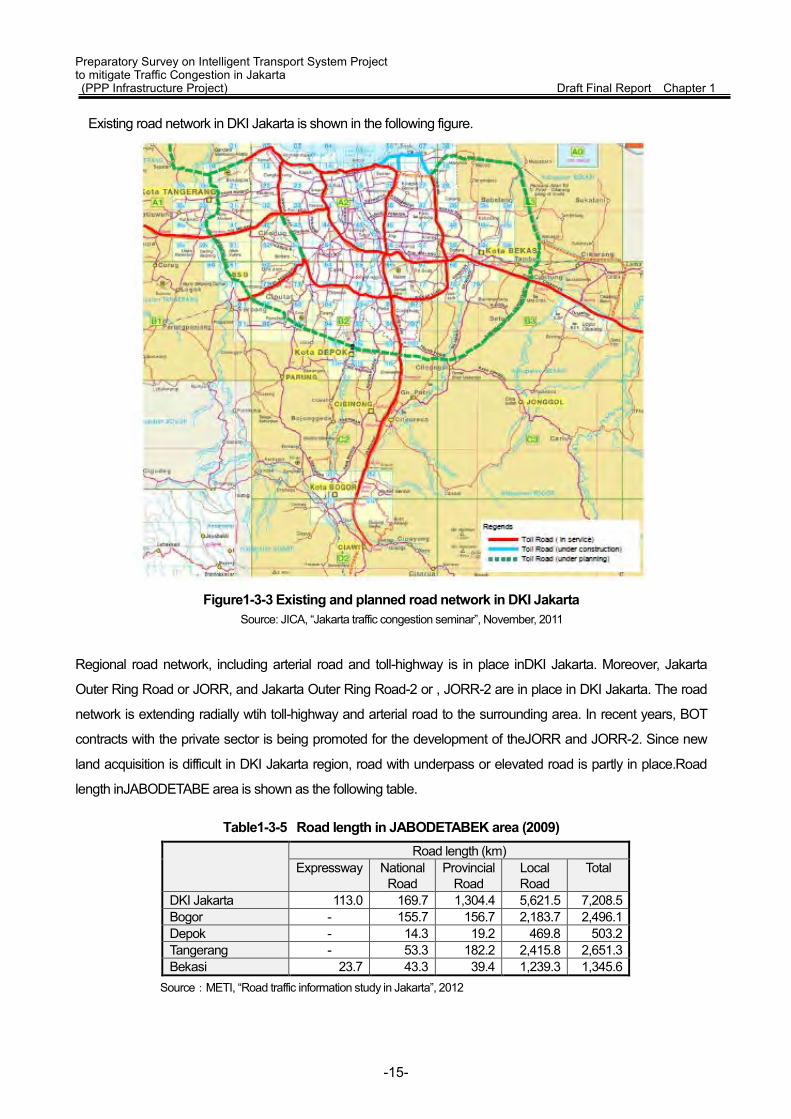
Preparatory Survey on Intelligent Transport System Project to mitigate Traffic Congestion in Jakarta (PPP Infrastructure Project) Draft Final Report Chapter 1
Existing road network in DKI Jakarta is shown in the following figure.
Figure1-3-3 Existing and planned road network in DKI Jakarta
Source: JICA, “Jakarta traffic congestion seminar”, November, 2011
Regional road network, including arterial road and toll-highway is in place inDKI Jakarta. Moreover, Jakarta
Outer Ring Road or JORR, and Jakarta Outer Ring Road-2 or , JORR-2 are in place in DKI Jakarta. The road
network is extending radially wtih toll-highway and arterial road to the surrounding area. In recent years, BOT
contracts with the private sector is being promoted for the development of theJORR and JORR-2. Since new
land acquisition is difficult in DKI Jakarta region, road with underpass or elevated road is partly in place.Road
length inJABODETABE area is shown as the following table.
Table1-3-5 Road length in JABODETABEK area (2009) Road length (km)
Expressway National Road
Provincial Road
Local Road
Total
DKI Jakarta 113.0 169.7 1,304.4 5,621.5 7,208.5 Bogor - 155.7 156.7 2,183.7 2,496.1 Depok - 14.3 19.2 469.8 503.2 Tangerang - 53.3 182.2 2,415.8 2,651.3 Bekasi 23.7 43.3 39.4 1,239.3 1,345.6
Source:METI, “Road traffic information study in Jakarta”, 2012
-15-

Preparatory Survey on Intelligent Transport System Project to mitigate Traffic Congestion in Jakarta (PPP Infrastructure Project) Draft Final Report Chapter 1 1.3.5 Present Status of Road Traffic Traffic demand is exceeding the supply of transportation services in the DKI Jakarta and since the public
transportion is still under development, car dependency ratio is very high. As it can be seen in the folowing table,
the ratio of private passenger vehicles in DKI Jakarta has risenup to 96.5%. We can say that road traffic
congestion is chronic and extremely serious issue in the main road ofDKI Jakarta.
Table1-3-6 Traffic demand and modal share in DKI Jakarta (2012)
Item Contents
Number of trips 25.7 million tripns per day
Modal share Private passenger car :96.5%, Public transport (Buses and Jabodetabek railway) : 3.5%
Source: DISHUB
The following figure shows a comparison of the road area of DKI Jakarta and the road area occupied by the car.
Rate of growth in car ownership exceeds the speed of the road development. As a result, road area occupied by
the car may surpass the area of constructed road in 2014, the typical phenomenon namely “Gridlock”
Figure1-3-4 A comparison of the road area of DKI Jakarta and the road area occupied by the car Source:DISHUB
As seen in the figure, the car usage ratio is extremely high in DKI Jakarta. Accodingly, the automobile traffic
demand is higher than the road capacity. As a result, road traffic congestion has steadily intensified. In order to
drastically improve the road traffic congestion in DKI Jakarta, implementation of the following two measures are
an urgent issue, namely 1) the proper management of automobile traffic demand, and 2) reduction of car
utilization rate based on improvement of public transport services.
-16-
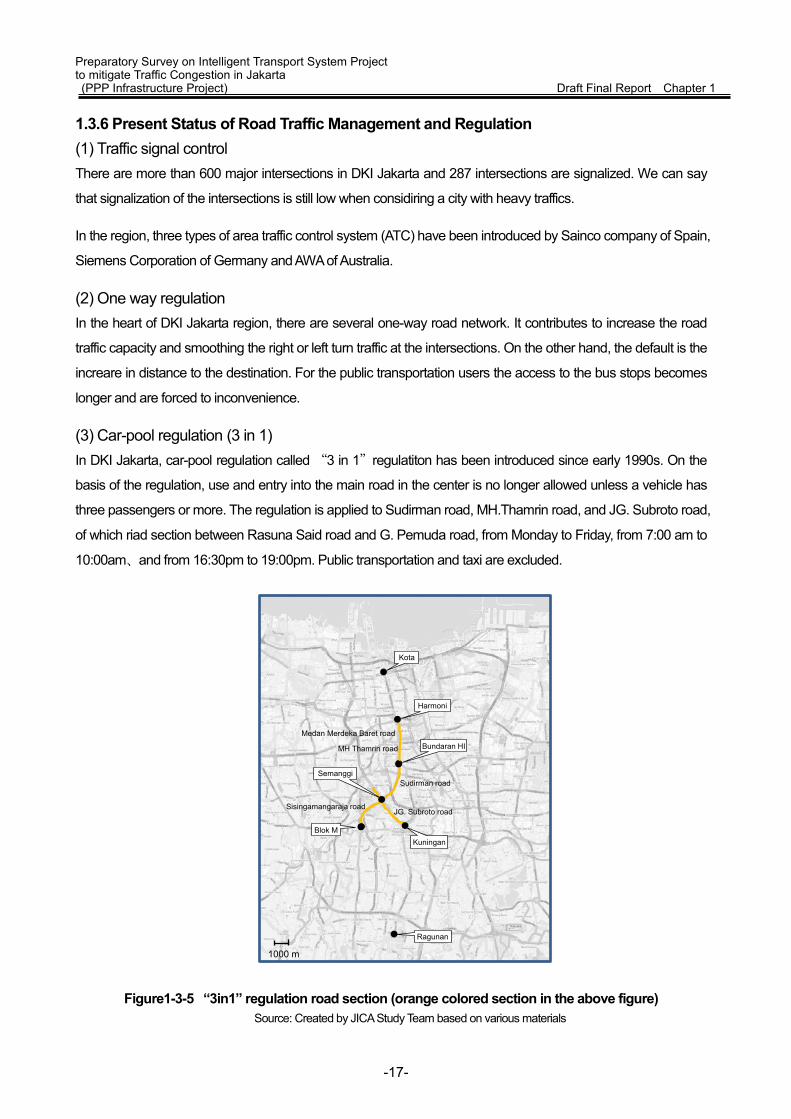
Preparatory Survey on Intelligent Transport System Project to mitigate Traffic Congestion in Jakarta (PPP Infrastructure Project) Draft Final Report Chapter 1 1.3.6 Present Status of Road Traffic Management and Regulation (1) Traffic signal control There are more than 600 major intersections in DKI Jakarta and 287 intersections are signalized. We can say
that signalization of the intersections is still low when considiring a city with heavy traffics.
In the region, three types of area traffic control system (ATC) have been introduced by Sainco company of Spain,
Siemens Corporation of Germany and AWA of Australia.
(2) One way regulation In the heart of DKI Jakarta region, there are several one-way road network. It contributes to increase the road
traffic capacity and smoothing the right or left turn traffic at the intersections. On the other hand, the default is the
increare in distance to the destination. For the public transportation users the access to the bus stops becomes
longer and are forced to inconvenience.
(3) Car-pool regulation (3 in 1) In DKI Jakarta, car-pool regulation called “3 in 1”regulatiton has been introduced since early 1990s. On the
basis of the regulation, use and entry into the main road in the center is no longer allowed unless a vehicle has
three passengers or more. The regulation is applied to Sudirman road, MH.Thamrin road, and JG. Subroto road,
of which riad section between Rasuna Said road and G. Pemuda road, from Monday to Friday, from 7:00 am to
10:00am、and from 16:30pm to 19:00pm. Public transportation and taxi are excluded.
Figure1-3-5 “3in1” regulation road section (orange colored section in the above figure) Source: Created by JICA Study Team based on various materials
1000 m
Sudirman road
MH Thamrin road
Semanggi
KuninganBlok M
Bundaran HI
Harmoni
Kota
JG. Subroto road
Ragunan
Sisingamangaraja road
Medan Merdeka Baret road
-17-

Preparatory Survey on Intelligent Transport System Project to mitigate Traffic Congestion in Jakarta (PPP Infrastructure Project) Draft Final Report Chapter 1 (4) Trucks regulation
There are several kinds of regulations for trucks as follows:
1) Heavy trucks which weighs 5.5 tons or more are not allowed to enter into Sudirman road and Thamrin road.
2)Trucks which weighs less than 5.5 tons and buses and motorcycles are allowed to use only leftmost lane in
Sisingamangaraja road, Sudirman road and Thamrin road.
3)Trucks in general are allowed to use first lane or second lane from the left on Medan Merdeka Baret road,
Majapahit road, GajahMada road, Hayam Wuruk road, Pintu Besar Selatan road and Pintu Besar Utara
road.
Figure1-3-6 Trucks regulation road sections Source: Created by JICA Study Team based on various materials
1000 mRagunan
Sudirman road
Medan Merdeka Baret road
MH Thamrin road
Semanggi
Kuningan
Blok M
Bundaran HI
Harmoni
Kota
Sisingamangaraja road
Majapahit road
GajahMada road(Hayam Wuruk road)
Pintu Besar Selatan roadPintu Besar Utara road
1)
2)
3)
-18-
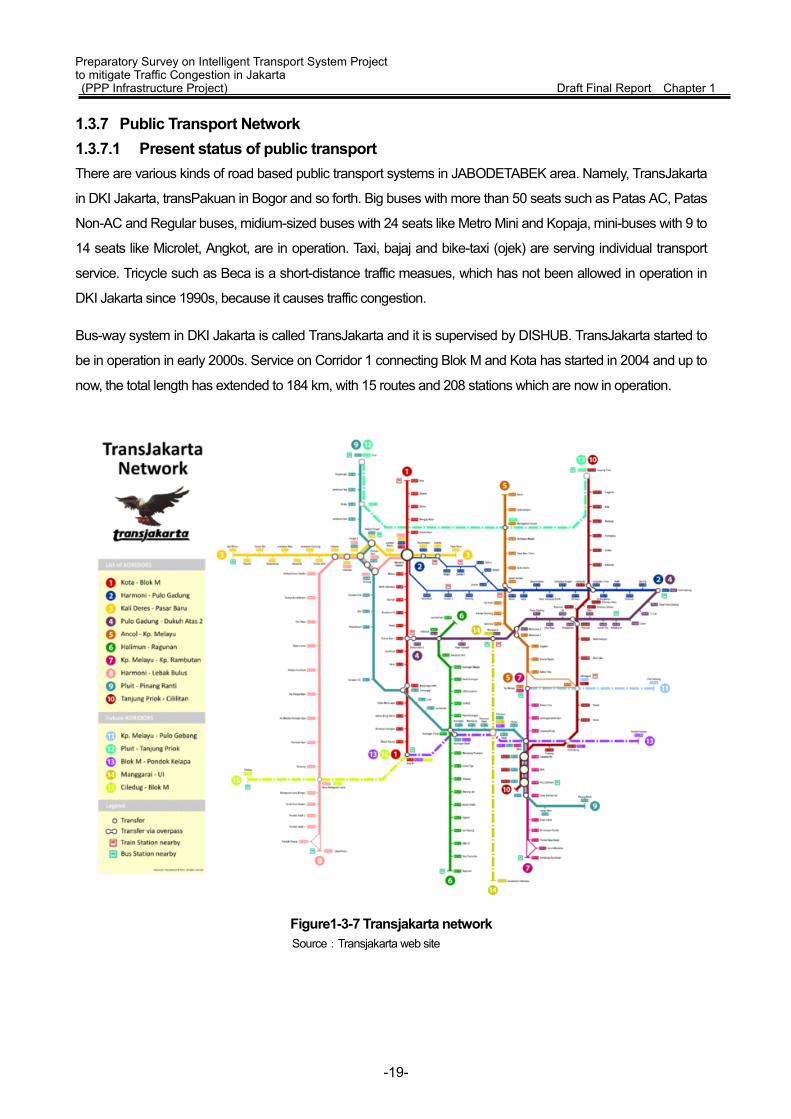
Preparatory Survey on Intelligent Transport System Project to mitigate Traffic Congestion in Jakarta (PPP Infrastructure Project) Draft Final Report Chapter 1 1.3.7 Public Transport Network 1.3.7.1 Present status of public transport There are various kinds of road based public transport systems in JABODETABEK area. Namely, TransJakarta
in DKI Jakarta, transPakuan in Bogor and so forth. Big buses with more than 50 seats such as Patas AC, Patas
Non-AC and Regular buses, midium-sized buses with 24 seats like Metro Mini and Kopaja, mini-buses with 9 to
14 seats like Microlet, Angkot, are in operation. Taxi, bajaj and bike-taxi (ojek) are serving individual transport
service. Tricycle such as Beca is a short-distance traffic measues, which has not been allowed in operation in
DKI Jakarta since 1990s, because it causes traffic congestion.
Bus-way system in DKI Jakarta is called TransJakarta and it is supervised by DISHUB. TransJakarta started to
be in operation in early 2000s. Service on Corridor 1 connecting Blok M and Kota has started in 2004 and up to
now, the total length has extended to 184 km, with 15 routes and 208 stations which are now in operation.
Figure1-3-7 Transjakarta network Source:Transjakarta web site
-19-

Preparatory Survey on Intelligent Transport System Project to mitigate Traffic Congestion in Jakarta (PPP Infrastructure Project) Draft Final Report Chapter 1 1.3.7.2 Public Transport Planning (1)Mass Rapid Transit (MRT)
Multiple MRT routes are being planned. Most prioritized route is Jakarta north-south line connecting to Lebak
Bulus, Dukuh Atas and Kota. Now basic design between LebakBulus and Dukuh Atas has been prepared. As
for MRT east-west line in JABODETABEK region, 5 alternative roytes are being considered, namely, alternative
route 1B and 2 in Balaraja and Cikarang, alternative route 3 in Roxy and Pondok Kopi, and alternative route 4 in
Balaraja and Setu.
Figure1-3-8 MRT planned routes Source:BAPPEDA
-20-

Preparatory Survey on Intelligent Transport System Project to mitigate Traffic Congestion in Jakarta (PPP Infrastructure Project) Draft Final Report Chapter 1
Figure1-3-9 MRT planned routes (specifications) Source:BAPPEDA
(2)Mono-rail
Total length of jakarta mono-rail is about 30km, and total project cost is 3 trillion 730 billion Rupiah (30.8 billion
yen). Green-line as a loop line in Senayan area of which length is 14.5 km and Blue-line as a connecting line to
eastern and western area of which length is 15.5 km are being planned. Commencement year of service
provisio of Green-line is 2015, while Blue-line is 2016. The project was stopped in 2008 due to shortage of
finance. Construction was started again in 2013.
The mono-rail is planned to have 200 passenger capacity per veihicle and 4-cartrain. Number of users are
expected to be about 77.5 thousand per day.
-21-

Preparatory Survey on Intelligent Transport System Project to mitigate Traffic Congestion in Jakarta (PPP Infrastructure Project) Draft Final Report Chapter 1
Figure1-3-10 Mono-rail planned routes Source:DKI Jakarta
(2) JABODETABEK railway In addition to the above urban railway, JABODETABEK railway, of which length is 150 km, is covering
JABODETABEK area. JABODETABEK railway has been almost electrified. The railway consists of central line,
Bogor line, Bekasi line, east line, west line, Tangerang line and Tanjyun Priok line. The line was constructed and
managed by MOT, and operated by PT KAI Commuter JABODETABEK. Now no plans of new line construction
and extention.
Summary of the planning of public transport is in the following table.
Table1-3-7 Current State and Plan of Public Transportation in Capital Region of Jakarta
Name Overview BRT(in operation) Began operation in 2004. As of 2014, 12 lines are under operation. 3 more lines will be added by
2015. The operator was BLU. Transjakarta, a part of DKI but changed to BUMD. Transjakarta because PT Jakarta Propertindo (Jakpro) has invested 1% (99% by DKI) since March of 2014. With adopting management perspective of a private company, it pursues the goal of service improvement and subsidy reduction.
JABODETABEK (in operation) Approx. 150-km rail network. “Directorate General of Railways, Ministry of Transportation” is responsible for construction and facility management. PT KAI Commuter JABODETABEK is in charge of operation management.
-22-

Preparatory Survey on Intelligent Transport System Project to mitigate Traffic Congestion in Jakarta (PPP Infrastructure Project) Draft Final Report Chapter 1
Name Overview MRT (in progress) The construction of South North Line Phase 1 (Lb.Bulus – Bundaran HI:15.2 km ) has begun and it
is scheduled to be completed in 2017. The construction of South North Line Phase 2 (Bundaran HI – Kp. Bandan:8.1km) will start after that. For East West Line, 2 plans are under review.
Monorail (in progress) Have 2 lines: the loop line “Green Line” (14.3 km with 16 stops) and the East West line “Blue Line” (13.7km with 14 stops). Green Line is predicted to open in 2016.The first construction has started in 2004 but was abandoned in 2008 due to financial problems. The project revived by investment of Singaporean capital in 2013.
Source: Created by JICA Study Team based on various materials
1.4 Necessity of the introduction of ERP in DKI Jakarta As discussed in prior, macroeconomic indicators and population are shown and socio-economic status of DKI
Jakarta, maintenance plans, current status of transport, transport infrastructure and the like were described.
Further deepening on the road traffic congestion in DKI Jakarta can be envisaged in the future even by looking
at any of them. One strategy to halt the further deepening of these road traffic congestion is the expansion of
public transportation, including the city bus and train. Urban development projects to encourage commuting
patterns of peoples behavior that does not depend on the car is also important. In addition, in order to alleviate
road traffic congestion, which currently become obvious already, the introduction of appropriate automobile
traffic management measures is also important.
Another measures to encourage these traffic measures is the reduction of economic policy incentives for car.
Namely raising the economic compensation for vehicle use can be a measure to reduce the relative
attractiveness of motor vehicle. ERP can be positioned in such category of measures. In addition to this, as a
measure to induce a higher cost that occurs with vehicle use, increase of the parking tarrif and raising the price
of gasoline are also placed on the same level of ERP.
By the increase in cost measures associated with vehicle use and raising measures of public transport service
levels being operated concurrently, road traffic congestion in DKI Jakarta will be managed properly. It can be
said that in this context, for the alleviation of serious road traffic congestion in DKI Jakarta today, introduction of
ERP is an essential measure.
In Chapter 2 of this report, of which main topic is the overall urban road traffic congestion measures, the above
discussion will be discussed in more detail.
-23-
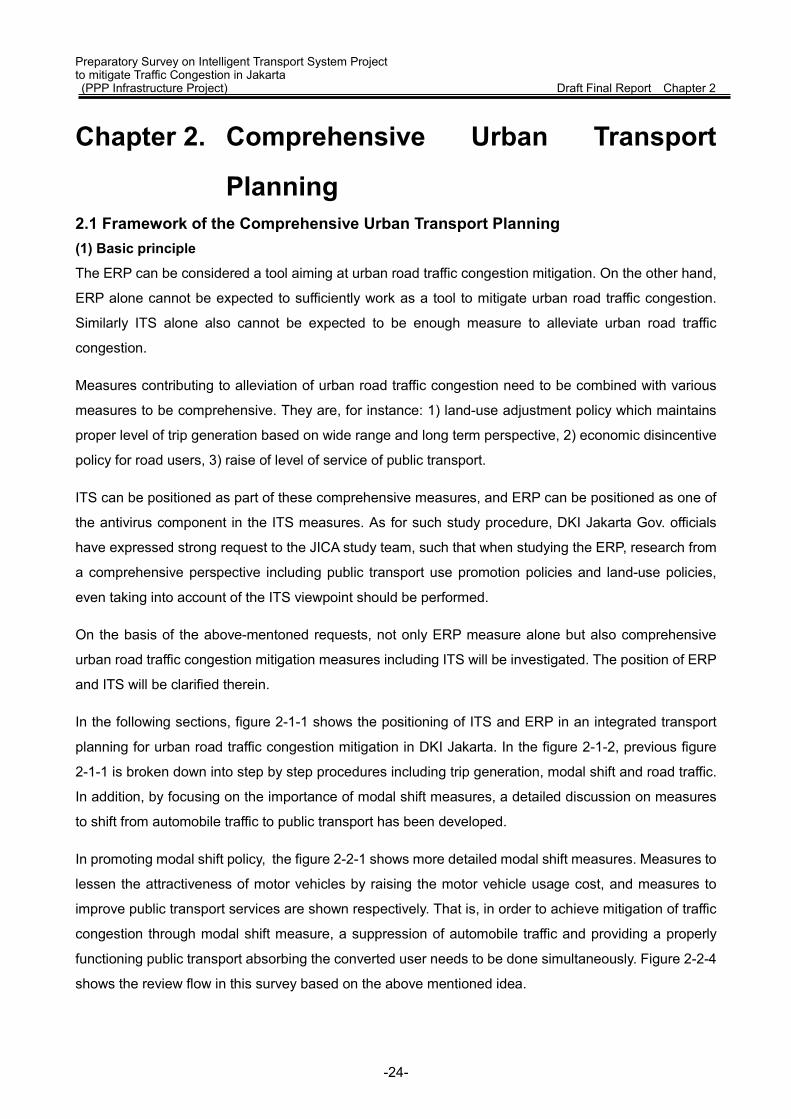
Preparatory Survey on Intelligent Transport System Project to mitigate Traffic Congestion in Jakarta (PPP Infrastructure Project) Draft Final Report Chapter 2
Chapter 2. Comprehensive Urban Transport
Planning 2.1 Framework of the Comprehensive Urban Transport Planning (1) Basic principle
The ERP can be considered a tool aiming at urban road traffic congestion mitigation. On the other hand,
ERP alone cannot be expected to sufficiently work as a tool to mitigate urban road traffic congestion.
Similarly ITS alone also cannot be expected to be enough measure to alleviate urban road traffic
congestion.
Measures contributing to alleviation of urban road traffic congestion need to be combined with various
measures to be comprehensive. They are, for instance: 1) land-use adjustment policy which maintains
proper level of trip generation based on wide range and long term perspective, 2) economic disincentive
policy for road users, 3) raise of level of service of public transport.
ITS can be positioned as part of these comprehensive measures, and ERP can be positioned as one of
the antivirus component in the ITS measures. As for such study procedure, DKI Jakarta Gov. officials
have expressed strong request to the JICA study team, such that when studying the ERP, research from
a comprehensive perspective including public transport use promotion policies and land-use policies,
even taking into account of the ITS viewpoint should be performed.
On the basis of the above-mentoned requests, not only ERP measure alone but also comprehensive
urban road traffic congestion mitigation measures including ITS will be investigated. The position of ERP
and ITS will be clarified therein.
In the following sections, figure 2-1-1 shows the positioning of ITS and ERP in an integrated transport
planning for urban road traffic congestion mitigation in DKI Jakarta. In the figure 2-1-2, previous figure
2-1-1 is broken down into step by step procedures including trip generation, modal shift and road traffic.
In addition, by focusing on the importance of modal shift measures, a detailed discussion on measures
to shift from automobile traffic to public transport has been developed.
In promoting modal shift policy, the figure 2-2-1 shows more detailed modal shift measures. Measures to
lessen the attractiveness of motor vehicles by raising the motor vehicle usage cost, and measures to
improve public transport services are shown respectively. That is, in order to achieve mitigation of traffic
congestion through modal shift measure, a suppression of automobile traffic and providing a properly
functioning public transport absorbing the converted user needs to be done simultaneously. Figure 2-2-4
shows the review flow in this survey based on the above mentioned idea.
-24-

Preparatory Survey on Intelligent Transport System Project to mitigate Traffic Congestion in Jakarta (PPP Infrastructure Project) Draft Final Report Chapter 2
Figure2-1-1 Positioning of ITS and ERP in comprehensive urban transport planning
(2) Framework of the Comprehensive Urban Transport Planning
The Comprehensive Urban Transport Plan has a management plan for each of different stages such as
the trip generation, modal split, and road traffic flow. At the stage of trip generation, measures to restrain
total trip can be considered. These measures include inhibit growth management policy, city formation
and urban development with small commuting traffic load and urban growth control policy.
In modal split transport management measures, both of measures to restrain motor vehicle trip and to
promote usage of public transport has to be properly implemented. For one thing, measures aiming at
reducing attractiveness of motor vehicle usage such as raising gasoline price and parking tariff will be a
typical policy measure to promote the reduction of motor vehicle usage. For other thing, improvement of
level of service of public transport will be a measure to promote attractiveness of public transport.
Through these two measures, a modal shift from motor vehicles to public transport is achieved. For
motor vehicle traffic, smooth traffic flow will be promoted through proper traffic management and traffic
control policy.
The above-mentioned framework of the comprehensive urban transport planning is shown in the
following figure.
Comprehensive Urban Transport Planning
ITS
ERP
Land-use plan
Public transport
Traffic regulation
Signal
Public transport
-25-
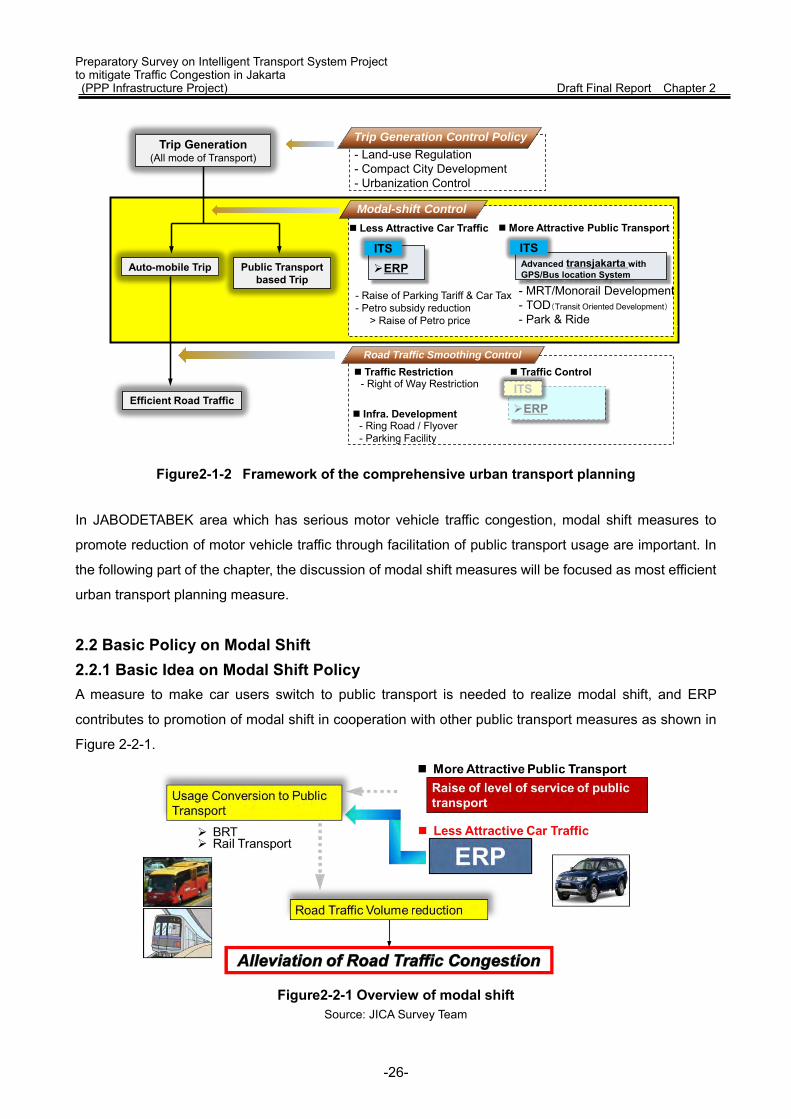
Preparatory Survey on Intelligent Transport System Project to mitigate Traffic Congestion in Jakarta (PPP Infrastructure Project) Draft Final Report Chapter 2
Figure2-1-2 Framework of the comprehensive urban transport planning
In JABODETABEK area which has serious motor vehicle traffic congestion, modal shift measures to
promote reduction of motor vehicle traffic through facilitation of public transport usage are important. In
the following part of the chapter, the discussion of modal shift measures will be focused as most efficient
urban transport planning measure.
2.2 Basic Policy on Modal Shift 2.2.1 Basic Idea on Modal Shift Policy A measure to make car users switch to public transport is needed to realize modal shift, and ERP
contributes to promotion of modal shift in cooperation with other public transport measures as shown in
Figure 2-2-1.
Figure2-2-1 Overview of modal shift
Source: JICA Survey Team
- Land-use Regulation- Compact City Development- Urbanization Control
Auto-mobile Trip
- MRT/Monorail Development- TOD(Transit Oriented Development)- Park & Ride
Trip Generation Control Policy
Public Transport based Trip
Modal-shift Control
- Raise of Parking Tariff & Car Tax- Petro subsidy reduction
> Raise of Petro price
Road Traffic Smoothing Control
More Attractive Public Transport Less Attractive Car Traffic
Efficient Road Traffic
Traffic Control
ERP
Traffic Restriction- Right of Way Restriction
Infra. Development- Ring Road / Flyover- Parking Facility
ITS
Advanced transjakarta with GPS/Bus location System
ITS
Trip Generation (All mode of Transport)
ERPITS
-26-

Preparatory Survey on Intelligent Transport System Project to mitigate Traffic Congestion in Jakarta (PPP Infrastructure Project) Draft Final Report Chapter 2 2.2.2 Roads under ERP and Public Transport 2.2.2.1 Targeted Roads for ERP The targeted roads or corridor to implement ERP are shown in Figure 2-2-2. According to DKI Jakarta,
Corridor I and Corridor VI are planned in the ERP roads.
Figure2-2-2 Roads under ERP Source: JICA Study Team
Corr
idor
I
Corr
idor
VI
-27-

Preparatory Survey on Intelligent Transport System Project to mitigate Traffic Congestion in Jakarta (PPP Infrastructure Project) Draft Final Report Chapter 2 2.2.2.2 Current State and Plan of Public Transport Figure 2-2-3 shows the current status and plan of public transport with roads under ERP. Table 2-2-1
also shows the summary of the current status and plan of public transport in DKI Jakarta. In Corridor I,
the transport capacity of public transport will be significantly enhanced by development of MRT between
Bundaran HI and Blok M in addition to BRT. The phase-2 development of MRT South North line will also
improve the transport capacity between Kota and Bundran HI. On the other hand, significant
enhancement of transport capacity like MRT cannot be expected in Corridor VI and only BRT can be a
recipient of modal shift.
Figure2-2-3 Roads under ERP and public transport (including plan) Source: Created by JICA Study Team based on various materials
East West
Line Plan 1
East West
Line Plan 1
-28-
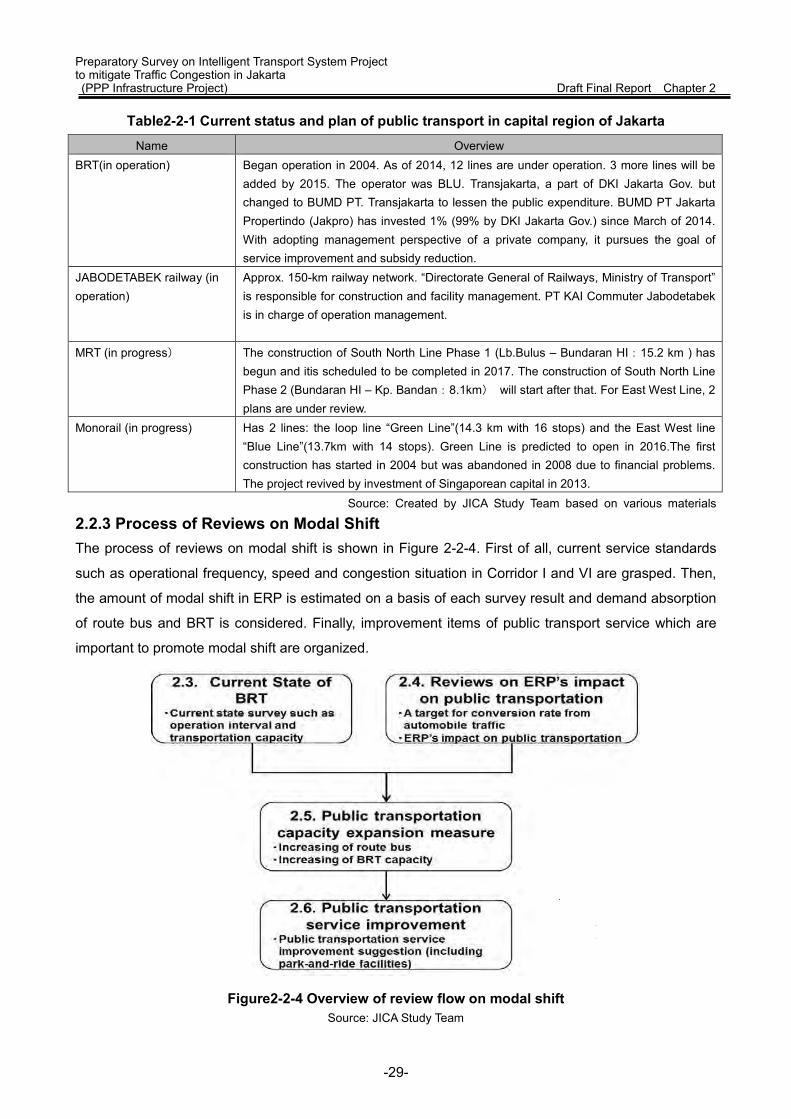
Preparatory Survey on Intelligent Transport System Project to mitigate Traffic Congestion in Jakarta (PPP Infrastructure Project) Draft Final Report Chapter 2
Table2-2-1 Current status and plan of public transport in capital region of Jakarta Name Overview
BRT(in operation) Began operation in 2004. As of 2014, 12 lines are under operation. 3 more lines will be added by 2015. The operator was BLU. Transjakarta, a part of DKI Jakarta Gov. but changed to BUMD PT. Transjakarta to lessen the public expenditure. BUMD PT Jakarta Propertindo (Jakpro) has invested 1% (99% by DKI Jakarta Gov.) since March of 2014. With adopting management perspective of a private company, it pursues the goal of service improvement and subsidy reduction.
JABODETABEK railway (in operation)
Approx. 150-km railway network. “Directorate General of Railways, Ministry of Transport” is responsible for construction and facility management. PT KAI Commuter Jabodetabek is in charge of operation management.
MRT (in progress) The construction of South North Line Phase 1 (Lb.Bulus – Bundaran HI:15.2 km ) has begun and itis scheduled to be completed in 2017. The construction of South North Line Phase 2 (Bundaran HI – Kp. Bandan:8.1km) will start after that. For East West Line, 2 plans are under review.
Monorail (in progress) Has 2 lines: the loop line “Green Line”(14.3 km with 16 stops) and the East West line “Blue Line”(13.7km with 14 stops). Green Line is predicted to open in 2016.The first construction has started in 2004 but was abandoned in 2008 due to financial problems. The project revived by investment of Singaporean capital in 2013.
Source: Created by JICA Study Team based on various materials
2.2.3 Process of Reviews on Modal Shift The process of reviews on modal shift is shown in Figure 2-2-4. First of all, current service standards
such as operational frequency, speed and congestion situation in Corridor I and VI are grasped. Then,
the amount of modal shift in ERP is estimated on a basis of each survey result and demand absorption
of route bus and BRT is considered. Finally, improvement items of public transport service which are
important to promote modal shift are organized.
Figure2-2-4 Overview of review flow on modal shift Source: JICA Study Team
-29-

Preparatory Survey on Intelligent Transport System Project to mitigate Traffic Congestion in Jakarta (PPP Infrastructure Project) Draft Final Report Chapter 2 2.3 Current Status Survey of BRT 2.3.1 Overview of Existing Survey The BRT system in DKI Jakarta are operated by TransJakarta and widely used by people as a critical
system of road-type public transport connecting to main areas in Jakarta. 12 lines are in operation and 3
more lines will be added. According to announcement of TransJakarta, the planned average speed of
each line is 18km/h. Table2-3-1 Average speed of BRT (Planned)
Source:Final Report of Project for the Study on JABODETABEK Public Transport Policy Implementation Strategy by JICA (May 2012)
On the other hand, various surveys have been conducted with respect to BRT service level. Table2-3-2
shows the result of travele speed survey conducted in the past. The table indicates that average speed
tends to be slower in morning and evening rush hour and there are many lines, which do not reach the
planned average speed of 18km/h. Table2-3-2 Traveling speed of BRT (survey result in previous fiscal year)
Source:Final Report of Project for the Study on JABODETABEK Public Transport Policy Implementation Strategy by JICA (May 2012)
-30-

Preparatory Survey on Intelligent Transport System Project to mitigate Traffic Congestion in Jakarta (PPP Infrastructure Project) Draft Final Report Chapter 2 As discussed in this manner, although BRT is pervasive among residents in Jakarta as a part of their
lifestyle, it is also expected to be a recipient of switching demands by modal shit from cars to public
transport when “traffic control measure” such as ERP is conducted to mitigate traffic congestion in
special capital region of Jakarta.
Therefore, the receptivity for switching demands through a field survey of current BRT operation will be
discussed in the next section. The targets are Corridor I and Corridor VI, which are the candidate
corridor for ERP implementation.
Table2-3-3 Stop name of TransJakarta
Corridor I Corridor VI
Source: TransJakarta
No. Stops Distance (m)
1 Blok M 02 Masjid Agung 1.0753 Bunderan Senayan 918
4 Gelora Bung Karno 7725 POLDA 4406 Bundungan Hilir 6357 Karet 2748 Setia Budi 7239 Dukuh Atas 58610 Tosari 74311 Bunderan H.I. 47912 Sarinah 67413 Bank Indonesia 58614 Monas 67415 Harmoni 1.15316 Sawah Besar 65517 Mangga Besar 1.07518 Olimo 39319 Glodok 42020 Kota 625
Total 12.900
No. Stops Distance (m)
1 Ragunan 02 Dep. Pertanian 1.3263 SMK 57 3904 Jati Padang 7115 Pejaten 9006 Buncit Indah 4517 Warung Jati 1.2178 Imigrasi 8529 Duren Tiga 527
10 Mampang Prapatan 1.154
11 Kuningan Timur 1.874
12 Patra Kuningan 50813 DEPKES 57514 GOR Sumantri 93815 Karet Kuningan 308
16 Kuningan Madya 631
17 Setiabudi Aini 40918 Latuharhari 82319 Halimun 88220 Dukuh Atas 1.322
Total 15.798
-31-

Preparatory Survey on Intelligent Transport System Project to mitigate Traffic Congestion in Jakarta (PPP Infrastructure Project) Draft Final Report Chapter 2 2.3.2 Traveling Speed Survey of BRT 2.3.2.1 Overview of Survey The overview of survey is as follows.
Table2-3-4 Overview of survey
Overview
Goal Grasping the travele time and the bottleneck points of BRT
Survey Date
and Place
3/25/2014 (TUE) 6:30-9:00AM Corridor1(Blok M-Kota, Kota-Blok M)
3/26/2014 (WED) 7:00-9:30AM Corridor6
(Ragunan-Dukuh Atas2, Dukuh Atas2-Ragunan)
Survey
Methodology
GPS measurement, visual confirmation and photo shooting at each place
2.3.2.2 Result of Survey As for the travel speed and major bottleneck spots of Corridor I and VI within rush hour, the result of
survey, which was done through GPS measuring equipment, is shown in Table 2-3-5 and Table 2-3-6.
The survey result of the weekday rush hour shows 15-19km/h for Corridor I and 13-19km/h for Corridor
VI. Through the survey, the fact that their speed is below the planned travel speed: 18km/h is confirmed,
which was similar to the result of past survey (Table 2-3-2). Especially for Corridor VI, the survey result
shows the travel speed is below 20km/h despite the average speed was a little over 21km/h in morning
rush hour both for North and South bound in the past result (Table 2-3-2).
According to analysis of time history response waves of travel speed, the causes of the low travel speed
can be described as over-1-minute stops occurring at signalized intersections and rotary intersections in
Corridor I and at signalized intersections and rail crossing intersection in Corridor VI.
BRT system has its own exclusive bus lane on most of the open roads. However junctions, which include
intersection and rotary and specific points like rail crossing, diminish the travel speed and act as
bottleneck. As shown in Table 2-3-7, the situation occurring at bottleneck points consumes times
resulting in unpunctual public service.
-32-

Preparatory Survey on Intelligent Transport System Project to mitigate Traffic Congestion in Jakarta (PPP Infrastructure Project) Draft Final Report Chapter 2
Table2-3-5 Travel speed measuring result with GPS measurement equipment(Corridor1)
Corridor1 Date Tue. 3/25/2014
North bound
Stop name Time Trip time Route length Scheduled speed
First stop Blok M 6:42 43 min (excluding transfer
time at Harmoni stop)
12.9km 18.5km/h Last stop Kota 7:27
Bottleneck Signaled intersection, Rotary intersection
Data
South bound
Stop name Time Trip time Route length Scheduled speed
First stop Kota 8:06 51 min 12.9km 15.1km/h
Last stop Blok M 8:57
Bottleneck Signaled intersection, U-turn slot, Rotary intersection
Data
0.0
20.0
40.0
60.0
80.0
6:41:46 6:48:58 6:56:10 7:03:22 7:10:34 7:17:46 7:24:58
速度
[km
/h]
計測時間
Signaled Rotary Rotary
Transfer time at Harmoni stop
0.0
20.0
40.0
60.0
80.0
8:06:00 8:13:12 8:20:24 8:27:36 8:34:48 8:42:00 8:49:12 8:56:24
速度
[km
/h]
計測時間
Signaled intersection, Signaled Rotary
-33-
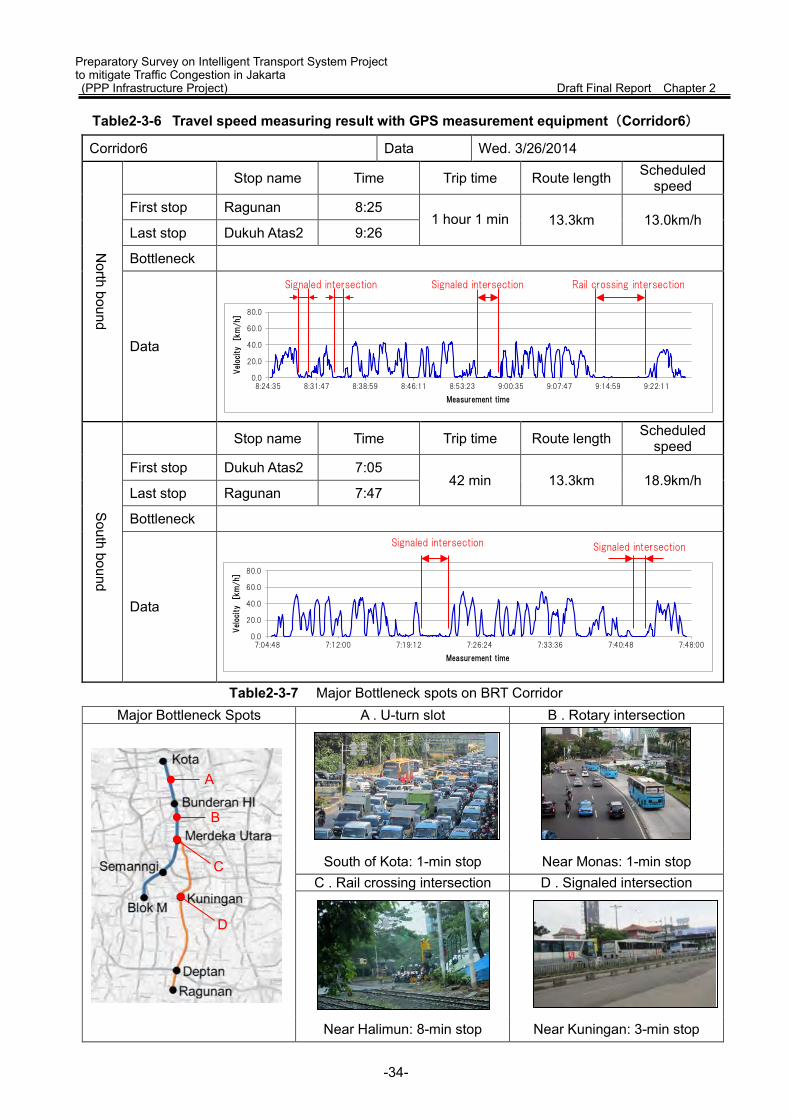
Preparatory Survey on Intelligent Transport System Project to mitigate Traffic Congestion in Jakarta (PPP Infrastructure Project) Draft Final Report Chapter 2
Table2-3-6 Travel speed measuring result with GPS measurement equipment(Corridor6)
Corridor6 Data Wed. 3/26/2014
North bound
Stop name Time Trip time Route length Scheduled speed
First stop Ragunan 8:25 1 hour 1 min 13.3km 13.0km/h
Last stop Dukuh Atas2 9:26
Bottleneck
Data
South bound
Stop name Time Trip time Route length Scheduled speed
First stop Dukuh Atas2 7:05 42 min 13.3km 18.9km/h
Last stop Ragunan 7:47
Bottleneck
Data
Table2-3-7 Major Bottleneck spots on BRT Corridor Major Bottleneck Spots A . U-turn slot B . Rotary intersection
South of Kota: 1-min stop Near Monas: 1-min stop C . Rail crossing intersection D . Signaled intersection
Near Halimun: 8-min stop Near Kuningan: 3-min stop
0.0
20.0
40.0
60.0
80.0
7:04:48 7:12:00 7:19:12 7:26:24 7:33:36 7:40:48 7:48:00
Vel
ocity
[km
/h]
Measurement time
0.0
20.0
40.0
60.0
80.0
8:24:35 8:31:47 8:38:59 8:46:11 8:53:23 9:00:35 9:07:47 9:14:59 9:22:11
Vel
ocity
[km
/h]
Measurement time
Signaled intersection Signaled intersection
Rail crossing intersection
Signaled intersection Signaled intersection
A
B
C
D
-34-

Preparatory Survey on Intelligent Transport System Project to mitigate Traffic Congestion in Jakarta (PPP Infrastructure Project) Draft Final Report Chapter 2 2.3.3 Survey of Stop Usage 2.3.3.1 Overview of Survey The survey overview is as follows.
Table2-3-8 Overview of survey
Overview
Goal Grasping the operation interval of BRT and congested situation at stops and on bus
Survey Date
and Place
3/25/2014(TUE) 6:30 Bloc M Stop, 8:00Kota Stop(Corridor1)
3/26/2014(WED) 7:00 Dukuh Atas2 Stop, 8:15 Ragunan Stop (Corridor2)
3/27/2014(THUR) 16:45-18:15 Tosari, Dukuh Atas1(Corridor1),
Dukuh Atas2(Corridor6)
Survey
Methodology
Visual confirmation and photo shooting at each spots
2.3.3.2 Overview of Survey Result The survey was narrowed down morning and evening rush hour of weekday which was expected to be
the highest usage of BRT. The survey result is shown in Table 2-3-9 and the survey situations are shown
in Figure2-3-1 and Figure 2-3-2. , 2 corridors show the common tendency as below.
- Congestion in evening rush hour is prominent when making comparison between morning and evening rush hour. This is because people make choice of going home at close of business at the same time.
- Stops are extremely congested in evening rush hour and load factor of BRT reaches almost 100%. On the other hand, BRT runs once every 2-3 minutes so passengers can get on second or third bus and the waiting time is only 10 minutes.
As above, the demand and supply of transport capacity of Corridor I and VI in rush hour are almost
balanced despite people have to wait for a little time at a bus stop.
Table2-3-9 BRT operation in rush hour (Corridor1&6)
Morning Rush Hour AM 6:30-9:00
Evening Rush Hour PM 17:00-19:00
Corridor1
Bus type/Capacity Articulated bus 125 persons (37 seats)
Operation interval*1 Every 3 minutes Every 2-3 minutes
Waiting line at stop A few waiting lines Congested(10minutes)
Load factor 60-80% 100%
Corridor6
Bus type/Capacity Non-articulated bus 85 persons(30 seats)
Operation interval*1 Every 3 minutes
Waiting line at stop A few waiting lines Congested(10minutes)
Load factor 100% Over 100%
-35-
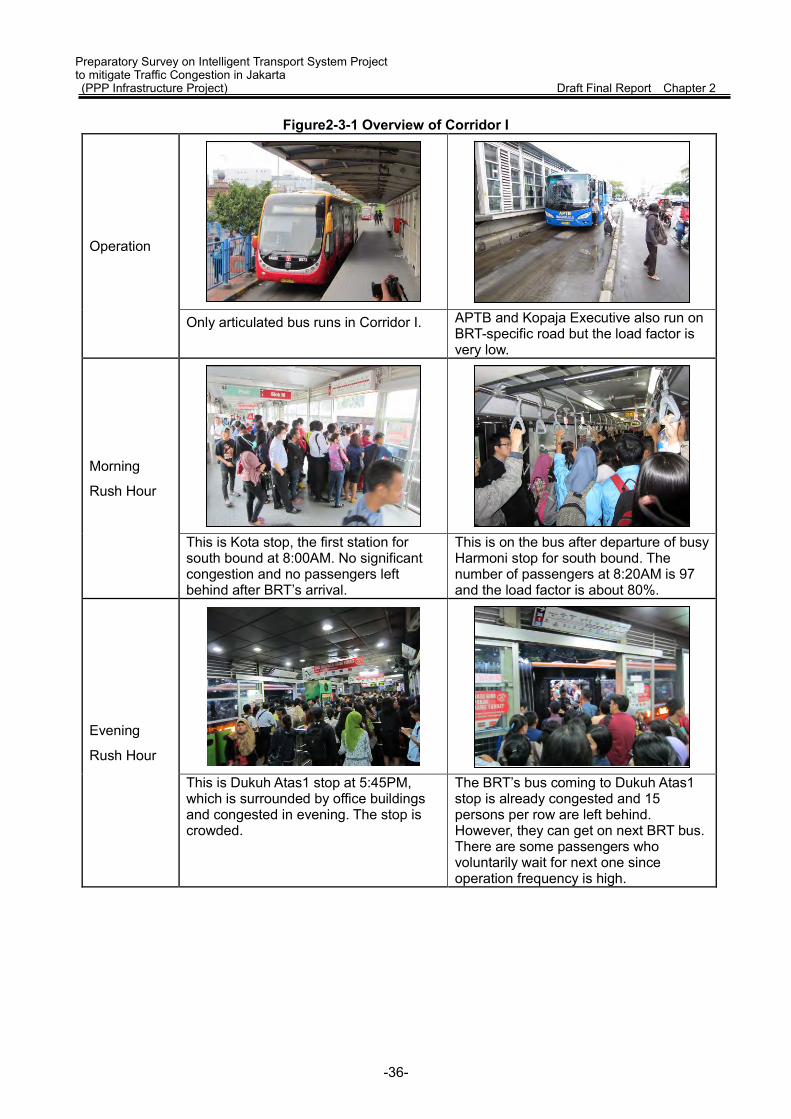
Preparatory Survey on Intelligent Transport System Project to mitigate Traffic Congestion in Jakarta (PPP Infrastructure Project) Draft Final Report Chapter 2
Figure2-3-1 Overview of Corridor I
Operation
Only articulated bus runs in Corridor I. APTB and Kopaja Executive also run on BRT-specific road but the load factor is very low.
Morning
Rush Hour
This is Kota stop, the first station for south bound at 8:00AM. No significant congestion and no passengers left behind after BRT’s arrival.
This is on the bus after departure of busy Harmoni stop for south bound. The number of passengers at 8:20AM is 97 and the load factor is about 80%.
Evening
Rush Hour This is Dukuh Atas1 stop at 5:45PM, which is surrounded by office buildings and congested in evening. The stop is crowded.
The BRT’s bus coming to Dukuh Atas1 stop is already congested and 15 persons per row are left behind. However, they can get on next BRT bus. There are some passengers who voluntarily wait for next one since operation frequency is high.
-36-
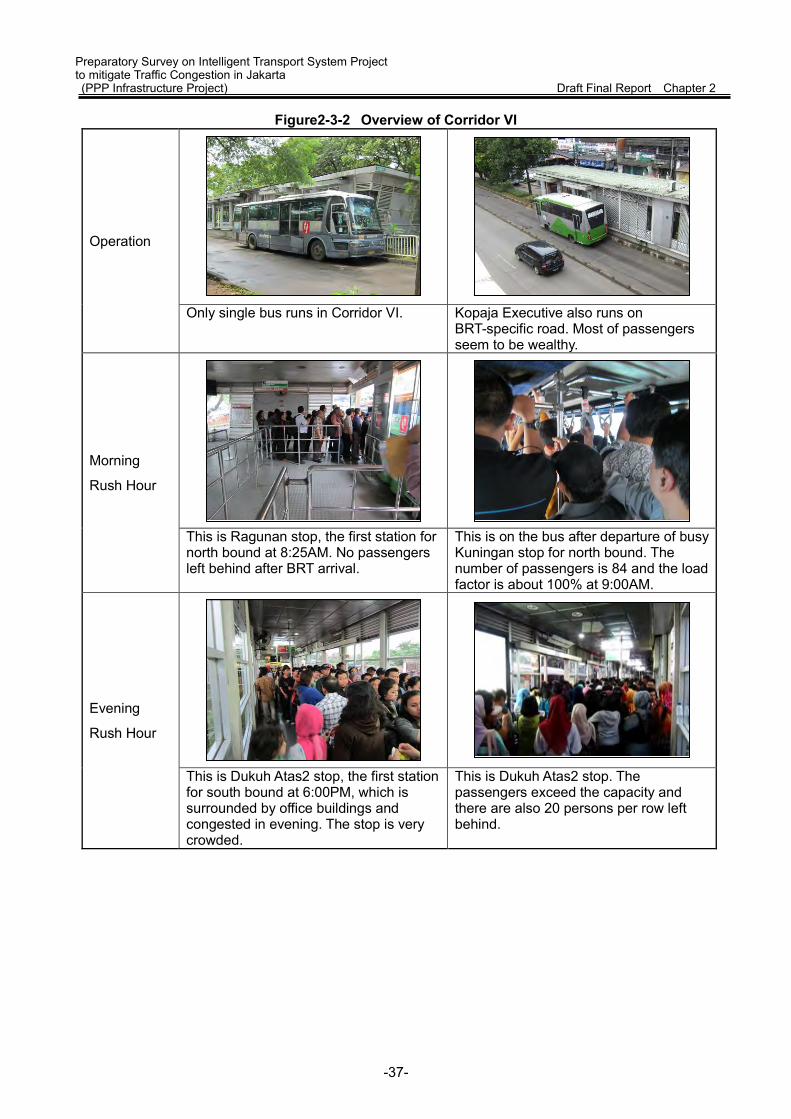
Preparatory Survey on Intelligent Transport System Project to mitigate Traffic Congestion in Jakarta (PPP Infrastructure Project) Draft Final Report Chapter 2
Figure2-3-2 Overview of Corridor VI
Operation
Only single bus runs in Corridor VI. Kopaja Executive also runs on
BRT-specific road. Most of passengers seem to be wealthy.
Morning
Rush Hour
This is Ragunan stop, the first station for north bound at 8:25AM. No passengers left behind after BRT arrival.
This is on the bus after departure of busy Kuningan stop for north bound. The number of passengers is 84 and the load factor is about 100% at 9:00AM.
Evening
Rush Hour
This is Dukuh Atas2 stop, the first station for south bound at 6:00PM, which is surrounded by office buildings and congested in evening. The stop is very crowded.
This is Dukuh Atas2 stop. The passengers exceed the capacity and there are also 20 persons per row left behind.
-37-
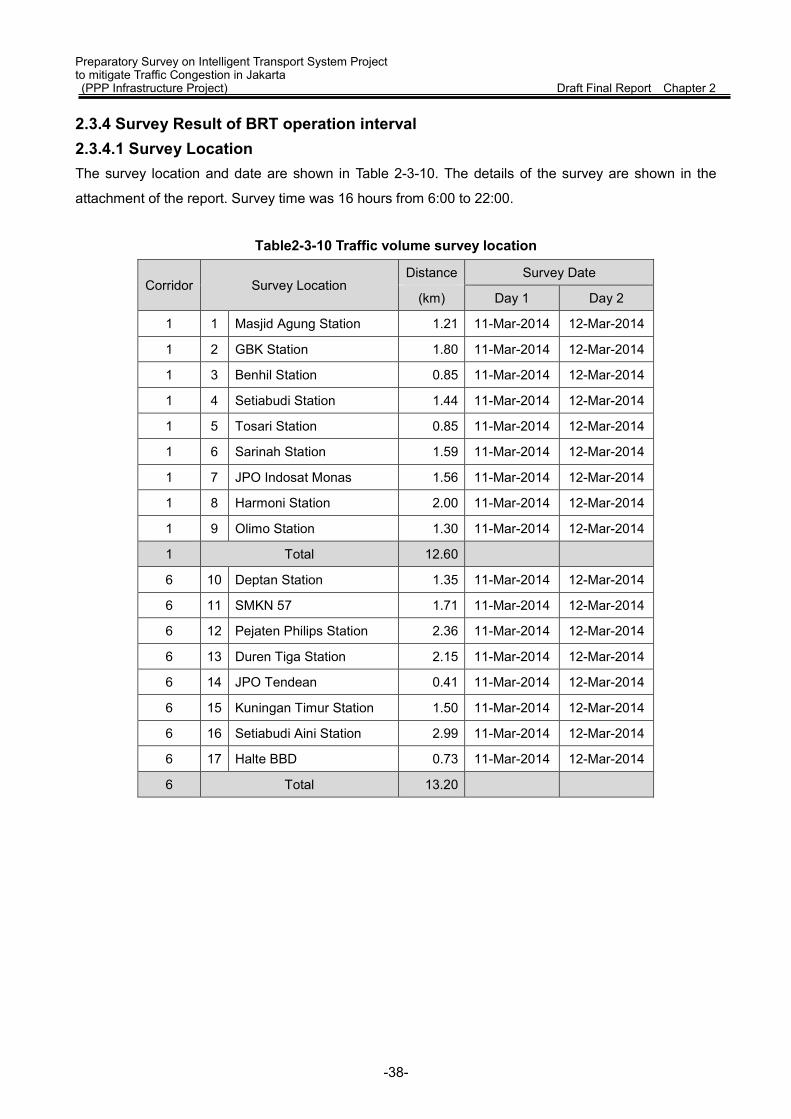
Preparatory Survey on Intelligent Transport System Project to mitigate Traffic Congestion in Jakarta (PPP Infrastructure Project) Draft Final Report Chapter 2 2.3.4 Survey Result of BRT operation interval 2.3.4.1 Survey Location The survey location and date are shown in Table 2-3-10. The details of the survey are shown in the
attachment of the report. Survey time was 16 hours from 6:00 to 22:00.
Table2-3-10 Traffic volume survey location
Corridor Survey Location Distance Survey Date
(km) Day 1 Day 2
1 1 Masjid Agung Station 1.21 11-Mar-2014 12-Mar-2014
1 2 GBK Station 1.80 11-Mar-2014 12-Mar-2014
1 3 Benhil Station 0.85 11-Mar-2014 12-Mar-2014
1 4 Setiabudi Station 1.44 11-Mar-2014 12-Mar-2014
1 5 Tosari Station 0.85 11-Mar-2014 12-Mar-2014
1 6 Sarinah Station 1.59 11-Mar-2014 12-Mar-2014
1 7 JPO Indosat Monas 1.56 11-Mar-2014 12-Mar-2014
1 8 Harmoni Station 2.00 11-Mar-2014 12-Mar-2014
1 9 Olimo Station 1.30 11-Mar-2014 12-Mar-2014
1 Total 12.60
6 10 Deptan Station 1.35 11-Mar-2014 12-Mar-2014
6 11 SMKN 57 1.71 11-Mar-2014 12-Mar-2014
6 12 Pejaten Philips Station 2.36 11-Mar-2014 12-Mar-2014
6 13 Duren Tiga Station 2.15 11-Mar-2014 12-Mar-2014
6 14 JPO Tendean 0.41 11-Mar-2014 12-Mar-2014
6 15 Kuningan Timur Station 1.50 11-Mar-2014 12-Mar-2014
6 16 Setiabudi Aini Station 2.99 11-Mar-2014 12-Mar-2014
6 17 Halte BBD 0.73 11-Mar-2014 12-Mar-2014
6 Total 13.20
-38-
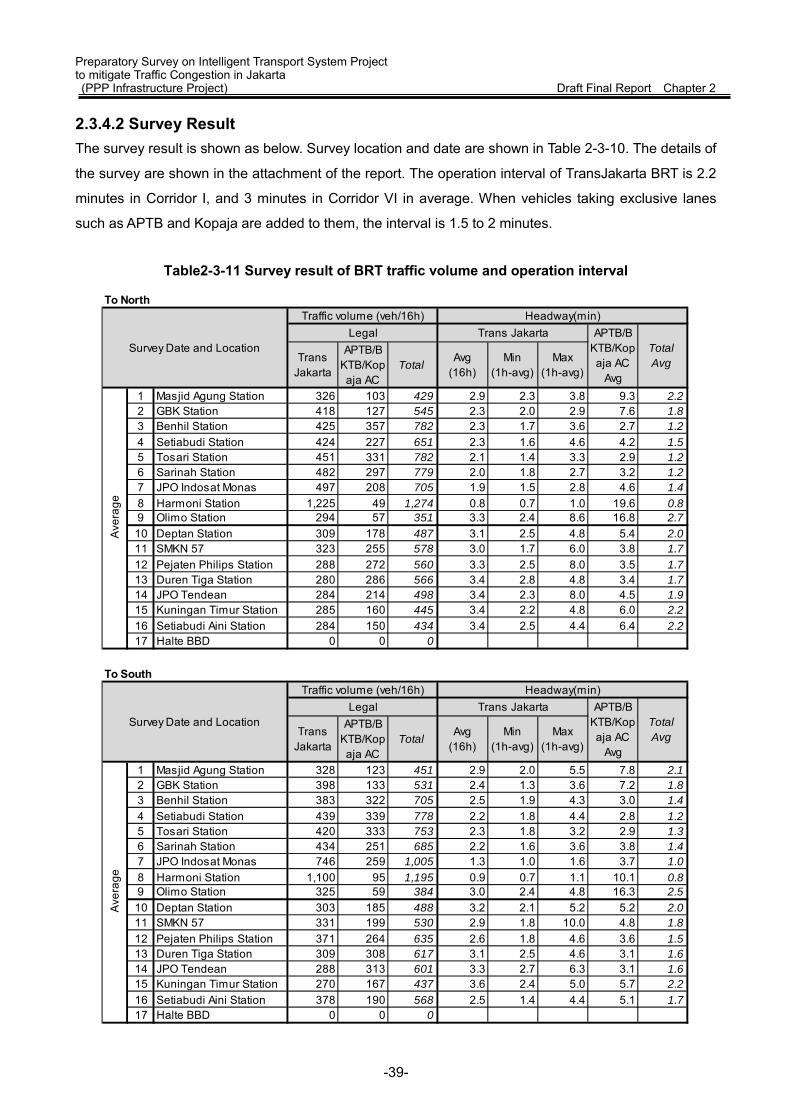
Preparatory Survey on Intelligent Transport System Project to mitigate Traffic Congestion in Jakarta (PPP Infrastructure Project) Draft Final Report Chapter 2 2.3.4.2 Survey Result The survey result is shown as below. Survey location and date are shown in Table 2-3-10. The details of
the survey are shown in the attachment of the report. The operation interval of TransJakarta BRT is 2.2
minutes in Corridor I, and 3 minutes in Corridor VI in average. When vehicles taking exclusive lanes
such as APTB and Kopaja are added to them, the interval is 1.5 to 2 minutes.
Table2-3-11 Survey result of BRT traffic volume and operation interval
To North
TransJakarta
APTB/BKTB/Kopaja AC
TotalAvg
(16h)Min
(1h-avg)Max
(1h-avg)
1 Masjid Agung Station 326 103 429 2.9 2.3 3.8 9.3 2.22 GBK Station 418 127 545 2.3 2.0 2.9 7.6 1.83 Benhil Station 425 357 782 2.3 1.7 3.6 2.7 1.24 Setiabudi Station 424 227 651 2.3 1.6 4.6 4.2 1.55 Tosari Station 451 331 782 2.1 1.4 3.3 2.9 1.26 Sarinah Station 482 297 779 2.0 1.8 2.7 3.2 1.27 JPO Indosat Monas 497 208 705 1.9 1.5 2.8 4.6 1.48 Harmoni Station 1,225 49 1,274 0.8 0.7 1.0 19.6 0.89 Olimo Station 294 57 351 3.3 2.4 8.6 16.8 2.710 Deptan Station 309 178 487 3.1 2.5 4.8 5.4 2.011 SMKN 57 323 255 578 3.0 1.7 6.0 3.8 1.712 Pejaten Philips Station 288 272 560 3.3 2.5 8.0 3.5 1.713 Duren Tiga Station 280 286 566 3.4 2.8 4.8 3.4 1.714 JPO Tendean 284 214 498 3.4 2.3 8.0 4.5 1.915 Kuningan Timur Station 285 160 445 3.4 2.2 4.8 6.0 2.216 Setiabudi Aini Station 284 150 434 3.4 2.5 4.4 6.4 2.217 Halte BBD 0 0 0
Ave
rage
Survey Date and LocationLegal APTB/B
KTB/Kopaja AC
Avg
TotalAvg
Trans JakartaHeadway(min)Traffic volume (veh/16h)
To South
TransJakarta
APTB/BKTB/Kopaja AC
TotalAvg
(16h)Min
(1h-avg)Max
(1h-avg)
1 Masjid Agung Station 328 123 451 2.9 2.0 5.5 7.8 2.12 GBK Station 398 133 531 2.4 1.3 3.6 7.2 1.83 Benhil Station 383 322 705 2.5 1.9 4.3 3.0 1.44 Setiabudi Station 439 339 778 2.2 1.8 4.4 2.8 1.25 Tosari Station 420 333 753 2.3 1.8 3.2 2.9 1.36 Sarinah Station 434 251 685 2.2 1.6 3.6 3.8 1.47 JPO Indosat Monas 746 259 1,005 1.3 1.0 1.6 3.7 1.08 Harmoni Station 1,100 95 1,195 0.9 0.7 1.1 10.1 0.89 Olimo Station 325 59 384 3.0 2.4 4.8 16.3 2.510 Deptan Station 303 185 488 3.2 2.1 5.2 5.2 2.011 SMKN 57 331 199 530 2.9 1.8 10.0 4.8 1.812 Pejaten Philips Station 371 264 635 2.6 1.8 4.6 3.6 1.513 Duren Tiga Station 309 308 617 3.1 2.5 4.6 3.1 1.614 JPO Tendean 288 313 601 3.3 2.7 6.3 3.1 1.615 Kuningan Timur Station 270 167 437 3.6 2.4 5.0 5.7 2.216 Setiabudi Aini Station 378 190 568 2.5 1.4 4.4 5.1 1.717 Halte BBD 0 0 0
TotalAvg
Headway(min)Traffic volume (veh/16h)Trans JakartaLegal APTB/B
KTB/Kopaja AC
Avg
Ave
rage
Survey Date and Location
-39-
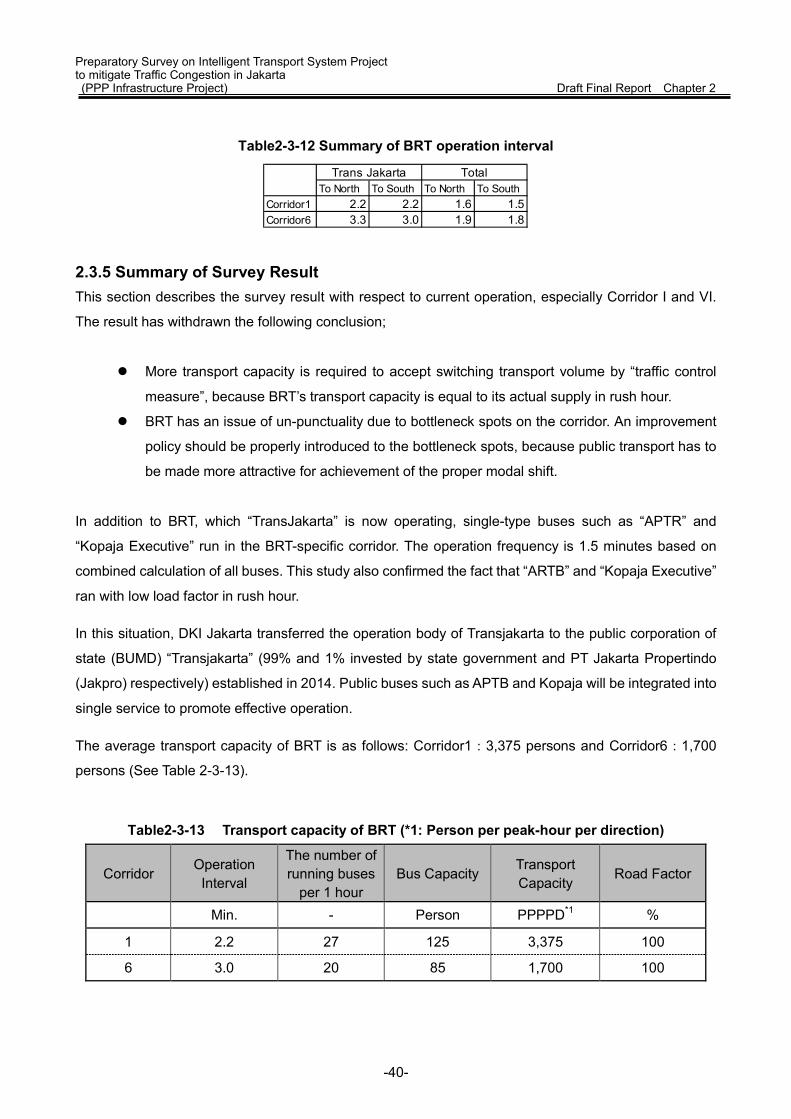
Preparatory Survey on Intelligent Transport System Project to mitigate Traffic Congestion in Jakarta (PPP Infrastructure Project) Draft Final Report Chapter 2
Table2-3-12 Summary of BRT operation interval
2.3.5 Summary of Survey Result This section describes the survey result with respect to current operation, especially Corridor I and VI.
The result has withdrawn the following conclusion;
More transport capacity is required to accept switching transport volume by “traffic control
measure”, because BRT’s transport capacity is equal to its actual supply in rush hour.
BRT has an issue of un-punctuality due to bottleneck spots on the corridor. An improvement
policy should be properly introduced to the bottleneck spots, because public transport has to
be made more attractive for achievement of the proper modal shift.
In addition to BRT, which “TransJakarta” is now operating, single-type buses such as “APTR” and
“Kopaja Executive” run in the BRT-specific corridor. The operation frequency is 1.5 minutes based on
combined calculation of all buses. This study also confirmed the fact that “ARTB” and “Kopaja Executive”
ran with low load factor in rush hour.
In this situation, DKI Jakarta transferred the operation body of Transjakarta to the public corporation of
state (BUMD) “Transjakarta” (99% and 1% invested by state government and PT Jakarta Propertindo
(Jakpro) respectively) established in 2014. Public buses such as APTB and Kopaja will be integrated into
single service to promote effective operation.
The average transport capacity of BRT is as follows: Corridor1:3,375 persons and Corridor6:1,700
persons (See Table 2-3-13).
Table2-3-13 Transport capacity of BRT (*1: Person per peak-hour per direction)
Corridor Operation Interval
The number of running buses
per 1 hour Bus Capacity Transport
Capacity Road Factor
Min. - Person PPPPD*1 %
1 2.2 27 125 3,375 100
6 3.0 20 85 1,700 100
To North To South To North To SouthCorridor1 2.2 2.2 1.6 1.5Corridor6 3.3 3.0 1.9 1.8
TotalTrans Jakarta
-40-
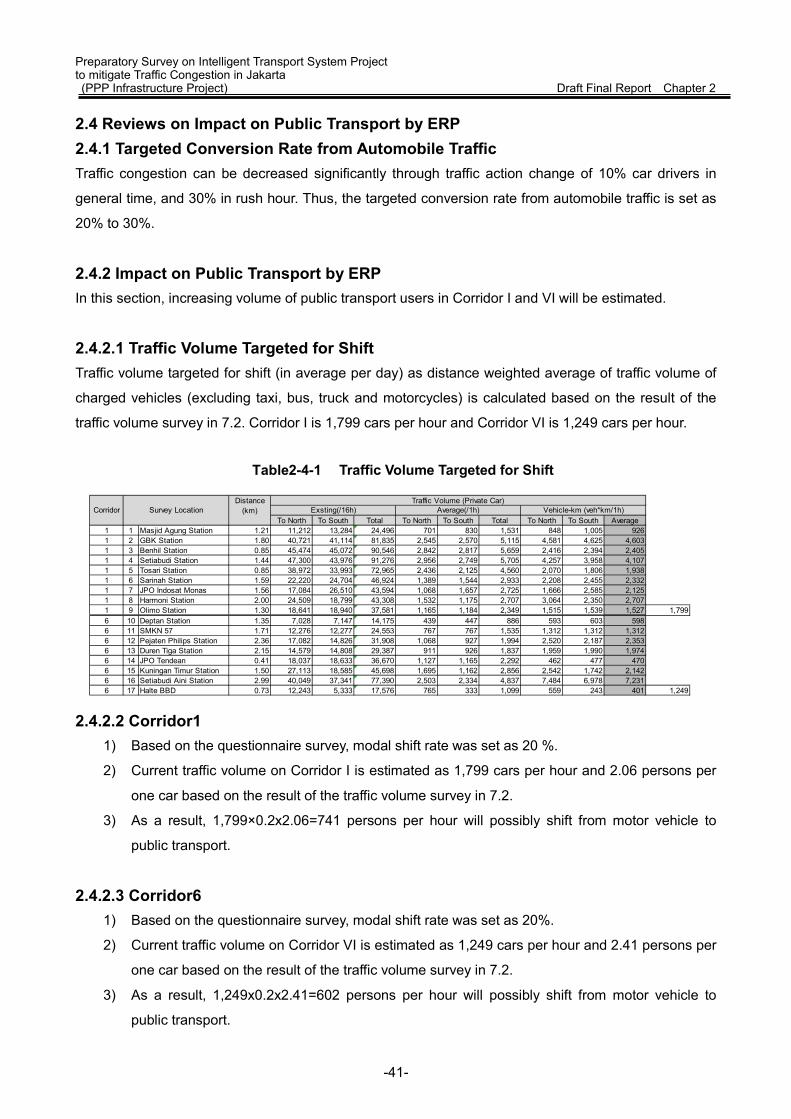
Preparatory Survey on Intelligent Transport System Project to mitigate Traffic Congestion in Jakarta (PPP Infrastructure Project) Draft Final Report Chapter 2 2.4 Reviews on Impact on Public Transport by ERP 2.4.1 Targeted Conversion Rate from Automobile Traffic Traffic congestion can be decreased significantly through traffic action change of 10% car drivers in
general time, and 30% in rush hour. Thus, the targeted conversion rate from automobile traffic is set as
20% to 30%.
2.4.2 Impact on Public Transport by ERP In this section, increasing volume of public transport users in Corridor I and VI will be estimated.
2.4.2.1 Traffic Volume Targeted for Shift Traffic volume targeted for shift (in average per day) as distance weighted average of traffic volume of
charged vehicles (excluding taxi, bus, truck and motorcycles) is calculated based on the result of the
traffic volume survey in 7.2. Corridor I is 1,799 cars per hour and Corridor VI is 1,249 cars per hour.
Table2-4-1 Traffic Volume Targeted for Shift
2.4.2.2 Corridor1 1) Based on the questionnaire survey, modal shift rate was set as 20 %.
2) Current traffic volume on Corridor I is estimated as 1,799 cars per hour and 2.06 persons per
one car based on the result of the traffic volume survey in 7.2.
3) As a result, 1,799×0.2x2.06=741 persons per hour will possibly shift from motor vehicle to
public transport.
2.4.2.3 Corridor6 1) Based on the questionnaire survey, modal shift rate was set as 20%.
2) Current traffic volume on Corridor VI is estimated as 1,249 cars per hour and 2.41 persons per
one car based on the result of the traffic volume survey in 7.2.
3) As a result, 1,249x0.2x2.41=602 persons per hour will possibly shift from motor vehicle to
public transport.
Distance(km)
To North To South Total To North To South Total To North To South Average1 1 Masjid Agung Station 1.21 11,212 13,284 24,496 701 830 1,531 848 1,005 9261 2 GBK Station 1.80 40,721 41,114 81,835 2,545 2,570 5,115 4,581 4,625 4,6031 3 Benhil Station 0.85 45,474 45,072 90,546 2,842 2,817 5,659 2,416 2,394 2,4051 4 Setiabudi Station 1.44 47,300 43,976 91,276 2,956 2,749 5,705 4,257 3,958 4,1071 5 Tosari Station 0.85 38,972 33,993 72,965 2,436 2,125 4,560 2,070 1,806 1,9381 6 Sarinah Station 1.59 22,220 24,704 46,924 1,389 1,544 2,933 2,208 2,455 2,3321 7 JPO Indosat Monas 1.56 17,084 26,510 43,594 1,068 1,657 2,725 1,666 2,585 2,1251 8 Harmoni Station 2.00 24,509 18,799 43,308 1,532 1,175 2,707 3,064 2,350 2,7071 9 Olimo Station 1.30 18,641 18,940 37,581 1,165 1,184 2,349 1,515 1,539 1,527 1,7996 10 Deptan Station 1.35 7,028 7,147 14,175 439 447 886 593 603 5986 11 SMKN 57 1.71 12,276 12,277 24,553 767 767 1,535 1,312 1,312 1,3126 12 Pejaten Philips Station 2.36 17,082 14,826 31,908 1,068 927 1,994 2,520 2,187 2,3536 13 Duren Tiga Station 2.15 14,579 14,808 29,387 911 926 1,837 1,959 1,990 1,9746 14 JPO Tendean 0.41 18,037 18,633 36,670 1,127 1,165 2,292 462 477 4706 15 Kuningan Timur Station 1.50 27,113 18,585 45,698 1,695 1,162 2,856 2,542 1,742 2,1426 16 Setiabudi Aini Station 2.99 40,049 37,341 77,390 2,503 2,334 4,837 7,484 6,978 7,2316 17 Halte BBD 0.73 12,243 5,333 17,576 765 333 1,099 559 243 401 1,249
Corridor Survey LocationTraffic Volume (Private Car)
Exsting(/16h) Average(/1h) Vehicle-km (veh*km/1h)
-41-
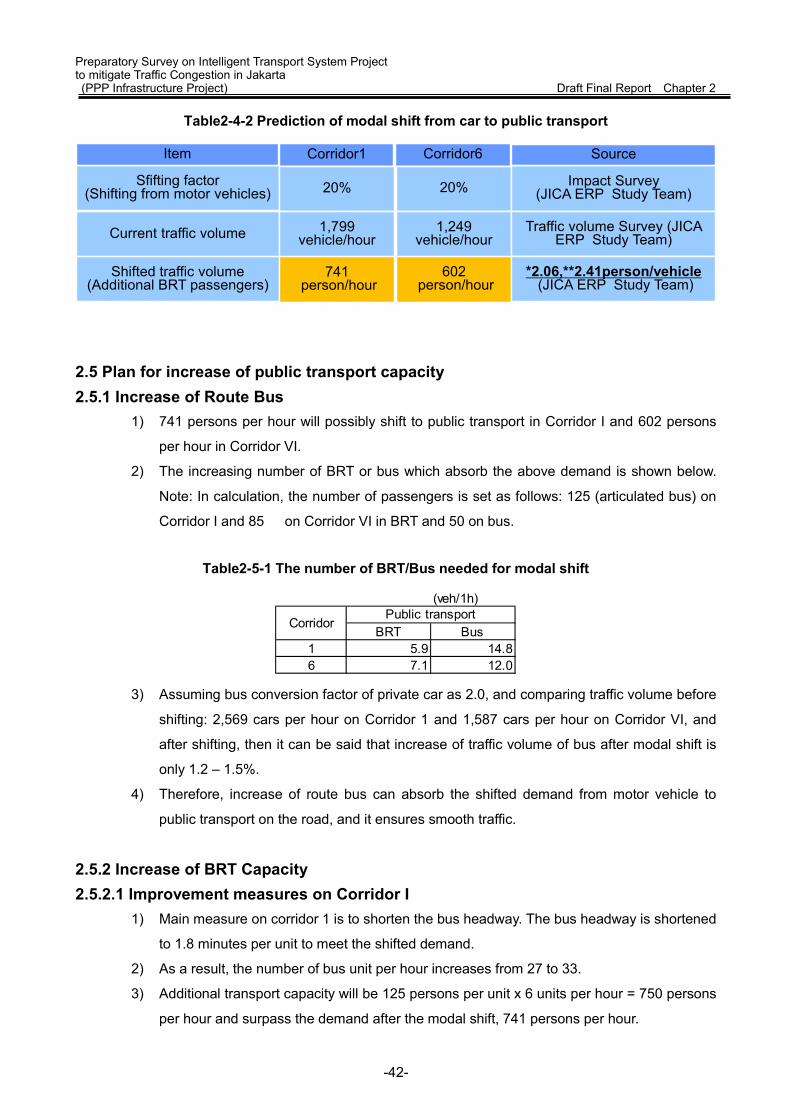
Preparatory Survey on Intelligent Transport System Project to mitigate Traffic Congestion in Jakarta (PPP Infrastructure Project) Draft Final Report Chapter 2
Table2-4-2 Prediction of modal shift from car to public transport
2.5 Plan for increase of public transport capacity 2.5.1 Increase of Route Bus
1) 741 persons per hour will possibly shift to public transport in Corridor I and 602 persons
per hour in Corridor VI.
2) The increasing number of BRT or bus which absorb the above demand is shown below.
Note: In calculation, the number of passengers is set as follows: 125 (articulated bus) on
Corridor I and 85 on Corridor VI in BRT and 50 on bus.
Table2-5-1 The number of BRT/Bus needed for modal shift
3) Assuming bus conversion factor of private car as 2.0, and comparing traffic volume before
shifting: 2,569 cars per hour on Corridor 1 and 1,587 cars per hour on Corridor VI, and
after shifting, then it can be said that increase of traffic volume of bus after modal shift is
only 1.2 – 1.5%.
4) Therefore, increase of route bus can absorb the shifted demand from motor vehicle to
public transport on the road, and it ensures smooth traffic.
2.5.2 Increase of BRT Capacity 2.5.2.1 Improvement measures on Corridor I
1) Main measure on corridor 1 is to shorten the bus headway. The bus headway is shortened
to 1.8 minutes per unit to meet the shifted demand.
2) As a result, the number of bus unit per hour increases from 27 to 33.
3) Additional transport capacity will be 125 persons per unit x 6 units per hour = 750 persons
per hour and surpass the demand after the modal shift, 741 persons per hour.
Sfifting factor(Shifting from motor vehicles)
Current traffic volume
Shifted traffic volume(Additional BRT passengers)
Corridor6Corridor1Item
20% 20%
1,799vehicle/hour
1,249vehicle/hour
741person/hour
602person/hour
Impact Survey(JICA ERP Study Team)
Traffic volume Survey (JICA ERP Study Team)
*2.06,**2.41person/vehicle(JICA ERP Study Team)
Source
(veh/1h)
BRT Bus1 5.9 14.86 7.1 12.0
CorridorPublic transport
-42-
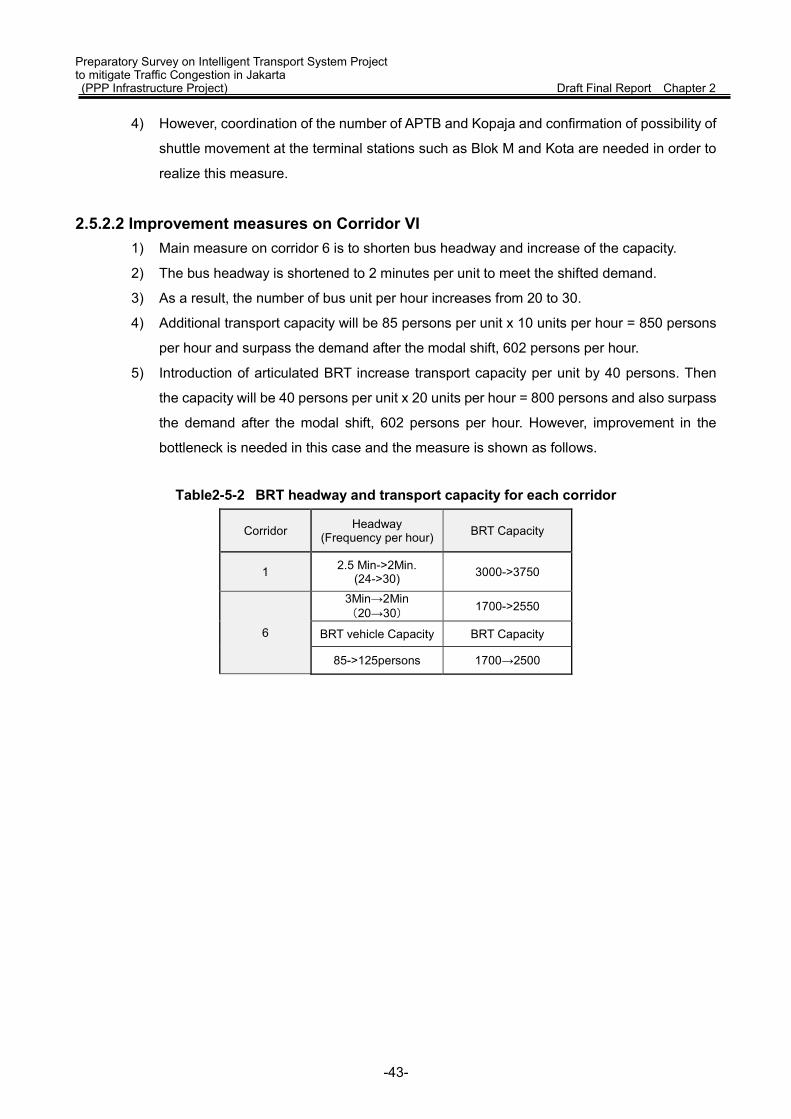
Preparatory Survey on Intelligent Transport System Project to mitigate Traffic Congestion in Jakarta (PPP Infrastructure Project) Draft Final Report Chapter 2
4) However, coordination of the number of APTB and Kopaja and confirmation of possibility of
shuttle movement at the terminal stations such as Blok M and Kota are needed in order to
realize this measure.
2.5.2.2 Improvement measures on Corridor VI 1) Main measure on corridor 6 is to shorten bus headway and increase of the capacity.
2) The bus headway is shortened to 2 minutes per unit to meet the shifted demand.
3) As a result, the number of bus unit per hour increases from 20 to 30.
4) Additional transport capacity will be 85 persons per unit x 10 units per hour = 850 persons
per hour and surpass the demand after the modal shift, 602 persons per hour.
5) Introduction of articulated BRT increase transport capacity per unit by 40 persons. Then
the capacity will be 40 persons per unit x 20 units per hour = 800 persons and also surpass
the demand after the modal shift, 602 persons per hour. However, improvement in the
bottleneck is needed in this case and the measure is shown as follows.
Table2-5-2 BRT headway and transport capacity for each corridor
Corridor Headway (Frequency per hour) BRT Capacity
1 2.5 Min->2Min. (24->30) 3000->3750
6
3Min→2Min (20→30) 1700->2550
BRT vehicle Capacity BRT Capacity
85->125persons 1700→2500
-43-
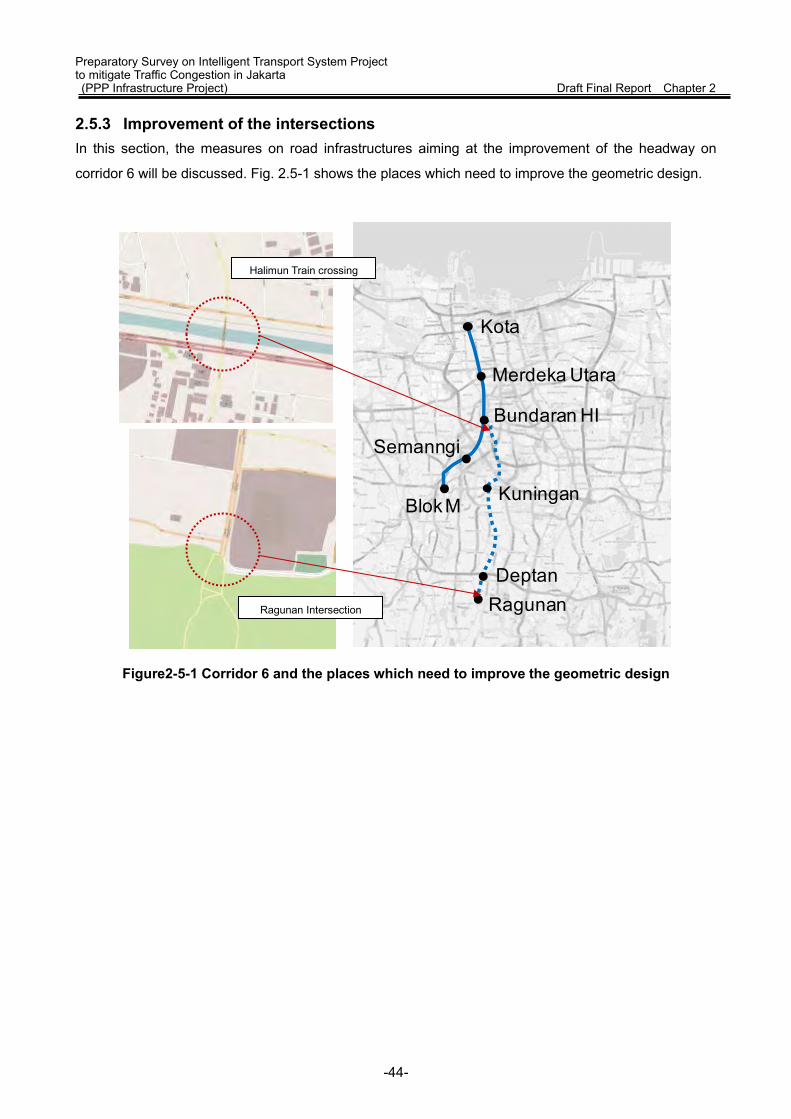
Preparatory Survey on Intelligent Transport System Project to mitigate Traffic Congestion in Jakarta (PPP Infrastructure Project) Draft Final Report Chapter 2 2.5.3 Improvement of the intersections In this section, the measures on road infrastructures aiming at the improvement of the headway on
corridor 6 will be discussed. Fig. 2.5-1 shows the places which need to improve the geometric design.
Figure2-5-1 Corridor 6 and the places which need to improve the geometric design
Kota
Merdeka Utara
Bundaran HI
Kuningan
DeptanRagunan
Blok M
Semanngi
Halimun Train crossing
Ragunan Intersection
-44-

Preparatory Survey on Intelligent Transport System Project to mitigate Traffic Congestion in Jakarta (PPP Infrastructure Project) Draft Final Report Chapter 2 (1) Improvement in Halimun Train crossing
Field survey found that BRT operation diagram is heavily-influenced by Halimun Train crossing. BRT
stopped for up to approximately five minutes and turned around the small intersection. In order to
introduce articulated BRT, the operation route needs to bypass the intersection, or the intersection needs
to be improved.
Figure2-5-2 Conditions in Halimun train crossing
Figure2-5-3 Top view of the train crossing
HalimunTrain crossing
Clliwung River
Galunggung
Bus route
JI.Lauharhari
train
-45-
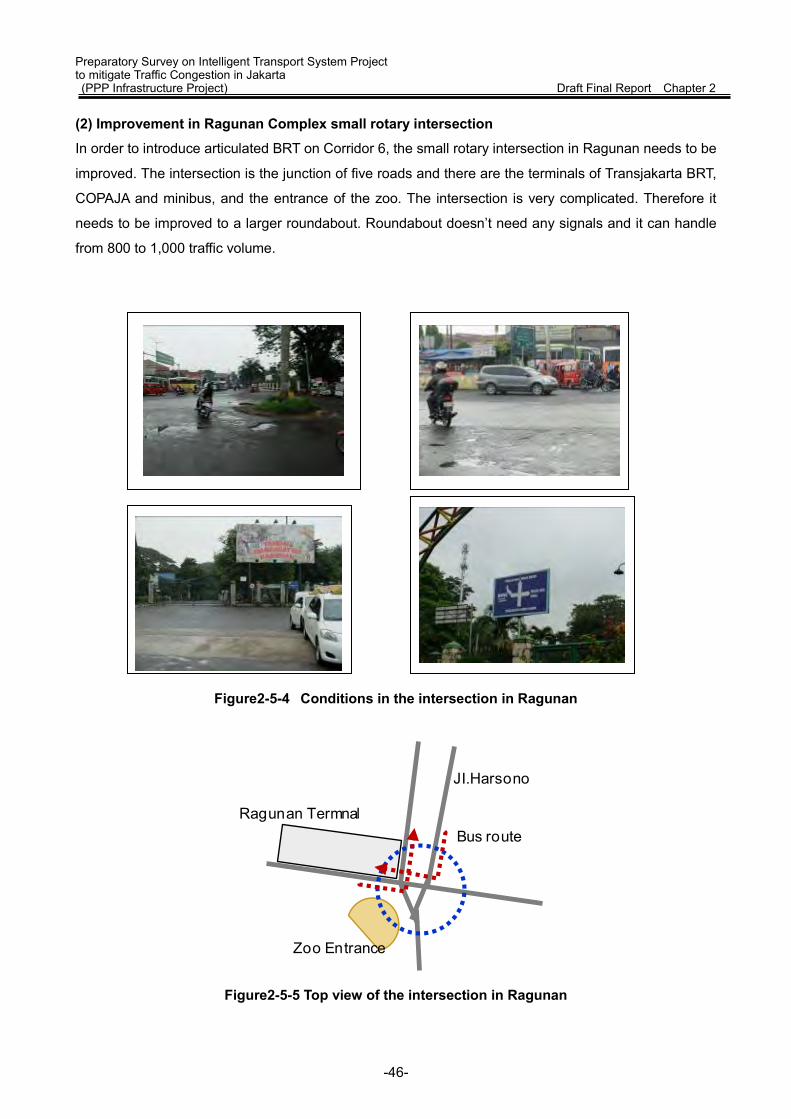
Preparatory Survey on Intelligent Transport System Project to mitigate Traffic Congestion in Jakarta (PPP Infrastructure Project) Draft Final Report Chapter 2 (2) Improvement in Ragunan Complex small rotary intersection
In order to introduce articulated BRT on Corridor 6, the small rotary intersection in Ragunan needs to be
improved. The intersection is the junction of five roads and there are the terminals of Transjakarta BRT,
COPAJA and minibus, and the entrance of the zoo. The intersection is very complicated. Therefore it
needs to be improved to a larger roundabout. Roundabout doesn’t need any signals and it can handle
from 800 to 1,000 traffic volume.
Figure2-5-4 Conditions in the intersection in Ragunan
Figure2-5-5 Top view of the intersection in Ragunan
JI.Harsono
Ragunan Termnal
Zoo Entrance
Bus route
-46-
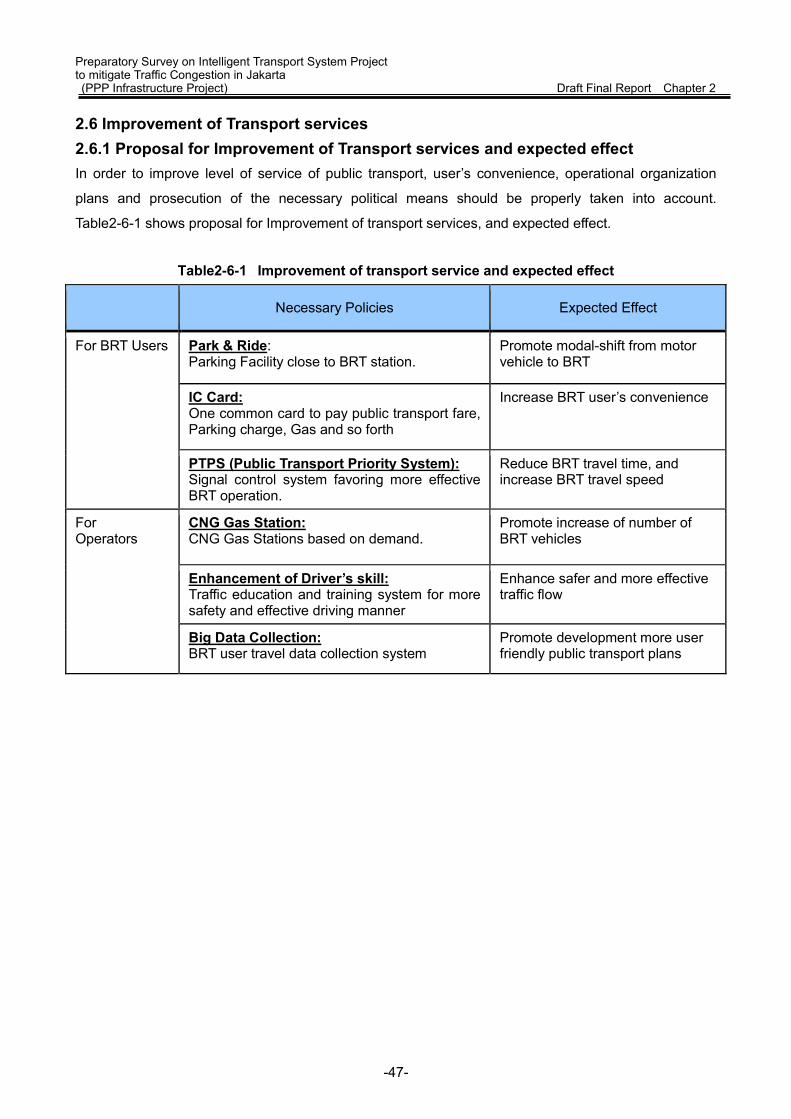
Preparatory Survey on Intelligent Transport System Project to mitigate Traffic Congestion in Jakarta (PPP Infrastructure Project) Draft Final Report Chapter 2 2.6 Improvement of Transport services 2.6.1 Proposal for Improvement of Transport services and expected effect In order to improve level of service of public transport, user’s convenience, operational organization
plans and prosecution of the necessary political means should be properly taken into account.
Table2-6-1 shows proposal for Improvement of transport services, and expected effect.
Table2-6-1 Improvement of transport service and expected effect
Necessary Policies Expected Effect
For BRT Users Park & Ride: Parking Facility close to BRT station.
Promote modal-shift from motor vehicle to BRT
IC Card: One common card to pay public transport fare, Parking charge, Gas and so forth
Increase BRT user’s convenience
PTPS (Public Transport Priority System): Signal control system favoring more effective BRT operation.
Reduce BRT travel time, and increase BRT travel speed
For Operators
CNG Gas Station: CNG Gas Stations based on demand.
Promote increase of number of BRT vehicles
Enhancement of Driver’s skill: Traffic education and training system for more safety and effective driving manner
Enhance safer and more effective traffic flow
Big Data Collection: BRT user travel data collection system
Promote development more user friendly public transport plans
-47-

Preparatory Survey on Intelligent Transport System Project to mitigate Traffic Congestion in Jakarta (PPP Infrastructure Project) Draft Final Report Chapter 2 2.6.2 Park and Ride Facility To promote the modal-shift from the vehicle to public transport, it is necessary to construct more parking
facilities because of the existing facility is insufficient. In this section, the typical parking facility in Jakarta
will be selected. In addition, its desirable condition will be examined, and the possibility of increasing the
number of parking cars will be investigated.
2.6.2.1 The Condition of existing Park and Ride Facility It is needless to say that construction of more parking facilities is necessary for promotion of the
modal-shift from the vehicle to public transport. In addition, park and ride function can contribute to
smooth transfer to BRT. In order to achieve smooth transfer to BRT transport, not only facility but also
the user friendly seamless public transport system should be introduced. The typical park and ride
facilities in Jakarta are listed as follows.
Figure2-6-1 The typical park and ride facilities in Jakarta
2.6.2.2 Survey of Ragunan parking Among the existing parking, one of the most highly used parking facility is Ragunan parking. The
condition of parking passenger usage and facility was surveyed in holidays in the afternoon and
weekday in the morning. The result of survey is as follows.
1) Peak time of BRT operation is AM7:30~AM8:00 at Ragunan Station.
2) Ragunan Parking Facility is full at AM8:00.
3) The structure of Ragunan Parking is made of steel. The parking space on the ground floor is
used for motorcycle, and the 2nd and the 3rd floor is used for car.
4) Some parking spaces are used as private parking space for a long time.
5) Ragunan Parking Facility has enough space on holidays, on the other hand, parking of zoo next
to Ragunan Parking is fully occupied.
Place Type Parking Capacity(PCU)
Kalideres Parking Facility close to BRT station.
90 Lebak Bulus 25 Ragunan 280 Kp.Rambutan 30
-48-

Preparatory Survey on Intelligent Transport System Project to mitigate Traffic Congestion in Jakarta (PPP Infrastructure Project) Draft Final Report Chapter 2
Table2-6-2 Specification of Ragunan parking facility
Type Vehicles Motor-Bike
Floors 2F&3F 1F
Parking Numbers 280 pcu
Figure2-6-2 Condition of Ragunan parking facility
2.6.2.3 Plan for improvement of Ragunan Parking Facility The possibility of increasing the number of parking spaces as park and ride facility will be discussed in
this section. Unit parking space is assumed as 25-30 m2/car for parking on the ground, and 35 m2/car for
steel structure based parking system.
On the basis of the site survey, it was concluded that it is possible to secure the land space 30,000 m2
and to increase 1,000 vehicles parking space by utilizing the existing parking space of the zoo efficiently
and constructing of multistory parking facility.
Corridor 6 has 1,249 cars per hour as the traffic volume targeted for shift based on 2.4.2.1. When 20% of
the volume shifts, 250 cars per hour will be on Corridor 6. Even if all cars for 4 hours (e.g. 6:00-10:00)
park all day, 1,000 vehicles parking space is enough.
-49-
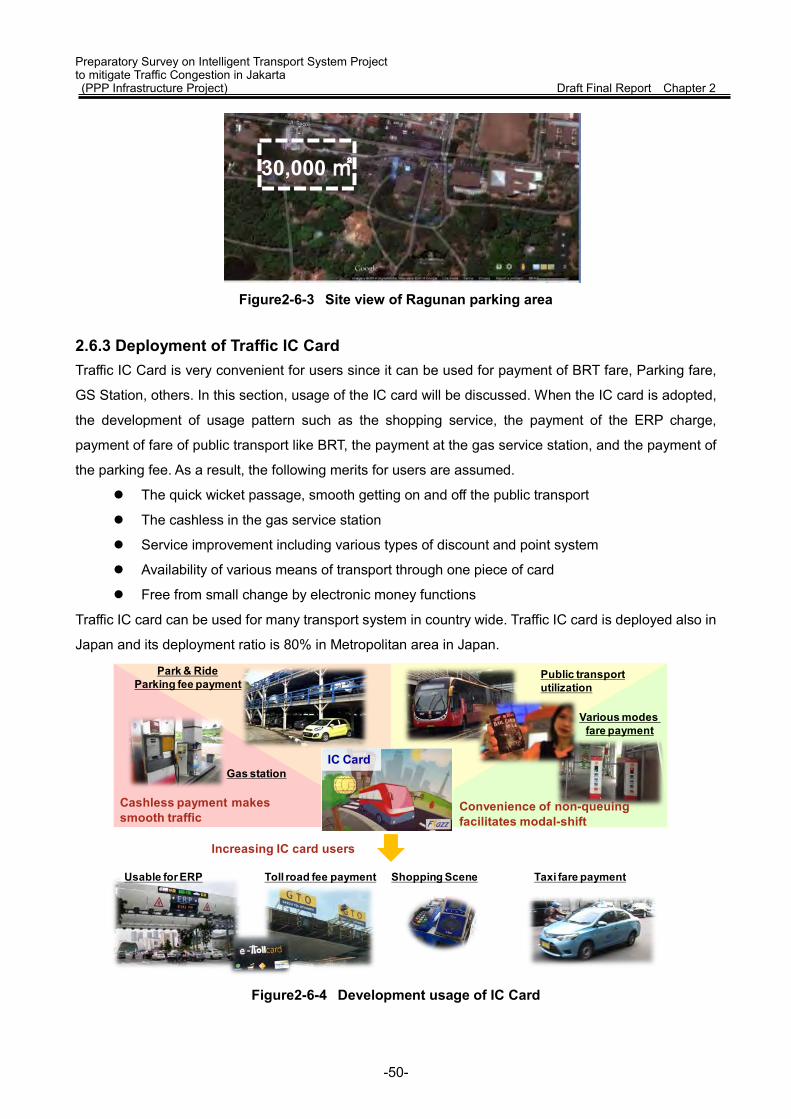
Preparatory Survey on Intelligent Transport System Project to mitigate Traffic Congestion in Jakarta (PPP Infrastructure Project) Draft Final Report Chapter 2
Figure2-6-3 Site view of Ragunan parking area
2.6.3 Deployment of Traffic IC Card Traffic IC Card is very convenient for users since it can be used for payment of BRT fare, Parking fare,
GS Station, others. In this section, usage of the IC card will be discussed. When the IC card is adopted,
the development of usage pattern such as the shopping service, the payment of the ERP charge,
payment of fare of public transport like BRT, the payment at the gas service station, and the payment of
the parking fee. As a result, the following merits for users are assumed.
The quick wicket passage, smooth getting on and off the public transport
The cashless in the gas service station
Service improvement including various types of discount and point system
Availability of various means of transport through one piece of card
Free from small change by electronic money functions
Traffic IC card can be used for many transport system in country wide. Traffic IC card is deployed also in
Japan and its deployment ratio is 80% in Metropolitan area in Japan.
Figure2-6-4 Development usage of IC Card
Various modes fare payment
Taxi fare payment
IC Card
Cashless payment makes smooth traffic
Park & RideParking fee payment
Shopping SceneUsable for ERP Toll road fee payment
Public transport utilization
Convenience of non-queuing facilitates modal-shift
Increasing IC card users
Gas station
30,000 ㎡
-50-

Preparatory Survey on Intelligent Transport System Project to mitigate Traffic Congestion in Jakarta (PPP Infrastructure Project) Draft Final Report Chapter 2 It is possible to collect fare of the public transport by the introduction of the traffic card effectively and
safely, so it is able to accomplish securing of profit surely. The following support policies are thought
about to plan spread of traffic IC cards promotion.
① IC card can be charged anytime at a convenient place;
( such as ticket office of the station, convenience store, shopping center, bank)
② Make a difference, such as discount with a card in cash;
③ The card deposit should be cheap;
④ Both pre-paid and post-paid method should be adopted as a charge system.
E-ticket of BRT is a major traffic IC Card in Jakarta. Since it is collaborated with domestic banks such as
Bank Mandiri, BRI, BCA and BNI, it also can be used as an e-cash card for payment at convenient store,
restaurant and highway. However, the penetration rate was only 20% as of January of 2014 and the
promotion to give a card (20,000 rupiah) for free was conducted in August of 2014 in order to promote.
More promotions (for example, chargeable at bus stop) are still needed in the future.
2.6.4 Signal control and PTPS (Public Transport Priority System) A method to improve the service for the user of the BRT, includes improvement of the scheduled speed
and time of BRT. BRT system does not keep the scheduled speed and time schedule at this time
because of some bottle necks on BRT lane as being described in 2.3.2 section.
The form of the bottleneck part is divided into following two.
① By the signalized Intersection and rotary shaped Intersection;
② By the basic geometric road structure such as shape, placement, and maintenance.
As mentioned above, we describe about ① in this section. As a result of the survey, typical bottle neck
points on BRT lane on corridor1 and Corridor6 are as follows.
-51-
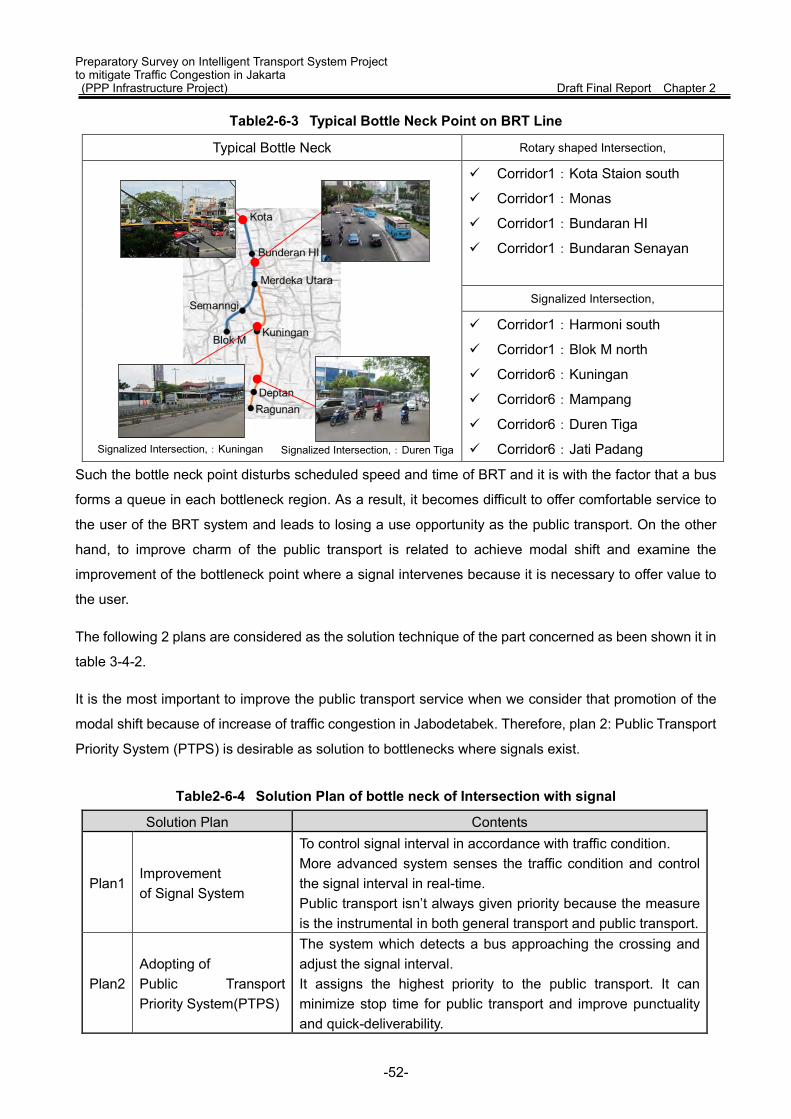
Preparatory Survey on Intelligent Transport System Project to mitigate Traffic Congestion in Jakarta (PPP Infrastructure Project) Draft Final Report Chapter 2
Table2-6-3 Typical Bottle Neck Point on BRT Line
Typical Bottle Neck Rotary shaped Intersection,
Corridor1:Kota Staion south
Corridor1:Monas
Corridor1:Bundaran HI
Corridor1:Bundaran Senayan
Signalized Intersection,
Corridor1:Harmoni south
Corridor1:Blok M north
Corridor6:Kuningan
Corridor6:Mampang
Corridor6:Duren Tiga
Corridor6:Jati Padang
Such the bottle neck point disturbs scheduled speed and time of BRT and it is with the factor that a bus
forms a queue in each bottleneck region. As a result, it becomes difficult to offer comfortable service to
the user of the BRT system and leads to losing a use opportunity as the public transport. On the other
hand, to improve charm of the public transport is related to achieve modal shift and examine the
improvement of the bottleneck point where a signal intervenes because it is necessary to offer value to
the user.
The following 2 plans are considered as the solution technique of the part concerned as been shown it in
table 3-4-2.
It is the most important to improve the public transport service when we consider that promotion of the
modal shift because of increase of traffic congestion in Jabodetabek. Therefore, plan 2: Public Transport
Priority System (PTPS) is desirable as solution to bottlenecks where signals exist.
Table2-6-4 Solution Plan of bottle neck of Intersection with signal
Solution Plan Contents
Plan1 Improvement of Signal System
To control signal interval in accordance with traffic condition. More advanced system senses the traffic condition and control the signal interval in real-time. Public transport isn’t always given priority because the measure is the instrumental in both general transport and public transport.
Plan2 Adopting of Public Transport Priority System(PTPS)
The system which detects a bus approaching the crossing and adjust the signal interval. It assigns the highest priority to the public transport. It can minimize stop time for public transport and improve punctuality and quick-deliverability.
Signalized Intersection,:Kuningan Signalized Intersection,:Duren Tiga
-52-
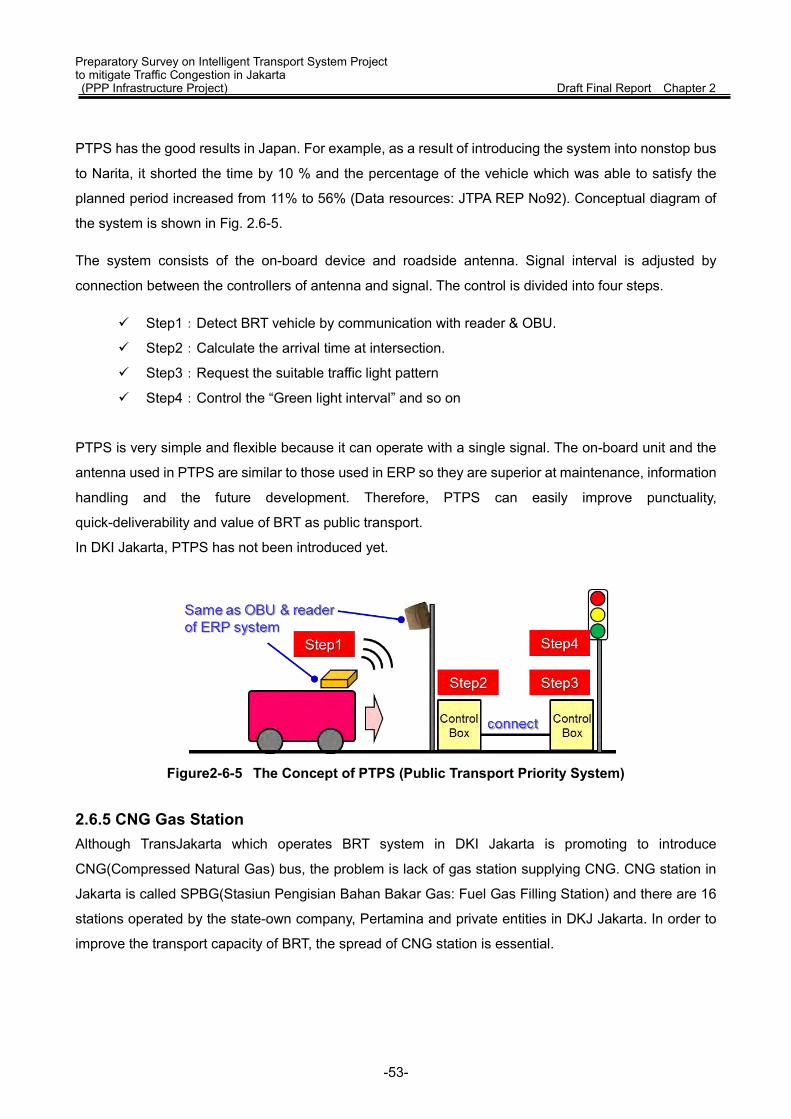
Preparatory Survey on Intelligent Transport System Project to mitigate Traffic Congestion in Jakarta (PPP Infrastructure Project) Draft Final Report Chapter 2
PTPS has the good results in Japan. For example, as a result of introducing the system into nonstop bus
to Narita, it shorted the time by 10 % and the percentage of the vehicle which was able to satisfy the
planned period increased from 11% to 56% (Data resources: JTPA REP No92). Conceptual diagram of
the system is shown in Fig. 2.6-5.
The system consists of the on-board device and roadside antenna. Signal interval is adjusted by
connection between the controllers of antenna and signal. The control is divided into four steps.
Step1:Detect BRT vehicle by communication with reader & OBU.
Step2:Calculate the arrival time at intersection.
Step3:Request the suitable traffic light pattern
Step4:Control the “Green light interval” and so on
PTPS is very simple and flexible because it can operate with a single signal. The on-board unit and the
antenna used in PTPS are similar to those used in ERP so they are superior at maintenance, information
handling and the future development. Therefore, PTPS can easily improve punctuality,
quick-deliverability and value of BRT as public transport.
In DKI Jakarta, PTPS has not been introduced yet.
Figure2-6-5 The Concept of PTPS (Public Transport Priority System)
2.6.5 CNG Gas Station Although TransJakarta which operates BRT system in DKI Jakarta is promoting to introduce
CNG(Compressed Natural Gas) bus, the problem is lack of gas station supplying CNG. CNG station in
Jakarta is called SPBG(Stasiun Pengisian Bahan Bakar Gas: Fuel Gas Filling Station) and there are 16
stations operated by the state-own company, Pertamina and private entities in DKJ Jakarta. In order to
improve the transport capacity of BRT, the spread of CNG station is essential.
-53-

Preparatory Survey on Intelligent Transport System Project to mitigate Traffic Congestion in Jakarta (PPP Infrastructure Project) Draft Final Report Chapter 2
Table 2-6-5 CNG Station in DKI Jakarta (Source: Pertamina website) Location Operator
Jl. Raya Pluit
Pertamina
Jl. Youth Jl. Sunday Market Jl. East Tevet Jl. Sumenep Jl. Margonda Kingdom Jl. Raya Bogor Jl. Wr. Distended Jl. Objects Kalideres Jl. Sudirman Tangerang Jl. Pondok Ungu (PGN)
Private
Jl. Urine (PPD) Jl. Danau Sunter Jl. A. Yani Jl. Daan Jl. Pioneer-Independence
CNG is less hazardous than diesel fuel and Indonesian government recommends CNG as wells as other
countries in the world. Indonesia is one of the major natural gas-producing countries but the spread of
CNG vehicle is behind developing nations such as China and India and the number of CNG gas station
is not much. However, not only providing incentives to businesses introducing CNG vehicles but also
the network construction of gas station is needed since the state-own energy company, Pertamina is
planning major construction of CNG station and increase of CNG vehicle can be expected. Table 2.6-6
shows the number of CNG vehicles and stations in each country of 2013. In India suffering from rapid
increase of traffic volume and traffic congestion as Indonesia, as of 2013, approximately 1.5 million CNG
vehicles are in widespread use with a focus on bus, three-wheeled vehicle and commercial vehicle. 1.47
million out of them are private cars and there are 700 gas stations.
The challenges for the spread of CNG station are shown in Figure 2.6-6. To spread gas stations, active
support from government is essential while cost down of high pressure container is needed. Clear
spread policy and relaxation of regulations, support and incentive based on the policy will promote the
spread of gas station. In “Energy Policy Act of 2005” by U.S. Department of Energy, tax exemption of
30% of installation cost (up to thirty thousand dollar for a major business and up to a thousand dollar for
a household) is provided. Tax credit (50cents per gallon) is also provided to natural gas sellers. In
addition, local government receives grants to promote the shift to public transport. U.S. Department of
Transport also has the same grant program for local governments.
On the other hand, the idea of adopting a diesel engine for BRT can be considered because the spread
of CNG is behind and the grant for gas is reduced. The environmental design of diesel engine is rapidly
improved in recent years and refueling can be done at existing gas stations.
-54-
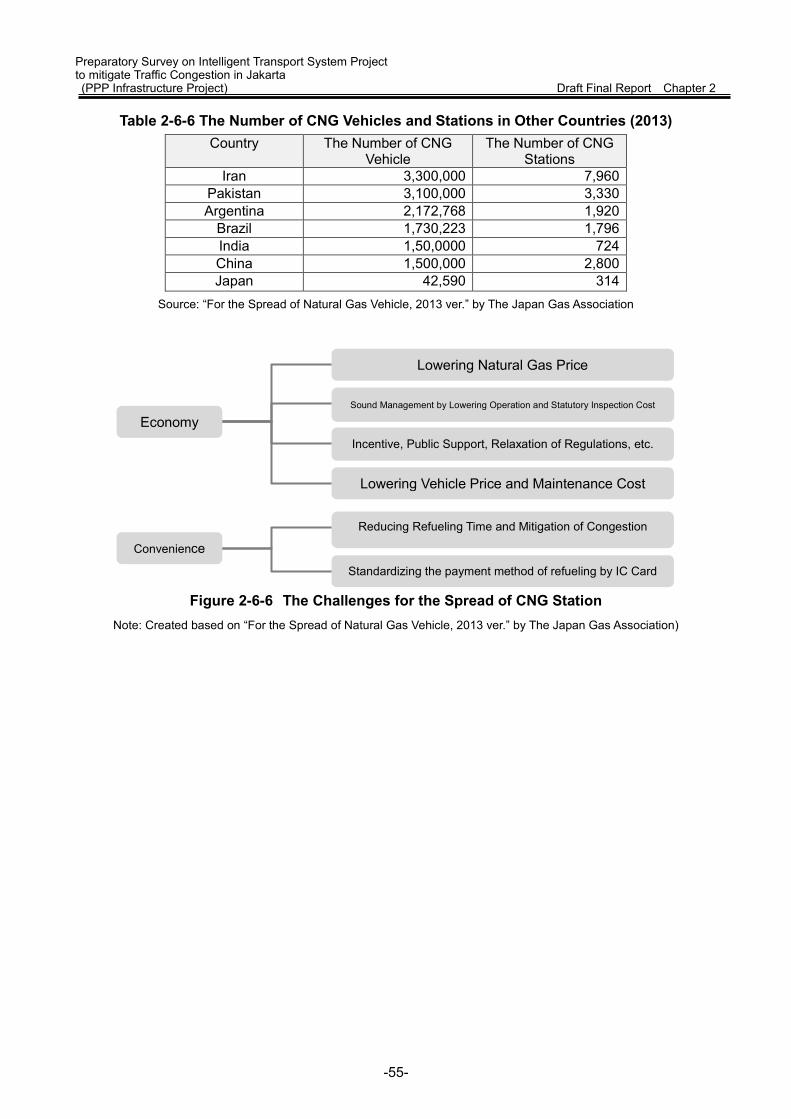
Preparatory Survey on Intelligent Transport System Project to mitigate Traffic Congestion in Jakarta (PPP Infrastructure Project) Draft Final Report Chapter 2
Table 2-6-6 The Number of CNG Vehicles and Stations in Other Countries (2013) Country The Number of CNG
Vehicle The Number of CNG
Stations Iran 3,300,000 7,960
Pakistan 3,100,000 3,330 Argentina 2,172,768 1,920
Brazil 1,730,223 1,796 India 1,50,0000 724 China 1,500,000 2,800 Japan 42,590 314
Source: “For the Spread of Natural Gas Vehicle, 2013 ver.” by The Japan Gas Association
Figure 2-6-6 The Challenges for the Spread of CNG Station
Note: Created based on “For the Spread of Natural Gas Vehicle, 2013 ver.” by The Japan Gas Association)
Lowering Natural Gas Price
Sound Management by Lowering Operation and Statutory Inspection Cost
Incentive, Public Support, Relaxation of Regulations, etc.
Lowering Vehicle Price and Maintenance Cost
Reducing Refueling Time and Mitigation of Congestion
Standardizing the payment method of refueling by IC Card
Economy
Convenience
-55-

Preparatory Survey on Intelligent Transport System Project to mitigate Traffic Congestion in Jakarta (PPP Infrastructure Project) Draft Final Report Chapter 2 2.6.6 Education for Drivers In order to improve the transport capacity of BRT system, not only improvement of infrastructure but also
educational activity for BRT drivers and general drivers driving on the roads around BRT is needed.
Improving the driving skill will realize safe operation and lead to increase of BRT users by improvement
of general service. The education for general drivers and BRT users also relates to safe and efficient
operation of BRT.
Table 2-6-7 Education Policy for Improving BRT Operation
Target Issue / Measure
Business Operators
Drivers
Understanding the items to be observed for safe driving Understanding structural features of vehicle and
pavement surface Improving driving skills such as danger anticipation and
avoidance Understanding physiological and psychological factors
related to safe driving and complete health
management Understanding the items to be paid attention for
security such as door opening/closing and rapid acceleration/deceleration
Understanding the road and traffic situation in operated routes or areas and the points of concern
Managers Understanding the importance of safety climate Establishing safety climate Building a framework of safety management
Users, General Traffic
General Drivers Understanding traffic rules Implementing a measure not to enter the BRT lanes Re-educating elderly drivers
Users Instructing manners on getting on/off and using BRT such as crossing a BRT lane
Pedestrians (specially children and elderly people)
Traffic safety education for young people at educational institutes
Traffic safety education for elderly people
The report of “Examination Committee of Measures to Prevent Human Error Accidents in Public Traffic”
of Ministry of Land, Infrastructure and Transport (April of 2006) noted that 80% of traffic accidents was
caused by human error. There are some definitions of human error. It commonly means interference with
functions of systems and machines despite human’s intentions or skills. The error without his/her intents
is understood as a narrow definition of human error while the intentional action with recognizing risks is
categorized into unsafe action. In most cases, unsafe actions violate regulations defined by business
operators. His/her personality can be one of the causes of unsafe action but it is said that environments
such as residential environment and climate have a lot of influence. In public transport, it’s important to
establish safety a climate giving the highest priority to safety (safety climate) and penetrations such as
in-service education and training are required not to reduce the safety awareness. Establishment of
-56-
Preparatory Survey on Intelligent Transport System Project to mitigate Traffic Congestion in Jakarta (PPP Infrastructure Project) Draft Final Report Chapter 2 safety climate leads not only to prevent intentional unsafe actions but also to prevent the accidents
caused by unintentional action or mitigate the damages. To establish it, everyone from top-level
executives to drivers must understand the “safety management” processing compliance, risk
management and PDCA cycle, build the management system and address it continuously.
Administrative agencies need to loosen the economic restriction while they are required to maintain and
improve the safety regulations. BRT system is operated by single driver and the drivers have a lot of
responsibility for safety during operation. Sometimes the drivers have to drive with private cars so they
are also needed to have high safety awareness and skill. In addition, longer or irregular driving imposes
a heavy burden on the drivers and it can trigger human error. Therefore, establishing safety climate in
overall business operators is desired.
To realize it, the following measures are required: holding of educational seminars and constructing
regularly and continuous educational systems based on the data of occurrence of “sudden break” using
GPS gyro technology.
The Transjakarta BRT system is practicing Bus Tracking System and planning the expansion into the all
lines. The system collects and analyzes the location of the bus by on-board GPS transmitter. The
specific application with a view of operation is to instruct drivers the headway. With a view of user, it can
improve the convenience of BRT by publishing the operating condition on the web. In these ways,
service deployments by using the operating data are being tried. In future, the variety of data will enable
the variety of service.
The information expected to be a new source of data is ticket gate information which is being introduced
into Corridor 1. The problem of the current BRT system is not to have the system which can figure out
the demand of BRT correctly. In general, demand of public transport can be grasped by periodic demand
survey. In case of the city growing rapidly, it is difficult to figure out the public transport demand which
varies with the season and other conditions.
Therefore, it is desirable to collect and analyze the information of ticket gate with IC card being
introduced currently. The information from automatic ticket gate is tied to the behavior of user so you can
figure out the demand correctly with them. As a result, to make a decision of BRT operation is facilitated.
In addition, the behavior of BRT user can be known by collecting OD (Origin-Destination) data and the
operating timetable can be set appropriate to the behavior to user. To figure out the demand in
immediate future is possible by analyzing the informations of environment and surrounding events.
Low utilization ratio of automatic ticket gate is an issue. The field survey on Corridor 1 found that most of
the BRT users buy tickets in window. Automatic ticket gate is not deployed to other lines and users have
few advantages. It is needed to provide incentives to IC card users and promote increase in user of
automatic gate.
-57-

Preparatory Survey on Intelligent Transport System Project to mitigate Traffic Congestion in Jakarta (PPP Infrastructure Project) Draft Final Report Chapter 2 On the other hand, expansion of the information of automatic gate is hoped. OD date can be known by
collecting the information of unloading. Current BRT system is single-price and only the information of
loading is collected. Various public transports like MRT will be operated and mutual use of IC card will be
started. Information of unloading is needed for mutual use of IC card and it is important to introduce
automatic ticket gate which can collect the information of unloading.
Efficient operation and comfortable service for users can be achieved by collecting the behavior of users.
In addition, coordination with existing bus tracking system enhances the information service for users.
Consequently, these can increase the value of BRT system.
Figure2-6-7 Example of Service for Users by big data of BRT
-58-
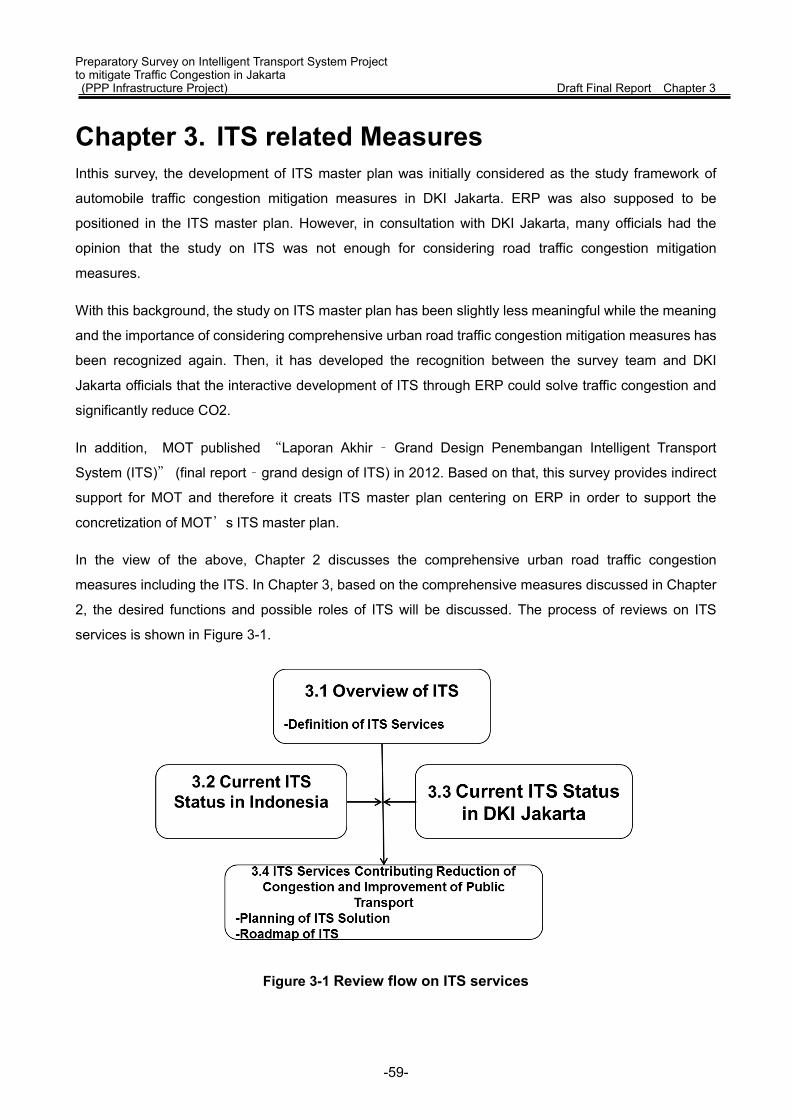
Preparatory Survey on Intelligent Transport System Project to mitigate Traffic Congestion in Jakarta (PPP Infrastructure Project) Draft Final Report Chapter 3
Chapter 3. ITS related Measures Inthis survey, the development of ITS master plan was initially considered as the study framework of
automobile traffic congestion mitigation measures in DKI Jakarta. ERP was also supposed to be
positioned in the ITS master plan. However, in consultation with DKI Jakarta, many officials had the
opinion that the study on ITS was not enough for considering road traffic congestion mitigation
measures.
With this background, the study on ITS master plan has been slightly less meaningful while the meaning
and the importance of considering comprehensive urban road traffic congestion mitigation measures has
been recognized again. Then, it has developed the recognition between the survey team and DKI
Jakarta officials that the interactive development of ITS through ERP could solve traffic congestion and
significantly reduce CO2.
In addition, MOT published “Laporan Akhir – Grand Design Penembangan Intelligent Transport
System (ITS)” (final report – grand design of ITS) in 2012. Based on that, this survey provides indirect
support for MOT and therefore it creats ITS master plan centering on ERP in order to support the
concretization of MOT’s ITS master plan.
In the view of the above, Chapter 2 discusses the comprehensive urban road traffic congestion
measures including the ITS. In Chapter 3, based on the comprehensive measures discussed in Chapter
2, the desired functions and possible roles of ITS will be discussed. The process of reviews on ITS
services is shown in Figure 3-1.
Figure 3-1 Review flow on ITS services
-59-

Preparatory Survey on Intelligent Transport System Project to mitigate Traffic Congestion in Jakarta (PPP Infrastructure Project) Draft Final Report Chapter 3 3.1 Overview of ITS
3.1.1 ITS Services To review ITS services in DKI Jakarta, ITS services need to be categorized into possible types. There
are 9 service sectors in the early stage of ITS in Japan as Table 3-1-1.
In these ITS service sectors, ERP can be positioned as one of comprehensive ITS measures with
utilizing (2) electronic toll collection systems and (4) optimizing traffic management to reduce traffic
congestion. There arealso desired functions and measures such as (6) support for public transportation
and (9) support for emergency vehicle operations at the same time as ERP. In addition, the functin is
expected to bring other function and measures and have majorripple effect.
ERP and the related measures are one of extremely valuable and high-level ITS measures because
those not only resolve traffic congestion but also become a foundation of various ITS services in DKI
Jakarta, Indonesia.
-60-
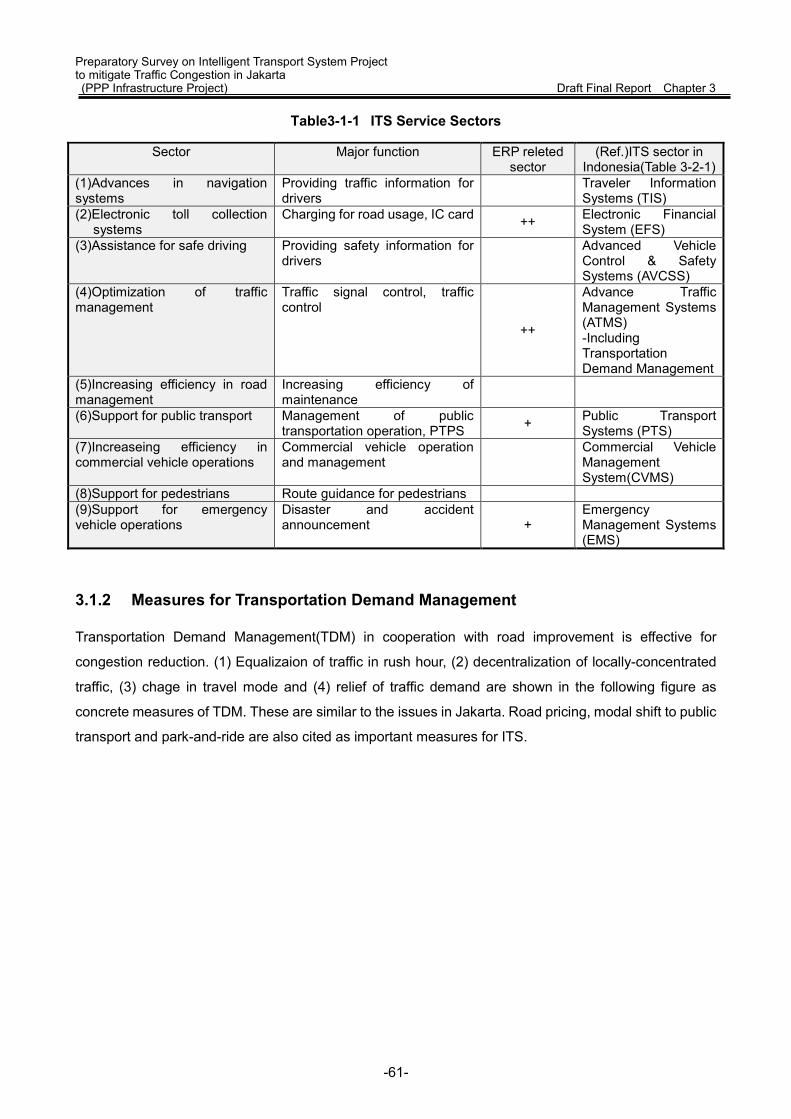
Preparatory Survey on Intelligent Transport System Project to mitigate Traffic Congestion in Jakarta (PPP Infrastructure Project) Draft Final Report Chapter 3
Table3-1-1 ITS Service Sectors
Sector Major function ERP releted sector
(Ref.)ITS sector in Indonesia(Table 3-2-1)
(1)Advances in navigation systems
Providing traffic information for drivers Traveler Information
Systems (TIS) (2)Electronic toll collection
systems Charging for road usage, IC card ++ Electronic Financial
System (EFS) (3)Assistance for safe driving Providing safety information for
drivers Advanced Vehicle Control & Safety Systems (AVCSS)
(4)Optimization of traffic management
Traffic signal control, traffic control
++
Advance Traffic Management Systems (ATMS) -Including Transportation Demand Management
(5)Increasing efficiency in road management
Increasing efficiency of maintenance
(6)Support for public transport Management of public transportation operation, PTPS + Public Transport
Systems (PTS) (7)Increaseing efficiency in commercial vehicle operations
Commercial vehicle operation and management
Commercial Vehicle Management System(CVMS)
(8)Support for pedestrians Route guidance for pedestrians (9)Support for emergency vehicle operations
Disaster and accident announcement +
Emergency Management Systems (EMS)
3.1.2 Measures for Transportation Demand Management
Transportation Demand Management(TDM) in cooperation with road improvement is effective for
congestion reduction. (1) Equalizaion of traffic in rush hour, (2) decentralization of locally-concentrated
traffic, (3) chage in travel mode and (4) relief of traffic demand are shown in the following figure as
concrete measures of TDM. These are similar to the issues in Jakarta. Road pricing, modal shift to public
transport and park-and-ride are also cited as important measures for ITS.
-61-

Preparatory Survey on Intelligent Transport System Project to mitigate Traffic Congestion in Jakarta (PPP Infrastructure Project) Draft Final Report Chapter 3
Figure 3-1-1 Optimum use of road network in Japan Source: Ministry of Land, Infrastructure, Transport and Tourism, Japan
3.2 Current ITS Status in Indonesia
In Indonesia, MOT leads the development of ITS master plan. The following is the brief of“Laporan
Akhir - Grand Design Pengembangan Intelligent Transport System (ITS)”.
3.2.1 Implementation and Function of ITS
Intelligent transportation system (ITS) is an application of information technology and communication on
transportation infrastructure and vehicles as an alternative solution for the growing density problems in
the big cities / metropolitan. The system is applied for controlling and managing the traffic, vehicles
distribution and infrastructure to achieve a safer, more organized and improved transportation system,
and efficiency improvement of the transit system and traffic infrastructure. This system will reduce the
traffic density to more efficient energy use andreduction of greenhouse gas emissions.
ITS can improve the accessibility, efficiency and safety of transportation by identifying the traffic area
through the combination of transportation system with information technology. With the ITS
implementation in Indonesia, every road user will be able to access the road information in real time and
1. Equalizaion of traffic in rush hourRelieve the concentration of traffic in
specified times such as commuter rush and holidays
Traffic jam occurs because of uneven distribution of traffic demand Relief of traffic jam by traffic demand management These measures enable congestion relief in collaboration with road construction
Optimum use of network by traffic demand management
< Outline of traffic demand management >
Staggered shift, flexible-hours Adjustment of working days
2. Decentralization of locally-concentrated traffic
Decentralization of locally-concentrated traffic such as chronic traffic jam in specific roads
3. Chage in travel modeEfforts for modal shift from car
such as promotion of public transport and introduction of park-and-ride
4. Traffic demand reliefEfficient utilization of cars such as
Improvement of Efficiency of logistics
Promotion of public transport andbicycle
Introduction of park-and-ride
Provide information of traffic jam Road pricing
Joint delivery Share-ride
-62-
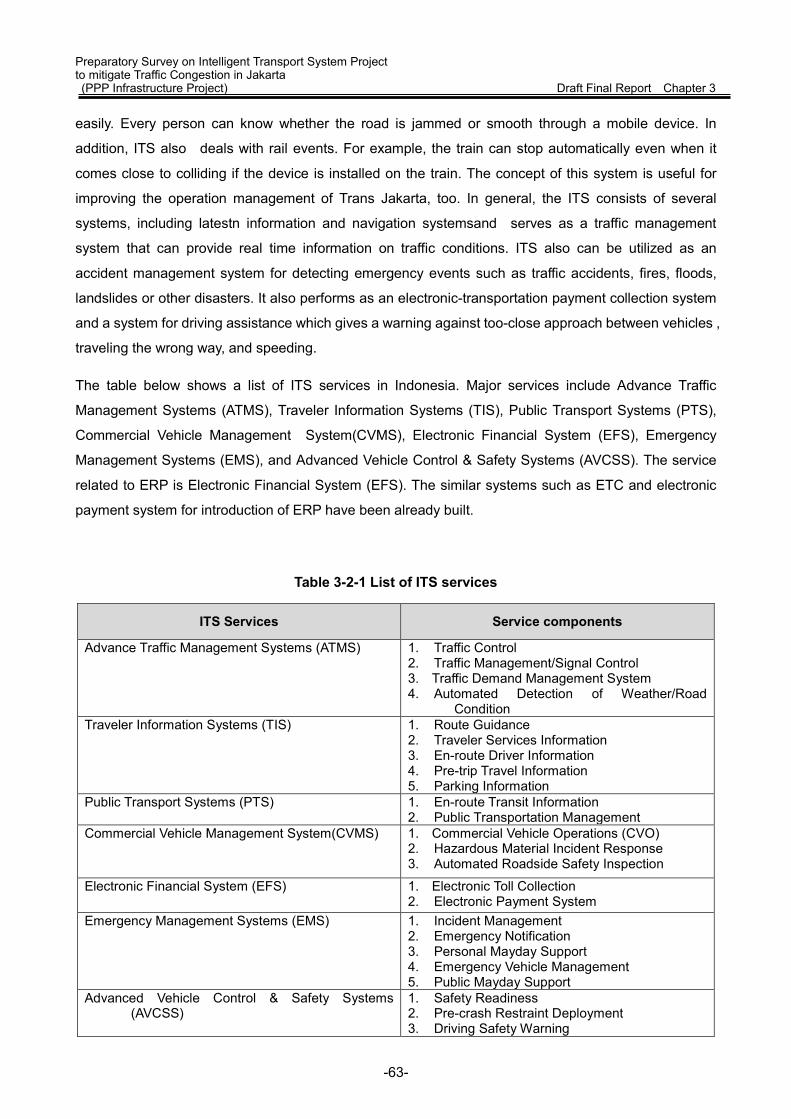
Preparatory Survey on Intelligent Transport System Project to mitigate Traffic Congestion in Jakarta (PPP Infrastructure Project) Draft Final Report Chapter 3 easily. Every person can know whether the road is jammed or smooth through a mobile device. In
addition, ITS also deals with rail events. For example, the train can stop automatically even when it
comes close to colliding if the device is installed on the train. The concept of this system is useful for
improving the operation management of Trans Jakarta, too. In general, the ITS consists of several
systems, including latestn information and navigation systemsand serves as a traffic management
system that can provide real time information on traffic conditions. ITS also can be utilized as an
accident management system for detecting emergency events such as traffic accidents, fires, floods,
landslides or other disasters. It also performs as an electronic-transportation payment collection system
and a system for driving assistance which gives a warning against too-close approach between vehicles ,
traveling the wrong way, and speeding.
The table below shows a list of ITS services in Indonesia. Major services include Advance Traffic
Management Systems (ATMS), Traveler Information Systems (TIS), Public Transport Systems (PTS),
Commercial Vehicle Management System(CVMS), Electronic Financial System (EFS), Emergency
Management Systems (EMS), and Advanced Vehicle Control & Safety Systems (AVCSS). The service
related to ERP is Electronic Financial System (EFS). The similar systems such as ETC and electronic
payment system for introduction of ERP have been already built.
Table 3-2-1 List of ITS services
ITS Services Service components
Advance Traffic Management Systems (ATMS) 1. Traffic Control 2. Traffic Management/Signal Control 3. Traffic Demand Management System 4. Automated Detection of Weather/Road
Condition Traveler Information Systems (TIS) 1. Route Guidance
2. Traveler Services Information 3. En-route Driver Information 4. Pre-trip Travel Information 5. Parking Information
Public Transport Systems (PTS) 1. En-route Transit Information 2. Public Transportation Management
Commercial Vehicle Management System(CVMS)
1. Commercial Vehicle Operations (CVO) 2. Hazardous Material Incident Response 3. Automated Roadside Safety Inspection
Electronic Financial System (EFS) 1. Electronic Toll Collection 2. Electronic Payment System
Emergency Management Systems (EMS) 1. Incident Management 2. Emergency Notification 3. Personal Mayday Support 4. Emergency Vehicle Management 5. Public Mayday Support
Advanced Vehicle Control & Safety Systems (AVCSS)
1. Safety Readiness 2. Pre-crash Restraint Deployment 3. Driving Safety Warning
-63-
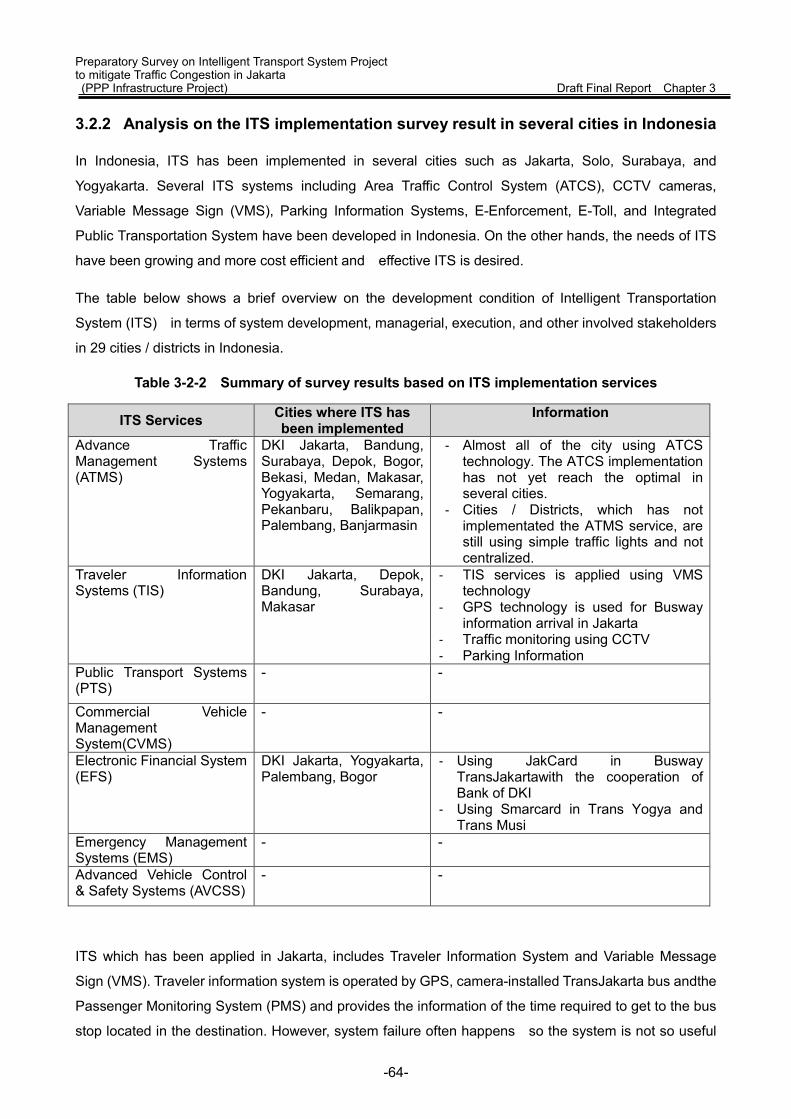
Preparatory Survey on Intelligent Transport System Project to mitigate Traffic Congestion in Jakarta (PPP Infrastructure Project) Draft Final Report Chapter 3 3.2.2 Analysis on the ITS implementation survey result in several cities in Indonesia
In Indonesia, ITS has been implemented in several cities such as Jakarta, Solo, Surabaya, and
Yogyakarta. Several ITS systems including Area Traffic Control System (ATCS), CCTV cameras,
Variable Message Sign (VMS), Parking Information Systems, E-Enforcement, E-Toll, and Integrated
Public Transportation System have been developed in Indonesia. On the other hands, the needs of ITS
have been growing and more cost efficient and effective ITS is desired.
The table below shows a brief overview on the development condition of Intelligent Transportation
System (ITS) in terms of system development, managerial, execution, and other involved stakeholders
in 29 cities / districts in Indonesia.
Table 3-2-2 Summary of survey results based on ITS implementation services
ITS Services Cities where ITS has been implemented
Information
Advance Traffic Management Systems (ATMS)
DKI Jakarta, Bandung, Surabaya, Depok, Bogor, Bekasi, Medan, Makasar, Yogyakarta, Semarang, Pekanbaru, Balikpapan, Palembang, Banjarmasin
- Almost all of the city using ATCS technology. The ATCS implementation has not yet reach the optimal in several cities.
- Cities / Districts, which has not implementated the ATMS service, are still using simple traffic lights and not centralized.
Traveler Information Systems (TIS)
DKI Jakarta, Depok, Bandung, Surabaya, Makasar
- TIS services is applied using VMS technology
- GPS technology is used for Busway information arrival in Jakarta
- Traffic monitoring using CCTV - Parking Information
Public Transport Systems (PTS)
- -
Commercial Vehicle Management System(CVMS)
- -
Electronic Financial System (EFS)
DKI Jakarta, Yogyakarta, Palembang, Bogor
- Using JakCard in Busway TransJakartawith the cooperation of Bank of DKI
- Using Smarcard in Trans Yogya and Trans Musi
Emergency Management Systems (EMS)
- -
Advanced Vehicle Control & Safety Systems (AVCSS)
- -
ITS which has been applied in Jakarta, includes Traveler Information System and Variable Message
Sign (VMS). Traveler information system is operated by GPS, camera-installed TransJakarta bus andthe
Passenger Monitoring System (PMS) and provides the information of the time required to get to the bus
stop located in the destination. However, system failure often happens so the system is not so useful
-64-
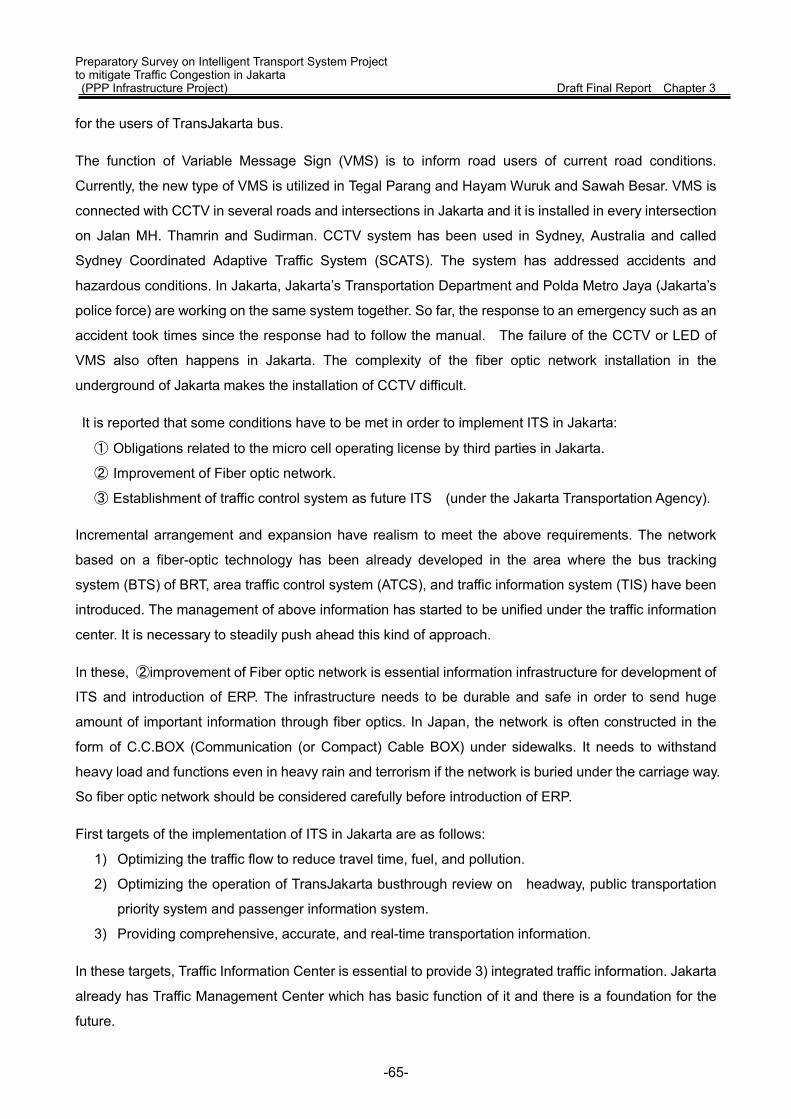
Preparatory Survey on Intelligent Transport System Project to mitigate Traffic Congestion in Jakarta (PPP Infrastructure Project) Draft Final Report Chapter 3 for the users of TransJakarta bus.
The function of Variable Message Sign (VMS) is to inform road users of current road conditions.
Currently, the new type of VMS is utilized in Tegal Parang and Hayam Wuruk and Sawah Besar. VMS is
connected with CCTV in several roads and intersections in Jakarta and it is installed in every intersection
on Jalan MH. Thamrin and Sudirman. CCTV system has been used in Sydney, Australia and called
Sydney Coordinated Adaptive Traffic System (SCATS). The system has addressed accidents and
hazardous conditions. In Jakarta, Jakarta’s Transportation Department and Polda Metro Jaya (Jakarta’s
police force) are working on the same system together. So far, the response to an emergency such as an
accident took times since the response had to follow the manual. The failure of the CCTV or LED of
VMS also often happens in Jakarta. The complexity of the fiber optic network installation in the
underground of Jakarta makes the installation of CCTV difficult.
It is reported that some conditions have to be met in order to implement ITS in Jakarta:
① Obligations related to the micro cell operating license by third parties in Jakarta.
② Improvement of Fiber optic network.
③ Establishment of traffic control system as future ITS (under the Jakarta Transportation Agency).
Incremental arrangement and expansion have realism to meet the above requirements. The network
based on a fiber-optic technology has been already developed in the area where the bus tracking
system (BTS) of BRT, area traffic control system (ATCS), and traffic information system (TIS) have been
introduced. The management of above information has started to be unified under the traffic information
center. It is necessary to steadily push ahead this kind of approach.
In these, ②improvement of Fiber optic network is essential information infrastructure for development of
ITS and introduction of ERP. The infrastructure needs to be durable and safe in order to send huge
amount of important information through fiber optics. In Japan, the network is often constructed in the
form of C.C.BOX (Communication (or Compact) Cable BOX) under sidewalks. It needs to withstand
heavy load and functions even in heavy rain and terrorism if the network is buried under the carriage way.
So fiber optic network should be considered carefully before introduction of ERP.
First targets of the implementation of ITS in Jakarta are as follows:
1) Optimizing the traffic flow to reduce travel time, fuel, and pollution.
2) Optimizing the operation of TransJakarta busthrough review on headway, public transportation
priority system and passenger information system.
3) Providing comprehensive, accurate, and real-time transportation information.
In these targets, Traffic Information Center is essential to provide 3) integrated traffic information. Jakarta
already has Traffic Management Center which has basic function of it and there is a foundation for the
future.
-65-

Preparatory Survey on Intelligent Transport System Project to mitigate Traffic Congestion in Jakarta (PPP Infrastructure Project) Draft Final Report Chapter 3 The figure below is the brief flow of the ITS technology development and expansion schedule based on
“Laporan Akhir - Grand Design Pengembangan Intelligent Transport System (ITS)” created by MOT. In
this concept, evaluation of existing systems will be done in the short term (2013-2015), upgrade and
migration of the system will be in the medium-term (2013-2015) and the extensive introduction of ITS will
be done in the long term (2020-2023).
Table 3-2-3 Stages of technology developement
Source: Summary of “Laporan Akhir - Grand Design Pengembangan Intelligent Transport System”
Activity Short term2013~2015
Medium term2016~2020
Long term2020~2023
REFUNCTIONING STRATEGY
UP-GRADE STRATEGY & MIGRATION
STRATEGY TOWARD TO
THE ITS
Detailed System-Evaluation(Evaluate
the performanceand effectiveness
including theExpanding needs)
Optimization/Refunctioning CC
Communicationnetwork
Homogenization ITS Platform
Preparation Blue-Print ITS(General framework,System Applicationand Architecture)
Migration toward open system(Interoperability software/hardware)
Expansion of control area(Network, detecter, CCTV)
Development of TMSApplication (Bus priority, etc)
Pilot Project ITS(Installation of fieldequipment (limited),
Trial application)
Evaluation of ITS PilotProject
(Technical/effectivenessEvaluation, Selection of
Development(location, type))
ITS Development(full scale)
(Preparation of existingSystems, Field
equipment expansionExtensification on
on-board equipment)
ITS Operationalization(ITS for support trafficManagement, ITS for
public information)
Refurbishment component(controllers, CCTV, detecters)
-66-
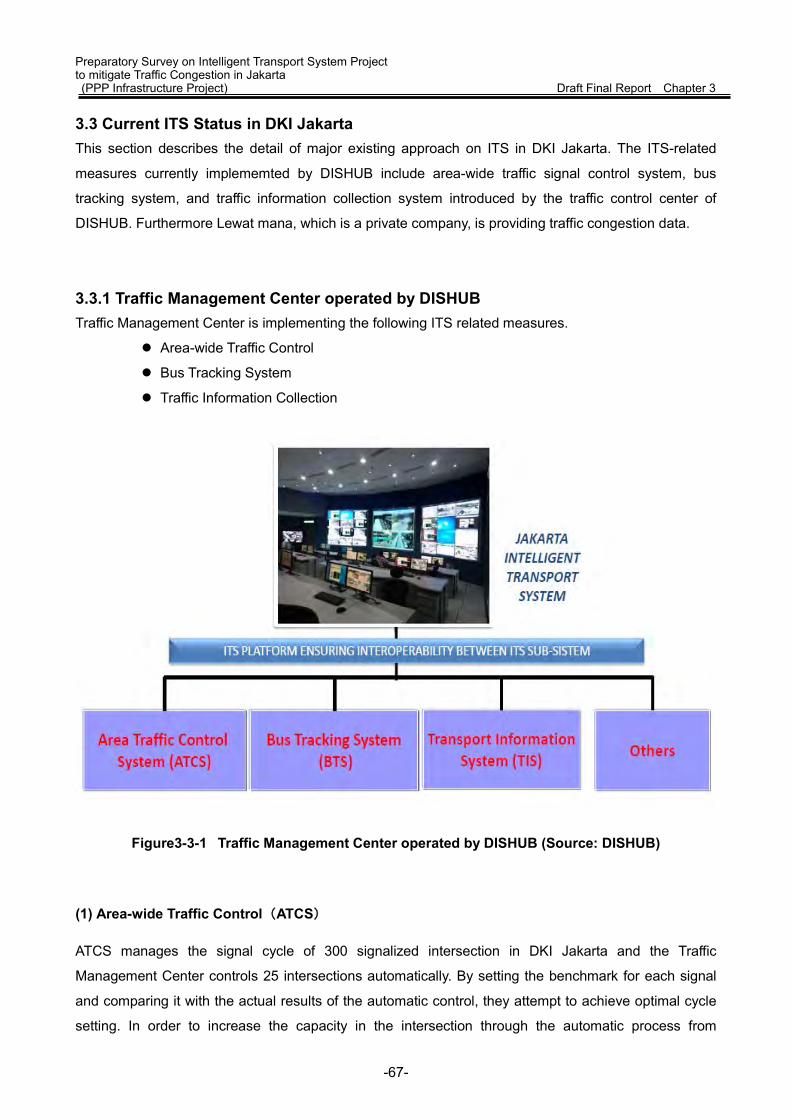
Preparatory Survey on Intelligent Transport System Project to mitigate Traffic Congestion in Jakarta (PPP Infrastructure Project) Draft Final Report Chapter 3 3.3 Current ITS Status in DKI Jakarta This section describes the detail of major existing approach on ITS in DKI Jakarta. The ITS-related
measures currently implememted by DISHUB include area-wide traffic signal control system, bus
tracking system, and traffic information collection system introduced by the traffic control center of
DISHUB. Furthermore Lewat mana, which is a private company, is providing traffic congestion data.
3.3.1 Traffic Management Center operated by DISHUB Traffic Management Center is implementing the following ITS related measures.
Area-wide Traffic Control
Bus Tracking System
Traffic Information Collection
Figure3-3-1 Traffic Management Center operated by DISHUB (Source: DISHUB)
(1) Area-wide Traffic Control(ATCS)
ATCS manages the signal cycle of 300 signalized intersection in DKI Jakarta and the Traffic
Management Center controls 25 intersections automatically. By setting the benchmark for each signal
and comparing it with the actual results of the automatic control, they attempt to achieve optimal cycle
setting. In order to increase the capacity in the intersection through the automatic process from
-67-
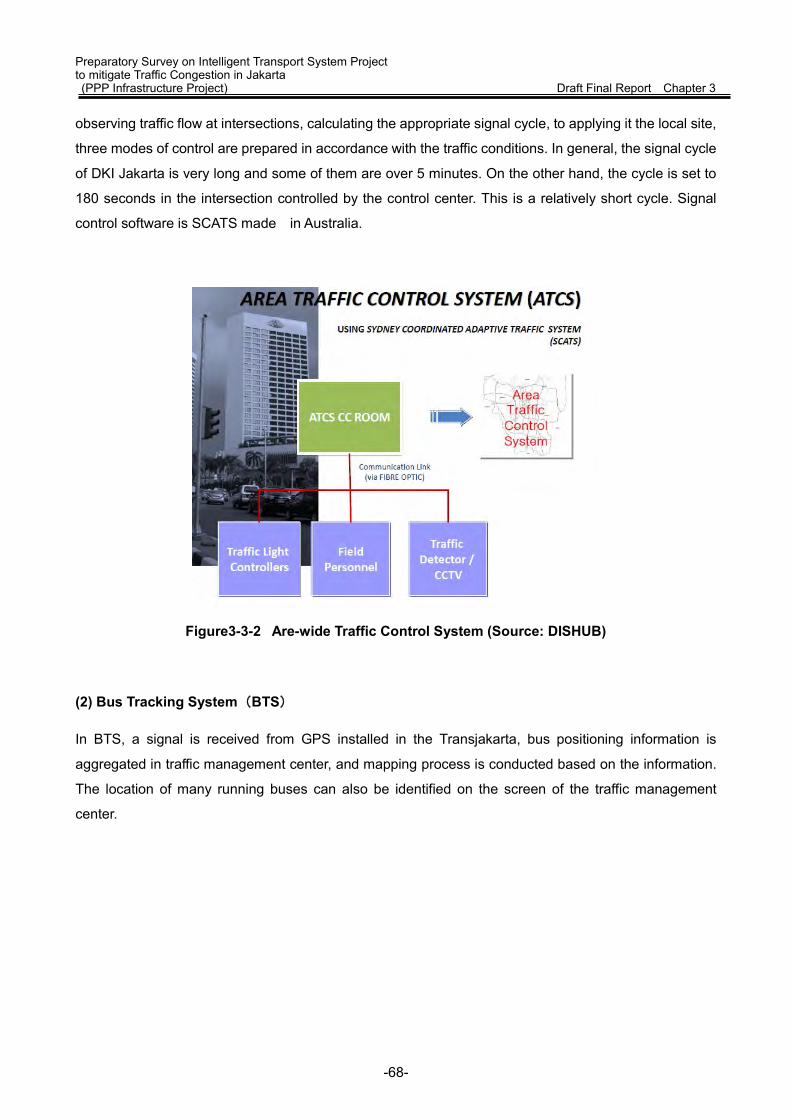
Preparatory Survey on Intelligent Transport System Project to mitigate Traffic Congestion in Jakarta (PPP Infrastructure Project) Draft Final Report Chapter 3 observing traffic flow at intersections, calculating the appropriate signal cycle, to applying it the local site,
three modes of control are prepared in accordance with the traffic conditions. In general, the signal cycle
of DKI Jakarta is very long and some of them are over 5 minutes. On the other hand, the cycle is set to
180 seconds in the intersection controlled by the control center. This is a relatively short cycle. Signal
control software is SCATS made in Australia.
Figure3-3-2 Are-wide Traffic Control System (Source: DISHUB)
(2) Bus Tracking System(BTS)
In BTS, a signal is received from GPS installed in the Transjakarta, bus positioning information is
aggregated in traffic management center, and mapping process is conducted based on the information.
The location of many running buses can also be identified on the screen of the traffic management
center.
-68-
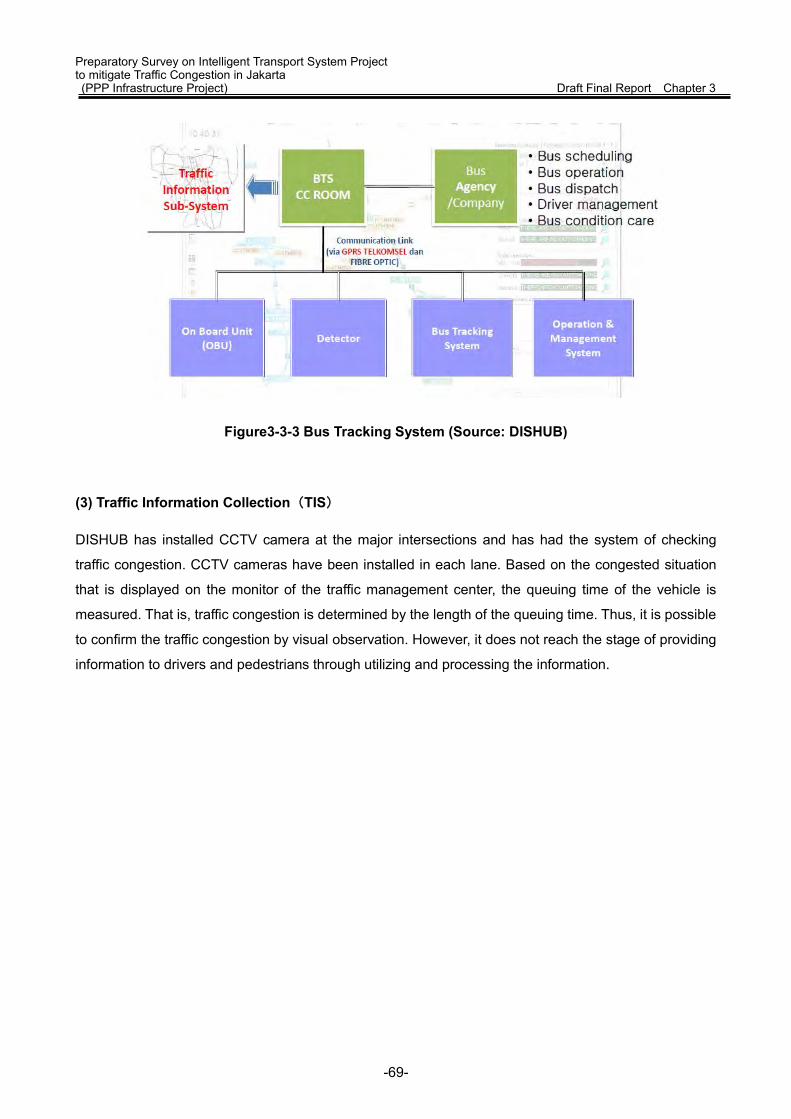
Preparatory Survey on Intelligent Transport System Project to mitigate Traffic Congestion in Jakarta (PPP Infrastructure Project) Draft Final Report Chapter 3
Figure3-3-3 Bus Tracking System (Source: DISHUB)
(3) Traffic Information Collection(TIS)
DISHUB has installed CCTV camera at the major intersections and has had the system of checking
traffic congestion. CCTV cameras have been installed in each lane. Based on the congested situation
that is displayed on the monitor of the traffic management center, the queuing time of the vehicle is
measured. That is, traffic congestion is determined by the length of the queuing time. Thus, it is possible
to confirm the traffic congestion by visual observation. However, it does not reach the stage of providing
information to drivers and pedestrians through utilizing and processing the information.
-69-
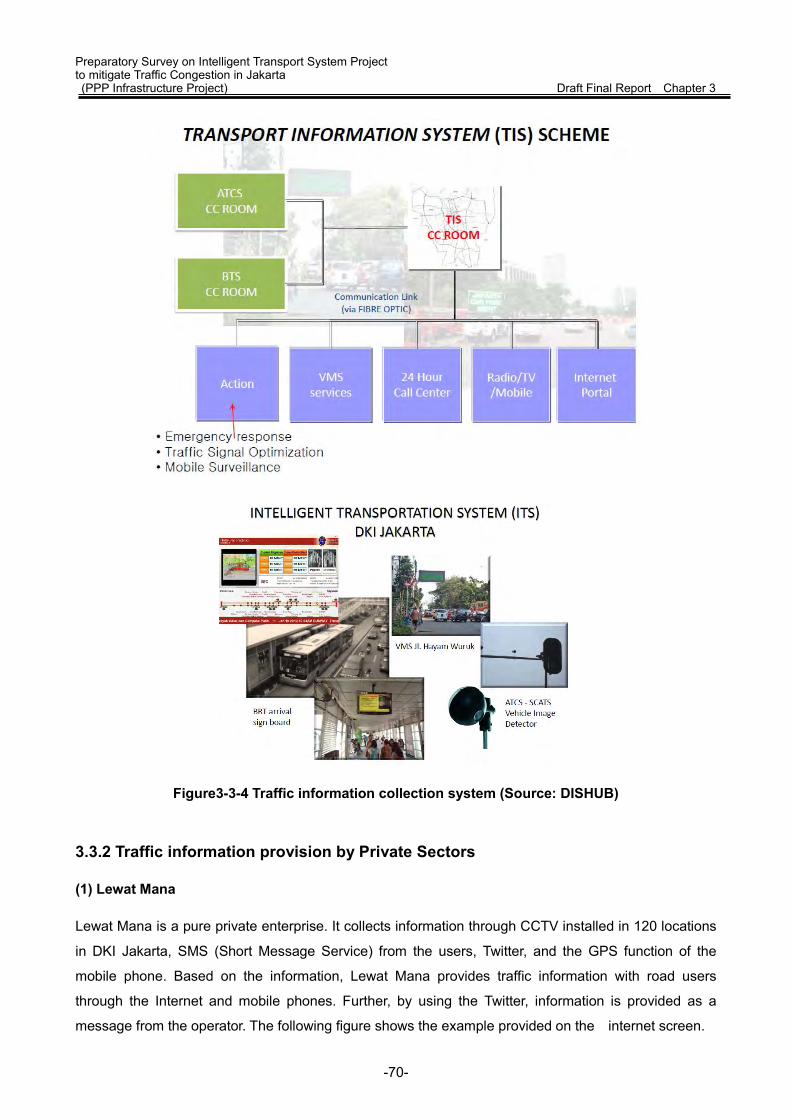
Preparatory Survey on Intelligent Transport System Project to mitigate Traffic Congestion in Jakarta (PPP Infrastructure Project) Draft Final Report Chapter 3
Figure3-3-4 Traffic information collection system (Source: DISHUB)
3.3.2 Traffic information provision by Private Sectors
(1) Lewat Mana
Lewat Mana is a pure private enterprise. It collects information through CCTV installed in 120 locations
in DKI Jakarta, SMS (Short Message Service) from the users, Twitter, and the GPS function of the
mobile phone. Based on the information, Lewat Mana provides traffic information with road users
through the Internet and mobile phones. Further, by using the Twitter, information is provided as a
message from the operator. The following figure shows the example provided on the internet screen.
-70-

Preparatory Survey on Intelligent Transport System Project to mitigate Traffic Congestion in Jakarta (PPP Infrastructure Project) Draft Final Report Chapter 3
Figure3-3-5 Traffic congestion information provided by Lewat Mana (Source: LewatMana.com)
(2) Information Provision using SNS
On the other hand, Bambang Susantono, vice minister of MOT, said that pioneering improvement of
mass transit (MRT, LRT and BRT) in 2020is planned in major cities of Indonesia in the lecture of
“Sustainable Transport in ASEAN: Indonesia Initiatives” at Final Symposium of Study of Long-Term
Transport Action Plan for ASEAN, Tokyo, 20 February 2014.
Additionally, traffic information services utilizing web and smartphone are provided by private companies
in Indonesia. Nebengers.com (http://www.nebengers.com/?page_id=226) is the largest community site
for car-sharing and ride-sharing.
-71-
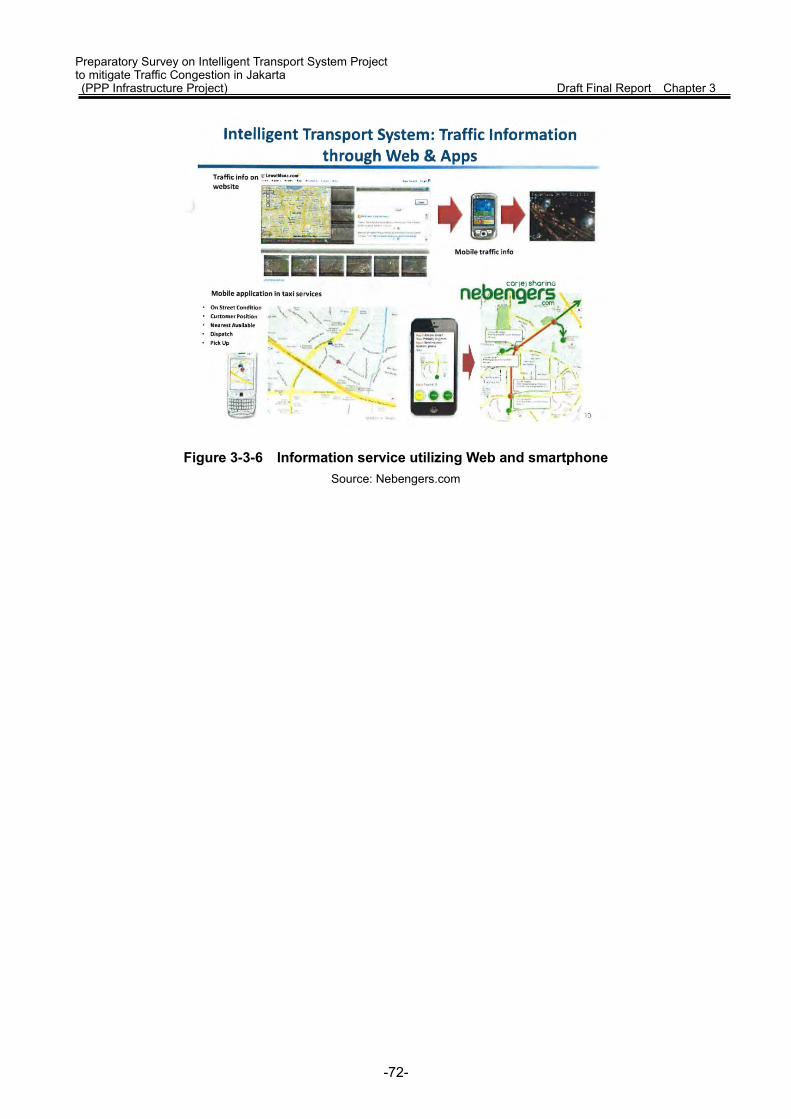
Preparatory Survey on Intelligent Transport System Project to mitigate Traffic Congestion in Jakarta (PPP Infrastructure Project) Draft Final Report Chapter 3
Figure 3-3-6 Information service utilizing Web and smartphone Source: Nebengers.com
-72-
Preparatory Survey on Intelligent Transport System Project to mitigate Traffic Congestion in Jakarta (PPP Infrastructure Project) Draft Final Report Chapter 3 3.4 ITS Services Contributing Reduction of Congestion and Improvement of Public
Transport
3.4.1 Basic Policy of Planning ITS Services
In this section, we describe the basic outlines of ITS items, particularly the services and systems which
are considered to be useful for Indonesia side. The important perspectives in planning are as follows.
(1) Attention on Localization and Sustainability
Though technical support by Japan and other countries is needed during the beginning of
implementation, proactive operation and management by MOT and Jakarta Government is preferable.
Periodic support and technical instruction by system and equipment manufacturers is also imperative but
this point is important when it comes to maintenance.
(2) Emphasis on Local Needs
Based on the result of the field survey, questionnaire and interview with the experts, we select a system
or service with high local needs. A system or service which needs prioritized and focused approach is
mainly considered. From the view of comprehensive problem resolutions, a system that is considered as
an important is also prioritized.
(3) Package Measures to Solve Congestion
To relief congestion, introduction of ITS-related devices and systems brings a major effect only after t
integration of both hardware-side measures such as road infrastructure improvement and
software-side measures such as change of traffic consciousness and education for citizen. It is proved
that in the process of ITS implementation in Japan.
(4) Reflection of Policy of Indonesian and Jakarta Government
Not only relief of congestion aimed by Indonesia and Jakarta Government but also reduction of GHG
emission can be expected as secondary effect.
(5) Adaption to Rapid Advances in Technology
The system needs to be flexible for advances in technology such as smartphone and changes in society
and lifestyle.
(6) Others
The system needs to be flexible for change in city planning, public transport and traffic demand and
replace of devices and systems.
-73-

Preparatory Survey on Intelligent Transport System Project to mitigate Traffic Congestion in Jakarta (PPP Infrastructure Project) Draft Final Report Chapter 3 3.4.2 ITS Solution for Reduction of Congestion
As stated before, various measures related road traffic and ITS are being planned or implemented.
Typical systems implemented by DISHUB include Area Traffic Control System (ATCS), Bus Tracking
System (BTS) and Traffic Information System (TIS).
Services which need realization or more improvement for easing congestion and ITS solutions for which
support from Japan is considered to be effective are described below.
3.4.2.1 Planning of ITS Solution
(1) Collection and Provision of road traffic information
① Integration and management of information
Integrated management of road traffic information is also an issue in Japan. In particular, it is in the
situation that various kinds of traffic information owned by operators and managers in rail and operators,
and police department are not coordinated. In Jakarta, many actions are feasible such as visualization of
traffic flow and information provision for users, improvement of operational management and monitoring
of BRT, share and integration of traffic probe data called Big Data, development of private sectors by
opening traffic data.
② Provision of information and improvement of traffic management center
Although Traffic Management Center operates some traffic control systems in Jakarta currently, more
improvement of functions is needed for the future. Real-time signal control reflecting real-time traffic flow,
traffic prediction information based on weather condition and existing traffic data and variable channeling
in accordance with traffic situations and time zone are desired.
Expansion of Bus tracking system is planned to apply it to all lines in the future. The improvement of
convenience of BRT system is expected through an operational support such as instruction of controlling
headway for bus drivers and a service for users such as provision of operational situation on the
Internet.
(2) Introduction of ERP
ERP’s effect for easing congestion in urban area and promoting modal shift to public transport is clear
from the performance in Singapore and our survey. As stated before, ERP, which was introduced in
Singapore in 1990s, is reliable and now accepted as one of the Singaporean social infrastructures.
-74-

Preparatory Survey on Intelligent Transport System Project to mitigate Traffic Congestion in Jakarta (PPP Infrastructure Project) Draft Final Report Chapter 3 (3) Support for Modal Shift to Public Transport
① Improvement of geometric structure of intersections and traffic signal controllers
Intersections facilitating the smooth travel of BRT, improvement of road geometric structure of BRT
terminal sections and PTSP which prioritizes public transport are effective for promoting modal shift to
public transport. For example, improvement of road marking, installation of pavement lighting system
and introduction of roundabout can be considered.
② Introduction of Transport IC Card
Transport IC card is available for payment of BRT, parking and refueling so it is very convenient for road
users. For operators, it not only functions as reliable fee collection but also collects user information. It
leads accurate project planning and provision of high quality service.
(4) Construction and implementation of traffic education system
Regardless of introduction of high-technology systems, education is important soft measure for
realization of reliable operation of BRT drivers. Education for drivers of passenger cars and mini-bus
who can influence on BRT operation is also necessary.
Figure 3-4-1 Introduction of ERP and its effects
Introduction of ERP
⑤Increase of traffic signals
and improvem
ent of controller
④improvement of BRT operation
ITS Service
Easingcongestion
Reduction of timeSpent to commute
①Integration of road
traffic informatio
ns
⑥Introducti
on of transport IC card
②Promotion of traffic demand
management
⑦Promotion of traffic
education
Effect
③Automatic
number plate
recognition
Reduction of CO2Modal shift to
Public Transport
Revitalization of theEconomy in Jakarta
-75-
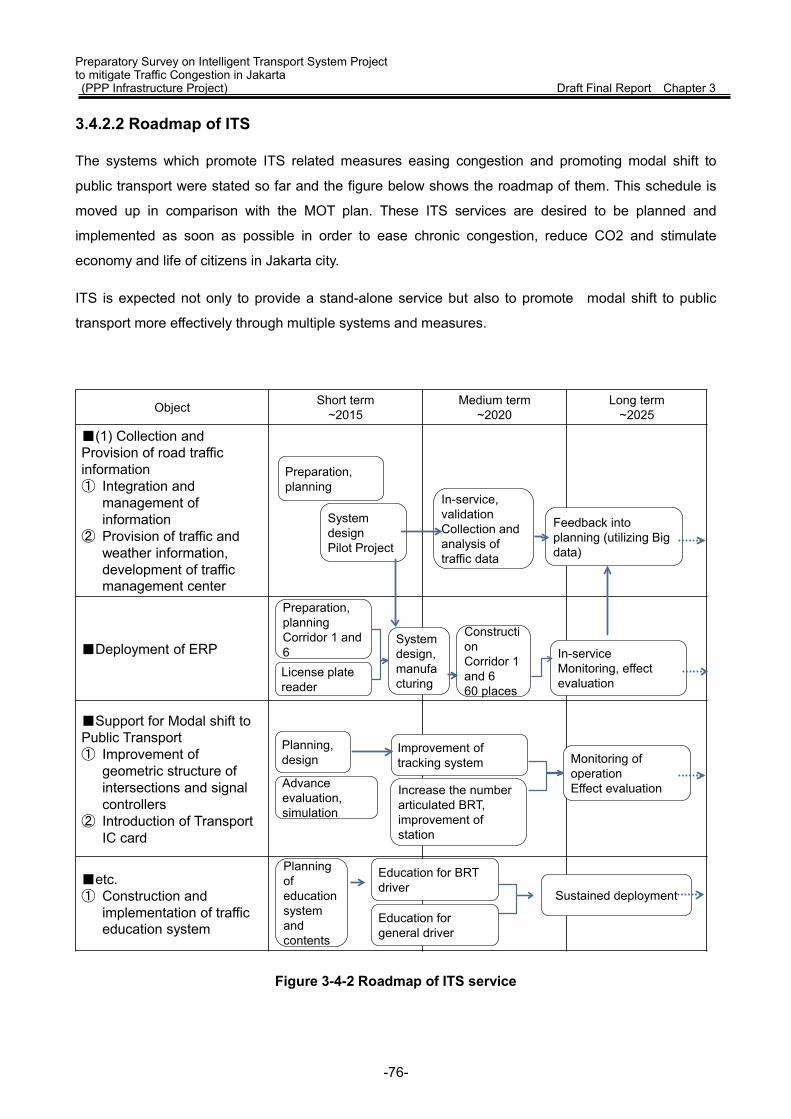
Preparatory Survey on Intelligent Transport System Project to mitigate Traffic Congestion in Jakarta (PPP Infrastructure Project) Draft Final Report Chapter 3 3.4.2.2 Roadmap of ITS
The systems which promote ITS related measures easing congestion and promoting modal shift to
public transport were stated so far and the figure below shows the roadmap of them. This schedule is
moved up in comparison with the MOT plan. These ITS services are desired to be planned and
implemented as soon as possible in order to ease chronic congestion, reduce CO2 and stimulate
economy and life of citizens in Jakarta city.
ITS is expected not only to provide a stand-alone service but also to promote modal shift to public
transport more effectively through multiple systems and measures.
Figure 3-4-2 Roadmap of ITS service
Object Short term~2015
Medium term~2020
Long term~2025
■(1) Collection and Provision of road traffic information① Integration and
management of information
② Provision of traffic and weather information, development of traffic management center
■Deployment of ERP
■Support for Modal shift to Public Transport① Improvement of
geometric structure of intersections and signalcontrollers
② Introduction of Transport IC card
■etc.① Construction and
implementation of traffic education system
Preparation, planning
System designPilot Project
Preparation, planningCorridor 1 and 6
In-service, validationCollection and analysis of traffic data
System design, manufacturing
In-serviceMonitoring, effect evaluation
Feedback into planning (utilizing Big data)
Planning, design
Advance evaluation, simulation
Improvement of tracking system
Planning of education system and contents
Education for BRT driver
Increase the number articulated BRT, improvement of station
Monitoring of operationEffect evaluation
Education for general driver
Sustained deployment
ConstructionCorridor 1 and 660 places
License plate reader
-76-

Preparatory Survey on Intelligent Transport System Project to mitigate Traffic Congestion in Jakarta (PPP Infrastructure Project) Draft Final Report Chapter 3 3.4.2.3 Importance of pioneering introduction of ERP
While we suggested various ITS services, introduction of ERP is considered to contribute directly and
effectively to ease traffic congestion in urban area of Jakarta.
The figure below shows the outline of modal shift to public transportation and change in traffic volume of
vehicle flowing into the urban area. There are three steps in modal shift to public transport: improvement
of BRT (optimization of TransJakarta operation), introduction of ERP and introduction of MRT. Although
multiple utilization of ITS measures is desired for realization of targeted user services, introduction of
ERP is the most effective measure of ITS which realizes the Jakarta’s goal of easing traffic congestion
and early implementation is desired.
MRT improvement is also expected as a measure for mass transit but it needs much cost and time. ERP
is a light infrastructure comparatively and expected as a measure realizing the revitalization of local
economy and improvement of quality of life.
Figure 3-4-3 Outline of ITS approach and introduction of ERP (drawn up by JICA)
Introduction of ERP
Improvement of signals and controllers
Improvement of BRT
User Service
Easing traffic congestionin center area
Revitalization oflocal economy
Reduction of CO2
Improvement ofconvenience
of public transport
Improvement of geometric structure in intersections
Integration of road traffic information
Introduction of Transport IC card
Promotion of traffic demand management
Promotion of traffic education
Improvement in quality of life
ITSRelated
measures
Improvement of BRT
Introduction of ERP Introduction
of MRT
Enhancement of ITS
Time
Reduction of Congestion
Improving the function of public transport
-77-

Preparatory Survey on Intelligent Transport System Project to mitigate Traffic Congestion in Jakarta (PPP Infrastructure Project) Interim Report Chapter 4
Chapter 4. Review of the Legal Framework 4.1 Legal Structure for ERP Project Implementation
Major legal structure for ERP project implementation is shown as the figure below.
The legal system for ERP project implementation can be categorized into 5 groups: road traffic, retribution,
local government, project scheme and others (spatial planning, environment, information communication). For
ERP implementation, PP (Government Regulation) 32/2011 on road traffic management and PP 97/2012 on
Traffic Control Retribution are the key regulations in the legal structure.
Figure4-1-1 Legal Structure for ERP (1/2) Source: Created by JICA ERP Study Team
-78-

Preparatory Survey on Intelligent Transport System Project to mitigate Traffic Congestion in Jakarta (PPP Infrastructure Project) Interim Report Chapter 4
For project scheme, ERP project is not included in the scope of PPP in Presidential Regulation 67 of 2005
(partially amended by Presidential Regulation 13/2010, 56/2011, and 66/2013) for PPP infrastructure of
Indonesian central government. Thus, ERP project scheme has to be reviewed based on regulations of regional
partnership project of local government such as widely applicable PP50/2007 (See 4.4).
Figure4-1-2 Legal Structure for ERP (2/2) Source: Created by JICA ERP Study Team
Table4-1-1 Summary of Related Laws
Category Law Type Competent Authority
Regulation # Title Summary Enacted
Date Remarks
1. Road Traffic Law
Central Government, Regional Government, and National Police
UU22/2009
Traffic and Road Transportation
This law regulates to develop and implement secure, safe, orderly, and smooth traffic and road transportation. The regulation of traffic and road transportation is through the activity of moving vehicles, people, and/or goods on the road; activity of using facilities, infrastructure, and supporting traffic and road transportation facilities; and activity in relation with the registration and identification of motor vehicles with its driver, traffic education, traffic management and engineering, and traffic and road transportation law enforcement. In terms of ERP, it stipulates the basic rights and obligations of traffic and road transportation users such as the duties of the government in managing the traffic and roads and the obligations of the road users to abide by the law.
2009/6/22 -
Central Government and Regional Government
UU38/2004 Road
This law regulates the implementation of the regulation, development, construction, and monitoring of public road; regulation, development, concession and monitoring of toll road; and special roads. The regulation of road is through the classification of it from its function and status. In terms of ERP, it stipulates the basic legal framework of the construction of
2004/10/18 -
-79-

Preparatory Survey on Intelligent Transport System Project to mitigate Traffic Congestion in Jakarta (PPP Infrastructure Project) Interim Report Chapter 4 Category Law Type Competent
Authority Regulation
# Title Summary Enacted Date Remarks
supplementary equipments/accessories of roads and it provides criminal sanctions on the destruction or hindrance of road.
Government Regulation or Minister Regulation
Minister of Transportation, Head of National Police, Governor, and Regent/Mayor
PP32/2011
Traffic Demand Management
In view of UU22/2009, this law stipulates the responsibility of relevant government/regional body and implementation policy on the management and engineering, impact analysis and traffic demand management for the purpose of optimizing the road network, improving the safety and smoothness of traffic and road transportation. In terms of ERP, it prescribes that traffic restriction on individual vehicle and restrictions on goods vehicles can be done by imposition of traffic control retribution, but also prescribes essential points for implementation of traffic control retribution including minimum criteria, applicable class of road, purpose of utilization of income from traffic control retribution.
2011/6/21 -
Minister of Transportation, and Governor
PP55/2012 Vehicle
This regulation stipulates the classification of vehicle based on its function and type; the technical requirements of road vehicles; regulation on motor vehicle testing.
2013/5/23 -
Minister of Transportation, Provincial Head of Road Traffic and Transportation Facilities and Infrastructure, Regency Head of Road Traffic and Transportation Facilities and Infrastructure, and National Police
PP80/2012
Motor Vehicle Inspection and the Prosecution of Road Traffic and Transportation Violation Procedure
This regulation prescribes the procedure of inspecting motor vehicle on the road and the procedure of the enforcement of traffic and road transportation violation.
2012/10/15 -
National Police and National Police Traffic Corps
Indonesian Police Regulation 5/2012
Registration and Identification of Motor Vehicle
This regulation states the system management of registration and identification of motor vehicles; the implementation of registration and identification of motor vehicles; the registration and identification of the ownership of motor vehicle. In terms of ERP, this regulation would set as the legal framework to classify the vehicles as object of ERP charge.
2012/10/1 -
Regional Regulation of DKI Jakarta
Governor, City Transportation Board, and Head of Transportation Unit
PD12/2003
Road, Train, River and Lake Traffic
This regulation states the types, elements and requirements of the Facilities and Infrastructure of Road Transportation; Train Transportation Facilities; River, Lake, and Crossings Transportation; the types, elements; the requirements for drivers on the road; the framework, elements and requirements of the traffic of Road and Train; the types, requirements of Road Transportation, Train Transportation, and River, Lake, and Crossings Transportation; the requirement of the facilities for the disabled and ill people, traffic impact analysis, retribution, information and statistic system, monitoring and control, criminal sanctions; and investigation.
2003/11/13 as has been amended by PD5/2014
-80-
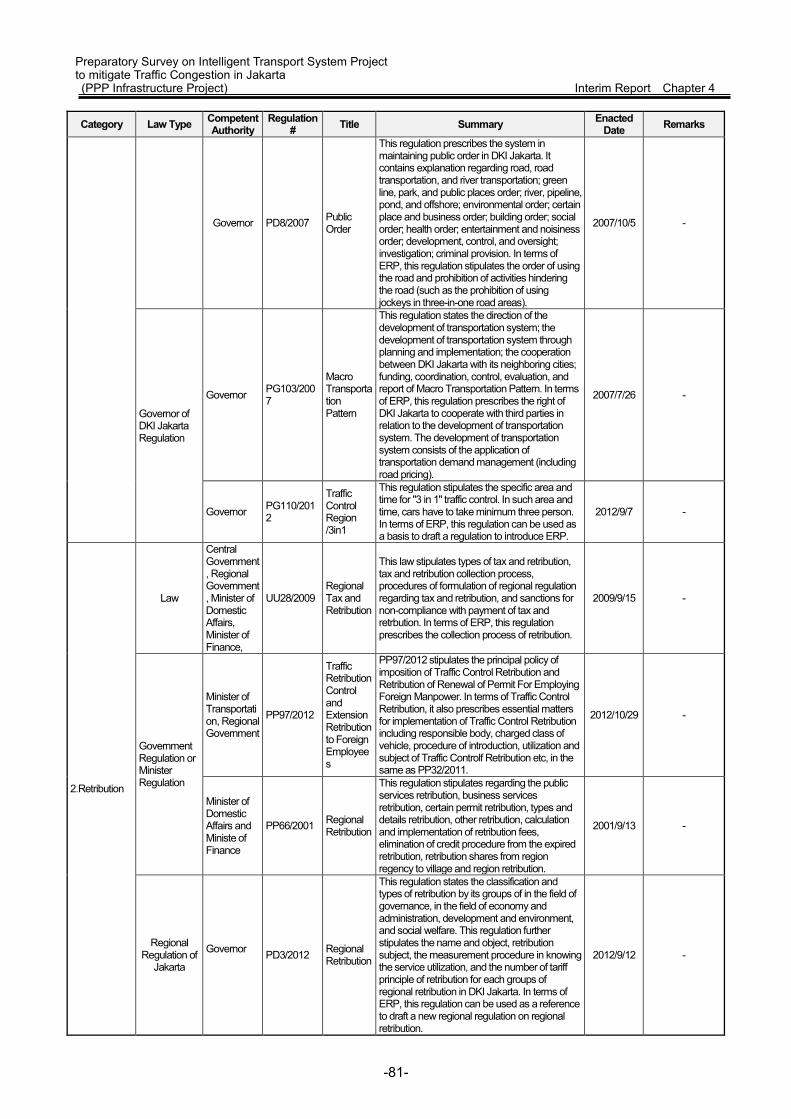
Preparatory Survey on Intelligent Transport System Project to mitigate Traffic Congestion in Jakarta (PPP Infrastructure Project) Interim Report Chapter 4 Category Law Type Competent
Authority Regulation
# Title Summary Enacted Date Remarks
Governor PD8/2007 Public Order
This regulation prescribes the system in maintaining public order in DKI Jakarta. It contains explanation regarding road, road transportation, and river transportation; green line, park, and public places order; river, pipeline, pond, and offshore; environmental order; certain place and business order; building order; social order; health order; entertainment and noisiness order; development, control, and oversight; investigation; criminal provision. In terms of ERP, this regulation stipulates the order of using the road and prohibition of activities hindering the road (such as the prohibition of using jockeys in three-in-one road areas).
2007/10/5 -
Governor of DKI Jakarta Regulation
Governor PG103/2007
Macro Transportation Pattern
This regulation states the direction of the development of transportation system; the development of transportation system through planning and implementation; the cooperation between DKI Jakarta with its neighboring cities; funding, coordination, control, evaluation, and report of Macro Transportation Pattern. In terms of ERP, this regulation prescribes the right of DKI Jakarta to cooperate with third parties in relation to the development of transportation system. The development of transportation system consists of the application of transportation demand management (including road pricing).
2007/7/26 -
Governor PG110/2012
Traffic Control Region /3in1
This regulation stipulates the specific area and time for "3 in 1" traffic control. In such area and time, cars have to take minimum three person. In terms of ERP, this regulation can be used as a basis to draft a regulation to introduce ERP.
2012/9/7 -
2.Retribution
Law
Central Government, Regional Government, Minister of Domestic Affairs, Minister of Finance,
UU28/2009 Regional Tax and Retribution
This law stipulates types of tax and retribution, tax and retribution collection process, procedures of formulation of regional regulation regarding tax and retribution, and sanctions for non-compliance with payment of tax and retrbution. In terms of ERP, this regulation prescribes the collection process of retribution.
2009/9/15 -
Government Regulation or Minister Regulation
Minister of Transportation, Regional Government
PP97/2012
Traffic Retribution Control and Extension Retribution to Foreign Employees
PP97/2012 stipulates the principal policy of imposition of Traffic Control Retribution and Retribution of Renewal of Permit For Employing Foreign Manpower. In terms of Traffic Control Retribution, it also prescribes essential matters for implementation of Traffic Control Retribution including responsible body, charged class of vehicle, procedure of introduction, utilization and subject of Traffic Controlf Retribution etc, in the same as PP32/2011.
2012/10/29 -
Minister of Domestic Affairs and Ministe of Finance
PP66/2001 Regional Retribution
This regulation stipulates regarding the public services retribution, business services retribution, certain permit retribution, types and details retribution, other retribution, calculation and implementation of retribution fees, elimination of credit procedure from the expired retribution, retribution shares from region regency to village and region retribution.
2001/9/13 -
Regional Regulation of
Jakarta
Governor PD3/2012 Regional
Retribution
This regulation states the classification and types of retribution by its groups of in the field of governance, in the field of economy and administration, development and environment, and social welfare. This regulation further stipulates the name and object, retribution subject, the measurement procedure in knowing the service utilization, and the number of tariff principle of retribution for each groups of regional retribution in DKI Jakarta. In terms of ERP, this regulation can be used as a reference to draft a new regional regulation on regional retribution.
2012/9/12 -
-81-

Preparatory Survey on Intelligent Transport System Project to mitigate Traffic Congestion in Jakarta (PPP Infrastructure Project) Interim Report Chapter 4 Category Law Type Competent
Authority Regulation
# Title Summary Enacted Date Remarks
Governor of DKI Jakarta Regulation
Governor PG109/2013
Regional Retribution
This regulation stipulates the registration, determination of cancellation, payment, billing, expiration of bill, objection, overpayment, administration and reporting, examination, coordination and development technical operational of regional retribution fees.
2013/9/30 -
3.Local Government
Law
Central Government, Minister of Domestic Affairs, and Minister of Finance
UU32/2004 Regional Governance
This regulation stipulates the establishment of local and special district, delegation of government affairs, regional government performance principles, local rights and obligations, local government, duty, authority and obligation of head and vice head of local government.
2004/10/15
as has amended two times by Perpu 3/2005 and UU 12/2008 ,and Constitutional Court Decision No.97/PUU-XI/2013
Central Government (Minister of Domestic Affairs)
UU29/2007
Province Government of Capital City Jakarta
This regulation prescribes the DKI Jakarta as a special province and as the capital city of Indonesia with its special rights to regulate certain sectors independently.
2007/7/30
Central Government (Minister of Domestic Affairs)
UU5/1962 Regional Company
This law stipulates regarding characteristic, purpose and business field, asset, capital, management, supervision in the regional company.
1962/2/14
no amendment for this regulation, but there exists a new substance which is added in MOHA Regulation No. 43 of 2000 concerning the Guidelines for Regional Company Cooperation with Third Parties
Government Regulation or Minister Regulation
Central Government PP38/2007
Government Affairs Division between Central Government and Local Government
This regulation stipulates the government affairs, government affairs division, management of government affairs between provincial government and local district/city government.
2007/7/9 -
Central Government(Minister of Finance, and Minister of Domestic Affairs)
MOHA Regulation 13/2006
Regional Financial Management Guidance
This regulation stipulates management of regional budget, structure and formulation of APBD (Regional Revenue and Expenditure Budget), regional government officers to manage the regional revenues and expenditures, evaluation and supervision on the management of regional budget. In terms of ERP, retribution is considered as a regional revenue, thus, revenue from ERP charge and expenses incurred for ERP Project shall be determined in APBD which is determined annually.
2006/5/15
as has been amended by MOHA 59/2007 and MOHA 21/2011.
Minister of Health, and Minister of Domestic Affairs
PP41/2007
Local Organization Structure
This regulation stipulates the formation of organization structure; the position, duty and function of provincial region structure: local secretary, Regional House of Representative secretary, local construction plan, local duty, local technical institution, the position, duty, function of the province region, education of local organization, expert staff and organization control and guidance.
2007/7/23 -
4. .Spatial / Environment
/Telecommunication
Law Central Government UU26/2007 Spatial
Planning
This law stipulates the principle and purpose of spatial planning: legal certainty, accountability and openness, the classification of spatial planning: main system function, administrative area, activities, strategic values area; duty and authority: aims for the people, performance of spatial planning, spatial planning management
2007/4/26 -
-82-

Preparatory Survey on Intelligent Transport System Project to mitigate Traffic Congestion in Jakarta (PPP Infrastructure Project) Interim Report Chapter 4 Category Law Type Competent
Authority Regulation
# Title Summary Enacted Date Remarks
and guidance by coordination, socialization, consultation, supervision and education on the implementation of spatial planning.
Minister of Environment
UU32/2009
Environmental Protection and Management
This law stipulates the environmental management, protection plan, continuing construction and ecosystem; protection and prevention of the destruction of environment, guarantying the environment; requirement to obtain environmental licenses, controlling the damage and destruction of environment, duty and authority of the government to manage the environment, the role of society, sanctions for non-compliance with requirement to manage the environment. In terms of ERP, this regulation prescribes the obligation of preparing environmental documents and the environmental documents will depend on the actual activity conducted in the ERP Project.
2009/10/3 -
Minister of Communication and Information Technology
UU36/1999 Telecommunications
In terms of ERP, this regulation prescribes the construction of telecommunication facilities and infrastructure and the licenses needed to utilize a radio frequency spectrum.
1999/9/8 -
5. Project Scheme)
Government Regulation
Minister of Domestic Affairs
PP50/2007
Procedure of Implementation of the Regional Corporation
This regulation stipulates the cooperation principle: efficiency, effectiveness and good faith; procedure for the regional cooperation; approval from the Regional House of Representative; result of the cooperation; dispute settlement; cooperation changes; termination of cooperation, guidance and controlled by the minister; cooperation board; to help the performance of head of region in implement the cooperation. In terms of ERP, this regulation prescribes the procedure of regional cooperation as a reference for the procurement of goods to DKI Jakarta.
2007/8/22 -
Presidential Regulation
President’s Office
PresReg54/2010
Procurement of Goods or Government Services
This regulation stipulates the procedure of procurements: the principles; the parties of the procurements of goods; general plan of procurement of goods; managements of the procurements goods; procurements of goods by the good/services provision; use of production of procurement goods/ services; control, supervising, complain and sanctions, procurements of goods/ services by international selection, development of human resources, in the procurement organization, the fund raising of the procurement of goods/ services by the foreign debt and the participation of foreign company to the procurement of goods/ services. In terms of ERP, this regulation provides a detailed regulation of the Working Group ULP (Procurement Service Unit)/ Procurement Officer who prepares and establishes Goods / Works Construction / Services Provider selection method and tendering process.
2010/8/6
as has been amended two times: Perpres 35/2011 and Perpres 70/2012
Minister Regulation
Minister of Domestic Affairs
MOHA 22/2009
Technical Procedure of Regional Cooperation
This regulation prescribes the scope and procedures on cooperation among regional governments, and cooperation between regional government and third parties. In terms of ERP, the regulation provides the possibility for cooperation between regional government and third parties in providing services and goods for ERP Project.
2009/5/22 -
6. PPP specifically for Infrastructure(Indonesian Gov.)
Presidential Regulation
President’s Office
Perpres 67/2005
Cooperation between the Governmetn and Business Entity in Infrastructu
This regulation stipulates the types, purposes of the cooperation principle between government and business entities, identification and determination of project based on the cooperation agreement; initial tariff and adjustment tariff; business entity procurement procedure in cooperation agreement for 8 infrastructure projects. Since ERP is not
2006/11/9
as has been amended three times: Perpres 13/2010, Perpres 56/2011, and Perpres 66/2013
-83-

Preparatory Survey on Intelligent Transport System Project to mitigate Traffic Congestion in Jakarta (PPP Infrastructure Project) Interim Report Chapter 4 Category Law Type Competent
Authority Regulation
# Title Summary Enacted Date Remarks
re Provision
included in such 8 infrastructure projects, thus this regulation is not related to ERP Project.
Minister of Finance
Perpres 78/2010
Infrastructure Guarantee in the Cooperation Project between Government and Business Entity
This regulation stipulates principles, scopes, general requirements, infrastructure guarantee, business entity and infrastructure guarantee for 8 infrastructure projects under Perpres 67/2005. In terms of ERP, this regulation is not applicable.
2010/12/21 -
-84-
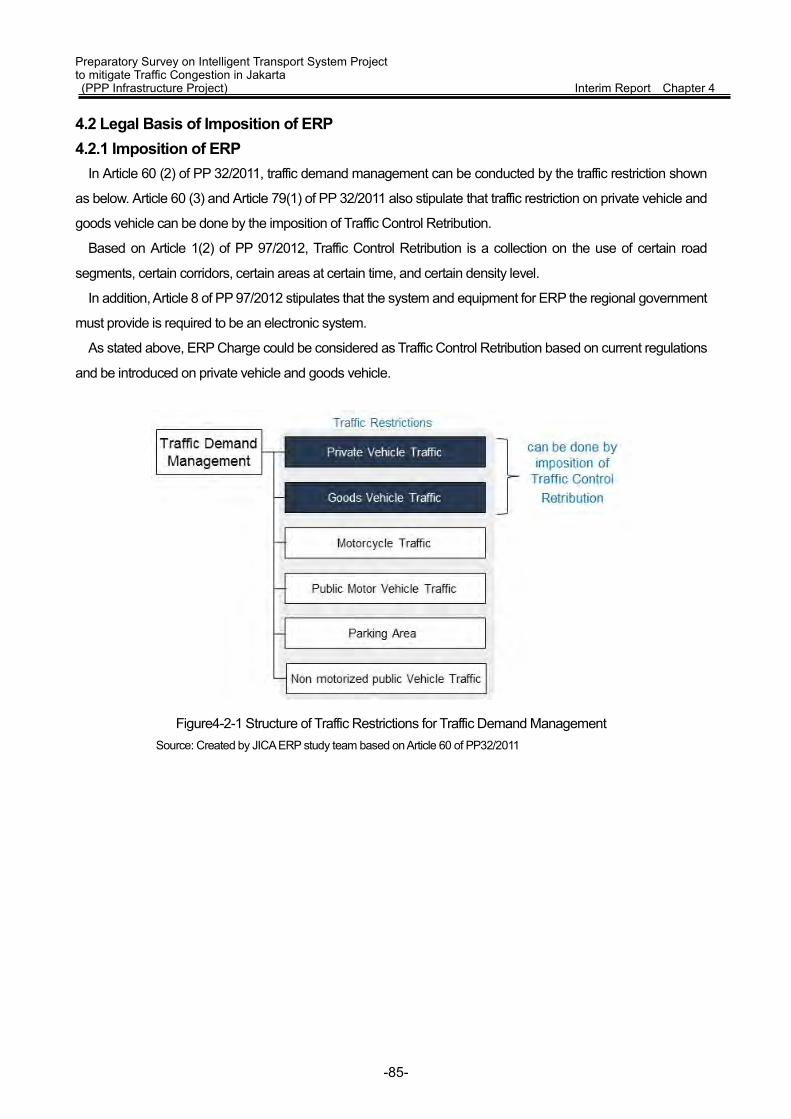
Preparatory Survey on Intelligent Transport System Project to mitigate Traffic Congestion in Jakarta (PPP Infrastructure Project) Interim Report Chapter 4 4.2 Legal Basis of Imposition of ERP 4.2.1 Imposition of ERP
In Article 60 (2) of PP 32/2011, traffic demand management can be conducted by the traffic restriction shown
as below. Article 60 (3) and Article 79(1) of PP 32/2011 also stipulate that traffic restriction on private vehicle and
goods vehicle can be done by the imposition of Traffic Control Retribution.
Based on Article 1(2) of PP 97/2012, Traffic Control Retribution is a collection on the use of certain road
segments, certain corridors, certain areas at certain time, and certain density level.
In addition, Article 8 of PP 97/2012 stipulates that the system and equipment for ERP the regional government
must provide is required to be an electronic system.
As stated above, ERP Charge could be considered as Traffic Control Retribution based on current regulations
and be introduced on private vehicle and goods vehicle.
Figure4-2-1 Structure of Traffic Restrictions for Traffic Demand Management
Source: Created by JICA ERP study team based on Article 60 of PP32/2011
-85-
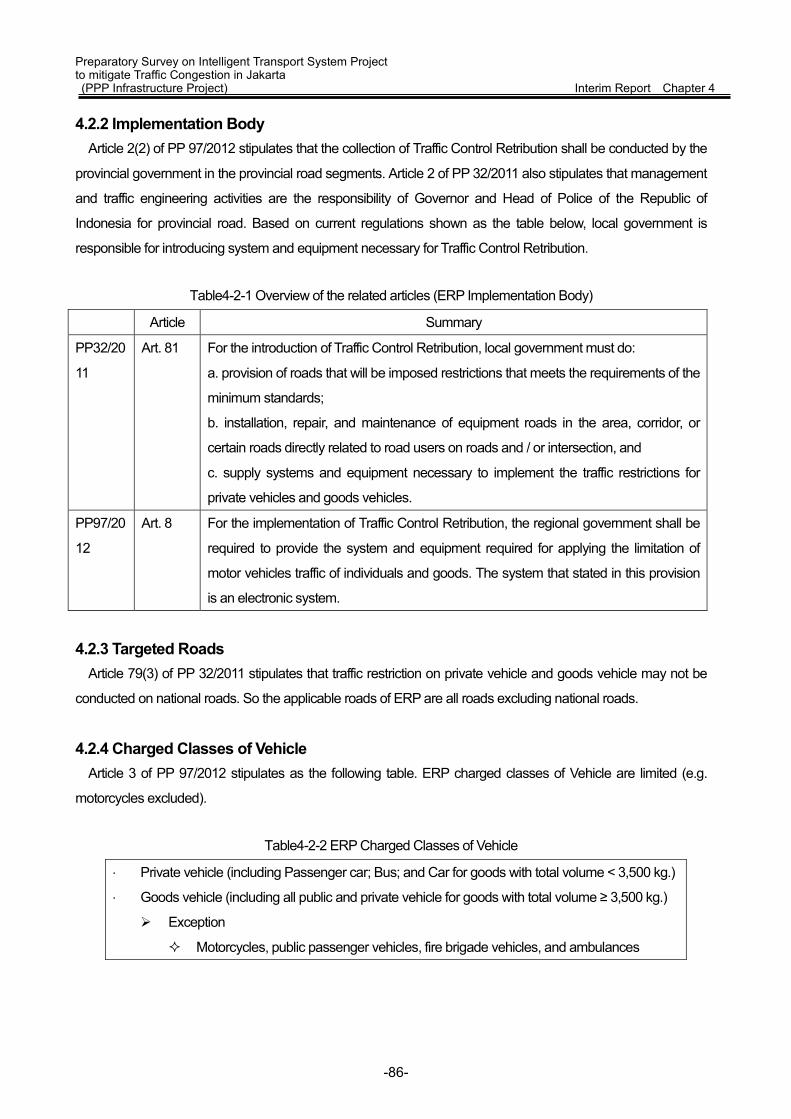
Preparatory Survey on Intelligent Transport System Project to mitigate Traffic Congestion in Jakarta (PPP Infrastructure Project) Interim Report Chapter 4 4.2.2 Implementation Body
Article 2(2) of PP 97/2012 stipulates that the collection of Traffic Control Retribution shall be conducted by the
provincial government in the provincial road segments. Article 2 of PP 32/2011 also stipulates that management
and traffic engineering activities are the responsibility of Governor and Head of Police of the Republic of
Indonesia for provincial road. Based on current regulations shown as the table below, local government is
responsible for introducing system and equipment necessary for Traffic Control Retribution.
Table4-2-1 Overview of the related articles (ERP Implementation Body)
Article Summary
PP32/20
11
Art. 81 For the introduction of Traffic Control Retribution, local government must do:
a. provision of roads that will be imposed restrictions that meets the requirements of the
minimum standards;
b. installation, repair, and maintenance of equipment roads in the area, corridor, or
certain roads directly related to road users on roads and / or intersection, and
c. supply systems and equipment necessary to implement the traffic restrictions for
private vehicles and goods vehicles.
PP97/20
12
Art. 8 For the implementation of Traffic Control Retribution, the regional government shall be
required to provide the system and equipment required for applying the limitation of
motor vehicles traffic of individuals and goods. The system that stated in this provision
is an electronic system.
4.2.3 Targeted Roads Article 79(3) of PP 32/2011 stipulates that traffic restriction on private vehicle and goods vehicle may not be
conducted on national roads. So the applicable roads of ERP are all roads excluding national roads.
4.2.4 Charged Classes of Vehicle Article 3 of PP 97/2012 stipulates as the following table. ERP charged classes of Vehicle are limited (e.g.
motorcycles excluded).
Table4-2-2 ERP Charged Classes of Vehicle
Private vehicle (including Passenger car; Bus; and Car for goods with total volume < 3,500 kg.)
Goods vehicle (including all public and private vehicle for goods with total volume ≥ 3,500 kg.)
Exception
Motorcycles, public passenger vehicles, fire brigade vehicles, and ambulances
-86-

Preparatory Survey on Intelligent Transport System Project to mitigate Traffic Congestion in Jakarta (PPP Infrastructure Project) Interim Report Chapter 4 4.2.5 ERP imposition Criteria
PP97/2012 and PP32/2011 stipulates as the following table.
Table4-2-3 ERP imposition Criteria
Item Summary
Charged
road
segments,
corridors, or
areas
Having 2 road lines, each lane having at least 2 lanes; and
Mass public transport network and service are available in the route.
The mass public transport should meet the minimum service standard specified by the
minister responsible for the means and facilities of road traffic and transport.
(Article 4 of PP 97/2012, Article 79(2) of PP 32/2011)
Charged
time
Charged time shall be determined based on the level of traffic density in charged road
segments, corridors or areas.
The level of traffic density shall be determined based on the criteria of:
a. Having the ratio of the traffic volume of motor vehicles to the road capacity in one of the
road lanes ≥ 0.9; and
The ratio means the comparison of both which is measured when the traffic
restriction for motor vehicles for individuals and goods is not applied.
b. Having the average speed ≤ 10km/h,
The average speed means the average speed of vehicle which is measured when
the traffic restriction for motor vehicles for individuals and goods is not applied.
Occurring regularly every working day.
(Article 5 of PP 97/2012, Article 79(2) of PP 32/2011)
4.2.6 Introduction Process Article 5 of PP 97/2012 stipulates that the determination of criteria fulfillment for ERP imposition shall be
determined by the ministry who is responsible for road traffic and transportation (the Ministry of Transportation).
Based on Article 7 of PP97/2012, the regional government who will perform ERP submits a request for
determination of criteria fulfillment to the Ministry of Transportation. The Minister shall determine the fulfillment of
criteria within maximum sixty (60) work days effective from the date of the request receipt.
-87-

Preparatory Survey on Intelligent Transport System Project to mitigate Traffic Congestion in Jakarta (PPP Infrastructure Project) Interim Report Chapter 4 4.2.7 Charge Amount
Article 11(1) of PP 97/2012 stipulates that effectiveness of traffic control and ability to cover implementation
costs shall be considered. According to Article 155 of UU 28/2009, amount of Traffic Control Retribution shall be
reviewed at least once in every 3 years.
Table4-2-4 ERP Charge amount (the amount of Traffic Control Retribution)
Article Summary
PP97/201
2
Art.
11(1)
(1) The determination of the amount of Traffic Control Retribution shall meet the principles
and objectives as follows:
a. effectiveness of traffic control; and
b. that could cover the cost of implementation.
(2) The effectiveness of traffic control as intended in paragraph (1) letter a shall be
measured based on the congestion cost
(3) The cost of implementation as intended in paragraph (1) letter b shall include capital
cost, operational cost, maintenance cost and interest expense.
UU
28/2009
155 The amount of Traffic Control Retribution is reviewed at least once in 3 (three) years.
UU
28/2009
155 (2)
and (3)
Review on the amount of Traffic Control Retribution is considering price index and
economic increase. Amendment of retribution tariff must be determined in the form of
governor regulation (head of regional regulation). Elucidation of Article 155(3) of Law
28/2009 stipulates that the head of regional can adjust the retribution tariff if the costs of
services are increase significantly and/or the retribution tariff is no longer effective by the
reason to control the demand of services.
-88-
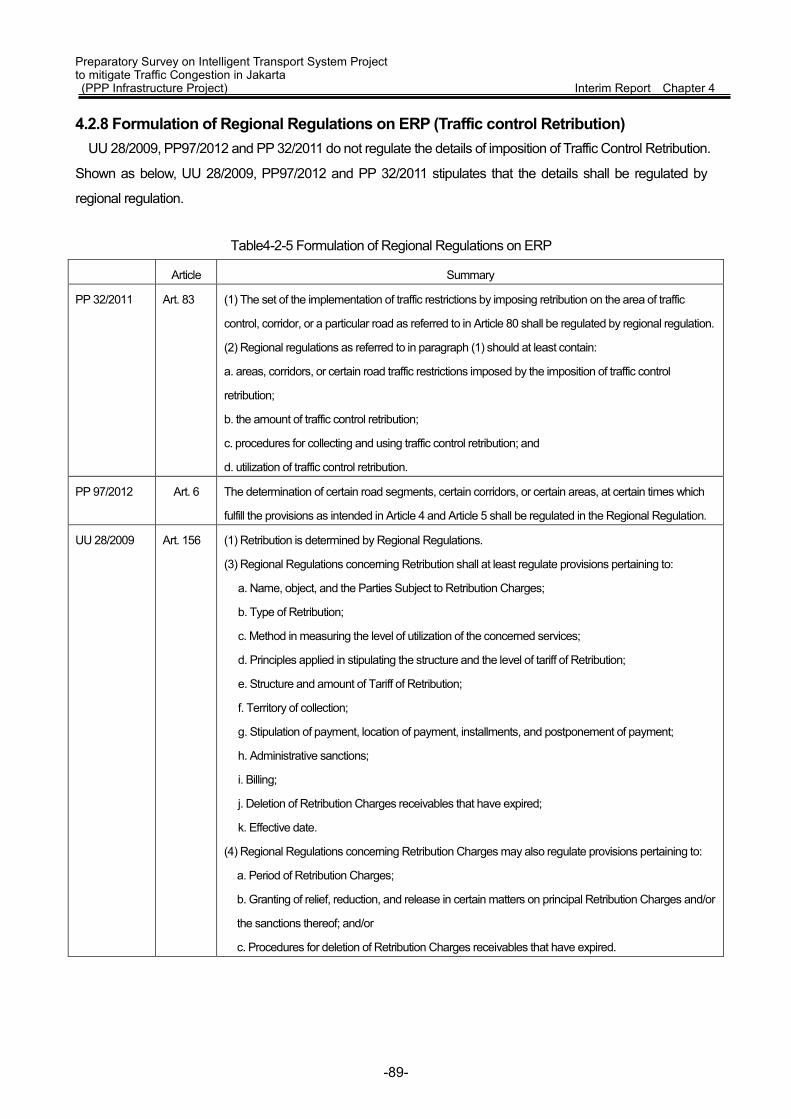
Preparatory Survey on Intelligent Transport System Project to mitigate Traffic Congestion in Jakarta (PPP Infrastructure Project) Interim Report Chapter 4 4.2.8 Formulation of Regional Regulations on ERP (Traffic control Retribution)
UU 28/2009, PP97/2012 and PP 32/2011 do not regulate the details of imposition of Traffic Control Retribution.
Shown as below, UU 28/2009, PP97/2012 and PP 32/2011 stipulates that the details shall be regulated by
regional regulation.
Table4-2-5 Formulation of Regional Regulations on ERP
Article Summary
PP 32/2011 Art. 83 (1) The set of the implementation of traffic restrictions by imposing retribution on the area of traffic
control, corridor, or a particular road as referred to in Article 80 shall be regulated by regional regulation.
(2) Regional regulations as referred to in paragraph (1) should at least contain:
a. areas, corridors, or certain road traffic restrictions imposed by the imposition of traffic control
retribution;
b. the amount of traffic control retribution;
c. procedures for collecting and using traffic control retribution; and
d. utilization of traffic control retribution.
PP 97/2012 Art. 6 The determination of certain road segments, certain corridors, or certain areas, at certain times which
fulfill the provisions as intended in Article 4 and Article 5 shall be regulated in the Regional Regulation.
UU 28/2009 Art. 156 (1) Retribution is determined by Regional Regulations.
(3) Regional Regulations concerning Retribution shall at least regulate provisions pertaining to:
a. Name, object, and the Parties Subject to Retribution Charges;
b. Type of Retribution;
c. Method in measuring the level of utilization of the concerned services;
d. Principles applied in stipulating the structure and the level of tariff of Retribution;
e. Structure and amount of Tariff of Retribution;
f. Territory of collection;
g. Stipulation of payment, location of payment, installments, and postponement of payment;
h. Administrative sanctions;
i. Billing;
j. Deletion of Retribution Charges receivables that have expired;
k. Effective date.
(4) Regional Regulations concerning Retribution Charges may also regulate provisions pertaining to:
a. Period of Retribution Charges;
b. Granting of relief, reduction, and release in certain matters on principal Retribution Charges and/or
the sanctions thereof; and/or
c. Procedures for deletion of Retribution Charges receivables that have expired.
-89-
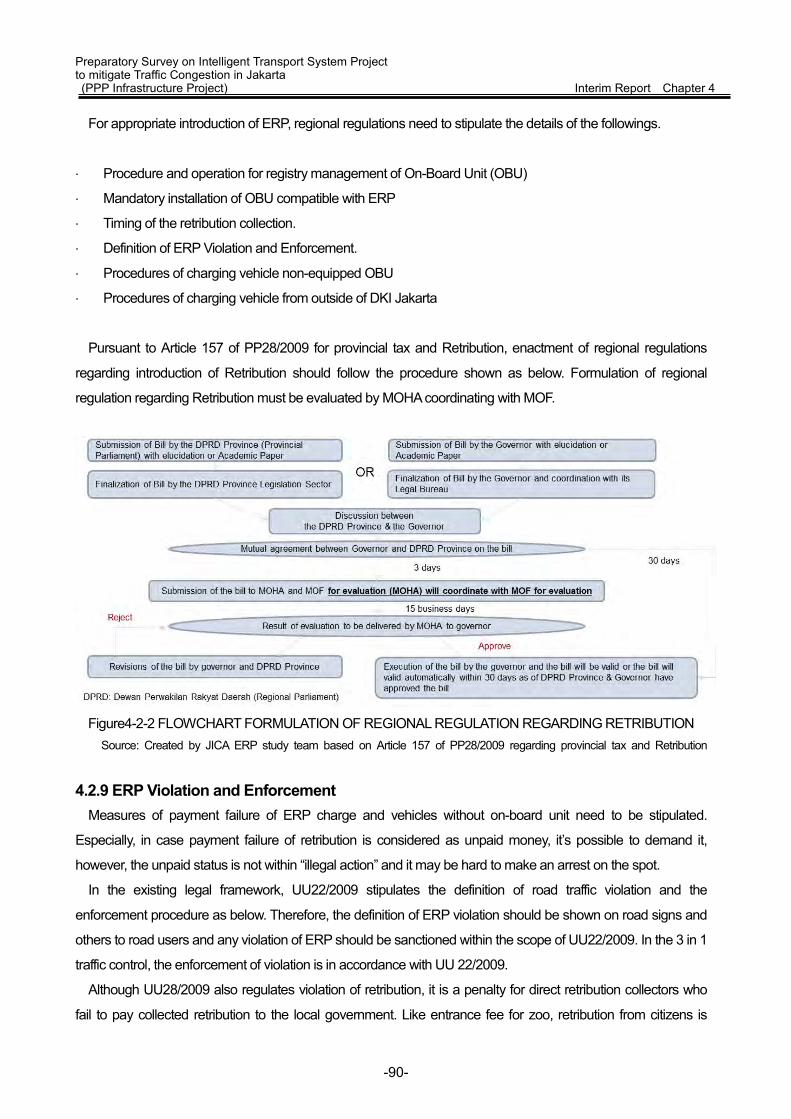
Preparatory Survey on Intelligent Transport System Project to mitigate Traffic Congestion in Jakarta (PPP Infrastructure Project) Interim Report Chapter 4
For appropriate introduction of ERP, regional regulations need to stipulate the details of the followings.
Procedure and operation for registry management of On-Board Unit (OBU)
Mandatory installation of OBU compatible with ERP
Timing of the retribution collection.
Definition of ERP Violation and Enforcement.
Procedures of charging vehicle non-equipped OBU
Procedures of charging vehicle from outside of DKI Jakarta
Pursuant to Article 157 of PP28/2009 for provincial tax and Retribution, enactment of regional regulations
regarding introduction of Retribution should follow the procedure shown as below. Formulation of regional
regulation regarding Retribution must be evaluated by MOHA coordinating with MOF.
Figure4-2-2 FLOWCHART FORMULATION OF REGIONAL REGULATION REGARDING RETRIBUTION
Source: Created by JICA ERP study team based on Article 157 of PP28/2009 regarding provincial tax and Retribution
4.2.9 ERP Violation and Enforcement Measures of payment failure of ERP charge and vehicles without on-board unit need to be stipulated.
Especially, in case payment failure of retribution is considered as unpaid money, it’s possible to demand it,
however, the unpaid status is not within “illegal action” and it may be hard to make an arrest on the spot.
In the existing legal framework, UU22/2009 stipulates the definition of road traffic violation and the
enforcement procedure as below. Therefore, the definition of ERP violation should be shown on road signs and
others to road users and any violation of ERP should be sanctioned within the scope of UU22/2009. In the 3 in 1
traffic control, the enforcement of violation is in accordance with UU 22/2009.
Although UU28/2009 also regulates violation of retribution, it is a penalty for direct retribution collectors who
fail to pay collected retribution to the local government. Like entrance fee for zoo, retribution from citizens is
-90-
Preparatory Survey on Intelligent Transport System Project to mitigate Traffic Congestion in Jakarta (PPP Infrastructure Project) Interim Report Chapter 4 based on the assumption that public service is provided to them at the same time, so there is no penalty for
citizens who violate retribution.
Pursuant to UU22/2009 (Traffic and Road Traffic), any violation of traffic signs, road markings, and/or other
traffic signal device must be sanctioned.
In terms of ERP users, failure to comply with orders, prohibitions, or instruction on traffic signs is subject
to imprisonment of a max. 2 months or fine of a max. IDR500,000 (Art. 287 UU 22/2009).
Pursuant to UU28/2009 (Regional Tax & Retribution), the failure to fulfill the obligation to pay retribution must
be sanctioned.
In terms of the Retribution Collector, the failure to comply with the above in a timely manner shall result
the Retribution Collector to be imposed administrative sanction of 2% interest every month from the
payable retribution (Art. 160 UU 28/2009).
In terms of the Retribution Collector, the failure to fulfill the obligation to pay retribution resulting to the
loss of regional finance shall result the Retribution Collector for maximum of 3 months of confinement or
for maximum criminal fine of three times the amount of the entire outstanding or the remaining unpaid
retribution (Art. 176 UU 28/2009).
4.2.10 Enforcement Body Investigation of the crime of Traffic and Transportation shall be conducted by Police force of Republic of
Indonesia and the investigator of specific civil servant in the field of traffic and road transportation that is
appointed by the Head of Province Department that is in charge of facility and infrastructure of traffic and road
transportation in accordance with UU 22/2009. It is supposed that the enforcement body of ERP violation shall
be determined under the UU 22/2009 as enforcement against violation of road traffic as well.
4.2.11 Motored Vehicle Registration Database In Head of Indonesian Police Force Regulation 5/2012, Article 31 (1) stipulates that identification and
verification of motored vehicle identity registration is conducted towards:
Physical data of the motored vehicle, type, variety, model, year of manufacture, cylinder, machine
number, color, fuel, number of wheels and fuse;
Fungsional data such as the utilization and eligibility of the motored vehicle;
Juridical data such as the origin of the motored vehicle and identity of the owner.
Pursuant to the Article 31 (2) of Head of Indonesian Police Force Regulation 5/2012, the data resulted from
the identification and verification of motored vehicle identity registration serves as forensic data of the national
police. Current issue is that it is difficult to build an integrated database because motored vehicle registration
database varies depending on the manager.
-91-
Preparatory Survey on Intelligent Transport System Project to mitigate Traffic Congestion in Jakarta (PPP Infrastructure Project) Interim Report Chapter 4 4.3 Institutional Framework on Retribution, Regional Government Revenue and
Expenditure
4.3.1 Legal Basis of Traffic Control Retribution Article 80 (1) of PP32/2011 stipulates that Traffic Control Retribution is a public service retribution. Public
service retribution is not a kind of tax but a payment for public service. Retribution is considered as revenue of
regional government.
Article 3 (1) of PP97/2012 stipulates that the object of traffic control retribution is the use of specific roads,
specific corridors, or specific areas on a specific time by private or freight motored vehicle. Therefore, in terms of
PP32/2011, it is supposed that Traffic Control Retribution is considered as a payment by road users for usage of
public service such as provision of public road, however, it becomes revenue of regional government directly
and it is not tariff as toll road tariff.
Article 160 of UU28/2009 also regulates that collection of retribution is done through the issuance of a letter
stating the payable retribution or other documents. Other documents can be in the form of ticket, coupon, and
subscription cards. No current laws and regulations explicitly regulate electronic charge of retribution.
4.3.2 Usage of income received from Traffic Control Retribution According to Article 9 (1) of PP 97/2012 and Article 80 (2) of PP32/2011, income received from Traffic Control
Retribution must be utilized to increase the traffic performance and public transport services.
4.3.3 Overview of Institution on Regional Government Revenues and Expenditures Budgetary (APBD)
Article 26(1) of MOHA Regulation 13/2006 (as lastly amended by MOHA Regulation 21/2011) stipulates that
income received from the collection of retribution is classified as regional government revenue. According to
Article 122 of MOHA Regulation 13/2006, all regional government revenues and expenditures for the
implementation of local government affairs shall be managed within Regional Government Revenues and
Expenditures Budgetary (APBD).
In addition, according to Article 15 of MOHA Regulation 13/2006, under the framework of Regional
Government Revenues and Expenditures Budgetary (APBD), changes of Regional Government Revenues and
Expenditures, and implementation of Regional Government Revenues and Expenditures each year is set by
regional government regulations.
In order to use the income received from collection of Traffic Control Retribution, such expenses must be
formulated in Regional Government Revenues and Expenditures Budgetary (APBD) which is determined
annually under regional regulation as well.
Regional regulation on Regional Revenues and Expenditure (APBD) shall be formulated in accordance with
the following flowchart. For formulation of Regional Revenues and Expenditure (APBD), regional regulation on
APBD must be stipulated annually with approval of DPRD (Dewan Perwakilan Rakyat Daerah: Regional
-92-

Preparatory Survey on Intelligent Transport System Project to mitigate Traffic Congestion in Jakarta (PPP Infrastructure Project) Interim Report Chapter 4 Parliament) and evaluation of MOHA. The purpose of evaluation of MOHA is to ensure whether the draft of
regional regulation is in accordance with higher hierarchy laws and regulations.
In case approval by DPRD and/or evaluation by MOHA for draft regional regulation on APBD are delayed,
there is a possibility that annual expenditure for traffic performance activity improvement from income of traffic
control retribution not conducted as scheduled.
-93-

Preparatory Survey on Intelligent Transport System Project to mitigate Traffic Congestion in Jakarta (PPP Infrastructure Project) Interim Report Chapter 4
Figure4-3-1 FLOWCHART OF FORMULATION OF REGIONAL REVENUES AND EXPENDITURE (APBD) source: Created by JICA ERP study team based on MOHA Regulation 13/2006 (as last amended by MOHA Regulation 21/2011)
-94-

Preparatory Survey on Intelligent Transport System Project to mitigate Traffic Congestion in Jakarta (PPP Infrastructure Project) Interim Report Chapter 4 4.3.4 Collection Body of Traffic Control Retribution
According to Article 10 of MOHA Regulation 13/2006, collection of non-tax revenue of regional government
such as retribution is specified as one of responsibility of Regional Apparatus Working Unit (SKPD), part of
regional government. Article 1 (10) of MOHA Regulation 13/2006 stipulates that SKPD (Regional Government
Working Unit) or Regional Apparatus Working Unit is regional apparatus in the regional government level as the
user of regional budget/goods. Thus, it is supposed that a SKPD has the authority of collection of Traffic
Control Retribution.
Pursuant to Article 122 of MOHA Regulation 13/2006, SKPD which has the authority to collection and use
regional government revenue needs to comply with the following regulations.
Income of SKPD (Regional Government Working Unit) is prohibited to be used directly to finance
expenditure, unless otherwise regulated under the prevailing laws and regulations.
Income of SKPD (Regional Government Working Unit) in form of cash money or cheque must be
deposited into the regional government general treasury account within maximum of 1 (one) working day.
Therefore, Traffic Control Retribution collected by SKPD must be deposited to Regional Government Account
within 1 working day. The conceptual diagram of collection and usage of Traffic Control Retribution is shown as
below.
Figure4-3-2 Conceptual Diagram of Collection and Usage of Traffic Control Retribution Source: Created by JICA ERP study team
-95-
Preparatory Survey on Intelligent Transport System Project to mitigate Traffic Congestion in Jakarta (PPP Infrastructure Project) Interim Report Chapter 4 4.4 Legal Framework on Project Scheme 4.4.1 Project Scheme 4.4.1.1 Laws and regulations which regulate Public Private Partnership
The partnership between public and private entities in Indonesia is regulated under Presidential Regulation
67/2005 (Presreg 67/2005) which has been amended three times and PP 50/2007.
(1) Presidential Regulation 67/2005
Presidential Regulation 67/2005 (Presreg 67/2005) regulates the partnership between the government of the
Republic of Indonesia (the minister/head of institution/head of regional government) and a business entity in the
activity which consists of construction works to build or increase the performance of infrastructure and/or
management of infrastructure and/or maintenance of infrastructure for the purpose of increasing the advantages
of infrastructure.
According to the 2nd amendment of Presreg 67/2005 (Presreg 13/2010), the sectors of infrastructure that can
be partnered with business entity are as follows:
i. transportation infrastructure, consisting of services in relation with the airport, procurement of and/or
services of seaport, facilities and infrastructure of railroad system;
ii. road infrastructure, consisting of toll road and toll bridges;
iii. irrigation infrastructure, consisting of water canal;
iv. drinking water infrastructure, consisting of water obtainment building, transmission network,
distribution network, water treatment installation;
v. sewage infrastructure consisting of sewage treatment installation, collecting network and main
network, and waste facility including transportation and disposal area.
vi. telecommunication and informatics infrastructure, consisting of telecommunication and e-government
infrastructure;
vii. electric power infrastructure, consisting of power plant, including development of geothermal energy,
transmission, or distribution of electricity; and
viii. oil and gas infrastructure, including transmission and/or distribution of oil and gas.
It can be concluded that the Presreg 67/2005 limits infrastructure projects to those that are only in line with the
above mentioned eight sectors. However ERP Project is not covered in the eight sectors stipulated by Presreg
67/2005, taking into account the attitude of Indonesia. So it is supposed that the ERP Project cannot be
conducted through the PPP infrastructure scheme under Presreg 67/2005 at this time.
-96-

Preparatory Survey on Intelligent Transport System Project to mitigate Traffic Congestion in Jakarta (PPP Infrastructure Project) Interim Report Chapter 4 (2) PP 50/2007
The cooperation regulated under PP50/2007 and MOHA Regulation 22/2009 regulates the agreement
between:
governor and other governor;
governor and regent/mayor;
regent/mayor and other regent/mayor; and or
governor, regent/mayor and third parties (private entities, regional government-owned enterprise
(BUMD) and other domestic legal entities)
Pursuant to Article 4 of PP50/2007, the object of the cooperation agreement regulated by the PP50/2007 and
MOHA Regulation 22/2009 is the entire regional government affairs that is the authority of autonomous region
and can be in the form of public service procurement.
According to Article 10 of UU 32/2004, regional government has the full authority and regional autonomy to
implement their governmental affairs that falls under their authority, except for the governmental of the central
government which are as follows:
i. foreign politics;
ii. defense;
iii. security;
iv. judicial;
v. national physical and monetary; and
vi. religion.
PP 50/2007 is open to other projects as long as the projects fall under the authority of the regional
governments as stated above. The broad scope of partnership project in PP 50/2007 provides the possibility for
the ERP Project to be facilitated under partnership agreement between the regional government (DKI Jakarta)
and private entity.
Pursuant to MOHA Regulation 22/2009, partnership agreements under PP 50/2007 can be in the form of the
following table. MOHA Regulation 22/2009 stipulates the schemes such as BTO, BOT and other project
scheme. Based on MOHA Regulation 22/2009, BTO and BOT can be applied as project scheme in which
private entity is responsible for finance, construction and maintenance of system and equipment for ERP.
Article 2 of PP 32/2011, legal basis for ERP charge, stipulates that management and traffic engineering
activities for state road are implemented on provincial government’s responsibility. Management and traffic
engineering activities include regulation, engineering, empowerment and supervision in Article 3 of PP 32/2011
and engineering, as defined in Article 28 of PP32/2011, includes: “repair of geometric roads and / or
intersections as well as road equipment that is not directly related to road users”, “procurement, installation,
repair, and maintenance of road equipment related directly to road users” and “optimization of traffic engineering
operations to improve the order, smoothness, and the effectiveness of law enforcement”. These facts indicates
-97-
Preparatory Survey on Intelligent Transport System Project to mitigate Traffic Congestion in Jakarta (PPP Infrastructure Project) Interim Report Chapter 4 that procurement, installation, repair and maintenance of ERP equipment should be implemented on provincial
government’s responsibility and procurement of ERP equipment is needed to be conducted based on traditional
public procurement system.
-98-
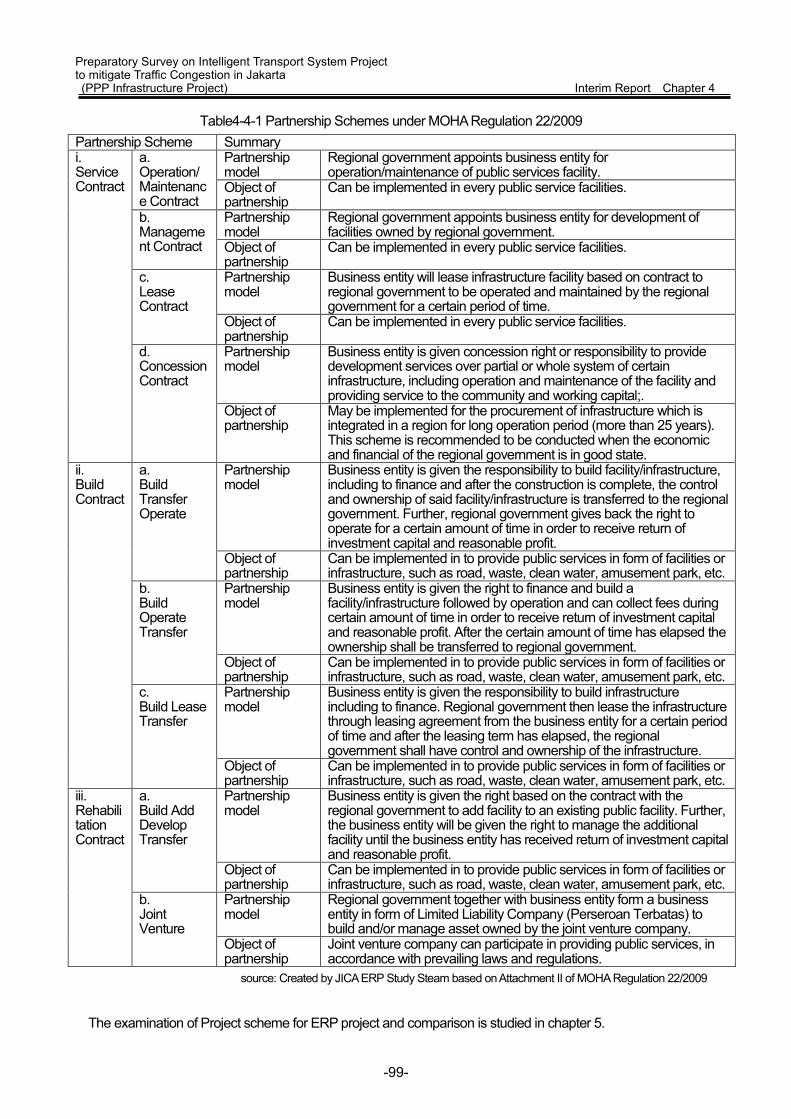
Preparatory Survey on Intelligent Transport System Project to mitigate Traffic Congestion in Jakarta (PPP Infrastructure Project) Interim Report Chapter 4
Table4-4-1 Partnership Schemes under MOHA Regulation 22/2009 Partnership Scheme Summary i. Service Contract
a. Operation/ Maintenance Contract
Partnership model
Regional government appoints business entity for operation/maintenance of public services facility.
Object of partnership
Can be implemented in every public service facilities.
b. Management Contract
Partnership model
Regional government appoints business entity for development of facilities owned by regional government.
Object of partnership
Can be implemented in every public service facilities.
c. Lease Contract
Partnership model
Business entity will lease infrastructure facility based on contract to regional government to be operated and maintained by the regional government for a certain period of time.
Object of partnership
Can be implemented in every public service facilities.
d. Concession Contract
Partnership model
Business entity is given concession right or responsibility to provide development services over partial or whole system of certain infrastructure, including operation and maintenance of the facility and providing service to the community and working capital;.
Object of partnership
May be implemented for the procurement of infrastructure which is integrated in a region for long operation period (more than 25 years). This scheme is recommended to be conducted when the economic and financial of the regional government is in good state.
ii. Build Contract
a. Build Transfer Operate
Partnership model
Business entity is given the responsibility to build facility/infrastructure, including to finance and after the construction is complete, the control and ownership of said facility/infrastructure is transferred to the regional government. Further, regional government gives back the right to operate for a certain amount of time in order to receive return of investment capital and reasonable profit.
Object of partnership
Can be implemented in to provide public services in form of facilities or infrastructure, such as road, waste, clean water, amusement park, etc.
b. Build Operate Transfer
Partnership model
Business entity is given the right to finance and build a facility/infrastructure followed by operation and can collect fees during certain amount of time in order to receive return of investment capital and reasonable profit. After the certain amount of time has elapsed the ownership shall be transferred to regional government.
Object of partnership
Can be implemented in to provide public services in form of facilities or infrastructure, such as road, waste, clean water, amusement park, etc.
c. Build Lease Transfer
Partnership model
Business entity is given the responsibility to build infrastructure including to finance. Regional government then lease the infrastructure through leasing agreement from the business entity for a certain period of time and after the leasing term has elapsed, the regional government shall have control and ownership of the infrastructure.
Object of partnership
Can be implemented in to provide public services in form of facilities or infrastructure, such as road, waste, clean water, amusement park, etc.
iii. Rehabilitation Contract
a. Build Add Develop Transfer
Partnership model
Business entity is given the right based on the contract with the regional government to add facility to an existing public facility. Further, the business entity will be given the right to manage the additional facility until the business entity has received return of investment capital and reasonable profit.
Object of partnership
Can be implemented in to provide public services in form of facilities or infrastructure, such as road, waste, clean water, amusement park, etc.
b. Joint Venture
Partnership model
Regional government together with business entity form a business entity in form of Limited Liability Company (Perseroan Terbatas) to build and/or manage asset owned by the joint venture company.
Object of partnership
Joint venture company can participate in providing public services, in accordance with prevailing laws and regulations.
source: Created by JICA ERP Study Steam based on Attachment II of MOHA Regulation 22/2009
The examination of Project scheme for ERP project and comparison is studied in chapter 5.
-99-

Preparatory Survey on Intelligent Transport System Project to mitigate Traffic Congestion in Jakarta (PPP Infrastructure Project) Interim Report Chapter 4 4.4.2 Tender Process
For partnership between regional government and private entity based on PP 50/2007, the procurement of
goods or services is conducted by way of tender as follows.
4.4.2.1 Laws and regulations which regulate Tender Process Tender process is classified into 3 types of tender depending on the specification of the goods/services as
follows: (a) public tender, (b) limited tender and (c) simple tender.
The applicable laws and regulations to tender process are Presidential Regulation 54/2010(Presreg 54/2010;
lastly amended by Presidential Regulation 70/2012) and Head of NPPA Regulation No. 14 of 2012 (“NPPA
Regulation 14/2012”). The competent authority in terms of general tender process is National Public
Procurement Agency / Lembaga Kebijakan Pengadaan Barang/Jasa Pemerintah ] ”(“NPPA”).
(1) Definition and Applicability of each tender
The definition and applicability of each tender are shown in the following table. Public tender applies to all
tender process in principle. However, limited tender can apply to ERP project when its construction, operation
and maintenance work are included in “complex works” mentioned below.
Table4-4-2 Definition of each tender
Definition
Public
Tender”
“Public Tender” is defined as selection method of goods/construction works/other services providers for all
works which can be participated by all goods/ construction works/ other services providers who fulfill the
requirements.
Limited
Tender
“Limited Tender” is defined as selection method of goods/construction works providers which can only be
conducted by limited provider and the works is complex in nature.
Simple
Tender
“Simple Tender” is defined as selection method of other goods/services providers for works not exceeding
IDR5,000,000,000.
Table4-4-3 Applicability of each tender
Applicability
Public
Tender
Public Tender applies generally to all tender process other than that is already covered by other tendering
process (Article 36 (1) of Presreg 54/2010).
Limited
Tender
Limited Tender applies to procurement of goods/service that requires complex works with limited provider of
services or goods (Article 36(2) of Presreg 54/2010). “complex works” is illustrated under Article 1(36) of
Presregf 54/2010 as works that requires high technology, high level of risk, utilize specially design utility
and/or works which value exceeds IDR100,000,000,000 (one hundred billion Rupiah).
Simple
Tender
Simple Tender applies to procurement of goods/service which value is not more than IDR5,000,000,000
(Article 37(1) of Presreg 54/2010).
-100-

Preparatory Survey on Intelligent Transport System Project to mitigate Traffic Congestion in Jakarta (PPP Infrastructure Project) Interim Report Chapter 4 (2) Qualification of Tender Participants
Qualification of the person/company that is entitled to participate in tender is stipulated in Article 19 of Presreg
54/2010 as follows:
a. comply with laws and regulations to carry out activities / business;
b. have the expertise , experience, technical and managerial capabilities to provide goods / services;
c. obtain at least 1 ( one ) work as provider goods / services within a period of 4 ( four ) years , either in the
governmental or private environment, including subcontract;
d. provisions referred to in letter c, excluded for providers of goods / services which are established for less
than three (3) years;
e. have sufficient human resources, capital, equipment and other facilities required for the procurement of
goods / services;
f. In the event the provision of goods / services will be conducted through partnership, provider of goods /
services shall have joint operation agreements / partnerships which stipulates partnership percentage
and companies that represent partnerships;
g. has a basic capabilities for non-small business , except for consultancy works;
h. not under the supervision of the court, not in the state of bankruptcy, business activities are not being
suspended and / or directors acting for and on behalf of the company is not under criminal sanction, as
evidenced with a sign waiver by the Provider of goods/service;
i. as a taxpayer to have a Taxpayer Identification Number ( NPWP) and has fulfilled tax obligations of the
previous years ( Annual PPTK ) and have a monthly tax report on Income Tax Article 21, Income Tax
Article 23 ( if there are transactions ) , Income Tax Article 29 25/Pasal and VAT ( for the Taxable Person )
at least 3 ( three) months in the current year;
j. have the capacity to legally bind themselves to the contract ;
k. not included in the black list ;
l. have a fixed address and clear and can be reached by services delivery ; and
m. sign the Integrity Pact.
(3) Flow of tender process
Pursuant to Attachment of NPPA Regulation 14/2012 Chapter II A.8, generally, the tender process consists of
the following stages. The stages are general in nature for post-qualification public tender with “one cover” or
“satu sampul” method and eliminate system. Therefore, actual tender stages may differ depending on the
qualification method, evaluation method, and submission of tender offer documents method:
(i) Announcement of tender in website of DKI Jakarta and in NPPA website/invitation for Limited Tender
(ii) Registration and retrieval of procurement documents by tender participant
(iii) Explanation on the procurement documents
(iv) Submission of tender offer documents to tender committee
-101-
Preparatory Survey on Intelligent Transport System Project to mitigate Traffic Congestion in Jakarta (PPP Infrastructure Project) Interim Report Chapter 4
(v) Opening and checking of the tender offer documents
(vi) Evaluation by tender committee of tender offer documents and qualification of bidder
(vii) Qualification verification of bidder who have fulfilled the required qualification
(viii) Drafting of Minutes of Tender Result by tender committee
(ix) Determination of the tender winner by tender committee
(x) Announcement of tender winner
(xi) Objection to the determination of tender winner (if any) to the tender committee
(xii) Appeal of objection to the determination of tender winner to the tender committee.
(xiii) Appointment Letter of Goods and Service Provider by [-Commitment Determination Officer/ Petugas
Pembuat Komitmen (PPK).
1) Qualification methods
Pursuant to Article 56 of Presreg 54/2010, there are 2 types qualification methods are as follows:
1. Pre-Qualification (Pra-kualifikasi)
Pre-Qualification is the qualification assessment process that is conducted before the submission of
tender offer document. Pre-qualification is conducted for procurement as follows:
a. selection of consultancy service;
b. selection of goods/construction work/other services provider which is complex in nature through public
tender;
c. selection of goods/construction work/other services provider which is conducted by way of direct
appointment, except for emergency response; or
d. selection of provider through direct procurement.
2. Post-Qualification (Pasca-kualifikasi)
Post-Qualification is qualification assessment process that is conducted after the submission of the
submission of tender offer document. Post-qualification is conducted for procurement of the following:
a. public tender, except for public tender for complex works;
b. simple tender/direct appointment;
c. selection of individual consultancy service.
2) Evaluation methods
Pursuant to Article 48 of Presreg 54/2010, evaluation method consists of the following:
1. Elimination System (Sistem Gugur)
Evaluation of tender is generally conducted by using elimination system.
2. Value System (Sistem Nilai)
Evaluation using the value system is used for the procurement of goods / services that take into
-102-

Preparatory Survey on Intelligent Transport System Project to mitigate Traffic Congestion in Jakarta (PPP Infrastructure Project) Interim Report Chapter 4
account the technical superiority and compatible with the tender offer price, considering the price of
tender offer is strongly influenced by the technical quality.
3. Assessment Costs over The Economical Life Evaluation System (Sistem Penilaian Biaya
Selama Umur Ekonomis)
Evaluation using cost assessment over the economical life evaluation system is used for the
procurement of goods/services that take into account factors of economic age, price, operating costs,
maintenance costs, and certain operating period.
3) Submission of tender offer documents methods
Pursuant to Article 47 of Presreg 54/2010, the tender committee determines the submission of tender offer
documents methods, as follows:
1. One Cover Method (Metode Satu Sampul)
One Cover Method is used for procurement of goods/services that are simple and that the price
standard has been determined by the government and technical specifications can be clearly stipulated
in the procurement document.
2. Two Covers Method (Metode Dua Sampul)
Two Covers Method is used for procurement of goods/services where the technical evaluation is
affected by the offering price and for procurement which uses value system or assessment costs over
the economical life evaluation system.
3. Two Stages Method (Metode Dua Tahap)
Two Stages Method is used for procurement of goods/services which have the following criteria;
• Works that are complex in nature;
• Fulfills all the work characteristic of the overall system, including consideration of the ease or
efficiency of operation and maintenance equipment
• There are other alternative on the use of the system and the design of the application of
different technologies;
• Technical evaluation may takes a long time; and/or
• Require technical equivalency.
(4) Treatment of BUMD
ERP project is possibly implemented by BUMD as well since the definition of third party includes BUMD in
Article 1 (3) of PP50/2007 regarding partnership agreement between local government and third party.
According to the relevant laws and regulations, BUMD is not treated favorably in any of the tender process and
treated equally to other bidders.
-103-
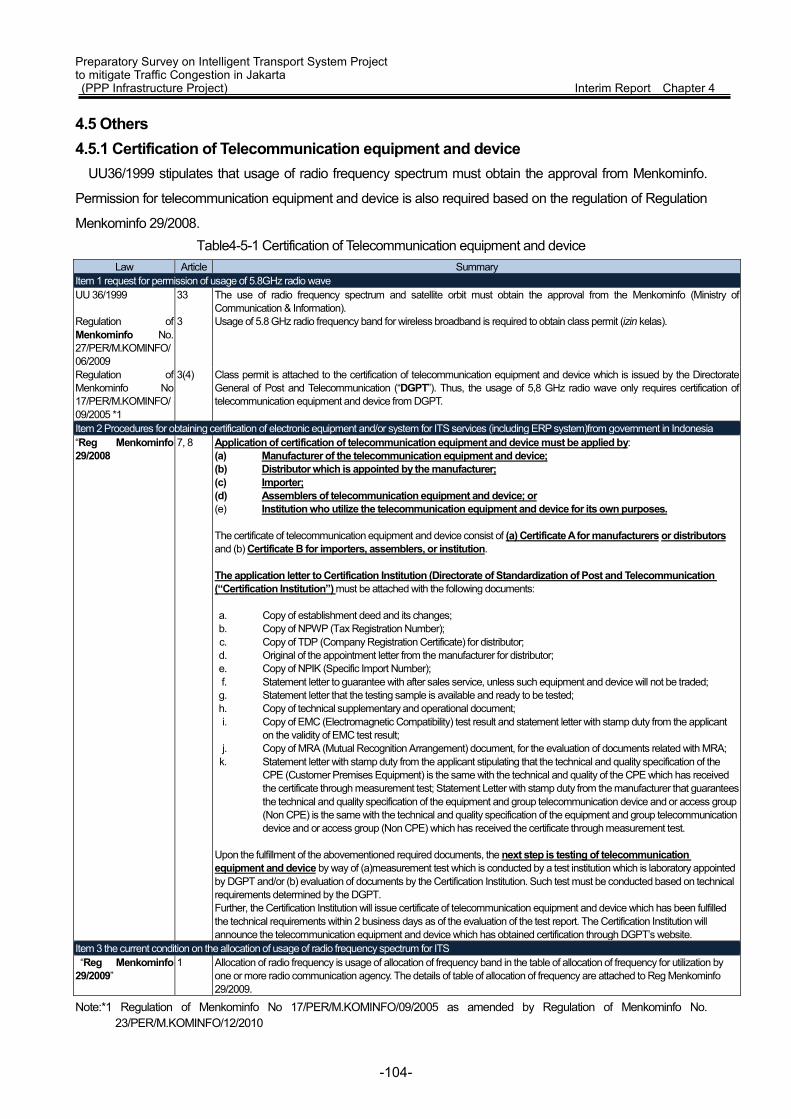
Preparatory Survey on Intelligent Transport System Project to mitigate Traffic Congestion in Jakarta (PPP Infrastructure Project) Interim Report Chapter 4 4.5 Others 4.5.1 Certification of Telecommunication equipment and device
UU36/1999 stipulates that usage of radio frequency spectrum must obtain the approval from Menkominfo.
Permission for telecommunication equipment and device is also required based on the regulation of Regulation
Menkominfo 29/2008. Table4-5-1 Certification of Telecommunication equipment and device
Law Article Summary Item 1 request for permission of usage of 5.8GHz radio wave UU 36/1999
33 The use of radio frequency spectrum and satellite orbit must obtain the approval from the Menkominfo (Ministry of Communication & Information).
Regulation of Menkominfo No. 27/PER/M.KOMINFO/06/2009
3 Usage of 5.8 GHz radio frequency band for wireless broadband is required to obtain class permit (izin kelas).
Regulation of Menkominfo No 17/PER/M.KOMINFO/09/2005 *1
3(4) Class permit is attached to the certification of telecommunication equipment and device which is issued by the Directorate General of Post and Telecommunication (“DGPT”). Thus, the usage of 5,8 GHz radio wave only requires certification of telecommunication equipment and device from DGPT.
Item 2 Procedures for obtaining certification of electronic equipment and/or system for ITS services (including ERP system)from government in Indonesia “Reg Menkominfo 29/2008
7, 8 Application of certification of telecommunication equipment and device must be applied by: (a) Manufacturer of the telecommunication equipment and device; (b) Distributor which is appointed by the manufacturer; (c) Importer; (d) Assemblers of telecommunication equipment and device; or (e) Institution who utilize the telecommunication equipment and device for its own purposes. The certificate of telecommunication equipment and device consist of (a) Certificate A for manufacturers or distributors and (b) Certificate B for importers, assemblers, or institution. The application letter to Certification Institution (Directorate of Standardization of Post and Telecommunication (“Certification Institution”) must be attached with the following documents: a. Copy of establishment deed and its changes; b. Copy of NPWP (Tax Registration Number); c. Copy of TDP (Company Registration Certificate) for distributor; d. Original of the appointment letter from the manufacturer for distributor; e. Copy of NPIK (Specific Import Number); f. Statement letter to guarantee with after sales service, unless such equipment and device will not be traded; g. Statement letter that the testing sample is available and ready to be tested; h. Copy of technical supplementary and operational document; i. Copy of EMC (Electromagnetic Compatibility) test result and statement letter with stamp duty from the applicant
on the validity of EMC test result; j. Copy of MRA (Mutual Recognition Arrangement) document, for the evaluation of documents related with MRA;
k. Statement letter with stamp duty from the applicant stipulating that the technical and quality specification of the CPE (Customer Premises Equipment) is the same with the technical and quality of the CPE which has received the certificate through measurement test; Statement Letter with stamp duty from the manufacturer that guarantees the technical and quality specification of the equipment and group telecommunication device and or access group (Non CPE) is the same with the technical and quality specification of the equipment and group telecommunication device and or access group (Non CPE) which has received the certificate through measurement test.
Upon the fulfillment of the abovementioned required documents, the next step is testing of telecommunication equipment and device by way of (a)measurement test which is conducted by a test institution which is laboratory appointed by DGPT and/or (b) evaluation of documents by the Certification Institution. Such test must be conducted based on technical requirements determined by the DGPT. Further, the Certification Institution will issue certificate of telecommunication equipment and device which has been fulfilled the technical requirements within 2 business days as of the evaluation of the test report. The Certification Institution will announce the telecommunication equipment and device which has obtained certification through DGPT’s website.
Item 3 the current condition on the allocation of usage of radio frequency spectrum for ITS “Reg Menkominfo 29/2009”
1 Allocation of radio frequency is usage of allocation of frequency band in the table of allocation of frequency for utilization by one or more radio communication agency. The details of table of allocation of frequency are attached to Reg Menkominfo 29/2009.
Note:*1 Regulation of Menkominfo No 17/PER/M.KOMINFO/09/2005 as amended by Regulation of Menkominfo No. 23/PER/M.KOMINFO/12/2010
-104-

Preparatory Survey on Intelligent Transport System Project to mitigate Traffic Congestion in Jakarta (PPP Infrastructure Project) Interim Report Chapter 4 4.5.2 Authority of DKI Jakarta
Unlike other provinces of Indonesia, DKI Jakarta has special tasks, rights, obligations and responsibilities as a
capital city of Indonesia. Thus, this section reviews current laws and regulations on the special authority of DKI
Jakarta in terms of ERP introduction.
According to Article 26 (4) of UU 29/2007, to the extent it has not been regulated or in conflicted with other
prevailing laws and regulation of higher hierarchy, the DKI Jakarta provincial government has authority to enact
an implementing regulation within its authority in the field of transportation. The DKI Jakarta provincial
government has the authority for the determination and implementation of policy in the field of transportation.
4.5.3 Spatial Planning/Environment Considering Article 61 of PP 32/2011, introduction of ERP needs to keep a consistency with related spatial
planning. The current urban spatial planning (Rencana Tata Ruang Wilayah) of DKI Jakarta has been approved
by MOHA (which conducts the governmental affairs in the field of spatial) and is stated in Regional Government
Regulation 1/ 2012 concerning Area Spatial Planning of DKI Jakarta 2030. Article 29 of Regional Government
Regulation 1/ 2012 includes implementation of traffic control mechanism in arterial roads. Therefore, this ERP
project is consistent with current urban spatial planning.
-105-