roadmap on signal processing for next generation
TRANSCRIPT

Measurement Science and Technology Roadmap on Signal Processing for Next Generation Measurement Systems
Roadmap on Signal Processing for Next Generation Measurement Systems
Dimitris K. Iakovidis1, Melanie Ooi2, Ye Chow Kuang2, Serge Demidenko3, Alexandr Shestakov4, Vladimir Sinistin4, Manus Henry4,5,6, Andrea Sciacchitano7, Stefano Discetti8, Silvano Donati9, Michele Norgia10, Andreas Menychtas11, Ilias Maglogiannis11, Selina C. Wriessnegger12, Luis Alberto Barradas Chacon12, George Dimas1, Dimitris Filos13,14, Anthony H. Aletras13,14, Johannes Töger13, Feng Dong15, Shangjie Ren15, Andreas Uhl16, Jacek Paziewski17, Jianghui Geng18, Francesco Fioranelli19, Ram M Narayanan20, Carlos Fernandez21, Christoph Stiller21, Konstantina Malamousi1, Spyros Kamnis22, Konstantinos Delibasis1, Dong Wang23, Jianjing Zhang24, Robert X. Gao24
1University of Thessaly, Greece 2University of Waikato, New Zealand 3Sunway University, Malaysia 4South Ural State University, Russia 5Coventry University, United Kingdom 6University of Oxford, United Kingdom 7Delft University of Technology, Netherlands 8Universidad Carlos III de Madrid, Spain 9University of Pavia, Italy 10Politecnico Milano, Italy 11University of Piraeus, Greece 12Institute of Neural Engineering, Graz University of Technology 13Lund University, Skane University Hospital, Sweden 14Aristotle University of Thessaloniki, Greece 15Tianjin University, China 16University of Salzburg, Austria 17University of Warmia and Mazury in Olsztyn, Poland 18Wuhan University, China 19TU Delft, Netherlands 20Pennsylvania State University, USA 21Karlsruhe Institute of Technology (KIT), Germany 22Castolin Eutectic-Monitor Coatings Ltd, United Kingdom 23Shanghai Jiao Tong University 24Case Western Reserve University, USA
This pre-print has been accepted for open access publication in the MST journal, and it will be published soon. Till then, if you wish to cite it please use the following digital object identifier (doi), which will be activated by the publisher, when published.
Iakovidis, D.K., Ooi, M., Kuang, Y.C., Damidenko, S., Shestakov, A., Sinistin, V., Henry, M., Sciacchitano, A., Discetti, A., Donati, S., Norgia, M., Menychtas, A., Maglogiannis, I., Wriessnegger, S.C., Barradas Chacon, L.A., Dimas, G., Filos, D., Aletras, A.H., Töger, J., Dong, F., Ren, S., Uhl, A., Paziewski, J., Geng, J., Fioranelli, F., Narayanan, R.M., Fernandez, C., Stiller, C., Malamousi, K., Kamnis, S., Delibasis, K., Wang, D., Zhang, J., Gao, R.X. Roadmap on Signal Processing for Next Generation Measurement Systems. Measurement Science and Technology, doi: https://doi.org/10.1088/1361-6501/ac2dbd

Measurement Science and Technology Roadmap on Signal Processing for Next Generation Measurement Systems
Abstract Signal processing is a fundamental component of almost any sensor-enabled system, with a wide
range of applications across different scientific disciplines. Time series data, images, and video
sequences comprise representative forms of signals that can be enhanced and analysed for
information extraction and quantification. The recent advances in artificial intelligence and machine
learning are shifting the research attention towards intelligent, data-driven, signal processing. This
roadmap presents a critical overview of the state-of-the-art methods and applications aiming to
highlight future challenges and research opportunities towards next generation measurement
systems. It covers a broad spectrum of topics ranging from basic to industrial research, organized in
concise thematic sections that reflect the trends and the impacts of current and future developments
per research field. Furthermore, it offers guidance to researchers and funding agencies in identifying
new prospects.
Keywords: signal processing, image processing, measurement systems, optical measurements,
machine learning, medicine, biology, remote sensing, environmental applications, industrial
applications
Contents 1. Introduction2. Signal Processing Considerations in Contemporary Measurement Systems
2.1. Signal uncertainty modelling 2.2. Signal processing for IoT-based measurements
3. Optical Measurements3.1. Particle image velocimetry data processing 3.2. Interferometry signal processing
4. Biomedical Measurements4.1. Biosignal processing for pervasive health monitoring 4.2. EEG sensors and signal processing 4.3. Optical image processing for in vivo measurements and diagnostics 4.4. Magnetic Resonance Imaging: Signal processing and simulation 4.5. Ultrasound imaging: Beyond conventional imaging and processing techniques 4.6. Signal and image processing methods for biometrics: The Impact of deep learning
5. Remote Sensing, Environmental, and Industrial Applications5.1. Signal processing for global navigation satellite systems 5.2. Proximal hyperspectral imaging for in-situ plants monitoring 5.3. Through-wall sensing, signal and image processing 5.4. Sensors for automated driving 5.5. Acoustic emission processing for industrial measurement systems 5.6. Signal and image processing for condition monitoring and fault diagnosis 5.7. Data-driven signal processing for additive manufacturing

Measurement Science and Technology Roadmap on Signal Processing for Next Generation Measurement Systems
1. Introduction
Dimitris K. Iakovidis, University of Thessaly
In the history of science, the establishment of signal processing as a discrete field of science is placed in 1940’s [1]. In that decade, masterpiece papers were published, mainly in the context of communications, with a monumental work to be that of Claude Shannon’s “A mathematical theory of communications.” That period signified the progress of signal processing also in the context of other fields, including radar technology, which flourished upon the needs of military applications during World War II [2]. Since then, especially after the revolution of digital technology of the sixties, signal processing has become an integral part of almost any sensor-enabled system.
The applications of signal processing are numerous, extending well-beyond the domain of communications. Multisource temporal data series, two or higher dimensional data structures, such as images and video, can be regarded as signals. Signal quality is affected by different factors, such as the characteristics of the sensors used for their acquisition, and non-deterministic phenomena related to the data acquisition environment. Signal processing methods have been devised to transform the signals so that different application needs are met. Common transformations aim to signal quality or feature enhancement and signal compression. Signal processing methods may precede, or be an integral part, of signal analysis methods, aiming to reveal important information about the content of the signals, including their semantics and the measurement of observable quantities. It is therefore evident that there are strong dependencies between sensor-based measurements and signal processing, either in the preparation phase or in the analysis phase of the signals considered by a measurement system.
In the recent years, the increase of computational resources has triggered a remarkable progress on adaptive systems with generic architectures, enabling the solution of more and more difficult signal processing and analysis problems. Such systems are the basis of machine learning and artificial intelligence (AI), and today, complex architectures, such as deep artificial neural networks (DNNs) [3], may include millions of free parameters that can be tuned by an algorithm to infer solutions, based solely on the input data. This trend, usually referred to as deep learning, has already entered the domain of measurement science, with several works indicating the effectiveness of today’s machine learning methods to solve measurement problems.
This roadmap presents a critical overview of the state-of-the-art signal processing and analysis methods and applications, aiming to highlight future challenges and perspectives towards next generation measurement systems. These are measurement systems of the Fourth Industrial Revolution, leveraging and contributing to the scientific and technological advancements of the next decades. It is organized in four sections. Section 2 identifies issues related to signal processing that are worth considering in contemporary measurement systems. These include uncertainty modelling, which is a fundamental issue that is still open, and issues related to networked multisensor measurement systems based on Internet of Things (IoT) technologies. Section 3 identifies challenges with respect to signal processing for optical measurement systems. In this direction signal processing perspectives are discussed in the context of particle image velocimetry and interferometry. Sections 4 and 5 deal with a broad spectrum of applications, where measurement quality and efficiency can have a significant societal or economic impact. These span to biomedical, remote sensing, environmental, and industrial domains.
Many of the challenges and perspectives identified in this roadmap are associated with machine learning, which is undoubtedly a promising direction. However, it should not be considered as a panacea for the treatment of any signal processing or measurement problem. By taking a closer look to a problem under investigation and by understanding the involved physical processes other solutions, either without or combining deep learning with knowledge about the problem under

Measurement Science and Technology Roadmap on Signal Processing for Next Generation Measurement Systems
investigation, could be more efficient. This is also highlighted in the roadmap, along with a multitude of other directions for novel research results and progress.
References
[1] Nebeker N. Fifty years of signal processing: The IEEE signal processing society and its technologies 1948-1998. The IEEE Signal Processing Society. 1998.
[2] Richards MA. Fundamentals of radar signal processing. McGraw-Hill Education; 2014. [3] Shrestha A, Mahmood A. Review of deep learning algorithms and architectures. IEEE Access.
2019 Apr 22;7:53040-65.

Measurement Science and Technology Roadmap on Signal Processing for Next Generation Measurement Systems
2.1. Signal uncertainty modelling Melanie Ooi, University of Waikato Ye Chow Kuang, University of Waikato Serge Demidenko, Sunway University
Status
Since the advent of the digital revolution, the volume of data acquisition and processing has been
growing at an alarming rate. It has been fuelled by new technologies and tools as well as by the naïve
confidence that there would be wisdom and knowledge within the acquired data that can reveal new
insights. However, the confidence in data-driven decision-making does not depend on the amount but
rather on the usefulness of data [1]. Data usefulness can be generally categorised into (1)
discrimination of what is relevant, (2) interpretation of the information acquired, and (3) identification
of sources, measurement, and management of uncertainties of the data (signals) as they inherently
affect the operations of data-driven systems.
It is therefore crucially important to account for uncertainties when employing or designing such
systems especially in mission-critical domains such as health, environment, security, etc. The sources
of uncertainties are associated with the measurement of system input signals as well as with the
processing of these signals by the system itself (that is naturally not perfect and having physical,
technical, performance, and other constraints). The technique to infer output uncertainties given the
uncertainties of input is known as the propagation of uncertainty. Known uncertainties of the inputs
to a known measurement system can be propagated through a model of the system to find the
probability density function or cumulative distribution function of the constraints, allowing
characterisation of the uncertainties imposed by the system. This, in turn, facilitates various types of
system analysis where needed. If no adequate model of the system is known, a model can be
developed by measuring input quantities in relation to output quantities to determine their
relationship.
Current and Future Challenges
The Guide to the Expression of Uncertainty in Measurement (GUM) [2] outlines three methods to
evaluate the propagation of uncertainty:
a) GUM uncertainty propagation framework. This analytical approach is sufficient for largely linear
cases. Unfortunately, it can be inaccurate in real-world scenarios in presence of non-linearities.
b) Monte Carlo simulation. It is valid for wider classes of uncertainty estimation problems. However,
it is computationally more expensive and requires large simulation sizes for complex problems
thus limiting its use.
c) Analytical methods based on statistical moments. In fact, the GUM uncertainty framework
outlines the simplest form of the moment-based method with just two moments: mean and
standard deviation. This somewhat limits the framework’s application since just two moments
are insufficient to model complex problems.
A concise yet quite comprehensive outline of the area of modelling uncertainty of signals can be found
in [3] published almost a decade ago. There have been a large number of new results in this very active
research domain including signal uncertainty evaluation, propagation through the measurement

Measurement Science and Technology Roadmap on Signal Processing for Next Generation Measurement Systems
procedures, modelling, applications, etc., while further extending the foundations formulated by
GUM, e.g., [4-7]. This area continues to expand while progressing to address the numerous
challenges, such as advancing approaches for uncertainty evaluation for time-dependent
measurements and their implementation for routine applications, increasing efficiency and reducing
the cost of a Monte Carlo method for uncertainty evaluation, studying advanced approaches based
on computing moments of higher orders of the output-of-interest, developing computationally
efficient uncertainty evaluation techniques and tools enabling real-time applications, and so on.
Advances in Science and Technology to Meet Challenges
Among the promising advances in the field under discussion is the analytical modelling of the
uncertainty within a process of technical design optimisation. Uncertainty evaluation tools are
employed to estimate the reliability and robustness of proposed design solutions. Here the reliability
reflects the level of confidence in meeting a physical design constraint, whereas robustness refers to
the sensitivity of an output to the uncertainties in the inputs. This method has been implemented in
the structural design [8], whereby the overall reliability and robustness of a prescribed constraint of
the structure comprising many elements (e.g., beams, columns, etc.), is often sought-after based on
the knowledge of uncertainty of each element. This information is then fed into deterministic
optimization algorithms (i.e., where uncertainties of the design parameters are not considered) to find
the best design solution while minimising weight/cost and meeting the physical constraints with a
desired level of reliability along with less susceptibility to the system uncertainties. As a result, a design
that meets the required reliability and safety can be achieved. This technique likely would be
applicable to designing measurement systems with numerous sensor elements.
Modelling uncertainty propagation within a complex system will be an important tool to build a robust
decision-making system. And herein lies the problem – the existing uncertainty propagation methods
have historically been focused on techniques that serve the main role of reporting/estimating output
uncertainty and are confined to static or quasi-static operating environments [9]. State-of-the-art
techniques are capable of evaluating input-output uncertainty of systems represented by linear or
polynomial functions. Theoretical advances to estimate input-output uncertainty of the systems
representable by more flexible models such as radial basis functions or artificial neural networks
would expand the ability to estimate uncertainty in complex decision making. In the cases where
closed-form solutions cannot be found, limiting solutions (similar to the central limit theorem) could
provide useful theoretical bound in the design of large and complex signal processing systems. Further
investigations, development and introduction of such improved techniques will help to advance the
research subject area of uncertainty propagation beyond the current boundaries.
Technical challenges for uncertainty evaluation and modelling are mainly associated with complex
signal processing structures having a multitude of distributed inputs and outputs deployed to carry
out long-term missions in varying environments (e.g., large-scale IoT systems) where the data
reliability and system stability are not guaranteed. This would negatively affect the fundamental items
of dealing with uncertainties – calibration (and system identification) and traceability [10]. A viable
solution would be self-adaptive sensing with soft-calibration using the acquired data, where yet again,
signal and uncertainty modelling would play a central role in developing efficient and robust self-
tuning algorithms. Transferability between applications would be important to enable cost-effective
large-scale integration. Improving data acquisition and sensor fusion have to be achieved as well as

Measurement Science and Technology Roadmap on Signal Processing for Next Generation Measurement Systems
optimisation of the computational efficiency (e.g., achieving the best trade-off between
computational accuracy versus resource utilization [11]) would also need to be advanced.
Concluding Remarks
It can be expected that the future intelligent measurement systems with embedded data-driven
decision-making will continue to be characterised by the large-scale long-term deployment of
multitudes of sensing elements connected to high-performance signal or data processing equipment.
The uncertainty associated with the signals or data arriving from the sensing elements is to be
accounted for along with the uncertainty of signal processing in time or complex digital computations
performed by the system thus supporting the avoidance of unintended wrong decisions or results at
the system outputs. And that is where lies the importance of the advancement of the theory, practice
and tools for uncertainty modelling and evaluation (a good example of an uncertainty evaluation tool
is given in [12]). The progress achieved in many topics associated with this field in recent years has
been very significant. Yet, in terms of finding more general solutions that would be required for the
design and deployment of the next-generation measurement systems, the challenges are serious.
Acknowledgements
The authors would like to express appreciation for the support provided to their research by the IEEE
Instrumentation and Measurement Society, Massey University, and Royal Society of New Zealand. The
valuable contributions made by A. Rajan, H. Carstens, and R. Zhang are acknowledged with thanks.
References
[1] Petri D 2020 IEEE Instrum. Meas. Mag. 23 32-34
[2] BIPM, IEC, IFCC, ILAC, ISO, IUPAC, IUPAP and OIML 2008 Guide to the Expression of Uncertainty
in Measurement JCGM 100:2008, GUM 1995 with minor corrections
www.bipm.org/utils/common/documents/jcgm/ JCGM 100 2008 E.pdf
[3] Hessling J P 2013 Deterministic Sampling for Quantification of Modeling Uncertainty of Signals
Digital Filters and Signal Processing ed F P Marquez and N Zaman (London: IntechOpen)
[4] Rajan A, Kuang Y C, Ooi M P-L, Demidenko S N and Carstens H 2018 IEEE Access 6 4072-4082
[5] Eichstädt S, Wilkens V, Dienstfrey A, Hale P, Hughes B and Jarvis C 2016 Metrologia 53 S125-
S135
[6] Mohammadi S and Cremaschi S 2019 Comput. Aided Chem. Eng. 47 487-492
[7] Aien M, Hajebrahimi A and Fotuhi-Firuzabad M 2016 Renew. Sust. Energ. Rev. 57 1077-1089
[8] Rajan A, Kuang Y C, Ooi M P-L and Demidenko S 2019 IEEE Instrum. Meas. Mag. 22 27-32
[9] Cheng Z-Y, Jiang W-S, Lei Y-J, Li R-J, Zhang L-S, Huang Q-X and Fan K-C 2020 Uncertainty
evaluation for dynamic identification of a micro contact probe based on the signal transmission
chain analysis method Meas. Sci. Technol. 31 125007
[10] Ferrero A and Petri D 2015 Measurement models and uncertainty Modern Measurement
Fundamentals and Applications ed A Ferrero et al (Hoboken, NJ: John Willey & Sons)
[11] Zhang R, Rajan A, Kuang Y C, Ooi M P-L and Demidenko S N 2018 IEEE International
Instrumentation and Measurement Technology Conf.
[12] Eichstädt S and Wilkens V 2016 GUM2DFT – a software tool for uncertainty evaluation of
transient signals in the frequency domain Meas. Sci. Technol. 27 055001

Measurement Science and Technology Roadmap on Signal Processing for Next Generation Measurement Systems
2.2. Signal Processing for IoT-based Measurements Alexandr Shestakov1, Vladimir Sinistin1, Manus Henry1,2,3 1South Ural State University, 2Coventry University, 3University of Oxford
Status
Recent decades have seen rapid developments in the scope and sophistication of networked sensor
technology, particularly within the context of the Internet of Things (IoT) [1, 2]. The IoT raises a wide
range of technical challenges for distributed sensing, including the development of energy-aware data
acquisition systems, localization of mobile IoT nodes, synchronization protocols, and security [3].
Further questions arise concerning basic measurement functionality. The default assumption is that
the measurement calculation and associated signal processing should be identical to that of an
equivalent non-networked sensor. Perhaps, even simplified measurement calculations may be
employed to reduce the complexity, cost and power consumption of the local device, if it can also be
assumed that, at the network level, sophisticated data fusion may overcome the metrological
limitations of individual sensing nodes. An alternative approach, promoted via an IEEE Recommended
Practice [4, 5], would claim that ‘a paradigm shift in the sensor world is on the horizon: the signal will
be processed entirely at the point of measurement (POM)’, i.e. that more, not less, measurement
calculation should be performed locally, in order to reduce power, communication bandwidth and
data storage requirements. The challenge is to develop schemes whereby local signal processing in
individual nodes can be configured and modified, ideally as directed by the network level. For
example, certain Fieldbus protocols, developed in the 1990s for industrial applications [1], provide a
limited capability for downloading signal processing tasks into local nodes. A valve position can be
modified using a control algorithm downloaded into a nearby temperature, pressure or flow sensor,
for example. However, this capability is limited to distributing fixed function blocks (e.g. PID) across
the device network. Here we present two promising techniques that provide more flexible, localised
signal processing within the IoT domain. The first technique [5] provides a universal framework for
extracting features from a measurement signal, resulting in a compact form of signal encoding. The
second technique [6] provides a low cost, modular signal processing block that can be flexibly
configured to perform a wide range of signal processing tasks, including for IoT devices.
Current and Future Challenges
IoT roll-out will generate an exponential rise in the number of sensing nodes, deployed in diverse
environments. This poses challenges to designers and users, whether of individual components or
entire systems. “As systems become more interconnected and diverse, architects are less able to
anticipate and design interactions among components, leaving such issues to be dealt with at runtime.
Soon systems will become too massive and complex for even the most skilled system integrators to
install, configure, optimize, maintain, and merge” (cited in [6]). Big data and machine learning
techniques have made remarkable progress in implementing top-down analysis, condition
monitoring, and efficient operation for a wide range of complex systems. However, the question arises
as to what signal processing capabilities might be provided at the lowest level to support autonomous
and adaptive systems at higher levels, while also minimising processing and data bandwidth. Such
developments would counteract the sometimes low priority currently afforded software development
for IoT devices, where “… often software engineering is the last activity after mechanical and electrical
design, facing a lack of information and limited development time because of delays in the other
disciplines. On the other hand, bugs created in other disciplines need to be fixed by means of

Measurement Science and Technology Roadmap on Signal Processing for Next Generation Measurement Systems
software” (cited in [6]). One route to new capability is to develop signal processing means to
characterise real-time measurement behaviour through a compact form of coding, as a further stage
of processing beyond the basic measurement. This should be simple enough to be implemented within
any sensor node, while being sufficiently expressive to support a wide range of potential uses at both
the local (sensor to sensor, sensor to actuator) and the system level. Another route is to consider
whether sensor signal processing tasks can be characterised in a modular, parameterised form, so that
task modification or augmentation can be compactly defined and communicated by the system down
into the individual sensing node. This would facilitate flexible and adaptive processing of high
bandwidth transducer data and produce high information content, low bandwidth, and possibly
bespoke measurements, as required and requested by the higher-level system.
Advances in Science and Technology to Meet Challenges
The IEEE Recommended Practice 21451 [5] provides an interpolation-based segmentation algorithm
to encode any time series into a sequence of signal shapes. It is intended for real-time operation within
any sensor and provides a standard means of signal identification and information fusion. Figure 1
shows the set of segment types, an example signal, and its corresponding coding vector: C is the
character type, while M and T are timing markers. The technique excludes amplitude information, as
it aims to encode only shape. However, maxima and minima are readily identified at the intersections
of specific segment pairs – for example, maxima occur at “de”, “df”, “ge”, or “gf” junctions. A simple
application example [5] consists of heating liquid in a tank, where the heating actuator asks the
temperature sensor to verify that the temperature is rising. The recommended signal shape
characterisation is sufficient to support decentralised, ad-hoc interactions between devices, including
the formulation of requests that can be interpreted and answered with low bandwidth yes/no
responses. The Prism [6, 7] is a linear phase FIR filter where, unusually, the calculation is recursive so
that the computational cost per sample is low and fixed, irrespective of filter length. Prism design and
instantiation, given desired parameter values, is also trivial. This design simplicity and low
computational cost support the use of Prism networks to carry out a variety of signal processing tasks,
including low-pass, bandpass and notch filtering, and tracking [6], whereby
frequency/phase/amplitude values are calculated for a sinusoidal, typically post-filtered, signal.
Spectral analysis is also supported [8]. These properties enable the creation of new signal processing
schemes within networked sensors on an ad-hoc, as needed basis. Figure 2 summarises a
demonstrator: a wireless acceleration sensor [9] measures angular acceleration for condition
monitoring of rotating machinery. A chipped or broken gear tooth results in modulation in the
amplitude of the 4th harmonic of the rotation frequency; a Prism signal processing scheme can be
instantiated for real-time tracking of this parameter to provide fault detection [10], where in this case
the scheme is instantiated to support the current (assumed steady) speed of rotation.

Measurement Science and Technology Roadmap on Signal Processing for Next Generation Measurement Systems
Figure 1 – We allow at most two figures that
are roughly the size of this box.
Figure 1. (upper) Classes for defining line segments; (lower) example of signal description using mark, class, tempos notation; from
[4], permission sought for reproduction
Figure 2. (top left) wireless acceleration sensor; (top right) sensor mounted on gear box; (middle) time-varying amplitude of 4th
harmonic for normal, chipped and broken gear; (bottom) Prism-based signal processing network to diagnose gear fault; from [10],
permission applied for.

Measurement Science and Technology Roadmap on Signal Processing for Next Generation Measurement Systems
Concluding Remarks
A comprehensive approach to the evolution of the Internet of Things should include a reconsideration
of how signal processing tasks can be defined and implemented. The development of novel techniques
to facilitate flexible and adaptive calculations at the Point of Measurement, i.e. within the sensing
node itself, will help to reduce the computational, communication and data storage requirements that
will continue to constrain the power and sophistication of fully autonomous systems. Current research
typically considers, on the one hand, IoT implementations of well-established signal processing
techniques, such as frequency estimation [11] or filtering [12], or on the other hand, application-
specific requirements such as for healthcare [13, 14]. The two techniques described here suggest the
potential for developing novel signal processing approaches to support localised, flexible signal
processing as required by IoT. The examples provided are an encoding technique to characterise the
shape of any signal, and the Prism, a recursive FIR signal processing building block with low design and
computational cost. The diversity of these approaches suggest that alternative valuable techniques
await discovery and application in future research programmes.
References
[1] Wollschlaeger M, Sauter T, and Jasperneite J, 2017 “The Future of Industrial Communication”
IEEE Industrial Electronics Magazine 11 17–27.
[2] Al-Fuqaha A, Guizani M, Mohammadi M, Aledhari M and Ayyash M 2015 "Internet of Things: A
Survey on Enabling Technologies, Protocols, and Applications" IEEE Communications Surveys &
Tutorials 17 2347-2376.
[3] Balestrieri E, De Vito L, Lamonaca F, Picariello F, Rapuano S, Tudosa I 2018 ”Research challenges
in measurements for Internet of Things systems” Acta IMEKO 7 82-94.
[4] Monte G, Huang V, Liscovsky P, Marasco P, and Agnello A 213 “Standard of things, first step:
Understanding and normalizing sensor signals” IECON 2013 - 39th Annual Conference of the IEEE
Industrial Electronics Society.
[5] IEEE Standard 21451-001-2017: Recommended Practice for Signal Treatment Applied to Smart
Transducers 2017.
[6] Henry M, Leach F, Davy M, Bushuev O, Tombs M, Zhou F, and Karout S 2017 “The Prism:
Efficient Signal Processing for the Internet of Things” IEEE Industrial Electronics Magazine 11
22–32.
[7] Henry M 2020 “The Prism: recursive FIR signal processing for instrumentation applications” IEEE Transactions on Instrumentation and Measurement 69 1519-1529.
[8] Henry M 2021 “Spectral Analysis Techniques using Prism Signal Processing” Measurement 169
108491.
[9] Sinitsin V and Shestakov A 2017 “Wireless acceleration sensor of moving elements for condition monitoring of mechanisms” Measurement Science and Technology 28 094002.
[10] Henry M and Sinitsin V 2018 “Prism Signal Processing for Machine Condition Monitoring II: Experimental Data and Fault Detection”, 1st IEEE International Conference on Industrial Cyber-Physical Systems.
[11] Campobello G, Segreto A and Donato N 2021 "A Novel Low-Complexity Frequency Estimation Algorithm for Industrial Internet-of-Things Applications" IEEE Transactions on Instrumentation and Measurement 70 1-10.
[12] Giouroukis D, Dadiani A, Traub J, Zeuch S, and Markl V 2020 “A survey of adaptive sampling and filtering algorithms for the internet of things” 14th ACM International Conference on Distributed and Event-based Systems 27-38.

Measurement Science and Technology Roadmap on Signal Processing for Next Generation Measurement Systems
[13] Jin Y, Liu Y, and Si W 2020 “Editorial for the Special Issue on Intelligent Agent Distributed Signal Processing for IoT” Journal of Ambient Intelligence and Humanized Computing 11 447–449.
[14] Muhammad G, Alshehri F, Karray F, El Saddik A, Alsulaiman M, Falk T 2021 “A comprehensive survey on multimodal medical signals fusion for smart healthcare systems” Information Fusion 76 355-375.

Measurement Science and Technology Roadmap on Signal Processing for Next Generation Measurement Systems
3.1. Particle Image Velocimetry data processing Andrea Sciacchitano, Delft University of Technology Stefano Discetti, Universidad Carlos III de Madrid
Status
Particle Image Velocimetry (PIV) is a well-established versatile technique for velocity measurements
of fluid flows. PIV is nowadays used in an impressively wide spectrum of applications, covering
aerodynamics, biomedical flows, meteorology, oceanography, industrial applications and many more.
The unique feature of PIV is its capability to deliver instantaneous velocity fields, thus enabling
computation of vorticity fields and identification of coherent structures. Although with a wealth of
variants, the processing of PIV images has reached a mature state. The core of the process is the use
of algorithms to track the motion of particle images, in most cases based on either cross-correlation
analysis [1] or individual tracking Error! Reference source not found.. PIV algorithms have been
progressively refined along the last three decades, leading to a sophisticated combination of image
pre-conditioning and processing techniques [3] able to deliver a highly accurate flow characterization
in an impressive range of conditions. Removal of unwanted background reflections from the image
recordings is typically carried out by subtraction of the time-minimum or time-average pixel intensity.
In most cases the velocity field is retrieved via cross-correlation analysis on small regions, often
referred to as interrogation windows, covering the flow field (see Figure 1). The process is generally
multi-step, iterative, with progressive grid refinement. A detection, removal and correction of outliers
is normally carried out after each pass. A-posteriori quantification of the measurement uncertainty is
nowadays possible based e.g. on the analysis of the correlation statistics [4]. For three-dimensional
flow measurements by tomography, the Shake-the-Box algorithm [5], based on the iterative particle
reconstruction coupled with prediction and correction of the particle images positions along individual
trajectories (see Figure 2), has demonstrated higher accuracy and efficiency with respect to
correlation-based algorithms.
PIV is now considered the dominant method in experimental flow characterization, and it is the most
prominent candidate to provide full flow description in experiments. This is particularly relevant in
applications where numerical simulations are either not reliable or not even feasible. While PIV
processing can now be regarded as well established, large margins for improvement are foreseen with
a clear reward ahead. PIV is still considered a technique for expert practitioners and with significant
user-dependence on the results, being this especially true for volumetric measurements.
Furthermore, we have witnessed the progressive increase in data size and dimensionality of PIV along
its history, starting from few instantaneous snapshots of planar measurements to thousands of time-
resolved volumetric representations of flow fields, each one including tens of thousands of vectors.
The complete flow description is extremely attractive for validation of numerical methods and is
fostering research efforts in data assimilation.

Measurement Science and Technology Roadmap on Signal Processing for Next Generation Measurement Systems
Current and Future Challenges
Despite the widespread use of PIV in research laboratories worldwide, applications of the technique
in the industrial environment are hindered by several limitations concerning both the measurement
hardware and the data processing algorithms. Those include: the relatively small size of the
measurement domain; the large times required for system calibration; the presence of unwanted laser
light reflections, which locally hinder the evaluation of the flow velocity; the limited dynamic spatial
and velocity ranges, both not exceeding O(100) [6]; the dependence of the measurement results upon
the user’s expertise, and in particular the selection of the processing algorithm; the limited knowledge
on the measurement uncertainty. These issues are further exacerbated when three-dimensional flow
measurements are performed, due to the use of multiple cameras and volumetric illumination.
Notwithstanding these difficulties, research efforts in the last decade have led to establish volumetric
PIV as a standard tool for research [8]. Time-resolved velocity measurements are now available up to
frequencies approaching 1 MHz [9], thus opening an unprecedented perspective for complete
moderate-to-high-Reynolds number flow characterization. Nevertheless, the high frequency content
of the velocity spectra is typically inaccessible due to measurement noise; currently, it is not clear
whether multi-frame processing algorithms are capable to suppress the measurement noise without
filtering the physical fluctuations. Enforcing first principles to extract field measurements of pressure
[10] and scalar transport has pushed PIV in the last years beyond the mere measurement of kinematic
quantities. Such approaches require high-repetition-rate equipment to achieve time resolution, thus
limiting their applicability to relatively low speed flows. A current challenge is to overcome this
limitation to transform PIV into a robust complete-flow-characterization tool in experimental
aerodynamics.
Figure 1. Analysis of double frame PIV recording based on digital cross-correlation. Reprinted with permission from [6].
Figure 2. Schematic description of the Shake-the-Box algorithm. Reprinted with permission from [5].

Measurement Science and Technology Roadmap on Signal Processing for Next Generation Measurement Systems
Advances in Science and Technology to Meet Challenges
Advances in high-repetition rate equipment, seeding particles for small response time, as well as
multi-frame image interrogation algorithms, will be key enablers for MHz-range PIV [11], thus
unveiling flow dynamics occurring at high-frequencies.
Bridging the gap between research laboratories and industry requires a higher level of automation in
the PIV data acquisition and processing. Robotic PIV systems have been introduced [12] to enlarge the
size of the measurement domain to cubic metres without compromising the data acquisition time.
The development of Artificial Intelligence approaches is considered crucial to optimise both image
acquisition (automatic identification of viewing directions, measurement regions and number of
samples to maximise the data quality) and data processing (user-independent optimisation of the
processing parameters). Furthermore, robust uncertainty quantification methodologies based on the
Design of Experiments framework shall be introduced that quantify the uncertainty associated with
each of the relevant error sources [13]. Finally, image and data compression approaches will be crucial
to enable researchers and engineers to handle the incredible wealth of flow information acquired.
Advances in Data Fusion and Data Assimilation approaches will have a key role in enriching the
measurement data by enabling the determination of flow properties otherwise not accessible, such
as surface pressure and wall shear stress, thus leading to the evaluation of the aerodynamic load
distributions, or flow scales beyond the Nyquist limit imposed by the spatial sampling with particles.
Promising pathways include imposing the compliance with the governing equations of fluid motion,
either based on the Navier-Stokes or on the Lattice-Boltzmann formulations, and the use of variational
data-assimilation frameworks employing adjoint Computational Fluid Dynamics.
Machine-learning algorithms are also expected to be a key player in addressing the challenges to
increase the robustness and user-independence of PIV image processing. Promising research avenues
are opened by the deployment of deep-learning algorithms. The perspective of such methods is to
exploit the recent advances of computer vision to increase the temporal and spatial resolution of PIV
beyond the limits of the image acquisition system. The developments in super-resolution machine-
learning algorithms (see, for instance, Generative Adversarial neural Networks) are now offering
intriguing research pathways. This is expected to stimulate research efforts on novel physics-informed
algorithms since in most of the applications of PIV the underlying equations are known and can be
enforced to regularize the final output. Furthermore, machine-learning algorithms can pave the way
towards embedding time-resolution in standard low-repetition-rate PIV using sparse high-repetition-
rate simultaneous measurements, thus easing the achievement of a complete flow dynamics
characterization.
Concluding Remarks
PIV is offering the perspective of a complete technique for flow characterization, with robust and
reliable measurements to validate numerical simulations and to explore configuration where
simulations are not accessible. The main challenges ahead are identified in the improvement of the
flexibility and robustness of the technique to ease its transition from being a specialized technique to
a standard tool also in industrial practice. Although hardware advances are foreseen as a strong
beneficial asset for this process, very promising opportunities in this direction are offered by advanced
signal processing. A strong embedding of first physical principles by means of data fusion, data
assimilation or physics-informed deep-learning methods is expected to be a key player in the next

Measurement Science and Technology Roadmap on Signal Processing for Next Generation Measurement Systems
years. The recent advances in computer vision are also already contributing to setting up a new
generation of PIV processing methods, opening new perspectives for improved accuracy, mitigation
of the user dependence, and for uncertainty quantification.
Acknowledgements
SD acknowledges funding from the European Research Council (ERC) under the European Union’s
Horizon 2020 research and innovation programme (grant agreement No 949085).
References
[1] Scarano F. Iterative image deformation methods in PIV. Measurement Science and Technology. 2001 Nov 23; 13(1):R1.
[2] Nishino K, Kasagi N, Hirata M. Three-dimensional particle tracking velocimetry based on automated digital image processing. Journal of Fluids Engineering. 1989 Dec 1; 111(4):384-391.
[3] Kähler CJ, Astarita T, Vlachos PP, Sakakibara J, Hain R, Discetti S, La Foy R, Cierpka C. Main results of the 4th International PIV Challenge. Experiments in Fluids. 2016 Jun 1;57(6):97.
[4] Wieneke B. PIV uncertainty quantification from correlation statistics. Measurement Science and Technology. 2015 Jun 5; 26(7):074002.
[5] Schanz D, Gesemann S, Schröder A. Shake-the-Box: Lagrangian particle tracking at high particle image densities. Experiments in fluids. 2016 May; 57(5), 1-27.
[6] Raffel M, Willert CE, Scarano F, Kähler CJ, Wereley ST, Kompenhans J. Particle image velocimetry: a practical
guide. Springer; 2018 Apr 3.
[7] Westerweel J, Elsinga GE, Adrian R J. Particle image velocimetry for complex and turbulent flows. Annual
Review of Fluid Mechanics. 2013 Jan 3; 45:409-436.
[8] Discetti S, Coletti F. Volumetric velocimetry for fluid flows. Measurement Science and Technology. 2018 Mar 6; 29(4):042001
[9] Beresh SJ, Spillers R, Soehnel M, Spitzer S. Extending the Frequency Limits of" Postage-Stamp PIV" to MHz Rates. In AIAA Scitech 2020 Forum 2020 (p. 1018).
[10] Van Gent PL, Michaelis D, Van Oudheusden BW, Weiss P É, de Kat R, Laskari A,Jeon YJ, David L, Schanz D, Huhn F, Gesemann S. Comparative assessment of pressure field reconstructions from particle image velocimetry measurements and Lagrangian particle tracking. Experiments in Fluids. 2017 Apr1; 58(4), 33.
[11] Beresh SJ. Time-resolved particle image velocimetry. Measurement Science and Technology. 2021 Jun 7. [12] Jux C, Sciacchitano A, Schneiders JF, Scarano F. Robotic volumetric PIV of a full-scale cyclist. Experiments in
Fluids. 2018 Apr; 59(4), 1-15. [13] Sciacchitano A. Uncertainty quantification in particle image velocimetry. Measurement Science and
Technology. 2019 Jul 19; 30(9):092001.
Measurement Science and Technology Roadmap on Signal Processing for Next Generation Measurement Systems
3.2. Interferometry Signal Processing Silvano Donati, University of Pavia and Michele Norgia, Politecnico Milano
Status
Interferometry conveys information about distance and changes in distance by the interference of a
sinusoidal light signal that is transmitted with its reflection from an object of interest, such as a mirror
or a diffusing target. The interferometric signal to be processed comes from a photodetector; ideally
the signal to be processed has the form:
I=I0[1+m cos (2ks+0)] (1)
This is the output signal obtained at the photodetector as the beating of the reference beam ER=E00
exp it, and the measurement beam propagated forth and back to the target at distance s, ES=ES0exp
i(t-2ks). We wish to trace back the distance s or displacement s contained in the phase term
=2ks+0 under the cosine function. Specifically, s=s(t) is the time-dependent distance of the target, I
is the photodetector current, I0 = E002+ ES0
2 its mean value, m=2 ES0E00/I0 the modulation index (or fringe
visibility), =2ks the interferometric phase accumulated over the path 2s, k=2 the wavevector and
the wavelength, and 0 a constant phase term, equal to arm imbalance in a two-beam
interferometer [1,2]. While the problem is trivial when s(t) is monotonic, because we can invert (1) as
s(t)= (1/2k) arccos [(I/I0 -1)/m]- 0, as soon as s(t) has minima or maxima the cosine function periodicity
(or the multi-values of arccos) prevent to obtain an unambiguous inversion.
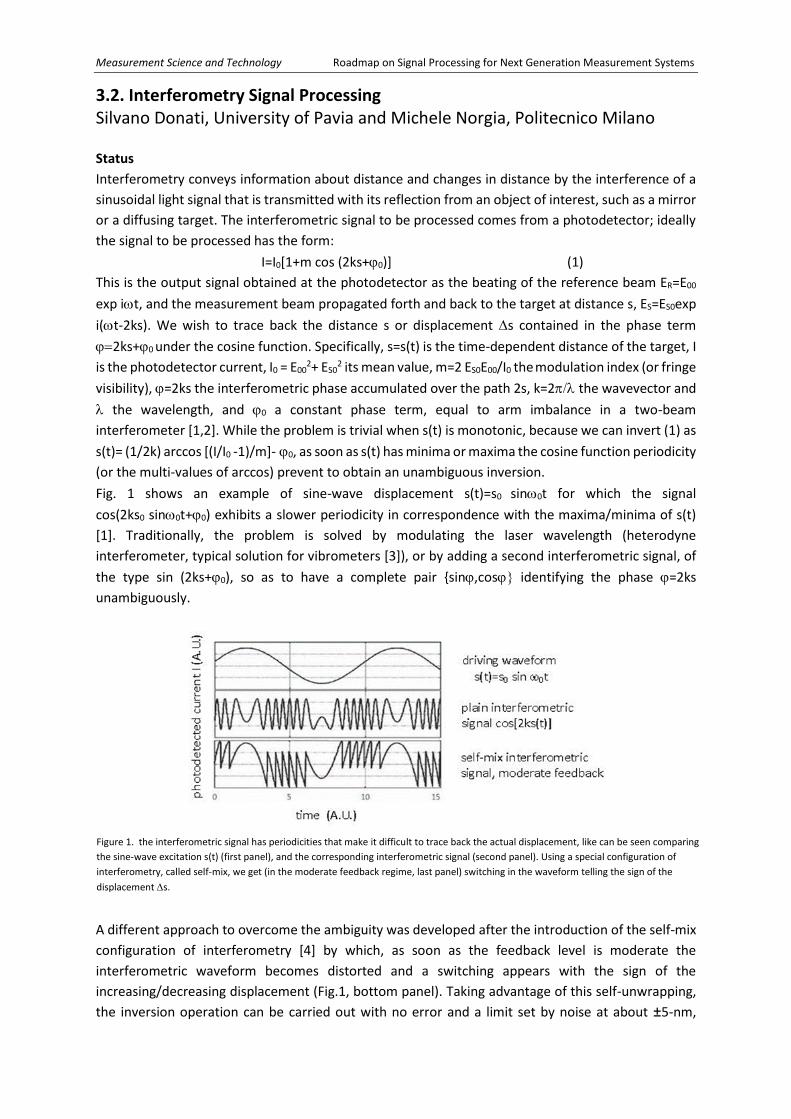
Fig. 1 shows an example of sine-wave displacement s(t)=s0 sin0t for which the signal
cos(2ks0 sin0t+0) exhibits a slower periodicity in correspondence with the maxima/minima of s(t)
[1]. Traditionally, the problem is solved by modulating the laser wavelength (heterodyne
interferometer, typical solution for vibrometers [3]), or by adding a second interferometric signal, of
the type sin (2ks+0), so as to have a complete pair {sin,cos identifying the phase =2ks
unambiguously.
A different approach to overcome the ambiguity was developed after the introduction of the self-mix
configuration of interferometry [4] by which, as soon as the feedback level is moderate the
interferometric waveform becomes distorted and a switching appears with the sign of the
increasing/decreasing displacement (Fig.1, bottom panel). Taking advantage of this self-unwrapping,
the inversion operation can be carried out with no error and a limit set by noise at about ±5-nm,
Figure 1. the interferometric signal has periodicities that make it difficult to trace back the actual displacement, like can be seen comparing
the sine-wave excitation s(t) (first panel), and the corresponding interferometric signal (second panel). Using a special configuration of
interferometry, called self-mix, we get (in the moderate feedback regime, last panel) switching in the waveform telling the sign of the
displacement s.

Measurement Science and Technology Roadmap on Signal Processing for Next Generation Measurement Systems
provided the parameter of the experiment (feedback factor C and linewidth enhancement ) are
known [5].
Current and Future Challenges
The first challenge of interferometric measurements is that of applications to mechanical engineering
[6] and machine tool control is to work on native, untreated surfaces (the non-invasiveness feature)
and this means that the phase measurement shall be carried out in the speckle pattern regime [1] of
optical field returning from the target. The speckle statistics corrupts both amplitude and phase of the
returning field. In amplitude, we have fading of the signal, with the occurrence of dark speckles with
near-to-zero amplitude, whereas the phase error amounts to a full 2 every time we go out of a
coherence region or swing out of the speckle size. Amplitude fading is defeated by operating in space
(or eventually wavelength) diversity, and the technique known as bright speckle tracking [7] has been
shown to solve the problem, at the expense of a small addition to the optical objective collimating the
beam out of the laser source: a piezo XY deflector moving the spot projected on the target so as to
maximize the amplitude of the return. Once fading is overcome, it is the residual speckle phase error
to limit the measurement accuracy. An analysis of the phenomenon [8] has revealed that, also in the
speckle regime, we can attain a sub-m resolution and precision by properly trading beam size and
distance of operation. Even better is the hypothetic perspective of cancelling the speckle phase error
by taking advantage of the Hilbert conjugation of phase and logarithm of the amplitude, till now
demonstrated only partially and in special cases [1]. A second challenge to interferometry is the
improvement of sensitivity and resolution limits for the most demanding applications, like the
gravitational wave detection [9]. Fig. 2 shows the optical scheme of VIRGO, the French-Italian detector
that uses Fabry-Perot resonators (mirrors WE-WI and NE-NI) to improve sensitivity of a factor ≈103,
equal to the finesse of the resonator, so as to reach the record sensitivity s/s0 =10-23 that is necessary
to sense gravitational waves.
A further challenge is the application to medicine and biology of low-coherence source imaging, also
known as OCT (optical coherence tomography) [10]. Upon scanning the reference arm length, we get
the in-depth scan of the surface from which the interferometric signal is collected, and in this way, we
Figure 2. VIRGO optical scheme principle (from [9]). This is an example of very-large Michelson interferometer, with 3 km-long arms
and enhanced sensitivity.

Measurement Science and Technology Roadmap on Signal Processing for Next Generation Measurement Systems
obtain a 3D image of the tissue (skin, blood vessel, retina) under test. The 3D image is further
processed to identify and recognise the diagnostic details of interest (lesions, melanoma, etc.). Since
now, identification and recognition have been carried out by CNN (convolutional neural network)
processing of the image at a single wavelength. A new possibility is offered by SS-OCT (spectral-
scanning OCT) because it entails also the wavelength dependence of image details and therefore
contains potentially more information as described in next Section.
Advances in Science and Technology to Meet Challenges
Signal processing for an interferometric instrument becomes increasingly crucial to tackle physical and
technological limits. For mechanical applications, digital acquisition at high sampling frequency allows
to better filter out disturbances and to highlight the desired measurement. Thanks to going digital,
complex processing strategies, such as neural networks and machine learning techniques, are
applicable in real time to the phase evaluation (for example, neural network are applied to
gravitational waves). Various complex inverse problems can now be solved numerically, to reach the
desired information.
As an example, the central problem of interferometric image reconstruction for detail recognition that
are of clinical interest in using an OCT can be formulated in very general terms: it is to be able solving
the constitutive Kubelka-Munk set of equation for the ongoing power flux I(x,y,z,) and the
backscattered power flux J(x,y,z,) through the sample. Writing the fluxes simply as I(z,) and J(z,),
i.e., letting the x,y dependence implied, we have:
d I(z,)/dz = - A(z,) I (z,)+ s(z,) J(z,)
d J(z,)/dz = A(z,) J(z,) - s(z,) I(z,) (2)
where A(z,) and s(z,) are the attenuation and backscattering coefficients of the details inside the
image at depth z.
In the equation above, the quantity J(z,) is the measurement output coming from the OCT
interferometer, and our computational task is to find out the best estimates of the spectral
attenuation A(z,) and of the spectral backscattering s(z,) coefficients for every pixel of the x,y image,
given the measured J(z,). The problem is a difficult one because it is ill-conditioned and requires an
algorithmic improvement of the calculation process respect to the well-known Gauss-Newton
method, but is worth considering because the A(z,) dependence more easily identifies the class of
detail in the 3D image compared with the CNN processing used so far. The rather large dimensionality
[the typical image may have 64 pixels in each coordinate and 16 values of ] and the real time
requirement add another challenge to the computation, which is however interesting because
applicable to a wide class of problems.
Concluding Remarks
Interferometry is one of the most powerful measurement techniques in Physics, Engineering and
Biomedical Sciences, and we have observed it is advantageously cross-fertilised by the advances in
technology on one side and advances in data processing on the other side. Modern techniques of
signal processing find broad application to interferometry, for phase evaluation or reconstruction of
the desired measurand. The current signal processing trend shows a progressive evolution from
analog systems [3] to digital processing (see bibliography of [2]), thanks to high-speed sampler with
high-resolution, and to real-time signal processors. Next generation of interferometry could be
simplified in optical architecture and more and more advanced in digital signal processing: this

Measurement Science and Technology Roadmap on Signal Processing for Next Generation Measurement Systems
evolution will allow to reduce the cost, thus broadening the possibilities of application in the industrial
world (see [1,2,11,12]).
References
[1] S. Donati: "Electro-Optical Instrumentation" Prentice Hall 2004, ISBN 013 0161610-9. [2] S. Yang, G. Zhang: “A review of interferometry for geometric measurement,” Meas. Sci. Technol.,
vol. 29, 2018, n. 102001. [3] N. A. Massie, R. D. Nelson, and S. Holly: “High-performance real-time heterodyne
interferometry”, Appl. Opt. 18 (1979), pp. 1797-1803. [4] S. Donati: ”Developing Self-Mixing Interferometry for Instrumentation and Measurements” Laser
Photonics Rev., 6 (2012), pp. 393–417 (DOI) 10.1002/ lpor.201100002. [5] J.Xi, Y.Yu, J. F. Chicharo, and T.Bosch: " Estimating the Parameters of Semiconductor Lasers Based
on Weak Optical Feedback Self-Mixing Interferometry", J. Quant. Electr. QE-41 (2005), pp. 1058-1064.
[6] S.J. Rothberg et al.: “An international review of laser Doppler vibrometry: Making light work of vibration measurement,” Optics and Laser in Engineering, 99 (2017), pp. 11-22
[7] M. Norgia, S.Donati, D. d'Alessandro : "Interferometric Measurements of Displacement on a Diffusing Target by a Speckle-Tracking Technique", J. Quant. Electr. vol. QE-37 (2001), pp.800-806.
[8] S.Donati, G.Martini, T.Tambosso: "Speckle Pattern Errors in Self-Mixing Interferometry", J. Select. Top. Quant. El. vol.49, 2013, pp.798-806.
[9] T Accadia et al.: “Virgo: a laser interferometer to detect gravitational waves,” J. of Instrumentation 7 (2012) n. P03012
[10] J. M. Schmitt: “Optical Coherence Tomography (OCT): A Review,” J. Select. Top. Quant. El. vol.5, (1999), pp.1205-1215.
[11] M.Norgia, F.Bandi, A.Pesatori, S.Donati: "High sensitivity Vibrometer based on FM Selfmixing Interferometry", IoP Journal of Physics, 2019, DOI 10.1088/1742-6596/1249/1/012020.
[12] S.Donati, G.Martini:"3D Profilometry with a Self-Mixing Interferometer: Analysis of the Speckle Error" IEEE Photonics Technol. Letters, vol.31, 2019, pp. 545-548, DOI 10.1109/LPT.2019.2901274

Measurement Science and Technology Roadmap on Signal Processing for Next Generation Measurement Systems
4.1. Biosignal processing for pervasive health monitoring Andreas Menychtas, University of Piraeus Ilias Maglogiannis, University of Piraeus Status
Historically, healthcare is one of the domains that is highly benefited from the technological
advancements in the different scientific areas, with the continuous creation of new clinical pathways,
and innovative treatment plans. The contribution of information and communication technologies on
this was fundamental, establishing the concepts of eHealth and mHealth, and accelerating the
adoption of solutions for proactive and personalized care, which play key role in the enhancement of
the mental and physical health and in the improvement of wellbeing in general [1]. In a broad context,
“eHealth” or “electronic healthcare” refers to the sets of computing infrastructure and applications
that assist the provision of medical services utilizing digitized medical data processed or in raw
formats. In case the applications allow the users to be “mobile” then we are referring to the “mHealth”
ecosystem. The evolution of sensing technologies, the availability of sophisticated hardware in
commodity products and the wide use of smart “things”, from phones, watches, and wearables, to
advanced, special purpose equipment for the continuous measurement of vital signs, creates a rich
profusion of data which can be exploited in pervasive health monitoring. The impact, in population
and individual level, of these immense amounts of biosignal data which are produced every day, is
even higher as a result of the modern methodologies and techniques which are used for signal
processing and knowledge extraction. This knowledge, which is produced by analysing streaming data
from biosignal sensors, and by correlating health data from personal, organizational, or public
repositories, is nowadays crucial in the processes of decision-making by healthcare professionals and
the assessment of patients’ health condition. There are also cases, that the processing results are
directly consumed by systems for the identification of health deterioration, estimation of risks, and
for personalized coaching in the concepts of Quantified-Self and Assisted Living. Machine learning,
complex event processing and anomaly detection are among the technologies which are used for the
processing of biosignals and are at the core of modern provisioning models in healthcare, such as the
notion of digital-twin, the AI-assisted diagnostics, and the personalized medicine (Figure 1). The
importance of the vital sign processing approaches and the creation of valuable insights is also
significant, if we take into consideration the disruption in everyday life due to extreme events such as
the COVID-19 pandemic, and their effect in healthcare and other digital systems.

Measurement Science and Technology Roadmap on Signal Processing for Next Generation Measurement Systems
Current and Future Challenges
The main characteristic of the biosignals is that they are continuously updated and they can measure,
quite effectively in most cases, important characteristics of patients’ health status. At the same time,
the nature of biosignal data itself introduces several challenges for their effective management,
processing, and analysis. The constantly increasing number of different and diverse data types,
following the abundance of hardware and sensors for measuring activity and biosignals, creates a
complex environment for managing and manipulating the data [2]. The analysis processes and
methodologies are becoming even more complicated taking into consideration the multi-modal
nature of the signals, since they have different granularity, with sensors and data sources to produce
on the one hand unprocessed raw data such as the users’ heartrate, or aggregated data and events
on the other hand, such as the identification atrial fibrillation following the measurement of ECG. The
overall processing flow is hindered though by missing, untrusted and inconclusive measurements due
to sensor misuse or network connectivity failures which introduce additional difficulties. da Costa et
al. [3] have provided a very enlightening analogy between the characteristics of health data from
sensors and Big Data. The challenges related to the biosignal volume, velocity, variety, veracity,
visualization and value are at the core of modern health applications which not only deal with data
but also with the knowledge produced using processing techniques for noise removal, data fusion,
semantic annotation and trend analysis. Since the processing typically takes place on mobile platforms
or on the edge of the network, the similarities become apparent. The complexity increases in modern
systems where different data streams, local and remote, medical and non-medical (e.g. location),
should be combined and aggregated with historical data from the centralized electronic health records
Figure 1. Vital sign processing overview for pervasive health.

Measurement Science and Technology Roadmap on Signal Processing for Next Generation Measurement Systems
of healthcare organizations, taking also into consideration the limitations on the resources availability
and energy consumption [4]. In this context, signal processing is often followed by analysis techniques
which are taking place in multiple layers of the application stack, such as clustering, SMV, decision
trees, neural and deep networks that are used for predictions, assessment of health parameters and
risk estimation [5].
Advances in Science and Technology to Meet Challenges
The first step towards the improvement of biosignal data processing and analysis is the unification of
the techniques for manipulating data of different nature or data provided from different sources. The
analysis methodologies may considerably benefit from the existence of an abstraction layer for data
access which will be able to support all data types and sources across systems and devices. This should
cover only the different characteristics of biosignals that can be found in electronic health records but
also the interactions between systems that operate on the data, from mobile phones and edge devices
to centralized digital repositories for vital signs and cloud computing platforms. Even though solutions
for processing health data in different levels are discussed in literature [6, 7], their generalization and
applicability for pervasive health monitoring is limited. Furthermore, processing methodologies
dealing with streaming data such as complex event processing, or data from external, non-health
related, sources such as users’ location or other environmental parameters are even more difficult to
be adopted without unified approaches for data exchange and health services interoperability.
Although for several health data types there have been notable implementations of standards and
models e.g. HL7 and FHIR [8], the biosignal data, and their extensions on Quantified-Self and social
aspects [9], still lack of specifications that are natively accepted in processing and analytics
frameworks. Example of this limitation is the incomplete list of Bluetooth GATT specifications which
only cover a fraction of the constantly increasing list of biosignals acquired from devices and sensors.
In addition, advancements on the semantic interoperability of biosignal data is a fundamental feature
for their effective analysis from healthcare professionals and experts in different domains. This also
includes the modelling and encoding of the analysis results and of the knowledge that is created in
the separate processing levels so that experts and systems can effortlessly operate on them, and in
that way transparently re-instantiate the data analysis loop following the annotation and fusion of
new vital signs and health data on top of the knowledge that has been already created in the past.
Concluding Remarks
The creation of harmonized data lakes of biosignals on which the mechanisms for processing and
analysis of data operate, should be the first step towards the wide adoption of advanced and efficient
biosignal analysis methodologies for pervasive health monitoring. The increasing usage of sensors, the
innovations in sensing technologies, and the advancements in fields of signal processing, event
identification and knowledge extraction, require the use of models and standards which will facilitate
the data integration processes. Correlation of biosignals and other health data, is fundamental in a
ubiquitous healthcare ecosystem, where advanced analysis mechanisms can effectively function,
allowing professionals to exploit them to gain insights on public health, and individuals to improve
their wellbeing [10]. The landscape is changing fast, with experts and end-users embracing these
technologies and concepts however, important steps are still required to ensure the veracity of vital
signs, as well as the privacy of the users, through strict certifications and policies.

Measurement Science and Technology Roadmap on Signal Processing for Next Generation Measurement Systems
References
[1] Haluza, D. and Jungwirth, D., 2018. ICT and the future of healthcare: aspects of pervasive health monitoring. Informatics for Health and Social care, 43(1), pp.1-11.
[2] Menychtas, A., Tsanakas, P. and Maglogiannis, I., 2020. Knowledge Discovery on IoT-Enabled mHealth Applications. In GeNeDis 2018 (pp. 181-191). Springer, Cham.
[3] da Costa, C.A., Pasluosta, C.F., Eskofier, B., da Silva, D.B. and da Rosa Righi, R., 2018. Internet of Health Things: Toward intelligent vital signs monitoring in hospital wards. Artificial intelligence in medicine, 89, pp.61-69.
[4] Menychtas, A., Papadimatos, D., Tsanakas, P. and Maglogiannis, I., 2017, November. On the integration of wearable sensors in IoT enabled mHealth and quantified-self applications. In Interactive Mobile Communication, Technologies and Learning (pp. 77-88). Springer, Cham.
[5] Mavrogiorgou, A., Kiourtis, A., Maglogiannis, I., Kyriazis, D., De Nigro, A., Blanes-Selva, V., García-Gómez, J.M., Menychtas, A., Soric, M., Jurak, G. and Lustrek, M., 2020. CrowdHEALTH: An e-Health Big Data Driven Platform towards Public Health Policies. In ICT4AWE (pp. 241-249).
[6] Rahmani, A.M., Gia, T.N., Negash, B., Anzanpour, A., Azimi, I., Jiang, M. and Liljeberg, P., 2018. Exploiting smart e-Health gateways at the edge of healthcare Internet-of-Things: A fog computing approach. Future Generation Computer Systems, 78, pp.641-658.
[7] Erdeniz, S.P., Maglogiannis, I., Menychtas, A., Felfernig, A. and Tran, T.N.T., 2018, May. Recommender systems for IoT enabled m-health applications. In IFIP International conference on artificial intelligence applications and innovations (pp. 227-237). Springer, Cham.
[8] Bender, D. and Sartipi, K., 2013, June. HL7 FHIR: An Agile and RESTful approach to healthcare information exchange. In Proceedings of the 26th IEEE international symposium on computer-based medical systems (pp. 326-331). IEEE.
[9] Rahmani, A.M., Gia, T.N., Negash, B., Anzanpour, A., Azimi, I., Jiang, M. and Liljeberg, P., 2018. Exploiting smart e-Health gateways at the edge of healthcare Internet-of-Things: A fog computing approach. Future Generation Computer Systems, 78, pp.641-658.
[10] Maglogiannis, I., Zlatintsi, A., Menychtas, A., Papadimatos, D., Filntisis, P.P., Efthymiou, N., Retsinas, G., Tsanakas, P. and Maragos, P., 2020, June. An Intelligent Cloud-Based Platform for Effective Monitoring of Patients with Psychotic Disorders. In IFIP International Conference on Artificial Intelligence Applications and Innovations (pp. 293-307). Springer, Cham.

Measurement Science and Technology Roadmap on Signal Processing for Next Generation Measurement Systems
4.2. EEG sensors and signal processing Selina C. Wriessnegger, Luis Alberto Barradas Chacon Institute of Neural Engineering, Graz University of Technology Status
After the first recordings of electrical activity in humans by means of electrodes attached to the scalp
by the German psychiatrist Hans Berger in 1924, a lot of research was carried out improving the signal
acquisition [8]. Although the principles and basic procedures of non-invasive electroencephalography
(EEG) have hardly changed, new advances in materials and electronic systems technologies support
the development of a new generation of EEG sensors (Fig.1). The most conventional sensors are wet
electrodes utilizing a saline or different type of gels to increase signal to noise ratio (SNR) by increasing
the scull contact area and decreasing impedance. Although they guarantee a high-quality signal
recording they have several disadvantages. Generally the montage time is relatively long, skin
irritations can occur and the hair must be washed after each measurement. To overcome these
problems a new generation of dry electrode has been developed and evaluated by different
companies (Fig.1) and researchers [1]–[3]. For example Hinrichs and colleagues [4] showed in a very
recent study that the signal quality, ease of montage set-up and high usability of the dry electrodes
comply with the needs of clinical applications. Even though the signals recorded from dry electrodes
are sometimes noisier [5]–[7], their advantages of a fast setup, user-friendliness and wearer comfort
are indisputable.
Figure 1. Different types of electrodes (1) passive sintered AgCl electrode, (2) gel-based active Ag/AgCl electrode
(g.LADYbird from g.tec), (3) gel-based active electrodes (Brain Products GmbH), (4) gel-based wavegard
electrodes (ANT Neuro), (5) gel-based slim active (actiCAP, BrainProducts), (6) passive dry electrode (g.SAHARA
electrode, g.tec),(7) water-based passive electrode (Mobita, TMSi), (8) dry EEG comb electrodes (OpenBCI), (9)
unicorn hybrid electrode (g.tec), (10) semi-dry saline based electrodes (Greentek). Sensors 2,6,7 have been
evaluated in [4].
Several studies confirmed that the signal quality of dry electrodes can match the quality of wet
electrodes depending on the context. For basic research of brain activity large multi-channel settings
are required to apply sophisticated processing methods and deliver reliable insights in brain
functioning. But nevertheless dry electrodes are successfully used in clinical studies [5] or in brain-
computer interface (BCI) applications [5,8] with a limited number of channels. Both sensors are
commercially available as wired or wireless systems. Especially the latter can be used out of the lab

Measurement Science and Technology Roadmap on Signal Processing for Next Generation Measurement Systems
measuring free movements of persons without cable restrictions. Although wet electrodes are still
considered as the golden standard, new advances in dry EEG electrodes give rise to extended future
applications in more diverse research fields [6].
Current and Future Challenges
When working with EEG signal processing, four major steps can describe the general pipeline:
Acquisition, Pre-processing, Feature Selection, and Modelling (Figure 2). Each step has its own
challenges: While recording, a small signal to noise ratio (SNR) and the reduction of different artefacts
caused by environmental or physiological sources are amongst the greatest challenges in EEG studies.
A second factor restricting common use of non-invasive EEG devices is the practical use of wet
electrodes. Although dry electrodes provide a faster setup and user comfort, they are still very
sensitive to noise. For this reason, effort is also being made into developing active electrodes that pre-
amplify EEG signals [9].
Figure 2. A generalized EEG signal processing pipeline.
Pre-processing is an essential step in EEG data analysis as it is carried out to remove any artefacts and
leaving only the desired EEG features for further analysis. The main challenge at this step is the
reduction of noise while simultaneously keeping the relevant features, and removing those that will
not be included in the model. This process can be as simple as channel selection, re-referencing
methods, or frequency filtering, or more complex with blind source separation (BSS), wavelet
transforms (WT) methods, empirical mode decomposition (EMD), Canonical Correlation Analysis (CCA)
or nonlinear mode decomposition (NMD)[7]. The main challenge when extracting and selecting
features from EEG signals is the incredible amount of variables that can be inferred from them.
Features can be as simple as amplitude, statistical measures or segments used for Event Related
Potentials (ERPs), but can also be abstract mathematical representations, like Hjorth Features,
Differential Entropy, Higher Order Crossing, Independent and Principal Component Analyses,
Autoregressive, Wavelet Packet Decomposition, or connectivity indices. This process is so
overwhelming that some researchers use stochastic methods like genetic algorithms to sample a
small, but relevant number of features to model. Modelling refers to the understanding of the
neurophysiological bases for the behaviour measured. The mathematical and computational methods
to understand how those bases relate to the physical measurement of EEG restrict our capacity to
abstract and predict accordingly. Generally, simple models tend to be linear, but more complex
models can make use of nonlinear Bayesian statistics, clustering algorithms, like nearest neighbours
classifiers, neural networks, or a combination of these, into ensemble algorithms. Many methods
have been created over the years for specific use-cases, but no general-use model exists for EEG
processing [10].
Signal Acquisition Preprocessing
Feature extraction and
selection
Model training and testing

Measurement Science and Technology Roadmap on Signal Processing for Next Generation Measurement Systems
Advances in Science and Technology to Meet Challenges
Several studies in the past compared dry-electrode performance with different types of wet
electrodes (active and passive, water-based) but lacking homogeneity in comparison. This is one
important step which should be addressed in future studies being able to make reliable
statements about the signal quality of dry electrode approaches and pave the way for
improvements. The creation and use of diverse electrodes allows for the development of new
techniques for EEG measurement. This is the case of textile and tattoo electrodes for wearable
technology, which allow for more diverse kinds of measurements. Conductive dry electrodes can be
custom designed and 3D printed. Textile electrodes allow for soft wearable devices for prolonged
measurements where participants can move freely. Tattoo electrodes provide minimally invasive
and comfortable long-term measurements. Non-contact electrodes provide the promise of non-
invasiveness, a fast setup, user-friendliness, comfort, and daily use electrodes. But also the
combination of two different types of sensors, e.g. dry and wet, opens new ways to improve the
SNR during EEG recordings [1], [9]–[11]. Although it is well known that the signal quality is strongly
associated with the compatibility between the amplifier and electrodes, most of the existing
literature has focused on electrodes only instead of the entire system. Therefore in future studies
electrodes and assigned amplifiers should be evaluated together to find bottlenecks.
Deep Learning (DL) provides techniques for data-driven discovery of relevant signal features,
while being specifically resilient to noise. DL methods are capable of automatically learning
features relevant to researched conditions, creating at the same time a model of the relationships
between those features. For this reason, they can achieve similar results in problems such as
mental state detection, motor decoding, or speech decoding [12]. A disadvantage of this
automatic learning is the explainability of the created models, an area of opportunity in the field
that has begun to be explored just recently [13]. This enables a more direct comparison of DL
model with those created by traditional methods. A less explored advantage of DL model relies
on Transfer Learning (TL); the possibility of using models that have been trained on specific
datasets for different goals, or in different datasets, and being able to obtain accurate results with
very little or no training. This is a good indicator that multi-objective multi-modal models are
viable. The fast advances in computing hardware and software for deep learning make it one of
the most promising techniques for reliable automated EEG data processing [14].
Concluding Remarks
Summarizing, there are already a lot of different EEG sensors commercially available but not all of
them deliver reliable and high signal quality recordings. Therefore a lot of research and development
is still necessary to improve SNR, design features and usability of the sensors and amplifiers. The
methods that drive this technology are bound to general signal processing techniques, but the
continuously increasing computer power, artificial intelligence, and the techniques that develop from
it can be easily applied both as a modelling, and as a knowledge discovery tool. In the next few years,
we expect a wide variety of user-friendly devices, combined with powerful computing techniques to
improve the development and understanding of human EEG.

Measurement Science and Technology Roadmap on Signal Processing for Next Generation Measurement Systems
References
[1] Shad, E. H. T., Molinas, M., & Ytterdal, T. (2020). Impedance and noise of passive and active dry eeg electrodes: A review. IEEE Sensors Journal, 20(24), 14565-14577.
[2] A. Pinegger, S. C. Wriessnegger, J. Faller, and G. R. Müller-Putz (2016) “Evaluation of Different EEG Acquisition Systems Concerning Their Suitability for Building a Brain-Computer Interface: Case Studies,” Front. Neurosci., vol. 10, p. 441.
[3] T. Radüntz,(2018) “Signal Quality Evaluation of Emerging EEG Devices,” Front. Physiol. [4] H. Hinrichs, M. Scholz, A. K. Baum, J. W. Y. Kam, R. T. Knight, and H.-J. Heinze (2020),
“Comparison between a wireless dry electrode EEG system with a conventional wired wet electrode EEG system for clinical applications,” Sci. Rep., vol. 10, no. 1, p. 5218.
[5] M. Spüler, (2017) “A high-speed brain-computer interface (BCI) using dry EEG electrodes,” PLoS One, vol. 12, no. 2, p. e0172400.
[6] H. J. Baek, H. J. Lee, Y. G. Lim, and K. S. Park (2013), “Comparison of pre-amplifier topologies for use in brain-computer interface with capacitively-coupled EEG electrodes,” Biomedical Engineering Letters, vol. 3, no. 3. pp. 158–169. doi: 10.1007/s13534-013-0099-6.
[7] Jiang, X., Bian, G. B., & Tian, Z. (2019). Removal of artifacts from EEG signals: a review. Sensors, 19(5), 987.
[8] G.R. Müller-Putz & S.C. Wriessnegger (2021). Electroencephalography and Brain–Computer Interfaces, In: Neuroprosthetics and Brain-Computer Interfaces in Spinal Cord Injury: A Guide for Clinicians and End Users, G.Müller-Putz & R. Rupp, Eds. Springer Nature.
[9] J. Xu, S. Mitra, C. Van Hoof, R. F. Yazicioglu, and K. A. A. Makinwa (2017), “Active Electrodes for Wearable EEG Acquisition: Review and Electronics Design Methodology,” IEEE Rev. Biomed. Eng., vol. 10, pp. 187–198.
[10] Bisht, A., Kaur, C., & Singh, P. (2020). Recent advances in artifact removal techniques for EEG signal processing. Intelligent Communication, Control and Devices, 385-392. [11]
[11] Soufineyestani, M., Dowling, D., & Khan, A. (2020). Electroencephalography (EEG) Technology Applications and Available Devices. Applied Sciences, 10(21), 7453.
[12] Schirrmeister, R. T., Springenberg, J. T., Fiederer, L. D. J., Glasstetter, M.,Eggensperger, K., Tangermann, M., ... & Ball, T. (2017). Deep learning with convolutional neural networks for EEG decoding and visualization. Human brain mapping, 38(11), 5391-5420.
[13] Borra, D., Fantozzi, S., & Magosso, E. (2020). Interpretable and lightweight convolutional neural network for EEG decoding: application to movement execution and imagination. Neural Networks, 129, 55-74.
[14] Merlin Praveena, D., Angelin Sarah, D., & Thomas George, S. (2020). Deep learning techniques for EEG signal applications–a review. IETE Journal of Research, 1-8.

Measurement Science and Technology Roadmap on Signal Processing for Next Generation Measurement Systems
4.3. Optical Image Processing for In Vivo Measurements and Diagnostics Dimitris K. Iakovidis, and George Dimas University of Thessaly
Status
Minimally invasive examination and treatment are continual challenges for medical science. In this
context, optical imaging technologies play an important role by offering tools for in vivo screening at
different wavelengths. Measurements performed in vivo, include the measurement of size, distance,
and optical biomarkers. Endoscopy is the basic tool that can be complemented by emerging
techniques revealing tissue properties valuable for diagnostic purposes, such as optical coherence
tomography, near-infrared fluorescence imaging, and multispectral/hyperspectral imaging [1]. Size
measurements in endoscopic procedures are still based mainly on empirical comparisons of the target
with a reference object, e.g., biopsy forceps. This approach can affect clinical decisions and lead to
inappropriate recommendations [2]. Towards more objective and accurate in vivo size measurements,
methods based on image processing have been proposed to perform comparisons with reference
objects or structured light projections [3, 4]. To alleviate the need for external references, more recent
image processing methods are based on artificial neural networks (ANNs) and geometric calculations
upon the optical camera characteristics, using one or more images as input [5, 6] (Figure 1).
In vivo distance measurements are useful for the localization of findings within the body, e.g.,
anomalies. They are usually performed with wearable sensor arrays or radiologic procedures;
however, recent image processing methods promise accurate results, more conveniently and less
costly [6]. These methods follow the principles of visual odometry, and they have been investigated
using both geometric and ANN-based approaches. Both distance and size measurements can be
affected by the depth estimation accuracy. Typically, depth is assessed using two cameras in a
stereoscopic setup, rendering the imaging system more costly and imposing constraints in
miniaturization. Recent studies indicate that monocular depth measurements can be competently
performed in vivo by deep learning methods [5, 7]. Deep ANNs (DNNs) have dominated computer-
aided diagnosis by offering a generic approach to image feature extraction. They have also proved
effective in the detection of pathologies based on optical biomarkers [8]. New avenues to the
identification of such biomarkers open with hyper-spectral/multi-spectral image analysis, which
enables rapid clinical assessment of pathologies [9] (Figure 1).

Measurement Science and Technology Roadmap on Signal Processing for Next Generation Measurement Systems
Current and Future Challenges
A major challenge for the development of trustworthy in vivo measurement systems based on image
processing is the validation of the performed measurements. Since such measurements are
performed within living organisms, it is difficult to establish a gold standard for accuracy and
uncertainty estimation. This challenge becomes even greater considering the elasticity, the
deformability, and the motility of the living tissues.
Methods based on ‘black box’ approaches that learn from data, such as DNNs, have dominated
image processing. DNNs are recognized for their high learning capacity; however, they usually require
large volumes of training data to provide sufficient generalization. One of the largest obstacles today
for the translation of the respective research to clinical practice, is the limited data availability, which
originates: a) from the vague and inflexible ethico-legal data sharing frameworks; and b) from the
need for image annotations by medical experts, which is usually a time-consuming and costly process.
Another obstacle is that the ‘black box’ approaches are not explainable, in the sense that the clinicians
cannot understand the reasons for the inferences of a machine learning system. Efforts dealing with
this challenging issue are still limited [10].
The accuracy of image-based in vivo measurements depends on image quality. Restrictions with
respect to image resolution are usually imposed by the small size of the image sensors satisfying the
miniaturization requirements of the endoscopes, and the small energy consumption of battery-based
solutions, e.g., wireless capsule endoscopes. Image quality can be significantly affected by noise
artifacts, which are often induced by the image communication channels and lossy image compression
algorithms, used to reduce the bandwidth and storage requirements. Body fluids or other content,
e.g., mucus or debris, that may randomly interfere with the content of interest in the camera field of
view can also be considered as noise affecting the quality of the measurements. However, coping with
such noise, is a challenge that usually requires a different image processing approach in different
medical imaging modalities.
Another challenge that is rarely addressed is the capacity of image-based measurement methods
to provide coherent and consistent results on different images, acquired from the same or different
..
..
Machine
Learning
Feature Extraction
Optical Sensor
Sensor Coordinate System Real-world
Coordinates
Geometric Calculations
Size
Measurement
Distance Optical Biomarkers …
Spectral Sensing
Depth Prediction
Output
Motion Estimation Content Classification
Figure 1. Architectural outline of a contemporary image-based measurement system.

Measurement Science and Technology Roadmap on Signal Processing for Next Generation Measurement Systems
imaging systems, e.g., to obtain comparable measurements from consecutive endoscopic video
frames, or from the measurement of the same target using different endoscopes.
The majority of the current endoscopic image-based measurement methods have been proposed
mainly in the context of gastrointestinal endoscopy [8], whereas fewer have been proposed in other
contexts, such as laparoscopy [11] and colposcopy [12]. Challenging perspectives arise with respect to
the application, adaptation, and validation of the current methods to other optical endoscopic imaging
contexts and modalities.
Advances in Science and Technology to Meet Challenges
A common approach to the validation of in vivo measurements is ex vivo or in vitro experimentation;
however, usually it is costly, and it requires mechanical engineering skills to develop the experimental
setup. In silico modeling and simulation can provide a sufficiently realistic solution for the
implementation of digital twins of the measurement systems. Such a solution can combine different
models, e.g., multiphysics, appearance, and device models, it can be applied for automated
simulations on virtual patients, considering the material properties and the motility of the living
tissues. Furthermore, it can complement the development ex vivo experimental setups via 3D printing.
In the same spirit, realistic synthetic medical images with ground truth annotations can be generated
to augment the training of DNN-based image processing methods [13–15] (Figure 2). However, the
use of synthetic training data is only a compromise, which could be fundamentally solved by the
adoption of a standardized digital image annotation and reporting framework by hospitals, and a
research-friendly privacy preserving medical data sharing framework.
From a methodological perspective, the requirements of DNN-based image processing methods
for annotated data, can be limited by investing more research effort on less supervised and
unsupervised learning methods. For example, semi-supervised methods can be trained with both
annotated and non-annotated data, weakly supervised methods can be trained with less informative
annotations, and unsupervised methods can be supported by domain knowledge instead of training
data. In this light, the detection and quantification of optical biomarkers could also be based on outlier
detection methods, e.g., one-class classification systems, since the training of such methods can be
based on normal samples.
Research directions towards image quality enhancement, include the development of improved
super-resolution methods that may be able to offer even sub-pixel accuracy in measurement
applications, less lossy or lossless compression algorithms, and noise reduction methods. The
development of more robust image calibration, image matching and registration methods, can
contribute to the improvement of the consistency and coherence of the image-based measurement
results. To this end, illumination invariance and patient-specific or intra-patient image normalization
methods are directions that require further investigation. An uncertainty analysis involving different
patients and optical imaging devices, where possible, would contribute to a more essential progress
in this field.

Measurement Science and Technology Roadmap on Signal Processing for Next Generation Measurement Systems
Concluding Remarks
Current advances on image processing and analysis indicate the feasibility of accurate image-based
contactless in vivo measurements for minimally or even non-invasive optical imaging systems. Several
studies have demonstrated their advantages over other methods based on special sensors or external
references; however, most these methods are still at a relatively early research stage. Their translation
to clinical practice requires efforts mainly towards enhancing their robustness, in a data-efficient way,
and testing their performance in environments that enable a closer approximation of the real-world
in vivo conditions. Addressing the challenges identified in this paper, will contribute to the evolution
of next generation in vivo optical measurement systems that will be safer and less discomforting for
the patients, as well as more reliable and efficient for the medical professionals.
References
[1] Peters BS, Armijo PR, Krause C, Choudhury SA, Oleynikov D. Review of emerging surgical robotic technology. Surgical endoscopy. Springer; 2018;32(4):1636–1655.
[2] Eichenseer PJ, Dhanekula R, Jakate S, Mobarhan S, Melson JE. Endoscopic mis-sizing of polyps changes colorectal cancer surveillance recommendations. Diseases of the colon & rectum. LWW; 2013;56(3):315–321.
[3] Park H, Ahn JY, Seo H, Pih GY, Na HK, Lee JH, et al. Validation of a novel endoscopic program for measuring the size of gastrointestinal lesions. Surgical Endoscopy [Internet]. Springer Nature; 2017 Apr;31(11):4824–4830. Available from: https://doi.org/10.1007%2Fs00464-017-5560-7
[4] Visentini-Scarzanella M, Kawasaki H, Furukawa R, Bonino MA, Arolfo S, Lo Secco G, et al. A structured light laser probe for gastrointestinal polyp size measurement: a preliminary comparative study. Endoscopy International Open. 2018;06(05):E602–E609.
[5] Dimas G, Bianchi F, Iakovidis DK, Karargyris A, Ciuti G, Koulaouzidis A. Endoscopic single-image size measurements. Measurement Science and Technology. IOP Publishing; 2020;31(7):074010.
[6] Iakovidis DK, Dimas G, Karargyris A, Bianchi F, Ciuti G, Koulaouzidis A. Deep endoscopic visual measurements. IEEE journal of biomedical and health informatics. IEEE; 2018;23(6):2211–2219.
[7] Li L, Li X, Yang S, Ding S, Jolfaei A, Zheng X. Unsupervised learning-based continuous depth and motion estimation with monocular endoscopy for virtual reality minimally invasive surgery. IEEE Transactions on Industrial Informatics. IEEE; 2020;
[8] Dray X, Iakovidis D, Houdeville C, Jover R, Diamantis D, Histace A, et al. Artificial intelligence in small bowel capsule endoscopy-current status, challenges and future promise. Journal of Gastroenterology and Hepatology. Wiley Online Library; 2021;36(1):12–19.
(a)
(b)
Figure 2. (a) Synthetic endoscopic images of the colon created from Computed Tomography (CT) images using cinematic rendering. (b)
Respective ground truth depth maps. Reprinted from [10] ©2018 IOP.
module for active locomotive intestinal capsule endoscopy using an electromagnetic
actuation system. Sensors and Actuators A Physical 2016; 243: 81-9. Copyright (2016) [mahmood].

Measurement Science and Technology Roadmap on Signal Processing for Next Generation Measurement Systems
[9] Ortega S, Fabelo H, Iakovidis DK, Koulaouzidis A, Callico GM. Use of hyperspectral/multispectral imaging in gastroenterology. Shedding some–different–light into the dark. Journal of clinical medicine. Multidisciplinary Digital Publishing Institute; 2019;8(1):36.
[10] Vasilakakis M, Sovatzidi G, Iakovidis DK. Explainable Classification of Weakly Annotated Wireless Capsule Endoscopy Images Based on a Fuzzy Bag-of-Colour Features Model and Brain Storm Optimization. M. de Bruijne et al. (Eds.): MICCAI 2021, LNCS 12903. 2021;
[11] Anteby R, Horesh N, Soffer S, Zager Y, Barash Y, Amiel I, et al. Deep learning visual analysis in laparoscopic surgery: a systematic review and diagnostic test accuracy meta-analysis. Surgical Endoscopy. Springer; 2021;1–13.
[12] Yuan C, Yao Y, Cheng B, Cheng Y, Li Y, Li Y, et al. The application of deep learning based diagnostic system to cervical squamous intraepithelial lesions recognition in colposcopy images. Scientific reports. Nature Publishing Group; 2020;10(1):1–12.
[13] Mahmood F, Chen R, Sudarsky S, Yu D, Durr NJ. Deep learning with cinematic rendering: fine-tuning deep neural networks using photorealistic medical images. Physics in Medicine & Biology. IOP Publishing; 2018;63(18):185012.
[14] Wang X-Z, Nie Y, Lu S-P, Zhang J. Deep Convolutional Network for Stereo Depth Mapping in Binocular Endoscopy. IEEE Access. IEEE; 2020;8:73241–73249.
[15] Diamantis DE, Zacharia AE, Iakovidis DK, Koulaouzidis A. Towards the Substitution of Real with Artificially Generated Endoscopic Images for CNN Training. 2019 IEEE 19th International Conference on Bioinformatics and Bioengineering (BIBE). IEEE; 2019. p. 519–524.

4.4. Magnetic Resonance Imaging: Signal Processing and Simulation
Dimitris Filos1,2, Anthony H. Aletras1,2, Johannes Töger1 1Lund University, Skane University Hospital, Department of Clinical Sciences Lund, Clinical Physiology,
Lund, Sweden 2Laboratory of Computing, Medical Informatics and Biomedical–Imaging Technologies, School of
Medicine, Aristotle University of Thessaloniki, Thessaloniki, Greece
Status
Magnetic Resonance Imaging (MRI) is used in medicine for imaging, among others, anatomy, function,
perfusion, diffusion and tissue viability which serve as a diagnostic tool, for risk assessment and for guiding
treatment. MRI is based on the response of the hydrogen nucleus to radio frequency (RF) pulses while the
patient lies inside a strong static magnetic field and its gradients. Different biophysical properties lead to
image contrast used for diagnosis. To obtain conventional quantitative tissue parameters, multiple images
are acquired with different scan parameters that affect the quantity to be measured. The images are then
interrogated on a pixel-by-pixel basis to estimate the tissue parameters, such as T1, T2, T2*, diffusion
coefficients, and extracellular volume. Accuracy and precision issues in tissue parameter mapping across
MRI scanners have been documented. For example: pulse sequence, scan protocol, hardware
characteristics, reconstruction software and parameter estimation methods may affect T1 and T2
mapping in cardiac MRI (1).
Ideally, it would be desirable to use a simple pulse sequence with a simple image reconstruction and
parameter estimation method that can quantify a large number of tissue parameters on a variety of
hardware platforms. In conventional MRI this is not possible since signal localization and tissue parameter
estimation are separated into two distinct steps and treated as two different problems. Unifying the
spatial localization and parameter estimation problems would potentially allow for more flexibility in
executing faster scans and estimating more than one tissue parameters with less-than-ideal hardware and
a simpler pulse sequence.
MR physics simulators are essential for solving the large-scale computational problem of a unified
approach to signal localization and parameter estimation. To date, MR simulators are mostly used as
research tools for pulse sequence design, hardware in-silico testing and educational purposes. Adding
complexity to MR physics simulators to include hardware imperfections will allow for their use as part of
both the image reconstruction chain and the parameter estimation process.
Several MR simulation platforms have been described in the literature. However, the increased
complexity of realistic MR experiments leads to unacceptable simulation times thus hindering their
applicability to clinical practice. Simplifications of the MRI physics models may have the potential to
reduce the simulation times, but these come at the cost of reduced accuracy and generalizability. On the
other hand, cloud computing and advancements in Graphical Processing Unit (GPU) technology have led
to the implementation of advanced MR simulation platforms, which are able to execute complex MRI
simulations within reasonable times, which may enable clinical applications (2).
Current and Future Challenges
Artificial Intelligence (AI) and Machine Learning (ML) provide unprecedented opportunities for improving
image-based diagnosis, prognosis, and risk stratification. However, these algorithms require a large

amount of training data and preferably annotated datasets, which may be expensive to produce. In order
to overcome this limitation, MRI simulations have been used to produce training datasets using realistic
models of human anatomy (3). This approach, which is an example of solving the forward problem, is
based on the solution of the Bloch equations which yield the MRI signal that describes the evolution of
the magnetization with a specific tissue model. The simulation protocol can incorporate various scanning
parameters and recreate artifacts, if needed. The production and incorporation of more detailed
anatomical models, such as statistical atlases that represent normal and pathological conditions,
constitutes one of the main challenges.
A current and future challenge in MRI is solving the inverse problem, i.e. to estimate tissue parameters
throughout the imaging volume based only on the acquired signal. MRI physics simulators are essential
for solving the inverse problem since they provide a reference for comparing the acquired signal in an
effort to obtain accurate reconstructions of quantitative multi-parametric maps. To this end, magnetic
resonance fingerprinting (MRF) uses a specialized pulse sequence with pseudorandom pulse sequence
parameters, such as RF flip angle and repetition times (TR), in order to produce “fingerprints” for each
combination of tissue properties (4). A sophisticated MR simulator has been used with the SQUAREMR
framework to quantify T1 in cardiac MR using existing clinical pulse sequences (5). More recently,
Magnetic Resonance Spin TomogrAphy in Time-domain (MR-STAT) (6) was proposed, which considers the
problem of parameter map reconstruction as a large-scale nonlinear inversion problem based on an MRI
simulator, which can be solved using optimization algorithms. This enables accurate tissue parameter
estimation but requires long simulation times, on the order of hours for a single 2D brain slice even when
using high-performance computing clusters.
Simulation-based reconstruction algorithms have also the potential to measure additional tissue
properties. Recently, an approach called MRF with exchange (MRF-X) was proposed (7) to quantify sub-
voxel relaxation times in single scan and ECV, used as a marker of myocardial fibrosis. Deep learning and
MR simulators can also be used in tandem to better estimate tissue relaxation times (8).
Figure 1. Graphical overview of the MR-STAT reconstruction algorithm. The signal d(t) acquired by the scanner is compared with a
simulated signal produced using the same pulse sequence in an anatomical model with known tissue properties s(a,t).
Optimization algorithms are used to change these properties so as to minimize their difference (error) and thus to
reconstruct the images with the correct tissue characteristics.

The simulation-based reconstruction techniques have shown promising results, however, the transition
from research to clinical practice remains challenging. Towards this goal both small-scale technical and
large-scale clinical validations must be considered.
Advances in Science and Technology to Meet Challenges
The main barrier for applying simulation-based techniques in clinical practice is the long computational
times. Simulation-based reconstruction techniques based on inverse problem solution, such as MRF and
MR-STAT, require fast and accurate computation of the simulated MR signal. Towards this goal,
technological advances should aim to reduce simulation times.
Hardware innovations, such as High-Performance Computing (HPC) and general-purpose computing on
GPU, enable the faster and parallel computation of the constantly growing complex models, allowing for
performance improvements of computationally intensive calculations regarding tissue characterization.
The integration of newer technologies has shown to progressively decrease the computational time.
Apart from raw computational power, which will always be useful, the implementation of novel
algorithms can also help propel these methods into clinical practice. Deep learning techniques have
demonstrated success in solving medical imaging problems. As described by Liu et al, recurrent Neural
Networks (NN) can be used as an alternative to the Bloch physics simulation for computing large-scale MR
signals and derivatives (9) and accelerate computation.
However, an ever-increasing amount of data requires increased computational power. In the future,
quantum computers will likely outperform classical computer architectures and out stage them for
applications requiring high performance computing. However, the design of quantum circuits differs
significantly from that of a classical computer and thus the implementation of the NNs may require more
qubits or lead to inconsistencies. Jiang et al. proposed the QuantumFlow framework which is based on
the co-design of NNs and quantum circuits (10) and could be used for processing high resolution MR
images.
Smarter algorithms are needed for estimating the derivatives of functions that are used for optimization
purposes. This will help reduce the overall computational load. Smarter algorithms are also needed for
simulating MRI physics. Such an example has been demonstrated by prolonging the smallest simulation
time interval (11). In the end, smarter algorithms may allow for large speedup simulation time.
Concluding Remarks
Current MRI scanners are characterized by their increased cost and the fact that they are difficult to use,
since a specialized technician with medical physics background is required to apply any modification
related to the scanning protocol. Next generation systems must overcome these obstacles. Simulation-
based image reconstruction approaches in MRI have demonstrated their early usefulness on tissue
parameter estimation with high accuracy. The common ground challenge in this field is the need for
reducing simulation times since the simulator is part of the inner loop of the algorithms. In addition, this
approach can allow the reconstruction of numerous images simultaneously, such as diffusion, perfusion,
or flow images, without the need of specialized pulse sequence to be applied. Advances in technological
infrastructure and computer science and in particular GPU technology may lead to simulated experiments
reflecting the full complexity of MR physics to increase accuracy of quantitative parameters. Feasibility
studies and extensive clinical tests must be performed in order to ensure the usefulness of these methods.
The standardization of the simulation-based reconstruction algorithms should be considered in terms of

their application in clinical practice (12). Finally, hardware advances can lead to reduction of the costs and
thus the more extensive adoption of MRI in the clinical pathway.
Acknowledgements
This research received funding from the Hellenic Foundation for Research & Innovation (H.F.R.I), the
Faculty of Medicine at Lund University, Sweden, the Region of Scania, Sweden, the Swedish strategic e-
science research program eSSENCE, and Swedish Research Council grant 2018-03721.
References
1. Liu Y, Hamilton J, Rajagopalan S, Seiberlich N. Cardiac Magnetic Resonance Fingerprinting: Technical Overview and Initial Results. JACC Cardiovasc Imaging. 2018;11(12):1837–53.
2. Xanthis CG, Aletras AH. CoreMRI: A high-performance, publicly available MR simulation platform on the cloud. PLoS One. 2019;14(5):1–26.
3. Xanthis CG, Filos D, Haris K, Aletras AH. Simulator-generated training datasets as an alternative to using patient data for machine learning: An example in myocardial segmentation with MRI. Comput Methods Programs Biomed [Internet]. 2021;198(xxxx):105817. Available from: https://doi.org/10.1016/j.cmpb.2020.105817
4. Panda A, Mehta BB, Coppo S, Jiang Y, Ma D, Seiberlich N, et al. Magnetic Resonance Fingerprinting-An Overview. Curr Opin Biomed Eng. 2017;3:56–66.
5. Xanthis CG, Bidhult S, Kantasis G, Heiberg E, Arheden H, Aletras AH. Parallel simulations for QUAntifying RElaxation magnetic resonance constants (SQUAREMR): An example towards accurate MOLLI T1 measurements. J Cardiovasc Magn Reson. 2015;17(1):1–15.
6. Sbrizzi A, Heide O van der, Cloos M, Toorn A van der, Hoogduin H, Luijten PR, et al. Fast quantitative MRI as a nonlinear tomography problem. Magn Reson Imaging. 2018;46(October 2017):56–63.
7. Hamilton JI, Griswold MA, Seiberlich N. MR Fingerprinting with chemical exchange (MRF-X) to quantify subvoxel T1 and extracellular volume fraction. J Cardiovasc Magn Reson. 2015;17(S1):1–3.
8. Shao J, Ghodrati V, Nguyen KL, Hu P. Fast and accurate calculation of myocardial T1 and T2 values using deep learning Bloch equation simulations (DeepBLESS). Magn Reson Med. 2020;84(5):2831–45.
9. Liu H, van der Heide O, van den Berg CAT, Sbrizzi A. Fast and accurate modeling of transient-state gradient-spoiled sequences by Recurrent Neural Networks. arXiv. 2020;
10. Jiang W, Xiong J, Shi Y. A co-design framework of neural networks and quantum circuits towards quantum advantage. Nat Commun [Internet]. 2021;12(1). Available from: http://dx.doi.org/10.1038/s41467-020-20729-5
11. Xanthis CG, Venetis IE, Chalkias A V., Aletras AH. MRISIMUL: A GPU-based parallel approach to MRI simulations. IEEE Trans Med Imaging. 2014;33(3):607–17.
12. Hsieh JJL, Svalbe I. Magnetic resonance fingerprinting: from evolution to clinical applications. J Med Radiat Sci. 2020;67(4):333–44.
Measurement Science and Technology Roadmap on Signal Processing for Next Generation Measurement Systems
4.5. Ultrasound Imaging: Beyond Conventional Imaging and Processing
Techniques
Feng Dong, Shangjie Ren
Tianjin Key Laboratory of Process Measurement and Control, School of Electrical
and Information Engineering, Tianjin University, Tianjin 300072, China
Status
Ultrasound imaging has been rapidly developed and well-established since the 1950s. The non-
invasion, portability, and low costs make it one of the most commonly used imaging techniques in
clinical and research settings. In soft bio tissue imaging, for like liver tissue examination and prenatal
diagnosis, ultrasound combines deep penetrability and good spatial resolution. The high temporal
resolution and non-ionizing-radiation also make the real-time ultrasound efficient in guiding
interventional therapy.
In the last two decades, the significant development of ultrasound imaging mainly benefits from the
advances in mechanics, electronics, and material science. The piezoelectric micromachined ultrasound
transducers (PMUT) [1] and capacitive micromachined ultrasonic transducers (CMUT) have allowed
the manufacturing of miniaturized and high-density transducer arrays, which significantly enriched
the observable information of sound waves and extended the application scenarios of ultrasound
imaging. The ultrasound tomography has dramatically benefited from the dense transducer array,
integrated reflection, sound speed, and attenuation modalities in one imaging system for depicting
breast parenchyma and fibro-adenoma in detail [2]. The ultrafast ultrasound, powered by plane-wave
beamforming, has also ushered in a new ultrasound imaging era. Supported by ultrafast ultrasound,
ultrasound localization microscopy collected hundreds of thousands of B-mode (Brightness) images
enhanced by microbubbles agent in a few minutes and achieved super-resolution ultrasonic
angiography (micron-level spatial resolution and centimeter-level penetrability) for Vivo rat brain [3],
as shown in figure 1. Continuous volumetric imaging (real-time 3D echography), energized by ultrafast
ultrasound and high-density transducer array, can collect 40 to 50 volumetric images within a single
heartbeat cycle been considered as a promising tool for visualization and quantitative assessment of
cardiac chamber and valves [4].
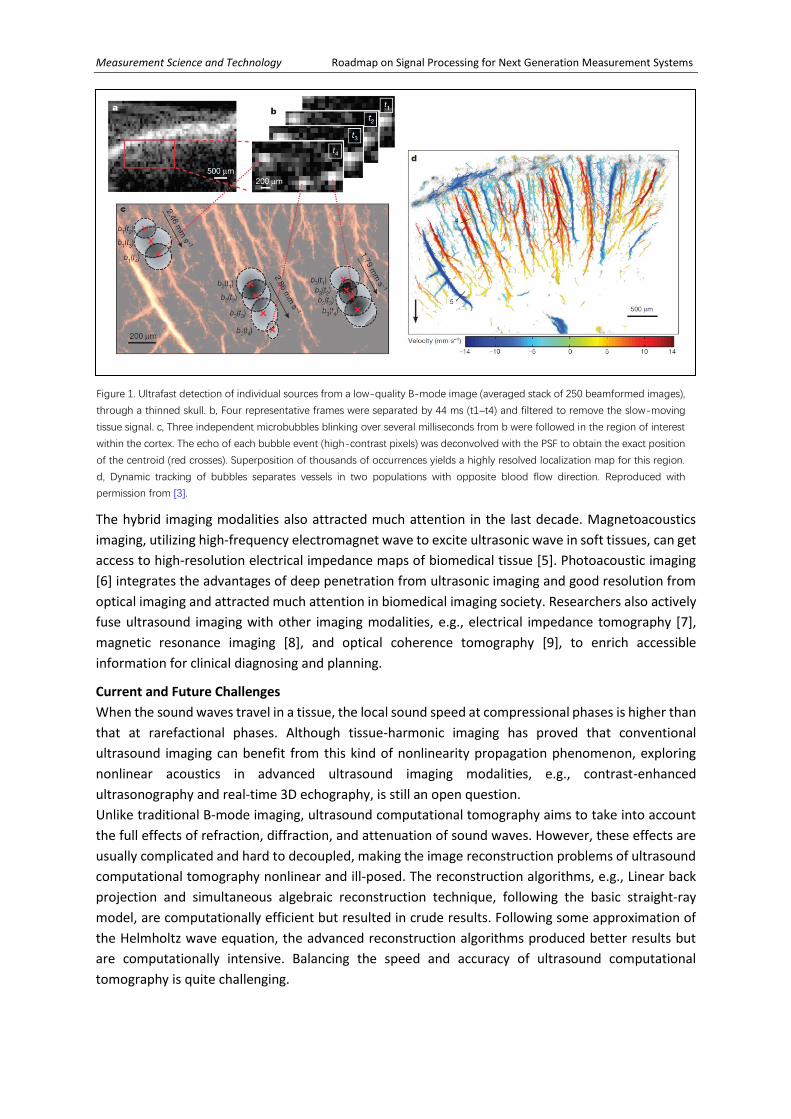
Measurement Science and Technology Roadmap on Signal Processing for Next Generation Measurement Systems
The hybrid imaging modalities also attracted much attention in the last decade. Magnetoacoustics
imaging, utilizing high-frequency electromagnet wave to excite ultrasonic wave in soft tissues, can get
access to high-resolution electrical impedance maps of biomedical tissue [5]. Photoacoustic imaging
[6] integrates the advantages of deep penetration from ultrasonic imaging and good resolution from
optical imaging and attracted much attention in biomedical imaging society. Researchers also actively
fuse ultrasound imaging with other imaging modalities, e.g., electrical impedance tomography [7],
magnetic resonance imaging [8], and optical coherence tomography [9], to enrich accessible
information for clinical diagnosing and planning.
Current and Future Challenges
When the sound waves travel in a tissue, the local sound speed at compressional phases is higher than
that at rarefactional phases. Although tissue-harmonic imaging has proved that conventional
ultrasound imaging can benefit from this kind of nonlinearity propagation phenomenon, exploring
nonlinear acoustics in advanced ultrasound imaging modalities, e.g., contrast-enhanced
ultrasonography and real-time 3D echography, is still an open question.
Unlike traditional B-mode imaging, ultrasound computational tomography aims to take into account
the full effects of refraction, diffraction, and attenuation of sound waves. However, these effects are
usually complicated and hard to decoupled, making the image reconstruction problems of ultrasound
computational tomography nonlinear and ill-posed. The reconstruction algorithms, e.g., Linear back
projection and simultaneous algebraic reconstruction technique, following the basic straight-ray
model, are computationally efficient but resulted in crude results. Following some approximation of
the Helmholtz wave equation, the advanced reconstruction algorithms produced better results but
are computationally intensive. Balancing the speed and accuracy of ultrasound computational
tomography is quite challenging.
Figure 1. Ultrafast detection of individual sources from a low-quality B-mode image (averaged stack of 250 beamformed images),
through a thinned skull. b, Four representative frames were separated by 44 ms (t1–t4) and filtered to remove the slow-moving
tissue signal. c, Three independent microbubbles blinking over several milliseconds from b were followed in the region of interest
within the cortex. The echo of each bubble event (high-contrast pixels) was deconvolved with the PSF to obtain the exact position
of the centroid (red crosses). Superposition of thousands of occurrences yields a highly resolved localization map for this region.
d, Dynamic tracking of bubbles separates vessels in two populations with opposite blood flow direction. Reproduced with
permission from [3].
Measurement Science and Technology Roadmap on Signal Processing for Next Generation Measurement Systems
The plane-wave beamforming is one of the crucial techniques for ultrafast ultrasound imaging. The
plane-wave ultrasound transmits in a broad region of interest. It can significantly reduce the number
of wave projections for image reconstruction, resulting in ultrafast imaging speed and challenges to
the beamforming and reconstruction algorithms. Although some recently published plane-wave
beamforming algorithms, e.g., the minimum variance beamforming [10] and short-lag spatial
coherence beamforming [11], achieved considerable accuracy, the high computational complexity of
these algorithms hampered their real-time applications. Newly developed deep learning-based
beamforming [12] is just beginning. More researches are needed to develop advanced beamforming
algorithms.
Furthermore, during the clinical applications of advanced ultrasound imaging techniques, the
interpretation of ultrasound images is one of the barrier factors that cannot be ignored. The credible
interpretations rely on the clinical specialist with a certain level of expertise. Deep learning-based
methods may achieve faster, easier, and high-quality image interpretation. However, the
interpretability and generalization of the learning-based methods is still an open question.
Advances in Science and Technology to Meet Challenges
Following Moore's law, computational power has been significantly improved in the last two decades.
The flourishing development of high-performance computing techniques, coupled with parallel multi-
core compute clusters, cloud computing, edge computing, and large-memory graphics processing unit,
is removing the barriers between advanced ultrasound imaging and real-time applications.
Full-wave inversion, which has been successfully applied in geophysics, recently has shown its
potentials in biomedical imaging [13]. Unlike the traditional ray model or approximated wave model,
the full-wave inversion method takes account of complex wave propagation in heterogeneous media
and multiple scattering of the wave-field. As a result, the total interactions between sound waves and
tissues, including refraction, diffraction, and attenuation, are automatically considered in its solution,
resulting in a significant spatial resolution improvement. Although the state-of-the-art full-wave
inversion requires several minutes for calculating one high-resolution 3D image, as shown in figure 2,
its computational cost is hopefully to be significantly reduced by using high-performance computing
techniques.
As a new paradigm of high-performance computing, the deep learning technique provided a
convenient solution for learning nonlinear relationships between two data domains. The solution is
so efficient that deep learning technology has revolutionized serval research fields, including
computer vision, natural language processing, and computational biology. In the last few years, the
deep learning technique also presented promising end-to-end solutions for ultrasound imaging, which
could be more robust and flexible than the classical signal or image processing methods. The impacts
of deep learning on the ultrasound imaging involves several aspects, including clutter suppression,
beamforming and reconstruction, Doppler signal processing, super-sensitive microbubble localization,
acceleration of image reconstruction, and intelligent interpretation of ultrasound images. After being
well trained, the deep learning methods provide efficient models and algorithms beyond conventional
imaging and processing techniques, making fast and accurate ultrasound imaging possible.

Measurement Science and Technology Roadmap on Signal Processing for Next Generation Measurement Systems
Concluding Remarks
Ultrasound has played an essential role in biomedical imaging in both clinical and research settings.
Advents of high-density transducer arrays and ultrafast ultrasound techniques have significantly
enriched the quantity and quality of the information accessible for ultrasound imaging. That also
brought new challenges to the research of single and image processing methods in ultrasound imaging
society. The advent of powerful parallel computing, full-wave inversion, and deep learning techniques
are broking the bottlenecks of advanced ultrasound imaging techniques. The rapid progress of
ultrasound imaging is coming in the near future.
Acknowledgements
The author acknowledges the support by the National Natural Science Foundation of China
(No.61227006, No.61571321, No. 61671322, No.81827806, and No.61971304).
References
[1] Qiu Y Q, Gigliotti J V, Wallace M, Griggio F, Demore C E M, Cochran S and Trolier-McKinstry S
2015 Piezoelectric micromachined ultrasound transducer (PMUT) arrays for integrated sensing,
actuation and imaging Sensors 15 8020-41.
[2] Malik B, Terry R, Wiskin J and Lenox M 2018 Quantitative transmission ultrasound tomography:
Imaging and performance characteristics Med. Phys. 45 3063-75.
Figure 2. a, Three-dimensional array of transducers used for data generation and subsequent inversion. Each transducer acts as
both a source and a receiver. b, A snapshot in time of the wavefield generated by a source transducer located at the position
indicated by the small yellow circle, computed via numerical solution of the 3D acoustic wave equation. The wavefield is dominated
by strong reflections from the skull, and by intracranial transmitted energy travelling across the brain. c, Prototype helmet containing
1024 transducers held rigidly in a 3D-printed framework. d, Close up of sensor connections in the prototype. e, h, k, Transverse, f,
i, l, sagittal, and g, j, m, coronal sections of the images. e-g, sections from true models. h-j, Sections from starting models. k-m,
Sections from recovered model. Reproduced with permission from [13].
Measurement Science and Technology Roadmap on Signal Processing for Next Generation Measurement Systems
[3] Errico C, Pierre J, Pezet S, Desailly Y, Lenkei Z, Couture O and Tanter M 2015 Ultrafast ultrasound
localization microscopy for deep super-resolution vascular imaging Nature 527 499-502.
[4] Lang R M, Addetia K, Addetia K, Narang A and Mor-Avi V 2018 3-Dimensional echocardiography:
latest developments and future directions JACC Cardiovasc. Imag. 11 1854-78.
[5] Wang L L, Liu G Q, Chen S P, Chen X, Ma X B and Xia H 2020 Novel reconstruction algorithm of
magnetoacoustic tomography based on ring transducer array for acoustic speed
inhomogeneous tissues Med. Phys. 47 3533-44 .
[6] Steinberg I, Huland D M, Vermesh O, Frostig H E, Tummers W S and Gambhir S S 2019
Photoacoustic clinical imaging Photoacoustics 14 77-98.
[7] Ren S J, Liang G H and Dong F 2020 A point constrained boundary reconstruction framework for
ultrasound guided electrical impedance tomography IEEE T Comput. Imag. 6 1336-50.
[8] Preisser F, Theissen L, Wenzel M, Humke C, Bodelle B, Köllermann J, Kluth L, Banek S, Becker A,
Roos F, Chun F and Mandel P 2019 Performance of combined magnetic resonance
imaging/ultrasound fusion-guided and systematic biopsy of the prostate in biopsy-naïve
patients and patients with prior biopsies Eur. Urol. Focus 7 39-46.
[9] Bourantas C, Jaffer F, Gijsen F, Soest G V, Madden S, Courtney B, Fard A M, Tenekecioglu E, Zeng
Y, Steen A V, Emelianov S, Muller J, Stone P, Marcu L, Tearney G and Serruys P 2017 Hybrid
intravascular imaging: recent advances, technical considerations, and current applications in
the study of plaque pathophysiology Eur. Heart J. 38 400–412.
[10] Synnevag J F, Austeng A and Holm S 2009 Benefits of minimumvariance beamforming in medical
ultrasound imaging IEEE T Ultrason. Ferr. 56 1868-79.
[11] Lediju M A, Trahey G E, Byram B C and Dahl J J 2011 Short-lag spatial coherence of backscattered
echoes: imaging characteristics IEEE T Ultrason. Ferr. 58 1377-88.
[12] Khan S, Huh J and Ye J C 2020 Adaptive and compressive beamforming using deep learning for
medical ultrasound IEEE T Ultrason. Ferr. 67 1558-72.
[13] Guasch L, Agudo O C, Tang M X, Nachev P and Warner M 2020 Full-waveform inversion imaging
of the human brain NPJ Digital Medicine 3 28

Measurement Science and Technology Roadmap on Signal Processing for Next Generation Measurement Systems
4.6. Signal and Image Processing Methods for Biometrics: The Impact of Deep Learning Andreas Uhl, University of Salzburg, Austria
Status
Biometric recognition is used as alternative to more traditional authentication procedures like
tokens or passwords. Unlike the latter two, which base authentication on “something you have” or
on “something you know”, biometrics conduct authentication on “something you are”. Contrasting
to tokens or passwords, biometric identifiers cannot be lost, stolen, forgotten, or passed-on to non-
legitimate users. Also, biometric authentication is much more difficult to deceive or misuse, as
biometric identifiers are often nearly impossible to duplicate or imitate. Even though there have
been attempts to forge biometric traits or to circumvent and/or deceive biometric sensors, also
various ways to counteract such fraudulent attacks have been proposed and successfully deployed.
Biometric traits can be physiological, which depend on the physical properties of a person (e.g. face,
fingerprint, iris, various vascular biometrics, ear, palmprint, EEG, and ECG), or behavioural, which can
be measured during a persons’ interaction with the environment (e.g. dynamic signatures,
keystroke, gait). Speech is often considered as behavioural, but also carries physiological properties
like voice pitch.
The biometric authentication process is a typical pattern recognition procedure and consists
classically of several distinct stages: First the data are acquired by the biometric sensor (satisfying
certain quality constraints) resulting in the biometric sample, and subsequently, this sample is pre-
processed to optimally enable the subsequent processing stages (pre-processing may include
denoising, contrast enhancement, segmentation, and alignment). The next stage comprises the
extraction of biometric features from the sample, resulting in the biometric template. The next stage
compares the biometric template acquired during authentication to the template stored in the
database which was generated during the enrolment process. The determined degree of similarity
between the templates is used in the final decision process to decide if sample verification or
identification has been successful.
Classical biometric recognition is based on hand-crafted or model-based features, derived from the
sample data using experts’ domain knowledge gained over decades. Contrasting to classical
computer vision with its general purpose feature descriptors like local binary patterns (LBP) or key
points along with their descriptors (e.g. SIFT, SURF, HOG, etc.), biometric features are often based on
intrinsic, trait-specific discriminating properties like face geometry, fingerprint minutiae, or gait
patterns. However, with the revolution introducing data-driven and learning-based signal
processing, also biometric technology has seen the application of deep learning [1-6], still with some
years delay.
Current and Future Challenges
While biometric authentication is a generic pattern recognition process, biometric sample data is by
far not generic. Many biometric traits’ sample types have quite distinct properties, often
significantly different as compared to classical data as processed and used in traditional computer
vision applications. This poses a particular challenge for learning-based biometric systems: Where do
we get our training from? Especially, where to get these data while still respecting privacy-protecting
Measurement Science and Technology Roadmap on Signal Processing for Next Generation Measurement Systems
regulations like the European Union GDPR ? In fact, this challenge has impacted significantly the way
we perceive biometric technology today: While face recognition was among the mediocre biometric
traits in terms of accuracy ten years ago, nowadays it is among the top performers, if not the best.
The reason is found in the widespread availability of facial data on-line, in social media platforms of
various kinds. It is not a coincidence that companies running social media platforms having access to
their users’ facial data are able to come up with the most accurate face recognition systems on the
market – simply put, they have access to the largest volume of training data to tailor and tune their
systems. The advance caused by using deep learning technology seen in other biometric traits is by
far less convincing: Often, traditional feature extraction-based technology is able to compete or is
still even superior. The lack of sufficient training data and the distinct properties of biometric
samples prevent the employment of deep architectures (as required for high accuracies in large
populations) and the effective application of transfer learning.
Nevertheless, deep-learning based approaches have been proposed to a large extent for biometric
systems. Seen from a distance, subject verification or identification is basically a classification
problem. Thus, training a deep-learning based classifier assigning each subject to a dedicated class
seems to be a natural choice for biometric recognition. However, there are severe limitations –
typically, in biometric systems, new users get enrolled (or eventually deleted), and when doing this,
the system has to cope with a dynamically changing number of classes, which limits its applicability.
Further, a system with a large number of classes (i.e. subjects) requires a very deep architecture and
a significant number of training samples per class – which is often not available. The solution is to
train networks to recognise sample similarity / dissimilarity in a Siamese configuration, so that there
is no issue in case of unseen subjects.
To overcome the limitations caused by the particular nature of certain biometric sample types
(which limits the effectiveness of using networks pre-trained on classical vision datasets) is to
employ a combination of transfer learning and fine tuning. Available biometric training data are used
to adjust a networks’ parameters trained on different types of visual data.
Overall, there is not a single strategy how to apply deep learning to biometrics. So far, we have
discussed the case of using deep learning as an end-to-end system, thus replacing all processing
stages. Contrasting to this, single stages only might be covered by deep learning technology, while
the entire biometric processing chain remains unaltered. For example, this applies to iris recognition
in case we apply deep learning-based semantic segmentation to extract iris texture from samples
[7], apply semantic segmentation to extract binary vascular features from finger vein samples [8], or
use specifically trained networks to detect fingerprint minutiae [9] or others to conduct latent
fingerprint segmentation [10], respectively.
Advances in Science and Technology to Meet Challenges
The unavailability of sufficiently extensive biometric sample training data calls for the development
of techniques to address this severe limitation. For example, when combining sample data from
different sensor sources, it is by far easier to result in sufficiently sized training data. However, often
the sensors are quite different in nature resulting in distinct sample characteristics. This calls for the
development and application of multi-sensor and cross-sensor training techniques, involving domain
adaptation techniques to compensate for differences also in feature space. Another approach to
handle the difficulty as imposed by privacy-protective measures is to synthesize biometric sample
data. We have seen techniques being developed that actually generate synthetic samples “from

Measurement Science and Technology Roadmap on Signal Processing for Next Generation Measurement Systems
scratch” obeying natural sample properties, or alternatively, to disentangle identity- and privacy-
related information in existing biometric samples such these can be used in GDPR compliant
manner.
Another issue with respect to training data has been identified and dealt with recently – it has been
discovered that unbalanced training data leads to bias in the recognition process, in particular
revealing ethnical and gender-related bias. Therefore, it has turned out that balanced design and fair
provisioning of training data are key elements to provide bias-free biometric recognition systems - a
fact that again obviously hampers the straightforward establishment of large-scale biometric
training data.
Finally, mobile devices get increasingly used as distributed biometric sensor infrastructure.
Consequently, also processing of biometric data on these devices becomes imperative, which is
particularly challenging in case of deep learning-based approaches. Thus, advances in this direction
are particularly important for future mobile biometric systems.
Concluding Remarks
While deep learning techniques prevail in many vision areas, their success in biometric recognition
system is still impeded by a couple of factors as discussed. However, in case these challenges can be
addressed properly, there is hardly doubt that also in this field, deep learning-based techniques will
improve on the state of the art.
The possible usage of deep learning in biometrics is however not limited to recognition as such.
Other popular and promising application areas include presentation attack detection (PAD),
biometric sensor authentication, learning-based template protection, and many more.
Acknowledgements
This work has been partially supported by the Austrian Science Fund, project no. P32201.
References
[1] Shervin Minaee, Amirali Abdolrashidi, Hang Su, Mohammed Bennamoun, David Zhang.
Biometric Recognition Using Deep Learning: A Survey. arXiv:1912.00271, 2019.
[2] Kalaivani Sundarajan, Damon L. Woodart. Deep Learning for Biometrics: A Survey. ACM
Computing Surveys 51(3): article 65, 2018.
[3] Bir Bhanu, Ajay Kumar (eds.). Deep Learning for Biometrics. Book series on Advances in
Computer Vision and Pattern Recognition, Springer, 2017.
[4] Mayank Vatsa, Richa Singh, Angshul Majumdar (eds.). Deep Learning in Biometrics. CRC Press,
2018.
[5] Richard Jiang, Chang-Tsun Li, Danny Crookes, Weizhi Meng, Christophe Rosenberger (eds.).
Deep Biometrics. Book series on Unsupervised and Semi-Supervised Learning, Springer 2020.
[6] Alberto Botana Lopez. Deep Learning in Biometrics: A Survey. ADCAIJ: Advances in Distributed
Computing and Artificial Intelligence Journal, 8(4), 19-32, 2019.
[7] Heinz Hofbauer, Ehsaneddin Jalilian, Andreas Uhl. Exploiting superior CNN-based iris
segmentation for better recognition accuracy. Pattern Recognition Letters 120, pp. 17-23, 2019.
[8] Ehsaneddin Jalilian, Andreas Uhl. Finger-vein Recognition using Deep Fully Convolutional Neural
Semantic Segmentation Networks: The Impact of Training Data. Proceedings of the IEEE 10th

Measurement Science and Technology Roadmap on Signal Processing for Next Generation Measurement Systems
International Workshop on Information Forensics and Security (WIFS 2018), pp. 1-8, Hong Kong,
December 11 - December 13, 2018.
[9] Luke N. Darlow, Benjamin Rosman. Fingerprint Minutiae Extraction using Deep Learning.
Proceedings of the 2017 IEEE International Joint Conference on Biometrics (IJCB), Denver, USA,
2017.
[10] Yanming Zhu, Xuefei Yin et al. Latent fingerprint segmentation based on convolutional neural
networks. Proceedings of the IEEE 9th International Workshop on Information Forensics and
Security (WIFS 2017), pp. 1-8, Rennes, December 4 - December 7, 2017.

Measurement Science and Technology Roadmap on Signal Processing for Next Generation Measurement Systems
5.1. Signal Processing for Global Navigation Satellite Systems Jacek Paziewski, University of Warmia and Mazury in Olsztyn Jianghui Geng, Wuhan University Status
With the progress and modernisation of GNSS (Global Navigation satellite Systems) including GPS,
Galileo, GLONASS, BDS and regional satellite navigation systems such as QZSS and NavIC, now multi-
constellation and multi-frequency observations are stimulating innovations [1]. As the most important
recent advances, we flag the change from frequency to code division multiple access in GLONASS and
the introduction of the third frequency band (L5) in GPS in the latest generation of the satellites. The
recent years also witness a great advancement in populating the orbital planes of Galileo and BDS
constellations. Therefore, nowadays both systems have become operational to provide positioning,
navigation and timing services on a global scale.
This progress induced the scientific community to pay a special attention to the integration of multi-
constellation signals into a routine GNSS processing. Also novel positioning models that addressed
such integration subsequently emerged. One noticeable recent advance is related to the multi-
constellation and multi-frequency precise point positioning with integer ambiguity resolution, which
now achieves even a millimetre-level precision at a single receiver [2]. This development would not
be possible without significant progress in the precision of GNSS products such as satellite orbits and
clocks, and the modelling of the satellite biases that allow isolating carrier-phase ambiguities as
integer values [3,4].
The limitations of low-cost receivers and smartphones have spurred a tremendous effort made by the
scientific community to address them. Based on the availability of smartphone-derived GNSS
measurements in May 2016, a number of studies on the signal quality and algorithm development
aiming at enhancing the positioning precision of mass-market devices have been carried out, which
has become recently one of the most frequently investigated topics in GNSS [5]. A common
recognition of a poor positioning performance of smartphones and low-cost receivers may soon not
hold true, since such receivers are on the way of reaching the performance close to that of survey-
grade GNSS receivers.
With these advancements, GNSS is now considered as a fully mature measurement technique which
is successfully employed in a number of geoscience applications. Thanks to high altitude of GNSS
orbits, satellite navigation signals are comprehensively employed in the water vapor and total electron
content sounding, thus contributing to the space weather, meteorology and climate monitoring also
coupled with tomographic methods [6]. GNSS reflectometry is a reliable source of information of the
geophysical properties of land, water and ice surfaces contributing to the climate research and
geohazard monitoring [7].
Current and Future Challenges
Notwithstanding a tremendous progress of low-cost GNSS devices and smartphones, we still recognize
a number of limitations that deter their application in the most demanding areas of science and
technology. The smartphone GNSS antennas suffer from a low and inhomogeneous pattern of gain,
high susceptibility to multipath, lack of phase centre models, and a linear polarization that does not
prevent the acquisition of the non-line-of-sight left-hand circularly polarized signals [5]. Moreover,
users have to handle highly noisy smartphone observations, the presence of unaligned chipset initial

Measurement Science and Technology Roadmap on Signal Processing for Next Generation Measurement Systems
phase biases, and other biases that destroy the integer and time-constant properties of carrier-phase
ambiguities.
Moreover, a variety of unknown observational biases greatly challenge GNSS data processing since
they depend not only on the satellite and receiver hardware, but also on the signal frequencies and
code/phase observables. The number of such biases can easily amount to the order of hundreds in a
multi-GNSS multi-frequency network analysis, but can hardly be estimated along with other
parameters of interest (e.g., positions, clocks, atmosphere, etc.) due to rank deficiency. In such cases,
these biases will be absorbed by the clock, ionosphere and ambiguity parameters, with the
consequence of complicating the time datum definition, the total electron content retrieval, and
integer ambiguity resolution. The difficult part in resolving these biases is to separate them from the
parameters of interest without harming, but rather enhancing high-precision GNSS.
In addition, the target of an establishment of centimetre-level positioning accuracy within seconds
over wide areas has been constantly haunting the GNSS community over the past decades. One of the
major obstacles is that GNSS carrier-phase ambiguities cannot be identified as integers within a short
period of observations. Multi-GNSS multi-frequency data bring a promising opportunity to form longer
wavelength carrier-phase observables of which the ambiguities can be resolved nearly instantly.
However, frequency-specific observation errors are adversely amplified therein by nearly a hundred
times to a few decimetres, which can hardly allow for the centimetre-level positioning. One such
typical error is the multipath effects which are the most difficult to tackle since they are purely
environment dependent and prevent the use of any feasible models.. Therefore, one of the most
critical challenges to speeding up centimetre-level positioning is to minimise the multipath effects
within multi-frequency GNSS data.
Advances in Science and Technology to Meet Challenges
While the GNSS satellite technology is developing disruptively, emerging receiver/antenna techniques
can also be one of the important routes to resolving the challenges above. The baseband processing
to track pseudorange and carrier-phase within GNSS chipsets, which governs how the receiver biases
are induced, should be reconciled among a variety of manufacturers. One common recognition among
the GNSS community is that such receiver biases should be identical with respect to the satellites
emitting the same signals. However, this is not true for GPS/Galileo/BDS satellites, since the receivers’
pseudorange biases originate in the chip-shape distortions which are subject to the front-end
bandwidths and the correlator designs of receivers. Hence, advanced GNSS baseband processing
technologies agreed on by receiver manufacturers are required to minimize such distortions on the
pseudo-random code tracking [8].
On the other hand, the multipath effects, especially those jeopardizing GNSS pseudorange, can be
potentially reduced by advanced receiver/antenna architecture designs. One can introduce the
inertial information of mobile receivers into their baseband chipsets, i.e., the deeply-coupled GNSS
receivers and inertial measurement units. In this case, a long coherent integration time can be applied
to the baseband with the goal of separating the direct and multipath signals in the frequency domain.
This idea is predicated on the fact that the direct and multipath signals usually have different Doppler
frequencies, which is associated with the different line-of-sight vectors from the satellites to the
receiver and from the reflectors to the receiver [9]. Furthermore, an advanced antenna designed with
an excellent cutoff pattern can augment the receivers’ baseband to better reduce multipath effects.
Such a cutoff pattern means that the antenna gain should stay steady over high satellite elevations,
but drop sharply when close to local horizons. Though classic choke-ring antennas with clumpy ground

Measurement Science and Technology Roadmap on Signal Processing for Next Generation Measurement Systems
planes achieve the steady gain pattern for high elevation satellites, their gain at low elevations is not
as good as (about 5-10 dB worse) those ensured by the emerging light and portable helix antennas
[10]. Such helix antenna designs and the like could be one of the most achievable directions for the
GNSS community to head for in the near future.
Concluding Remarks
In this contribution we have reviewed the current and forthcoming issues in GNSS signal processing.
We believe that there are no fundamental barriers that would inhibit a steady improvement in the
performance of GNSS positioning and applications. However, the pace of such progress depends on
the efficient handling of biases and other error sources in multi-constellation and multi-frequency
GNSS signal processing, the quality of satellite products, the magnitude of the research efforts in the
processing algorithm development, emerging receiver and antenna technical progress, and fusion
with other sensing modalities.
Acknowledgements
This contribution was supported by the National Science Centre, Poland (No. 2016/23/D/ST10/01546)
and National Science Foundation of China (No. 42025401).
References
[1] J. Bu, K. Yu, N. Qian, X. Zuo, J. Chang, Performance Assessment of Positioning Based on Multi-Frequency Multi-GNSS Observations: Signal Quality, PPP and Baseline Solution, IEEE Access. 9 (2021) 5845–5861. https://doi.org/10.1109/ACCESS.2020.3048352.
[2] S. Choy, S. Bisnath, C. Rizos, Uncovering common misconceptions in GNSS Precise Point Positioning and its future prospect, GPS Solut. 21 (2017) 13–22. https://doi.org/10.1007/s10291-016-0545-x.
[3] O. Montenbruck, P. Steigenberger, L. Prange, Z. Deng, Q. Zhao, F. Perosanz, I. Romero, C. Noll, A. Stürze, G. Weber, R. Schmid, K. MacLeod, S. Schaer, The Multi-GNSS Experiment (MGEX) of the International GNSS Service (IGS) – Achievements, prospects and challenges, Advances in Space Research. 59 (2017) 1671–1697. https://doi.org/10.1016/j.asr.2017.01.011.
[4] S. Banville, J. Geng, S. Loyer, S. Schaer, T. Springer, S. Strasser, On the interoperability of IGS products for precise point positioning with ambiguity resolution, J Geod. 94 (2020) 10. https://doi.org/10.1007/s00190-019-01335-w.
[5] J. Paziewski, Recent advances and perspectives for positioning and applications with smartphone GNSS observations, Meas. Sci. Technol. 31 (2020) 091001. https://doi.org/10.1088/1361-6501/ab8a7d.
[6] M. Hernandez-Pajares, J. Miguel Juan, J. Sanz, A. Aragon-Angel, A. Garcia-Rigo, D. Salazar, M. Escudero, The ionosphere: effects, GPS modeling and the benefits for space geodetic techniques, J. Geodesy. 85 (2011) 887–907. https://doi.org/10.1007/s00190-011-0508-5.
[7] J. Wickert, E. Cardellach, M. Martin-Neira, J. Bandeiras, L. Bertino, O.B. Andersen, A. Camps, N. Catarino, B. Chapron, F. Fabra, N. Floury, G. Foti, C. Gommenginger, J. Hatton, P. Hoeg, A. Jaggi, M. Kern, T. Lee, Z. Li, H. Park, N. Pierdicca, G. Ressler, A. Rius, J. Rosello, J. Saynisch, F. Soulat, C.K. Shum, M. Semmling, A. Sousa, J. Xie, C. Zuffada, GEROS-ISS: GNSS REflectometry, Radio Occultation, and Scatterometry Onboard the International Space Station, IEEE J. Sel. Top. Appl. Earth Observations Remote Sensing. 9 (2016) 4552–4581. https://doi.org/10.1109/JSTARS.2016.2614428.
[8] A. Hauschild, O. Montenbruck, A study on the dependency of GNSS pseudorange biases on correlator spacing, GPS Solut. 20 (2016) 159–171. https://doi.org/10.1007/s10291-014-0426-0.

Measurement Science and Technology Roadmap on Signal Processing for Next Generation Measurement Systems
[9] A. Soloviev, F. Van Graas, Use of Deeply Integrated GPS/INS Architecture and Laser Scanners for the Identification of Multipath Reflections in Urban Environments, IEEE J. Sel. Top. Signal Process. 3 (2009) 786–797. https://doi.org/10.1109/JSTSP.2009.2027796.
[10] D.V. Tatarnikov, A.P. Stepanenko, A.V. Astakhov, Moderately compact helix antennas with cutoff patterns for millimeter RTK positioning, GPS Solut. 20 (2016) 587–594. https://doi.org/10.1007/s10291-016-0534-0.

Measurement Science and Technology Roadmap on Signal Processing for Next Generation Measurement Systems
5.2. Proximal hyperspectral imaging for in-situ plants monitoring Melanie Ooi, University of Waikato Ye Chow Kuang, University of Waikato Serge Demidenko, Sunway University
Status
To meet the food needs of the fast-growing world’s population, the ability to detect early onsets of
plant diseases, predict an optimum harvest time, estimate yield, ensure biosafety and sustainability
has become of paramount importance in modern farming.
Plant phenotyping is a term given to the process of measuring a set of physical, biological, and
biochemical traits in a plant. With sensors and measurement devices being a ubiquitous part of
modern life, their application to in-situ plant monitoring and phenotyping combined with the
incorporation of information processing is gaining momentum. The associated multidisciplinary field
involving engineering, physics, computer science, biology and chemistry, amongst others, is commonly
defined as phenomics. Among the application areas of phenomics is the measurement and estimation
of the precise nutrient and/or pesticide requirements enabling the evidence-driven trade-off analysis
between crop yield and negative environmental impacts. Another important example is the early
detection of crop diseases. It facilitates loss-preventive measures thus improving the production yield.
Digital phenotyping activities involve various forms of imaging. One of the most promising of them is
hyperspectral imaging, which has been brought from remote to proximal sensing applications allowing
simultaneous measurement of structural and spectral responses. Early studies in the field (e.g., [1])
analysed primary characteristics of plants (such as growth, resistance, architecture, physiology, yield,
tolerance, etc.). Whole plant specimens and their specific components (e.g., roots, leaves, shoots,
fruits, seeds, bark, etc.) were examined. Recent studies showed that hyperspectral imaging data could
be linked to plant chemical composition [2, 3]. It allowed correlating the non-destructive imaging
assessment with the traditional destructive chemical analytical methods, providing precise
measurement of specific chemical compounds. The studies particularly focused on phytochemical
compounds related to the crop, i.e., anthocyanin [2], carotenoid, and chlorophyll [3].
The progress in the field has enabled linking the proximal hyperspectral imaging with not only plant
phenotypes but also with their genotypes [4]. In turn, this opens up the perspective of identifying
genetic strains of the crop with desirable characteristics (e.g., drought tolerance) so to support reliable
food production [5].
Current and Future Challenges
Traditional challenges of hyperspectral imaging have been associated with acquiring sufficient image
data of good quality (i.e., factors such as consistency in imaging setups, illumination, image
normalisation, optical distortions, nonlinear sensing sensitivity, etc., contributing to high variations of
the plants’ spectral response measurements). Besides, some applications demand short acquisition
time, high speed of data processing, and image analysis. Current techniques are often not fast or
accurate enough [6] while also associated with a high equipment cost.
Measurement Science and Technology Roadmap on Signal Processing for Next Generation Measurement Systems
Some new problems have started to become a bottleneck slowing the progress of hyperspectral
imaging for in-situ plants monitoring. First of all, it is a lack of commonly accepted protocols for
hyperspectral imaging setup and calibration that could ensure repeatable measurements and
standardisation in data set structures as well as enable meaningful comparison across experiments.
Secondly, image analysis techniques are yet to be urgently advanced to new heights. For instance,
image samples of biological specimens are nonhomogeneous even after discounting illumination and
imaging noise. This is due to the different spectral characteristics of the specimen parts. Besides, pixel
counts of plant parts that are not of interest could overwhelm the pixel counts of the areas of focus
of analysis. Efficient annotation and correlation of the measured responses to the intended
phenotypes require effective techniques that should be able to identify and separate spectral and/or
spatial signatures from surrounding noise.
Challenges in relevant statistical analysis methods are also quite serious. For example, an apparently
flat surface of a hyperspectral image represents the measurement of a specimen at varying
depths/thickness depending on the penetration of electromagnetic waves of different wavelengths.
The confounding effect between thickness (which is often unknown) and the spectral responses poses
a problem to standard machine learning algorithms. Besides, traditional statistical methods don’t scale
well with large hyperspectral imaging datasets thus requiring particular machine learning and pattern
recognition techniques. Sample sizes are often too small when compared to the variations in crops.
This is especially so for mapping of phenotype and genotype [7], thus leading to poor reproducibility
and could negate the costs in acquiring, storing and analysing the data.
Advances in Science and Technology to Meet Challenges
A multitude of developments in science and technology is needed to provide further progress towards
addressing the challenges of proximal hyperspectral imaging for in-situ plants monitoring. The range
of such advances is wide: from the sensing and image acquisition platforms to image processing and
data analysis and then to specific applications of the information. Several needed advances are
outlined below.
Advanced toolboxes to fuse multiple sensors aiming to perform complex data analysis are yet to come.
Out of all the sensor fusion categories, an efficient algorithm combining a three-dimensional
morphological model with hyperspectral images to perform the analysis is acutely lacking. This
particular fusion holds great potential to create automated inspection systems with superhuman
prediction performance. The creation of the comprehensive toolbox is indeed a very challenging task
requiring a team of experts in an array of disciplines such as plant morphology and physiology,
machine vision and imaging, sensor fusion, point cloud modelling, machine learning, and high-
performance computing among others.
Statistical machine learning and pattern recognition have been advancing to address numerous
challenges in the niche area of plant phenotyping and hyperspectral images analysis. At the same time,
the development of a library of efficient specialised machine learning and machine vision algorithms
to facilitate high-level phenotype analysis would be a very useful common platform of a high value.

Measurement Science and Technology Roadmap on Signal Processing for Next Generation Measurement Systems
Hyperspectral imaging systems are getting more affordable, compact, and resilient. Unfortunately,
sometimes the cost improvements are achieved by sacrificing some technical performance
characteristics and functions in specific classes of niche applications. In this context, vendors’ ability
to rapidly customise their produced systems to address specific needs of ever-narrowing niche
applications could become a key-important factor to encourage the adoption of proximal
hyperspectral technology in agriculture and other relevant fields at an industrial scale.
Robust data management protocols and imaging setups conforming to formulated and adopted good
practices would be critical to guarantee the quality of data feeding into the analysis. Reliable data and
well-managed databases are pre-requisite to enable the use of high-performance data-hungry
algorithms associated with image-based plant phenotyping, its applications, and relevant associated
areas [8].
Concluding Remarks
Hyperspectral imaging combined with advanced data analytics (Figure 1) has been identified and well-
accepted as one of the enabling technologies of the Fourth Industrial Revolution addressing the urgent
need for accelerating the global food systems transformation. Proximal hyperspectral imaging for in-
situ plants monitoring is fast coming to the age of maturity, and it has a great potential to become an
important part of the quest. At the same time, a significant number of challenging research and
development problems associated with algorithms, techniques, and tools for sensing, acquisition,
processing, analysis, interpretation, etc., as well as the application of the results are still waited to be
addressed [9]. In this section, some of them have been outlined based on the authors’ experience
gained in the field (e.g., [10]).
Figure 1. Application of proximal hyperspectral imaging to plants
Acknowledgements
This work was supported in part by the Royal Society of New Zealand Te Apārangi through a Rutherford
Discovery Fellowship conferred to Melanie Ooi. Furthermore, the authors gratefully acknowledge the
valuable discussions with Stefan Hill and Laura Raymond as well as Ray Simpkin, who are senior
scientists from two of New Zealand’s Crown Research Institutes: Scion and Callaghan Innovation
respectively. They are very thankful for the cooperation with staff and the use of facilities that were
made available by the partner institutions: (1) Wayne Holmes, Dan Blanchon, Irene Kereama-Royal,

Measurement Science and Technology Roadmap on Signal Processing for Next Generation Measurement Systems
and Gregor Steinhorn from Applied Molecular Solutions at Unitec Institute of Technology; (2) Mike
Duke and Hin Lim from Robotics, Automation, and Sensing at University of Waikato; (3) Photometric
Laboratory at Massey University, (4) Manu Caddie and his team, alongside their horticulture facilities
at Rua Bioscience, and for (5) valuable assistance from Sunway University.
References
[1] Utsushi H, Abe A, Tamiru M, Ogasawara Y, Obara T, Sato E, Ochiai Y, Terauchi R and Takagi H 2015
Breed. Sci 65 285-289
[2] Diaz-Garcia L, Schlautman B, Covarrubias-Pazaran G, Maule A, Johnson-Cicalese J, Grygleski E,
Vorsa N and Zalapa J 2018 Mol. Genet. Genom. 293 1379-1392
[3] Campbell Z C, Acosta-Gamboa L M, Nepal N and Lorence A 2018 Phytochem. Rev. 17 1329–1343 [4] Fachi L R, Krause W, Vieira H D, Araújo D V, Luz P B and Viana A P 2019 Genet. Mol. Res. 2019 18
18331 [5] Sytar O, Zivcak M, Olsovska K and Brestic M 2018 Perspectives in high-throughput phenotyping
of qualitative traits at the whole-plant Level Eco-Friendly Agro-Biological Techniques for Enhancing Crop Productivity (Singapore: Springer)
[6] Zhang Y and Zhang N 2018 Front. Agric. Sci. Eng. 5 406-419 [7] Afonnikov D A, Genaev M A, Doroshkov A V, Komyshev E G and Pshenichnikova T A 2016 Genetika
52 788-803 [8] Rahaman M M, Ahsan M A and Chen M 2019 Sci. Rep. 9 1952 [9] Lu B, Dao P D, Liu J, He Y and Shang J 2020 Remote Sens. 12 2659 [10] Holmes W S, Ooi M P-L, Kuang Y C, Simpkin R, Blanchon D, Sen Gupta G and Demidenko S 2020
IEEE International Instrumentation and Measurement Technology Conf.

Measurement Science and Technology Roadmap on Signal Processing for Next Generation Measurement Systems
5.3. Through-Wall Sensing, Signal and Image Processing Francesco Fioranelli1 and Ram M Narayanan2 1TU Delft, Netherlands 2Pennsylvania State University, USA
Status
Through-The-Wall (TTW) radar imaging is truly a “multifaceted technology”, requiring a wide breadth
of integrated and multidisciplinary knowledge across diverse fields of engineering, such as antennas
and array design, signal processing, waveform design, electromagnetic scattering and propagation
modelling, and imaging algorithms [1].
Surprisingly, the earliest report of the use of radar signals for through-wall propagation appeared
in an advertisement [2]. The first open research papers and surveys on the topic of TTW radar
appeared around the late 1980s, attracted by the potential advantages of radar-based through-wall
imaging in comparison to alternative technologies based on acoustic and X-ray systems. Radio-
frequency electromagnetic waves are attractive since they are able to propagate through common
wall construction materials, such as plaster, bricks, concrete, and thick and complex multi-layered
structures such as cinder blocks [3].
Although TTW radar systems employing a plurality of waveforms and algorithms have been
proposed and validated [1], it is difficult to classify the many different solutions within a unified
framework. Performance metrics may include spatial resolution in range and azimuth directions,
maximum detection range, stand-off distance, processing time, dynamic range, and practical aspects
such as power usage, weight, and size. Alternatively, the amount of information for situational
awareness can be used [4], starting from 0D systems indicating human presence and type of human
activity, up to 1D, 2D, and 3D systems capable of providing the distance of the TTW targets, their
locations in range and angle, and even their comprehensive volumetric signature, respectively. For
example, Figure 1 shows 3D images of a human target located behind a 60-cm thick reinforced
concrete wall wherein the posture of the person, i.e., standing or laying, can be inferred from the 3D
images [5].
Despite significant advances, TTW imaging is still an extremely important field for applications in
the security and safety domains (e.g., hostage situations, firefighter intervention, building evacuation,
earthquake survivor detection, concealed weapon detection) with several open research problems for
addressal. Some challenging problems confounding target detection and characterization include non-
uniformity of the barrier structure in terms of wall shape and materials, presence of significant indoor
clutter, targets of smaller size, and effects of multipath.
Current and Future Challenges
The wall’s effects on the two-way radar propagation path inhibits the formation of clean 2D/3D
images. Compensation for wall effects requires knowledge of the dielectric properties of its
constituent materials and its internal structure and thickness, which are generally unknown.
Approximations based on average values across different construction material types introduce errors
in reconstructed image quality. Walls containing internal cavities or metallic rebars create resonant
effects extending the wall’s signature in time, possibly interfering with those of targets located near

Measurement Science and Technology Roadmap on Signal Processing for Next Generation Measurement Systems
the back side of the wall. Another challenge is the mitigation of ghost targets created by multipath
reflections from the back and side walls, ceiling, and other obstacles in the indoor environment
resulting in artefacts and distortion in the reconstructed images.
The two-way signal attenuation through the wall affects the radar’s power link budget and
imposes dynamic range constraints for detecting small targets located at far ranges [6]. Furthermore,
the strong backscattered reflection at the air-wall interface may saturate the radar receiver.
Conventional wall effect removal techniques include subspace projection, spatial filtering, background
subtraction, change detection, hardware filtering, and time gating.
Indoor clutter, typically arising from furniture elements, is another scourge in TTW radar systems
causing high backscattered signals compared to those from human targets [7]. High reflections occur
from the large planar surfaces of the clutter objects, particularly, the front, sides, and back. Figure 2
shows that the radar cross section (RCS) of furniture arrangements is generally 5 dB higher than that
of the human over the 1–5 GHz frequency band. This interferes with and degrades the radar system’s
ability to accurately detect, locate, and track desired targets. Waveform design exploiting spectral
characteristics as features are being investigated for target classification [8].
Achieving high resolution in TTW radar systems is another major challenge. Low frequencies are
preferred for better signal penetration through the wall but obtaining the necessary large bandwidth
for high down-range resolution is difficult. In addition, antenna beamwidths are wider at lower
frequencies inhibiting high cross-range resolution. Techniques such as multiple-input-multiple-output
(MIMO) and synthetic aperture radar (SAR) are being investigated for sharpening the cross-range
resolution.
Figure 1. TTW measurement scenario and example of results at MS3 Radar Laboratory, TU Delft showing the 3D image of person in
standing position (top) and in laying position (bottom) [5]. The front face of the wall is the XZ-plane and the radar is positioned towards
the left side.

Measurement Science and Technology Roadmap on Signal Processing for Next Generation Measurement Systems
Advances in Science and Technology to Meet Challenges
Advances in MIMO radar systems and related signal processing can address some of the open research
challenges in TTW radar imaging [9]. Increasing the number of channels and where possible, given the
operational constraints to deploy and synchronize such systems, moving towards forms of distributed,
bistatic, or multistatic systems, are expected to enhance situational awareness. Such systems can
achieve finer angular resolutions for better characterization of the volumetric target signatures in both
azimuth and elevation planes, i.e., finer details of the targets’ features and postures for improved
situational assessment. Distributed systems can also provide multi-perspective view of the scene of
interest, enhancing the perception of certain key target scattering features for identification, and
helping discriminate real targets from ghosts [10]. In this context, compressive sensing approaches
are additional research paradigms that can play a key role in minimizing the number of physical
channels and antennas by exploiting sparse sampling techniques, thereby reducing hardware
complexity, expense, size, and processing time.
More sophisticated Doppler processing approaches are needed in the area of human movement
and vital sign detection, especially through rubble following disasters [11]. Examples include
extraction of very low-level signals due to shadowing and/or propagation through several collapsed
walls, rejection of Doppler signals from spurious sources such as fans and motors, and detection of
multiple humans of varying sizes.
Intelligent and adaptive waveform design is another open research area where target signatures
can be enhanced while suppressing clutter, wall effects, and radio frequency interference. The recent
emergence of arbitrary waveform generators and high-speed digital samplers has given rise to several
new waveforms and sophisticated pulse-shaping techniques for improved detection and localization
of targets behind wall barriers and suppression of ghosts caused by multiple reflections. These include
matched illumination, chaotic, orthogonal frequency-division multiplexed (OFDM), and frequency-
modulated interrupted continuous wave (FMICW) waveforms. FMICW waveforms mitigate wall
reflections and improve detection of stationary targets and moving or breathing humans behind
different wall types [12].
Advances in materials used in antenna fabrication, such as dielectric lenses and metamaterial-
inspired superstrates, also provide new directions to significantly enhance TTW radar performance.
Examples include bandwidth extension and multi-frequency operation through feeding structure
enhancements [13], antenna size reduction using high dielectric constant substrates, and precise
beam focusing and control using metasurfaces.
Artificial intelligence (AI) and machine learning (ML) techniques can also play a significant role in
the performance improvements of TTW systems [14]. Examples include learning better approaches
for removal and/or mitigation of wall effects and suppression of ghost targets via generative
adversarial networks (GANs) and denoising networks, as well as dynamic transmit waveform
adaptation for improving the signal-to-clutter ratio and switching between different frequency bands
to exploit more favourable propagation conditions. As the learning capabilities of these algorithms
improve, hybrid techniques could be developed whereby physical prior information on the TTW
propagation and scattering can be incorporated into the AI/ML algorithms for target classification and
situational awareness, or to provide better estimation of the physical parameters of the wall for
deconvolution of its effects.
Traditional TTW radar techniques involve relatively expensive hardware deployment costs and
higher power requirement since these operate in an active manner. An emerging area of TTW research

Measurement Science and Technology Roadmap on Signal Processing for Next Generation Measurement Systems
involves the exploitation of Wi-Fi signals from the increasing deployment of wireless local area
network (IEEE 802.11) technologies in indoor environments due to their ubiquity [15]. Since such
systems operate in the passive (i.e., receive-only) mode, opportunities for advances are called for in
the development of beamforming and coherent/non-coherent integration schemes to detect and
track weak signals from targets, adaptive processing to optimize system performance under
uncertainty and noise in the reference channel, and reduction in the computational load for cross-
correlation processing.
Concluding Remarks
TTW radar technology is an essential tool in several military, safety and security, law enforcement,
commercial, and more recently, in personal applications, and is used primarily to detect humans.
Although research in TTW radar has been ongoing for several decades, there are many areas for
improvement to enhance target detection, recognition, and imaging. Although the wall signature
appears as a nuisance signal, it does provide useful information which may be exploited to suppress
its effects in subsequent processing. Detection of targets buried behind irregularly oriented walls
formed by building collapses is a major challenge. Most TTW radars are plagued by harsh indoor clutter
which may be suppressed by optimization of the transmit spectrum. Future operation TTW radar
systems may require a dual-frequency approach wherein lower frequencies are used for high-range
detection while higher, perhaps millimetre-wave frequencies, may possess the resolution to detect
and resolve targets closer to the wall.
Therefore, next generation measurement systems for through-wall sensing, signal and image
processing applications are expected to incorporate and integrate several new technological
Figure 2. Comparison of RCS of human and representative furniture arrangements for vertical-vertical (VV) polarization (top) and
horizontal-horizontal (HH) polarization (bottom). Observe that the furniture clutter overwhelms the human signature [7].
.

Measurement Science and Technology Roadmap on Signal Processing for Next Generation Measurement Systems
breakthroughs, such as distributed and dispersed sensors for more complete views of the target scene,
intelligent and cognitive waveforms for real-time enhancement of targets and suppression of clutter
and interference, advanced Doppler processing techniques for extracting faint vital sign and motion
signals, artificial intelligence and machine learning approaches for improved feature selection and
exploitation, and metamaterial-inspired antennas for reconfigurable beamforming.
References (IoP style)
[1] Amin M G (ed.) 2010 Through-the-Wall Radar Imaging (Boca Raton: CRC Press)
[2] Anonymous 1976 Eng. Mater. Des. 20(1) 34
[3] Baranoski E J 2008 J. Franklin Inst. 345 556
[4] Farwell M, Ross J, Luttrell R, Cohen D, Chin W, Dogaru T 2008 J. Franklin Inst. 345 570
[5] Savelyev T G, Zhuge X, Yarovoy A G, Ligthart L P, Lerat J M, Duchesne L, Fortuny-Guasch J 2011
Development of through-wall imaging radar with planar MIMO array 8th European Radar Conf.,
Manchester, UK pp 226–229
[6] Beeri A, Daisy R 2006 Non-uniform integration for through-wall-imaging radar SPIE Conf.
Unmanned/Unattended Sensors and Sensor Networks III, Stockholm, Sweden, doi:
10.1117/12.687633
[7] Bufler T D, Narayanan R M, Dogaru T 2015 IEEE Trans. Aerosp. Electron. Syst. 51 521.
[8] Bufler T D, Narayanan R M 2016 IET Radar Sonar Navig. 10 1468
[9] Pan J, Ye S, Shi C, Yan K, Liu X, Ni Z, Yang G, Fang G 2021 IET Radar Sonar Navig. 15 261
[10] Narayanan R M, Gebhardt E T, Broderick S P 2017 Electronics 6 70
[11] Yang D, Zhu Z, Zhang J, Liang B 2021 Sensors 21 402
[12] Fioranelli F, Salous S, Raimundo X 2014 IEEE Trans. Geosci. Remote Sens. 52 6272
[13] Fioranelli F, Salous S, Ndip I 2012 Optmized patch-like antennas for through the wall radar
imaging and preliminary results with frequency modulated interrupted continuous wave, 2012
Int. Symp. Signals, Systems, and Electronics (ISSSE), Potsdam, Germany, doi:
10.1109/ISSSE.2012.6374334
[14] Ghorbani F, Soleimani H, Soleimani M 2021 arXiv:2102.07990v1
[15] Zhong W, He K, Li L 2019, J. Eng. 2019 6940
References (full citation)
[1] M. G. Amin, Through-the-Wall Radar Imaging. Boca Raton, FL: CRC Press, 2010.
[2] Anonymous, “Radar senses through wall,” Engineering Materials and Design, vol. 20, no. 1, p.
34, Jan. 1976.
[3] E. J. Baranoski, “Through-wall imaging: historical perspective and future directions,” Journal of
the Franklin Institute, vol. 345, pp. 556–569, Sep. 2008.
[4] M. Farwell, J. Ross, R. Luttrell, D. Cohen, W. Chin, and T. Dogaru, “Sense through the wall
system development and design considerations,” Journal of the Franklin Institute, vol. 345, pp.
570–591, Sep. 2008.
[5] T. G. Savelyev, X. Zhuge, A. G. Yarovoy, L.P. Ligthart, J.M. Lerat, L. Duchesne, and J. Fortuny-
Guasch, “Development of through-wall imaging radar with planar MIMO array,” in Proc. 2011
8th European Radar Conference, Manchester, UK, 12–14 Oct. 2011, pp. 226–229.
[6] A. Beeri and R. Daisy, “Non-uniform integration for through-wall-imaging radar,” in Proc. SPIE
Conference on Unmanned/Unattended Sensors and Sensor Networks III, Stockholm, Sweden,
11–14 Sep. 2006, doi: 10.1117/12.687633.

Measurement Science and Technology Roadmap on Signal Processing for Next Generation Measurement Systems
[7] T. D. Bufler, R. M. Narayanan, and T. Dogaru, “Radar signatures of furniture elements,” IEEE
Transactions on Aerospace and Electronic Systems, vol. 51, no. 1, pp. 521–535, Jan. 2015.
[8] T. D. Bufler and R. M. Narayanan, “Radar classification of indoor targets using support vector
machines,” IET Radar, Sonar & Navigation, vol. 10, no. 8, pp. 1468–1476, Oct. 2016.
[9] J. Pan, S. Ye, C. Shi, K. Yan, X. Liu, Z. Ni, G. Yang, and G. Fang, “3D imaging of moving targets for
ultra-wideband MIMO through-wall radar system,” IET Radar, Sonar & Navigation, vol. 15, no.
3, pp. 261–273, Mar. 2021.
[10] R. M. Narayanan, E. T. Gebhardt, and S. P. Broderick, “Through-wall single and multiple target
imaging using MIMO radar,” Electronics, vol. 6, no. 4, art. no. 70, 2017.
[11] D. Yang, Z. Zhu, J. Zhang, and B. Liang, “The overview of human localization and vital sign
signal measurement using handheld IR-UWB through-wall radar,” Sensors, vol. 21, no. 2, art.
no. 402, 2021.
[12] F. Fioranelli, S. Salous, and X. Raimundo, “Frequency-modulated interrupted continuous wave
as wall removal technique in through-the-wall imaging,” IEEE Transactions on Geoscience and
Remote Sensing, vol. 52, no. 10, pp. 6272–6283, Oct. 2014.
[13] F. Fioranelli, S. Salous, and I. Ndip, “Optmized patch-like antennas for through the wall radar
imaging and preliminary results with frequency modulated interrupted continuous wave,” in
Proc. 2012 International Symposium on Signals, Systems, and Electronics (ISSSE), Potsdam,
Germany, 3–5 Oct. 2012, doi: 10.1109/ISSSE.2012.6374334.
[14] F. Ghorbani, H. Soleimani, and M. Soleimani, “Deep learning approach for target locating in
through-the-wall radar under electromagnetic complex wall,” arXiv:2102.07990v1, 16 Feb
2021.
[15] W. Zhong, K. He, and L. Li, “Through-the-wall imaging using Wi-Fi signals,” Journal of
Engineering, vol. 2019, no. 20, pp. 6940–6942, Oct. 2019.

Measurement Science and Technology Roadmap on Signal Processing for Next Generation Measurement Systems
5.4. Sensors for automated driving
Carlos Fernandez, Christoph Stiller, Karlsruhe Institute of Technology (KIT).
Status
Since early experiments with autonomous vehicles in the 1980s [1] the vision of automated driving
has inspired numerous research groups all over the world. Today, modern driver assistance systems
are standard to most vehicles and contribute to enhance safety and comfort. Many experts expect the
market introduction of fully automated vehicles in the not too far future and that this technology will
be disruptive and revolutionary to the automotive industry [2].
Automated vehicles acquire all relevant information through their sensors. For safety reasons, a
sensor setup should have redundancy and 360° field of view including different sensor technologies
(Fig. 1).
Automotive radar (Radio Detection and Ranging) mainly operates in the 76–81 GHz frequency band.
Among all environmental sensors, radar is most robust against atmospheric influences. The strengths
of radar include high accuracy (measuring object position and radial velocity) and long range in radial
direction, while in azimuthal and vertical accuracy radar remains about an order of magnitude behind
cameras and lidars.
Automotive lidar (Light Detection and Ranging) operate in the optical spectrum of about 905 nm and
measure distance by the time-of-flight principle. Today, lidar sensors provide a set of 3D points in the
environment, each associated with a reflectance value. As compared to cameras, lidars are less
affected by strong sunlight and robust against spatially variable illumination. Restrictions occur for
perception of objects with low reflectivity caused by the material itself or by an unfavorable viewing
angle.
Cameras are closest to human perception and operate in the visible spectrum of 380-780 nm. No other
sensor principle has comparable perception capabilities when it comes to rich diversity of information.
Cameras can detect, classify, measure and track moving and static objects of almost any kind. The
status of traffic lights is one example of important information that can hardly be perceived by any
other sensor principle.
As automated driving is a safety-critical application, all of the above sensor principles are applied in
parallel and appropriate information fusion methods are applied to yield a consistent and plausibilized
representation of the environment for subsequent motion planning and control [3].
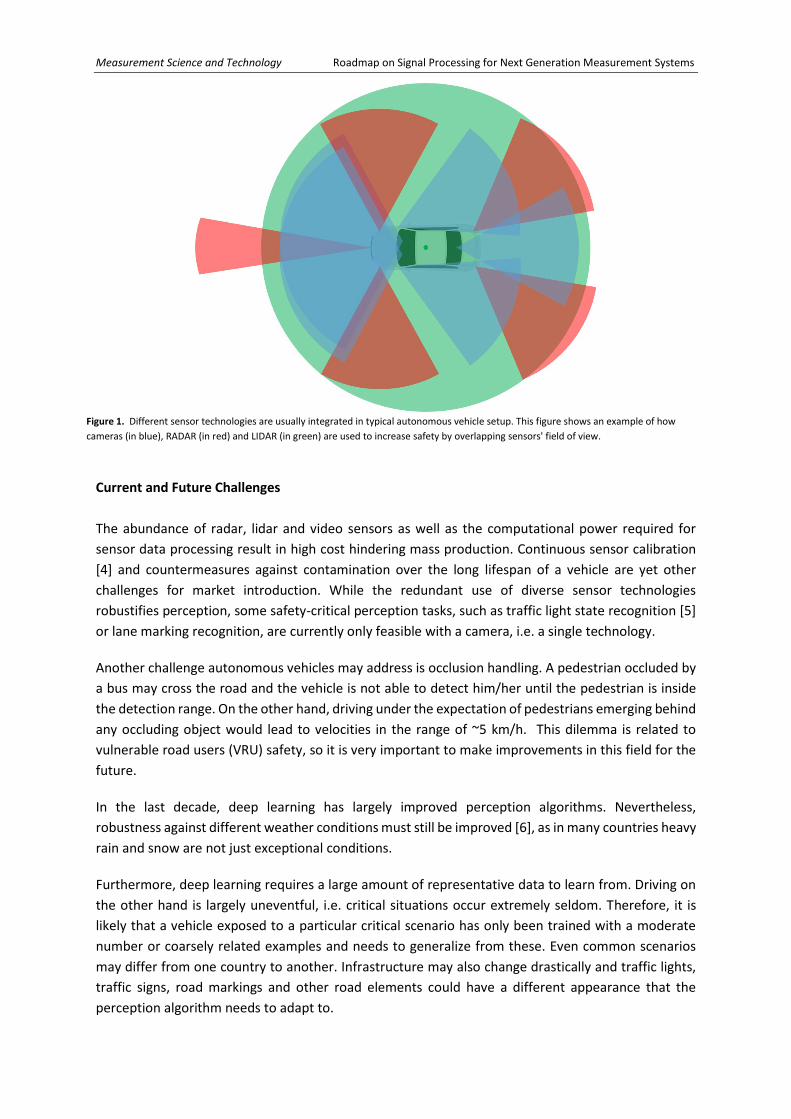
Measurement Science and Technology Roadmap on Signal Processing for Next Generation Measurement Systems
Figure 1. Different sensor technologies are usually integrated in typical autonomous vehicle setup. This figure shows an example of how
cameras (in blue), RADAR (in red) and LIDAR (in green) are used to increase safety by overlapping sensors' field of view.
Current and Future Challenges
The abundance of radar, lidar and video sensors as well as the computational power required for
sensor data processing result in high cost hindering mass production. Continuous sensor calibration
[4] and countermeasures against contamination over the long lifespan of a vehicle are yet other
challenges for market introduction. While the redundant use of diverse sensor technologies
robustifies perception, some safety-critical perception tasks, such as traffic light state recognition [5]
or lane marking recognition, are currently only feasible with a camera, i.e. a single technology.
Another challenge autonomous vehicles may address is occlusion handling. A pedestrian occluded by
a bus may cross the road and the vehicle is not able to detect him/her until the pedestrian is inside
the detection range. On the other hand, driving under the expectation of pedestrians emerging behind
any occluding object would lead to velocities in the range of ~5 km/h. This dilemma is related to
vulnerable road users (VRU) safety, so it is very important to make improvements in this field for the
future.
In the last decade, deep learning has largely improved perception algorithms. Nevertheless,
robustness against different weather conditions must still be improved [6], as in many countries heavy
rain and snow are not just exceptional conditions.
Furthermore, deep learning requires a large amount of representative data to learn from. Driving on
the other hand is largely uneventful, i.e. critical situations occur extremely seldom. Therefore, it is
likely that a vehicle exposed to a particular critical scenario has only been trained with a moderate
number or coarsely related examples and needs to generalize from these. Even common scenarios
may differ from one country to another. Infrastructure may also change drastically and traffic lights,
traffic signs, road markings and other road elements could have a different appearance that the
perception algorithm needs to adapt to.

Measurement Science and Technology Roadmap on Signal Processing for Next Generation Measurement Systems
As an additional ‘virtual sensor’, high definition maps augment the information basis of AVs [7]. While
these provide information in a large spatial range including traffic rules, road topology, speed limits,
etc. the main challenge concerning them is how to keep them up to date with the maintenance of the
road infrastructure.
Advances in Science and Technology to Meet Challenges
Next generation measurement systems are improving quality and lowering their cost:
· Radar development aims to provide array antennas with improved angular resolution applying
beamforming techniques and on-a-chip antennas.
· Likewise, lidar technology migrates from scanning to solid-state technology, removing any moving
parts and making sensors cheaper and more robust.
· Cameras are based on silicon technology already and thus follow Moore’s law, i.e. their
resolution is increased by about a factor 2 every 1.5 years. Emerging from graphical processing
units (GPUs), low power video data processing units tailored to deep learning techniques are
under development.
Occlusions imply safety critical situations and are very difficult to eliminate from a single vehicle
perspective. However, vehicle to vehicle (V2V), and vehicle to infrastructure (V2I) communication may
mitigate this problem. In the extreme, when all vehicles intentions or trajectories are shared, more
efficient trajectories can be generated and negotiated, where efficiency involves a reduction of
traveling time and energy saving.
Challenging weather conditions such as heavy rain, snow or low light conditions should be considered
in vehicle design. Due to the fact that deep learning requires large amounts of data, dataset generation
for a wide variety of purposes becomes a key point. Therefore, tool chains for the acquisition and
augmentation of high quality datasets with relevant corner case scenarios gain a growing relevance
for many disciplines and applications. Governmental authorities assist such activities as they may lead
to homologation requirements and standards.
Datasets covering different regions of the world will contribute to reduce the domain gap and thus
improve perception algorithms. Another solution comes from standardization beyond countries to
have the same traffic lights, traffic signs, traffic rules, etc. and allow algorithms to perform better
regardless of the country or city.
Classical signal processing has been replaced or combined with deep learning techniques. Deep
learning is getting integrated in all the software stages. Consequently, a lot of effort is put into
understanding deep neural networks, what their limitations are and how to provide safety using
metrics [8].
To conclude, map verification and crowdmapping is getting popular due to the fact that high level map
information requires low bandwidth and it can be transmitted to the cloud.
Concluding Remarks
Measurement Science and Technology Roadmap on Signal Processing for Next Generation Measurement Systems
Include brief concluding remarks. This should not be longer than a short paragraph. (150 words max)
Currently 151
Automated driving promises a groundbreaking change to our mobility. Thus it comes as no surprise
that global players invest great enthusiasm and effort in this technology. These include established
vehicle manufacturers that mainly continuously improve their driver assistance systems to adding
more and more automation until full automation is reached. In contrast to this evolutionary approach,
IT companies aim to build a fully automated vehicle for a limited operational domain in a disruptive
approach.
In either approach, sensors and perception algorithms are key components for market introduction.
As compared to many other applications, AVs operate in an open world with a priori unknown
scenarios. Nevertheless, appropriate safety guarantees need to be provided for the perception system
before market introduction. Furthermore, safety of the vehicle architecture in general and motion
planning in particular are not just mere additional challenges that need to be approached before
automated vehicles become reality on our roads.
References
[1] Dickmanns, E. D., & Christians, T. (1991). Relative 3D-state estimation for autonomous visual
guidance of road vehicles. Robotics and autonomous systems, 7(2-3), 113-123.
[2] Winner, H., Hakuli, S., Lotz, F., & Singer, C. (Eds.). (2014). Handbook of driver assistance systems
(pp. 405-430). Amsterdam, The Netherlands:: Springer International Publishing.
[3] M. L. Fung, M. Z. Q. Chen and Y. H. Chen, (2017). Sensor fusion: A review of methods and
applications. 29th Chinese Control And Decision Conference (CCDC), 2017, pp. 3853-3860, doi:
10.1109/CCDC.2017.7979175.
[4] T. Dang, C. Hoffmann and C. Stiller, (2009). Continuous Stereo Self-Calibration by Camera
Parameter Tracking. IEEE Transactions on Image Processing, vol. 18, no. 7, pp. 1536-1550, July 2009,
doi: 10.1109/TIP.2009.2017824.
[5] C. Fernández, C. Guindel, N. Salscheider and C. Stiller, (2018). A Deep Analysis of the Existing
Datasets for Traffic Light State Recognition. 21st International Conference on Intelligent
Transportation Systems (ITSC), 2018, pp. 248-254, doi: 10.1109/ITSC.2018.8569914.
[6] Heinzler, R., Piewak, F., Schindler, P., Stork, W. (2020). CNN-based Lidar Point Cloud De-Noising in
Adverse Weather. IEEE Robotics and Automation Letters. 5. 1-1. 10.1109/LRA.2020.2972865.
[7] S. Bauer, Y. Alkhorshid and G. Wanielik. (2016). Using High-Definition maps for precise urban
vehicle localization. IEEE 19th International Conference on Intelligent Transportation Systems (ITSC),
2016, pp. 492-497, doi: 10.1109/ITSC.2016.7795600.
[8] Shalev-Shwartz, S., Shammah, S., Shashua, A. (2017). On a formal model of safe and scalable
self-driving cars. arXiv preprint arXiv:1708.06374.

Measurement Science and Technology Roadmap on Signal Processing for Next Generation Measurement Systems
[1] @article{DickmannsC91, author = {Ernst D. Dickmanns and Thomas Christians}, title = {Relative 3D-state estimation for autonomous visual guidance of road vehicles}, journal = {Robotics Auton. Syst.}, volume = {7}, number = {2-3}, pages = {113--123}, year = {1991} }
[2]
@book{10.5555/2911262, author = {Winner, Hermann and Hakuli, Stephan and Lotz, Felix and Singer, Christina}, title = {Handbook of Driver Assistance Systems: Basic Information, Components and Systems for Active Safety and Comfort}, year = {2015}, isbn = {3319123513}, publisher = {Springer Publishing Company, Incorporated}, edition = {1st} }
[3]
@INPROCEEDINGS{7979175, author={Fung, Man Lok and Chen, Michael Z. Q. and Chen, Yong Hua}, booktitle={2017 29th Chinese Control And Decision Conference (CCDC)}, title={Sensor fusion: A review of methods and applications}, year={2017}, volume={}, number={}, pages={3853-3860}, doi={10.1109/CCDC.2017.7979175}}
[4]
@ARTICLE{5061491, author={Dang, Thao and Hoffmann, Christian and Stiller, Christoph}, journal={IEEE Transactions on Image Processing}, title={Continuous Stereo Self-Calibration by Camera Parameter Tracking}, year={2009}, volume={18}, number={7}, pages={1536-1550}, doi={10.1109/TIP.2009.2017824}}
[5]
@inproceedings{FernandezGuindelSalscheider2018_1000090990, author = {Fernandez, C. and Guindel, C. and Salscheider, N.-O. and Stiller, C.}, year = {2018}, title = {A Deep Analysis of the Existing Datasets for Traffic Light State Recognition}, pages = {248-254},

Measurement Science and Technology Roadmap on Signal Processing for Next Generation Measurement Systems
booktitle = {21st IEEE International Conference on Intelligent Transportation Systems, ITSC 2018; Maui; United States; 4 November 2018 through 7 November 2018}, doi = {10.1109/ITSC.2018.8569914}, publisher = {{Institute of Electrical and Electronics Engineers (IEEE)}}, isbn = {978-1-72810-323-5}, language = {english} }
[6]
@article{article, author = {Heinzler, Robin and Piewak, Florian and Schindler, Philipp and Stork, Wilhelm}, year = {2020}, month = {02}, pages = {1-1}, title = {CNN-based Lidar Point Cloud De-Noising in Adverse Weather}, volume = {5}, journal = {IEEE Robotics and Automation Letters}, doi = {10.1109/LRA.2020.2972865} }
[7]
@article{article, author = {Liu, Rong and Wang, Jinling and Zhang, Bingqi}, year = {2019}, month = {08}, pages = {1-18}, title = {High Definition Map for Automated Driving: Overview and Analysis}, volume = {73}, journal = {Journal of Navigation}, doi = {10.1017/S0373463319000638} }
[8] @article{DBLP:journals/corr/abs-1708-06374, author = {Shai Shalev{-}Shwartz and Shaked Shammah and Amnon Shashua}, title = {On a Formal Model of Safe and Scalable Self-driving Cars}, journal = {CoRR}, volume = {abs/1708.06374}, year = {2017}, timestamp = {Mon, 13 Aug 2018 16:48:39 +0200}, biburl = {https://dblp.org/rec/journals/corr/abs-1708-06374.bib}, bibsource = {dblp computer science bibliography, https://dblp.org} }

Measurement Science and Technology Roadmap on Signal Processing for Next Generation Measurement Systems
5.5. Acoustic Emission Processing for Industrial Measurement Systems
Konstantina Malamousi -University of Thessaly, Dept. of Computer Science and Biomedical
Informatics, GR
Spyros Kamnis -Castolin Eutectic-Monitor Coatings Ltd, R&D Department, UK
Konstantinos Delibasis -University of Thessaly, Dept. of Computer Science and Biomedical
Informatics, GR
Status
The scientific era of acoustic emissions (AE) started in the early 20th century when researchers around
the world started to report distinct sounds during the investigation of material deformation. Since
then and throughout the years, AE processing has become integral part of industrial sensing
technologies aiming to continuously measure critical material properties and to control and report the
status of production processes. In principle, AE is a passive monitoring and measurement system with
only receivers and without ultrasound transmitters. Currently, the AE uses one or more sensors to
‘listen’ to a wide range of events with unique non-destructive (NDT) and dynamic information
characteristics in broadly three application areas: structural testing and surveillance, process
monitoring and control, and materials characterisation. The latest state of the art in this field is the
development of knowledge-based systems (KBS) alongside interactive machine learning techniques.
The adoption of advanced industrial measurement technologies, through AE processing, are quickly
becoming the entry standard for competitive companies and those that fail to do so are likely to be
crowded out of an increasingly competitive market. As supply chains become more connected and
‘transparent’ game changing technologies are shared, through technology transfer licenses, to
customers and competitors alike. Such outward transfer of technology has become an important
dimension in corporate strategies and has created a highly interdependent ecosystem within most
manufacturing sectors. In the absence of sophisticated digital measurement and control technologies,
the quality of technical and service support could be extremely compromised. Failure to provide more
advanced industrial measurement systems can result in whole batch recalls, downstream production
delays, which in turn has a knock-on effect on many sectors such as construction, automotive,
aerospace and machinery. The impact extends to costly stock management and even potential loss of
contracts. The demand for the development and use of AE technologies is ever increasing. Modern
supply chains rely more on digitization as a key enabling technology for building stronger and smarter
supply chains through AE measurement and control.
Current and Future Challenges
Understanding the physical nature of acoustic emission in different processes is the cornerstone in
the development of the AE technology. The success and the depth of the technology capabilities
depend on the ability to determine unique detectable noise features that can be attributed and
effectively correlated to target variables and properties. However, establishing such dependences for
different materials and structures is probably the biggest real scientific and technological challenge
[1]. To address this critical two main approaches are used. These are broadly the statistical or empirical
method and the deterministic or fundamental method. Statistical source characterisation is of wide

Measurement Science and Technology Roadmap on Signal Processing for Next Generation Measurement Systems
applicability and it is suitable for complex geometries, anisotropic or inhomogeneous materials.
Deterministic characterisation is based on a reasonably detailed knowledge of the physical processes
involved in the source so that a mathematical model can be set up. Even though existing techniques
are highly efficient, they have also shown some restrictions in handling large number of process
parameters and in turn obtaining a judicious relationship between input and output target data. Such
difficulties were observed mainly due to the nonlinear and complex nature of phenomena and
parameters involved in industrial AE applications. Several other challenges have been identified by [2]
in relation to AE. Current AE hardware does not provide sufficient noise immunity against
interferences. At the hardware level this requires electromagnetically isolated instrumentation. On
the other hand, removing noise during post-processing requires more advanced techniques, as
discussed in the next section, alongside outlier detection after frequency filtering. Denoising
techniques, such as discrete wavelet filtering of waveform data and Swansong filtering [3] of hit
features, are very effective at dividing AE signals into discrete and continuous parts. These can be
quantified separately, improving fault diagnosis. Although adaptive filtering has also been applied for
segregating specific signals into noise-data components, poor replication and repeatability for generic
signals possess a great challenge. In addition, building AE amplifiers, filters, and power supplies with
sufficiently low noise levels is much more complicated than for other lower frequency sensing
applications (e.g. vibration), due in part to the wide dynamic range and bandwidth required.
Advances in Science and Technology to Meet Challenges
The latest state of the art in noise handling and data analysis is the development of knowledge-based
systems (KBS) [4]. KBS are interactive computer programs which attempt to simulate the existing
knowledge and experience-based thought processes and provide a wide range of advice. In this
direction, machine learning (ML) techniques with the ability to solve intricate and highly nonlinear
processes have attracted worldwide researchers to use them for AE processing optimization, industrial
monitoring and control. Different machine learning techniques such as Artificial Neural Networks
(ANN) and Convolution Neural Networks (CNN) [5] have been used extensively due to their capability
of learning from the past data and using them to predict the target variable more accurately. The basic
functionality of the example CNN in Fig 1. can be broken down into four key areas. The CNN is trained
from AE data collected during thermal spray coating deposition under different spray conditions. As
found in other forms of ANN, the input layer comprises of pixel values of a spectrogram image. The
convolutional layer determines the output of neurons that are connected to local areas of the input
through the calculation of the scalar product of weights and the input volume. The pooling layer then
performs down sampling along the spatial dimensionality of the given input. Finally, the fully
connected layers perform the same operations found in standard ANNs and attempt to produce class
scores. Through this method of transformation, CNNs are able to transform the original input layer by
layer using convolutional and down sampling techniques to produce classification scores [6,7]. The
accuracy of the model can be significantly improved when large datasets are used during training. The
background industrial noise, form part of the training processes and in this respect special and
computationally expensive denoising techniques are not necessary. The demand for development and
implementation of automated AE systems with computerized testing involving data acquisition,
processing, and evaluation is growing. The true power of machine learning techniques is harnessed by
the synergistic use of measurement data from a probe array composed of multiple sensors.

Measurement Science and Technology Roadmap on Signal Processing for Next Generation Measurement Systems
Concluding Remarks
Acoustic Emission based systems are flexible technologies that make quality management easier. AE
acquired live and historic measurement and process monitoring data enable issues that affect quality
to be quickly identified and resolved centrally-even across global operations and into the supplier
network. New capabilities powered by modern machine learning techniques, allow for combined real-
time data, physical dependency models and intelligence from different platforms. The ability to
simulate, measure, predict and improve assets plays a vital role in smart factories of the future [8].
Next generation AE signal processing technologies are expected to drive continuous product
improvement and profitability by identifying gaps in performance, diagnosing deficiencies, correcting
and reversing negative trends, reducing cost, improving yields, and maintaining equipment reliability.
Increased emphasis should be placed on the evolution of machine learning techniques and hardware
including smart, wireless, self-powered sensors that report back AE information through the next
generation 5G networks.
Acknowledgements
The authors would like to acknowledge the support from the UK Research & Innovation (UKRI). Project
Grant: 132885.
Figure 1. Application of AE in Surface Engineering High Velocity Thermal Spray Processes. Measuring the Coating Microhardness from AE
signal classification using Convolution Neural Networks.

Measurement Science and Technology Roadmap on Signal Processing for Next Generation Measurement Systems
References
[1] Sikorska J Z and Mba D 2008 Challenges and obstacles in the application of acoustic emission
to process machinery Proc. Inst. Mech. Eng. Part E J. Process Mech. Eng. 222, 1–19
[2] Jemielniak K 2001 Some aspects of acoustic emission signal pre-processing J. Mater. Process.
Technol. 109, 242–247
[3] Sikorska, J. Z 2006 The application of acoustic emission monitoring to the detection of flow
conditions in centrifugal pumps. PhD Thesis, University of WA
[4] Meola C and Raj B 2016 Nondestructive Testing and Evaluation: Overview Reference Module
in Materials Science and Materials Engineering. (Elsevier)
[5] Kamnis S, Malamousi K, Marrs A, Allcock B and Delibasis K 2019 Aeroacoustics and Artificial
Neural Network Modeling of Airborne Acoustic Emissions During High Kinetic Energy Thermal Spraying
J. Therm. Spray Technol. 28, 946–962
[6] Zeiler M D and Fergus R 2014 Visualizing and understanding convolutional networks Lecture
Notes in Computer Science (including subseries Lecture Notes in Artificial Intelligence and Lecture
Notes in Bioinformatics) Springer Verlag, 818–833.
[7] LeCun Y, Boser B, Denker J S, Henderson D, Howard R E, Hubbard W and Jackel L D 1989
Backpropagation Applied to Handwritten Zip Code Recognition Neural Comput. 1, 541–551
[8] Tzinava M, Delibasis K, Allcock B and Kamnis S 2020 A general-purpose spray coating
deposition software simulator Surf. Coatings Technol. 399 126148

Measurement Science and Technology Roadmap on Signal Processing for Next Generation Measurement Systems
5.5 - Signal and Image Processing for Condition Monitoring and Fault Diagnosis Dong Wang, The State Key Laboratory of Mechanical Systems and Vibration, Shanghai Jiao Tong University (email: [email protected])
Status
Signal and image processing for condition monitoring and fault diagnosis can extract representative
features to distinguish different health conditions of systems and critical components and it is always
an emerging and cutting-edge topic. Thanks to the rapid development of deep learning, given
sufficiently historical data, advanced fault features can be automatically extracted by using various
deep learning algorithms. Nevertheless, in industrial applications, abnormal and faulty data collected
from systems and critical components are seldom available. Most collected data are in a healthy
condition. On this condition, most deep learning algorithms for condition monitoring and fault
diagnosis may lose their powerful ability to extract advanced fault features. Further, even though deep
learning algorithms can extract advanced fault features, they are difficult to interpret and can not be
used as objective/loss functions of signal processing and machine learning algorithms for guiding
parameters tuning. As a result, in the field of condition monitoring and fault diagnosis, advances in
theoretical investigations on fault feature extraction become extremely important. The first benefit of
theoretical investigations on fault feature extraction is that one can know how fault features can be
used to quantify the characteristics of signals. The dimensionality of raw signals can be reduced into
a few advanced fault features. The second benefit of theoretical investigations on feature extraction
is to provide more objective/loss functions for signal processing and machine learning algorithms. It is
well-known that objective/loss functions are one essential component in various algorithms to
determine expected properties of output results. Once new objective/loss functions are generated
from advanced fault features, an amount of signal processing and machine learning algorithms will be
accordingly improved. The third benefit of theoretical investigations on feature extraction is to serve
as advanced health indices to assess degradation performance of systems and critical components. If
health indices are with desired monotonicity, trendability, robustness, etc., prognostic models for
predicting future feature trends and remaining useful life can be considerably simplified. The fourth
benefit of theoretical investigations on feature extraction is to build fault feature databases, which
are beneficial to engineers for their practical uses for condition monitoring and fault diagnosis.
Current and Future Challenges
The most possible reason why deep learning algorithms for fault feature extraction is popular is that
deep learning algorithms are easy to implement due to their data-driven black-box behaviors. Once
enough historical data are available, any regression/classification models can be fitted to find the
relationship between inputs and outputs. However, the interpretation of deep learning-based
features needs strong mathematical skills and wide knowledge. Theoretical investigations on fault
feature extraction are parallel to deep learning-based feature extraction. Some research issues and
challenges exist. Firstly, to design suitable features for the quantification of a signal, one must be clear
to the distribution characteristics of a signal and needs to design one or more features to characterize
the distribution of a signal. Secondly, for condition monitoring and fault diagnosis, the theoretical
baseline of features is crucial. This is because the theoretical baseline serves as a reference to know
how and when current health conditions deviate from a healthy condition. Thirdly, if multiple features
are designed, how to correlate these features and consider their joint condition monitoring and fault
diagnosis? Fourthly, varying operating conditions exist during condition monitoring and fault

Measurement Science and Technology Roadmap on Signal Processing for Next Generation Measurement Systems
diagnosis. How to design advanced features that are insensitive to varying operating conditions is
great of concern. Fifthly, deep learning algorithms have powerful ability to generate advanced
features for condition monitoring and fault diagnosis. How to design advanced features from deep
learning weights is greatly interesting and attractive, which provides the reverse thinking of feature
extraction from deep learning algorithms. Sixthly, a fault feature may only be involved with one
designed property to characterize the distribution of a signal. It is known that, in a machine run-to-
failure process, signals are varied with degradation time. How to design a composite feature that owns
multiple properties for condition monitoring and fault diagnosis is preferable. Seventhly, how to
design analytic and simplified expressions for advanced features is beneficial to providing more
objective/cost functions for signal processing and machine learning algorithms. Eighthly, how to
design fault feature databases to answer that what kinds of faults need what kinds of fault features is
greatly concerned in industrial applications.
Advances in Science and Technology to Meet Challenges
In recent years, advances in theoretical investigations on fault feature extraction to meet fault feature
challenges have been reported. Some typical advances are simply introduced as follows. Firstly, for
machine condition monitoring, pioneering work is spectral kurtosis (1). The main idea of spectral
kurtosis is to use kurtosis as a fault feature to quantify the impulsiveness of signals preprocessed by a
series of band-pass filters to monitor impulsive signals caused by localized machine faults. Moreover,
the spectral kurtosis of complex Gaussian noise was calculated as a baseline for machine condition
monitoring. Any significant deviation from the baseline can be used to detect machine abnormality.
Subsequently, Shannon entropy (2), Gini index (3), smoothness index (4), quasi-arithmetic means (5),
correlation dimension and approximate entropy (6), Box-Cox sparsity measures (7), etc. have been
theoretically investigated and they can categorised as sparsity measures and complexity measures for
machine condition monitoring. In figure 1, signal processing algorithms including wavelet transform,
squared envelope and Fourier transform, and sparsity measures are linearly decomposed as the
weighted sum of physical interpretable nodes and their connections form a neural network-like
structure (8). Moreover, the linear decomposition of sparsity measures (9) in Figure 2 are incorporated
into the neural network-like structure to physically interpret the use of hand-crafted features for fault
feature extraction and to make the whole neural network-like structure physically interpretable. Here,
the ReLU function is used because machine condition monitoring is only concerned about positive
outputs of the ReLU function to detect machine abnormality. Secondly, composite health indices with
desired mathematical properties (10-12) were proposed to fuse process and non-process data to
improve the prognostic ability of health indices. Thirdly, besides condition monitoring and fault
diagnosis, exponential fault features (13, 14) with random variables and Bayesian updating were
proposed to predict remaining useful life of an exponential degradation process. Fourthly, wavelet
transform was mathematically incorporated into in the first layer of convolutional neural networks
(15) to make convolutional neural networks partially interpretable for condition monitoring and fault
diagnosis. These works provide preliminary and inspiring results for further theoretical investigations
on more advanced fault features for condition monitoring, fault diagnosis and prognostics.

Measurement Science and Technology Roadmap on Signal Processing for Next Generation Measurement Systems
Concluding Remarks
Hand-crafted features and deep learning-based fault features are parallel features that can enrich the
knowledge domain of condition monitoring, fault diagnosis and prognostics. In recent years, fault
features are not fully and theoretically explored and subsequently many fault feature issues and
challenges will be addressed. Theoretical investigations on fault features are an emerging research
direction that is helpful for engineers and academia to fully understand how popular deep learning
algorithms extract advanced fault features and how to artificially and specifically design advanced
hand-crafted features to fully characterize the distribution of a signal. Once various advanced fault
Node 1
The jth input
signal jx
with a
length of d
M
Node d
Node 1
M
Node d
Input layer:
a raw signal
Hidden layer
1: wavelet
coefficients
Node 1
M
Node d
Hidden layer
2: square
envelope
Node 1
M
Node d
Hidden layer 3:
square envelope
spectrum
Signal preprocessing layers for exhibiting cyclo-stationarity of
repetitive transients
Kurtosis
Negative
entropy
Gini
index
Smoothn
ess index
Node 1
M
Node
m
Output weights
β need to be
determined
Hidden layer 4:
sparsity
measures
The fourth hidden layer for characterizing cyclo-stationarity of repetitive transients
Output layer:
system health
monitoring
Wavelet
parameters need
to be determined
Figure 1. Neural network-like structure [8] constructed from the linear decomposition of signal processing algorithms including wavelet
transform, squared envelope and Fourier transform, and sparsity measures for machine condition monitoring.
Node 1
M
Node d
Hidden layer 3:
square envelope
spectrum
Kurtosis
1 1NSES+
−
k
k a k b
Node 1
M
Node
m
Output
weights β
Hidden layer 4:
sparsity measures
The fourth hidden layer for characterizing cyclo-stationarity of repetitive transients
The output layer:
system health
monitoring
Negative entropy
2 2NSES+
−
k
k a k b
Gini index
3
e
3
order dNSESk
k a k b+
−
Smoothness index
4 4NSES+
−
k
k a k b
Figure 2. Sparsity measures [8] used in the fourth hidden layer of the neural network-like structure for physical interpretation of fault
feature extraction.
Measurement Science and Technology Roadmap on Signal Processing for Next Generation Measurement Systems
features are constructed in fault feature databases, condition monitoring, fault diagnosis and
prognostics would become mature and reliable.
Acknowledgements
The research work was fully supported by the National Natural Science Foundation of China under
Grant No. 51975355. The authors would like to thank five reviewers for their valuable and constructive
comments.
References
1. Antoni J. The spectral kurtosis: a useful tool for characterising non-stationary signals. Mech. Syst. Signal Pr. 2006;20(2):282-307. 2. Antoni J. The infogram: Entropic evidence of the signature of repetitive transients. Mech. Syst. Signal Pr. 2016;74:73-94. 3. Wang D. Some further thoughts about spectral kurtosis, spectral L2/L1 norm, spectral smoothness index and spectral Gini index for characterizing repetitive transients. Mech. Syst. Signal Pr. 2018;108:360-8. 4. Bozchalooi IS, Liang M. A smoothness index-guided approach to wavelet parameter selection in signal de-noising and fault detection. J. Sound Vib. 2007;308(1-2):246-67. 5. Hou B, Wang D, Xia T, Wang Y, Zhao Y, Tsui K-L. Investigations on quasi-arithmetic means for machine condition monitoring. Mech. Syst. Signal Pr. 2021;151:107451. 6. Wang D, Zhong J, Shen C, Pan E, Peng Z, Li C. Correlation dimension and approximate entropy for machine condition monitoring: Revisited. Mech. Syst. Signal Pr. 2021;152:107497. 7. Wang D, Zhong J, Li C, Peng Z. Box-Cox sparse measures: A new family of sparse measures constructed from kurtosis and negative entropy. Mech. Syst. Signal Pr. 2021;160:107930. 8. Wang D, Chen Y, Shen C, Zhong J, Peng Z, Li C. Fully Interpretable Neural Networks for Machine Health Monitoring. Mech. Syst. Signal Pr. 2022. 9. Wang D, Peng Z, Xi L. The sum of weighted normalized square envelope: A unified framework for kurtosis, negative entropy, Gini index and smoothness index for machine health monitoring. Mech. Syst. Signal Pr. 2020;140:106725. 10. Liu K, Gebraeel NZ, Shi J. A data-level fusion model for developing composite health indices for degradation modeling and prognostic analysis. IEEE Trans. Autom. Sci. Eng. . 2013;10(3):652-64. 11. Yan T, Wang D, Xia T, Xi L. A generic framework for degradation modeling based on fusion of spectrum amplitudes. IEEE Trans. Autom. Sci. Eng. . 2020. 12. Yan T, Wang D, Hou B, Peng Z. Generic Framework for Integration of First Prediction Time Detection With Machine Degradation Modelling from Frequency Domain. IEEE Trans. Reliab. . 2021. 13. Gebraeel NZ, Lawley MA, Li R, Ryan JK. Residual-life distributions from component degradation signals: A Bayesian approach. IIE Trans. . 2005;37(6):543-57. 14. Wang D, Tsui K-L. Brownian motion with adaptive drift for remaining useful life prediction: Revisited. Mech. Syst. Signal Pr. 2018;99:691-701. 15. Li T, Zhao Z, Sun C, Cheng L, Chen X, Yan R, Gao RX. WaveletKernelNet: An interpretable deep neural network for industrial intelligent diagnosis. IEEE Transactions on Systems, Man, and Cybernetics: Systems. 2021.

Measurement Science and Technology Roadmap on Signal Processing for Next Generation Measurement Systems
1
Data-Driven Signal Processing for Additive Manufacturing Jianjing Zhang and Robert X. Gao*, Case Western Reserve University, Cleveland, OH 44106-7222, USA
1. Status
Over the past decades, additive manufacturing (AM) has increasingly reshaped the manufacturing
industry, demonstrating benefits such as higher geometric flexibility and material efficiency as
compared to the traditional subtractive processes as represented by metal cutting. While details of
the specific AM processes may vary, the general principle of AM is to create tracks of material by fusing
powders within a laser-generated melt pool and layering these tracks side-by-side and on top of one
another to create 3D components [1]. The sequential relationship of process-structure-property (PSP)
is the central paradigm for scientific understanding of AM [2], where the process thermal history
involves cycles of repeated melting and solidification of metal powders to produce hierarchical
microstructures.
Due to the multi-physics nature of AM processes, significant amount of sensor data can be acquired,
making signal processing an indispensable means for data analysis toward the discovery of salient
patterns that underlie the PSP relationship. While methods of signal processing have historically been
based on analytical models, the increasing availability of data due to ubiquitous sensing has enabled
data-driven signal processing as an complementary technique of growing importance [3]. As
illustrated in Table 1, model-based approaches use analytical representation to perform signal
analysis. For example, the characteristic frequency of the temperature signal measured during AM
process provides the basis for time-frequency analysis of the thermal history and the inference of
properties of the printed part. In comparison, data-driven approaches directly learn salient patterns
that are characteristic of the AM process from the measured data, and associates them with part
properties by means of numerical modeling.
Approach Method Representation
Model-Based Wavelet Transform cwt(𝑠, 𝜏) =1
√𝑠∫ 𝑥(𝑡)𝜓∗ (
𝑡−𝜏
𝑠) 𝑑𝑡
Kalman Filter 𝑝(𝒙𝑘|𝒛𝑘−1)~𝑁(𝒙′𝑘 + 𝐾(𝒛𝑘 − 𝐺𝑘𝒙′𝑘), 𝑃′𝑘 − 𝐾𝐺𝑘𝑃′𝑘) Data-Driven Support Vector Machine argmin𝒘,𝒃
‖𝒘‖2
2, s.t. 𝑦𝑖(𝒘𝑇𝒙𝑖 + 𝑏) ≥ 1
Deep Neural Networks argmin𝒘 − ∑ 𝒚𝑖log (𝜎(𝑓𝒘(𝒙𝑖)))
Besides the availability of data, increasing attention to data-driven signal processing techniques can
be attributed to several additional factors: 1) the increasing complexity in AM processes, for which
high-fidelity analytical models are not available, 2) new measurement techniques that enable multi-
modal data collection, and 3) advancement in computational infrastructure for efficient processing of
big data [4].
2. Current and Future Challenges
While data-driven signal processing techniques have shown to be effective in deepening the
understanding of AM, several challenges have been identified:
Sensing resolution. AM process is characterized by rapid interaction between the heat source and
metal powders. While sensing systems such as IR camera and pyrometer have enabled the in-situ
capture of the thermal history associated with the printed part at the macro-scale, knowledge gaps at
the meso-scale (e.g., powder scale) remain, such as the mechanism underlying the formation of
microstructure (e.g., pore, crack, and keyhole), caused by the limited spatial and temporal resolutions
Table 1. Representative methods for model-based and data-driven signal processing

Measurement Science and Technology Roadmap on Signal Processing for Next Generation Measurement Systems
2
of the existing sensors. Revealing these meso-scale phenomena will provide insight into the influence
of the fundamental interactions driving the AM dynamics. Therefore, research of high-resolution
sensing system will play a crucial role in advancing the state-of-knowledge in AM [5].
Image processing. Due to the spatial and temporal characterizations required for PSP modelling,
imaging has become the most prominent sensing modality for AM. However, finding salient patterns
embedded in the images that are indicative of process conditions and defects such as porosity,
cracking, balling, delamination, and distortion has remained challenging, since each type of the defects
exhibits complex geometrical characteristics, surface textures, and varying scales that are difficult to
characterize using traditional model-based or even data-driven techniques. Research of advanced
image processing techniques is needed to take full advantage of the rich information embedded in the
sensing images, which can serve as the technical foundation for establishing the PSP model [6].
Model interpretation. The prediction logic of many data-driven methods, especially that of deep
learning models, is generally not transparent to the users. For example, it is unclear which image pixels
are used by the network as evidence to recognize process defects and whether findings from the
network are consistent with physical knowledge of heat transfer and material formation. These
limitations create significant barriers for establishing data-driven signal processing as a trustworthy
complement to physics-based reasoning by human experts. Future research on interpretable
prediction logic will contribute to establishing user trust in the performance of data-driven and
translating the findings into knowledge creation [7].
3. Advances in Science and Technology to Meet Challenges
In recent years, new advances in science and technology have provided promising means to tackle
the challenges in data-driven signal processing in AM.
To provide sufficient spatial and temporal resolutions and capture the fundamental interactions
occurred in AM processes, high-speed synchrotron X-ray imaging has been developed to complement
the traditional infrared and visible light sensing (Fig. 1). X-ray imaging enables tracking of the AM
dynamics with significantly improved spatial (µm scale instead of mm scale) and temporal (107 Hz as
compared to 105 Hz) resolutions [5].
Figure 1. Imaging in infrared, visible light and X-ray range for AM process monitoring [5]
Recent advancement in data-driven techniques such as Convolutional Neural Networks (CNN),
which are inspired by the mechanism of human vision system for image processing [6], has shown to
be effective in analysing and extracting salient features from the complex image compositions to
support PSP modelling. In [8], a CNN-based method for recognizing surface defects induced by process
condition deviations has been developed, where a bi-stream CNN structure has been designed to
analyse visible light images of both AM part slices and powder layers (Fig. 2) and fuse the extracted
defect patterns from both to enable comprehensive evaluation of the AM condition. Experimental
evaluation has shown high condition recognition accuracy of 99.4%.

Measurement Science and Technology Roadmap on Signal Processing for Next Generation Measurement Systems
3
Figure 2. Bi-stream CNN structure for process condition monitoring [8]
Research efforts towards improving model interpretability have also been reported, which fall under
two categories. The first quantifies the relevance of individual image pixels in network decision-
making as part of a post-analysis. A representative technique is the Layer-wise Relevance Propagation
(LRP) [9], which redistributes network’s prediction backwards until a score is assigned to each image
pixel. Positive score values indicate that the corresponding pixels are used as evidence by the network
to determine process conditions. In comparison, techniques in the second category embeds
knowledge of process physics directly into the model design to improve its interpretability and
consistency with physics. For example, WaveletKernelNet has been developed [10], in which a
continuous wavelet convolutional layer is designed to enable the discovery of physically interpretable
kernels for feature extraction.
4. Concluding Remarks
With the increasing availability of measurement data, data-driven signal processing has developed
into a promising alternative to complement traditional signal processing techniques, with the
advantage of directly learning salient patterns that underlie the data to understand the physical
phenomenon of interest. Using AM as an application scenario, this section summarizes the state of
data-driven signal processing for manufacturing process monitoring. In addition, major challenges to
improving sensing resolution, image processing and model interpretability are summarized, and early
research efforts in tackling these challenges are highlighted.
Acknowledgements
Please include any acknowledgements and funding information as appropriate.
References (separate from the two-page limit)
Limit of 10 References. Please provide the full author list, and article title, for each reference to
maintain style consistency in the combined roadmap article. Style should be consistent with all other
contributions
[1] Frazier W 2014 Metal additive manufacturing: a review J. Mater. Eng. Perform. 23(6) 1917-1928.
[2] Olson G B 1997 Computational design of hierarchically structured materials Science 277 1237–42.
[3] Lin X, Zhu K, Fuh J Y H and Duan X 2021 Metal-based additive manufacturing condition monitoring
methods: From measurement to control ISA Trans. (Early access, doi:
10.1016/j.isatra.2021.03.001)
[4] Gao R, Wang L, Helu M and Teti R 2020 Big data analytics for smart factories of the future CIRP
Ann. 69 668–92.
Measurement Science and Technology Roadmap on Signal Processing for Next Generation Measurement Systems
4
[5] Parab N D, Zhao C, Cunningham R, Escano L I, Fezzaa K, Everhart W, Rollett A D, Chen L and Sun T 2018 Ultrafast X-ray imaging of laser–metal additive manufacturing processes J. Synchrotron Radiat. 25 1467–77.
[6] Lecun Y, Bengio Y and Hinton G 2015 Deep learning Nature 521 436–44. [7] Wang J, Li Y, Zhao R and Gao R 2020 Physics guided neural network for machining tool wear
prediction J. Manuf. Syst. 57 298–310. [8] Caggiano A, Zhang J, Alfieri V, Caiazzo F, Gao R and Teti R 2019 Machine learning-based image
processing for on-line defect recognition in additive manufacturing CIRP Ann. 68 451–4. [9] Grezmak J, Zhang J, Wang P, Loparo K A and Gao R 2020 Interpretable Convolutional Neural
Network through Layer-wise Relevance Propagation for Machine Fault Diagnosis IEEE Sens. J. 20 3172–81.
[10] Li T, Zhao Z, Sun C, Cheng L, Chen X, Yan R and Gao R 2021 WaveletKernelNet: An Interpretable Deep Neural Network for Industrial Intelligent Diagnosis IEEE Trans. Syst. Man, Cybern. Syst. (Early access, doi: 10.1109/TSMC.2020.3048950).