role of gps synchronized measurements in power system ... · role of gps synchronized measurements...
TRANSCRIPT

1Tele-Seminar, April 30, 2004PSERC
April 30, 2004PSERC Tele-Seminar
April 30, 2004PSERC Tele-Seminar
Role of GPS Synchronized Measurements in Power System Visibility
Role of GPS Synchronized Measurements in Power System Visibility
Sakis MeliopoulosGeorgia Tech
Sakis MeliopoulosGeorgia Tech

2Tele-Seminar, April 30, 2004PSERC
Outline
• Power System Visibility (Real Time Model)
• GPS Synchronized Measurement Technology
• Data Validation – Issues
• NYPA’s HMS
• Hybrid State Estimator
• Numerical Experiments
3Tele-Seminar, April 30, 2004PSERC
Recommendation 22Evaluate and adopt better real-time tools for operators and reliability coordinators.
Bits & PiecesFrom
US-Canada Power System Outage Task Force
Contributing FactorsInadequate Situational Awareness

4Tele-Seminar, April 30, 2004PSERC
Observations
Basic Task in System Operation:Obtain a Reliable and Accurate Real Time Model
Past and Present Practice:SCADA + State Estimator Real Time Model
Today’s Reality:SCADA, IEDs, DFRs, PMUs, Relays Collect an EnormousAmount of Data. Is There a Better Way to Validate andUtilize this Data?

5Tele-Seminar, April 30, 2004PSERC
Basic Capabilities
• GPS “Commercial” Accuracy (Time):0.5 MicrosecondsPhase Error 0.01 Degrees at 60 Hz
• GPS “Commercial” Accuracy (Location):7 meters
• New Enhancement:WAAS (Wide Area Augmentation System)Performance Much Better
• Other Enhancements in the Works…

6Tele-Seminar, April 30, 2004PSERC
GPS-Synchronized Measurements
• Technology Became Available to Power Systems About 15 years ago
• Specialized Equipment
• Addition of GPS Synchronization in IDEs and Relays
• Cost is Rapidly Reducing (Basic Receiver is $30)
• Technology is Under-Utilized

7Tele-Seminar, April 30, 2004PSERC
IED Cordova
IED West Point
IED VolunteerIED Johnsonville Fossil Plant
IED Kanawha River
IED Callaway, Ameren
IED Rockport, AEP
IED Rush Island, Ameren
ECARMAIN
IED Jacksons Ferry, 765 kV
IED Orange, AEP
Planned GPS-Synchronized Measurements for the TVA System
8Tele-Seminar, April 30, 2004PSERC
2 2
1
2
239
62
4
1
9067
5
43
24
10
82
24515
840
19
4
2
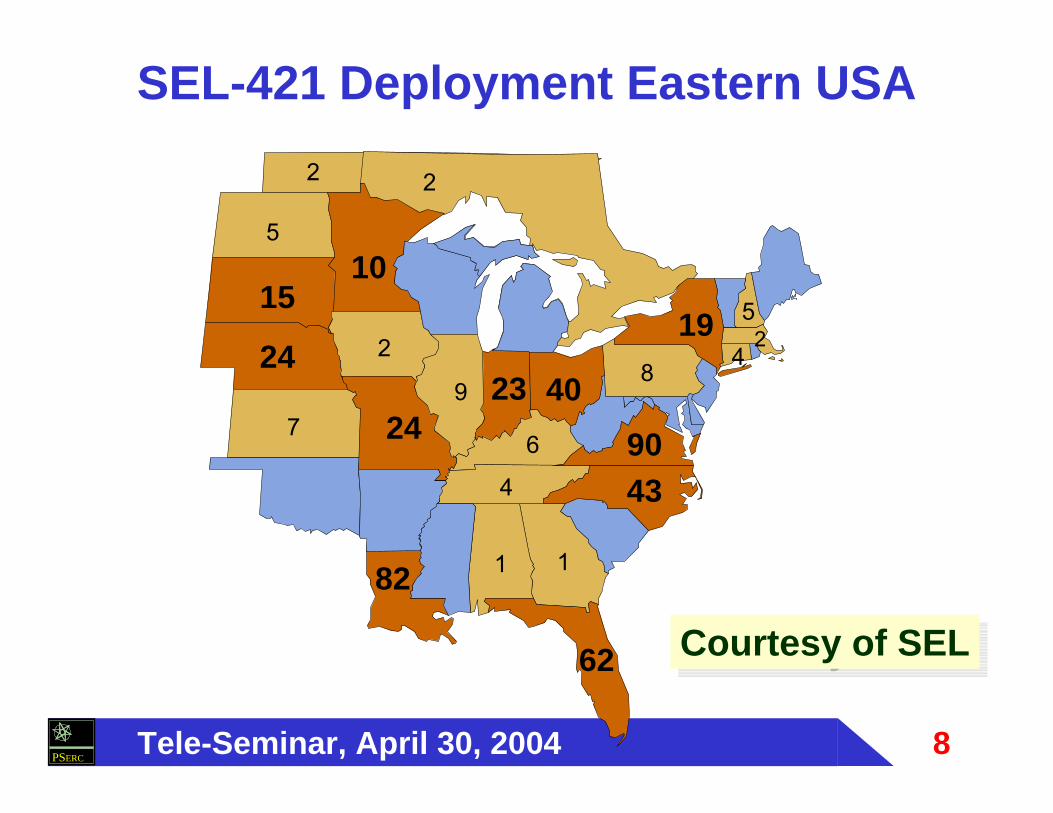
Courtesy of SELCourtesy of SEL
SEL-421 Deployment Eastern USA

9Tele-Seminar, April 30, 2004PSERC
By Virtue of its Timing Accuracy the Technology Can Be Used to Directly Measure the State of the Power System
GPS-Synchronized Measurements
10Tele-Seminar, April 30, 2004PSERC
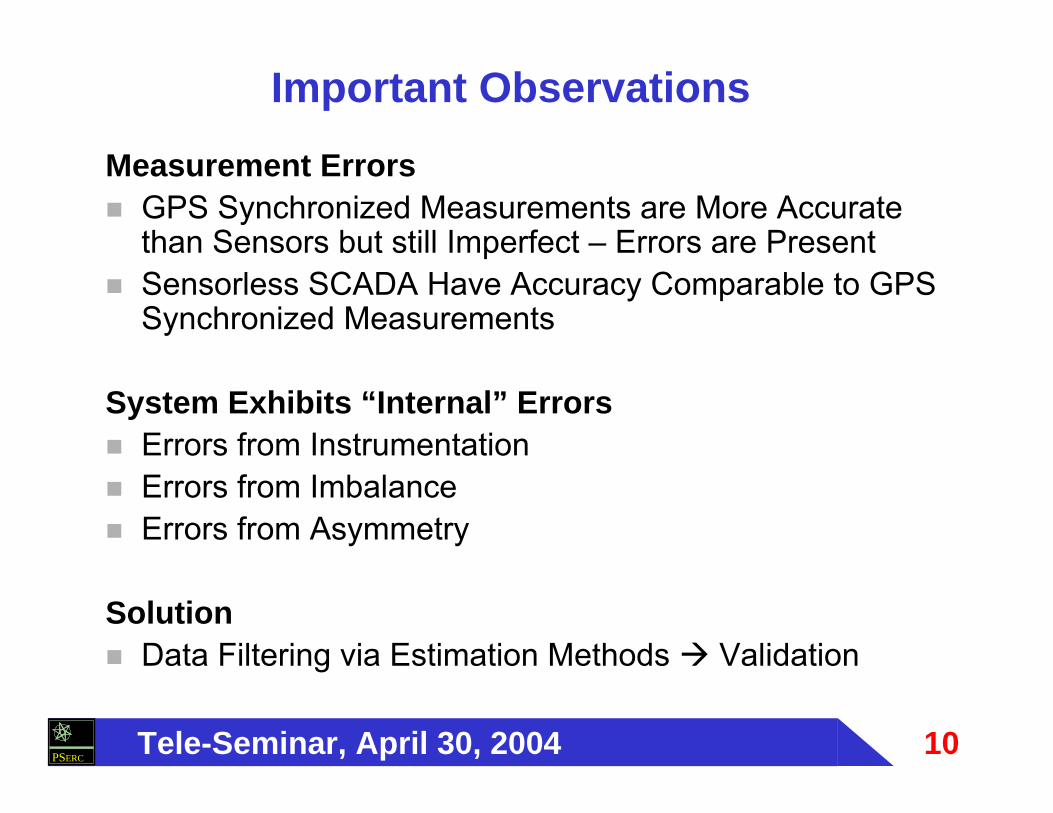
Measurement ErrorsGPS Synchronized Measurements are More Accurate than Sensors but still Imperfect – Errors are PresentSensorless SCADA Have Accuracy Comparable to GPS Synchronized Measurements
System Exhibits “Internal” ErrorsErrors from InstrumentationErrors from ImbalanceErrors from Asymmetry
SolutionData Filtering via Estimation Methods Validation
Important Observations
11Tele-Seminar, April 30, 2004PSERC
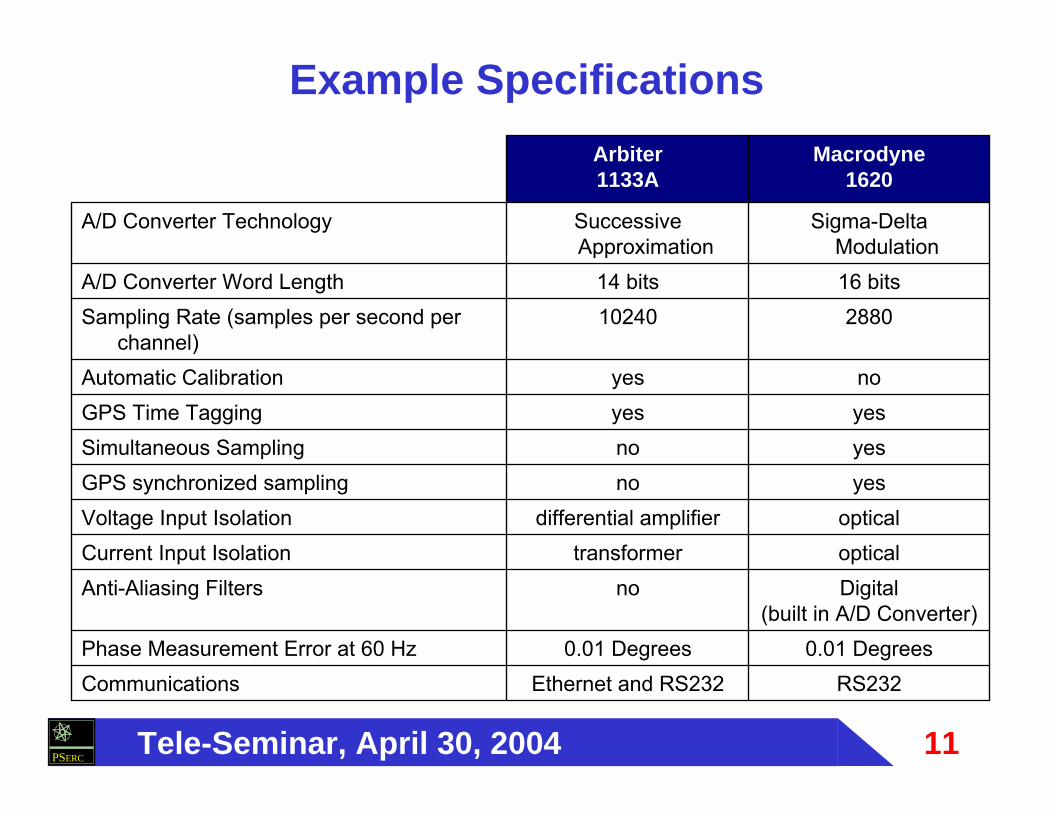
RS232Ethernet and RS232Communications0.01 Degrees0.01 DegreesPhase Measurement Error at 60 Hz
Digital(built in A/D Converter)
noAnti-Aliasing FiltersopticaltransformerCurrent Input Isolationopticaldifferential amplifierVoltage Input Isolation
yesnoGPS synchronized samplingyesnoSimultaneous SamplingyesyesGPS Time TaggingnoyesAutomatic Calibration
288010240Sampling Rate (samples per second per channel)
16 bits14 bitsA/D Converter Word Length
Sigma-Delta Modulation
Successive Approximation
A/D Converter Technology
Macrodyne1620
Arbiter1133A
Example Specifications

12Tele-Seminar, April 30, 2004PSERC
Example Characteristics of a PMU

13Tele-Seminar, April 30, 2004PSERC
Errors from Imbalance and Asymmetry

14Tele-Seminar, April 30, 2004PSERC
180 660 1140 1620 2100
0.06
0.04
0.02
0.0
Series Admittance
Shunt Admittance
Frequency (Hz)
Asym
met
ry F
acto
rValidity of Power System Symmetry Assumption
1
minmax1 2
1z
zzS
−=
1
minmax2 2
1y
yyS
−=
The Phase Impedances May
Vary by 5% Among Phases
15Tele-Seminar, April 30, 2004PSERC
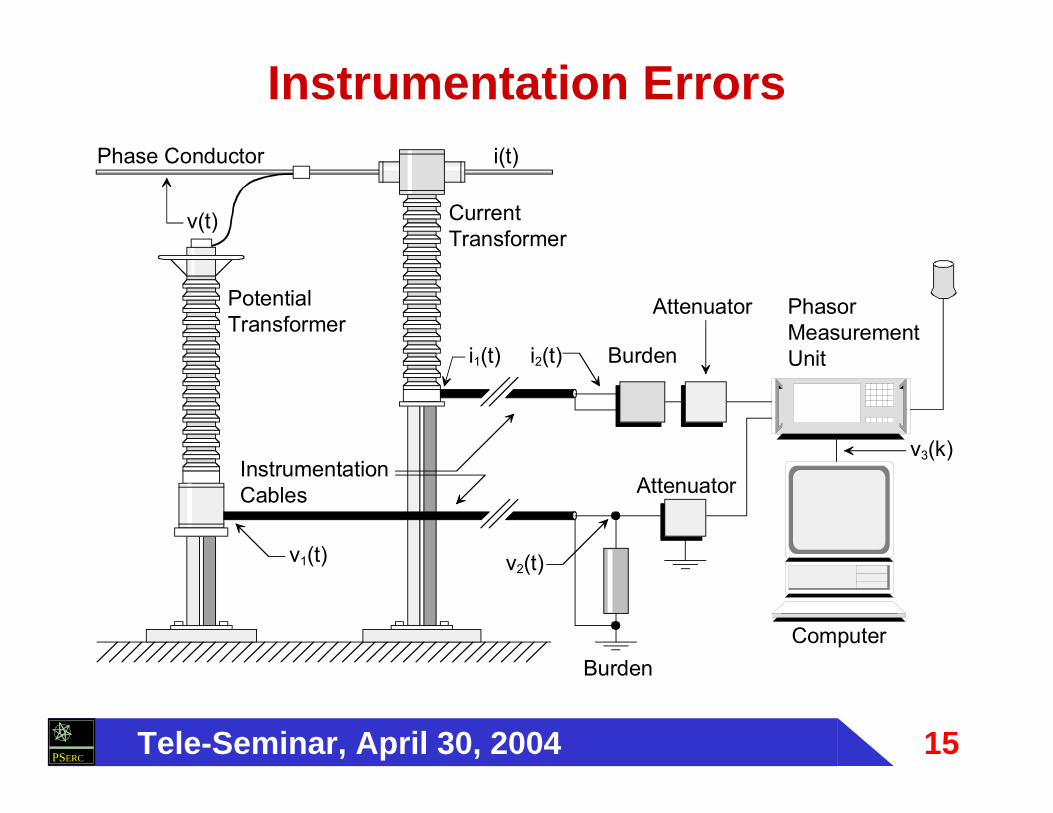
Phase Conductor
PotentialTransformer
CurrentTransformer
PhasorMeasurementUnit
ComputerBurden
InstrumentationCables
v(t)
v1(t) v2(t)
v3(k)
Burdeni2(t)i1(t)
i(t)
Attenuator
Attenuator
Instrumentation Errors
16Tele-Seminar, April 30, 2004PSERC
G
1 2
1 2V
V
V
V
A
A/D
V
PT, 66.4kV:115VControl Cable, RG-8
A/D Converter
IC AnimatorVoltage Meter Voltage Meter
SOURCE BUS115 BUS115A
LOAD
PTOUT VCHINPUT VADOUT
BUS115B
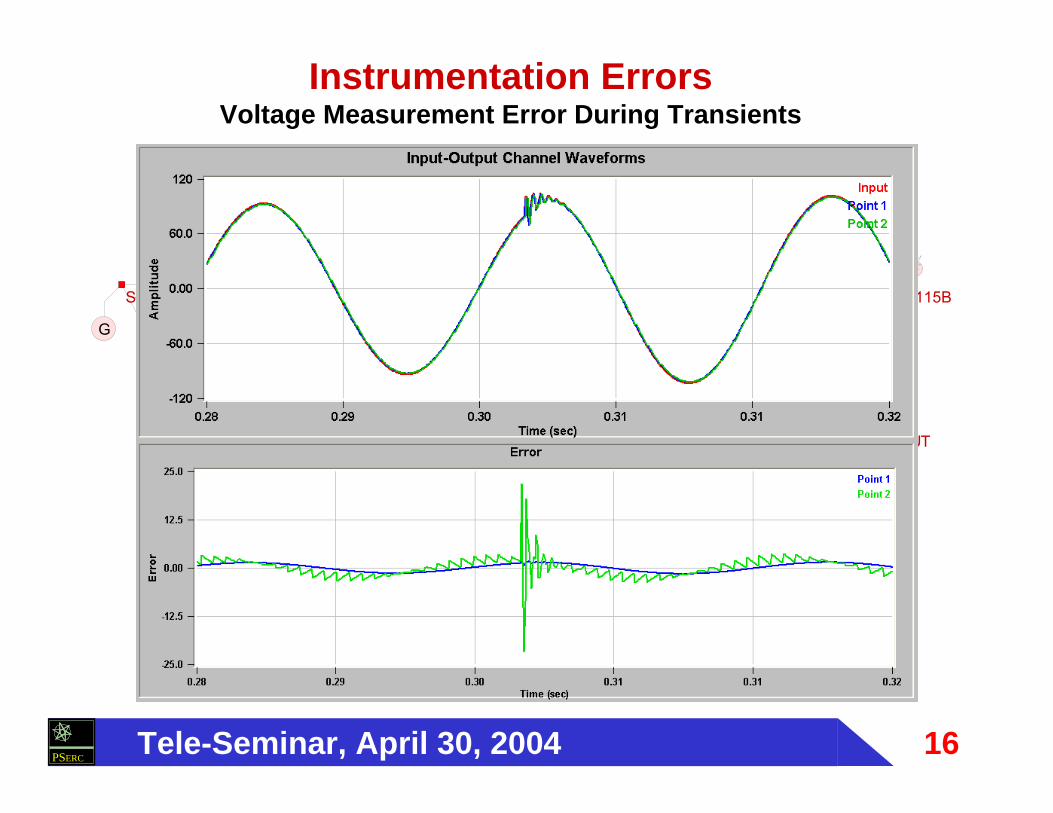
Instrumentation ErrorsVoltage Measurement Error During Transients

17Tele-Seminar, April 30, 2004PSERC
0.140300 m0.110225 m0.070150 m0.04075 m
Phase ( Vout / Vin )Cable Length (l)
Vinput
VoutputWoundType PT Burden
l
Instrumentation ErrorsInstrumentation Cable Phase Error
PMU PhaseAccuracy is0.01 degrees
PMU PhaseAccuracy is0.01 degrees
18Tele-Seminar, April 30, 2004PSERC
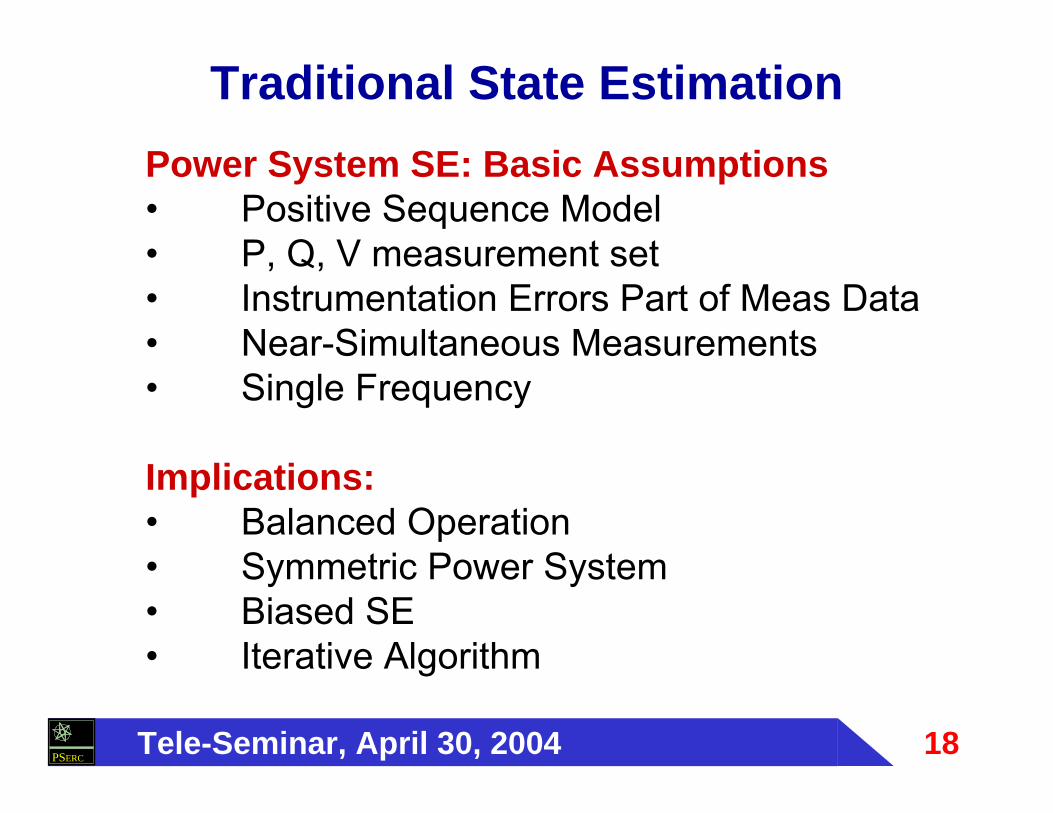
Power System SE: Basic Assumptions• Positive Sequence Model• P, Q, V measurement set• Instrumentation Errors Part of Meas Data• Near-Simultaneous Measurements• Single Frequency
Implications:• Balanced Operation• Symmetric Power System• Biased SE• Iterative Algorithm
Traditional State Estimation

19Tele-Seminar, April 30, 2004PSERC
NYPA’s Harmonic Measurement System Using GPS Synchronized Measurements (Macrodyne’s PMUs)
I
Global TimeReference
(GPS)
GPSReceiver
MicroprocessorA/D
Phasor data(time stamped)SerialCommunicationPort
Filte
r
To Control Center
Harmonics DataConcentrator
(Located in Atlanta)
PMU Block Diagram
V
GPS Antena
ADD BulletinBoard System
GIC DataConcentrator
Located at NYPP
PMUComputer
PMUComputer
PMUComputerHMS Host System
Massena
Marcy
Niagara
Fraser
Robinson PTS
PTS
Albany
Coopers Corner
1 2
PTS
PTS
PTS
PTS
PTS
MASENA765
MARCY765
NIAGARA ROBINSON
EDIC
MARCY345
NSCOTLAND
VOLNEY
FRASER
COOPERSC
CLAY MARCY-T1MARCY-T2
OAKDALE
GILBOA
FRASER115
ROB115ROB-T1
STOLLE
HINMAN
LOCUST
HARISON
NIAG230
NIAG-T1
NIAG-T2
NR-2 PA-301PA-302
MASNA230BMASNA-T1
MASNA230AMASNA-T2
MOSES230
MMS2
CHTAUG765
LAFAYETTE
HMS Host SystemMassena
Marcy
Niagara
Fraser
Robinson PTS
PTS
Albany
Coopers Corner
1 2
PTS
PTS
PTS
PTS
PTS
MASENA765
MARCY765
NIAGARA ROBINSON
EDIC
MARCY345
NSCOTLAND
VOLNEY
FRASER
COOPERSC
CLAY MARCY-T1MARCY-T2
OAKDALE
GILBOA
FRASER115
ROB115ROB-T1
STOLLE
HINMAN
LOCUST
HARISON
NIAG230
NIAG-T1
NIAG-T2
NR-2 PA-301PA-302
MASNA230BMASNA-T1
MASNA230AMASNA-T2
MOSES230
MMS2
CHTAUG765
LAFAYETTE
Asymmetric Power System
ModelNew York Power
Authority

20Tele-Seminar, April 30, 2004PSERC
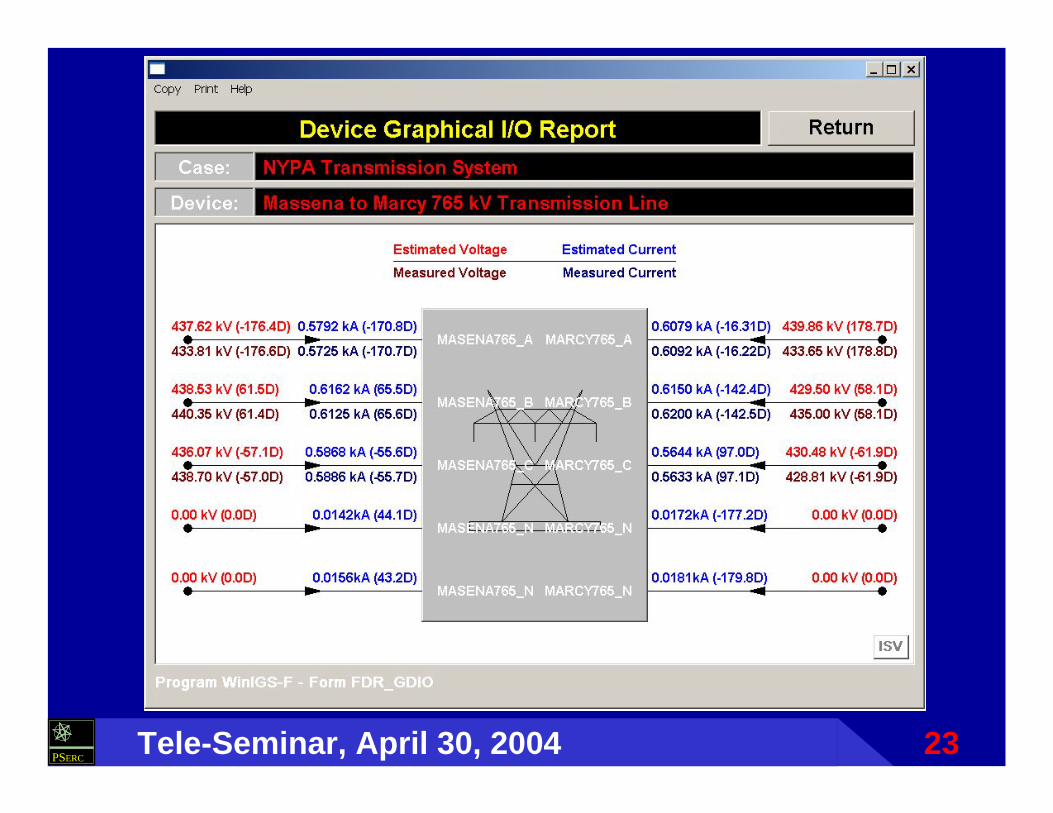
Synchronized Measurement Based SEWhat is the Advantage
va(t)ia(t)
vA(t)iA(t)
vb(t)ib(t)
vB(t)iB(t)
vc(t)ic(t)
vC(t)iC(t)
Voltage Waveform Measurement
Current Waveform Measurement
Bus 1 Bus 2
a
b
c
A
B
C
Phasor Measurements of Voltages and Currents
21Tele-Seminar, April 30, 2004PSERC
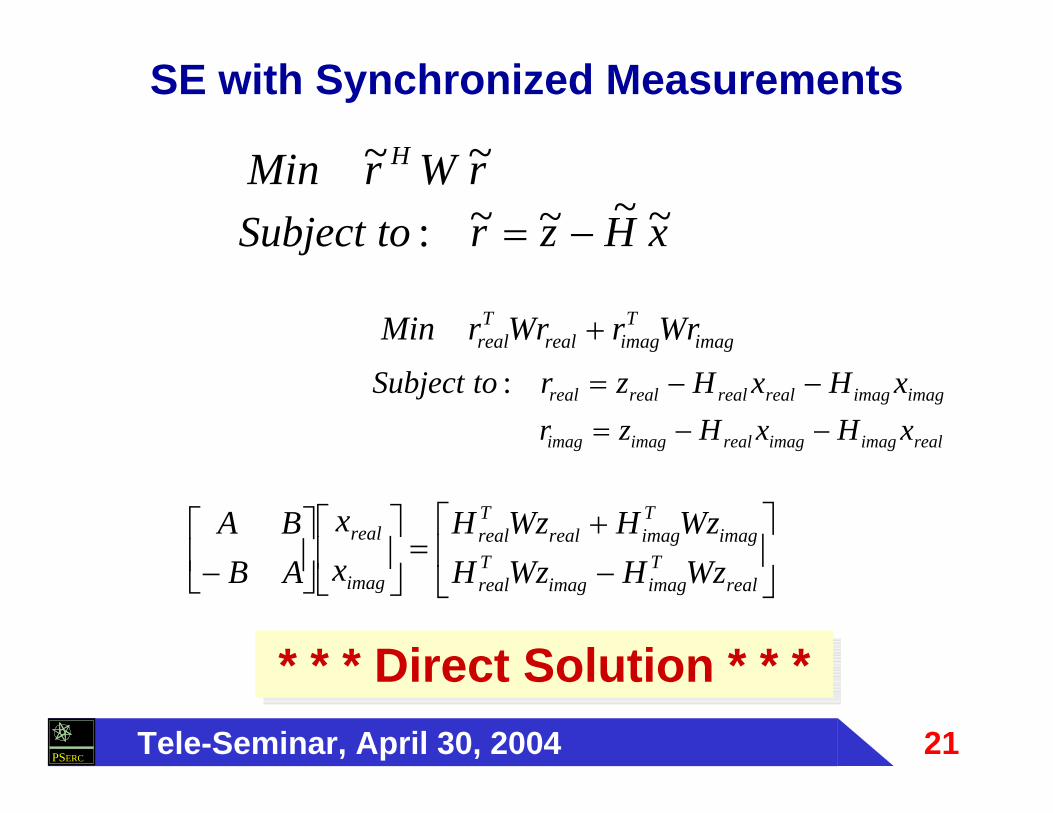
SE with Synchronized Measurements
* * * Direct Solution * * * * * * Direct Solution * * *
⎥⎦
⎤⎢⎣
⎡
−+
=⎥⎦
⎤⎢⎣
⎡⎥⎦
⎤⎢⎣
⎡− real
Timagimag
Treal
imagTimagreal
Treal
imag
real
WzHWzHWzHWzH
xx
ABBA
rWrMin H ~~
xHzrtoSubject ~~~~: −=
imagT
imagrealTreal WrrWrrMin +
imagimagrealrealrealreal xHxHzrtoSubject −−=:
realimagimagrealimagimag xHxHzr −−=

22Tele-Seminar, April 30, 2004PSERC
In Case that All Data are GPS Synchronized Measurements the
State Estimator is DIRECT
Big Advantage
Observation
23Tele-Seminar, April 30, 2004PSERC

24Tele-Seminar, April 30, 2004PSERC
Detection of SE Bias
Case Description Confidence Level(Chi-Square Test)
Three Phase Asymmetric Model,Three Phase Measurements
100.00
Three Phase Symmetric Model,Three Phase Measurements
13.02
Three Phase Asymmetric Model,Single Phase (A) Measurements
0.0
Numerical Experiments on the MSU-1 Line (765 kV)
25Tele-Seminar, April 30, 2004PSERC
G G G G G G G G G G
G G G G G G G G
G G G G G G
G G G G
G G
SOURCE BUS001 BUS002 BUS003 BUS004 BUS005 BUS006 BUS007 BUS008 BUS009 BUS010
ASOURCE ABUS001 ABUS002 ABUS003 ABUS004 ABUS005 ABUS006 ABUS007 ABUS008
BSOURCE BBUS001 BBUS002 BBUS003 BBUS004 BBUS005 BBUS006
CSOURCE CBUS001 CBUS002 CBUS003 CBUS004
DSOURCE DBUS001 DBUS002
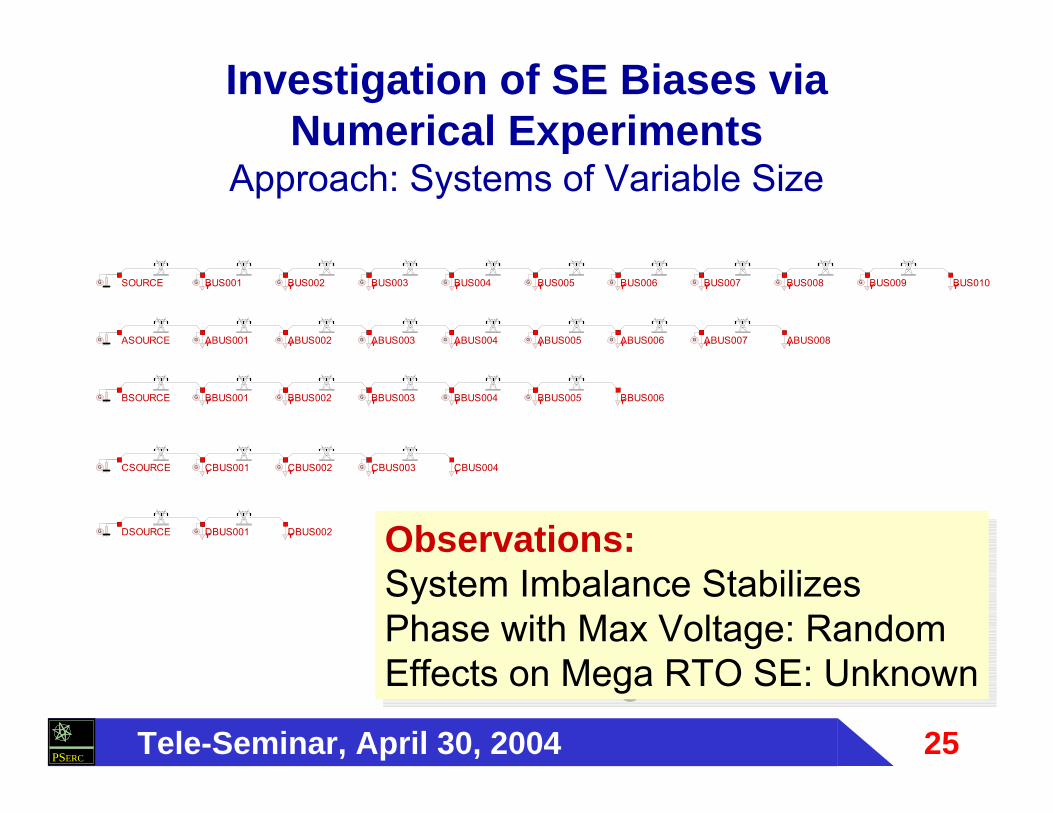
Investigation of SE Biases viaNumerical Experiments
Approach: Systems of Variable Size
Observations: System Imbalance StabilizesPhase with Max Voltage: RandomEffects on Mega RTO SE: Unknown
Observations: System Imbalance StabilizesPhase with Max Voltage: RandomEffects on Mega RTO SE: Unknown

26Tele-Seminar, April 30, 2004PSERC
Confidence Level vs size for single phase mesurements
0.0001
0.001
0.01
0.1
10 5 10 15 20
System Size
Con
fiden
ce L
evel
σ=0.02 σ=0.01 σ=0.009 σ=0.008 σ=0.007
Confidence Level of Data Accuracy

27Tele-Seminar, April 30, 2004PSERC
GPS Synchronized Measurements are Imperfect – Errors are PresentOther Useful Data Exist (SCADA, Relays, DFRs, etc.).
Proposed Approach: HYBRID STATE ESTIMATOR. It Utilizes all Available Data
Errors from ImbalanceErrors from Asymmetry
Proposed Approach: THREE PHASE MODEL. It Eliminates Model Biases
Proposed Approach

28Tele-Seminar, April 30, 2004PSERC
A B C
Bus m
A B C
Bus kA B C
A B CVk~
Vm
~
~Id1,k,A
Pd1,k,A
Qd1,k,A
~Id1,m,APd1,m,AQd1,m,A
device d1
device d2
~Id2,k,A
Pd2,k,A
Qd2,k,A
QPF-SE Approach: Available Data
Phasor Measurements Non-Synchronized Measurements
Description Type Code Description Type
Code
Voltage Phasor, V~ 1 Voltage Magnitude, V 4
Current Phasor, I~ 2 Real Power Flow, fP 5
Current Injection Phasor, injI~ 3 Reactive Power Flow, fQ 6
Real Power Injection, injP 7
Reactive Power Injection, injQ 8
29Tele-Seminar, April 30, 2004PSERC
Kentucky
Tennessee
SUB
SUB
SUB
G G
SUB
G G
SUB
SUB
SUB
G G
SUB
G G
SUB
G G
SUB
G G
SUB
G G
G G
G G
SUB
SUB
SUB
G G
SUB
SUB
SUB
SUB
SUB
SUB
G G
SUB SUB
G G
G G
G G
G G
G G
G G
SUB
G G
SUB
SUB
Section 2Section 1 Section 3 Sect
Section 5 Section 7Section 6
BROWNSFERMADISON
WIDOWSCRK
LIMESTONE
WESTPOINT
BFTRIN2BFTRIN1
MAURY
UNION
BRFTRIC1BRFTRIC2
EASTPOINT
MILLER
TRICOTRINITY
RACOONMT
SEQUOYAH
JOHNSONVLDAVIDSON
CUMBERLND
JACKSON
GLEASON
FRANKLIN
MARSHALL
MONTGOMRY
WILSON
ROANE
PARADISE
WATTS-BAR
VOLUNTEERBULL-RUN
PHIPSBENDSULLIVAN
WVERNONLOWNDES
PLEASANTH
CORDOVA
BENTON
FREEPORTBIRMSTEEL
SHELBY
LAGOONCRK
ARKANSAS HAYWOOD
WEAKLEY
SHAWNEE
PINHOOK
NAGEL
SHAVENCONASAUGA
CALEDONIA
LOANOAK
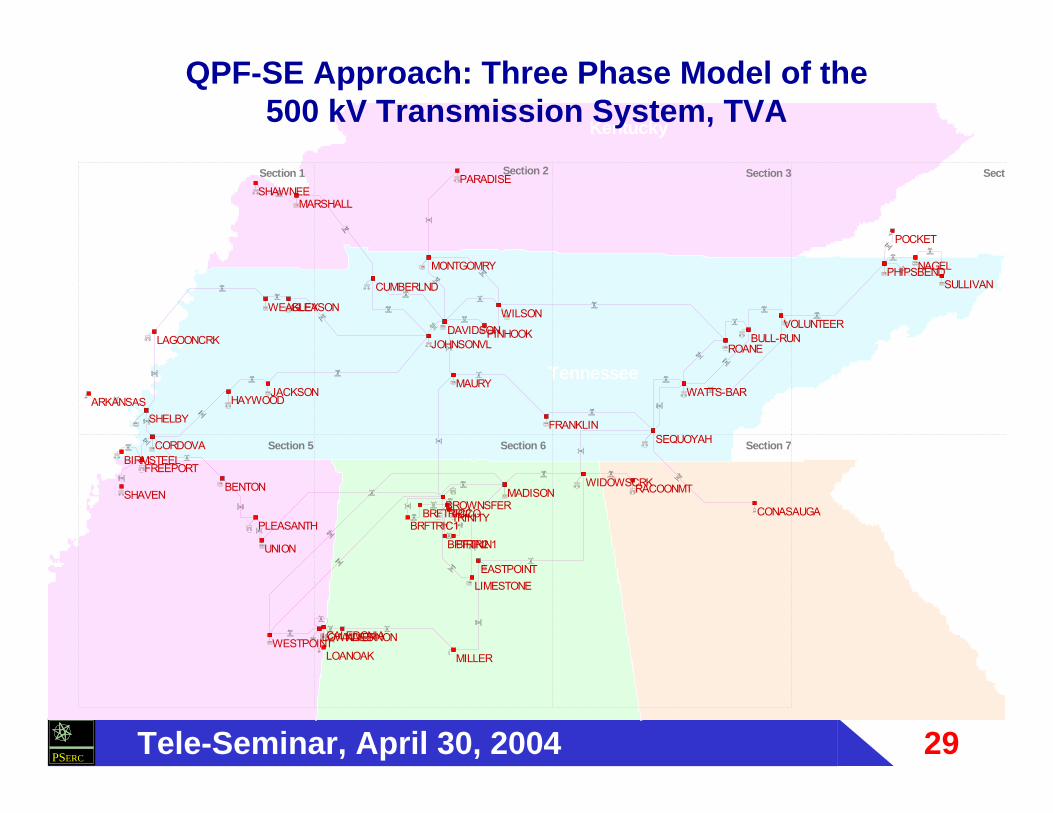
QPF-SE Approach: Three Phase Model of the 500 kV Transmission System, TVA

30Tele-Seminar, April 30, 2004PSERC
3-Phase Overhead Transmission Line Accept Cancel Franklin to Sequoyah 500 kV Line
Phase Conductors ACSRSize RAIL
Shields/Neutrals HS5/16HS
Tower/Pole TVA-SA-23R1Circuit Number 1
Tower/Pole Ground Impedance (Ohms)25.0 0.0R =
Bus Name, Side 1
62.77Line Length (miles)0.1Line Span Length (miles)
100.0Soil Resistivity (Ohm-Meters)
X =
FRANKLINBus Name, Side 2
SEQUOYAHCircuit Number
1
A1 B1 C1
N1 N1
110.0 feet
80.0'
SINGLE TOWER 500 KV
Type
SizeType
Type
N/AStructure Name
500.0Operating Voltage (kV)2300.0
Insulation Level (kV)FOW (Front of Wave)
BIL (Basic Insulation Level) 1650.0
AC (AC Withstand) 1050.0 Transposed Phases Insulated Shields Transposed Shields
Program WinIGS-F - Form IGS_M102

31Tele-Seminar, April 30, 2004PSERC
QPF-SE Approach: Hybrid SE Formulation
∑∑−∈∈
+=synnonphasor
JMinν ν
νν
ν ν
νν
σηη
σηη
22
* ~~
νν η~~~~,, +−= NkAk VVz
ννν ηη ~
~~~~~~
~~
,
,
,
,
,
,
,,1,,1 +
⎥⎥⎥⎥⎥⎥⎥⎥
⎦
⎤
⎢⎢⎢⎢⎢⎢⎢⎢
⎣
⎡
=+=
Ck
Bm
Am
Ck
Bk
Ak
TAkdAkd
VVVVVV
CIz
=+−= νν η2~~ 2
,, NkAk VVz
ννν ηη +
⎪⎪⎪⎪
⎭
⎪⎪⎪⎪
⎬
⎫
⎪⎪⎪⎪
⎩
⎪⎪⎪⎪
⎨
⎧
⎟⎟⎟⎟⎟⎟⎟⎟
⎠
⎞
⎜⎜⎜⎜⎜⎜⎜⎜
⎝
⎛
⎥⎥⎥⎥⎥⎥⎥⎥
⎦
⎤
⎢⎢⎢⎢⎢⎢⎢⎢
⎣
⎡
=+=
*
,
,
,
,
,
,
,,1,,,1
~~~~~~
~Re
Ck
Bm
Am
Ck
Bk
Ak
TAkdAkAkd
VVVVVV
CVPz
GPS-Synchronized Measurements(Linear Model)
Non-Synchronized Measurements(Quadratic Model)
Voltage Phasor
Current Phasor Real Power
Voltage Magnitude
( ) ( ) νη22
,,,,2
,,,, +−+−= iNkiAkrNkrAk VVVV

32Tele-Seminar, April 30, 2004PSERC
Error of Bus Voltage Phase – Estimated minus Measured ValueMagnified 200 times (min error: -0.144, max error: 0.147 degrees)

33Tele-Seminar, April 30, 2004PSERC
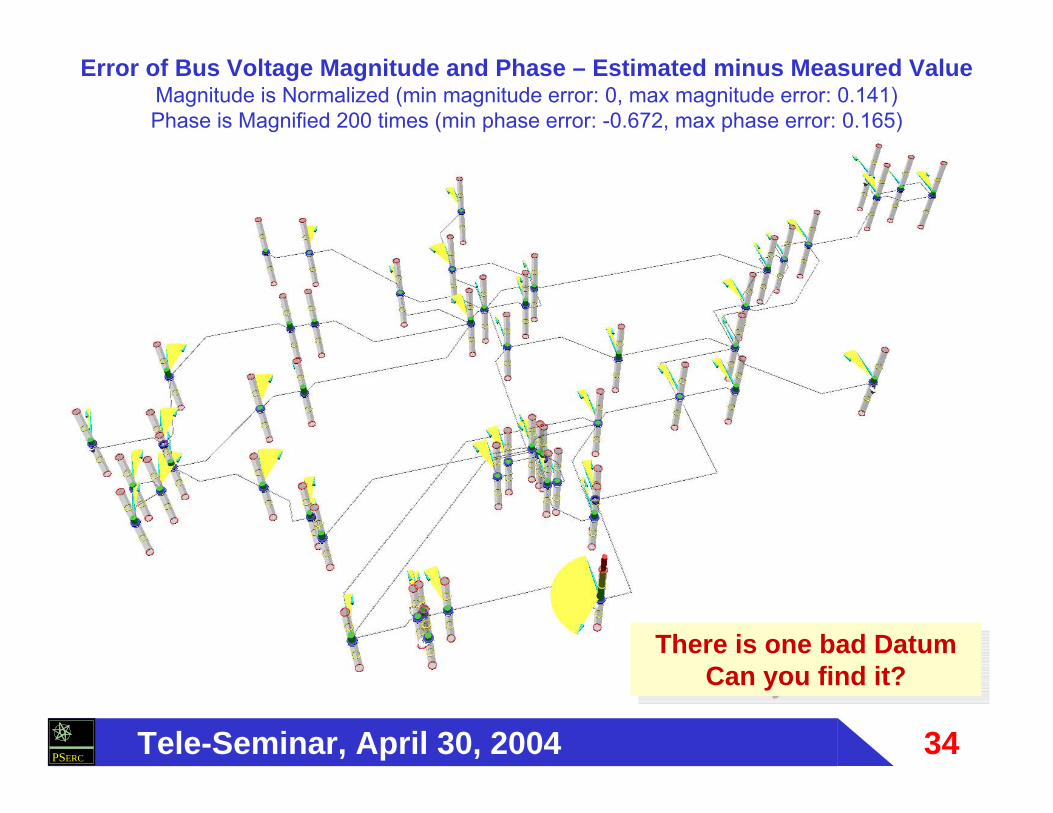
Bad Data Detection & Identification
This is an Important Issue:
- Current Approaches are Computationally Demanding.- Leverage Points Are Especially Troublesome.
Utilizing All Available Data Increases Redundancy.
The implications are:(a) Increased Effort for System Initial Calibration, and (b) Improved Bad Data Identification Process.
Visualization Methods Also Help
34Tele-Seminar, April 30, 2004PSERC
Error of Bus Voltage Magnitude and Phase – Estimated minus Measured ValueMagnitude is Normalized (min magnitude error: 0, max magnitude error: 0.141)Phase is Magnified 200 times (min phase error: -0.672, max phase error: 0.165)
There is one bad DatumCan you find it?
There is one bad DatumCan you find it?

35Tele-Seminar, April 30, 2004PSERC
Error of Bus Voltage Magnitude and Phase – Estimated minus Measured ValueMagnitude Error Range: 0.1 to 4.4kV – Phase Error Range: -0.1 to 0.8 Degrees
(Phase Error is Magnified 100 times)
Measurement Data: Phase A OnlyRandom Error: Voltage: 0.7%, Phase: 0.050, Power: 1%
Displayed Data:
Phase A

36Tele-Seminar, April 30, 2004PSERC
Error of Bus Voltage Magnitude and Phase – Estimated minus Measured ValueMagnitude Error Range: 0.4 to 4.6kV – Phase Error Range: -0.5 to 0.4 Degrees
(Phase Error is Magnified 100 times)
Measurement Data: Phase A OnlyRandom Error: Voltage: 0.7%, Phase: 0.050, Power: 1%
Displayed Data:
Phase B

37Tele-Seminar, April 30, 2004PSERC
Error of Bus Voltage Magnitude and Phase – Estimated minus Measured ValueMagnitude Error Range: 0.2 to 6.6kV – Phase Error Range: -0.6 to 0.4 Degrees
(Phase Error is Magnified 100 times)
Measurement Data: Phase A OnlyRandom Error: Voltage: 0.7%, Phase: 0.050, Power: 1%
Displayed Data:
Phase C

38Tele-Seminar, April 30, 2004PSERC
Proposed Utilization of the QPF-SE
• Assume There Are Sufficient GPS Synchronized Measurements for Complete State Observability from These Measurements Alone
• Exercise QPF-SE Once Each Hour
• Use Results of QPF-SE to Calibrate GPS Synchronized Measurements.
• Use the GPS Synchronized Measurements Directly as the Real Time Model.
39Tele-Seminar, April 30, 2004PSERC
Summary and ConclusionsPresent Implementation of State EstimatorsBiased Estimator
Synchronized Measurements Direct State Estimation
Synchronized Measurements + Multiphase ModelUnbiased State Estimation
Synchronized Measurements+SCADA+IEDs + Multiphase ModelHybrid, Unbiased State Estimation

40Tele-Seminar, April 30, 2004PSERC
ΤελοςΤελος