r/v maurice ewing data reduction summary - … maurice ewing data reduction summary ......
TRANSCRIPT

� � � � � � � � � � � � � � � � � � � � � � � � � � � � � � � � � � � � � � �
� � � � � � � �� � � � � � � � � ! � " � � �
� # � � $ � % � � � � � � � � � � & � � � ' � � � � � � � � ( � � � ) � � � � � � � � ) � �* + , - � , � * � . .
R/V Maurice Ewing Data Reduction Summary
EW−0205 Dutch Harbor − Kodiak
Date Julian Date Time Port
May 12, 2002 132 12:00:00 Dutch Harbor, AL
June 10, 2002 162 09:06:00 Kodiak, AL
/ 0 1 2 3 4 5 6 4 7 8
Background and Scientific Objectives
Fisheries−Oceanography coordinated Investigations (FOCI) is an effort by National Oceanic andAtmospheric Administration (NOAA) and associated academic scientists. FOCI’s goal is tounderstand the effects of abiotic and biotic variability on ecosystems of the North Pacific Oceanand Bering Sea in order to discern the physical and biological processes that determinerecruitment variability of commercially valuable finfish and shellfish stocks in Alaskan waters.This cruise is in support of the United States Global Ocean Ecosystems Dynamics (U.S.GLOBEC) and the Steller Sea Lion Research Programs. This cruise is being undertaken byFOCI in support of research into the physical, chemical, and biological mechanisms acting in thecoastal Gulf of Alaska.
The first leg will involve the recovery of 16 moorings, the deployment of 25 moorings, whichincludes two 2.3−meter diameter surface fiberglass−over−foam toroid moorings, in addition toConductivity, Temperature, and Depth (CTD) profile operations at each mooring site and at night.
The second leg will involve nearly continuous operations at CTD/Bongo stations, with someCalVET tows at selected sites, plus four MOCNESS tows. If time and conditions permit an eddyexperiment involving ARGOS satellite tracked drifters and CTD/Bong stations will be conducted.Approximately 16 satellite−tracked drifters will be deployed during the course of the two legs ofthe cruise.
-
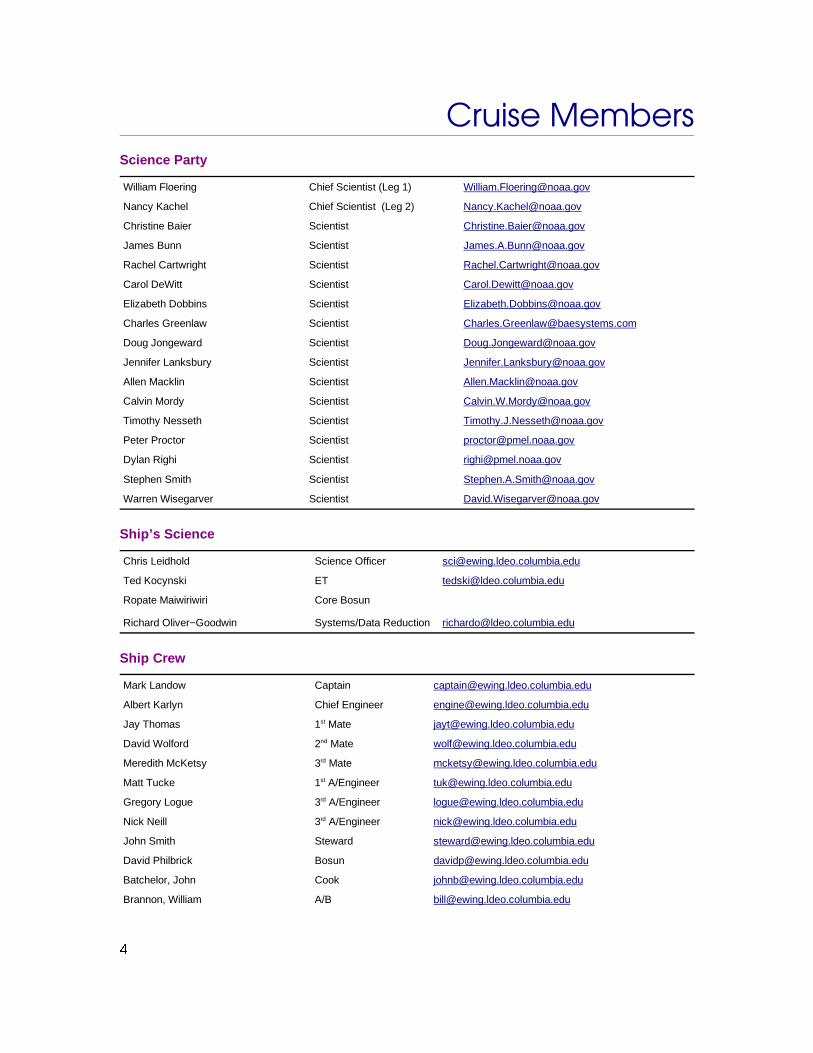
Science Party
William Floering Chief Scientist (Leg 1) [email protected]
Nancy Kachel Chief Scientist (Leg 2) [email protected]
Christine Baier Scientist [email protected]
James Bunn Scientist [email protected]
Rachel Cartwright Scientist [email protected]
Carol DeWitt Scientist [email protected]
Elizabeth Dobbins Scientist [email protected]
Charles Greenlaw Scientist [email protected]
Doug Jongeward Scientist [email protected]
Jennifer Lanksbury Scientist [email protected]
Allen Macklin Scientist [email protected]
Calvin Mordy Scientist [email protected]
Timothy Nesseth Scientist [email protected]
Peter Proctor Scientist [email protected]
Dylan Righi Scientist [email protected]
Stephen Smith Scientist [email protected]
Warren Wisegarver Scientist [email protected]
Ship’s Science
Chris Leidhold Science Officer [email protected]
Ted Kocynski ET [email protected]
Ropate Maiwiriwiri Core Bosun
Richard Oliver−Goodwin Systems/Data Reduction [email protected]
Ship Crew
Mark Landow Captain [email protected]
Albert Karlyn Chief Engineer [email protected]
Jay Thomas 1st Mate [email protected]
David Wolford 2nd Mate [email protected]
Meredith McKetsy 3rd Mate [email protected]
Matt Tucke 1st A/Engineer [email protected]
Gregory Logue 3rd A/Engineer [email protected]
Nick Neill 3rd A/Engineer [email protected]
John Smith Steward [email protected]
David Philbrick Bosun [email protected]
Batchelor, John Cook [email protected]
Brannon, William A/B [email protected]
+

Florendo, Rudy Oiler [email protected]
Hontiveros, Felepe A/B [email protected]
Keller, Tom Oiler [email protected]
McNeal, Frederick Utility [email protected]
Schwartz, Jack Electrician [email protected]
Syferd, Jim O/S [email protected]
Uribe, Fernando Oiler [email protected]
Walker, Wakefield A/B [email protected]
Wilson, Scott A/B [email protected]
,
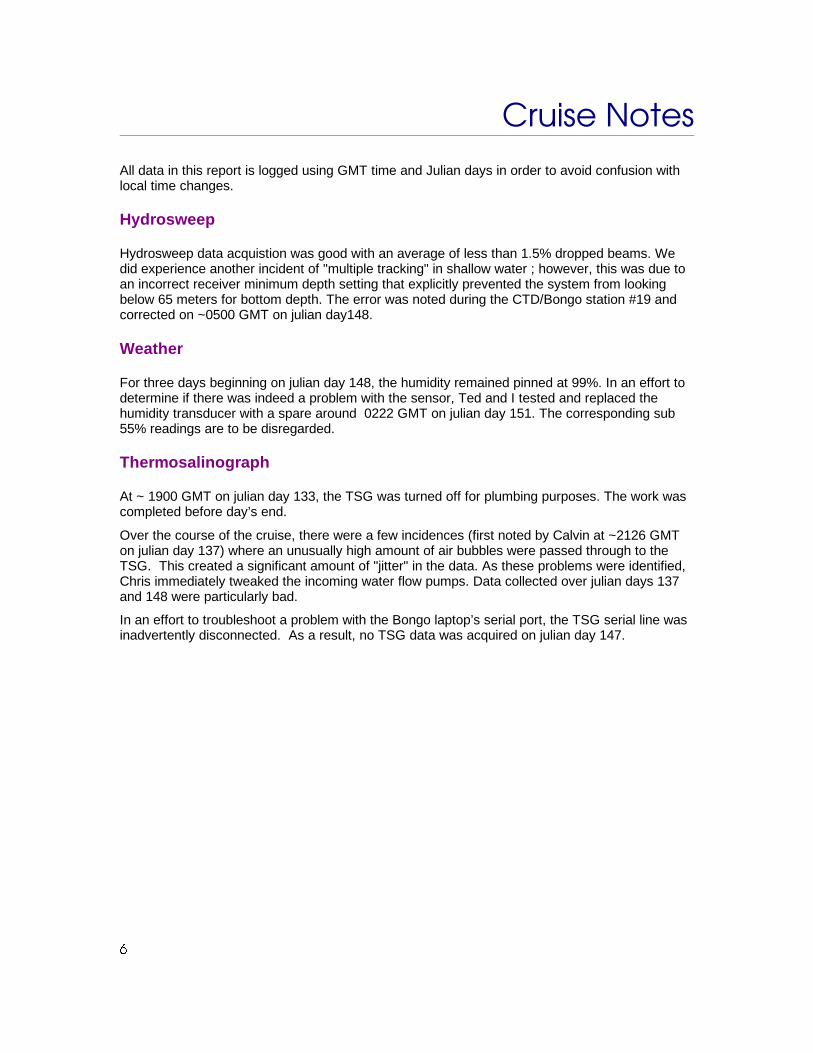
All data in this report is logged using GMT time and Julian days in order to avoid confusion withlocal time changes.
Hydrosweep
Hydrosweep data acquistion was good with an average of less than 1.5% dropped beams. Wedid experience another incident of "multiple tracking" in shallow water ; however, this was due toan incorrect receiver minimum depth setting that explicitly prevented the system from lookingbelow 65 meters for bottom depth. The error was noted during the CTD/Bongo station #19 andcorrected on ~0500 GMT on julian day148.
Weather
For three days beginning on julian day 148, the humidity remained pinned at 99%. In an effort todetermine if there was indeed a problem with the sensor, Ted and I tested and replaced thehumidity transducer with a spare around 0222 GMT on julian day 151. The corresponding sub55% readings are to be disregarded.
Thermosalinograph
At ~ 1900 GMT on julian day 133, the TSG was turned off for plumbing purposes. The work wascompleted before day’s end.
Over the course of the cruise, there were a few incidences (first noted by Calvin at ~2126 GMTon julian day 137) where an unusually high amount of air bubbles were passed through to theTSG. This created a significant amount of "jitter" in the data. As these problems were identified,Chris immediately tweaked the incoming water flow pumps. Data collected over julian days 137and 148 were particularly bad.
In an effort to troubleshoot a problem with the Bongo laptop’s serial port, the TSG serial line wasinadvertently disconnected. As a result, no TSG data was acquired on julian day 147.
�

1 9 : ; 7 < < = > ? / : @ A B @ C
.

The R/V Maurice Ewing data logging system is run on a Sparc Ultra Enterprise Server. Attachedare 48 serial ports via 3 16−port Digi International SCSI Terminal Servers. Generally, all datalogged by the Ewing Data Acquisition System (DAS) is time stamped with the CPU time of theserver, and broadcast to the Ewing network using UDP packet broadcasts. The CPU time of theserver is synchronized once every half hour to a Datum UTC gps time clock.
GPS times are also time−tagged with cpu time, although the time of the GPS position is from theGPS fix itself.
The following tables describe the data instruments which performed logging during this cruise.The tables associated with the instruments describe logging periods and data losses for thatinstrument.
Time Reference
Datum StarTime 9390−1000
logging interval: 30 minutesfile id: tr2
Used as the CPU synchronization clock. This clock is polled once every half hour tosynchronize the CPU clock of the data logger to UTC time. The logger (octopus) isresponsible for updating the times of the other CPUs.
This clock was running and synchronizing the system the entire cruise.
Interruption s greater than 30 minutes are displayed in the following table
Log Date LogDate Comment
2002+132:00:04:29.731 Logging officially started
2002+161:18:04:29.758 Logging officially ends
GPS Receivers
GPS data is usually logged at 10 second intervals. The NMEA strings GPGGA and GPVTG arelogged for position, speed, and heading fixes. This data was logged constantly throughout thecruise.
The Tasmon GPS was the primary GPS for this cruise.
*
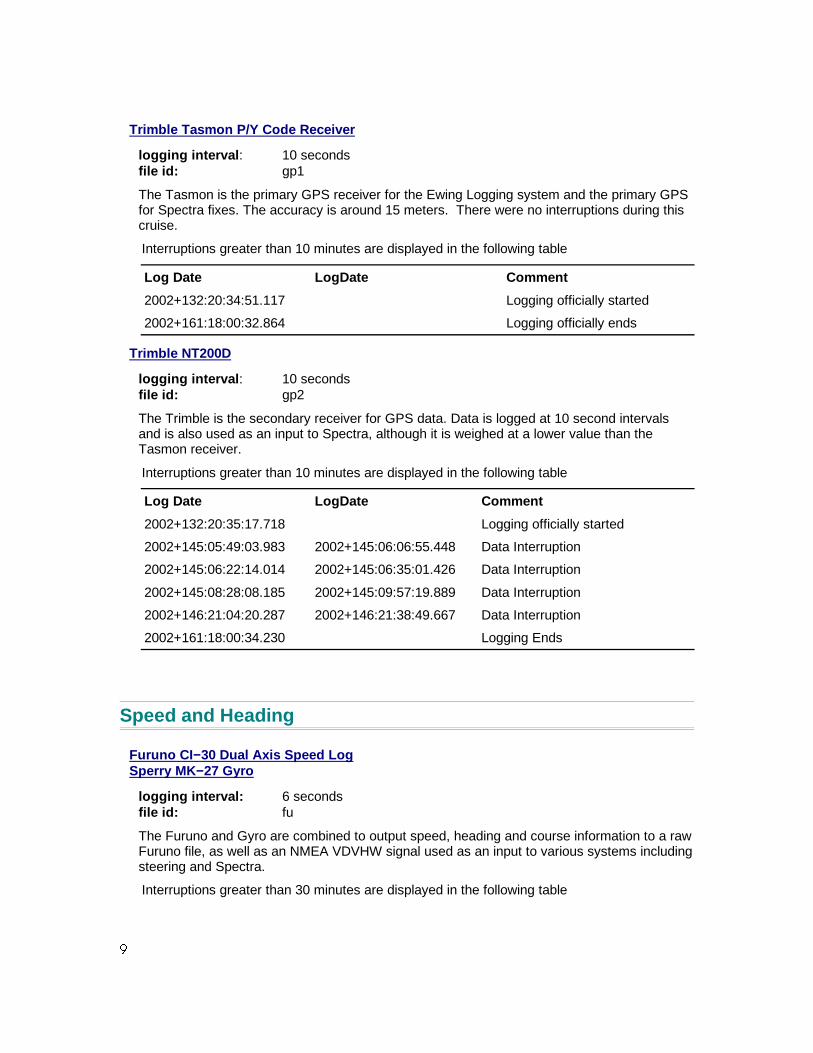
Trimble Tasmon P/Y Code Receiver
logging interval: 10 secondsfile id: gp1
The Tasmon is the primary GPS receiver for the Ewing Logging system and the primary GPSfor Spectra fixes. The accuracy is around 15 meters. There were no interruptions during thiscruise.
Interruptions greater than 10 minutes are displayed in the following table
Log Date LogDate Comment
2002+132:20:34:51.117 Logging officially started
2002+161:18:00:32.864 Logging officially ends
Trimble NT200D
logging interval: 10 secondsfile id: gp2
The Trimble is the secondary receiver for GPS data. Data is logged at 10 second intervalsand is also used as an input to Spectra, although it is weighed at a lower value than theTasmon receiver.
Interruptions greater than 10 minutes are displayed in the following table
Log Date LogDate Comment
2002+132:20:35:17.718 Logging officially started
2002+145:05:49:03.983 2002+145:06:06:55.448 Data Interruption
2002+145:06:22:14.014 2002+145:06:35:01.426 Data Interruption
2002+145:08:28:08.185 2002+145:09:57:19.889 Data Interruption
2002+146:21:04:20.287 2002+146:21:38:49.667 Data Interruption
2002+161:18:00:34.230 Logging Ends
Speed and Heading
Furuno CI−30 Dual Axis Speed LogSperry MK−27 Gyro
logging interval: 6 secondsfile id: fu
The Furuno and Gyro are combined to output speed, heading and course information to a rawFuruno file, as well as an NMEA VDVHW signal used as an input to various systems includingsteering and Spectra.
Interruptions greater than 30 minutes are displayed in the following table
�

Log Date Log Date Comment
2002+132:20:37:19.086 Official start date
2002+161:18:00:33.144 Official end date
Bathymetry
Krupp Atlas Hydrosweep−DS2
logging interval: variable based on water depthfile id: hb (centerbeam), hs (swath)
The hydrosweep full swath data is continuously logged for every cruise, and centerbeam datais extracted and processed separately. The centerbeam operates at a logging frequencydependent on the water depth.
The full swath data is not routinely processed, but can be processed with the MB−Systemsoftware which can be downloaded for free. For instructions, use the website:http://www.ldeo.columbia.edu/MB−System.
MBSystem, version 5.0beta3 is necessary to process data after June 1, 2001.
Interruptions greater than 10 minutes are displayed in the following table
Log Date LogDate Comment
2002+132:20:43:47 Official start logging
2002+161:18:00:22 Official end logging
Weather Station
RM Young Precision Meteorological Instruments, 26700 series
logging interval: 1 minutefile id: wx
The weather station is used to log wind speed, direction, air temperature, and barometricpressure. We log this information at 1−minute intervals.
Log Date LogDate Comment
2002+132:20:41:43.668 Official start logging
2002+151:01:59:00.599 2002+151:01:59:00.599 Data Interruption
2002+161:18:00:00.182 Official end logging
� "

For all formats, a − in the time field means an invalid value for some reason.
D E F G H I H J K L K M N H O P
Thi s dat a has been smoot hed and out put 1 f i x per mi nut e.
CPU Ti me St amp Tr ack Speed Hdg Gyr o
2000+166: 00: 01: 53. 091 − 4. 4 140. 5 148. 3
Q R S I K P F T T U V T J W T I X T E Y Z X O J
Hydr osweep dat a mer ged wi t h navi gat i on
Cent er beamCPU Ti me St amp Lat i t ude Longi t ude Dept h
2000+074: 09: 55: 00. 000 N 13 6. 6206 W 59 39. 3908 134. 9
[ T I M T S \ E W E Y
GPSCPU Ti me St amp Lat i t ude Longi t ude Used Set Dr i f t Dept h
2000+200: 12: 25: 00. 000 N 45 54. 1583 W 42 47. 1770 gp1 0. 0 0. 0
Magnet i c Gr avi t yTot al I nt ensi t y Anomal y FAA GRV EOTVOS Dr i f t Shi f t
49464. 7 55. 5 22. 2 980735. 0 −8. 4 −0. 1 2. 8
Temper at ur e Sal i ni t y Conduct i v i t y
0. 0 0. 0 0. 0
The gr avi t y dr i f t and shi f t ar e val ues t hat have been added t o t he r aw gr avi t y t o makeup f or dr i f t i n t he met er t hat has been l ost i n accor dance wi t h a gr avi t y check at eachpor t s t op.
Temper at ur e, Sal i ni t y and Conduct i v i t y wi l l onl y be val i d whi l e l oggi ng aTher mosal i nogr aph, whi ch i s not usual l y t he case.
] E ^ _ M E W _ K J G _ ` T J
CPU Ti me St amp Lat i t ude Longi t ude Used Set Dr i f t
2000+074: 00: 03: 00. 000 N 13 6. 2214 W 59 37. 9399 gp1 0. 0 0. 0
\ E W H Y a _ Y T W P b O I
CPU Ti me Dat um Ti me Ti me Ref er ence
2001+069: 00: 15: 29. 727 069 00 15 29. 378 dat um
D E F c d e M U f g b h O S
Raw GPS i s i n NMEA For mat .
� �
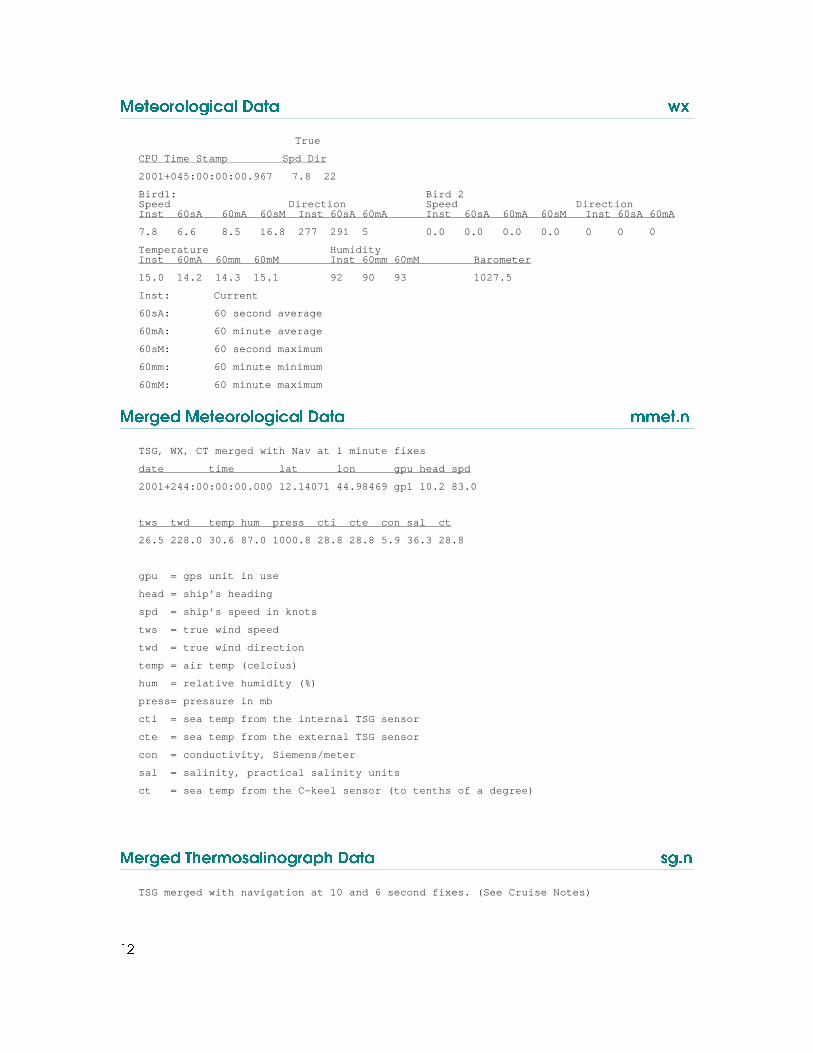
[ T W T K I K ` K M _ i E ` \ E W E F j
Tr ue
CPU Ti me St amp Spd Di r
2001+045: 00: 00: 00. 967 7. 8 22
Bi r d1: Bi r d 2Speed Di r ect i on Speed Di r ect i onI nst 60sA 60mA 60sM I nst 60sA 60mA I nst 60sA 60mA 60sM I nst 60sA 60mA
7. 8 6. 6 8. 5 16. 8 277 291 5 0. 0 0. 0 0. 0 0. 0 0 0 0
Temper at ur e Humi di t yI nst 60mA 60mm 60mM I nst 60mm 60mM Bar omet er
15. 0 14. 2 14. 3 15. 1 92 90 93 1027. 5
I nst : Cur r ent
60sA: 60 second aver age
60mA: 60 mi nut e aver age
60sM: 60 second maxi mum
60mm: 60 mi nut e mi ni mum
60mM: 60 mi nut e maxi mum
[ T I M T S [ T W T K I K ` K M _ i E ` \ E W E Y Y T W O J
TSG, WX, CT mer ged wi t h Nav at 1 mi nut e f i xes
dat e t i me l at l on gpu head spd
2001+244: 00: 00: 00. 000 12. 14071 44. 98469 gp1 10. 2 83. 0
t ws t wd t emp hum pr ess c t i c t e con sal c t
26. 5 228. 0 30. 6 87. 0 1000. 8 28. 8 28. 8 5. 9 36. 3 28. 8
gpu = gps uni t i n use
head = shi p’ s headi ng
spd = shi p’ s speed i n knot s
t ws = t r ue wi nd speed
t wd = t r ue wi nd di r ect i on
t emp = ai r t emp ( cel c i us)
hum = r el at i ve humi di t y ( %)
pr ess= pr essur e i n mb
ct i = sea t emp f r om t he i nt er nal TSG sensor
ct e = sea t emp f r om t he ext er nal TSG sensor
con = conduct i v i t y , Si emens/ met er
sal = sal i ni t y , pr act i cal sal i ni t y uni t s
ct = sea t emp f r om t he C−keel sensor ( t o t ent hs of a degr ee)
[ T I M T S a Z T I Y K P E ` _ J K M I E U Z \ E W E P M O J
TSG mer ged wi t h navi gat i on at 10 and 6 second f i xes. ( See Cr ui se Not es)
� k

dat e i me Lat Lon Seabi r d hex dat a l i pt s68 ei pt s68
2001+244: 23: 59: 31. 892 12. 14071 44. 98469 A907E23A2853F0713BD8 28. 301 28. 283
l cond l sal
5. 850 36. 370
l i pt s68 = l ocal wat er t emp sensor , degr ees C
ei pt s68 = ext er nal wat er t emp sensor , degr ees C
l cond = conduct i v i t y l ocal
l sal = l ocal sal i ni t y cal cul at ed f r om l cond and l i pt s68
I PTS68 i ndi cat es t he model whose cal i br at i on const ant s ar e
l odged i n t he l _t sg2. c l oggi ng pr ocess’ s sour ce code.
� -

EW0205
EW0205pdf this document
ew0205.cdf NetCDF database file of this cruise
ew0205.cdf_nav NetCDF database file of this cruise’ navigation
adcp/ ADCP data
configs/ Ewing logging, reduction, and watchdata configuration files
docs/ File Formats
plots/ Waypoint plots with gridded Sandwell bathymetry
processed/ Processed datafiles merged with navigation
trackplots/ daily cruise track plots (postscript)
raw/ Raw data directly from logger
reduction/ Reduced data files
clean/ daily processing directory, includes dailypostscript plots of the data.