サトウキビバガス灰(scba)を活かした泥炭地盤の安 定処理とそ …
TRANSCRIPT

九州大学学術情報リポジトリKyushu University Institutional Repository
サトウキビバガス灰(SCBA)を活かした泥炭地盤の安定処理とその有効性の評価
モハマド, ハイデイル ビン アブ タリブ
https://doi.org/10.15017/1654849
出版情報:Kyushu University, 2015, 博士(工学), 課程博士バージョン:権利関係:Fulltext available.

i
Effectiveness of Sugarcane Bagasse Ash (SCBA)
Utilization in Peat Stabilization
Mohd Khaidir Bin Abu Talib
March, 2016

ii
Effectiveness of Sugarcane Bagasse Ash (SCBA)
Utilization in Peat Stabilization
A thesis submitted in partial fulfillment of the requirements for the degree of
Doctor of Engineering
By
Mohd Khaidir Bin Abu Talib
To the:
DEPARTMENT OF CIVIL ENGINEERING
GRADUATE SCHOOL OF ENGINEERING
KYUSHU UNIVERSITY
Fukuoka, Japan
March, 2016

iii
DEPARTMENT OF CIVIL AND STRUCTURAL ENGINEERING
GRADUATE SCHOOL OF ENGINEERING
KYUSHU UNIVERSITY
Fukuoka, Japan
CERTIFICATE
The undersigned hereby certify that they have read and recommended to the
Graduate School of Engineering for the acceptance of this thesis entitled,
“Effectiveness of Sugarcane Bagasse Ash (SCBA) Utilization in Peat Stabilization”
by Mohd Khaidir Bin Abu Talib in partial fulfillment of the requirements for the
degree of Doctor of Engineering.
Dated: March, 2016
Thesis Supervisor:
Prof. Noriyuki Yasufuku, Dr. Eng.
Examining Committee:
Prof. Hideki Shimada, Dr. Eng.
Assoc. Prof. Kiyonobu Kasama, Dr. Eng.
Prof. Noriyuki Yasufuku, Dr. Eng.

iv
ABSTRACT
Peat distribution is extensive and can be found in many countries throughout
the world. These soils are problematic as they are very highly compressible and low
shear strength. Conventionally, the normal practice is to avoid these soils area, soil
replacement or driven pile. However due to dearth of suitable land for development,
avoidance of construction on peat is no relevance anymore. Replacement method
will make large scale disposal of peat in unacceptable amount in future. Structures on
peat that suspended on piles normally give deposition effect to surrounding ground.
In Malaysia, there is approximately 26000 km2 of peat. Johor is 3rd largest of peat
total area in Peninsular Malaysia but recorded the largest oil palm and other crops
plantation area on peat. Malaysia once becomes the main contributor of oil palm in
the world but after 2006 Malaysia turn into second place after Indonesia. According
to Malaysia Palm Oil Board (MPOB), transportation problem on peat identified as
one reason of oil palm production shortage.
In scope of effective, economic and rapid improvement method, mass
stabilization technique by using cement perceived a good option for peat stabilization
on oil palm planting area. Nevertheless, cement productions contributes roughly 5%
of carbon oxide (CO2) all over the world. Until 2012, cement volumes are
approximately 3.7 billion ton and forecast to reach 4.4 billion ton by 2050. Average
emissions are approximately 900 kg CO2/ton cement. The prices of cement are also
expected increases year by year. For these reasons, utilization of biological plant
waste materials is seen to be a good measure in creating a new sustainable method
for peat stabilization. Sugarcane production is presently world No. 1 commodities.
About 32% of bagasse is produced from every ton of sugar cane that been processed.
The total plantation area of sugarcane bagasse in Malaysia is nearly 150 km2. About
82000 ton of sugarcane is produced in 2012; hence bagasse also can be easily
obtained in Malaysia. Normally, bagasse burned to produce energy and steam for
power in factory and finally leave the ash as the waste. Increasing concern of
disposal of bagasse ash residual creates interest to explore the potential application of
this material. Main objectives of this study are to demonstrate the effectiveness of
Sugarcane Bagasse Ash (SCBA) as pozzolanic materials that possibly can be used

v
for partial cement replacement in peat mass stabilization. This dissertation consists of
seven chapters. The specific content of each chapter are described as follows:
Chapter 1 presents an introduction of this research. Current problem and
motivation to conduct this research are to be presented in this chapter. Objectives and
structure of the thesis are also described.
Chapter 2 deliberates an overview of peat concerning to geotechnical
characteristics that highlight the physical, chemical and mechanical properties. The
collected results of studied peat from Hokkaido then compared to Malaysia peat in
order to investigate the similarity potential. It is observed that studied peat has
similar properties with the Johor peat located in southern part of peninsular Malaysia.
Therefore, it is expected the research finding could be also applied on Johor peat in
future.
Chapter 3 presents the approach method to clarify the effectiveness of three
types SCBA utilization on peat strength. The Unconfined Compressive Strength
(UCS) tests were conducted at all samples with the aim to elucidate the stabilized
peat strength improvement. The new simple method for preloading during curing
was executed by using controlled air pressure instead of iron rod in conventional
method. The main target of this chapter is to determine the optimum SCBA inclusion
as partial replacement of cement. Next, the optimum mixtures from each SCBA were
used in further UCS test that stresses on various effect factors in peat stabilization. It
was found that optimum Peat-Cement-Bagasse (PCB) mixtures attain the maximum
UCS and discovered greater than Peat-Cement (PC) specimen. Moreover, the
proposed calculation to predict deformation modulus of PCB mixtures based on two-
phase mixtures model was introduced and developed. The main benefit of this
proposed model is the ability to determine the optimum PCB mixture which depends
on the physical and chemical effects of SCBA. It was observed that the proposed
model outcomes demonstrate a well agreement with the experimental results. At the
optimal mix design, the UCS of the stabilized peat specimens increased with
increasing of curing time, Ordinary Portland Cement (OPC) dosage, silica sand
dosage and preloading. At final stage, the preloading rates during curing and ideal
mixture proportions are recommendable for the peat stabilization to be effective.
vi
Chapter 4 discusses the strength improvement mechanism of stabilized peat
by focusing on the microstructure and chemical composition enhancement. The main
objective in this chapter is to verify the results obtained from previous chapter. It can
be stated that the stabilized soil is characterized by a well cemented soil medium
with tiny pore spaces within it as a result of the pozzolanic activity of SCBA. The
oxide compound percentages from Energy-dispersive X-ray spectroscopy (EDX)
results clearly depict that lower CO2 and higher calcium oxide (CaO2) portions
contribute the better results of strength. Additionally, the essential pozzolanic oxide
compounds [Silica (SiO2) and Alumina, (Al2O3)] display the high proportions for
stabilized peat which proves the formation of cementation products namely Calcium
Silicate Hydrates (CSH) and Calcium Alumina Silicate Hydrates (CASH).
Chapter 5 considers the evaluation of SCBA quality on pozzolanic effect in
stabilized peat. Pozzolanic effect of SCBA was determined from the outcomes of
UCS with different curing duration by setting the strength of PC mixture as a
reference. Previously, it was detected that the main different between SCBA
characteristics are their particle sizes and chemical compositions. Hence, mean grain
size (D50) and CaO2:SiO2 ratio of SCBA were adopted in statistical multiple
regression model analysis in order to predict the mixtures strength that consider
many other factors of peat stabilization. Considering the suggestion of the preloading
rates and best mixture proportions in chapter 3, the estimation equations were
simplified to easy form that emphasizes the SCBA quality and quantity only. Finally,
the quality of SCBA characteristics (D50 and CaO2:SiO2) that can be utilized in
hemic peat stabilization were suggested.
Chapter 6 illustrates the effectiveness of optimum PCB mixtures on peat
deformation behavior. Afterward, the outcomes were compared to PC mixture and
untreated peat compressibility test results. There was a significant reduction of void
ratio (e) for optimum PCB mixtures as compared to the untreated one. The essential
effect of treatment on the compression behavior is the increase in the
preconsolidation pressure, σ’c with curing period which means the compression
curve of the stabilized soil is shifted to higher effective stress. It is found that the
ratio of the secondary compression index, Cα to compression index, Cc or Cα/Cc of
untreated peat obviously decrease after stabilized with optimum PCB mixtures. As

vii
the Cα/Cc ratio declines, the soils engineering behaviors is shift from organic soils to
inorganic soils and finally reach to a granular material after a month of curing age on
the best optimum PCB mixtures. As a result, stabilized peat with high quality SCBA
inclusions was found to be a good foundation material by the geotechnical engineers.
Chapter 7 concludes all the research works together with study limitation and
future works.

viii
ACKNOWLEDGEMENTS
First of all, I am very grateful to Allah the Almighty for His grace I managed to
complete my PhD successfully. In preparing and completing the research and PhD
thesis, I have received invaluable help from many people. As a token of gratitude to
them, I would like to present some of individual who have contributed to my success.
To begin with, I really would like to express my sincere gratitude to my
supervisor, Prof. Dr. Noriyuki Yasufuku for the continuous support of my PhD study,
for his patience, tolerance, motivation and good guidance. I am very fortunate to
have a supervisor who is very kind and knowledgeable as he was. He always gives
me a freedom in conducting research but will be reprimanded if something went
wrong and then give a valuable recommendation. Besides my advisor, I would like to
express my gratefulness to members of examining committee, Prof. Dr. Hideki
Shimada and Assoc. Prof. Dr. Kiyonobu Kasama for their treasured time, attentive
evaluation and valuable comments on my works.
I would also like to thank Prof. Dr. Hemanta Hazarika and Dr. Ryohei Ishikura
who sometimes share some useful knowledge during my PhD research. Not to forget
also great appreciation to Mrs. Aki Ito in student affairs and Mr. Michio Nakashima
who helps a lot in the success of the experimental work in the laboratory. I owe a
debt of gratitude to all my comrades from Geotechnical Engineering Laboratory on
their good assistance throughout my study and live in Japan. They are Dr. Mahmoud
Hassan Fawzy, Dr. Jiang Zhenbo, Mr. Shintaro Miyamoto, Dr. He Yi, Dr. Teng Teng,
Dr. Miao Jiali, Dr. Luky Handoko, Dr. Zentaro Furukawa as well as many other
students in our research group for their decent cooperation. I am also indebted to Dr.
Midori Watanabe from Centre of Advanced Instrumental Analysis with whom I have
interacted during the SEM and EDX test. I would like to extend my great
acknowledgement to my employer in Malaysia, Universiti Tun Hussein Onn
Malaysia (UTHM) in providing me the scholarship to further my PhD study at
Kyushu University.
Finally, I am indebted to my most lovable parents and siblings for their indirect
encouragement from homeland. Special thanks to my beloved wife and my little
daughter who are always supports and show unconditional love to me.

ix
TABLE OF CONTENTS
CHAPTER 1 INRODUCTION .................................................................................. 1
1.1 Research background and problem statements ............................................. 1
General problem of peat ........................................................................ 1
Oil palm plantation in Johor, Malaysia .................................................. 2
Cement consumption in peat stabilization ............................................. 6
Sugarcane bagasse ash (SCBA) ............................................................. 7
1.2 Research objectives ....................................................................................... 8
1.3 Research scopes ............................................................................................ 9
1.4 Research motivation ...................................................................................... 9
1.5 Dissertation overview .................................................................................. 10
1.6 Research contributions ................................................................................ 11
1.7 References ................................................................................................... 14
CHAPTER 2 AN OVERVIEW OF PEAT SOIL CONCERNING TO
GEOTECHNICAL CHARACTERISTICS ............................................................... 18
2.1 Introduction ................................................................................................. 18
Definition and classification ................................................................ 18
Formation and distribution ................................................................... 21
2.2 Geotechnical characteristic review on Japan and Malaysia peat ................ 23
Physical properties ............................................................................... 24
Mechanical and chemical properties .................................................... 34
2.3 Summary ..................................................................................................... 41
2.4 References ................................................................................................... 42
CHAPTER 3 CLARIFYING AN EFFECTIVENESS OF SUGARCANE
BAGASSE ASH (SCBA) UTILIZATION ON THE STRENGTH OF STABILIZED
PEAT ......................................................................................................................... 46
3.1 Introduction ................................................................................................. 46
3.2 Literature review ......................................................................................... 47
Introduction .......................................................................................... 47
Peat improvement methods .................................................................. 48
3.3 Methodology ............................................................................................... 54
Description of materials ....................................................................... 54

x
Mixing designs of laboratory test ........................................................ 55
Laboratory sample preparation procedures .......................................... 57
3.4 Results and discussions ............................................................................... 61
Materials properties ............................................................................. 61
Effect of partial replacement of Ordinary Portland Cement (OPC) with
sugarcane bagasse ash (SCBA) .......................................................................... 64
Two phase model for peat-cement-bagasse (PCB) mixtures ............... 71
Effects of duration of curing in water .................................................. 76
Effect of preloading during curing ....................................................... 78
Effects of Ordinary Portland Cement (OPC) dosage ........................... 80
Effects of silica sand (K7) dosage ....................................................... 82
Effect of calcium chloride (CaCl2) as OPC accelerator ....................... 84
3.5 Summary ..................................................................................................... 86
3.6 References ................................................................................................... 87
CHAPTER 4 VERIFICATION OF PEAT STRENGTH IMPROVEMENT VIA
MICROSTRUCTURE AND CHEMICAL COMPOSITION ASSESSMENT......... 93
4.1 Introduction ................................................................................................. 93
4.2 Methodology ............................................................................................... 94
4.3 Results and discussions ............................................................................... 96
Materials .............................................................................................. 96
Untreated peat versus stabilized peat ................................................... 99
4.4 Summary ................................................................................................... 110
4.5 References ................................................................................................. 113
CHAPTER 5 EVALUATION OF SUGARCANE BAGASSE ASH (SCBA)
QUALITY CHARACTERISTICS ON POZZOLANIC EFFECT IN STABILIZED
PEAT ....................................................................................................................... 115
5.1 Introduction ............................................................................................... 115
5.2 Methodology ............................................................................................. 116
5.3 Results and discussions ............................................................................. 118
Performance/amount of pozzolanic effect (physical and chemical effect)
on stabilized peat ............................................................................................. 118
Estimation of the strength (qu) that focusing on the physical and
chemical effect of SCBA ................................................................................. 120

xi
5.4 Summary ................................................................................................... 129
5.5 References ................................................................................................. 131
CHAPTER 6 EFFECTIVENESS OF OPTIMUM PEAT-CEMENT-BAGASSE
ASH (PCB) MIXTURES ON PEAT DEFORMATION BEHAVIOUR ................ 133
6.1 Introduction ............................................................................................... 133
6.2 Methodology ............................................................................................. 135
6.3 Results and discussions ............................................................................. 135
Void ratio (e), coefficient of permeability (k) and pre-consolidation
pressure (σc’) .................................................................................................... 135
Coefficient of volume compressibility, mv and coefficient of
consolidation, Cv .............................................................................................. 142
Compression index, Cc and secondary compression index, Cα ......... 147
6.4 Summary ................................................................................................... 157
6.5 Reference ................................................................................................... 159
CHAPTER 7 CONCLUSIONS AND FUTURE WORKS .................................... 163
7.1 Conclusions ............................................................................................... 163
7.2 Future works.............................................................................................. 165
APPENDIX .............................................................................................................. 167

xii
LIST OF FIGURES
Figure 1.1: Malaysia National Key Economic Areas (NKEA); Sources: [11] ............ 3
Figure 1.2: Oil palm distribution area in Southeast Asia; sources: [13] ...................... 4
Figure 1.3: Field transportation and mechanical harvester on normal ground (above)
and on peat ground (below); Sources: [10] ............................................................. 6
Figure 1.4: Example of poor quality of road for oil palm transportation .................... 6
Figure 1.5: Flowcharts of research works .................................................................. 13
Figure 2.1: Peat definitions ........................................................................................ 19
Figure 2.2: Comparison of classification systems used for peat and organic soils [41]
............................................................................................................................... 20
Figure 2.3: Degree of humification (Von Post scale system) [39] ............................ 20
Figure 2.4: Formation of peat ground [43] ................................................................ 22
Figure 2.5: Peat distribution in the world [50] ........................................................... 23
Figure 2.6: Peat land distribution in West (left) and East Malaysia (right) ............... 24
Figure 2.7: Distribution of peat land in Hokkaido, Japan .......................................... 24
Figure 2.8: Research flowcharts of chapter 2 ............................................................ 26
Figure 2.9: Geotechnical characteristic laboratory test ............................................. 27
Figure 2.10: Oven and muffle furnace for moisture and ash contents test ................ 28
Figure 2.11: Organic content versus natural moisture content [4] ............................ 29
Figure 2.12: Atterberg limit test execution ................................................................ 30
Figure 2.13: Graph of liquid limit analysis ................................................................ 30
Figure 2.14: Comparison of organic contents, OC% versus liquid limit, LL% ......... 31
Figure 2.15: Comparison of specific gravity, Gs versus organic contents, OC% ...... 33
Figure 2.16: Standard sieve and diffraction laser apparatus ...................................... 34
Figure 2.17: Graph of particle size between 4.75 mm and 75µm .............................. 34
Figure 2.18: Laboratory unconfined compression tests ............................................. 35
Figure 2.19: Unconfined Compression Strength (UCS) of Hokkaido peat ............... 35
Figure 2.20: Laboratory standard 1D Oedometer apparatus ...................................... 36
Figure 2.21: Void ratio (e) versus effective vertical stress (σ’v) for Hokkaido peat . 37
Figure 2.22: Result of; a) SEM, b) EDX on Hokkaido untreated peat ...................... 38
Figure 2.23: Illustration of comparative study between Malaysia and Japan peat .... 40

xiii
Figure 2.24: Typical of Hokkaido peat basic properties ............................................ 40
Figure 3.1: Execution planning of Chapter 3 ............................................................. 47
Figure 3.2: Replacement (cut and fill) method on the peaty ground [85] ................. 49
Figure 3.3: Usual section of construction on peat: Immediately after completion of
structure (above) and after several years of construction completion (below) ..... 50
Figure 3.4: Peat improvement by preloading method [85] ........................................ 50
Figure 3.5: Peat improvement by load modification method [85] ............................. 51
Figure 3.6: Peat improvement by reinforcement method [85] ................................... 51
Figure 3.7: Cement and lime prices comparison for Malaysia market [56] .............. 52
Figure 3.8: Peat improvement by mass stabilization method [85] ............................ 53
Figure 3.9: All study materials: Hokkaido peat, OPC, K7, CaCl2, SCBA ................ 55
Figure 3.10: Mixtures mould cell parts (left) and the cell calibrations method (right)
............................................................................................................................... 58
Figure 3.11: Sample mould cells friction test results ................................................. 58
Figure 3.12: Mixing tools and method ....................................................................... 59
Figure 3.13: Samples filling and curing method ........................................................ 59
Figure 3.14: Schematic diagram of sample curing under air pressure ....................... 60
Figure 3.15: Conventional method in making, loading and testing of stabilized peat60
Figure 3.16: Sample extruder and cutter .................................................................... 61
Figure 3.17: Particle size distribution of peat and materials ...................................... 63
Figure 3.18: Comparison of all SCBA properties as pozzolan .................................. 64
Figure 3.19: Unconfined compressive strength of PCB mixtures compared to PC
mixture (top) and untreated peat (bottom) ............................................................ 66
Figure 3.20: The results of pH (top) and water contents (bottom) for all PCB
mixtures ................................................................................................................. 68
Figure 3.21: Relationship between secant modulus at E50 and unconfined
compressive strength, qu for all optimum PCB mixtures ...................................... 70
Figure 3.22: Relationship between strain at failure, εf and unconfined compressive
strength, qu for all optimum PCB mixtures ........................................................... 70
Figure 3.23: The concept in evaluate the deformation modulus of PCB mixture ..... 71
Figure 3.24: Relationship between alpha coefficient, α and optimum SCBA inclusion,
fsopt ......................................................................................................................... 74

xiv
Figure 3.25: Relationship between alpha coefficient, α and SCBA inclusion, fs ...... 74
Figure 3.26: Relationship between physical effects: chemical effects ratio of SCBA,
PE/CE and optimum SCBA inclusion, fsopt ............................................................ 75
Figure 3.27: The results of calculation/estimation of E50pcb versus experimental E50pcb
............................................................................................................................... 76
Figure 3.28: Effect of curing duration for all peat-cement-bagasse ash (PCB)
mixtures on the unconfined compressive strength, qu ........................................... 77
Figure 3.29: Effect of curing duration for PCB 1 mixtures on the acidity, pH and
water contents, w%................................................................................................ 78
Figure 3.30: On site difficulty in peat stabilization ................................................... 79
Figure 3.31: Effect of preloading for all peat-cement-bagasse ash (PCB) mixtures on
the unconfined compressive strength, qu ............................................................... 80
Figure 3.32: Effect of preloading for PCB 1 mixtures on the acidity, pH and water
contents, w% ......................................................................................................... 80
Figure 3.33: Effect of Ordinary Portland Cement (OPC) dosage for all peat-cement-
bagasse ash (PCB) mixtures on the unconfined compressive strength, qu ............ 81
Figure 3.34: Effect of ordinary Portland cement (OPC) dosage for PCB 1 mixtures
on the acidity, pH and water contents, w% ........................................................... 82
Figure 3.35: Effect of silica sand (K7) dosage for all peat-cement-bagasse ash (PCB)
mixtures on the unconfined compressive strength, qu ........................................... 83
Figure 3.36: Effect of silica sand (K7) dosage for PCB 1 mixtures on the acidity, pH
and water contents, w% ......................................................................................... 83
Figure 3.37: Effect of calcium chloride (CaCl2) dosage for all peat-cement-bagasse
ash (PCB) mixtures on the unconfined compressive strength, qu ......................... 85
Figure 3.38: Effect of calcium chloride (CaCl2) dosage for PCB 1 mixtures on the
acidity, pH and water contents, w% ...................................................................... 85
Figure 4.1: Execution planning of Chapter 4 ............................................................. 94
Figure 4.2: SEM superscan (SS-550) apparatus ........................................................ 94
Figure 4.3: Examples of prepared sample for SEM and EDX test ............................ 95
Figure 4.4: Coating apparatus and specimen chamber of SS-550 ............................. 96

xv
Figure 4.5: Scanning Electron Microscopy (SEM) results on materials used: a)
Untreated peat, b) Silica sand, c) Ordinary Portland Cement, d) Sugarcane
Bagasse Ash 1, e) Sugarcane Bagasse Ash 2, f) Sugarcane Bagasse Ash 3 ......... 97
Figure 4.6: Test results of untreated peat, P on SEM (a) and EDX (b) ..................... 99
Figure 4.7: Test results of stabilized peat of PC and PCB1 mixtures on SEM (left
side @ a to c) and EDX (right side @ d to f) ...................................................... 102
Figure 4.8: Test results of stabilized peat of PCB2-5 and PCB3-10 mixtures on SEM
(left side @ a and b) and EDX (right side @ c and d) ........................................ 104
Figure 4.9: EDX plot results of PCB1-20 and PCB3-10 ......................................... 104
Figure 4.10: Effect of calcium chloride, CaCl2 on the strength activity index ........ 105
Figure 4.11: Particle size distribution of all SCBA ................................................. 106
Figure 4.12: The UCS and EDX results of OPC dosage effect on PCB1-20 mixtures
............................................................................................................................. 108
Figure 4.13: The UCS and EDX results of preloading effect on PCB1-20 mixtures
............................................................................................................................. 109
Figure 4.14: The UCS and EDX results of K7 effect on PCB1-20 mixtures .......... 109
Figure 4.15: The UCS and EDX results of CaCl2 effect on PCB1-20 mixtures ...... 109
Figure 4.16: Ratio of calcium to silica for all mixtures ........................................... 110
Figure 4.17: Summary of the UCS and EDX results of P, PC and PCB mixtures .. 111
Figure 4.18: Summary of the UCS and EDX results of various effect of admixtures
on PCB1-20 mixtures .......................................................................................... 112
Figure 5.1: Execution planning of Chapter 5 ........................................................... 117
Figure 5.2: Effect of curing durations on the strength activity index of all optimum
PCB ..................................................................................................................... 120
Figure 5.3: Effect of silica sand, K7 on the strength activity index ........................ 120
Figure 5.4: Predicted versus experimental UCS of median particle size, D50 (left) and
Ca/Si ratio (right) on pozzolanic effects analysis ............................................... 127
Figure 5.5: Effect of median particle size (top) and Ca/Si ratio (bottom) of SCBA on
UCS ..................................................................................................................... 128
Figure 5.6: Ratio of physical-chemical ratio of SCBA versus SCBA percentage
inclusion .............................................................................................................. 129

xvi
Figure 6.1: Subsidence rate versus groundwater level relationships for different areas
in the world [128] ................................................................................................ 134
Figure 6.2: Flowchart of Chapter 6 experimental planning ..................................... 135
Figure 6.3: Void ratio, e versus effective vertical stress, σv’ for untreated peat ...... 136
Figure 6.4: Relationship of coefficient of compressibility, k, effective vertical stress,
σv’ and void ratio, e of untreated peat ................................................................. 137
Figure 6.5: Determination of preconsolidation pressure, σ’c by Casagrande’s method
for untreated peat................................................................................................. 138
Figure 6.6: Void ratio, e versus effective vertical stress, σv’ for; (a) all optimum PCB
and PC mixture at 7 days of curing, (b) optimum PCB1-20 mixture at 7, 28 and 60
days of curing ...................................................................................................... 139
Figure 6.7: Void ratio, e versus coefficient of permeability, k for; (a) all optimum
PCB and PC mixture at 7 days of curing, (b) optimum PCB1-20 mixture at 7, 28
and 60 days of curing .......................................................................................... 140
Figure 6.8: Coefficient of permeability, k versus effective vertical stress, σv’ for; (a)
all optimum PCB and PC mixture at 7 days of curing, (b) optimum PCB1-20
mixture at 7, 28 and 60 days of curing ................................................................ 141
Figure 6.9: Coefficient of volume compressibility, mv versus effective vertical stress,
σv’ for; (a) untreated peat, (b) all optimum PCB mixture at 7 days of curing, (c)
optimum PCB1-20 mixture at 7, 28 and 60 days of curing ................................ 144
Figure 6.10: Settlement vs square root time curve; example for determination of
coefficient of consolidation rate, Cv in laboratory consolidation test ................. 145
Figure 6.11: Coefficient of consolidation rate, Cv versus effective vertical stress, σv’
for; (a) untreated peat, (b) all optimum PCB mixture at 7 days of curing, (c)
optimum PCB1-20 mixture at 7, 28 and 60 days of curing ................................ 147
Figure 6.12: Compression index, Cc versus effective vertical stress, σv’ for; (a)
untreated peat, (b) all optimum PCB mixture at 7 days of curing, (c) optimum
PCB1-20 mixture at 7, 28 and 60 days of curing ................................................ 149
Figure 6.13: Secondary compression index, Cα versus effective vertical stress, σv’ for;
(a) untreated peat, (b) all optimum PCB mixture at 7 days of curing, (c) optimum
PCB1-20 mixture at 7, 28 and 60 days of curing ................................................ 151

xvii
Figure 6.14: Void ratio, e vs log time curve, example for determination of secondary
compression index, Cα in untreated peat (P) compressibility analysis ............... 151
Figure 6.15: Void ratio, e vs log time curve; example for determination of secondary
compression index, Cα in stabilized peat (PCB1-20 mixtures at 7 days curing)
compressibility analysis ...................................................................................... 152
Figure 6.16: Compression ratio, Cc/1+eo versus secondary compression ratio, Cα/1+eo
for; (a) untreated peat, (b) all optimum PCB mixture at 7 days of curing, (c)
optimum PCB1-20 mixture at 7, 28 and 60 days of curing ................................ 154
Figure 6.17: Compression index ratio, Cc/Cα for; (a) all mixture at 7 days of curing,
(b) optimum PCB1-20 mixture at 7, 28 and 60 days of curing ........................... 155
Figure 6.18: Compression ratio, Cc/1+eo for; (a) all mixture at 7 days of curing, (b)
optimum PCB1-20 mixture at 7, 28 and 60 days of curing ................................ 156
Figure 7.1 Future works ........................................................................................... 166
Figure 7.2 Planning idea for field test trial of PCB mixtures .................................. 166

xviii
LIST OF TABLES
Table 1.1: Area of peat under agriculture and oil palm in peninsular Malaysia;
Sources: [12] ........................................................................................................... 5
Table 1.2: Area of peat under agriculture and oil palm in Johor; Sources: [12] ......... 5
Table 2.1: Geotechnical engineering characteristic of peat land in Malaysia and
Japan ...................................................................................................................... 25
Table 2.2: Adopted standards for test method ........................................................... 27
Table 2.3: Classification of peat based on ASTM standards ..................................... 39
Table 2.4: Malaysian Soil Classification Systems (MSCS) for Organic and Peat [5]39
Table 3.1: Laboratory mix design .............................................................................. 56
Table 3.2: Oxide compounds of peat and materials ................................................... 62
Table 3.3: Requirement of pozzolan materials results for all SCBA ......................... 63
Table 3.4: The data of calculation/estimation of E50pcb versus experimental E50pcb .. 75
Table 4.1: Main specification of SEM550 apparatus ................................................ 95
Table 4.2: Energy Dispersive X-ray (EDX) test results of untreated peat and
materials ................................................................................................................ 98
Table 4.3: Summary of EDX test results of untreated and stabilized peat on the
percentage of crucial chemical elements............................................................. 100
Table 4.4: Summary of EDX test results of various stabilization factors on the PCB1-
20 mixtures .......................................................................................................... 107
Table 5.1: Collected results for multiple regression analysis of peat stabilization by
SCBA focusing on median particle size and Ca/Si ratio effects ......................... 122
Table 5.2: Correlation between UCS and various factor of peat stabilization by
SCBA focusing on median particle size and Ca/Si ratio effects ......................... 123
Table 5.3: Statistical correlation guidelines on strength of relationship .................. 124
Table 5.4: Regression statistics of median particle size, D50 (left) and Ca/Si ratio
(right) on pozzolanic effects analysis .................................................................. 125
Table 5.5: Analysis of variance (ANOVA) on pozzolanic physical effects analysis
............................................................................................................................. 126
Table 5.6: Analysis of variance (ANOVA) on pozzolanic chemical effects analysis
............................................................................................................................. 126

xix
Table 6.1 Classification of compression ratio [30] .................................................. 157

xx
NOMENCLATURE AND ABBREVIATIONS
ASTM American Society for Material Testing
USCS United Soil Classification System
MSCS Malaysian Soil Classification Systems
SCBA Sugarcane Bagasse Ash
OPC Ordinary Portland Cement
CaCl2 Calcium Chloride
K7 Silica sand
w Natural water content, %
A.C Ash content, %
O.C Organic content, %
F.C Fiber content, %
γ Bulk unit weight, kN/m3
Gs Specific gravity
LL Liquid Limit, %
pH Acidity
qu Unconfined Compressive strength, kPa
Su Undrained shear strength, kPa
E50 Secant Young’s modulus at 50% of the qu, MPa
εf Strain at failure, %
P Untreated peat samples
PC Peat-cement mixtures
PCB Peat-cement-bagasse mixtures
CSH Calcium Silicate Hydrate
CASH Calcium Aluminate Silicate Hydrate
CH Calcium Hydroxide
UCS Unconfined Compressive Strength, kPa
SAI Strength Activity Index, %
SEM Scanning Electron Microscopy
EDX Energy-dispersive X-ray
CO2 Carbon Oxide

xxi
C Carbon
Ca Calcium
Si Silica
Al Alimina
Fe Feric
Ca/Si Ratio of calcium to silica
D50 Average/ mean particle sizes, µm
ANOVA Analysis of the variance
e Void ratio
eo Initial void ratio
σv' Vertical stress, kPa
mv Coefficient of volume compressibility, 1/kPa
Cv Coefficient of consolidation, m2/s
k coefficient of permeability, m2/s
Cc Compressive index
Cα Secondary compressive index
Cc / 1+eo Compression index ratio
Cα / 1+eo Secondary compression index ratio
Cα / Cc Ratio of compression to secondary compression index ratio

1
CHAPTER 1
INTRODUCTION
1.1 Research background and problem statements
General problem of peat
Consequence of population and economic growth, land use activities
perceived increased intensely. As a result, suitable land for infrastructure
development has decreased and become a problem in the future. Therefore, it is
inevitable to construct on less favorable soils, like peat. Peat distribution is extensive
and can be found in many countries throughout the world when the conditions are
favorable for their accumulation and formation [1-3]. The vastness of peat land
coverage and its occurrence close to or within population centres and existing
cropped areas means some form of infrastructure development has to be carried out
in these areas. To stimulate agriculture development for instance, basic civil
engineering structures such as roads are required [4].
The identification of peat is very important because they are much weaker
than mineral (inorganic) soils. As such they do not provide suitable supports for most
engineering works. Peat and organic soil represent the extreme form of soft soil and
subject to instability and enormous primary as well as long-term settlement even
when subjected to moderate load [5]. These materials can also change chemically
and biologically over time. For instance, humidification of organic matter that
continues may change the mechanical properties of soil such as compressibility,
shear strength and hydraulic conductivity. Dropping of ground water may cause
shrinking and oxidation of peat leading to humidification with consequent increase in
2
permeability and compressibility. Besides, these soils are problematic as they are
very highly compressible and are of very low shear strength [6].
Numerous construction techniques have been carried out to support
embankments over peat without risking bearing failures but settlement of these
embankments remains extremely large and continues for many years. In addition,
stability problems during construction such as localized bearing failures and slip
failures need to be considered [2]. Access to these superficial deposits is usually very
difficult as the water table will be at near or above the ground surface. Undoubtedly,
this is a consequence of the tendency to avoid either the construction and building on
this land, or when this is not possible, to just remove, replace or supersede those in
certain circumstances can lead to possibly uneconomical design and construction
alternative [7]. Peat bearing capacity is very low and seems to be influenced by the
water table and the presence of wood chips under the ground [8; 9].
To sum up, peat is considered as unsuitable soils for supporting foundations
or any construction works in its natural state.
Oil palm plantation in Johor, Malaysia
During the Tenth Plan period (2011-2015), Malaysia will focus its economic
growth efforts on National Key Economic Areas (NKEA)as shown in Figure 1.1. An
NKEA is defined as a driver of economic activity that has the potential to directly
and materially contribute a quantifiable amount of economic growth to the Malaysian
economy. One of the listed NKEA is palm oil. Palm oil production is vital for the
economy of Malaysia, which is the world's second- largest producer of the
commodity. Oil palm is the most efficient oil crop in the world. A hectare of oil palm
can produce up to 10 times more oil than other leading oil crops [10].
There are 281,652 ha of peat under cultivation in Peninsular Malaysia, of
which 203,455 ha or 72% are under oil palm plantations (Table 1.1). Johor has the
greatest area of peat under agriculture (crops/husbandry) like shown in Figure 1.2.
One third of all oil palm plantations on peat in Peninsular Malaysia are found in
Johor.

3
Figure 1.1: Malaysia National Key Economic Areas (NKEA); Sources: [11]
Oil palm plantations comprise a large proportion of the total area of peatlands
in Johor utilised for agriculture. Conversion of peat swamp forest in Johor began in
early 1974, when 95,000 ha of West Johor peatlands were converted for agricultural
purposes. According to a survey carried out in 1997, a subsidence rate of 1.2 m was
recorded in the district of Pontian [12].
Oil palm plantation transportation challenge on peat ground
The oil palm industry is still very much dependent on manual labour to carry
out most of the operations, particularly in harvesting. To remain competitive, the
industry is constantly searching and using new machines to increase outputs and to
cut production costs. Field transportation and mechanical harvesting (Figure 1.3) of
oil palm fresh fruit bunches (FFB) remains an important issue that needs to be solved.
The harvested FFB must be quickly evacuated to the mill with as little
damage to the FFB as possible. Oil palm plantations cover a wide variety of
topography and ground conditions and hence requiring various systems to address
specific needs. Conventional methods, including the wheelbarrow and animal drawn

4
carts (Figure 1.3), are still being practiced in areas where heavy machines are not
accessible. One of the challenging tasks when it comes to crop evacuation is when
the palms are planted on peat. This is due to the ‘very loose’ and ‘very soft’ nature of
peat where the machines do not have sufficient traction and ability to float, thereby
restricting smooth movement of the machine. [10].
Figure 1.2: Oil palm distribution area in Southeast Asia; sources: [13]
Frequently, palm oil and other crop plantations include production areas
requiring supporting infrastructure such as light buildings and roads. When there is a
better management of the roads in the estates, better quantity and quality crops yield
will be sent to mill and processed. Road transport has a fundamental meaning for the
sustainable agriculture. Poor quality (Figure 1.4) and inadequate coverage of roads
will continue to hinder economic development in the future plantation. It is well-
known that long term settlements of road embankment and pavement deformations
are widespread on peat. These have resulted to unsafe, poor riding quality and high
road maintenance costs [14].

5
Table 1.1: Area of peat under agriculture and oil palm in peninsular Malaysia;
Sources: [12]
Table 1.2: Area of peat under agriculture and oil palm in Johor; Sources: [12]

6
Figure 1.3: Field transportation and mechanical harvester on normal ground (above)
and on peat ground (below); Sources: [10]
Figure 1.4: Example of poor quality of road for oil palm transportation
Cement consumption in peat stabilization
The use of cement and its capability in inorganic soil stabilization is very
popular since long time ago. However, the use of cement is not given much attention
in the stabilization of organic soils because evasion is often become the first choice
rather than build up any infrastructure on these problem land. However, over the past

7
few years, there are researchers who began to observe the ability of the cement in the
stabilization of organic soil [6; 15-20].
It is well recognized that organic soils can retard or prevent the proper
hydration of binders such as cement in binder-soil mixtures [17]. The combination of
humic acid with calcium ions produced in cement hydration makes it difficult for the
calcium crystallization, which is responsible for the increase of peat-cement mixture
strength to take place [18]. The acids may also cause the soil pH to drop and this
negatively affects the reaction rate of the binder, resulting in a slower strength gain in
peat [16].
Due to high organic content and less solid particles in peat, cement alone is
insufficient as a chemical admixture for peat stabilization. Compared with clay and
silt, peat has a considerably lower content of clay particles that can enter into
secondary pozzolanic reactions [21]. That means unless a large quantity of cement is
mixed with the soil to neutralize the acids, the process of the soil stabilization
remains retarded. However, adding a large quantity of cement into the peat is
definitely an unfriendly and uneconomical solution to deep peat ground improvement
considering the fact that the peat ground is covers a wide area, and the rising cost of
cement and its transportation to the site [22]. Cement is responsible for about 5%–
8% of global CO2 emissions and expected to grow 0.8 to 1.2% per year until may
reach 4.4 billion tonnes of productions in 2050 [23].
Sugarcane bagasse ash (SCBA)
A pozzolana is a material occurring either naturally or artificially, and which
contains silica, iron and aluminum ions that can generate a pozzolanic reaction [24].
Small amount of pozzolans can be added to cement stabilized peat to enhance the
secondary pozzolanic reaction in the stabilized soil [22] . One of pozzolan materials
sources are getting from agricultural waste ash such as rice husk ash, straw ash and
sugarcane bagasse ash. Production of large quantity of agricultural wastes all over
the world faces serious problems of handling and disposal. The disposal of
agricultural wastes creates a potential negative impact on the environment causing air

8
pollution, water pollution finally affecting the local ecosystems. Hence safe disposal
of agricultural wastes becomes challenging task for engineers [25].
Sugarcane production is world number one commodities with amount
approximately 1.8 billion tonnes in 2012. Bagasse is the residue left after the
crushing of sugarcane for juice extraction and on average, about 32% of bagasse is
produced from every tonne of sugarcane been processed. The total plantation area of
sugarcane bagasse in Malaysia is nearly 37000 acre. About 800000 ton of sugarcane
is produced in 2012; hence bagasse also can be easily obtained in Malaysia.
Furthermore, Federal Agriculture Marketing Authority (FAMA) Malaysia has also
built a Sugarcane Collection Center or Pusat Pengumpulan Tebu (PPT) with cost
RM4.5 million in Batu Pahat, Johor for export marketing to Singapore. Increasing
concern of disposal of bagasse residual creates interest to explore the potential
application of this material [26]. The sugarcane industry is still seeking solutions to
dispose of the wastes generated by the sugar and alcohol production processes. This
ash is used as fertilizer in the plantations, but it does not have adequate mineral
nutrients for this purpose. SCBA has also been studied as a promising pozzolanic
material and can be used in civil construction especially in concrete study [27-33].
Nowadays, despite the increasing interest in the potential use of SCBA as a pozzolan
in concrete technology, there is no evidence in the current literature of its use as a
soil stabilizer especially for organic soil.
1.2 Research objectives
By taking into the account the increasing demand and consumption of cement
together with the backdrop of SCBA waste problems, it could be something very
beneficial to develop alternate binders that are environment friendly and contribute
towards sustainable management. Hence, the utilization of SCBA in the stabilization
of peat can be a compelling idea and seems to be promising alternative when
considering issues of energy consumption and pollution.
The objective of this research works is to evaluate and clarify the
effectiveness factors of SCBA in peat stabilization. It is expected that the obtained
optimum mix design can be applied to stabilized peat layer in order to support the

9
infrastructure construction within estate area which could lead towards a more
sustainable agriculture plantation in the future.
1.3 Research scopes
In this research works, the soil that had been used is Hokkaido peat. In order
to focus for achieving the study target or objectives, experimental works plans were
divided by two stages that comprise three main parts from each stage. The stages
mentioned are untreated and stabilized Hokkaido peat while the main parts are
physical, chemical and mechanical properties for both said stages (Figure 1.5).
Briefly, this study scopes were concentrated to strength and deformation of stabilized
peat by utilizing sugarcane bagasse ash (SCBA) as partial cement replacement. To
evaluate the degree of improvement, the established parameters of this peat-cement-
bagasse (PCB) mixture must be compared to those of untreated peat and cemented
peat.
1.4 Research motivation
There are several important factors that encourage this research works.
Among these are:
a. Trying to meet the recommendations of the Ministry of Public Works, Malaysia,
Datuk Seri Fadillah Yusof that stating more research is still needs to be done on
peat in Malaysia since the soil conditions complicate efforts to implement
infrastructure projects. He also noted the focus needs to be done to develop the
better technology and construction materials for the peat as it will significantly
reduce the cost of construction of roads, buildings, utilities and other and
maintenance thereafter.
b. The facilities of research centers operating under UTHM (Research Center of
Soft Soil, RECESS and Peat Test Research Station, PTRs) that allows the study
of structures / infrastructures on the peat ground can be done on an ongoing basis
in the years to come and thus contribute new technologies or green materials in
implementing development on peat.

10
c. An effort to improve the transportation of oil palm plantation over the peat
ground particularly in Johor and thus improve the quality/ production of
agricultural revenue of the country.
1.5 Dissertation overview
This research work contains seven chapters that can be described as follows:
Chapter 1 presents an introduction of this research. Current problem and motivation
to conduct this research are to be presented in this chapter. Objectives and structure
of the thesis are also described.
Chapter 2 deliberates an overview of peat concerning to geotechnical characteristics
that highlight the physical, chemical and mechanical properties. The collected results
of studied peat (Hokkaido peat) then compared to Malaysia peat in order to
investigate the similarity potential.
Chapter 3 presents the approach method to clarifying effectiveness the three types of
sugarcane bagasse ash (SCBA) utilization on peat strength. The unconfined
compressive strength (UCS) tests were conducted at all samples with the aim to
elucidate the stabilized peat strength improvement. The main target of this chapter is
to determine the optimum SCBA inclusion as partial replacement of cement. The
best mixtures from each SCBA then chosen and use in further UCS test which is
stresses on various effect factor in peat stabilization.
Chapter 4 discusses about the strength improvement mechanism of stabilized peat by
focusing on the microstructure and chemical composition enhancement. The main
objective in this chapter is to verify the results obtained from previous chapter. It can
be stated that the stabilized soil is characterized by a well cemented soil medium
with tiny pore spaces within it as a result of the pozzolanic activity of SCBA.
Chapter 5 consider about the evaluation of sugarcane bagasse ash (SCBA) quality
characteristics on pozzolanic effect in stabilized peat. Pozzolanic effect of SCBA
was determined from the UCS of curing effect results by making a peat-cement (PC)
mixture as a reference. It was detected that the main different between SCBA’s

11
characteristics is their particle sizes (physical effect) and chemical compositions
(chemical effect). Hence, mean grain size (D50) and CaO:SiO2 ratio of SCBA were
adopted in regression model analysis in order to predict the strength and minimum
cement consumption that consider many other factor of peat stabilization.
Chapter 6 illustrates the effectiveness of optimum peat-cement-bagasse ash (PCB)
mixtures on peat deformation behavior. Afterward, the outcomes were compared to
peat-cement (PC) mixture and untreated peat in order to analyze the contribution of
SCBA inclusion in stabilized peat.
Chapter 7 concludes all the research works together with study limitation and future
works.
1.6 Research contributions
There are several contributions in this research work. The first one is the new
developed alternate binders that are economy and environment friendly by utilization
of the sugarcane bagasse ash (SCBA) as supplementary cement materials in peat
stabilization which can reach 20% of cement replacement with good quality of
SCBA. This mixture is expected suitable for supporting the infrastructure
construction within estate area especially at the palm oil plantation area which vastly
planted on peat ground with regularly not exceeds 3m depth in Malaysia [34]. The
better supporting infrastructure such as rural-urban connection highway including
road networks for agricultural activity will lead towards a more sustainable
agriculture plantation in the future. Consequently, increase the production
tremendously and simultaneously may raise the country revenue.
The second contribution is a suggested method of preloading during curing
by air pressure in the laboratory rather than solid iron rod (conventional method from
literature) as a simulation of initial loading at site. This technique is easier to apply
on many samples with various size and pressure at once. As a result, it will lead to
time and cost savings in conducting test. The third one is suggestion of minimum
amount of cement, silica sand and preloading for the peat stabilization to be effective
and achieve the minimum strength target (345kPa). Furthermore, the proposed

12
calculation to predict deformation modulus of Peat-Cement-Bagasse (PCB) mixtures
based on two-phase mixtures model was introduced and developed. The proposed
modified model was demonstrates a well agreement with the experimental results.
The final one is the statistical regression model to predict the strength gained
for the PCB mixtures that consider many other factor of peat stabilization.
Considering the suggestion of admixtures minimum amount above, the estimation
equations were simplified to easy form that emphasizes the SCBA quality and
quantity only. The percentage of SCBA inclusion depends on the quality of SCBA
which in this study were focusing in average particle size, D50 (physical effect) and
ratio of calcium to silica, Ca/Si (chemical effect). After that, the minimum quality of
raw SCBA that can be utilizing in peat stabilization without any special process to
harmonize this ash was recommended. This mean that the SCBA that fulfill the
suggested requirement can be chosen from mills and directly consumed in peat
improvement (specifically on hemic peat type such as Hokkaido and Johor peat).
Therefore, it saves the budget (avoid additional process), environment and time.

13
EFFECTIVENESS OF SUGARCANE BAGASSE ASH
(SCBA) UTILIZATION ON STABILIZED PEAT
Preliminary Study: problem statements,
objectives and approach method
Untreated peat properties: An overview of peat
soil concerning to geotechnical characteristicsTreated peat properties: Clarifying an effectiveness
of sugarcane bagasse ash (SCBA) utilization
Physical & chemical properties:
· Basic index properties
· Microstructure
· Acidity (soil pH)
· Chemical compositions
Mechanical properties:
· Unconfined Shear
Strength (UCS)
· Consolidation parameters
Mechanical properties:
Unconfined Shear Strength (UCS):
Determination of optimum SCBA inclusion
as partial replacement of cement
· Effect of SCBA compositions
Consolidation
parameters; Study
of deformation
behavior
transformation;
e.g. e, Cc, Cα, Cv,
mv, k etc
UCS: Investigation of multi-effect factor
of stabilized peat
· Effect of curing time
· Effect of OPC dosage
· Effect of K7 dosage
· Effect of preloading during curing
· Effect of CaCl2
Optimum mixtures
selected
Physical & chemical properties:
Verify the peat strength
improvement mechanism
· Microstructure
· Chemical compositions
· Acidity (soil pH)
Estimation of UCS &
minimum OPC
requirements- base on SCBA
physical & chemical
characteristics
Introduction to peat: Definition, classification,
formation, distribution etc.
Minimum amount of
admixtures recommended
Comparative study on
Japan & Malaysia peat
Minimum quality of SCBA
recommended (physical &
chemical characteristics)
Chapter 2
Chapter 3
Chapter 5
Chapter 4 Chapter 6
Chapter 1
Figure 1.5: Flowcharts of research works

14
1.7 References
[1] Asadi, A., Huat, B.B.K., Hanafi, M.M., Mohamed, T.A. and Shariatmadari, N.,
2009. Role of organic matter on electroosmotic properties and ionic
modification of organic soils. Geosciences Journal, 13(2): 175-181.
[2] Duraisamy, Y., Huat, B.K., Muniandy, R. and Aziz, A.A., 2008. Compressibility
Behavior of Fibrous Peat Reinforced with Cement Columns. ICCBT- E-
(09)–pp93-110.
[3] Montanarella, L., Jones, R.J.A. and Hiederer, 2006. The distribution of peatland
in Europe. Mires and Peat, 1 (2006), Article 01, 1-10.
[4] Huat, B.K., Sew, G.S. and Ali, F.H., 2004. Organic and Peat Soils Engineering.
Serdang, University Putra Malaysia, Press, ISBN Number: 983-2871-08-5.
[5] Jarrett, P.M., 1995. Site investigation for organic soils and peat. Geoguide 6. JKR
Document 20709- 0341-95. Public Works Department Malaysia. Malaysia.
[6] Huat, B.K., Maail, S. and Mohamed, T.A., 2005. Effect of Chemical Admixtures
on the Engineering Properties of Tropical Peat Soils. American Journal of
Applied Sciences, 2(7): 1113-1120.
[7] Huat, B.K., 2006. Deformation and Shear Strength Characteristics of Some
Tropical Peat and Organic Soils. Pertanika J. Sci. & Techno., 14(1&2): 61-74.
[8] Islam, M.S. and Hashim, R., 2008. Use of Mackintosh Probe Test for Field
Investigation in Peat Soil. Proc. of Int. Conf. on Highway and Geotechnical
Engineering, 26th - 27th May 2008, Best Western Premier Seri Pacific Kuala
Lumpur, Malaysia, pp. 27.
[9] Andriesse, J.P., 1988. Nature and Management of Tropical Peat Soils. FAO Soils
Bulletin 59 Rome, ISBN Number: 9251026572, Edition Number: 291894.
[10] MPOB, 2014. International Competition on Oil Palm Mechanisation.
http://www.mpob.gov.my/ICOPM/ICOPM%20brochure%20web.pdf.
[11] http://business.malaysia.my/en/articles/why-malaysia/initiatives/national-key-
economic-area-n-k-e-a,
[12] International, W., 2010. A quick scan of peatlands in Malaysia, Wetlands
International- Malaysia: Petaling Jaya, Malaysia. 74 pp.

15
[13] UNEP, 2011. Oil palm plantations: threats and opportunities for tropical
ecosystems.
http://www.na.unep.net/geas/getUNEPPageWithArticleIDScript.php?article_i
d=73, United Nations Environment Programme (UNEP).
[14] Vincent, T.C.K., 2010. Road Construction on Soft Soils in Sibu: A Practical
Perspective. Workshop on Ground Improvement Techniques on Peat in
Sarawak.
[15] EuroSoilStab, 2002. Development of design and construction methods to
stabilize soft organic soils. Design guide soft soil stabilization. CT97-0351.
Project No. BE 96-3177, Industrial & Materials TechnologiesProgramme
(Brite- EuRam III), European Commission.
[16] Axelsson, K., Johansson, S.E. and Anderson, R., 2002. Stabilization of Organic
Soils by Cement and Puzzolanic Reactions- Feasibility Study, Swedish deep
stabilization Research Centre, Report 3, English translation.
[17] Hebib, S. and Farrell, E.R., 2003. Some experiences on the stabilization of Irish
peats. Canadian Geotechnical Journal, 40(1): 107-120.
[18] Chen, H. and Wang, Q., 2006. The behaviour of organic matter in the process of
soft soil stabilization using cement. Bulletin of Engineering Geology and the
Environment, 65(4): 445-448.
[19] Sobhan, K., Reddy , D.V. and Ramirez, J.C., 2012. Cement Stabilization of
Organic Subgrades for Pavement Preservation. In: LACCEI (Editor),
Megaprojects: Building Infrastructure by fostering engineering collaboration,
efficient and effective integration and innovative planning Panama City,
Panama.
[20] Ahnberg, H., 2006. Strength of stabilised soils– A laboratory study on clays and
organic soils stabilised with different types of binder, Swedish deep
stabilization Research Centre, Report 16, English translation.
[21] Janz, M. and Johansson, S.E., 2002. The function of different binding agents in
deep stabilization, Swedish Deep Stabilization Research Center, Linkoping:
SGI. 9.

16
[22] Wong, L.S., Hashim, R. and Ali, F.H., 2009. A Review on Experimental
Investigations of Peat Stabilization. Australian Journal of Basic and Applied
Sciences, 3(4): 3537-3552, 2009. ISSN 1991-8178.
[23] WBCSD, 2009. Cement Technology Roadmap 2009, World Business Council
for Sustainable Development, W.B.C.S.D. Internationa Energy Agency, I.E.A.
[24] Velosa, A.L. and Cachim, P.B., 2009. Hydraulic-lime based concrete: Strength
development using a pozzolanic addition and different curing conditions.
Construction and Building Materials, 23(5): 2107-2111.
[25] Chittaranjan, M., Vijay, M. and Keerthi, D., 2011. Agricultural wastes as soil
stabilizers International Journal of Earth Sciences and Engineering, ISSN
0974-5904, Volume 04, No 06 SPL, October 2011, pp 50-51
[26] Lee, S.C. and Mariatti, M., 2008. The effect of bagasse fibers obtained (from
rind and pith component) on the properties of unsaturated polyester
composites. Materials Letters, 62(16): 2253-2256.
[27] Cordeiro, G.C., Toledo Filho, R.D., Tavares, L.M. and Fairbairn, E.M.R., 2009.
Ultrafine grinding of sugar cane bagasse ash for application as pozzolanic
admixture in concrete. Cement and Concrete Research 39, 110-115.
[28] Paya, J., Monzo, J., Borrachero, M.V., Diaz-Pinzon, L. and Ordonez, L.M.,
2002. Sugar-cane bagasse ash (SCBA): studies on its properties for reusing in
concrete production. Journal of Chemical Technology and Biotechnology,
77(3): 321-325.
[29] Ganesan, K., Rajagopal, K. and Thangavel, K., 2007. Evaluation of bagasse ash
as supplementary cementitious material. Cement & Concrete Composites,
29(6): 515-524.
[30] Cordeiro, G.C., Toledo, R.D., Tavares, L.M. and Fairbairn, E.M.R., 2008.
Pozzolanic activity and filler effect of sugar cane bagasse ash in Portland
cement and lime mortars. Cement & Concrete Composites, 30(5): 410-418.
[31] Fairbairn, E.M.R. et al., 2010. Cement replacement by sugarcane bagasse ash:
CO2 emissions reduction and potential for carbon credits. J Environ Manage;
91:1864-71.
[32] Sales, A. and Lima, S.A., 2010. Use of Brazilian sugarcane bagasse ash in
concrete as sand replacement. Waste Management, 30(6): 1114-1122.

17
[33] Frias, M., Villar, E. and Savastano, H., 2011. Brazilian sugar cane bagasse ashes
from the cogeneration industry as active pozzolans for cement manufacture.
Cement & Concrete Composites, 33(4): 490-496.
[34] RISDA, Garis Panduan Pengurusan Dan Penanaman Sawit Di Kawasan Tanah
Gambut. www.mpn.gov.my/c/document_library/get_file?uuid=363518fc-
f66b-4c80-b942-d9bc33adb8ed&groupId=82677.

18
CHAPTER 2
AN OVERVIEW OF PEAT CONCERNING TO
GEOTECHNICAL CHARACTERISTICS
2.1 Introduction
This chapter deliberates an overview of peat concerning to geotechnical
characteristics that highlight the physical, chemical and mechanical properties. The
collected results of studied peat (Hokkaido peat) then compared to Malaysia peat in
order to investigate the similarity potential.
Definition and classification
Peat definitions and classifications are different between countries. Some
such names are bogs, moors, muskeg, mire, tropical swamp forests and fens. These
names help characterize the peat by its differences resulting from the effect of
climate and type of plant materials that constitute the peat. Geotechnically, peat
described as soil that having an organic content greater than 75%. In Japan, peat
generally includes soil with more than 20% organic contents because of their
engineering properties [1]. Most of these soils are controlled by its organic matter
quantity, quality and physical properties. However, the definition and description of
peat between soil scientists and geotechnical engineers are different. Scientists have
described as peat with organic matter content greater than 25%. Figure 2.1 shows the
variety of peat definition based on multi-discipline background.

19
Current classification systems for peat and organic soils were used organic
and ash content as the sole parameter in classification [2-5] but it has resulted in a
wide variation in the definition of peat which is compared in Figure 2.2. Loughlin
and Lehane [6] observed that a classification system based on organic content and
ash content was not sufficient; other factors such as natural water content, structure,
degree of humidification, nature of organic material and also specific gravity also
need to be considered. United Soil Classification System (USCS), adopted by the
American Society for Material Testing (ASTM) defines organic soils as a separate
soil class in the standard classification of soils for engineering.
In Malaysia, classification of peat and organic soils is based on the British
Standard 5930:1981. Nevertheless, this classification has been upgraded by Public
Work Malaysia & Jarret [7] to make this system more clear and suitable to the
Malaysia situation. The Malaysian Soil Classification Systems (MSCS) introduced
the degree of humidification by Von Post scale as the second important parameter to
be considered after organic content [3].
Figure 2.1: Peat definitions
In technical term of geotechnology edited by Japanese Society of Soil
Mechanics and Foundation Engineering, soil with more than 5% organic contents
classified as organic soils and with more 50% as highly organic soils and generally
called peat in Japanese soil science particularly by Hokkaido Agriculture Experiment
Station. They classify the soil with 20-50% of organic contents as sub-peat. Between

20
the range 5% to 50% organic contents, the soils has classified as low organic soils
such as Kuroboku soil [1]. Studies conducted by Noto [1] on engineering
characteristic of Hokkaido peat, the organic content of peat are between 20 and 98%.
These roughly show that Hokkaido peat is similar to Malaysian peat with very high
content of loss of ignition value. Another useful method to classify peat or organic
soil is by referring its degree of humification or decomposition that also known as
the Von Post scale system (Figure 2.3).
Figure 2.2: Comparison of classification systems used for peat and organic soils [8]
Figure 2.3: Degree of humification (Von Post scale system) [5]
21
Formation and distribution
Jarret [9] described peat as naturally occurring, highly organic substance
derived primarily from plant materials. Peat is formed when the rate of accumulation
of organic matter is greater than the rate of decay. Peat actually represents an
accumulation of the disintegrated plant remains, which have been preserved under
condition of incomplete aeration and high water content as shown in Figure 2.4.
Peat formed in very wet conditions accumulates considerably faster and is
less decomposed than peat accumulating in drier places [10]. It accumulation
wherever the conditions are suitable, that is, in areas with excess rainfall and the
ground are poorly drained, irrespective of latitude or altitude. Nonetheless, peat tend
to be more common in those regions with comparatively cool wet climate. Physico-
chemical and biochemical process cause this organic material to remain in a state of
preservation over a long period of time. In other words, waterlogged poorly drained
condition, not only favor the growth of a particular type of vegetation but also help
preserve the plant remains [11].
Peat in Japan, in many cases is basin peat, formed when lakes and marshes
become filled with dead plants growing around them and then turn into land. This
type of peat is characterized by the spongy formation of plant fiber. In the peatland
of Hokkaido, peat commonly accumulates to a thickness of three to five meters on
the ground surface, while the soft clay layer underlying is the peat is often over 20
meters thick. In some areas, a sand layer exists between the peat and the clay layers.
The rate of deposition of peat depends on humidity and weather conditions [1; 12].
Huat [12] observed the depths for peat in Malaysia were varying from 1m to
20m. The color of peat in Malaysia is generally dark reddish brown to black. It
consists of loose partly decomposed leaves, branches, twigs and tree trunks with a
low mineral content [2]. The ground water table in these areas is always high and
occurs at or near the surface [13]. According to Jamil [14] where soil with peat depth
of <1.0 m, 1.0 – 1.5 m, 1.5 – 3.0 m, and >3.0 m is classified as shallow, moderate,
deep and very deep peat. In its drained state, the peat will transform to a compact soil
mass consisting of partially large wood fragments and tree trunks embedded in it.

22
Drainage influences the degree of decomposition, shrinkage and consolidation
behavior of the soil [2].
The peat land consists of nearly 5 to 8% of the earth land surface and nearly
60% of the wetland of the world is peat [1] (Figure 2.5). While the areas occupied by
the tropical peat land is about 30 million hectares and two third of that are in South
East Asia. These soils are found in many countries throughout the world. In the US,
peat is found in 42 states, with a total acreage of 30 million hectares. Canada and
Russia are the two countries with a large area of peat, 170 and 150 million hectares
respectively. In term of country land area, Finland recorded the highest percentage
with 33.5% while Malaysia was ranked 10th in the world with 8% and Japan ranked
26th with 0.5% [16].
Figure 2.4: Formation of peat ground [10]

23
In Malaysia, there is approximately 26,000 km2 of peat that accounting for
about 8% of the country’s land area (Figure 2.6) [16; 17]. Among these lands, 6,300
hectares of the peat lands are found in Pontian, Batu Pahat and Muar in West Johore
[18]. Peat forests, once found extensively in the district of Pontian, have been
converted to agriculture for oil palm, pineapple and other food crops [8]. The state
that covers the largest area of peat land in Malaysia is Sarawak which is about 13%
of the state area or 1.66 million hectares with 89% of these areas are more than 1m in
depth [19]. In Japan, peat is widely distributed through Hokkaido especially along
the lower reaches of the Ishikari, Kushiro and Tashio Rivers with approximately
2,000 km2 which equals to 6% of the flat area of the island (Figure 2.7) [1].
Figure 2.5: Peat distribution in the world [20]
2.2 Geotechnical characteristic review on Japan and Malaysia peat
The physical study of peat on geotechnical characteristics has been done by
several researchers especially geotechnical engineers and academician to ensure that
any construction on peat are safe. As mentioned earlier, this chapter presents some
review of peat from Japan and Malaysia pertaining to geotechnical properties. The
parameters studied were the moisture content, loss on ignition, unit weight, specific
gravity, fiber contents, acidity, liquid limit, plastic limit, plastic index and shear
strength as shown in Table 2.1.

24
Figure 2.6: Peat land distribution in West (left) and East Malaysia (right)
Figure 2.7: Distribution of peat land in Hokkaido, Japan
Physical properties
Methodology
In this study, peat from Hokkaido, Japan had been used in order to compare
with Malaysia peat. The depth of excavated samples is about 1m from ground
surface. The test of physical, mechanical and chemical properties of these peats had
been conducted like shown in Figure 2.8 and Figure 2.9 while the entire laboratory
test regulation and standards that had been implemented was shown in Table 2.2.

25
Table 2.1: Geotechnical engineering characteristic of peat land in Malaysia and Japan
Japan Malaysia
Properties Hokkaido West East Johore
Natural water content, % 580 115-1570 200-700 200-2207 230-659
Ash content, % 16.79 2-80 3-35 5-50 1.5-20
Organic content , % 83.21 20-98 65-97 50-95 80-98.5
Bulk unit weight (kN/m3) 10.57 7.1-19.7 8.3-11.5 8-12 7-12.3
Specific gravity, Gs 1.67 1.04-2.63 1.38-1.7 1.07-1.63 1.44-1.8
Fiber content, % 43 42-86.9 31-77 - 49
Acidity ,pH 5.46 - - 3-7.2 3.63
Liquid Limit 375 - 190-360 210-550 220-380
Compression Index, Cc 4.89 0.3-14 1.0-2.6 0.5-2.5 0.9-1.5
Undrained shear strength, kPa 6.80 5-40 8-17 8-10 7-11
References Authors [1; 21; 22] [12; 23-25] [12; 23-25] [3; 24; 26]

26
C H A P T E R 2 : An Overview of Peat Soil
Concerning to Geotechnical Characteristics
Introduction to peat soilGeotechnical characteristic review
on Japan and Malaysia peat
· Definition and classification
· Formation and distribution
Physical & chemical properties:
· Basic index properties
· Microstructure
· Acidity (soil pH)
· Chemical compositions
Mechanical properties:
· Unconfined Shear Strength
(UCS)
· Consolidation parameters
Comparative study on
Japan & Malaysia peat
Figure 2.8: Research flowcharts of chapter 2

27
Figure 2.9: Geotechnical characteristic laboratory test
Table 2.2: Adopted standards for test method
Moisture contents, organic and ash contents
One of the significant and most variable properties of peat is its water or
moisture content. The value of water content depends on the origin, degree of
decomposition and the chemical composition of peat. Naturally, peat has very high
natural water content due to its natural water-holding capacity. The high natural
water holding capacity is because of the soil structure characterized by organic
coarse particles (fibers) which can hold a considerable amount of water since the soil
fibers are very loose and hollow. The high water content is also because peat has low
bulk density and low bearing capacity as results of high buoyancy and high pore
volume [27].
Testing Names Standards
Atterberg Limit JGS 0141-2009
Moisture Content ASTM- D 2974
Particle Size Distribution ASTM- D 422
Specific Gravity ASTM- D 854
Organic (ash) Content ASTM- D 2974
Fiber Content ASTM- D 1997
Acidity (pH Test) ASTM- D 2976
Consolidation test ASTM- D 2435
Unconfined Compression Strength ASTM- D 2166
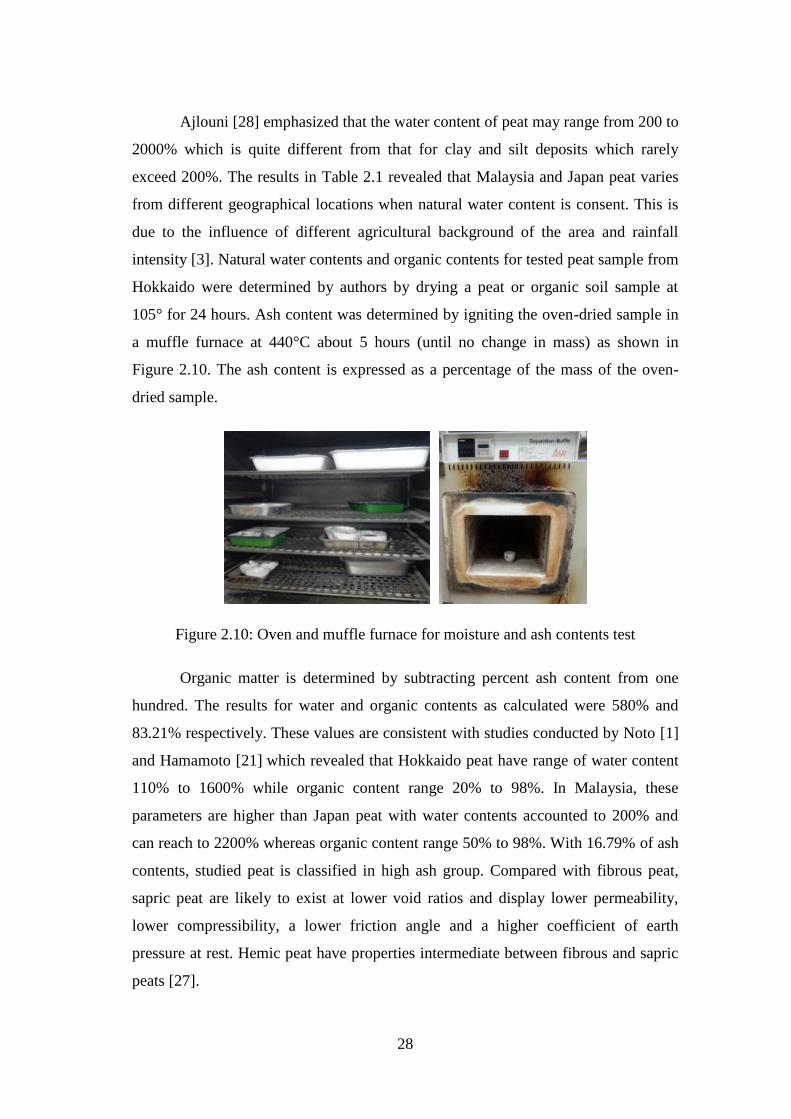
28
Ajlouni [28] emphasized that the water content of peat may range from 200 to
2000% which is quite different from that for clay and silt deposits which rarely
exceed 200%. The results in Table 2.1 revealed that Malaysia and Japan peat varies
from different geographical locations when natural water content is consent. This is
due to the influence of different agricultural background of the area and rainfall
intensity [3]. Natural water contents and organic contents for tested peat sample from
Hokkaido were determined by authors by drying a peat or organic soil sample at
105° for 24 hours. Ash content was determined by igniting the oven-dried sample in
a muffle furnace at 440°C about 5 hours (until no change in mass) as shown in
Figure 2.10. The ash content is expressed as a percentage of the mass of the oven-
dried sample.
Figure 2.10: Oven and muffle furnace for moisture and ash contents test
Organic matter is determined by subtracting percent ash content from one
hundred. The results for water and organic contents as calculated were 580% and
83.21% respectively. These values are consistent with studies conducted by Noto [1]
and Hamamoto [21] which revealed that Hokkaido peat have range of water content
110% to 1600% while organic content range 20% to 98%. In Malaysia, these
parameters are higher than Japan peat with water contents accounted to 200% and
can reach to 2200% whereas organic content range 50% to 98%. With 16.79% of ash
contents, studied peat is classified in high ash group. Compared with fibrous peat,
sapric peat are likely to exist at lower void ratios and display lower permeability,
lower compressibility, a lower friction angle and a higher coefficient of earth
pressure at rest. Hemic peat have properties intermediate between fibrous and sapric
peats [27].

29
The correlation between organic content to water content for Malaysia and
Japan peat was revealed in Figure 2.11. The results from Malaysia were studied by
Kazemian et al. [24] for tropical hemic of West Malaysia. After several laboratories
test for organic and water contents of untreated Hokkaido peat, authors were plotted
and gain the fitted line (dotted red line) like shown in this figure. Clearly, present
study outcomes illustrate the similarity results to Kazemian et al. [24] finding since
the obtained line was slightly less than average line of Malaysia peat. It is also shows
that the current study results are in the range of upper and lower bound of Malaysia
peat and have significant match to Seri Medan and Parit Sulung peat which located
in Johor.
Figure 2.11: Organic content versus natural moisture content [12]
Atterberg limits
For liquid limit and plastic limit test, cone penetrometer method had been
used. The values of this parameter on Malaysia peat varies from 190% to 550% and
100% to 300% respectively while the studied peat gave the results 375% for liquid
limit. Figure 2.12 and Figure 2.13 shows the Atterberg limit test execution and the
graph of Hokkaido peat analysis for liquid limit determination respectively. Figure
2.14 shows the comparison of organic contents, OC% versus liquid limit, LL% for
studied peat to tropical peat of West Malaysia [24] and temperate peat by Skempton
[29]. The results revealed that Hokkaido peat was more near to tropical peat line
rather than temperate peat line which indicate the similarities with Malaysia peat.

30
Figure 2.12: Atterberg limit test execution
Figure 2.13: Graph of liquid limit analysis
Japanese Geotechnical Society (JGS 0142-2000) describes the determination
of liquid limit using the fall- cone method. JGS method suggests be careful roll soil
samples into threads until it become thinner and eventually break at about 3 mm
diameter. Authors face the problem in order to get the plastic limit of tested peat by
this method. Peat can be moulded to this shape but failure occurred due to peat not
behaving as a plastic material [30]. Bei-Lin Tang [30] also proved hemic peat in her
study gave almost zero plastic limit by adopting Feng method. Zainorabidin and
Ismail [31] have previously encountered problems when attempting to determine the
plastic limit of Malaysian hemic peat. The presence of the fibres in peat makes the
process of determining the Atterberg limits difficult and less accurate. According to
Hobbs [32], it was impossible to carry out plastic limits tests on pure bog peat. On
R² = 0.98
0
2
4
6
8
10
12
14
16
18
20
0 100 200 300 400 500 600
Pen
etra
tion
, m
m
Water content, %

31
the other hand, even if the peat is highly humidified there was little point in
performing plastic limit testing on peat since the deduced plasticity index gives little
indication of their character.
Figure 2.14: Comparison of organic contents, OC% versus liquid limit, LL%
Fiber contents and degree of humification
Fiber content is determined typically from dry weight of fibres retained on a
sieve size of 100 (less than 0.15mm opening size). A known mass of undried peat is
soaked in a dispersing agent (5 % sodium hexametaphosphate) for approximately 15
h. The material is then washed through a 100-mesh (150 μm) sieve by application of
a gentle flow of tap water. The fibrous material left on the sieve is oven-dried (at
105°C) until a constant mass is achieved. The mass of fiber is expressed as a
percentage of the oven-dried mass of the original sample. In fiber content test,
calculated fiber content is 41% which is categorized as hemic peat according to
classification of peat by ASTM.
Through visual observation on the studied peat, the soil was brown in color.
When the soil was extruded on squeezing (passing between fingers), it could be
observed that the soil was somewhat pasty with dark brown water squeezed out, and
20
40
60
80
100
120
0 200 400 600
Org
an
ic c
on
ten
t, O
C (
%)
Liquid Limit, LL (%)
West Malaysia Skempton Authors
West Malaysia OC% = 0.175LL + 20.37 Skempton OC% = (LL - 0.5)/5
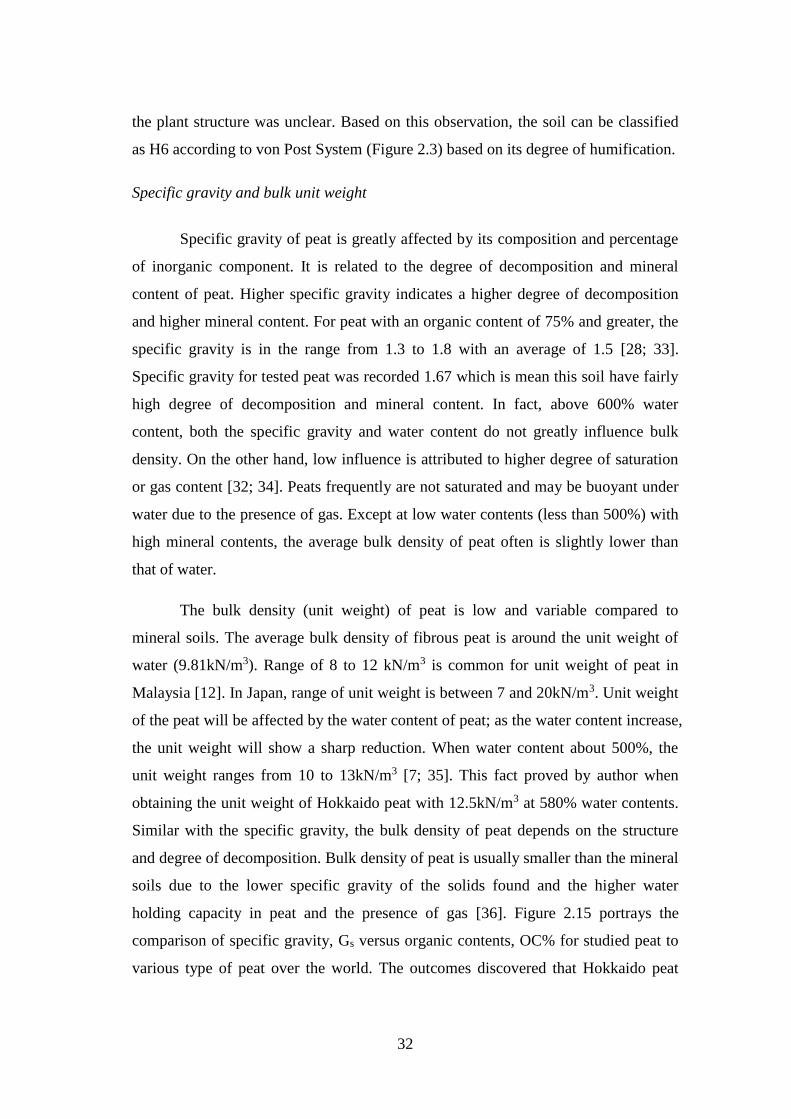
32
the plant structure was unclear. Based on this observation, the soil can be classified
as H6 according to von Post System (Figure 2.3) based on its degree of humification.
Specific gravity and bulk unit weight
Specific gravity of peat is greatly affected by its composition and percentage
of inorganic component. It is related to the degree of decomposition and mineral
content of peat. Higher specific gravity indicates a higher degree of decomposition
and higher mineral content. For peat with an organic content of 75% and greater, the
specific gravity is in the range from 1.3 to 1.8 with an average of 1.5 [28; 33].
Specific gravity for tested peat was recorded 1.67 which is mean this soil have fairly
high degree of decomposition and mineral content. In fact, above 600% water
content, both the specific gravity and water content do not greatly influence bulk
density. On the other hand, low influence is attributed to higher degree of saturation
or gas content [32; 34]. Peats frequently are not saturated and may be buoyant under
water due to the presence of gas. Except at low water contents (less than 500%) with
high mineral contents, the average bulk density of peat often is slightly lower than
that of water.
The bulk density (unit weight) of peat is low and variable compared to
mineral soils. The average bulk density of fibrous peat is around the unit weight of
water (9.81kN/m3). Range of 8 to 12 kN/m3 is common for unit weight of peat in
Malaysia [12]. In Japan, range of unit weight is between 7 and 20kN/m3. Unit weight
of the peat will be affected by the water content of peat; as the water content increase,
the unit weight will show a sharp reduction. When water content about 500%, the
unit weight ranges from 10 to 13kN/m3 [7; 35]. This fact proved by author when
obtaining the unit weight of Hokkaido peat with 12.5kN/m3 at 580% water contents.
Similar with the specific gravity, the bulk density of peat depends on the structure
and degree of decomposition. Bulk density of peat is usually smaller than the mineral
soils due to the lower specific gravity of the solids found and the higher water
holding capacity in peat and the presence of gas [36]. Figure 2.15 portrays the
comparison of specific gravity, Gs versus organic contents, OC% for studied peat to
various type of peat over the world. The outcomes discovered that Hokkaido peat

33
almost on the line of general peat on earth and clearly close to Parit Sulong peat in
Johor, Malaysia.
Figure 2.15: Comparison of specific gravity, Gs versus organic contents, OC%
Particles size distribution
The peat tested in this study often produce clods. The particle size
distribution curves for the studied soils were obtained by standard dry sieve analysis
and laser diffraction particle size analyzer (Figure 2.16). In addition to this standard
sieve test method, the soil fraction finer than 75µm was analyzed using a diffraction
laser method (SALD-3103 and SALD-MS30 model by Shimadzu, Japan) which is
interpreted as one graph in Figure 2.17. As can be seen, Hokkaido peat consists
broadly of sand to fine size base on Unified Soil Classification System (USCS)
gradation and on average, 90% of the soil is finer than 4.75mm, and 2% is finer than
75µm. The coefficient of uniformity, Cu is 9.3, and the average coefficient of
gradation Cg is 1.71. Pattern of Hokkaido peat particle size distribution is quite
similar with Malaysia peat conducted by Kalantari [37].

34
Figure 2.16: Standard sieve and diffraction laser apparatus
Figure 2.17: Graph of particle size between 4.75 mm and 75µm
Mechanical and chemical properties
Unconfined shear strength (UCS)
Since strength of stabilized peat is often evaluated by measuring its
unconfined compressive strength due to the soil low permeability and high stiffness,
unconfined compression tests (Figure 2.18) often provide relatively fast and cheap
means of determining the soil strength [38].
The unconfined compressive strength (qu) is defined as the compressive stress
at which an unconfined cylindrical specimen of soil will fail in a simple compression
test [39]. In this study, the unconfined compressive strength is taken as the maximum
load attained per unit area or the load per unit area at 15% axial strain, whichever
0
20
40
60
80
100
0.0001 0.001 0.01 0.1 1 10
Per
cen
t fi
ner
, %
Particles size, mm

35
occurs first during the performance of a test. For untreated peat, the specimen was
prepared in the mould size of 50 mm diameter and 100 mm length in three layers.
Each layer was subjected 10 full thumb pressures at about 10 seconds [40]. The
sample then trimmed and tested under vertical axial load at constant rate of strain of
1 mm min-1. The detail calculations to compute UCS are shown in Appendix A. The
result shows the peak was not obtained until 20% of axial strains. Hence, the max
value of UCS was taken at 15% of strain which is equal to 13.6 kPa (Figure 2.19).
From this result, undrained shear strength, (Su = qu/2) was equal to 6.8kPa. These
values indicate that Hokkaido peat is very soft.
Figure 2.18: Laboratory unconfined compression tests
Figure 2.19: Unconfined Compression Strength (UCS) of Hokkaido peat

36
Consolidation
Consolidation tests were carried out in the standard 1D Oedometer apparatus
(Figure 2.20) on the Hokkaido peat. The sizes of specimens were 60 mm in diameter
and 30 mm in height. The Oedometer tests comprised seven incremental-load stages
and each load stage lasted 24 hours. An initial stress of 10 kPa was applied and the
stress was increased in steps at the end of each load stage using a load increment
ratio of unity until a final stress of 640 kPa had been applied.
Figure 2.20: Laboratory standard 1D Oedometer apparatus
It revealed from the Figure 2.21 that untreated Hokkaido peat demonstrated the
high void ratio, e and consequently contribute high coefficient of compression, Cc=
Δe/ (Δ log σv’) with about 9 and 4.9 respectively. This is because of plant matters that
constitute peat particles are light and hold a considerable amount of water. Peat
grains, plates, fibers, or elements are light because the specific gravity of organic
matter is relatively small and the particles are porous. As a consequence of high in e,
peat display high values of Cc [41].
Compare to Malaysia peat, studied peat shows the higher numbers in Cc but this
results almost in range of Cc mentioned by Huat et al. [12] which Cc can be as high
as 5 to 10 for tropical peat .However in Malaysia, typical Cc was detected in range of
0.5 and 2.6 (Table 2.1). By using Casagrande method (Figure 2.21), the pre-
consolidation pressure, σc’ estimation of untreated Hokkaido peat was given
approximately 25 kPa.

37
Scanning Electron Microscope (SEM), Energy-Dispersive X-Ray Spectroscopy (EDX)
and pH test
Scanning Electron Microscope, SEM apparatus was used to examine
microstructure of untreated peat. The detail of experiment apparatus and procedure
had been describing in Chapter 4. Figure 2.22 (a) depicts the results of SEM test on
untreated peat samples. It has been observed that the untreated peat contains coarse
organic particles and fibers in a loose condition. They were organized arbitrarily
without significant microstructural orientation. The organic coarse particles were
typically hollow and spongy. Due to spongy nature of organic coarse particles,
untreated peat is highly compressible and has a high water holding capacity when
fully saturated [42].
Figure 2.21: Void ratio (e) versus effective vertical stress (σ’v) for Hokkaido peat
Dry samples of test specimens of untreated Hokkaido peats was scanned in
energy dispersive X-ray (EDX) and the chemical composition percentages outcomes
are displayed in Figure 2.22 (b). It can be detected from this figure that the untreated
peat is predominantly characterized by carbon (C) and oxide (O) which are two main
components of organic matter. It is obvious that the peat has also a very low content
of pozzolanic minerals with 4.6% SiO2, 3.1% Al2O3 and 2.1% Fe2O3 together with
low calcium at about only 1%.
2.0
3.0
4.0
5.0
6.0
7.0
8.0
9.0
10.0
1 10 100 1000
Void
rati
o,
e
Vertical stress, σv'
σ`c = 25kPa

38
It is known one of crucial parameter of peat is their acidity (pH). The
electrometric measurement of the pH of peat in suspensions of water and calcium
chloride solutions is made with a potentiometer using a glass-calomel electrode
system calibrated with buffers of known pH (pH 4, 7, 9 and 12). The average result
of peat pH in this study is about 5.4 which quite large compared to Malaysia peat
with range of 3 to 7 (Table 2.1). This means Hokkaido peat are categorized as lightly
acidic peat. It appears that organic acids mixed with soil and cement that produce a
pH lower than 9 in the pore solution, prevent the development of the cementing
products because the pH is too low to allow secondary mineral formation [43].
Figure 2.22: Result of; a) SEM, b) EDX on Hokkaido untreated peat
Classification of Hokkaido studied peat
United Soil Classification System (USCS), adopted by the American Society
for Material Testing (ASTM) defines organic soils as a separate soil class in the
standard classification of soils for engineering as shown in Table 2.3. In Malaysia,
classification of peat and organic soils is based on the British Standard 5930:1981.
Nevertheless, this classification has been upgraded by Public Work Malaysia &
Jarret [7] to make this system more clear and suitable to the Malaysia situation. The
Malaysian Soil Classification Systems (MSCS) showed in Table 2.4 introduced the
degree of humidification by Von Post scale as the second important parameter to be
considered after organic content [3].
In order to compare with Malaysia peat and classify the investigated peat,
Figure 2.23 was created based on the collected results in Table 2.1 . This figure and

39
Figure 2.24 includes the typical of Hokkaido peat basic properties with the reasons to
confirm and ensure the assessment results by authors are reliable. It can be seen that
the peat has fiber content between 33% and 67%, ash content exceed 15%, and pH
value between 4.5 and 5.5. Hence, this peat can be classified as hemic peat with high
ash content and moderate acidic [44]. With the high water content, high liquid limit
and low shear strength, the studied peat demonstrated the high compressibility and
instability characteristics. Roughly, it can be said that studied peat are always in the
range of typical Hokkaido and Malaysia peat.
Table 2.3: Classification of peat based on ASTM standards
Table 2.4: Malaysian Soil Classification Systems (MSCS) for Organic and Peat [5]
Fibric peat- fibers > 67%
Hemic peat- 33% < fibers < 67% fibers
Sapric peat- fibers < 33%
High ash peat- ash > 15%
Medium ash peat- 5% < ash < 15% ash
Low ash peat- ash < 5%
Highly acidic peat- pH < 4.5
Moderate acidic peat- 4.5 < pH < 5.5
Slightly acidic peat- 5.5 < pH < 7.0
Basic peat- pH ≥ 7.0
Acidity
(ASTM D2976)
Fiber content
(ASTM D1997)
Ash content
(ASTM D2974)
Soil
group
Organic
content
Soil
Symbol
Degree of
Humidification
Subgroup
nameField Identification
H1-H3Fibric or
Fibrous Peat
H4-H6
Hemic or
moderately
decomposed
peat
H7-H10
Sapric or
amorphous
peat
Dark brown to black in
color. Material has low
density so seems light.
Majority of mass is
organic so if fibrous the
whole mass will be
recognized plant remains.
More likely to smell
strongly if highly
humidified
Peat > 75% Pt

40
Figure 2.23: Illustration of comparative study between Malaysia and Japan peat
Figure 2.24: Typical of Hokkaido peat basic properties
0
20
40
60
80
100
120
OC γ Gs F Cc Su
Valu
e
Soil properties
Hokkaido peat Current study

41
2.3 Summary
As summary, this chapter briefly introduces the peat in general in order to
develop an understanding about this ground. These include about peat definition,
classification, formation and distribution in the world especially in Japan and
Malaysia. Moreover, this chapter deliberates an overview of peat concerning to
geotechnical characteristics that highlight the physical, chemical and mechanical
properties. The collected results of studied peat (Hokkaido peat) then compared to
Malaysia peat in order to investigate the similarity potential.
Overall, Hokkaido peat that had been studied has some similarities of peat
properties with Malaysia peat especially in West region including Johor peat.
Therefore, it is expected the research finding could be also applied on Johor peat in
future. These similarities display in Table 2.1 and Figure 2.23 which is shows the
whole comparison between Malaysia and Hokkaido peat. Studied peat can be
categorized as hemic with high ash and lightly acidic peat. This chapter results also
lead to a better understanding of the performance of Japan and Malaysia peat for
better geotechnical design in future.

42
2.4 References
[1] Noto, S., 1991. Peat Engineering Handbook. Civil Engineering Research Institute,
Hokkaido Development Agency, Prime Minister's Office,Japan.
[2] Zainorabidin, A. and Wijeyesekera, D.C., 2007. Geotechnical Challenges with
Malaysian Peat. Proceedings of the AC&T, pp.252-261.
[3] Zainorabidin, A., Wijeyesekera, D.C. and Mohd Masirin, M.I., 2007.
Comparative Study of British And Malaysian Peat Soils Pertaining To
Geotechnical Characteristics. Sri lankan Geotechnical Society, University of
Arizona (Tucson) and ISSMGE.
[4] Andrejko, M.J., Fience, F. and Cohen, A.D., 1983. Comparison of ashing
techniques for determination of the inorganic content of peats. Testing of
peats and organic soils, ASTM Special Technical Publication nr. 820, 5-20.
[5] Landva, A.O., Korpijaako, E.O. and Pheeney, P.E., 1983. Geotechnical
classification of peats and organic soils. Testing of peat and organic soils,
ASTM Special Technical Publication nr. 820, 37-51.
[6] Loughlin, C.D. and Lehane, B.M., 2003. A Study of the link between
composition and compressibility of peat and organics soil. In Proceedings of
2nd International Conference on Advances in Soft Soil Engineering and
Technology, ed. Huat et al, pp.135-152 Putra Jaya, Malaysia.
[7] Jarrett, P.M., 1995. Site investigation for organic soils and peat. Geoguide 6. JKR
Document 20709- 0341-95. Public Works Department Malaysia. Malaysia.
[8] Leong, E.C. and Chin, C.Y., 2000. Geotechnical Characteristics of Peaty Soils in
Southeast Asia. In Proceedings of GeoEngineering, Melbourne, Australia.
[9] Jarret, P.M., 1997. Recent development in design and construction on peat and
organic soils. In Proceedings of Recent Advances in Soft Soil Engineering,ed.
Huat and Bahia, pp.1-30.Sarawak.
[10] Leete, R., 2006. Malaysia peat swamp forest conservation and sustainable use.
Publised by United Nations Development Programme Malaysia,. Ministry of
Natural Resources and Environment, Malaysia.

43
[11] Huat, B.K., Maail, S. and Mohamed, T.A., 2005. Effect of Chemical
Admixtures on the Engineering Properties of Tropical Peat Soils. American
Journal of Applied Sciences, 2(7): 1113-1120.
[12] Huat, B.K., Sew, G.S. and Ali, F.H., 2004. Organic and Peat Soils Engineering.
Serdang, University Putra Malaysia, Press, ISBN Number: 983-2871-08-5.
[13] Kamarudin, A. and Lulie, M., 1999. Management practices for sustainable
cultivation of crop plants on tropical peatland. In Proceedings of the
International Symposium on tropical peatlands, pp. 119-134, Bogor,
Indonesia.
[14] Jamil, M.A., Chow, W.T., Chan, Y.K. and Yew, S.K., 1989. Land use of Peat in
Peninsular Malaysia. Proc. of the Nat. Workshop on Peat Research and
Development, MARDI, pp. 27- 39.
[15] Asadi, A., Huat, B.B.K., Hanafi, M.M., Mohamed, T.A. and Shariatmadari, N.,
2009. Role of organic matter on electroosmotic properties and ionic
modification of organic soils. Geosciences Journal, 13(2): 175-181.
[16] Hartlen, J. and Wolski, J., 1996. Embankments on organic soils. Elsevier.
[17] Mutalib, A.A., Lim, J.S., Wang, M.H. and Koonvai, L., 1991. Characterization,
distribution and utilization of peat in Malaysia. In Proceeding of International
Symposium on Tropical Peatland 6 - 10 May 1991, 7-8. Sarawak.
[18] Yulindasari, I., 2006. Compressibility characteristics of fibrous peat soil, Master
Dissertation, Universiti Teknologi Malaysia, Malaysia.
[19] Said, J.M. and Taib, S.N.L., 2009. Peat stabilization with carbide lime.
UNIMAS- E- J. Civil Eng., 1: 1.
[20] http://www.grida.no/graphicslib/detail/peat-distribution-in-the-world_8660,
[21] Hamamoto, S., Dissanayaka, S., Kawamoto, K. and Komatsu, T., 2010. Effects
of Moisture Content and Shrinkage on Soil-Thermal Properties for Peat Soils
in Japan. International Conference on Sustainable Built Environment
(ICSBE), Kandy, Sri Lanka, pp. 53-57.
[22] Hayashi, H., Nishimoto, S. and Takahashi, M., 2011. Field Performance of PVD
Combined With Reinforced Embankment on Peaty Ground. Soils and
Foundation, Japanese Geotechnical Society, Vol. 51, No. 1, 191-201, Feb.
2011.

44
[23] Huat, B.K., Prasad, A., Asadi, A. and Kazemian, S., 2014. Geotechnics of
Organic Soils and Peat. Technology & Engineering. CRC Press, London, UK,
250 pp.
[24] Kazemian, S., Asadi, A. and Huat, B.K., 2009. Laboratory study on
geotechnical properties of tropical peat soils. Int. J. Geotechnics Environ., 1:
69-79.
[25] Al-Raziqi, A.A., Huat, B.K. and Munzir, H.A., 2003. Index Properties of Some
Tropical Peat and Organic Soils. In Proceedings of 2nd International
Conference on Advances in Soft Soil Engineering and Technology,2-4July
2003, ed. Huat et al, 183-190.Putra Jaya, Malaysia.
[26] Lin, T.B., 2011. Revitalization of Organic and Peat Soils, Universiti Tun
Hussein Onn Malaysia, Malaysia.
[27] Huat, B.K., Kazemian, S., Prasad, A. and Barghchi, M., 2011. State of an art
review of peat: General perspective. International Journal of the Physical
Sciences Vol. 6(8), pp. 1988-1996, 18 April, 2011.
[28] Ajlouni, M.A., 2000. Geotechnical properties of peat and related engineering
problems, PhD Dissertation, University of Illinois at Urbana-Champaign. 15-
189.
[29] Skempton, A.W. and Petley, D.J., 1970. Ignition loss and other properties of
peats and clays from Avonmouth, King’s Lynn and Cranberrry Moss.
Geotechnique, 20 (4): . 343-356.
[30] Tang, B.L., Bakar, I. and Chan, C.M., 2011. Reutilization of Organic and Peat
Soils by Deep Cement Mixing. International Journal of Environmental, Earth
Science and Engineering, Vol:5 No:2.
[31] Zainorabidin, A. and Bakar, I., 2003. Engineering properties of in-situ and
modified hemic peat soil in Western Johor. In Proceedings of 2nd
International Conference on Advances in Soft Soil Engineering and
Technology,2-4 July 2003, ed. Huat et al, 173-182.Putra Jaya, Malaysia.
[32] Hobbs, N.B., 1986. Mire morphology and the properties and behaviour of some
British and foreign peats. Quart. J. of Eng. Geol., (19), 7-80.
[33] Davis, J.H., 1997. The peat deposits of florida: their occurrence, development
and uses. Florida Geological Survey. Geol. Bull., 3.

45
[34] Bell, F.G., 2000. Engineering Properties of Soils and Rocks. Malden, MA,
Blackwell Science. 1st ed., pp 1-496.
[35] Kazemian, S. and Huat, B.K., 2009. Compressibility characteristics of fibrous
tropical peat reinforced with cement column. Electronic J. Geotech. Eng.,
14E: 1-8.
[36] Boelter, D.H., 1968. Important physical properties of peat materials.
Proceedings of the Third International Peat Congress. Quebec, Canada. 150-
156.
[37] Kalantari, B., Prasad, A. and Huat, B.B.K., 2012. Use of cement, polypropylene
fibers and optimum moisture content values to strengthen peat. International
Journal of Physical Sciences, 7(8): 1276 - 1285.
[38] Wong, L.S., Hashim, R. and Ali, F., 2011. Unconfined compressive strength
characteristics of stabilized peat. Scientific Research and Essays, 6(9): 1915-
1921.
[39] ASTM-D2166, 2005. Standard Test Method for Unconfined Compressive
Strength of Cohesive Soil. American Society for Testing and Materials
Standards, Pennsylvania, USA, Volume 04.08.
[40] Axelsson, K., Johansson, S.E. and Anderson, R., 2002. Stabilization of Organic
Soils by Cement and Puzzolanic Reactions- Feasibility Study, Swedish deep
stabilization Research Centre, Report 3, English translation.
[41] Mesri, G., Stark, T.D., Ajlouni, M.A. and Chen, C.S., 1997. Secondary
compression of peat with or without surcharging. J. Geotech. Geoeviron.
Engr., 123(5):411-421.
[42] Wong, L.S., Hashim, R. and Ali, F., 2013. Improved strength and reduced
permeability of stabilized peat: Focus on application of kaolin as a pozzolanic
additive. Construction and Building Materials, 40: 783-792.
[43] Tremblay, H., Duchesne, J., Locat, J. and Leroueil, S., 2002. Influence of the
nature of organic compounds on fine soil stabilization with cement. Canadian
Geotechnical Journal, 39(3): 535-546.
[44] ASTM, 2005. American Society of Testing Materials, Annual Book of ASTM
Standards, Soil and Rock (I): D 420 - D 5611, Vol. 04.08.

46
CHAPTER 3
CLARIFYING AN EFFECTIVENESS OF SUGARCANE
BAGASSE ASH (SCBA) UTILIZATION ON THE
STRENGTH OF STABILIZED PEAT
3.1 Introduction
Due to high organic content, presence of humic acid and less solid particles in
peat, cement alone is inadequate as a chemical admixture for this ground stabilization
except a large quantity of cement is mixed. Sugarcane production is world number
one commodities and produced a lot of bagasse. Bagasse is burnt to generate power
required for diverse activities in the factory and leave bagasse ash as a waste.
Increasing concern of disposal of bagasse residual creates interest to explore the
potential application of this material.
This chapter emphasis on laboratory investigation on the application of
Sugarcane Bagasse Ash (SCBA) to maximize the filler and pozzolanic effects on the
strength of stabilized peat. Other than SCBA, calcium chloride (CaCl2), Ordinary
Portland Cement (OPC) and silica sand (K7) were used as additives to stabilize the
peat sampled from Hokkaido, Japan. To develop the optimal mix design, specimens
of stabilized peat were tested in unconfined compression. In order to clarify an
effectiveness of SCBA in peat stabilization, some factors that affect the pozzolanic
reactivity of stabilized peat were considered. These factors are OPC-SCBA
composition, duration of curing in water, OPC dosage, K7 dosage and preloading
effects. The flowchart of this chapter implementation is displays in Figure 3.1.

47
3.2 Literature review
Introduction
Peat is considered as challenging soils in the view of design parameter and
always associated to low bearing capacity, poor strength characteristics, large
deformation, high compressibility, and high rates of creep [1-5]. Shear strength is
considered as one of the most important fundamental property required in
geotechnical design and analysis. Shear strength always plays a vital role when
dealing with soil especially during pre and post-construction since it is used to
evaluate the foundation and slope stability of soil [1; 6; 7].
CHAPTER 3: Clarifying an Effectiveness of Sugarcane Bagasse
Ash (SCBA) Utilization on Peat Strength
Unconfined Shear Strength (UCS):
Determination of optimum SCBA inclusion as
partial replacement of cement
· Effect of SCBA compositions
· Two phase PCB mixture model
UCS: Investigation of multi-effect factor
of stabilized peat
· Effect of curing time
· Effect of OPC dosage
· Effect of K7 dosage
· Effect of preloading during curing
· Effect of CaCl2
Optimum mixtures
selected
Figure 3.1: Execution planning of Chapter 3
The shear strength properties of soil are normally determined by unconfined
compression tests, triaxial tests or the fall-cone test [8]. Due to the soil low
permeability and high stiffness, unconfined compression tests often provide

48
relatively fast and cheap means of determining the soil strength [9]. In recent years,
unconfined compressive (UCS) test become popular in determine the strength of
untreated and stabilized peat in the laboratory [8-15]. The other common laboratory
test is direct shear test in determining the drained shear strength of fibrous peat.
Triaxial test is frequently used for evaluation of shear strength of peat in the
laboratory under consolidated-undrained (CU) conditions. This is due to the fact that
the results of triaxial test on fibrous peats are difficult to interpret because fiber often
act as horizontal reinforcement, so failure is seldom obtained in a drained test [1].
Generally, results from the simple shear tests give lesser strength than triaxial
compression tests because of the fiber orientation (typically horizontal) relative to the
shear plane. It is expected the deduction due to this effect could be as much as 25%
[16]. Due to several advantages of UCS tests to stabilized peat as described above,
this test were chosen and applied in this study.
The effective internal friction, ø’ of peat is generally higher than inorganic
soil. However, fibrous peat (normally at shallow depth) showed values of c and the
angle of friction higher compared than other peat types (e.g. hemic and sapric). [7;
17-19]. The high friction angle of peat not actually reflects high shear strength as a
result of the fact that the fibers are not always solid and may be filled with water and
gas. The presence of fibers will modify the strength behavior of peat since the fibers
can be considered as reinforcement and the fibers can provide effective stress where
there is none and it induces anisotropy[1]. The fibers can influence the strength of
peat in that the shear resistance continues to develop at high strain values without a
significant peak behavior and will exhibit K0 values decrement compared to that of
clays [20].
Peat improvement methods
Conventionally, the normal practice is to avoid peat ground, or excavate (cut
and fill or replacement method) or drive pile through them [17]. However due to
dearth of suitable land for infrastructure development and agriculture, evasion of
construction on poor lands such as organic and peat land is no longer option anymore.
Replacement method (Figure 3.2) will make large scale disposal of peaty soils in

49
unacceptable amount in future [21]. Excavation and replacement of the peat below
the road line is the safest option for constructing, or improving, a road over peat
other than by avoidance. In this method all of the weak materials under the road line
are excavated out to a suitable firm layer and the embankment constructed on the
exposed sound foundation, preferably with non-cohesive material locally won on site.
However, the actual economic at a particular construction location will depend on the
local parameters for example the type of peat, the depth of peat, the area of peat, the
cost of the backfill material and availability of disposal areas [22]. Disposal of poor
quality surplus material can be regarded as one of the most significant environmental
problems in construction. The other disadvantages of this method are the difficulties
in excavation and placing fill below water table. Normally demands high quality of
fill material (low percentage of fines). Deep excavations may have effects on
adjacent lands and structures. Unexcavated soft material below embankment may
cause future settlements [22; 23]. Structures on peat that suspended on piles normally
give deposition effect to surrounding ground [24] like shown in Figure 3.3. Currently,
the utilization of peat land in Malaysia is quite low although construction on
marginal land such as peat has become increasingly necessary for economic reasons.
Engineers are reluctant to construct on peat because of difficulty to access the site
and other problems related to unique characteristics of peat. Thus, not much research
has been focused on the development of soil improvement method for construction
on peat [25].
Figure 3.2: Replacement (cut and fill) method on the peaty ground [22]
There are a number of improvement options that can be applied to peat
especially for road construction, namely: excavation-displacement or replacement;
left in place such as strength improvement (e.g. preloading- Figure 3.4), load

50
modification- Figure 3.5 (e.g. slope reduction, berms, lightweight fill),
reinforcement- Figure 3.6 (e.g. geotextiles, geogrid, timber raft, and steel mesh),
vertical drainage, piling, stabilization (e.g. in-situ chemical admixtures). These
chemical admixtures can be applied either as deep in situ mixing method (cement
columns), or as surface stabilizer (mass stabilization) and this method considered as
economical and time saving option [20; 22; 26-28].
Figure 3.3: Usual section of construction on peat: Immediately after completion of
structure (above) and after several years of construction completion (below)
Figure 3.4: Peat improvement by preloading method [22]
Chemical admixture method in peat stabilization
Chemical admixtures or chemical stabilization always involves treatment of
the soil with some kind of chemical compound, which when added to the soil, would
result in a chemical reaction. This method has been extensively used in both shallow

51
and deep stabilization in order to improve inherent properties of the soil such as
strength and deformation behavior. Lime or cement has commonly been used as
chemical admixtures for soil stabilization and mixing method to improve the
properties of soils since olden times. However in the case of tropical peat, little is
known about it responding to chemical admixtures such as cement and lime [24; 29;
30].
Figure 3.5: Peat improvement by load modification method [22]
Figure 3.6: Peat improvement by reinforcement method [22]

52
The use of cement and its capability in inorganic soil stabilization is very
popular since long time ago. Nevertheless, the use of cement is not given much
attention in the stabilization of organic soils because evasion is often become the first
choice rather than build up any infrastructure on these problem land. However, over
the past few years, there are researchers who began to observe the ability of the
cement in the stabilization of organic soil [8; 10; 11; 24; 31-35]. From the literature
review on peat stabilization by chemical admixtures, cement mixtures usually gives
the better results than lime [11; 24]. Other than it potential as stabilizer, cement is
also considered as low cost admixtures compared to lime (Figure 3.7) and ease of
storage in a hot and humid climate such as Malaysia [36].
Figure 3.7: Cement and lime prices comparison for Malaysia market [36]
Peat mass stabilization method
In recent years, one of the popular peat improvement techniques that get
attention is mass stabilization by use cement as a main binder (Figure 3.8). One of
the limitation of this stabilization practice is the depth of peat should not more than
5m. However this constraint may be able to be a great approach for peat stabilization
in oil palm plantation since peat ground under oil palm estate is very suitable at peat
depth that not more than 3 meter [37]. As stated by Allu [38], mass stabilization is
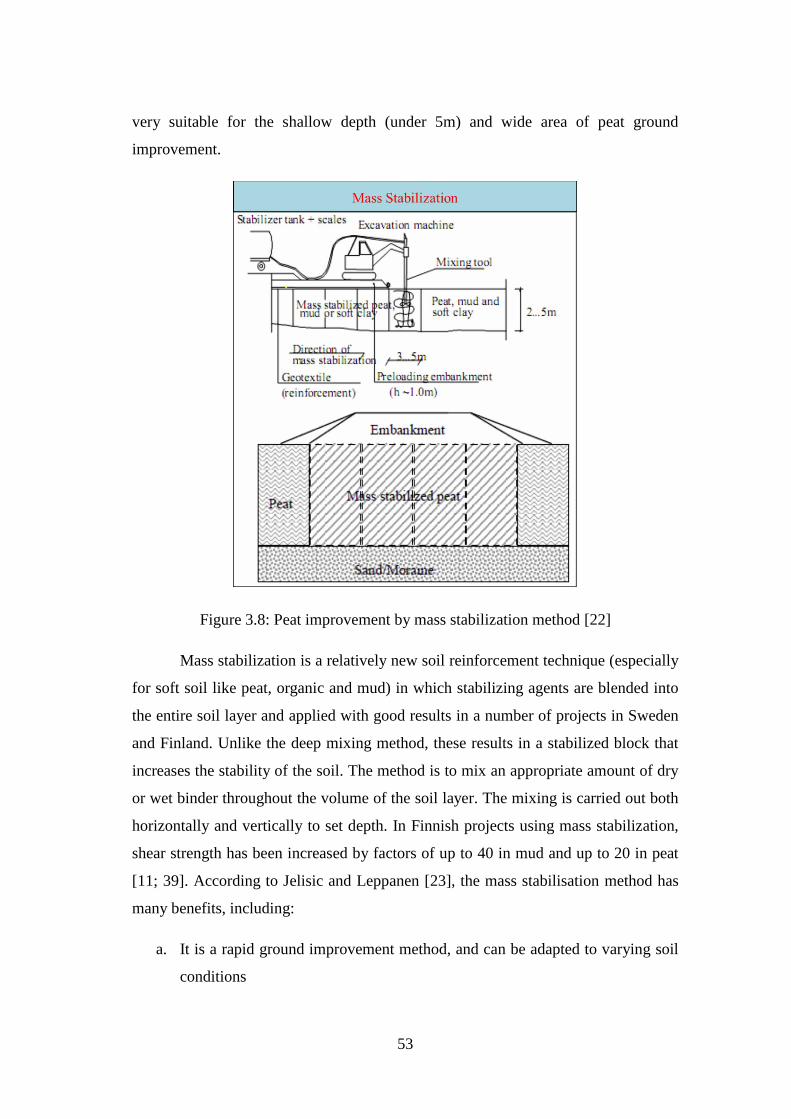
53
very suitable for the shallow depth (under 5m) and wide area of peat ground
improvement.
Figure 3.8: Peat improvement by mass stabilization method [22]
Mass stabilization is a relatively new soil reinforcement technique (especially
for soft soil like peat, organic and mud) in which stabilizing agents are blended into
the entire soil layer and applied with good results in a number of projects in Sweden
and Finland. Unlike the deep mixing method, these results in a stabilized block that
increases the stability of the soil. The method is to mix an appropriate amount of dry
or wet binder throughout the volume of the soil layer. The mixing is carried out both
horizontally and vertically to set depth. In Finnish projects using mass stabilization,
shear strength has been increased by factors of up to 40 in mud and up to 20 in peat
[11; 39]. According to Jelisic and Leppanen [23], the mass stabilisation method has
many benefits, including:
a. It is a rapid ground improvement method, and can be adapted to varying soil
conditions
54
b. It is in most cases economically efficient and saves materials and energy.
c. It improves the engineering properties of the soil and can be flexibly linked
with other structures and with the surroundings (no harmful settlement
differences)
d. Transfer of the natural soil elsewhere is not needed, so there is less
transportation and traffic pollution and no need for disposal sites and offsite
transport.
Mass stabilization method is suitable for reduction of settlement and for
improvement of stability of soft ground and is applicable in infrastructure projects
like roads and railways. It is also used for foundation of smaller buildings and
bridges, and for stabilization of excavations, lagoons and natural slopes. In general,
the method is found technically, economically and environmentally favorable
compared to other alternatives [39]. In obtaining effectiveness of this method, some
stabilizing factors should be taken into account and carefully observed. There are
cement dosage (sometimes together with accelerator), pozzolana (e.g. fly ash to
enhance the secondary pozzolanic reaction), filler (e.g. fine sand to increase solid
particles in peat), temperature, curing duration and preloading during curing [11; 31;
40; 41].
3.3 Methodology
Description of materials
Figure 3.9 shows the materials that had been used in this study. There are
peat, Ordinary Portland Cement (OPC), silica sand so called K7, calcium chloride
(CaCl2) and Sugarcane Bagasse Ash (SCBA). The site of the peat under study is
located at Sapporo in the Hokkaido region, Japan. Peat was excavated approximately
to a depth of 1 m below the ground surface in order to obtain samples for laboratory
experimental. Two types of SCBA samples were obtained from Kagoshima
prefecture in Kyushu, Japan. One type is expected to be a high quality pozzolan than
other one. The 3rd type of SCBA was created by mixing both, high and low quality of
collected SCBA’s. Other than OPC as main binder and CaCl2 as cement accelerator,

55
well graded silica sand (K7) was prepared as a filler to increase the solid particles
and enhance the filling effect of the stabilized peat.
Figure 3.9: All study materials: Hokkaido peat, OPC, K7, CaCl2, SCBA
Mixing designs of laboratory test
In order to ensure the safety and the quality of the final stabilized product, a
number of stabilization tests must be carried out in the laboratory beforehand to
establish the most suitable stabilizers, to optimize the quantity of stabilizer and to
assess strength-deformation properties of the stabilized soil for the actual case. A
new laboratory testing procedure has been introduced for peat so that the actual
loading conditions in the field can be simulated in laboratory [23]. About 50-70 % of
the total costs in stabilization project are caused by the binder. By careful laboratory
work the suitable binder and its optimized quantity [in kg/m3] is selected and thus
considerable savings are reached [38].
In order to clarify an effectiveness of SCBA in peat stabilization, some
factors that affect the pozzolanic reactivity of stabilized peat were considered. These
factors are OPC-SCBA composition, duration of curing in water, OPC dosage, K7
dosage and preloading effect. The selection of these factors is based on the literature
review [8; 10; 34; 38; 41]. The mix designs of stabilized peat for laboratory testing
are shown in Table 3.1. These mix designs were implemented to all SCBA types.
The basic mixtures were produce by include OPC and K7 dosage at 300 kg/m3 and
500 kg/m3 respectively. These mixtures then cured under 20 kPa of air pressure for 7
days. These admixtures amount would change depend on the purpose of
investigation as described in Table 3.1.

56
Table 3.1: Laboratory mix design
No. of
testType of test Description of test purpose
Curing
durations
(days)
Initial
pressure
(kPa)
OPC dosages
(kg/m3)
K7 dosages
(kg/m3)
CaCl2
dosages
(%)
Mixtures compositions
1 UCS , pH, w
To investigate the effect of
binder composition on the
tested specimens
7 20 300 500 3
100% OPC @ PC
95%OPC:5%SCB @ PCB-5
90%OPC:10%SCB @ PCB-10
85%OPC:15%SCB @ PCB-15
80%OPC:20%SCB @ PCB-20
75%OPC:25%SCB @ PCB-25
70%OPC:20%SCB @ PCB-30
65%OPC:25%SCB @ PCB-35
2 UCS , pH, w
To investigate the effects
curing duration on the tested
specimens
7, 14, 21,
28, 6020 300 500 3
The optimum binder
composition from test (1)
3 UCS, pH, w
To investigate the effects of
initial pressure on the tested
specimens
70, 20, 40,
60, 80, 100300 500 3
The optimum binder
composition from test (1)
4 UCS , pH, w
To investigate the effect of
binder dosage on the tested
specimens
7 20100, 150, 200,
250, 300500 3
The optimum binder
composition from test (1)
5 UCS , pH, w
To investigate the effect of
silica sand (filler) dosages on
the tested specimens
7 20 3000, 100, 200,
300, 400, 5003
The optimum binder
composition from test (1)
6 UCS , pH, w
To investigate the effect of
CaCl2 dosages on the tested
specimens
7 20 300 500 0, 1, 2, 3, 4The optimum binder
composition from test (1)
57
Laboratory sample preparation procedures
The mix designs of stabilized peat were formulated in term of binder
composition and dosage as conducted by EuroSoilStab [15]. A total of 140 samples
of stabilized peat were prepared for all three types of SCBA. Each admixture consists
of 3 samples in order to keep results consistency and reliability. Each binder dosage
was determined based on the bulk density of peat that remoulded at its average
natural water content.
Initially, cylinder mould for the mixtures was prepared (Figure 3.10). Each
cylinder mould has a size of 60 mm internal diameter and 300 mm height. One of the
important factors of mould preparing is to calibrate the friction between mould cell
inner wall and the piston block that occurred during curing under a certain subjected
pressure. The calibration of these was conducted by comparing the magnitudes of the
applied pressure and the corresponding pressure response at the bottom of the cell.
The lubricant oil was applied at first to the wall and the side of piston block before
the test implemented. In this study, air pressure had been used rather than iron rod in
conventional method [8; 11; 23; 38] with the aim of the field preloading simulation.
The air pressures with magnitudes of 20, 40, 80 and 100 kPa were subjected to the
piston block in the mould cell consequently (Figure 3.10). This test had been
conducted on three random mould cells in order to get an average response pressure.
As shown in Figure 3.11, the response pressure shows the slight low reading
compared to applied pressure which means the friction between cell wall and piston
block exist. However, this friction can be neglected since the graph trendline results
is approach to perfect line with R2 is almost 1.
In producing each admixture, a mixer was used to intimately mix the peat
with other materials for 10 minutes. At first 3 minutes, the admixtures were mixed
without peat by using standard kitchen mixer. For another 7 minutes the all materials
were mixed and by using hybrid mixer. The process of mixing was displayed in
Figure 3.12. The main part of the special mixer is driller that combined with kitchen
mixer blade. In order to maximize the homogenization of samples mixing, regulator
has been used on this special mixer and set to the constant power. Preparation of
each test specimen of stabilized peat for unconfined compression test will be done by

58
filling and tamping the stabilized soil admixture in five equal layers in the cylinder
mould as shown in Figure 3.13. Then the piston was lubricated and pushed gently to
rest at the upper mixture surface. The remaining area between the cells caps then
filled with the water for the safety purpose. After that, cell was screwed once again
by the mould lid before it immersed in a water container for curing (Figure 3.13) at
specified duration under an initial pressure by using air pressure to simulate the
surcharge pressure on the stabilized soil at site.
Figure 3.10: Mixtures mould cell parts (left) and the cell calibrations method (right)
Figure 3.11: Sample mould cells friction test results

59
Figure 3.12: Mixing tools and method
Figure 3.13: Samples filling and curing method
Figure 3.14 presents the schematic diagram that shows the detail arrangement
of sample curing under air pressure. This method can be considered as a new

60
technique for curing the sample under pressure since the conventional method
(Figure 3.15) was using iron cylinder as a load pressure [8; 38]. Once the mixture
cured, the cylinder tube is removed and the test specimen is trimmed to the required
size for testing by using special sample extruder and cutter (Figure 3.16). To evaluate
the degree of improvement, the established parameters of the stabilized soil must be
compared to those of untreated peat.
Figure 3.14: Schematic diagram of sample curing under air pressure
Figure 3.15: Conventional method in making, loading and testing of stabilized peat

61
Figure 3.16: Sample extruder and cutter
3.4 Results and discussions
Materials properties
Table 3.2 demonstrates the percentages of oxide compounds of the materials
and peat that used in this study. These results were obtained from EDX test. It is
noticeable that the peat has very low contents of pozzolanic minerals as described in
Chapter 2. The OPC is predominantly characterized by 65.4% CaO, 10.26% SiO2,
6.6% Al2O3 and 5.57 Fe2O3. Based on a review, OPC is primarily characterized by
quicklime (CaO), silica (SiO2), alumina (Al2O3) and ferric oxide (Fe2O3) [42]. With
content about 93% of SiO2, it can be confirmed that quartz is the main mineral in the
K7 silica sand. For SCBA 1 and SCBA 2, it was found that the summation of the
crucial pozzolanic oxide compounds (SiO2, Al2O3 and Fe2O3) is around 72% and
74% of the total oxide compounds. These results point out the suitability of used
SCBA’s as a pozzolan since the amount of such oxide compounds exceeds 70% as
recommended by ASTM C618 Standard [43].
The particle size distribution of the peat and other materials are tabulated in
Figure 3.17. The untreated peat particle size distribution curves result was briefly
deliberated in Chapter 2. For materials grain size, most of K7 particles sizes are 0.05
to 0.3mm in range. The SCBA 1, SCBA 2 and SCBA 3 particles consist about 80%,
15% and 60% finer than 0.045mm (passing No. 325 sieve) respectively. This result

62
also indicates that SCBA 1 is finer than SCBA 2 and SCBA 3 with average particle
size are (D50) around 18, 260 and 27 µm individually. Based on Figure 3.17, SCBA 3
particle size seems approach the SCBA 1 curves results especially in finer region.
Although this SCBA is actually created by fair combination of SCBA 1 and SCBA 2,
the finer results gained is probably because of mixing effect that contributes by mixer
blade and duration. According to ASTM C 618 Standard [43], volume fraction of
more than 66% of particles smaller than 45 µm is good for a pozzolanic material and
this limit achieved only by SCBA 1 as proved in Table 3.3. Figure 3.18 had been
created in order to simplify the results that obtained from Table 3.3. Clearly from this
Figure 3.18 that only SCBA 1 passes the entire minimum requirement that assigned
by ASTM [43] where the water contents, loss on ignition and sulfur oxide of
pozzolan materials should not exceed 3, 6 and 5% respectively. Therefore, in this
assessment, it can be understood that SCBA 1 has better quality than other SCBA in
peat stabilization especially the contribution made by its fine particle size.
Table 3.2: Oxide compounds of peat and materials
CO2 86.14 - - - - -
CaO2 1.10 65.21 0.65 7.70 2.53 5.40
SiO2 4.64 21.55 70.18 57.38 70.53 55.07
Al2O3 3.09 3.82 19.30 10.19 1.65 8.36
Fe2O3 2.07 1.28 0.17 4.07 2.24 4.32
Na2O 0.76 1.51 0.00 1.71 0.51 0.73
MgO 0.95 1.97 0.42 1.23 1.22 2.02
P2O5 0.27 0.87 7.29 4.33 7.62 6.36
SO3 0.54 1.68 0.67 1.47 0.15 2.42
K2O 0.45 1.29 0.53 10.98 12.74 14.38
TiO2 0.00 0.82 0.78 0.93 0.82 0.91
Total 100.0 100.0 100.0 100.0 100.0 100.0
Oxide
Compound, %
Untreated
peatOPC
Sand
(K7)SCBA 1 SCBA 2 SCBA 3

63
Figure 3.17: Particle size distribution of peat and materials
Table 3.3: Requirement of pozzolan materials results for all SCBA
0
20
40
60
80
100
0.0001 0.01 1
Per
cen
t fi
ner
, %
Particles size, mm
Peat
K7
OPC
SCBA 1
SCBA 2
SCBA 3
Sources Test results Requirements SCBA 1 SCBA 2 SCBA 3
w, % Less than 3% 2.89 35.67 16.27
LOI, % Less than 6% 3.91 9.93 6.91
Passing 45µm, % ≥ 66% 85 15 62
D50, mm 0.018 0.260 0.027
SO3 Less than 5% 1.47 0.15 2.42
CaO 7.70 2.53 5.40
Al2O3 10.19 1.65 8.36
SiO2 57.38 70.53 55.07
Fe2O3 4.07 2.24 4.32
SiO2+Al2O3+Fe2O3 ≥ 70% 71.64 74.42 67.75
CaO/SiO2 0.134 0.036 0.098
Laboratory
test
SEM &
EDX test

64
Figure 3.18: Comparison of all SCBA properties as pozzolan
Effect of partial replacement of Ordinary Portland Cement (OPC) with
sugarcane bagasse ash (SCBA)
Figure 3.19 displays the experimental results of the effect of all types of
SCBA percentage replacements on the UCS of the stabilized peat. The detail
determination of UCS and its average reading were shown in Appendix B and
Appendix D. An optimal UCS of the stabilized soil was evaluated based on the
results of unconfined compression tests on the specimens of stabilized peat with
partial replacement of the cement with SCBA that varies from 5% to 35% as shown
in Table 3.1. However for SCBA 2 and SCBA 3, replacement percentage only done
until the substitute amount achieved 25%. This is because the peak strength results
shown for both SCBA are found at 5 and 10% replacement and continuously drop
when the cement are reduces as much as 25%. It can be detected that the test
specimen with 20% partial replacement of OPC with SCBA 1 (PCB1-20) has the
highest UCS of 387 kPa and was discovered to be about 30 times better than
untreated peat and approximately 1.2 times greater than UCS of PC specimen (Figure
3.19). On the other hand, SCBA 2 mixture achieves the optimum at only 5% of
cement replacement (PCB2-5) and recorded slight increment compared to PC
specimen. It seems SCBA 3 mixture recorded a little lower strength than SCBA 1
0
10
20
30
40
50
60
70
80
90
Si+Al+Fe >45µm w LOI SO
Per
cen
tag
e, %
SCBA 1 SCBA 2 SCBA 3
Min Max
ASTM-
C618

65
mixtures but it achieved an optimum at only 10% cement replacement (PCB3-10).
This may cause by combination properties between two main SCBA’s in SCBA 3
development especially influence by SCBA 1 grain characteristic as proved in Figure
3.17. As stated by ASTM D4609 [44], an increase in UCS of 345 kPa (adopted as
minimum UCS target in this study) or more must be reached for a treatment to be
considered effective.
The main reasons why PC mixture gave lesser strength than optimum mixture
of SCBA 1, SCBA 2 and SCBA 3 are because peat consists of high organic content
and less solid particles as showing in Table 3.2. Organic soils can retard or prevent
the proper hydration of cement in soil mixtures and become insufficient to provide
the required function for peat stabilization. Matched to clay and silt, peat has a
considerably lower content of clay particles that can enter into secondary pozzolanic
reactions [10; 40]. The combination of humic acid with calcium ions produced in
cement hydration makes it difficult for the calcium crystallization, which is
responsible for the increase of peat-cement mixture strength to take place [31].
3C S H CSH CH (3.1)
CH Pozzolan H CSH or / and CASH (3.2)
Generally, chemical reactions between cement and pozzolan with water are
denoted in Eqn. 3.1 and Eqn. 3.2. Calcium silicate hydrates (CSH) or also known as
tobermorite gels together with calcium hydroxide (CH) are formed when cement
reacts with water (H) in peat. The CSH act as adhesive that binds and grasp the soil
particles together. Nevertheless, humic acid in peat reacts with calcium ion to form
insoluble calcium humid acid. These conditions make the secondary pozzolanic
reaction between CH and the peat is inhibited and this renders a low strength gain in
the soil-cement mixture.
The fact that the test specimen of PCB1-20, PCB2-5and PCB3-10 has the
better UCS may be explained by a condition whereby it has achieved an optimal
effect of hydration reaction. By means of the inclusion of pozzolan such as SCBA in
the soil-cement mixture, hydration of cement is accelerated when the pozzolan reacts
with calcium hydroxide and water to form more secondary tobermorite gels along
with calcium alumina silicate hydrates (CASH) as shown in Eqn. 3.2. This is
probable because the pozzolan which contains extra silica and alumina that activated

66
by cement is able to counterbalance the acid and create an alkaline atmosphere that
boosts the secondary pozzolanic reaction within the cemented soil. Additional CSH
and CASH densify the stabilized peat, thereby further enhancing its strength [45].
Figure 3.19: Unconfined compressive strength of PCB mixtures compared to PC
mixture (top) and untreated peat (bottom)

67
Frequently, the pozzolanic effect depends not only on the pozzolanic reaction
but also on the physical or filler effect of the smaller particles in the mixture [42].
The positive result indicates that the optimal mix design can be effectively applied to
stabilize the peat in such a way that the fine particles of pozzolan fill up the pore
spaces of the cemented soil, thus closely packing, reinforcing and strengthening its
matrix as the hydration and pozzolanic products are formed during cement hydrolysis
[41].
Figure 3.20 shows the results of pH and water contents for all PCB mixtures
Generally, it can be seen that higher the pH seems gave better strength to specimens
while water content looks like rely on rate of hydration by vary OPC composition. At
peak point of all optimum PCB mixtures onwards, it seems clear decrease of the
samples pH and consequently dropping its strength. It is observed this decrement
pattern continuously occurred when the rate of cement content declined. In the other
hand, water contents show the increment as SCBA percentage rose. In the other
words, water consumption appears to increase as a percentage of cement is reduced.
This is believed because of low hydration and pozzolanic reaction contributed both
by SCBA inclusion and cement quantity. At 10% OPC replacement by SCBA, it was
observed that UCS obtained for PCB 3 is higher than PCB 1. This phenomenon
could be happened because of the SCBA reactivity amount and its grain size
distribution. The SCBA particle in the PCB 3 that non-reactive normally will act as
filler in mixtures which improve the stiffness (void filling) and strength of the mixing.
This non-reactive particle is believed contributed by SCBA 2 (low quality SCBA).
Since PCB 3 also comprise SCBA 1 particles, chemical effect was understood could
be enhance its strength together with physical effect by finest grain of SCBA 1. It is
well known that secondary pozzolanic reaction normally take place in later step and
in long term hydration. The results in this figure were only revealed the UCS gained
after 7 days curing. This is probably the reason why PCB 1 displays lower strength
than PCB 3 at 10% OPC replacement.

68
Figure 3.20: The results of pH (top) and water contents (bottom) for all PCB
mixtures
For an organic soil stabilization to be effective, the pH value of the stabilized
soil admixture must exceed 9. Tremblay et al. [46] stated that specimens with organic
acids producing pH lower than 9 in the pore solution strongly affect the development
of cementing products and also no strength gain was noted. However, they also

69
mentioned that pore solution more than 9 not always indicate great strength gain. In
the case of this study, for instance, although a pH value that exceeded the minimal
required pH of 9 was achieved by stabilized peat admixture at all PCB mixtures, an
unconfined compressive strength that exceeded the minimum target unconfined
compressive strength of 345kPa was only reached at a minimum pH about 12.5 with
maximum water contents about 85% (Figure 3.20). These occurrences happened
because when insufficient cement is added, hydration and pozzolanic reaction
become lower and effective neutralization of humid acids within the soil is not
achieved. This is due to the limited formation of primary cementation products to
bind the soil because the soil organic matter tends to retain the calcium ions
produced from cement hydrolysis, resulting in a limited amount of calcium
hydroxide that could react with silica and alumina of SCBA to yield secondary
pozzolanic products during the pozzolanic reaction. The acids may also cause the soil
pH to drop and this negatively affects the binder reaction rate, resulting in a slower
strength gain in peat [11].
Secant values of Young’s modulus of elasticity at 50% of the unconfined
compressive strength, E50, have been related to the unconfined compressive strength,
qu as shown in Figure 3.21. This relationship could be attained by dividing half of the
peak strength (qu/2) with the observed strain at the stress level in the UCS test. It was
detected from this figure that a value of the ratio of E50 to qu (E50/qu) for PCB 1
mixtures is greater than other mixtures and exceeds 50. From the literature review,
values of E50/qu for the dry method of deep mixing have been stated in the range
from 50 to 250 [47-49]. Figure 3.22 shows the relationship between strain at failure,
εf and unconfined compressive strength, qu for all optimum PCB mixtures. Obvious
difference was detected between PCB 1 and PCB 2 mixtures which are represent
high and low quality of SCBA respectively. This could be happened mainly because
of percentage of SCBA in mixtures. When more SCBA was inserted in mixtures,
ductile behavior was appeared. The different is PCB1 mixtures become ductile
slowly compared to PCB2 with SCBA increment. This probably could be occurred
because of the reactivity level of SCBA used in the mixtures. Higher reactivity
pozzolan is tending to take part in hydration process and as a result the mixtures
behavior is similar to the behavior of cement stabilized soil (generally shows the

70
brittle behavior). On the contrary, non-reactive pozzolan like SCBA 2 will act as soil
filler with limited hydration rate and finally make the mixtures more ductile.
Figure 3.21: Relationship between secant modulus at E50 and unconfined
compressive strength, qu for all optimum PCB mixtures
Figure 3.22: Relationship between strain at failure, εf and unconfined compressive
strength, qu for all optimum PCB mixtures
Based on the finding, the mixtures PC, PCB1-20, PCB2-5 and PCB3-10
corresponding to the optimal mix design was further applied to the remaining test
specimens of stabilized peat in the experiment on various stabilization factor.

71
Two phase model for peat-cement-bagasse (PCB) mixtures
It is become something beneficial when PCB mixtures strength property at
various percentage of SCBA inclusion could be estimated by knowing some
important characteristics of raw SCBA. This idea possibly could be achieved through
generalization of two phase mixtures model into studied PCB mixtures. Two phase
mixtures can be defined as the mixtures that consist of a basic and a supplementary
material which called a matrix and an inclusion. The concept in evaluate the
deformation modulus of PCB mixture were shown in Figure 3.23. In this study, PC
mixture that prepared in laboratory was considered as matrix while SCBA as an
inclusion which its mechanical properties were known.
Flow chart for obtaining deformation modulus of
PCB mixtures
PCB mixtures for
estimationSCBA as inclusion
PC mixtures prepared
in laboratory
PCB mixtures prepared
in laboratory
Unconfined
Compressive Test
Two phase
mixtures model
Measurement of
improvement rate
Deformation modulus,
E of PCB mixtures
Figure 3.23: The concept in evaluate the deformation modulus of PCB mixture
Young modulus of two phase mixtures in 1-D stress condition from previous
researcher [50-54] is represents by Eqn. 3.3 and Eqn. 3.4. For two phase model of
peat- cement-bagasse (PCB) mixtures, b could be represents the estimation stress
distribution while fs denote the SCBA inclusion percentage. The parameter Es and E*
indicate the deformation modulus of SCBA inclusion and PC mixture respectively.
Deformation secant modulus, E50, which is the compression stress-strain curve at a

72
half of maximum compressive stress is usually used as parameter for representing
unconfined compressive strength property. Therefore, the elastic moduli in Eqn. 3.3
correspond to the deformation moduli of the PCB mixtures as E= E50pcb, Es=E50s and
E*=E50*.
*
1 1
(1 )s
s s
s
b fE
f b f
E E
(3.3)
where;
1/2
*
sEb
E
(3.4)
The first step that had to be done with the intention of PCB mixtures
deformation modulus, E50pcb estimation is to determine the improvement rate of PC
mixtures after SCBA inclusion. Therefore the vital parameters to evaluate first are Es
and E*. As mentioned before, SCBA was considered as an inclusion and it
deformation modulus, Es will be assumed as constant (Eqn. 3.5). For E*, it was
expected that this values will increasing up to optimum PCB mixtures and gradually
dropped afterwards. For that reason, the proposed equation for E* is shown in Eqn.
3.6. By substituting Eqn.3.5 and Eqn. 3.6 into Eqn. 3.3 and Eqn. 3.4, Eqn. 3.7 and
Eqn. 3.8 were derived for E50pcb prediction.
constantsE (3.5)
* *
0 (1 )sE E f (3.6)
*
1 1
(1 )
(1 )
s
s s
s s
b fE
f b f
E E f
(3.7)
where;
1/2
*(1 )
s
s
Eb
E f
(3.8)

73
In Eqn. 3.6 to Eqn. 3.8, the main parameter is alpha (α). In this study, the α is
suggested as indicator of quality characteristic of SCBA that could be enhance the
filling (packing) and hydration effect of matrix until the optimum composition of
PCB mixtures attained. After the optimum point reached, it is assumed that the more
inclusion of SCBA will stop or decline the hydration effect in mixtures and
consequently E50pcb will decrease. As a result, α can be computed by Eqn. 3.9 and
Eqn. 3.10. The Eqn. 3.9 is considered valid when 0 < fs < fsopt while the Eqn. 3.10
with the range fsopt < fs < 1. However there some limitation in Eqn. 3.10 which when
fs is larger than fsopt and satisfy Eqn. 3.11, the α become zero.
0 optsf for (0 < fs < fsopt) (3.9)
1/4
0 1 1opt
opt
ss
s
ff
f
for (fsopt < fs < 1) (3.10)
0 when
1/4
1 1
opt
s
s
f
f
(3.11)
In order to determine αofsopt, the graph α vs fsopt (Figure 3.24) was developed
by taking the optimum point for each SCBA from Figure 3.25 that created by using
Eqn. 3.7. The α in Figure 3.25 were obtained by parametric study of this parameter in
order to predict optimum point for all PCB mixtures. Next step is estimating the
αofsopt from the Figure 3.24 (equal to graph trend line gradient) which from this study
the αofsopt = 15fs. This value then will be used in Eqn. 3.9 and Eqn. 3.10 before
replace the α in Eqn. 3.7 for predicting all E50pcb. With the intention of fsopt (optimum
percentage of SCBA inclusion) approximation, Figure 3.26 (fsopt vs PE/CE) was
developed and could be used. This graph was created base on the crucial
characteristic that is able to distinguish between the good and low quality of all used
SCBA. The characteristics were mainly focusing on physical effect, PE (e.g. D50) and
chemical effect, CE (e.g. CaO2/SiO2). Based on literature review [40; 42; 55; 56],
these two vital characteristics are believed become the main contributor of filling and
hydration effect in PCB mixtures.

74
Figure 3.24: Relationship between alpha coefficient, α and optimum SCBA inclusion,
fsopt
Figure 3.25: Relationship between alpha coefficient, α and SCBA inclusion, fs

75
Figure 3.26: Relationship between physical effects: chemical effects ratio of SCBA,
PE/CE and optimum SCBA inclusion, fsopt
The data and results of calculation/estimation of E50pcb versus experimental
E50pcb was summarized in Table 3.4 and Figure 3.27 for all PCB mixtures. Obviously,
the proposed calculation results seem very effective by presenting the good
agreement with the experimental PCB mixtures deformation modulus.
Table 3.4: The data of calculation/estimation of E50pcb versus experimental E50pcb
Mixtures PCB5 PCB10 PCB15 PCB20 PCB25
fs 0.05 0.1 0.15 0.2 0.25
PC mixtures E50*
E50s
E50pcb (lab) 15.20 19.40 21.20 24.80 17.80
E50pcb (est) 16.25 19.21 22.25 24.84 17.05
E50s
E50pcb (lab) 15.00 11.10 9.40 7.90 7.80
E50pcb (est) 15.13 11.68 10.55 9.56 8.69
E50s
E50pcb (lab) 15.80 19.60 14.00 11.09 9.70
E50pcb (est) 15.83 18.22 13.35 11.17 10.49
SCBA 3
4.10
14.50
SCBA 1
7.60
SCBA 2
2.08

76
Figure 3.27: The results of calculation/estimation of E50pcb versus experimental E50pcb
Effects of duration of curing in water
It can be observed from Figure 3.28 that the UCS of all optimum PCB
mixture specimens increased while increasing the duration of curing in water. When
the surcharge of 20 kPa was applied, the UCS of test specimens increased
progressively at the curing time in water of 7, 14, 21, 28 and 60 days for PC and PCB
mixtures. It is evident from the findings that the duration of curing in water
influenced the UCS of test specimens. All PCB mixtures show the slow increment
compare to PC mixtures and overall PCB 1 mixtures shows the higher positive
results. However, it is clear that after 7 to 14 days of curing, UCS of PCB2-5 and
PCB3-10 mixtures become lesser than PC mixture and this trends looks continuously
till 2 month of curing. This results shows the good agreement with the fact that
cement hydration (PC mixtures) is normally rapid and effective at first month but
almost stop or complete after that duration while pozzolan reaction can be occurred
continuously until several month or even years [8; 38; 45]. Therefore it is plainly
indicate that the quality of selected SCBA is very important and should be prudently
examined in order to get long term strength gain.

77
The rate of the UCS development was very rapid within 7 days of curing
duration, after which between 28 and 60 days of curing time, it reached a state of
transition in which the UCS increase began to slow down. A drastic increase in the
unconfined compressive strength at 7 days of curing was mainly attributed to a
combination of cement accelerator (CaCl2), filler effect of both silica sand and SCBA,
hydration reaction of the cement, and pozzolanic activity of SCBA. Pozzolanic
reactions depend on calcium hydroxide released by the hydration reactions of
calcium silicates as exposed in Eqn. 3.2. Figure 3.29 represents the effect of curing
duration for all peat-cement-bagasse ash (PCB) mixtures on the acidity, pH and
water contents, w%. It was observed that pH increase with curing time and
simultaneously reduces the w. The reason why this could be happened is perhaps
because there are more hydration development occurred with elapsed time in alkaline
condition and consequently enhance the mixture strength. As known, hydration
process requires enough water in order to get proper cementation product and this
progression is significant at first month of curing.
Figure 3.28: Effect of curing duration for all peat-cement-bagasse ash (PCB)
mixtures on the unconfined compressive strength, qu

78
Figure 3.29: Effect of curing duration for PCB 1 mixtures on the acidity, pH and
water contents, w%
Effect of preloading during curing
Figure 3.31 shows the results of preloading effect on stabilized peat by all
PCB mixtures. The results indicate the positive and linear improvement when the
initial loading rises for all PC and PCB mixtures. It observed that preloading gave the
significant increment even only subjected the pressure as small as 20 kPa if
compared to the specimen without pressure during curing. For PCB2-5, it is
suggested to use at least 40 kPa (about 2 meter high of embankment in the field)
preloading during to the aim of minimum strength. The strength of stabilized peat is
pronouncedly affected by the application of initial load shortly after mixing with
binder. Refer to Figure 3.31, PC mixtures strength was exceed PCB2-5 mixtures start
from 60 kPa subjected initial loading and the different obvious at 100 kPa of
preloading. This could be happened when more contact between material particles
and cement, hydration progression could be formed easily and rapidly. Since PC
mixtures consume 100% of OPC compositions, therefore more cement products able
to produce while for PCB-5 mixtures was likely tend to fill the mixture voids caused
by 5% of SCBA 2 replacement. For that reason it could be suggested that the

79
replacement of cement by low quality of SCBA are not recommended for high
embankment.
Particularly in stabilizing peat, an initial surcharge or preloading, in the field
has been regarded necessary in order to create a more homogeneous stabilized mass
of peat. Besides, preloading provides a trafficable bed for the continuous stabilization
of adjacent areas, thereby considerably improve the strength of stabilized peat.
Without preloading as a trafficable bed during peat stabilization, the situation that
illustrated in Figure 3.30 may be occur. It is not the magnitude of the initial load
itself that governs the increase in strength, but the amount of compression resulting
from loading. The void spaces between the binder grains and the solid soil particles
in peat would be reduced by the compression that occurs under preloading. With the
increasing preloading, the compression increases resulting in the decrease of initial
density of the stabilized soil and time lapse between mixing and loading [33]. Figure
3.32 indicates the effect of preloading for PCB 1 mixtures on the acidity, pH and
water contents, w%. Overall, it can be seen from this graph that the water contents
uniformly dropped by 5% between 0 kPa and 100 kPa of initial loading. On the
contrary, pH results climbed rapidly at first 20 kPa of preloading and followed by
gradual soared from that point. This finding shows the agreements with strength
gained (from 218 kPa to 387 kPa) which is the preloading gave the significant
increment when subjected the pressure of 20 kPa if compared to the sample without
pressure during curing.
Figure 3.30: On site difficulty in peat stabilization

80
Figure 3.31: Effect of preloading for all peat-cement-bagasse ash (PCB) mixtures on
the unconfined compressive strength, qu
Figure 3.32: Effect of preloading for PCB 1 mixtures on the acidity, pH and water
contents, w%
Effects of Ordinary Portland Cement (OPC) dosage
Figure 3.33 shows the results of the effect of the OPC dose to the unconfined
compressive strength. In relation to the dosage of OPC, binder quantity must be

81
adequate to achieve the threshold for effective stabilization of peat. It can be seen
from Figure 3.33 that strength gain gradually increases with OPC dosage and it is
more obvious especially after the amount exceed 250 kg/m3. All PCB mixtures
except PCB2-5 gave the good results that exceed the minimum UCS target in this
study. It is revealed that at satisfactory OPC quantity, the acid in the peat could be
neutralized. This also imply that below the threshold binder dosage, stabilization of
the peat remains hindered due to insufficient binder to induce cement hydration and
pozzolanic reactions in the test specimens. This is by reason of the limited formation
of primary cementation products to bind the soil because the soil organic matter
tends to retain the calcium ions produced from cement hydrolysis, resulting in a
limited amount of CH that could react with silica (Si) and alumina (Al) of SCBA to
yield secondary pozzolanic products during the pozzolanic reaction.
Figure 3.34 displays the effect of ordinary Portland cement (OPC) dosage for
PCB 1 mixtures on the acidity, pH and water contents, w%. Similar to SCBA
composition effect in Figure 3.20, the strength rose as the water contents decrease
and the pH increased. Plainly, the water content declined sharply when the OPC
contents larger. This situation can ensue due to high water consumption during the
effective cement hydration that could only be achieved when the amount of cement
reach optimum levels.
Figure 3.33: Effect of Ordinary Portland Cement (OPC) dosage for all peat-cement-
bagasse ash (PCB) mixtures on the unconfined compressive strength, qu

82
Figure 3.34: Effect of ordinary Portland cement (OPC) dosage for PCB 1 mixtures
on the acidity, pH and water contents, w%
Effects of silica sand (K7) dosage
By the same optimum binder composition, test specimens were prepared at
varying K7 silica sand dosages of 0, 100, 200, 300, 400 and 500 kg/m3 for the
purpose of evaluating its effect on the stabilized peat. The result in Figure 3.35
shows that there was a progressive increment of the UCS when the dosage of silica
sand of the test specimens increases. This suggests that well graded silica sand had a
positive effect on the development of the UCS in such a way that it increased the
density and reduced the void of the test specimens. Because silica sand is chemically
inert, it did not take part in the cement hydration process. However, it provided solid
particles for the binder to bind and form a load bearing stabilized soil. The particle of
the sand is strong and it shape almost spherical and uniform that make it almost no
internal voids. For PCB1-20 and PCB3-10 mixture, inclusion of a minimum OPC
dosage of 300 kg/m3 and K7 dosage of 500 kg/m3 along with curing under 20 kPa
pressure is recommendable for the peat stabilization to be effective. However for
PCB2-5 mixture, it suggested to use more OPC and K7 dosage or alternatively
increase the preloading during curing to 40 kPa in order to achieve minimum
strength target.

83
Figure 3.35: Effect of silica sand (K7) dosage for all peat-cement-bagasse ash (PCB)
mixtures on the unconfined compressive strength, qu
Figure 3.36: Effect of silica sand (K7) dosage for PCB 1 mixtures on the acidity, pH
and water contents, w%
Figure 3.36 displays the effect of silica sand (K7) dosage for PCB 1 mixtures
on the acidity, pH and water contents, w%. Visibly, the water contents percentage
were observed fell rapidly from 170% to 84% between 0 and 500 kg/m3 of K7. This
sharp decline is due to the nature of the K7 which fulfill the void spaces between

84
grains of soil, thus making the sample becomes more solid and strong. Contrary to
previous findings, the pH results show the slight decrements as the strength
augmented. This finding makes an agreement with Tremblay et al. [46] which
mentioned that pore solution more than 9 not always indicate great strength gain. As
explained before, since K7 is almost inert, this material is more likely contribute to
the physical strength rather than chemical effect (not involve in hydration
progression). This evidence is likely to became the causes why the pH decreased
when K7 and strength of the sample increases.
Effect of calcium chloride (CaCl2) as OPC accelerator
Calcium chloride is a common accelerator that used to quicken the period and
the rate of strength gain especially in concrete technology. This material is well
known as economical and effective accelerating admixtures. It should meet the
requirements of ASTM D 98 [57]. Too much quantities of CaCl2 in concrete mix
may result in rapid stiffening, increase in drying shrinkage and corrosion of
reinforcement. The normal range of CaCl2 compositions are between 1 and 4% of
cement amounts [58-61]. Figure 3.37 describes the effect of calcium chloride (CaCl2)
dosage for all peat-cement-bagasse ash (PCB) mixtures on the unconfined
compressive strength, qu. Strength improvement was perceived with CaCl2 increases.
However, the pattern of increments shows the non-uniform.
Noticeably for all PC and PCB mixtures, the strength gain significantly when
the CaCl2 rose from 1 to 3% and almost levelled off at 4%. According to Abrams
[59], for concrete cured in a moist room, he found the optimum dosage to be 2% to
4%. In addition he concluded that no advantage was gained by using dosages higher
than 3%. The study done by Price [62] prove that concrete with dosages up to 3% of
CaCl2 improved compressive strength at all ages up to a year. Besides, he also
concluded that there was little advantage in using more than 3% CaCl2 because the
tests showed very little strength increase when the dosage was increased from 2% to
3%. These discoveries become the reasons why 3% of CaCl2 was used in all samples
for experimental laboratory works in this research study. Figure 3.38 illustrates the
effect of calcium chloride (CaCl2) dosage for PCB 1 mixtures on the acidity, pH and

85
water contents, w%. Undoubtedly, the strength shows the gradual improvement with
increment of pH together with water contents reduction.
Figure 3.37: Effect of calcium chloride (CaCl2) dosage for all peat-cement-bagasse
ash (PCB) mixtures on the unconfined compressive strength, qu
Figure 3.38: Effect of calcium chloride (CaCl2) dosage for PCB 1 mixtures on the
acidity, pH and water contents, w%

86
3.5 Summary
As summary, this chapter presents the approach method to clarifying
effectiveness the three types of sugarcane bagasse ash (SCBA) utilization on peat
strength. The unconfined compressive strength (UCS) tests were conducted at all
samples with the aim to elucidate the stabilized peat strength improvement. The new
simple method for preloading during curing was executed by using controlled air
pressure instead of iron rod in conventional method. The main target of this chapter
is to determine the optimum SCBA inclusion as partial replacement of cement. The
best mixtures from eac h SCBA then chosen and use in further UCS test which is
stresses on various effect factor in peat stabilization.
It was found that stabilized peat comprising 20%, 5% and 10% (PCB1-20,
PCB2-5 and PCB3-10) partial replacement of OPC with SCBA 1, SCBA 2 and
SCBA 3 attain the maximum unconfined compressive strength (UCS) and discovered
greater than untreated soil (P) and peat-cement (PC) specimen. Generally, it observed
that higher the pH seems gave better strength to specimens while water content looks
like rely on rate of hydration by vary OPC composition. Moreover, the proposed
calculation to predict deformation modulus of Peat-Cement-Bagasse (PCB) mixtures
based on two-phase mixtures model was introduced and developed. The main benefit
of this proposed model is the ability to determine the optimum PCB mixture which
depends on the physical and chemical effects of SCBA. It was observed that the
proposed model outcomes demonstrate a well agreement with the experimental
results. At the optimal mix design, the UCS of the stabilized peat specimens
increased with increasing of curing time, OPC dosage, K7 dosage and preloading.
For PCB1-20 and PCB3-10 mixture, inclusion of a minimum OPC dosage of 300
kg/m3 and K7 dosage of 500 kg/m3 along with curing under 20 kPa pressure is
recommendable for the peat stabilization to be effective. However for PCB2-5
mixture, it suggested to use more OPC and K7 dosage or alternatively increase the
preloading during curing to 40 kPa in order to achieve minimum strength target.

87
3.6 References
[1] Kazemian, S., Huat, B.B.K., Prasad, A. and Barghchi, M., 2011. A state of art
review of peat: Geotechnical engineering perspective. International Journal of
the Physical Sciences, 6(8): 1974-1981.
[2] Haan, d.E.J. and Kruse, G.A.M., 2006. Characterisation and engineering
properties of Dutch peats. In: D.W.H. K . K . Phoon , S . Leroueil , and T . S .
Tan (Editor), Characterisation and Engineering Properties of Natural Soils.
Taylor & Francis pp. 2101-2133.
[3] Islam, M.S. and Hashim, R., 2008. Use of Mackintosh Probe Test for Field
Investigation in Peat Soil. Proc. of Int. Conf. on Highway and Geotechnical
Engineering, 26th - 27th May 2008, Best Western Premier Seri Pacific Kuala
Lumpur, Malaysia, pp. 27.
[4] Islam, S. and Hashim, R., 2008. Engineering properties of peat soils in peninsular
Malaysia. J. Appl. Sci., 8(22).
[5] Andriesse, J.P., 1988. Nature and Management of Tropical Peat Soils. FAO Soils
Bulletin 59 Rome, ISBN Number: 9251026572, Edition Number: 291894.
[6] Huat, B.K., 2006. Deformation and Shear Strength Characteristics of Some
Tropical Peat and Organic Soils. Pertanika J. Sci. & Techno., 14(1&2): 61-74.
[7] Zainorabidin, A. and Wijeyesekera, D.C., 2008. Geotechnical Characteristics of
Peat. Proceedings of the AC&T, pp.71 -78.
[8] EuroSoilStab, 2002. Development of design and construction methods to stabilize
soft organic soils. Design guide soft soil stabilization. CT97-0351. Project No.
BE 96-3177, Industrial & Materials TechnologiesProgramme (Brite- EuRam
III), European Commission.
[9] Wong, L.S., Hashim, R. and Ali, F., 2011. Unconfined compressive strength
characteristics of stabilized peat. Scientific Research and Essays, 6(9): 1915-
1921.
[10] Hebib, S. and Farrell, E.R., 2003. Some experiences on the stabilization of Irish
peats. Canadian Geotechnical Journal, 40(1): 107-120.
[11] Axelsson, K., Johansson, S.E. and Anderson, R., 2002. Stabilization of Organic
Soils by Cement and Puzzolanic Reactions- Feasibility Study, Swedish deep
stabilization Research Centre, Report 3, English translation.

88
[12] Hashim, R. and Islam, M.S., 2008. Properties of stabilized peat by soil-cement
column method. EJGE. Electronic J. Geotechn. Eng., p.1-9.
[13] Islam, M.S. and Hashim, R., 2010. Stabilization of peat soil by soil-column
technique and settlement of the group columns. International Journal of the
Physical Sciences, 5(9): 1411-1418.
[14] Kazemian, S. and Huat, B.K., 2009. Compressibility characteristics of fibrous
tropical peat reinforced with cement column. Electronic J. Geotech. Eng.,
14E: 1-8.
[15] Moayedi, H., Kazemian, S. and Huat, B.B.K., 2013. Shear Strength Parameters
of Improved Peat by Chemical stabilizer. Geotechnical and Geological
Engineering, Volume 31, Issue 4, pp 1089-1106.
[16] Lechowicz, Z., 1994. An Evaluation of the Increase in Shear-Strength of
Organic Soils. Advances in Understanding and Modelling the Mechanical
Behaviour of Peat: 167-179.
[17] Huat, B.K., Sew, G.S. and Ali, F.H., 2004. Organic and Peat Soils Engineering.
Serdang, University Putra Malaysia, Press, ISBN Number: 983-2871-08-5.
[18] Landva, A.O. and LaRochelle, P., 1983. Compressibility and shear
characteristics of radforth peats. Testing Peat Organic Soils, ASTV STP, 820:
157-191.
[19] Culloch, F.M., 2006. Guidelines for the Risk Management of Peat Slips on the
Construction of Low Volume/ Low Cost Road Over Peat. Scotland: For. Civ.
Eng. For. Comm., pp. 1-46.
[20] Edil, T.B., 2003. Recent advances in Geotechnical characterization and
construction over peat and organic soils. Proceedings 2nd International
Conference on Advances in Soft Soil Engineering and Technology: 3-25.
[21] Leong, E.C. and Chin, C.Y., 2000. Geotechnical Characteristics of Peaty Soils
in Southeast Asia. In Proceedings of GeoEngineering, Melbourne, Australia.
[22] Munro, R., 2004. Dealing with bearing capacity problems on low volume roads
constructed on peat, The Highland Council, Environmental and Community
Service, HQ, Glenurquhart Road, Scotland.
[23] Jelisic, N. and Leppanen, M., 1999. Mass stabilization of peat in road and
railway construction. Dry Mix Methods for Deep Soil Stabilization: 59-64.

89
[24] Huat, B.K., Maail, S. and Mohamed, T.A., 2005. Effect of Chemical
Admixtures on the Engineering Properties of Tropical Peat Soils. American
Journal of Applied Sciences, 2(7): 1113-1120.
[25] Hashim, R. and Islam, M.S., 2008. A Model Study to Determine Engineering
Properties of Peat Soil and Effect on Strength after Stabilisation. European
Journal of Scientific Research, 22(2): 205-215.
[26] Kazemian, S. et al., 2011. Effect of aggressive pH media on peat treated by
cement and sodium silicate grout. Journal of Central South University of
Technology, 18(3): 840-847.
[27] Kazemian, S., Huat, B.K. and Prasad, A., 2011. Study of Peat Media on
Stabilization of Peat by Traditional Binders. Int. J. Phys. Sci., 6(3): 476-481.
[28] Kazemian, S., Huat, B.K. and Barghchi, M., 2011. Effect of calcium chloride
and kaolinite on shear strength and shrinkage of cement grout. Int. J. Phys.
Sci., 6(4): 707-713.
[29] Bergado, D.T., Anderson, L.R., Miura, N. and Balasubramaniam, A.S., 1996.
Soft Ground Improvement. New York: ASCE Press.
[30] Mohidin, M.N. et al., 2007. Some Index Properties on Rengit Peat Soil Stabilize
with Cement-Lime. Prosiding Kebangsaan Awam '07, Langkawi, Kedah.
[31] Chen, H. and Wang, Q., 2006. The behaviour of organic matter in the process of
soft soil stabilization using cement. Bulletin of Engineering Geology and the
Environment, 65(4): 445-448.
[32] Sobhan, K., Reddy , D.V. and Ramirez, J.C., 2012. Cement Stabilization of
Organic Subgrades for Pavement Preservation. In: LACCEI (Editor),
Megaprojects: Building Infrastructure by fostering engineering collaboration,
efficient and effective integration and innovative planning Panama City,
Panama.
[33] Ahnberg, H., 2006. Strength of stabilised soils– A laboratory study on clays and
organic soils stabilised with different types of binder, Swedish deep
stabilization Research Centre, Report 16, English translation.
[34] Wong, L.S., Roslan, H. and Ali, F.H., 2008. Engineering Behaviour of
Stabilized Peat Soil. European Journal of Scientific Research, 21(4 ): 581-591.

90
[35] Wong, L.S., Hashim, R. and Ali, F., 2013. Improved strength and reduced
permeability of stabilized peat: Focus on application of kaolin as a pozzolanic
additive. Construction and Building Materials, 40: 783-792.
[36] Lin, T.B., 2011. Revitalization of Organic and Peat Soils, Universiti Tun
Hussein Onn Malaysia, Malaysia.
[37] RISDA, Garis Panduan Pengurusan Dan Penanaman Sawit Di Kawasan Tanah
Gambut. www.mpn.gov.my/c/document_library/get_file?uuid=363518fc-
f66b-4c80-b942-d9bc33adb8ed&groupId=82677.
[38] Allu, F.O., 2005. Mass stabilization Manual.
[39] Maijala, A. et al., 2009. Cement stabilization and solidification- review of
techniques and methods. Rap001-Id01.
[40] Janz, M. and Johansson, S.E., 2002. The function of different binding agents in
deep stabilization, Swedish Deep Stabilization Research Center, Linkoping:
SGI. 9.
[41] Wong, L.S., Hashim, R. and Ali, F., 2013. Utilization of sodium bentonite to
maximize the filler and pozzolanic effects of stabilized peat. Engineering
Geology, 152(1): 56-66.
[42] Isaia, G.C., Gastaldini, A.L.G. and Moraes, R., 2003. Physical and pozzolanic
action of mineral additions on the mechanical strength of high-performance
concrete. Cement & Concrete Composites, 25(1): 69-76.
[43] ASTM-C618, 2005. Standard Specification for Fly Ash and Raw or Calcium
Natural Pozzolanas for Use in Concrete. American Society for Testing and
Materials Standards, Pennsylvania, USA, Volume 04.02.
[44] ASTM, 2005. American Society of Testing Materials, Annual Book of ASTM
Standards, Soil and Rock (I): D 420 - D 5611, Vol. 04.08.
[45] Wong, L.S., Hashim, R. and Ali, F.H., 2009. A Review on Experimental
Investigations of Peat Stabilization. Australian Journal of Basic and Applied
Sciences, 3(4): 3537-3552, 2009. ISSN 1991-8178.
[46] Tremblay, H., Duchesne, J., Locat, J. and Leroueil, S., 2002. Influence of the
nature of organic compounds on fine soil stabilization with cement. Canadian
Geotechnical Journal, 39(3): 535-546.

91
[47] Broms, B.B., 2003. Deep Soil Stabilization: Design and Construction of Lime
and Lime/Cement Columns. Royal Institute of Technology, Stockholm,
Sweden.
[48] Baker, S., 2000. Deformation Behaviour of Lime/Cement Column Stabilized
Clay. Swedish Deep Stabilization Research Centre, Rapport 7, Chalmers
University of Technology.
[49] Jacobson, J.R., Filz, G.M. and Mitchell, J.K., 2005. Factors Affecting Strength
of Lime-Cement Columns Based on a Laboratory Study of Three Organic
Soils. Deep Mixing '05:International conference on deep mixing best practice
and recent advances.
[50] Omine, K., Ochiai, H. and Yasufuku, N., 1996. Evaluation of Strength-
Deformation Properties of Light-Weight Soils Based on Two-Phase. Proc. of
the 12 th Southeast Asian Geotechnical Conference on Tropical Soil, pp. 101-
106, May 1996, Kuala Lumpur, Malaysia.
[51] Omine, K., Ochiai, H. and Bolton, M., 1998. Generalized Two-Phase Mixture
Model and Its Application to Composite Ground. Memoirs of the Faculty of
Engineering, Kyushu University, Vol.58, No.2, June 1998.
[52] Omine, K., Ochiai, H. and Yoshida, N., 1998. Estimation of In-Situ Strength of
Cement-Treated Soils based on Two-Phase Mixture Model. Soils and
Foundation, Vol. 38, No. 4, 17-29, Dec. 1998, Japanese Geotechnical Society.
[53] Yasufuku, N., Springman, S.M., Omine, K. and Ochiai, H., 2001. Stress-strain
relationship of frozen sand as a composite geomaterial. Soils and Foundations,
41(3): 17-30.
[54] Yasufuku, N., Ochiai, H., Omine, K. and Iwamoto, N., 2001. Strength and
Deformation Characteristics of Artificially Cemented Clay with Dispersion.
Advanced Laboratory Sress-strain Testing of Geomaterials, Tatsuoka,
Shibuya & Kuwano (eds), 2001 Swets & Zeitlinger Publishers Lisse, ISBN
90 2651 843 9.
[55] Cordeiro, G.C., Toledo, R.D., Tavares, L.M. and Fairbairn, E.M.R., 2008.
Pozzolanic activity and filler effect of sugar cane bagasse ash in Portland
cement and lime mortars. Cement & Concrete Composites, 30(5): 410-418.

92
[56] Cordeiro, G.C., Toledo Filho, R.D., Tavares, L.M. and Fairbairn, E.M.R., 2009.
Ultrafine grinding of sugar cane bagasse ash for application as pozzolanic
admixture in concrete. Cement and Concrete Research 39, 110-115.
[57] ASTM-D98, 1998. Standard Specification for Calcium Chloride. American
Society for Testing and Materials Standards, Pennsylvania, USA, Volume
04.03.
[58] Clemmer, H.F. and Burggraf, F., 1923. An Investigation of the Use of Calcium
Chloride As a Curing Agent and Accelerator of Concrete. ASTM Proceedings,
Part II, ASTM, p. 314.
[59] Abrams, D.A., 1924. Calcium Chloride As an Admixture in Concrete. ASTM
Proceedings, Part II, pp. 781–834.
[60] Yates, J.C., 1941. Effect of Calcium Chloride on the Strength Development of
Concrete Stored at Low Temperatures. Proceedings, Highway Research
Board, pp. 288–293.
[61] Shideler, J.J., 1952. Calcium Chloride in Concrete. Jourrnal of the American
Concrete Institute, pp. 537–559 .
[62] Price, W.H., 1951. Factors Influencing Concrete Strength. Jourrnal of the
American Concrete Institute, American Concrete Institute, Farrmington
Hills, Mich., pp. 423–424.

93
CHAPTER 4
VERIFICATION OF PEAT STRENGTH
IMPROVEMENT VIA MICROSTRUCTURE AND
CHEMICAL COMPOSITION ASSESSMENT
4.1 Introduction
This chapter discusses the strength improvement mechanism of stabilized
peat by focusing on the microstructure and chemical composition enhancement. The
main objective in this chapter is to verify the results obtained from previous chapter.
The flowcharts of this chapter implementation can be illustrated in Figure 4.1.
A scanning electron microscope (SEM) is a type of electron microscope that
creates images of a sample by scanning it with a focused beam of electrons. The
electrons act together with atoms in the sample, generating many signals that can be
detected and that contain information about the sample's surface topography and
composition. The electron beam is generally scanned in a raster scan pattern, and the
beam's position is combined with the detected signal to produce an image [1].
Energy-dispersive X-ray spectroscopy (EDX) is an analytical technique used
for the elemental analysis or chemical characterization of a sample. It relies on an
interaction of some source of X-ray excitation and a sample. Its characterization
capabilities are due in large part to the fundamental principle that each element has a
unique atomic structure allowing unique set of peaks on its X-ray emission spectrum
[2].
94
CHAPTER 4: Verification Of Peat Strength
Improvement Mechanism Via Microstructure And
Chemical Composition Assessment
Scanning Electron Microscope
(SEM)
Mechanism of stabilized peat strength
gained on;
· Effect of SCBA proportions and
optimum PCB mixtures
· Effect of OPC dosage
· Effect of K7 dosage
· Effect of preloading during curing
· Effect of CaCl2
Energy-dispersive X-ray spectroscopy
(EDX)
Materials:
· Untreated peat
· OPC
· Sand
· SCBA 1, 2 and 3
Figure 4.1: Execution planning of Chapter 4
4.2 Methodology
In this study, the SEM test was conducted by using the instruments brands of
Shimadzu, Japan (Model: SS-550) as displayed in Figure 4.2. The main
specifications of this device were listed in the Table 4.1. This apparatus not only can
produce an image but chemical compositions as well. The SS-550 was attached
together with Energy-dispersive X-ray (EDX) system namely Genesis2000 that able
to generate chemical elements analysis of studied sample.
Figure 4.2: SEM superscan (SS-550) apparatus
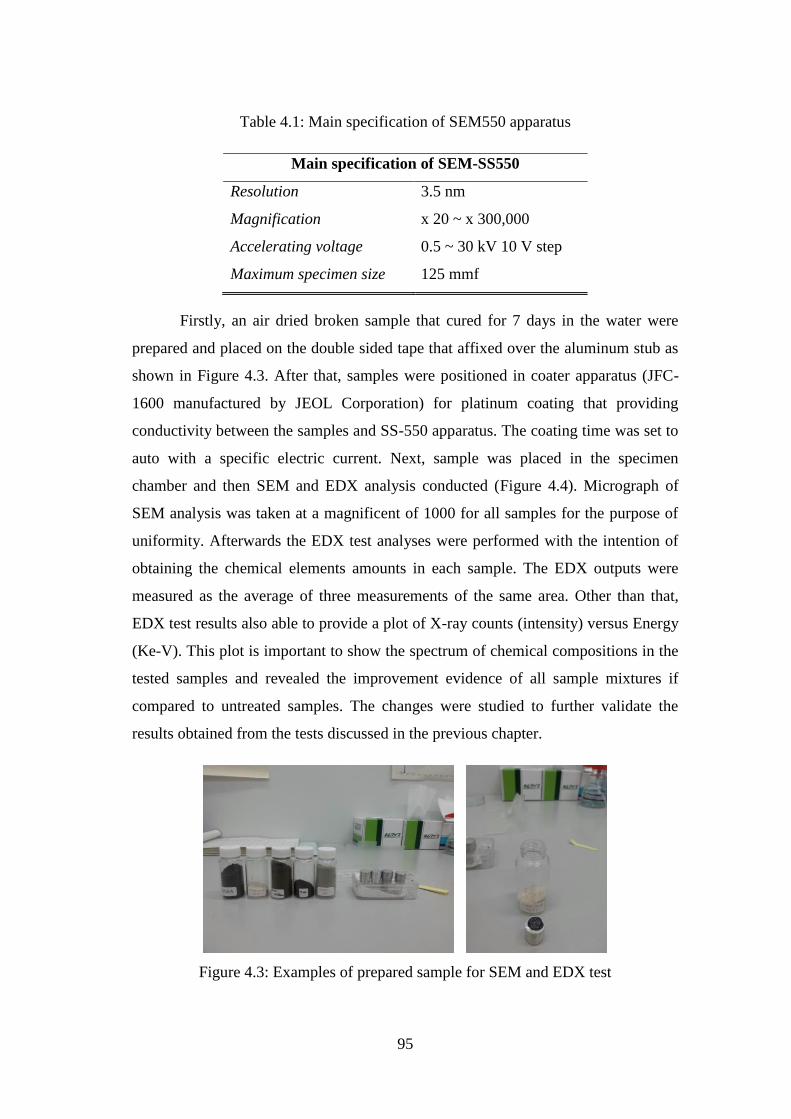
95
Table 4.1: Main specification of SEM550 apparatus
Main specification of SEM-SS550
Resolution 3.5 nm
Magnification x 20 ~ x 300,000
Accelerating voltage 0.5 ~ 30 kV 10 V step
Maximum specimen size 125 mmf
Firstly, an air dried broken sample that cured for 7 days in the water were
prepared and placed on the double sided tape that affixed over the aluminum stub as
shown in Figure 4.3. After that, samples were positioned in coater apparatus (JFC-
1600 manufactured by JEOL Corporation) for platinum coating that providing
conductivity between the samples and SS-550 apparatus. The coating time was set to
auto with a specific electric current. Next, sample was placed in the specimen
chamber and then SEM and EDX analysis conducted (Figure 4.4). Micrograph of
SEM analysis was taken at a magnificent of 1000 for all samples for the purpose of
uniformity. Afterwards the EDX test analyses were performed with the intention of
obtaining the chemical elements amounts in each sample. The EDX outputs were
measured as the average of three measurements of the same area. Other than that,
EDX test results also able to provide a plot of X-ray counts (intensity) versus Energy
(Ke-V). This plot is important to show the spectrum of chemical compositions in the
tested samples and revealed the improvement evidence of all sample mixtures if
compared to untreated samples. The changes were studied to further validate the
results obtained from the tests discussed in the previous chapter.
Figure 4.3: Examples of prepared sample for SEM and EDX test

96
Figure 4.4: Coating apparatus and specimen chamber of SS-550
4.3 Results and discussions
Materials
Scanning Electron Microscopy (SEM)
Figure 4.5 portrays the results of SEM test on untreated peat and materials
used in this study. It has been observed that the untreated peat (Figure 4.5a) consists
of coarse organic particles and fibers in a loose condition. They were organized
arbitrarily without significant microstructural orientation. The organic coarse
particles were typically hollow and spongy. Due to spongy nature of organic coarse
particles, untreated peat is highly compressible and has a high water holding capacity
when fully saturated [3]. The OPC image was observed exposes the box and stone-
shaped particles in Figure 4.5b. Most particles of OPC will be composed of some
calcium rich phases which generally extremely fine grained and often occur without
distinct grain boundaries. Figure 4.5c shows the silica sand (K7) microscopy results.
Since the main component of silica sand is quartz, the surface of this material looks
very hard and flat with very little cleavage.
When seen by SEM on the SCBA samples (Figure 4.5d, e and f), the presence
of coarse and porous particles are detected and these are typical materials present in
SCBA. Generally, prismatic, angular, spherical and fibrous particles are shown on
the SCBA morphologies. The size of these particles differs noticeably between the
types of ashes. The particle sizes increase in the following order: SCBA 1 < SCBA 3

97
< SCBA 2. The SCBA 2 shows the morphology with large voids and high coarse
particles content; while SCBA 1 demonstrate the finest particles together with small
pores. The SCBA 2 also comprises a large quantity of long cylindrical porous plates
of sugarcane bagasse that not burnt. Since SCBA 3 is combination of SCBA 1 and
SCBA 2 materials, therefore its produce the intermediate particle size between the
used ashes. These images finding are similar to previous researcher that focus on
SCBA materials [4-9].
Figure 4.5: Scanning Electron Microscopy (SEM) results on materials used: a)
Untreated peat, b) Silica sand, c) Ordinary Portland Cement, d) Sugarcane Bagasse
Ash 1, e) Sugarcane Bagasse Ash 2, f) Sugarcane Bagasse Ash 3

98
Energy-dispersive X-ray spectroscopy (EDX)
Table 4.2 demonstrates the average percentages of oxide compounds of the
materials and peat. It is obvious that the peat has a very low content of pozzolanic
minerals with 4.64% SiO2, 3.09% Al2O3 and 2.07% Fe2O3. In this study, OPC is
predominantly characterized by 65.21% CaO, 21.55% SiO2, 3.82% Al2O3 and 1.28
Fe2O3. Based on a review, OPC is primarily characterized by quicklime (CaO), silica
(SiO2), alumina (Al2O3) and iron oxide (Fe2O3) [10]. These findings agree with the
typical constituents of Portland cement released by Cement Chemists Notation
(CCN) [11]. With a content of 70.18% SiO2 and 19.3% Al2O3, it can be affirmed that
quartz and alumina are the major mineral in the K7 silica sand. For SCBA 1, SCBA
2 and SCBA 3, it was found that the summation of the crucial pozzolanic oxide
compounds (SiO2, Al2O3 and Fe2O3) is 71.64%, 74.42% and 67.75% of the total
oxide compounds respectively. These results indicate the potential of SCBA as a
pozzolan since the amount of such oxide compounds approximately 70% as
recommended by ASTM C 618 Standard.
Table 4.2: Energy Dispersive X-ray (EDX) test results of untreated peat and
materials
CO2 86.14 - - - - -
CaO2 1.10 65.21 0.65 7.70 2.53 5.40
SiO2 4.64 21.55 70.18 57.38 70.53 55.07
Al2O3 3.09 3.82 19.30 10.19 1.65 8.36
Fe2O3 2.07 1.28 0.17 4.07 2.24 4.32
Na2O 0.76 1.51 0.00 1.71 0.51 0.73
MgO 0.95 1.97 0.42 1.23 1.22 2.02
P2O5 0.27 0.87 7.29 4.33 7.62 6.36
SO3 0.54 1.68 0.67 1.47 0.15 2.42
K2O 0.45 1.29 0.53 10.98 12.74 14.38
TiO2 0.00 0.82 0.78 0.93 0.82 0.91
Total 100.0 100.0 100.0 100.0 100.0 100.0
Oxide
Compound, %
Untreated
peatOPC
Sand
(K7)SCBA 1 SCBA 2 SCBA 3

99
Untreated peat versus stabilized peat
Scanning Electron Microscopy (SEM) and Energy-dispersive X-ray spectroscopy
(EDX)
Figure 4.6 depicts the results of SEM and EDX test on untreated Hokkaido
peat samples in this study. For SEM results of untreated peat in Figure 4.6a, it was
given detail explanation in subchapter 4.3.1 (Figure 4.5a). Figure 4.6b illustrates the
outcomes of EDX test in term of chemical elements intensity (scatter plot) and
percentages (small tables). The strength (UCS) of sample that obtained from Chapter
3 was also included in this table for comparison purpose. The chemical elements
percentages were attains by taking an average EDX outcomes of chemical compound
proportions readings as shown in Table 4.3. These results take into account only the
essential elements i.e. carbon (C), calcium (Ca), silica (Si), alumina (Si) and iron
(Fe). It is clear that untreated peat mainly comprises a high peak of carbon (C) and
oxide (O) that given an evident of the presence of two primary elements of organic
matter. It is about 86% of untreated peat are contain these two chemical compounds.
This figure also discovered that the peat has a very low content of pozzolanic
minerals (SiO2+ Al2O3 +Fe2O3) with 9.8% in total. This results can become the
reason why cement stabilized peat had a low potential to generate secondary
hydration that mainly contributed by mentioned pozzolanic minerals.
Figure 4.6: Test results of untreated peat, P on SEM (a) and EDX (b)

100
Table 4.3: Summary of EDX test results of untreated and stabilized peat on the
percentage of crucial chemical elements
Figure 4.7 illustrates the assessment outcomes of stabilized peat of peat-
cement (PC) and peat-cement-bagasse ash 1 mixture (PCB1) on the SEM and EDX
test. Obvious change had apparent and occurred when comparing the SEM results of
PC, PCB 1-20 and PCB 1-30 (Figure 4.7a, b, c) with the untreated peat (Figure 4.6a).
Minor void spaces can be detected in the micrographs of all stabilized peats mixtures.
However, compared to PC and PCB1-30 mixtures, a PCB1-20 mixture gave the
significant pore improvement that can be perceived in the photomicrograph of the
stabilized peat. Figure 4.7a (PC mixture), is clearly shows the noticeable gel plume
Point C O Ca Si Al Fe
1 56.59 31.81 1.17 4.08 2.59 1.34
2 59.15 26.41 1.15 4.94 2.91 2.39
3 59.44 25.01 0.97 4.89 3.77 2.48
Avg 58.39 27.74 1.10 4.64 3.09 2.07
Std. dev. 1.28 2.93 0.09 0.39 0.50 0.52
Std. err. 0.91 2.07 0.06 0.28 0.35 0.37
1 11.70 33.65 24.98 17.07 4.52 1.97
2 10.40 33.72 33.77 11.39 3.19 3.35
3 11.06 30.98 34.07 10.36 3.95 3.05
Avg 11.05 32.78 30.94 12.94 3.89 2.79
Std. dev. 0.53 1.28 4.22 2.95 0.54 0.59
Std. err. 0.31 0.74 2.43 1.70 0.31 0.34
1 5.97 29.17 35.98 10.43 3.92 3.40
2 7.90 29.63 34.26 9.54 3.55 4.64
3 6.44 30.86 34.86 10.16 3.73 2.73
Avg 6.77 29.89 35.03 10.04 3.73 3.59
Std. dev. 0.82 0.71 0.71 0.37 0.15 0.79
Std. err. 0.47 0.41 0.41 0.22 0.09 0.46
1 25.26 29.92 18.45 12.44 2.21 2.90
2 25.38 34.10 20.20 11.84 1.97 0.00
3 27.15 30.13 19.33 11.70 1.81 1.86
Avg 25.93 31.38 19.33 11.99 2.00 1.59
Std. dev. 0.86 1.92 0.71 0.32 0.16 1.20
Std. err. 0.50 1.11 0.41 0.19 0.09 0.69
1 10.08 28.64 31.99 14.09 4.01 3.94
2 11.13 30.03 30.93 13.78 3.61 2.62
3 10.90 28.90 32.94 13.78 3.95 2.56
Avg 10.70 29.19 31.95 13.88 3.86 3.04
Std. dev. 0.45 0.60 0.82 0.15 0.18 0.64
Std. err. 0.26 0.35 0.47 0.08 0.10 0.37
1 8.47 27.74 34.83 13.99 3.16 2.77
2 7.49 27.25 34.75 14.16 3.62 2.78
3 5.36 26.47 35.93 15.46 3.84 1.52
Avg 7.11 27.15 35.17 14.54 3.54 2.36
Std. dev. 1.30 0.52 0.54 0.66 0.28 0.59
Std. err. 0.75 0.30 0.31 0.38 0.16 0.34
Sample
SCBA 2
PCB2-5
(C95B5)-
optimum
P (Untreated peat)
PC (C100)
SCBA 1
PCB1-20
(C80B20)-
optimum
PCB1-30
(C70B30)
SCBA 3
PCB3-10
(C90B10)-
optimum

101
of hydrated cement-soil by means of results from the reaction of cement and water as
described in chapter 3. When SCBA was included as much as 30% replacement of
OPC (Figure 4.7c @ PCB1-30), SEM images shows the worst packing structures
among other stabilized mixtures. It can be witnessed that the gel clots was reduced
(cement-soil hydration decrease) while coarse particles that probably contribute by
abandoned SCBA inclusion is greatly observed. As conclusion, it can be stated that
the stabilized soil is characterized by a well cemented soil medium with very small
pore spaces within it as a result of the pozzolanic activity of SCBA.
By comparing to EDX outcomes from untreated peat in Figure 4.6b, it is
discovered that lower carbon (C) and higher calcium (Ca) chemical elements
fractions shows the better results of strength for all stabilized peat (Figure 4.7d, e, f).
The essential pozzolanic oxide compounds (silica-Si, alumina-Al and iron-Fe)
display the high values for all stabilized peat are almost certainly because of SCBA
and K7 presence in the mixtures. For EDX findings of optimum mixtures (PCB1-20
@ Figure 4.7e), it was clearly shown the highest intensity (peak) of the elements of
Ca, Si, Al and O if compared to other stabilized peat. It is important to note that the
four elements are essential for the formation of CSH and CASH crystals, which are
the main cementation products of the stabilized soil [12; 13]. Obvious decrement of
carbon elements percentage was observed after Hokkaido peat was stabilized. For
instance, by comparing P mixtures with optimum mixtures (PCB1-20), the carbon
elements fell dramatically from 58% to 7%. This finding proves that neutralization of
organic matter in peat by peat-cement-bagasse ash combinations are going very well.
Based on same comparison above, calcium constituent proportion shows significant
increment from 1% to 35%. The high Ca concentration in the stabilized peat
specimens confirms that a large number of calcium ions were produced from the
rapid cement hydration process. This promoted alkaline condition, in which more
silica and alumina became soluble in the soil–cement admixture. This enabled
secondary pozzolanic reaction to take place, of which additional cementation bonds
of mainly secondary calcium silicate hydrates were developed [3]. At mix binder
PCB1-30 (Figure 4.7f), carbon and main pozzolanic minerals (silica and alumina)
demonstrates the increment intensity while the calcium was declining. This finding
becomes evidence why the SEM of PCB1-30 shows the large void images and more

102
coarse particles were detected. This is due to the limited formation of primary
cementation products to bind the soil because the soil organic matter tends to retain
the calcium ions produced from cement hydrolysis, resulting in a limited amount of
calcium hydroxide (CH) that could react with silica and alumina of SCBA to yield
secondary pozzolanic products during the pozzolanic reaction.
Figure 4.7: Test results of stabilized peat of PC and PCB1 mixtures on SEM (left
side @ a to c) and EDX (right side @ d to f)

103
Figure 4.8 represents the assessment products of stabilized peat of PCB2-5
and PCB3-10 mixtures on the SEM and EDX test. Overall, it was noticed that the
results are having some similarity to the results shown in Figure 4.7. For example,
Figure 4.8a shows that PCB2-5 mixtures have some similar pattern of the stabilized
parts area with PC mixture where coagulated hydrated gel could be seen. It may
happen is because of cement content is replaced only at 5% by SCBA 2 in order to
obtain the optimum mixture. That is means that the OPC is still the main admixtures
in this blend and almost retain its micrograph behavior. It can be said that this
mixture was generated mostly by primary cement hydration process like mentioned
in Chapter 3 (Eqn. 3.1 under Subtopic 3.4.2) and followed by the little pozzolanic
reaction of SCBA 2. However, PCB2-5 shows the slight denser arrangement with
fewer voids compared to PC mixture that may be attributed by SCBA 2 existence. It
also seen the clumps were developed by combination of SCBA particles and cement
gel products. This clump conversely is different with SEM results of PCB1-20
mixtures where PCB2-5 seems shows there are more coarse SCBA particles that
covered by cement products. The reactive and finer particles of SCBA 1 become the
strong reason why this could be happen. The densification in PCB3-10 (Figure 4.8b)
displays the almost same stabilized structure with PCB1-20 mixtures that perhaps
because of SCBA 1 inclusion effect. However, PCB3-10 shows more heterogeneity
arrangement together with some of coarse SCBA particles that probably contributed
by SCBA 2 in this mixtures.
It was apparent the similar amount of C, Ca, Si and Al elements between
PCB1-20 and PCB3-10. Percentage of Si and Al compounds in PCB1-20 is detected
slightly lower than PCB3-10 probably because of there are more pozzolanic reaction
occurred which involves these elements. In this reaction, Si and Al are the most vital
elements to generate additional CSH and CASH. When organic matter smoothly
counteracted from the peat, cement hydrolysis able to release more CH from primary
hydration and consequently more pozzolanic reaction is likely happened to produce
more secondary pozzolanic products. This is also become the reason why the UCS
results of these two mixture gave comparable results with 386kPa and 363kPa
respectively. However, EDX plot proves that PCB1-20 portrays higher intensity rate
of Ca, Si and Al components than PCB3-10 like shown in Figure 4.9.

104
Figure 4.8: Test results of stabilized peat of PCB2-5 and PCB3-10 mixtures on SEM
(left side @ a and b) and EDX (right side @ c and d)
Figure 4.9: EDX plot results of PCB1-20 and PCB3-10

105
Other possible reasons of slight difference of obtained UCS for PCB1-20 and
PCB3-10 are an effect of CaCl2 and the change of particle size during mixing. Figure
4.10 portrays the effect of CaCl2 on the strength activity index (SAI) for all PCB at 7
days of curing. Obviously seen that when inclusion 3% of CaCl2 into PCB3, the SAI
go up almost reach to similar SAI of PCB1. In contrast, SAI of PCB1 mixture was
lower at 3% of CaCl2 inclusion compare to without CaCl2. This state happened
because the CaCl2 amount is highly related to cement content in produce higher
strength. With higher dosage of cement, there are more hydration occurred especially
at early stage. As known, PCB3-10 mixture consists of 90% of OPC while PCB1-20
is made of 80% of OPC and as a result, the obtained UCS between PCB1-20 and
PCB3-10 is comparable. Figure 4.11 displays the particle size distribution of all
SCBA. As mentioned in previous chapter, SCBA 3 was prepared by mixing both
SCBA 1 and SCBA 2 equally. Logically, particle size results should show the
intermediate distribution. However, clearly that particle size of SCBA 3 becomes
similar to PCB1 especially after 10µm. These results possibly due to mixer blade
effect and finally affect the results of UCS of PCB mixtures.
Figure 4.10: Effect of calcium chloride, CaCl2 on the strength activity index

106
Figure 4.11: Particle size distribution of all SCBA
Table 4.4 represents the summary of EDX test results of various stabilization
factors on the PCB1-20 mixtures. As described previously in Chapter 3, among the
factors that included in this study are cement effect, preloading effect, silica sand
effect and calcium chloride effect. The optimum mixture (PCB1-20) was used as
references for the purpose of comparison valuation. For cement effect, the inclusion
of 100kg/m3 or PCB1-20-C1 (Point 2) was chosen for comparison purpose to the
optimum one (Point 1). This OPC amount is the minimum dosage used in the cement
effect investigation. The UCS and EDX results of the OPC dosage effect of PCB1-20
mixtures were displayed in Figure 4.12. Perceptibly, calcium compounds dropped
when the OPC quantity was reduced from 300 kg/m3 in the optimum mixture to 100
kg/m3 in PCB1-20-C1 mixtures. In the same time, carbon and oxide elements were
increased which connotes there are still a lot of organic matter that not counteracted.
Moreover, the percentages of silica and alumina (contributed by K7 and SCBA) also
higher indicate that no or very little pozzolanic reaction involve in this mixture.
These occurrences happened because when insufficient cement is added, hydration
and pozzolanic reaction become lower and effective neutralization of humid acids
within the soil is not achieved. Consequently, the strength becomes smaller. As can
be seen in Figure 4.12, UCS of PCB1-20-C1 mixture shows the decrement as much
as 15 times compared to optimum mixtures and slightly higher than untreated peat.

107
Table 4.4: Summary of EDX test results of various stabilization factors on the PCB1-
20 mixtures
Figure 4.13 to Figure 4.15 shows the UCS and EDX of preloading rate, K7
dosage and CaCl2 composition effect on PCB1-20 mixtures (Point 1). All the
outcomes displays almost the same pattern which is the higher calcium together with
lower carbon mixtures will gain the greater UCS. It clearly sees in the Figure 4.13,
the calcium reduce while silica percentage rose if there is no preloading (PCB1-20-
L0) subjected to samples. These results prove that when preloading throughout
curing process will increase the surface contact between soil particles and admixtures
during hydration course. When there is more interaction of the soil material with the
binder, there are easier and more CSH and CASH could be produced. Moreover,
Figure 4.13 revealed that preloading effect contributes the significant stabilization
Sample Point C O Ca Si Al Fe
1 5.97 29.17 35.98 10.43 3.92 3.40
2 7.90 29.63 34.26 9.54 3.55 4.64
3 6.44 30.86 34.86 10.16 3.73 2.73
Avg 6.77 29.89 35.03 10.04 3.73 3.59
Std. dev. 0.82 0.71 0.71 0.37 0.15 0.79
Std. err. 0.47 0.41 0.41 0.22 0.09 0.46
1 14.03 40.15 4.89 22.40 8.19 0.98
2 12.49 39.61 4.22 23.63 9.01 1.31
3 12.87 40.57 4.51 23.37 8.71 0.94
Avg 13.13 40.11 4.54 23.13 8.64 1.08
Std. dev. 0.66 0.39 0.27 0.53 0.34 0.17
Std. err. 0.38 0.23 0.16 0.31 0.20 0.10
1 18.53 44.23 12.28 18.17 2.93 0.86
2 14.70 41.23 12.50 24.12 3.57 0.91
3 14.26 41.28 12.61 23.62 4.21 0.36
Avg 15.83 42.25 12.46 21.97 3.57 0.71
Std. dev. 1.92 1.40 0.14 2.69 0.52 0.25
Std. err. 1.11 0.81 0.08 1.56 0.30 0.14
1 21.30 43.22 13.66 9.12 3.30 0.98
2 20.79 42.64 13.87 9.95 3.49 1.53
3 21.63 41.74 13.29 9.98 3.62 2.20
Avg 21.24 42.53 13.61 9.68 3.47 1.57
Std. dev. 0.35 0.61 0.24 0.40 0.13 0.50
Std. err. 0.20 0.35 0.14 0.23 0.08 0.29
1 18.29 36.04 19.79 10.38 3.62 2.20
2 16.42 34.75 22.10 11.38 3.99 1.95
3 14.05 38.82 21.86 11.26 3.79 1.88
Avg 16.25 36.54 21.25 11.01 3.80 2.01
Std. dev. 1.73 1.70 1.04 0.45 0.15 0.14
Std. err. 1.00 0.98 0.60 0.26 0.09 0.08
Opt.
PCB1-20
C1
L0
K0
CC0
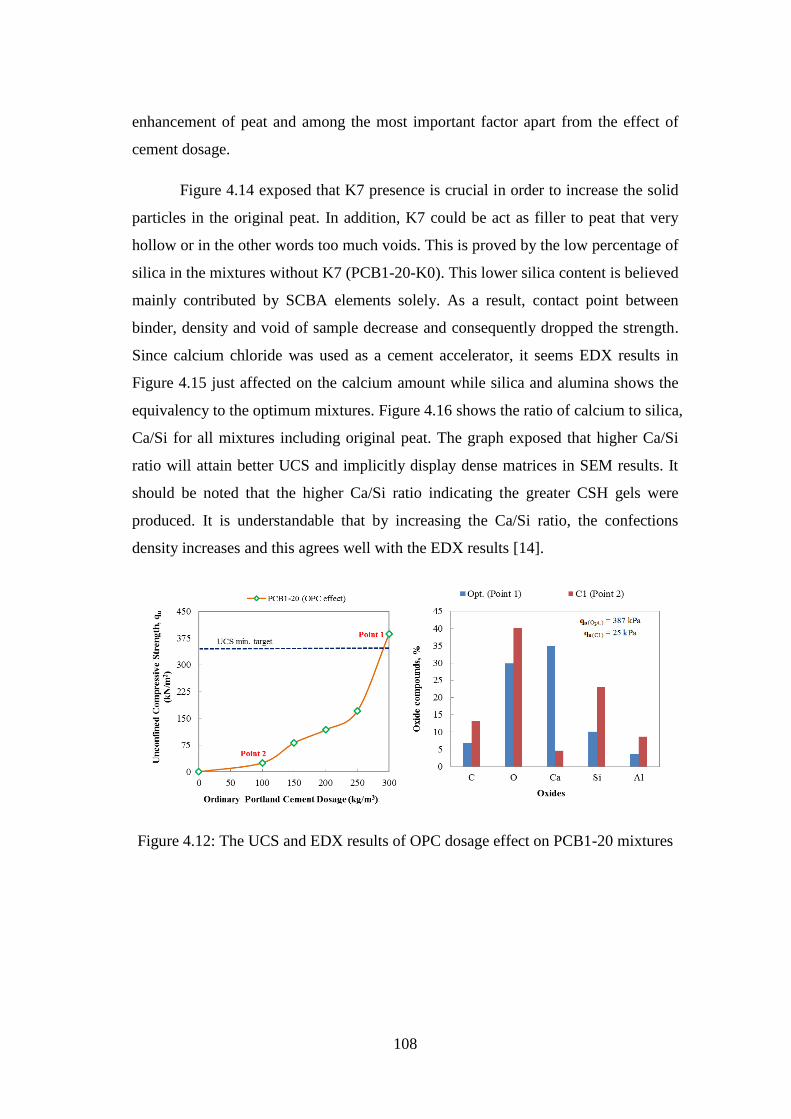
108
enhancement of peat and among the most important factor apart from the effect of
cement dosage.
Figure 4.14 exposed that K7 presence is crucial in order to increase the solid
particles in the original peat. In addition, K7 could be act as filler to peat that very
hollow or in the other words too much voids. This is proved by the low percentage of
silica in the mixtures without K7 (PCB1-20-K0). This lower silica content is believed
mainly contributed by SCBA elements solely. As a result, contact point between
binder, density and void of sample decrease and consequently dropped the strength.
Since calcium chloride was used as a cement accelerator, it seems EDX results in
Figure 4.15 just affected on the calcium amount while silica and alumina shows the
equivalency to the optimum mixtures. Figure 4.16 shows the ratio of calcium to silica,
Ca/Si for all mixtures including original peat. The graph exposed that higher Ca/Si
ratio will attain better UCS and implicitly display dense matrices in SEM results. It
should be noted that the higher Ca/Si ratio indicating the greater CSH gels were
produced. It is understandable that by increasing the Ca/Si ratio, the confections
density increases and this agrees well with the EDX results [14].
Figure 4.12: The UCS and EDX results of OPC dosage effect on PCB1-20 mixtures

109
Figure 4.13: The UCS and EDX results of preloading effect on PCB1-20 mixtures
Figure 4.14: The UCS and EDX results of K7 effect on PCB1-20 mixtures
Figure 4.15: The UCS and EDX results of CaCl2 effect on PCB1-20 mixtures

110
Figure 4.16: Ratio of calcium to silica for all mixtures
4.4 Summary
As summary, objectives of Chapter 4 were achieved. Verification of the
strength results gained in Chapter 3 was accomplished. The strength improvement
mechanisms of stabilized peat were observed by focusing on the microstructure and
chemical composition enhancement. The summary of the UCS and EDX results for
all mixtures were depicts in Figure 4.17 and Figure 4.18.
Overall, it can be stated that the stabilized soil is characterized by a well
cemented soil medium with tiny pore spaces within it as a result of the pozzolanic
activity of SCBA and other admixtures. The reactive and finer particles of SCBA can
be said as one of the strong reason why this could be happen. The oxide compound
percentages from EDX results clearly depict that lower carbon (C) and higher
calcium (Ca) oxide fractions shows the better results of stabilized peat strength
(UCS). The essential pozzolanic oxide compounds (SiO2 and Al2O3) display the high
values for stabilized peat mainly because of SCBA and K7 presence. In secondary
pozzolanic reaction, Si and Al are the most vital elements to generate additional CSH
and CASH. When organic matter smoothly counteracted from the peat, cement
hydrolysis able to release more CH from primary hydration and consequently more
pozzolanic reaction is likely happened to produce more secondary pozzolanic
products.

111
An optimum mixture (PCB1-20) shows the highest intensity (peak) of the
elements of Ca, Si, Al and O if compared to other stabilized peat. It is important to
note that the four elements are essential for the formation of CSH and CASH crystals.
The high Ca concentration in the stabilized peat specimens proves that a great
quantity of calcium ions were produced from the rapid cement hydration process and
eventually promoted alkaline condition. In this condition, more silica and alumina
able to involved in secondary pozzolanic reaction. This process then leads to higher
strength obtained in the mixtures. When insufficient cement is added, hydration and
pozzolanic reaction become lower and effective neutralization of humid acids within
the soil is not achieved. As results, amount of calcium hydroxide (CH) that could
react with silica and alumina of SCBA to yield secondary pozzolanic products during
the pozzolanic reaction become inadequate. Consequently, the strength becomes
smaller.
Figure 4.17: Summary of the UCS and EDX results of P, PC and PCB mixtures

112
Figure 4.18: Summary of the UCS and EDX results of various effect of admixtures
on PCB1-20 mixtures

113
4.5 References
[1] Wikipedia, 2015. Scanning electron microscope. 18 June. Wikipedia, the free
encyclopedia. https://en.wikipedia.org/?title=Scanning_electron_microscope.
[2] Wikipedia, 2015. Energy-dispersive X-ray spectroscopy. 18 June. Wikipedia, the
free encyclopedia. https://en.wikipedia.org/wiki/Energy-dispersive_X-
ray_spectroscopy#cite_note-2.
[3] Wong, L.S., Hashim, R. and Ali, F., 2013. Improved strength and reduced
permeability of stabilized peat: Focus on application of kaolin as a pozzolanic
additive. Construction and Building Materials, 40: 783-792.
[4] Faria, K.C.P., Gurgel, R.F. and Holanda, J.N.F., 2012. Recycling of sugarcane
bagasse ash waste in the production of clay bricks. Journal of Environmental
Management, 101: 7-12.
[5] Frias, M., Villar, E. and Savastano, H., 2011. Brazilian sugar cane bagasse ashes
from the cogeneration industry as active pozzolans for cement manufacture.
Cement & Concrete Composites, 33(4): 490-496.
[6] Cordeiro, G.C., Toledo Filho, R.D., Tavares, L.M. and Fairbairn, E.M.R., 2009.
Ultrafine grinding of sugar cane bagasse ash for application as pozzolanic
admixture in concrete. Cement and Concrete Research 39, 110-115.
[7] Sales, A. and Lima, S.A., 2010. Use of Brazilian sugarcane bagasse ash in
concrete as sand replacement. Waste Management, 30(6): 1114-1122.
[8] Paya, J., Monzo, J., Borrachero, M.V., Diaz-Pinzon, L. and Ordonez, L.M., 2002.
Sugar-cane bagasse ash (SCBA): studies on its properties for reusing in
concrete production. Journal of Chemical Technology and Biotechnology,
77(3): 321-325.
[9] Alavez-Ramirez, R., Montes-Garcia, P., Martinez-Reyes, J., Altamirano-Juarez,
D.C. and Gochi-Ponce, Y., 2012. The use of sugarcane bagasse ash and lime
to improve the durability and mechanical properties of compacted soil blocks.
Construction and Building Materials, 34: 296-305.
[10] Isaia, G.C., Gastaldini, A.L.G. and Moraes, R., 2003. Physical and pozzolanic
action of mineral additions on the mechanical strength of high-performance
concrete. Cement & Concrete Composites, 25(1): 69-76.

114
[11] Wikipedia, 2015. Portland cement. 24 June. Wikipedia, the free encyclopedia.
https://en.wikipedia.org/?title=Portland_cement.
[12] Wong, L.S., Hashim, R. and Ali, F., 2013. Utilization of sodium bentonite to
maximize the filler and pozzolanic effects of stabilized peat. Engineering
Geology, 152(1): 56-66.
[13] Lav, A.H. and Lav, M.A., 2000. Microstructural development of stabilized fly
ash as pavement base material. Journal of Materials in Civil Engineering,
12(2): 157-163.
[14] Kazemian, S., Prasad, A., Huat, B.B.K., Mohammad, T.A. and Aziz, F.N.A.A.,
2013. Stabilization of tropical peat by chemical grout. Journal of the Chinese
Institute of Engineers, 36(1): 114-128.

115
CHAPTER 5
EVALUATION OF SUGARCANE BAGASSE ASH
(SCBA) QUALITY CHARACTERISTICS ON
POZZOLANIC EFFECT IN STABILIZED PEAT
5.1 Introduction
This chapter considered about the evaluation of sugarcane bagasse ash
(SCBA) quality characteristics on pozzolanic effect in stabilized peat. Pozzolans play
an important role when added to Portland cement because they usually increase the
mechanical strength and durability of concrete structures depending on its reactivity.
Higher reactivity of pozzolan has more cementitious strength value and consequently
the amount of cement reduction will be greater. The most important effects in the
cementitious paste microstructure are chemical effect and physical or filler effect [1;
2].
In recent science, regression analysis is an essential part of virtually almost
any data reduction process. Popular spreadsheet programs such as Microsoft Excel
provide comprehensive statistical program packages, which include a regression tool
among many others. Regression models analysis can be classified as the relationship
of regression function, between one dependent variable, y and several others
independent variables, xi. Regression function also includes a set of unknown
parameters, bi. If a regression function is linear in the parameters (but not necessarily
in the independent variables) we term it a linear regression model. Otherwise, the
model is called non-linear. Linear regression models with more than one independent
variable are referred to as multiple linear models, as opposed to simple linear models

116
with one independent variable [3]. Multiple linear models can be expressed by
mathematical formula as shown below;
0 1 1 2 2 i iy b b x b x b x (5.1)
Where;
y = dependent variable (predicted by a regression model)
i = number of independent variables (number of coefficients)
xi = ith independent variable
bi = ith coefficient corresponding to xi
b0 = intercept (or constant)
The main aim of multiple linear regression analysis is to determine the best
set of parameters; bi such that the model predicts experimental values of the
dependent variable as accurately as possible (i.e. calculated values ought to be close
to experimental values). Furthermore, the model itself must be evaluated whether it
is adequate to fit the observed experimental data and required to check whether all
terms in model are significant.
5.2 Methodology
Pozzolanic effect of SCBA was determined from the UCS of curing effect
results by making a peat-cement (PC) mixture as a reference. As stated in Chapter 3
and Chapter 4, the main different between SCBA 1 and 2 characteristics are their
particle sizes and chemical composition. The SCBA 1 was recorded the finer
particles and higher ratio of calcium to silica (Ca/Si) composition if compared to
SCBA 2. Janz and Johansson [4] point out that the Ca/Si ratio, which stands for
relative abundance of CaO and SiO2, is the sign of the potential for pozzolanic
reactions and those binders with larger Ca/Si ratios are likely to be more effective
stabilizers. This important characteristic also had been studied by Tastan et al. [5] on
organic soil stabilization by using fly ash. Therefore, it is important to estimate the
effect of these characteristics on the strength of- stabilized peat by using SCBA.

117
In order to achieve this goal, all the average unconfined strength, qu results
were collected for carrying out a statistical analysis. Important factors that include in
this analysis are SCBA replacement percentage, SCBA average particle sizes (D50),
curing durations (D), cement dosage (C), silica sand dosage (S) and preloading
during curing (P). Each of these variables was included in a multiple linear
regression analysis to find an equation that can be used to predict the qu of peat-
cement-bagasse ash (PCB) mixtures. For the final results, the simple formula and
graphs were developed with the aim of strength prediction. This prediction model
will emphasize the chemical and physical characteristic of SCBA for achieving the
minimum target of strength. The flowcharts of this chapter implementation can be
illustrated in Figure 5.1.
CHAPTER 5: Evaluation of
Sugarcane Bagasse Ash (SCBA)
Quality Characteristics on
Pozzolanic Effect in Stabilized Peat
Estimation of UCS -
base on SCBA physical &
chemical characteristics
Recommended
minimum amount of
admixtures (from Chapter 3)
& chemical compositions
results (from Chapter4)
The quality of SCBA
characteristics were
recommended (D50 & Ca/Si)
Assessment the
amount of pozzolanic
involved in mixtures
Figure 5.1: Execution planning of Chapter 5

118
5.3 Results and discussions
Performance/amount of pozzolanic effect (physical and chemical effect) on
stabilized peat
Figure 5.2 indicates the effect of curing durations on the strength activity
index (SAI) of the samples. This graph illustrates the amount of pozzolanic effect on
all optimum PCB. The strength activity index was calculated by follow the
procedures that provided in ASTM-C311 [6]. The dotted line with PC sign is the
references line (PC control mixtures) which used to compare the strength activity
index among the tested specimens. At 7 days curing time, it was visibly shows the
highest strength activity index and all optimum PCB mixtures were observed exceed
the PC line. One of the probable reasons this condition could be happened is because
the strength activity index of optimum PCB mixtures due to filler effect is higher
than due to pozzolanic reaction at early curing days. This findings was coincides to
the obtained results of Tangpagasit et al. [7] that concludes that the packing effect of
fly ash mortar is higher than the pozzolanic reaction at initial ages. Similarly, Isaia et
al. [1] state that physical or filler effect increased more than the pozolanic reaction
when the results for the same strength values are compared. Micro-filler effect is at
least equally important or even more significant than the pozzolanic effect [8; 9].
Pozzolanic reactions are highly related to released calcium hydroxide
(CaOH2) or lime that depends on the amount of cement hydration. At early ages only
a small amount of cement has hydrated and thus the amount of released CaOH2
becomes low and limited. Consequent to this situation, pozzolanic reaction also is
small at early curing times and the pozzolan particles that are not completely reacted
may fill the voids and increase mixtures density [2; 10]. At this moment, filler or
packing effect of SCBA take part as the significant contributor of samples
compressive strength. Filler effect is an appropriate arrangement of small particles
which block the voids and contribute to the increment of compressive strength
without any chemical reaction [1; 7; 9]. However, it also become possible that the
higher strength gained at early age is because the great combination of SCBA
physical and chemical effect. Inclusion of CaCl2 is well known could create high

119
cement hydration at early time. Therefore, along with filler effect that mentioned
above, the strength of the sample that curing under 20 kPa pressure at 7 days
recorded the greatest value.
Conversely, between 7 and 28 days of curing periods, the highest strength
activity index demonstrates the slight declination and levelled off. Just after 28 days
of curing durations onwards, these strength activity index back to increase minimally.
This could be occurred by the reason of the fact that cement hydration (PC mixtures)
is normally rapid and effective at first month but almost stop or complete after that
duration while pozzolan reaction can be occurred continuously until several month or
even years [11-13]. The overall results of Figure 5.2 were also exposed that the finer
SCBA (SCBA 1) particles provide higher compressive strength if compared to coarse
SCBA (SCBA 2 and SCBA 3). The physical action of the pozzolans provides a
denser, more homogeneous and uniform paste that may reduce the wall effect in the
transition zone between the paste and the soil particles. This weaker zone is
strengthened due to the higher bond between these two phases, improving the PCB
mixtures microstructures and properties [8; 9; 14; 15].
In Figure 5.3, the comparative study analysis between an effect of silica sand,
K7 and the strength activity index was illustrated. This comparison comprises of all
optimum mixture of PCB (with 500kg/m3 K7) and the mixtures that without any K7.
The main purpose of this figure is to determine an effect of pozzolan reaction
produced by SCBA. Since the K7 or silica sand is almost inert (non-reactive
materials) which not involve in any chemical reactions, hence the pozzolanic
reaction amount might be attain by calculating the differences of strength activity
index between the mixtures with and without K7. Obviously from the mixtures
without K7 for PCB1-20, the pozzolanic reaction of SCBA seems gave the
significant improvement (contribute about 18% of strength activity index) while on
the other hand K7 effect only contribute approximately 5% of strength activity index
for the same SCBA. The amount of these reactions were evaluate by subtract the
strength activity index of mixtures without K7 to PC mixtures and the optimum
mixtures. A PCB3-10 mixture similarly shows that pozzolanic effect of SCBA is
better than K7 influence. In contrast, PCB2-5 demonstrates that SCBA 2 (low quality

120
SCBA) pozzolanic effect was insufficient and not recommended to use in the PCB
mixtures considering its strength activity index is lesser than PC mixtures. Inclusion
of K7 shows the better improvement of strength for PCB2-5.
Figure 5.2: Effect of curing durations on the strength activity index of all optimum
PCB
Figure 5.3: Effect of silica sand, K7 on the strength activity index
Estimation of the strength (qu) that focusing on the physical and chemical
effect of SCBA
Table 5.1 represents the collected results for multiple regression analysis of peat
stabilization by SCBA focusing on median particle size and Ca/Si ratio effects. Each
UCS average results were obtained from 3 or at least 2 tested samples. The data

121
comprises all the compressive strength of various factors for the PC, PCB1 and
PCB2 mixtures. The PCB 1 and PCB 2 blends were represents the good and low
quality of SCBA respectively. This analysis will be emphasis on the physical and
chemical effect of SCBA. For the physical effect, median particle size D50 was
chosen as the indicator parameter. On the other hand, Ca/Si ratio had been used in
order to determine the SCBA quality in term of chemical effect.
The important factors of peat stabilization that include in this statistical
analysis were SCBA replacement percentage (B), SCBA average particle sizes (D50),
curing durations (D), cement dosage (C), silica sand dosage (S) and preloading
during curing (P). Each of these variables was included in a linear regression analysis
to find an equation that can be used to predict the compressive strength, qu of PCB
mixtures. The median particle size of SCBA 1 and SCBA 2 are 0.018mm and
0.26mm respectively while their Ca/Si ratios are 0.134 and 0.036. The results of peat
stabilization effect factors were taken and accumulate from the Chapter 3.
Table 5.2 displays the correlation coefficients between UCS and various
factor of peat stabilization by SCBA focusing on median particle size and Ca/Si ratio
effects. Basically, correlation can express something about the relationship between
variables. It is used to understand whether the relationship is positive or negative and
the strength of relationship. Correlation is a powerful tool that provides these vital
pieces of information. Statistical correlation is measured by what is called coefficient
of correlation (r). Its numerical value ranges from +1.0 to -1.0. It gives us an
indication of the strength of relationship. In general, r > 0 indicates positive
relationship, r < 0 indicates negative relationship while r = 0 indicates no relationship
(or that the variables are independent and not related). Here r = +1.0 describes a
perfect positive correlation and r = -1.0 describes a perfect negative correlation.
Closer the coefficients are to +1.0 and -1.0, greater is the strength of the relationship
between the variables. As a rule of thumb, the statistical correlation guidelines on
strength of relationship in Table 5.3 are often useful [16].

122
Table 5.1: Collected results for multiple regression analysis of peat stabilization by
SCBA focusing on median particle size and Ca/Si ratio effects
Unit kPa % mm Days kg/m3
kg/m3
kN/m2
Symbol q u B D 50 CaO 2 /SiO 2 D C S P
UCSavg SCBA D50 Ca/Si Curing OPC dosage K7 dosage Preloading
316 0 0 0 7 300 500 20
324 5 0.018 0.134 7 285 500 20
341 10 0.018 0.134 7 270 500 20
373 15 0.018 0.134 7 255 500 20
387 20 0.018 0.134 7 240 500 20
387 20 0.018 0.134 7 240 500 20
431 20 0.018 0.134 14 240 500 20
473 20 0.018 0.134 21 240 500 20
500 20 0.018 0.134 28 240 500 20
530 20 0.018 0.134 60 240 500 20
25 20 0.018 0.134 7 80 500 20
81 20 0.018 0.134 7 120 500 20
118 20 0.018 0.134 7 160 500 20
171 20 0.018 0.134 7 200 500 20
387 20 0.018 0.134 7 240 500 20
201 20 0.018 0.134 7 240 0 20
225 20 0.018 0.134 7 240 100 20
262 20 0.018 0.134 7 240 200 20
297 20 0.018 0.134 7 240 300 20
325 20 0.018 0.134 7 240 400 20
387 20 0.018 0.134 7 240 500 20
218 20 0.018 0.134 7 240 500 0
387 20 0.018 0.134 7 240 500 20
427 20 0.018 0.134 7 240 500 40
473 20 0.018 0.134 7 240 500 60
556 20 0.018 0.134 7 240 500 80
616 20 0.018 0.134 7 240 500 100
322 5 0.260 0.036 7 285 500 20
257 10 0.260 0.036 7 270 500 20
231 15 0.260 0.036 7 255 500 20
223 20 0.260 0.036 7 240 500 20
322 5 0.260 0.036 7 285 500 20
333 5 0.260 0.036 14 285 500 20
365 5 0.260 0.036 21 285 500 20
386 5 0.260 0.036 28 285 500 20
409 5 0.260 0.036 60 285 500 20
19 5 0.260 0.036 7 80 500 20
72 5 0.260 0.036 7 120 500 20
104 5 0.260 0.036 7 160 500 20
138 5 0.260 0.036 7 200 500 20
322 5 0.260 0.036 7 240 500 20
158 5 0.260 0.036 7 285 0 20
177 5 0.260 0.036 7 285 100 20
206 5 0.260 0.036 7 285 200 20
234 5 0.260 0.036 7 285 300 20
273 5 0.260 0.036 7 285 400 20
322 5 0.260 0.036 7 285 500 20
197 5 0.260 0.036 7 285 500 0
322 5 0.260 0.036 7 285 500 20
368 5 0.260 0.036 7 285 500 40
412 5 0.260 0.036 7 285 500 60
445 5 0.260 0.036 7 285 500 80
476 5 0.260 0.036 7 285 500 100
SC
BA
2
B effect
D effect
C effect
S effect
P effect
PC
SC
BA
1
B effect
D effect
C effect
S effect
P effect

123
Table 5.2: Correlation between UCS and various factor of peat stabilization by
SCBA focusing on median particle size and Ca/Si ratio effects
Referring to Table 5.3, an effect of OPC dosage and preloading shows the
strong relationship to UCS gained which both of this effect factors are more than 0.5.
With 0.35, curing effect can be grouped as moderate relationship to UCS expanded.
Replacement of SCBA percentage into peat-cement mixtures shows the lowest
reading of relationship with only 0.2 and categorized as weak correlations. Although
this value is small, it is still should be included in this analysis since the replacement
of SCBA percentage inextricably linked with cement dosage which mentioned
previously had very high correlation to better PCB mixture strength. Nonetheless,
SCBA crucial characteristics shows the better potential in UCS increments which
mean particle sizes, D50 and Ca/Si ratio share the same values of 0.25. Negative signs
in D50 anticipate that finer particles of SCBA could improve mixtures strength. The
table also revealed that SCBA is highly depending to these two vital characteristics at
approximately 80% to 90% of correlations (3rd column). Nevertheless, coefficient of
correlation or ‘r’ should not be used to say anything about cause and effect
relationship. Put differently, by examining the value of 'r', we could conclude that
variables x and y are related. However the same value of 'r' does not tell us if x
influences y or the other way round. Statistical correlation should not be the primary
tool used to study causation, because of the problem with third variables [16].
UCSavg SCBA D50 Ca/Si Curing OPC dosage K7 dosage Preloading
UCSavg 1.00
SCBA 0.20 1.00
D50 -0.25 -0.81 1.00
Ca/Si 0.25 0.88 -0.93 1.00
Curing 0.35 0.01 0.01 0.01 1.00
OPC dosage 0.55 -0.36 0.26 -0.31 0.12 1.00
K7 dosage 0.29 -0.01 -0.01 -0.01 0.14 -0.16 1.00
Preloading 0.54 0.01 0.01 0.01 -0.11 0.12 0.14 1.00

124
Table 5.3: Statistical correlation guidelines on strength of relationship
Sources: [16]
In order to verify the model accuracy, two main criteria must be calculated
and checked in this analysis. The first one is regression statistic and the second, an
analysis of the variance (ANOVA). Table 5.4 shows the regression statistics of
median particle size, D50 (physical effect) and Ca/Si ratio on pozzolanic physical
effects analysis. The multiple correlations coefficient, R is around 0.95. This
indicates that the correlation among the independent and dependent variables is
positive. This statistic, which ranges from -1 to +1, does not indicate statistical
significance of this correlation. The coefficient of determination, R2 and adjusted R
square value indicates the wellness of the independent variable estimation. The
closer R2 is to one, the better the model describes the data [3; 17]. In the case of a
perfect fit R2=1. In this case, it point out about 90% of the observed UCS can be
predicted using this model for both vital characteristics of SCBA. The adjusted R2 is
preferable value that is commonly used in simple linear regression. It adjusts the R2
value to consider both the sample size and the number of predictors [17]. Strictly
speaking adjusted R2 should be used as an indicator of an adequacy of the model,
since it takes in to account not only deviations, but also numbers of degrees of
freedom. Standard error is an estimate of the deviation of experimental values of the
dependent variable y with respect to those predicted by the regression model. It is
used in statistics for different purposes [3]. There were 53 observations for both
regression statistics.
Value of rStrength of
relationship
-1.0 to -0.5 or
1.0 to 0.5Strong
-0.5 to -0.3 or
0.3 to 0.5Moderate
-0.3 to -0.1 or
0.1 to 0.3Weak
-0.1 to 0.1None or very
weak

125
Table 5.4: Regression statistics of median particle size, D50 (left) and Ca/Si ratio
(right) on pozzolanic effects analysis
Table 5.5 and Table 5.6 represents the ANOVA of median particle size, D50
and Ca/Si ratio on pozzolanic physical effects analysis respectively. The signs df, SS,
MS, F and significance F (PR)denotes the degrees of freedom, sum of squares, mean
square (variance), test of significance and F-numbers. In study case, PR= 1.91E-20
and 8.19E-20, the approximate corresponding level of confidence 1 - PR = 0.999.
Therefore with the confidence near to 100%, it can be said that at least one of
coefficients b1 and b2 is significant for the model illustrated in Eqn. 5.1.This proved
there was a significant relationship among independent variables and the dependent
variable. A coefficient in ANOVA output represents the bi coefficients from the Eqn.
5.1. The t-Stat is the ratio of the predictors’ coefficient to the standard error. The P
value is the probability that the null hypothesis is correct. If the corresponding P
value for each independent variable is less than an arbitrary value of 0.05, the null
hypothesis is rejected. In this series of analyses, the null hypothesis was defined as
the absence of a significant relationship between the independent variable and
dependent variable [17]. In this analysis, all the predictors had a P value of <0.05;
hence, prove that all of the predictors could affected the response.
Multiple R 0.94
R Square 0.89
Adjusted R Square 0.88
Standard Error 47.68
Observations 53
Regression Statistics
Multiple R 0.95
R Square 0.89
Adjusted R Square 0.88
Standard Error 46.80
Observations 53
Regression Statistics

126
Table 5.5: Analysis of variance (ANOVA) on pozzolanic physical effects analysis
Table 5.6: Analysis of variance (ANOVA) on pozzolanic chemical effects analysis
The following regression model for predict the qu of peat-cement-bagasse ash
(PCB) mixtures was developed from the analysis:
qu (stabilized) = 4.32B – 0.26D50 + 3.42D + 1.7C + 0.3S + 2.97P – 371.43 (5.2)
qu (stabilized) = 2.64B – 863Ca/Si + 3.33D + 1.73C + 0.3S + 2.93P – 466.3 (5.3)
where B= SCBA % of OPC replacement; D= D50 of SCBA in µm; C= OPC dosage
in kg/m3; S= K7 dosage in kg/m3; P= Preloading during curing in kN/m2. Eqn. 5.2
represents the regression model for physical effects, D50 while Eqn. 5.3 for chemical
effects, Ca/Si ratio. A comparison of the predicted versus experimental unconfined
compressive strength of median particle size, D50 and Ca/Si ratio on pozzolanic
df SS MS F Significance F
Regression 6 851079.54 141846.59 62.39 1.91E-20
Residual 46 104586.27 2273.61
Total 52 955665.81
Coefficients Standard Error t Stat P-value Lower 95% Upper 95%
Intercept -371.43 58.32 -6.37 8.10E-08 -488.83 -254.03
SCBA 4.32 1.58 2.74 8.67E-03 1.15 7.49
D50 -257.64 91.77 -2.81 7.30E-03 -442.37 -72.92
Curing days 3.42 0.62 5.48 1.71E-06 2.16 4.67
OPC dosage 1.70 0.14 11.83 1.48E-15 1.41 1.99
K7 dosage 0.30 0.05 5.69 8.39E-07 0.19 0.40
Preloading 2.97 0.33 8.98 1.11E-11 2.31 3.64
df SS MS F Significance F
Regression 6 854907.38 142484.56 65.05 8.19E-21
Residual 46 100758.43 2190.40
Total 52 955665.81
CoefficientsStandard Error t Stat P-value Lower 95% Upper 95%
Intercept -466.30 48.39 -9.64 1.30E-12 -563.70 -368.89
SCBA 2.64 1.90 1.39 1.71E-02 -1.18 6.46
Ca/Si 863.36 274.00 3.15 2.86E-03 311.83 1414.89
Curing days 3.33 0.61 5.44 1.95E-06 2.10 4.56
OPC dosage 1.73 0.14 12.29 3.94E-16 1.44 2.01
K7 dosage 0.30 0.05 5.99 3.02E-07 0.20 0.41
Preloading 2.93 0.32 9.01 9.97E-12 2.27 3.58

127
physical effects analysis is shown Figure 5.4. It shows that the regression model
represents the qu data is reasonably fit, with R2 = 0.89 for both SCBA characteristics.
Figure 5.4: Predicted versus experimental UCS of median particle size, D50 (left) and
Ca/Si ratio (right) on pozzolanic effects analysis
Generally, Eqn. 5.2 and 5.3 can be used at any values of multi-factor of
studied peat stabilization. However, from previous multi-factor in peat stabilization
results in Chapter 3, it was suggested the mixture that able to achieve minimum qu
target of 345kPa could be obtained at; Curing= 7days; OPC= 300kg/m3; K7=
500kg/m3; and P=20kPa (about 1m embankment). Therefore, the Eqn. 5.2 and Eqn.
5.3 can be simplified to;
qu (stabilized) = 0.78B – 0.26D50 + 369.55 (5.4)
qu (stabilized) = -2.54B + 863Ca/Si + 285.79 (5.5)
for physical effects and chemical effects respectively. From the Eqn. 5.4 and 5.5, the
correlation chart between predicted qu to D50 and Ca/Si ratio had been made like
shown in Figure 5.5. However, the developed charts were limited to apply on
Hokkaido peat or hemic peat stabilization with constant dosage/amount of cement,
silica sand and initial loading. According to Figure 5.5, the following inferences can
be made: (1) qu gained has a close relationship to D50 and Ca/Si ratio; (2) increase in
the SCBA percentage decreases the qu of the PCB mixture but depends on SCBA
particles size and its chemical characteristics; and (3) smaller size of D50 and larger
Ca/Si ratio indicates greater qu of the PCB mixture and simultaneously can decrease -

128
Figure 5.5: Effect of median particle size (top) and Ca/Si ratio (bottom) of SCBA on
UCS

129
the OPC inclusion percentages. In this investigation, in order to achieve minimum
UCS target, it is suggested the maximum D50 is should not exceed 80µm and Ca/Si
compositions should more than 0.083 for at least 5% SCBA replacement of OPC
content. So as to reach 20% SCBA replacement of OPC, D50 must finer than 36µm
while Ca/Si proportion ought to larger than 0.127. From this obtained results, Figure
5.6 had been construct for simplify the requirement of physical-chemical effect ratio
of SCBA in order achieved 345kPa (minimum strength target).
Figure 5.6: Ratio of physical-chemical ratio of SCBA versus SCBA percentage
inclusion
5.4 Summary
As summary, evaluation of SCBA quality characteristics on pozzolanic effect
in stabilized peat has been examined in this chapter. It can be summarized from the
experimental results that SCBA characteristics have made a significant influence on
the mechanical properties of the stabilized peat. Based on the outcome of the this
chapter analysis, the following concluding comments are made.

130
i. Curing duration of samples at 7 days was visibly shows the highest strength
activity index and all optimum PCB mixtures were observed exceed the PC line.
The probable reasons this condition could be happened is because;
a. the strength activity index of optimum PCB mixtures due to filler effect is
higher than due to pozzolanic reaction at early curing days.
b. the great combination of SCBA physical and chemical effect. Inclusion of
CaCl2 is well known could create high cement hydration at early time.
ii. Pozzolanic reaction still occurred after a month of curing. This could be
happened by the reason of the fact that cement hydration (PC mixtures) is
normally rapid and effective at first month but almost stop or complete after that
duration while pozzolan reaction can be occurred continuously until several
month.
iii. Effect of SCBA pozzolan was observed has more significance influence on the
strength activity index if compare to silica sand, K7 inclusion.
iv. Regression statistical analysis was successfully verified and completed. The
outcomes are;
a. qu gained has a close relationship to D50 and Ca/Si ratio of SCBA.
b. increase in the SCBA percentage decreases the qu of the PCB mixture but
depends on SCBA particles size and its chemical characteristics.
c. finer size of D50 and larger Ca/Si ratio indicates greater qu of the PCB
mixture and simultaneously can increase the SCBA percentage
replacement or on the other hand decrease the OPC inclusion percentages.
d. in this study, in order to achieve minimum UCS target , it is suggested the
maximum D50 is should not exceed 80µm and Ca/Si compositions should
more than 0.083 for at least 5% SCBA replacement of OPC content. So as
to reach 20% SCBA replacement of OPC, D50 must finer than 36µm
while Ca/Si proportion ought to larger than 0.127.

131
5.5 References
[1] Isaia, G.C., Gastaldini, A.L.G. and Moraes, R., 2003. Physical and pozzolanic
action of mineral additions on the mechanical strength of high-performance
concrete. Cement & Concrete Composites, 25(1): 69-76.
[2] Edwin, R.D., 2011. How Does Pozzolanic Reaction Make Concrete “Green”?,
World of Coal Ash (WOCA), Denver, CO, USA.
[3] Orlov, M.L., 1996. Multiple Linear Regression Analysis Using Microsoft Excel.
Chemistry Department, Oregon State University,
http://chemistry.oregonstate.edu/courses/ch361-464/ch464/RegrssnFnl.pdf.
[4] Janz, M. and Johansson, S.E., 2002. The function of different binding agents in
deep stabilization, Swedish Deep Stabilization Research Center, Linkoping:
SGI. 9.
[5] Tastan, E.O., Edil, T.B., Benson, C.H. and Aydilek, A.H., 2011. Stabilization of
Organic Soils with Fly Ash. Journal of Geotechnical and Geoenvironmental
Engineering, 137(9): 819-833.
[6] ASTM-C311, 2005. Standard Test Methods for Sampling and Testing Fly Ash or
Natural Pozzolans for Use in Portland-Cement Concrete. American Society
for Testing and Materials Standards, Pennsylvania, USA, Volume 04.02.
[7] Tangpagasit, J., Cheerarot, R., Jaturapitakkul, C. and Kiattikomol, K., 2005.
Packing effect and pozzolanic reaction of fly ash in mortar. Cement and
Concrete Research, 35(6): 1145-1151.
[8] Goldman, A. and Bentur, A., 1993. Effects of pozzolanic and non-reactive fillers
on the transition zone of high strength concrete. Maso JC, editor. RILEM
International Symposium on Interfaces in cementitious composites Toulouse,
1992, Proceedings. London: E&FN SPON; p. 53–62(RILEM Proceedings 18).
[9] Goldman, A. and Bentur, A., 1993. The influence of micro-fillers on
enhancement of concrete strength. Cem Concr Res;23:962–72.
[10] Berry, E.E., Hemmings, R.T., Zhang, M.H., Cornelius, B.J. and Golden, D.M.,
1994. Hydration in High-Volume Fly-Ash Concrete Binders. Aci Materials
Journal, 91(4): 382-389.
[11] EuroSoilStab, 2002. Development of design and construction methods to
stabilize soft organic soils. Design guide soft soil stabilization. CT97-0351.

132
Project No. BE 96-3177, Industrial & Materials TechnologiesProgramme
(Brite- EuRam III), European Commission.
[12] Wong, L.S., Hashim, R. and Ali, F.H., 2009. A Review on Experimental
Investigations of Peat Stabilization. Australian Journal of Basic and Applied
Sciences, 3(4): 3537-3552, 2009. ISSN 1991-8178.
[13] Allu, F.O., 2005. Mass stabilization Manual.
[14] Mehta, P.K. and Aitcin, P.C., 1990. Principles underlying production of
highperformance concrete. Cem Concr Aggregate;12(2):70–8.
[15] Roy, D.M., 1992. Advanced cement systems including CBC, DSP, MDF.
International Congress on the Chemistry of Cement, 9th, New Delhi, ,
Proceedings, vol. 4. New Delhi: National Council for Cement and Building
Materials; 1992. p. 357–80.
[16] Explorable.com, 2009. Statistical Correlation. Retrieved Aug 26, 2015 from
Explorable.com: https://explorable.com/statistical-correlation
[17] Motamedi, S., Song, K.I. and Hashim, R., 2015. Prediction of unconfined
compressive strength of pulverized fuel ash-cement-sand mixture. Materials
and Structures, 48(4): 1061-1073.

133
CHAPTER 6
EFFECTIVENESS OF OPTIMUM PEAT-CEMENT-
BAGASSE ASH (PCB) MIXTURES ON PEAT
DEFORMATION BEHAVIOUR
6.1 Introduction
This chapter illustrates the effectiveness of optimum peat-cement-bagasse ash
(PCB) mixtures on peat deformation behavior. Afterward, the outcomes were
compared to peat-cement (PC) mixture and untreated peat in order to analyze the
contribution of SCBA inclusion in stabilized peat.
The compressibility of soil commonly comprises three phases namely initial
compression, primary consolidation, and secondary compression. Initial compression
occurs instantaneously after the load is applied whereas primary and secondary
compressions depend upon the length of time the load is applied. The initial
compression occurs mainly due to the compression of gas within the pore spaces and
also due to the elastic compression of soil grains [1]. Primary consolidation observed
during the increase in effective vertical stress caused the dissipation of excess pore
water pressure. After the completion of dissipation of excess pore water pressure, the
secondary compression would take place at constant effective vertical stress.
The compression behavior of peat varies from the compression behavior of
other types of soils in two ways. First, the compression of peat is much larger than
that of other soils. Secondly, the creep portion of settlement plays a more significant
role in determining the total settlement of peat than of other soil types. The dominant
factors controlling the compressibility characteristics of peat include the fiber content,

134
natural water content, void ratio, initial permeability, nature and arrangement of soil
particles, and inter-particle chemical bonding in some of the soils. Determination of
compressibility of fibrous peat is usually based on the standard consolidation test [2;
3]. For more temperate regions, this subsidence rate was high for Malaysia as shown
in the Figure 6.1 [4; 5].
Figure 6.1: Subsidence rate versus groundwater level relationships for different areas
in the world [4]
The calculation of the settlement requires evaluation of soil parameters from
the compression curves which are usually obtained from laboratory Oedometer tests.
The results of incremental loading Oedometer tests are usually presented as the
relationship between void ratio, e, and effective vertical stress, σv’. The σv’ may be
plotted on a linear scale to determine the coefficient of volume change, mv or on
logarithmic scale to determine the compression index, Cc. As with mineral soils (silt
and clay), the settlement parameters of peat (i.e. consolidation settlement) may also
be determined from standard incremental Oedometer (one dimensional compression)
tests [6; 7]. The parameters are interpreted from traditional e log σv’ plots. There may
be differences in the magnitudes of various quantities measured but the general shape
of the consolidation curves appear reasonably similar and the formulation developed
for clay compression can be used to predict the magnitude and rate of settlement [7].

135
6.2 Methodology
Consolidation tests were carried out in the standard Oedometer apparatus on
the untreated (P) and stabilized peat (PC, PCB1-20 and PCB2-5) mixtures samples
that obtained from UCS test in Chapter 3. The flowchart that related to this chapter
had been shown in Figure 6.2. The sizes of specimens were 60 mm in diameter and
30 mm in height. The standard Oedometer tests comprised seven incremental load
stages and each load stage lasted 24 hours. An initial stress of 10 kPa was applied
and the stress was increased in steps at the end of each load stage using a load
increment ratio of unity until a final stress of 640 kPa had been applied.The detail
computations for this compressibility were shown in Appendix F.
CHAPTER 6 : Effectiveness of Optimum
Peat-Cement-Bagasse Ash (PCB) Mixtures
on Peat Deformation Behaviour
Settlement
parameter analysis
P vs PC vs PCB
Effect of curing
duration on
optimum mixtures
(from Chapter 3)
Interpretation of
compressibility
behaviour change
Figure 6.2: Flowchart of Chapter 6 experimental planning
6.3 Results and discussions
Void ratio (e), coefficient of permeability (k) and pre-consolidation pressure
(σc’)
The void ratio, e versus effective vertical stress, σv’ for untreated is shown in
Figure 6.3. The results reveal that untreated Hokkaido peat demonstrated the high e
and as a result contribute high coefficient of compression, Cc= Δe/ (Δ log σv’) with
about 9 and 4.9 respectively. The average value of the specific gravity, Gs of studied

136
Hokkaido peat (Gs= 1.67) was used in phase relationship to determine the initial void
ratio of the soil specimen employed in the experimental program. The high void ratio
is believed predominantly contributed by high water contents and liquid limit in peat.
This matter has also been discovered by Huat [7] and Den Haan [131]. However, the
void ratio was seen reduced with σv’ increment and consequently drop the k
significantly.
Figure 6.3: Void ratio, e versus effective vertical stress, σv’ for untreated peat
The relationship between e, k and σv’ for untreated Hokkaido peat was shown
in Figure 6.4. The k noticeably decreases once after the small load was subjected as
shown in Figure 6.4a. This is because peat represent the extreme form of soft soil and
subject large settlement even when subjected to moderate load [9]. The change in
permeability as a result of compression is drastic for peats (as compression proceeds
and void ratio decreases rapidly, permeability is greatly reduced as shown in Figure
6.4b). The application of consolidation pressure may induce a rearrangement of fiber
orientation and drastically reduces the void, causing a significant reduction in the
vertical permeability [10; 11]. In this study, e of untreated peat reduces from 9.6 to
2.4 while k decreases from 2.7E-08 to 3.2E-11 m/s which is mean as compression
proceeds and void ratio decreases rapidly. Permeability is greatly reduced roughly
1000-fold to a value comparable to that of clay. In general, the initial permeability of
peats is 100 -1000 times that of soft clays and silts [12] and Edil [13] stated that the

137
rate of decrease of k with decreasing e is usually higher than that in clays. A range of
the peat k between E-05 and E-08 m/s was obtained from previous studies [10; 14].
With 2.7E-08 for studied peat, it shows that hemic peat has lower permeability if
compared to typical fibrous type in literature review.
Figure 6.4: Relationship of coefficient of compressibility, k, effective vertical stress,
σv’ and void ratio, e of untreated peat
Another important characteristic of soil compressibility is the pre-
consolidation pressure, σc’. The two most commonly used methods for determining
(a)
(b)

138
the end of primary consolidation, namely the Taylor and Casagrande graphical
constructions from a void ratio or axial strain, ε versus time curve [10; 15]. The σc’
estimation of untreated Hokkaido peat was given approximately 25 kPa by using
Casagrande method [16] as shown in Figure 6.5. The obtained σc’ value has little in
common with peat from the USA, UK and Malaysia. Mesri et al. [2], the researchers
from the USA found the σc’ of his studied fibrous peat were lying between 30-34 kPa.
One of active peat researcher in UK, O' Kelly [17; 18] was observed on six kind of
UK peat which record the range of σc’ between 20 to 50 kPa. While in Malaysia, a
study by Ali et al. [19] revealed that their studied fibrous peat σc’ is about 25.5kPa.
Figure 6.5: Determination of preconsolidation pressure, σ’c by Casagrande’s method
for untreated peat
In the Figure 6.6a, there was a significant reduction of e in the stabilized
peats (all optimum PCB and PC mixture at 7 days of curing) as compared to that of
the untreated one (Figure 6.3a). Initially, the e for PCB1-20 represents the lowest and
then followed by PCB2-5 and PC mixtures. Likewise to the results in Figure 6.6b,
the e for 60 days curing of PCB1-20 represents the lowest and then followed by 28
and 7 days curing of same mixtures at the beginning, yet it is turn to inverse way at
the final load (640kPa). This proves that the mixture of PCB1-20 is harder, denser
and stronger with time and better than other mixtures in term of compressibility.
However, the e of stabilized peat seems shows the slow lessening with curing age.

139
One of the reasons this could be occurred because the duration of stabilization
generally does not affect its permeability to a large extent [20].
Figure 6.6: Void ratio, e versus effective vertical stress, σv’ for; (a) all optimum PCB
and PC mixture at 7 days of curing, (b) optimum PCB1-20 mixture at 7, 28 and 60
days of curing
The relationship between e, k and σv’ for stabilized Hokkaido peat was shown
in Figure 6.7 and Figure 6.8. In the same way with untreated peat, as compression
proceeds and void ratio decreases, permeability is reduced but not as rapid and great
(a)
(b)

140
as untreated peat. This is because the structure of stabilized peat is stiffer and solid
compared to untreated. However, it was revealed that the initial k between stabilized
and untreated almost same or small change.
Figure 6.7: Void ratio, e versus coefficient of permeability, k for; (a) all optimum
PCB and PC mixture at 7 days of curing, (b) optimum PCB1-20 mixture at 7, 28 and
60 days of curing
(b)
(a)

141
Figure 6.8: Coefficient of permeability, k versus effective vertical stress, σv’ for; (a)
all optimum PCB and PC mixture at 7 days of curing, (b) optimum PCB1-20 mixture
at 7, 28 and 60 days of curing
The permeability of the cement-stabilized peat was of the same order or
lower than the original peat depending on the stress state acting during curing [21]. It
was found that the k for all mixtures encounter a very slight change between each
other. The PC mixture shows the lowest k then other PCB mixtures. This is maybe
because of SCBA presence in the other two mixtures which the particles are coarser
(b)
(a)

142
than OPC and consequently change the soil fibric and increase the macropores. For
curing effects, two month curing samples shows the less k and become prove it has
higher strength and more compact. EuroSoilStab [22] reported that permeability tests
on peat with different binders showed that the permeability of stabilized peat was
between E-09 to E-08 m/s after 28 and 180 days respectively. Similar to study results,
the k of stabilized peat was between E-09 to E-08 m/s in range of 7 to 60 days curing.
In addition, Figure 6.6 also point out that the important effect of treatment on
the compression behavior is the increase in the pre-consolidation pressure, σc’ with
different PCB mixture and curing period. In the consolidation tests the most evident
effect of treatment with PC was the increase in the σc’. The development of this σc’ is
the mechanism responsible for the reduction in deformations associated with any
increase in effective stresses [15]. In contrast to e result, the σc’ shows the increment
pattern. The σc’ increased from 25 kPa (untreated peat) to about 200 kPa, 210 kPa
and 240 kPa for PC, PCB2-5 and PCB1-20 respectively. Similarly, Figure 6.6b
shows the increment of the σc’ for optimum PCB1-20 mixture at 7, 28 and 60 days of
curing with 240 kPa, 280 kPa and 290 kPa respectively. This increase in σc’ is in
agreement with the increase in strength with time recorded from the UCS results in
Chapter 3. These findings has an similarity with the observed results in Hebib and
Farrell [21] study. As a result of the development of this σc’, the compression curve
of the stabilized soil is shifted to higher effective stress. Moreover, the
compressibility of the stabilized peat measured in the overconsolidated area also
shows a decrease with increasing curing duration especially between 7 and 60 days.
These two effects are an indication of the effectiveness of the treatment in reducing
settlements [23]. As a result, the stabilized soil can sustain higher effective stress
than the Hokkaido untreated peat at the same void ratio [15].
Coefficient of volume compressibility, mv and coefficient of consolidation, Cv
Figure 6.9 displays the coefficient of volume compressibility, mv =
[(ΔH/Havg)% x ΔP] versus effective vertical stress, σv’ for untreated peat, all
optimum PCB mixture at 7 days of curing and optimum PCB1-20 mixture at various
days of curing. The results indicate that the addition of consolidation pressure has the
effect of decreasing the coefficient of permeability of untreated and stabilized

143
Hokkaido peat. The mv decreases drastically at the lower range of pressure but the
effect become less at large compression. This trend is in agreement with the
consolidation theory [10; 24].
According to Kazemian and Huat [25], this parameter is very useful to
estimate the primary consolidation settlement. For the untreated peat, the mv exhibits
significant decrement if compared to stabilized specimens. The compressibility
characters of soils are improved because of the hardened skeleton matrix formed by
bagasse-cement particles bonding with soil particles. The optimum mixtures of
PCB1-20 that cured for 60 days shows the lowest mv if matched to other stabilized
mixtures. Therefore, it can be said that the longer curing time with the high quality of
SCBA inclusion in peat stabilization could be beneficial to reduce the mv which
indirectly reduce the soil settlement potential.
(a)

144
Figure 6.9: Coefficient of volume compressibility, mv versus effective vertical stress,
σv’ for; (a) untreated peat, (b) all optimum PCB mixture at 7 days of curing, (c)
optimum PCB1-20 mixture at 7, 28 and 60 days of curing
There are two practical methods available to determine the coefficient of
consolidation rate, Cv from laboratory consolidation test; log t method and square
root t, √t method. In this study √t method was adopted to define the Cv as this method
was believed has better accuracy [19]. Figure 6.11 displays the coefficient of
consolidation rate, Cv = [0.848/t90 x (Havg/2)2] versus effective vertical stress, σv’ for
(b)
(c)

145
untreated peat, all optimum PCB mixture at 7 days of curing and optimum PCB1-20
mixture at various days of curing. The values of t90 were obtained from the
settlement vs √t curve as shown in Figure 6.10 as example. Similar pattern were
observed between untreated and stabilized peat where the Cv reduce as vertical
consolidation pressure increase. Ajlouni [26] pointed out a pronounced decrease in
Cv with load during consolidation due to large reduction in permeability. It was
revealed that the Cv of stabilized peat potrays the higher values than untreated one
where the Cv for PCB1-20 mixtures that cured for two month gave the higher values
among the stabilized mixtures. As mentioned previously, it is because of the effect of
SCBA inclusions in the mixtures that could replace organic matter in the soil. Study
by Hassan et al. [27] shows that increasing percentage of sand content in peat
stabilization may replace the organic content and finally increase the Cv. As stated by
Farrell et al. [28], lower Cv is more evidence in specimen with higher organic
contents. Therefore, it can be concluded that PCB1-20 mixtures represents the lowest
organic content by the effect of primary and secondary hydration. It was also can be
proved from the chemical results in Chapter 4 where this mixture has the lowest
carbon contents which can be considered as lower organic contents.
Figure 6.10: Settlement vs square root time curve; example for determination of
coefficient of consolidation rate, Cv in laboratory consolidation test

146
(a)
(b)

147
Figure 6.11: Coefficient of consolidation rate, Cv versus effective vertical stress, σv’
for; (a) untreated peat, (b) all optimum PCB mixture at 7 days of curing, (c) optimum
PCB1-20 mixture at 7, 28 and 60 days of curing
Compression index, Cc and secondary compression index, Cα
Figure 6.12 and Figure 6.13 displays the primary and secondary compression
index, (Cc and Cα) versus effective vertical stress, σv’ for untreated peat, all optimum
PCB mixture at 7 days of curing and optimum PCB1-20 mixture at various days of
curing. For the purpose of Cα = Δe/ (Δ log t) determination, the slope of the e – log t
curves were used. It was easy to compute Cα for untreated Hokkaido peat since the
curve shows the typical S-curve like exposed in Figure 6.14. However, considering
the standard oedometer apparatus that had been used in this study cannot determine
the dissipation of water during consolidation, it assumes that secondary compression
started 4 hours (240 minutes) after loading for stabilized peat. This assumption
approach adopted from previous research conducted by Hebib and Farrel [21] and
Duraisamy [29]. Therefore, Cα was determined from the slope of the e – log t curves
4–24 hour after a load increment was applied (Figure 6.15).
In the case of untreated peat, it was discovered that Cc and Cα significantly
increase with the increase of σv’ near the preconsolidation pressure, σc. At values of
σv’ past about 3σc, Cc gradually decreases with the increase in σv’. Consequently,
(c)

148
according to the Cα/Cc concept of compressibility, Cα is expected to gradually
decrease with time. Similar to the study by Mesri et al. [2], they found that the lowest
values of Cα were encountered in the recompression range where Cc is small, and the
highest values of Cα were observed at effective vertical stresses just past the
preconsolidation pressure where Cc maximizes.
(a)
(b)

149
Figure 6.12: Compression index, Cc versus effective vertical stress, σv’ for; (a)
untreated peat, (b) all optimum PCB mixture at 7 days of curing, (c) optimum PCB1-
20 mixture at 7, 28 and 60 days of curing
Contrary to the untreated peat, the Cc and Cα for stabilized peat continuously
increase with the increase of σv’ even beyond the preconsolidation pressure, σc.
These increments seem obvious just after the σv’ exceed the UCS of mixtures that
obtained from Chapter 3. For instance after 320 kPa of σv’ was subjected on PCB1-
20 mixtures, the curves shows the drastic raises of these two important parameter
especially when the load reach and past about 380 kPa (UCS of PCB1-20 mixtures).
It also shown the value of Cc and Cα was relatively low at low effective stresses,
however it increased as preconsolidation pressure was approached and continuous to
rise after beyond these pressure. Significant increase in Cc and Cα occurs after σv’ for
the cement-stabilized peat discovered that creep could be associated with a structural
breakdown [21].
(c)

150
(a)
(b)

151
Figure 6.13: Secondary compression index, Cα versus effective vertical stress, σv’ for;
(a) untreated peat, (b) all optimum PCB mixture at 7 days of curing, (c) optimum
PCB1-20 mixture at 7, 28 and 60 days of curing
Figure 6.14: Void ratio, e vs log time curve, example for determination of secondary
compression index, Cα in untreated peat (P) compressibility analysis
(c)
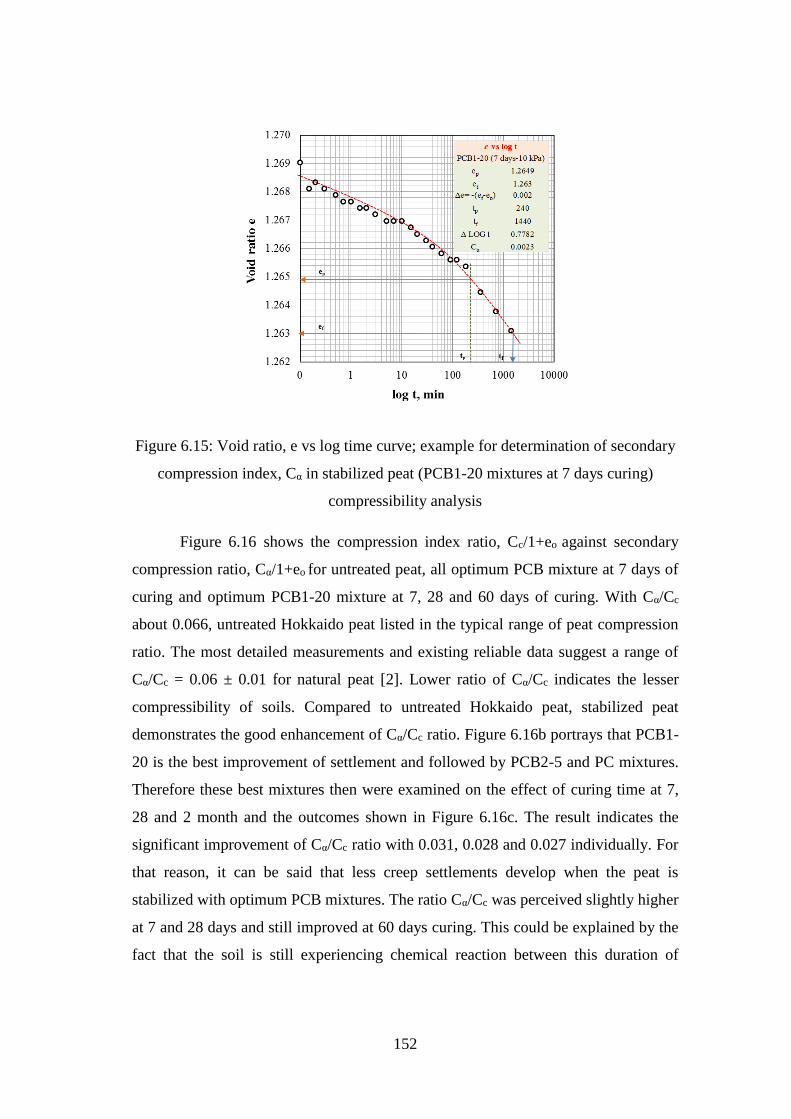
152
Figure 6.15: Void ratio, e vs log time curve; example for determination of secondary
compression index, Cα in stabilized peat (PCB1-20 mixtures at 7 days curing)
compressibility analysis
Figure 6.16 shows the compression index ratio, Cc/1+eo against secondary
compression ratio, Cα/1+eo for untreated peat, all optimum PCB mixture at 7 days of
curing and optimum PCB1-20 mixture at 7, 28 and 60 days of curing. With Cα/Cc
about 0.066, untreated Hokkaido peat listed in the typical range of peat compression
ratio. The most detailed measurements and existing reliable data suggest a range of
Cα/Cc = 0.06 ± 0.01 for natural peat [2]. Lower ratio of Cα/Cc indicates the lesser
compressibility of soils. Compared to untreated Hokkaido peat, stabilized peat
demonstrates the good enhancement of Cα/Cc ratio. Figure 6.16b portrays that PCB1-
20 is the best improvement of settlement and followed by PCB2-5 and PC mixtures.
Therefore these best mixtures then were examined on the effect of curing time at 7,
28 and 2 month and the outcomes shown in Figure 6.16c. The result indicates the
significant improvement of Cα/Cc ratio with 0.031, 0.028 and 0.027 individually. For
that reason, it can be said that less creep settlements develop when the peat is
stabilized with optimum PCB mixtures. The ratio Cα/Cc was perceived slightly higher
at 7 and 28 days and still improved at 60 days curing. This could be explained by the
fact that the soil is still experiencing chemical reaction between this duration of
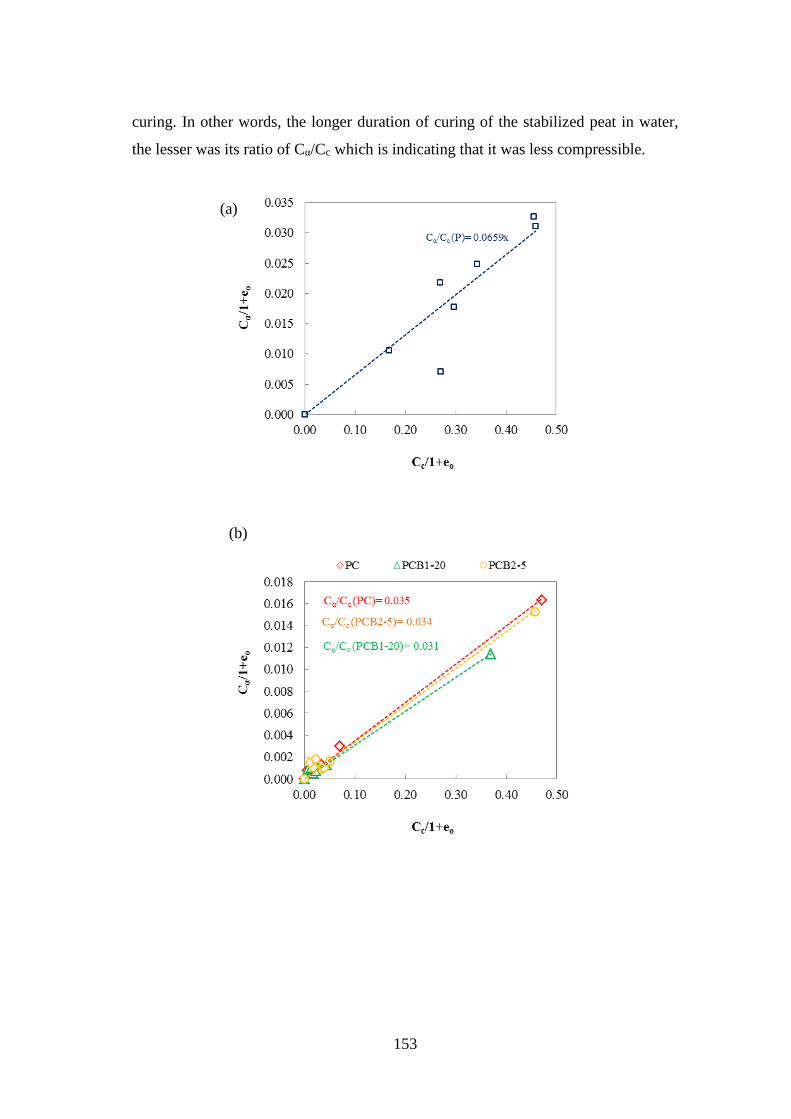
153
curing. In other words, the longer duration of curing of the stabilized peat in water,
the lesser was its ratio of Cα/Cc which is indicating that it was less compressible.
(a)
(b)

154
Figure 6.16: Compression ratio, Cc/1+eo versus secondary compression ratio, Cα/1+eo
for; (a) untreated peat, (b) all optimum PCB mixture at 7 days of curing, (c) optimum
PCB1-20 mixture at 7, 28 and 60 days of curing
Similarly, Figure 6.17 shows the compression index ratio, Cc/Cα for all
mixture at 7 days of curing and optimum PCB1-20 mixture at 7, 28 and 60 days of
curing. As the Cα/Cc ratio decreases, the soil engineering behavior is known to shift
from that of peaty or organic soils to inorganic soils and finally to a granular material
[15; 23; 30; 31]. It is found that the stabilized peat Cα/Cc ratios reached to granular
soil materials at a curing age of 1 month and above. With curing duration from 28
days to 60 days, small noticeable improvements were observed and the pattern was
similar to gained UCS results. These results are encouraging, since the compression
behavior of organic soils appears to be fundamentally changed to that of granular soil,
which is considered to be an excellent foundation material by the geotechnical and
pavement engineers [31].
(c)

155
Figure 6.17: Compression index ratio, Cc/Cα for; (a) all mixture at 7 days of curing,
(b) optimum PCB1-20 mixture at 7, 28 and 60 days of curing
In Figure 6.18, the compression ratio, Cc/1+eo for all mixture at 7 days of
curing and optimum PCB1-20 mixture at 7, 28 and 60 days of curing were shown.
According to Loughlin and Lehane [32], compressibility level could be classified by
referring compression index ratio, Cc/1+eo of tested peat as shown in Table 6.1.
Figure 6.18a was revealed that stabilized peat significantly change the
compressibility behavior of original peat from very compressible to slightly
(b)
(a)

156
compressible. It was exposed that PCB1-20 shows the less compressibility compare
to other stabilized peat with Cc/1+eo= 0.079 and dropped as much 77% from
untreated peat (Cc/1+eo= 0.345). On the same direction, Figure 6.18b discover that
curing duration on best optimum mixtures (PCB1-20) contribute better improvement
which change the compressibility behavior from slightly to very slightly
compressibility after two month curing duration.
Figure 6.18: Compression ratio, Cc/1+eo for; (a) all mixture at 7 days of curing, (b)
optimum PCB1-20 mixture at 7, 28 and 60 days of curing
(a)
(b)

157
Table 6.1 Classification of compression ratio [30]
6.4 Summary
As summary, this chapter proves the effectiveness of optimum peat-cement-
bagasse ash (PCB) mixtures on peat deformation behavior. There was a significant
reduction of void ratio, e for stabilized peat mixtures as compared to that of the
untreated one. Consequently, the permeability coefficient, k noticeably decreases.
However, the e of this stabilized peat seems shows the slow decreasing with curing
age. It was found that the k for all mixtures encounter a very slight change between
each other. The PC mixture shows the lowest k then other PCB mixtures. This is
maybe because of SCBA presence in the other two mixtures which the particles are
coarser than OPC and consequently change the soil fibric and increase the
macropores. The k of stabilized peat was between E-09 to E-08 m/s in range of 7 to 60
days curing.
The important effect of treatment on the compression behavior is the increase
in the pre-consolidation pressure, σc’ with different PCB mixture and curing period.
This σc’ increment is in agreement with the increase in strength with time recorded
from the UCS results. As a result of the development of this σc’, the compression
curve of the stabilized soil is shifted to higher effective stress. The mv decreases
drastically at the lower range of pressure but the effect become less at large
compression. The Cv reduce as vertical consolidation pressure increase due to large
reduction in permeability.
In the case of untreated peat, it was discovered that Cc and Cα significantly
increase with the increase of σv’ near the preconsolidation pressure, σc. At values of
σv’ past about 3σc, Cc gradually decreases with the increase in σv’. Contrary to the
untreated peat, the Cc and Cα for stabilized peat continuously increase with the

158
increase of σv’ even beyond the preconsolidation pressure, σc. Significant increase in
Cα occurs after σv’ for the cement-stabilized peat discovered that creep could be
associated with a structural breakdown. Compared to untreated Hokkaido peat,
stabilized peat demonstrates the good enhancement of Cα/Cc ratio. The less creep
settlements develop when the peat is stabilized with optimum PCB mixtures at the
longer duration of curing of the stabilized peat in water.
As the Cα/Cc ratio decreases, the soil engineering behavior is known to shift
from that of peaty or organic soils to inorganic soils and finally to a granular material.
As a result, stabilized peat considered to be an excellent foundation material by the
geotechnical and pavement engineers. The compression ratio, Cc/1+eo results
revealed that stabilized peat significantly change the compressibility behavior of
original peat from very compressible to slightly compressible and finally to very
slightly compressible after cured for 2 month.

159
6.5 Reference
[1] Kazemian, S., Huat, B.B.K., Prasad, A. and Barghchi, M., 2011. A state of art
review of peat: Geotechnical engineering perspective. International Journal of
the Physical Sciences, 6(8): 1974-1981.
[2] Mesri, G., Stark, T.D., Ajlouni, M.A. and Chen, C.S., 1997. Secondary
compression of peat with or without surcharging. J. Geotech. Geoeviron.
Engr., 123(5):411-421.
[3] Mesri, G. and Ajlouni, M., 2007. Engineering properties of fibrous Peats. Journal
of Geotechnical and Geoenvironmental Engineering, 133(7): 850-866.
[4] Wosten, J.H.M., Ismail, A.B. and vanWijk, A.L.M., 1997. Peat subsidence and its
practical implications: A case study in Malaysia. Geoderma, 78(1-2): 25-36.
[5] Haider, A.A., Erwin, O. and Gary, C., 2013. Engineering properties of peat in
estuarine environment. Foundation and Soft Ground Engineering Conference
Thu Dau Mot UniversityICTDMU-1, Binh Duong.
[6] Huat, B.K., 2006. Deformation and Shear Strength Characteristics of Some
Tropical Peat and Organic Soils. Pertanika J. Sci. & Techno., 14(1&2): 61-74.
[7] Edil, T.B., 1997. Construction over peats and organic soils. In Proceedings of
Recent Advances in Soft Soil Engineering, ed. Huat and Bahia, pp.85-
108.Sarawak.
[8] Den Haan, E.J., 1997. An overview of the mechanical behaviour of peats and
organic soils and some appropriate construction techniques. In Proceedings of
Conference on Recent Advances in Soft Soil Engineering, ed. Huat and Bahia,
p. 17-45. Kuching, Sarawak, Malaysia.
[9] Jarrett, P.M., 1995. Site investigation for organic soils and peat. Geoguide 6. JKR
Document 20709- 0341-95. Public Works Department Malaysia. Malaysia.
[10] Gofar, N., 2006. Determination of coefficient of rate of horizontal consolidation
of peat soil, Master Dissertation, Universiti Teknologi Malaysia, Malaysia.
36-172.
[11] Dhowian, A.W. and Edil, T.B., 1980. Consolidation behavior of peats. Geotech.
Testing J., 3(3): 105-114.

160
[12] Colleselli, F., Cortellazzo, G. and Cola, S., 2000. Laboratory Testing of Italian
Peat Soils. Geotechnics of High Water Content Materials, ASTM STP 1374,
Edil, T.B., and Fox, P.J. (Eds.), American Society for Testing and Materials,
West Conshohocken, PA.
[13] Edil, T.B., 2003. Recent advances in Geotechnical characterization and
construction over peat and organic soils. Proceedings 2nd International
Conference on Advances in Soft Soil Engineering and Technology: 3-25.
[14] Miyakawa, J., 1960. Soils engineering research on peats alluvia, Reports 1-3.
Civil Engineering Research Institute, Hokkaido Development Bureau
Bulletin No. 20.
[15] Hwang, J., Humphrey, A., Bobet, A. and Santagata, M.C., 2005. Stabilization
and Improvement of Organic Soils. Publication FHWA/IN/JTRP-2004/38.
Joint Transportation Research Program, Indiana Department of
Transportation and Purdue University, West Lafayette, Indiana.
[16] Casagrande, A., 1936. The determination of the pre-consolidation load and its
practical significance. Proceedings of the First International Conference on
Soil Mechanics and Foundation Engineering.
[17] O'Kelly, B.C., 2005. Compressibility of some peats and organic soils.
Proceedings of International Conference on Problematic Soils, Cyprus, Vol. 3,
pp. 1193-1202.
[18] O'Kelly, B.C., 2007. Compressibility and permeability anisotropy of some peaty
soils. Proceedings of the 60th Canadian Geotechnical Conference, Ottawa,
Ontario.
[19] Ali, F.H., Sing, W.L. and Hashim, R., 2010. Engineering properties of improved
fibrous peat. Scientific Research and Essays, 5(2): 154-169.
[20] Wong, L.S., Hashim, R. and Ali, F.H., 2009. A Review on Experimental
Investigations of Peat Stabilization. Australian Journal of Basic and Applied
Sciences, 3(4): 3537-3552, 2009. ISSN 1991-8178.
[21] Hebib, S. and Farrell, E.R., 2003. Some experiences on the stabilization of Irish
peats. Canadian Geotechnical Journal, 40(1): 107-120.
[22] EuroSoilStab, 2002. Development of design and construction methods to
stabilize soft organic soils. Design guide soft soil stabilization. CT97-0351.

161
Project No. BE 96-3177, Industrial & Materials TechnologiesProgramme
(Brite- EuRam III), European Commission.
[23] Bobet, A., Hwang, J.H., Johnston, C.T. and Santagata, M., 2011. One-
dimensional consolidation behavior of cement-treated organic soil. Canadian
Geotechnical Journal, 48(7): 1100-1115.
[24] Yulindasari, I., 2006. Compressibility characteristics of fibrous peat soil, Master
Dissertation, Universiti Teknologi Malaysia, Malaysia.
[25] Kazemian, S. and Huat, B.K., 2009. Compressibility characteristics of fibrous
tropical peat reinforced with cement column. Electronic J. Geotech. Eng.,
14E: 1-8.
[26] Ajlouni, M.A., 2000. Geotechnical properties of peat and related engineering
problems, PhD Dissertation, University of Illinois at Urbana-Champaign. 15-
189.
[27] Hassan, Z.A., Daud, M.N.M., Yahya, M.A. and Shaharuddin, M.S., 2013. Effect
of Granular Material on the Rate of Consolidation of Peat Soil. Electronic
Journal of Geotechnical Engineering, Vol. 13, Bund. F, 6113-6123.
[28] Farrell, E.R., O'Neill, C. and Morris, A., 1994. Changes in the Mechanical
Properties of Soils with Variation in Organic Content. In Advances in
Understanding and Modeling the Mechanical of Peat, Balkema Rotterdam,
19-25.
[29] Duraisamy, Y., Huat, B.K., Muniandy, R. and Aziz, A.A., 2008.
Compressibility Behavior of Fibrous Peat Reinforced with Cement Columns.
ICCBT- E- (09)–pp93-110.
[30] Mesri, G., Stark, T.D. and Chen, C.S., 1994. Cc/Cα concept applied to
compression of peat. discussion. J. Geotech. Geoenv. Eng., 120: 764-766.
[31] Sobhan, K., Reddy , D.V. and Ramirez, J.C., 2012. Cement Stabilization of
Organic Subgrades for Pavement Preservation. In: LACCEI (Editor),
Megaprojects: Building Infrastructure by fostering engineering collaboration,
efficient and effective integration and innovative planning Panama City,
Panama.
[32] Loughlin, C.D. and Lehane, B.M., 2003. A Study of the link between
composition and compressibility of peat and organics soil. In Proceedings of

162
2nd International Conference on Advances in Soft Soil Engineering and
Technology, ed. Huat et al, pp.135-152 Putra Jaya, Malaysia.

163
CHAPTER 7
CONCLUSIONS AND FUTURE WORKS
7.1 Conclusions
As conclusions, the main objective of this research works was achieved
where the effectiveness of SCBA in stabilized peat successfully evaluated and
clarified. The first important step in this study is the comparative study between
Hokkaido and Malaysia peat. The main purpose is to check the similarity potential of
peat geotechnical characteristics so that the research finding possible to apply on
Malaysia peat in future. As stated in Chapter 1, the research scopes were
concentrates to the strength and compressibility of stabilized peat that will be
compare to untreated peat. Therefore, the conclusions regarding the enhancement of
the strength and compressibility of stabilized peat by utilizing SCBA are presented;
1. The stabilized peat comprising 20%, 5% and 10% (PCB1-20, PCB2-5 and PCB3-
10) partial replacement of OPC with SCBA 1 (good quality), SCBA 2 (low
quality) and SCBA 3 (intermediate quality) attain the maximum UCS and
discovered greater than P and PC specimen.
2. The proposed calculation to predict deformation modulus of Peat-Cement-
Bagasse (PCB) mixtures based on two-phase mixtures model was introduced and
developed. The main benefit of this proposed model is the ability to determine
the optimum PCB mixture which depends on the physical and chemical effects of
SCBA. The proposed modified model was exhibits a good agreement with the
experimental results.

164
3. At each optimal mix of PCB mixtures, the UCS increased with increasing of
curing time, OPC dosage, K7 dosage and preloading. For PCB1-20 and PCB3-10
mixture, inclusion of a minimum OPC dosage of 300 kg/m3 and K7 dosage of
500 kg/m3 along with curing under 20 kPa pressure is recommendable for the
peat stabilization to be effective. However PCB2-5 mixture is not recommended
to use in stabilized peat unless more OPC and K7 dosage should be consumed in
order to achieve minimum strength target.
4. Pozzolanic reaction still occurred after a month of curing for PCB1-20 because of
the fact that cement hydration (PC mixtures) is normally rapid and effective at
first month but almost stop or complete after that duration while pozzolan
reaction may be occurred continuously until several month.
5. From multiple regressions statistical model, the qu gained has a close relationship
to D50 and Ca/Si ratio of SCBA. Finer size of D50 and larger Ca/Si ratio indicates
greater qu of the PCB mixture and simultaneously can increase the SCBA
percentage replacement or on the other hand decrease the OPC inclusion
percentages.
6. There was a significant reduction of void ratio, e for stabilized peat mixtures as
compared to that of the untreated one. Consequently, the permeability coefficient,
k noticeably decreases.
7. The σc’ shows the increment with different PCB mixture and curing period. This
σc’ increment is in agreement with the increase in strength with time recorded
from the UCS results. Consequently to the development of σc’, the compression
curve of the stabilized soil is shifted to higher effective stress.
8. The mv decreases drastically at the lower range of pressure but the effect become
less at large compression while the Cv reduce as vertical consolidation pressure
increase due to large reduction in permeability.
9. For untreated peat, Cc and Cα significantly increase with the increase of σv’ near
the σc. At values of σv’ past about 3σc, Cc gradually decreases with the increase in
σv’. The Cc and Cα for stabilized peat continuously increase with the increase of
σv’ even beyond the σc. Significant increase in Cα occurs after σv’ for the cement-
stabilized peat discovered that creep could be associated with a structural
breakdown.

165
10. Compared to untreated Hokkaido peat, stabilized peat demonstrates the good
enhancement of Cα/Cc ratio. The less creep settlements develop when the peat is
stabilized with optimum PCB mixtures at the longer duration of curing of the
stabilized peat in water. As the Cα/Cc ratio decreases, the soil engineering
behavior is known to shift from that of peaty or organic soils to inorganic soils
and finally to a granular material. As a result, stabilized peat considered to be an
excellent foundation material by the geotechnical and pavement engineers. The
compression ratio, Cc/1+eo results revealed that stabilized peat significantly
change the compressibility behavior of original peat from very compressible to
slightly compressible and finally to very slightly compressible after cured for 2
month.
7.2 Future works
Overall, this study main objective was positively accomplished where the
effectiveness of SCBA utilization in stabilized peat was revealing the good outcomes.
However, there are still many improvement and further study on this new material.
Currently, the improvement and future works that planned to be focus are listed
below and shown in;
1. Study on effectiveness of SCBA on other type of peat (fibric and sapric) so that
this material can be utilized and generalized in peat stabilization.
2. Material safety identification by leaching tes such as Toxicity Characteristic
Leaching Procedure (TCLP).
3. Make additional test for road construction purpose such as resilient modulus and
California Bearing test (CBR) which important to evaluate the mechanical
strength of road subgrades.
4. Improve the compressibility study on PCB mixtures on long term duration with
proper apparatus such as Rowe cell that can accurately compute the dissipation of
water during compression.
5. Deeply study on the SCBA characteristics reaction with the aim of quantifies
how much reactive rate of SCBA during hydration process. Therefore, possibility

166
to understand how much non-reactive SCBA becomes filler and how much
reactive SCBA that enhances the chemical reaction become clearer.
6. Field test trial and make comparative study with laboratory experimental results.
Figure 7.1 Future works
Figure 7.2 Planning idea for field test trial of PCB mixtures
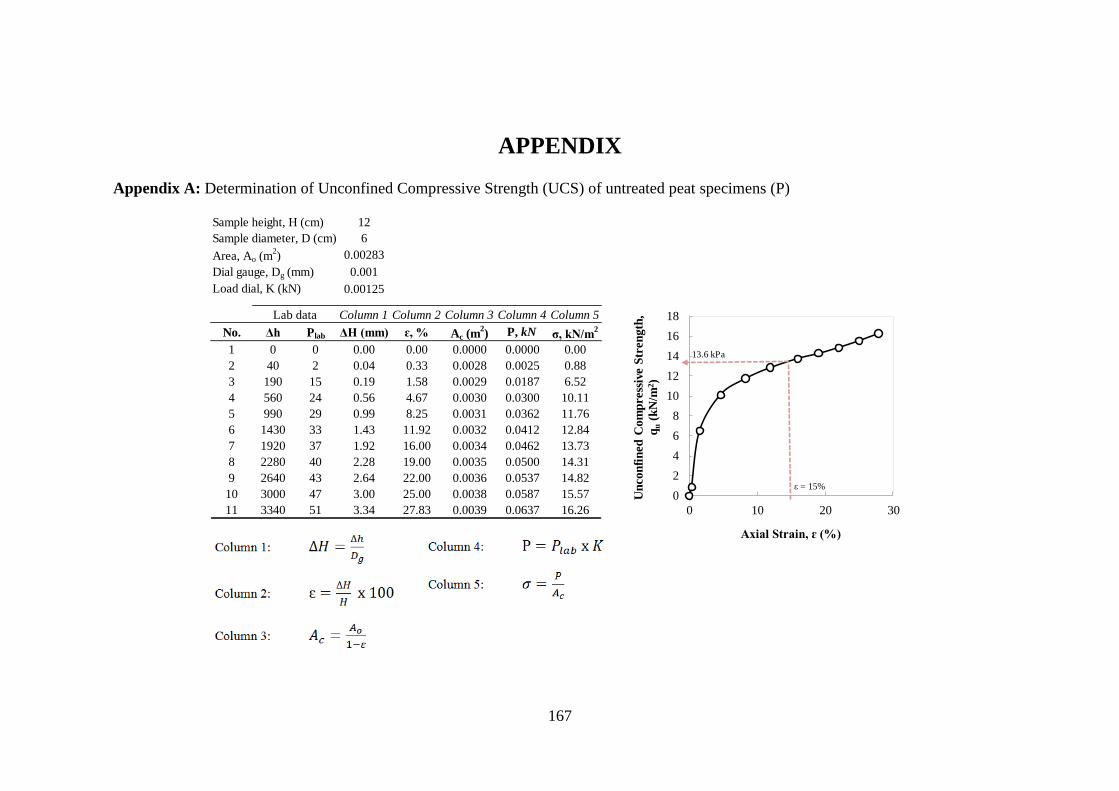
167
APPENDIX
Appendix A: Determination of Unconfined Compressive Strength (UCS) of untreated peat specimens (P)
12
6
0.00283
0.001
0.00125
Column 1 Column 2 Column 3 Column 4 Column 5
No. Δh Plab ΔH (mm) ɛ, % Ac (m2) P, kN σ, kN/m
2
1 0 0 0.00 0.00 0.0000 0.0000 0.00
2 40 2 0.04 0.33 0.0028 0.0025 0.88
3 190 15 0.19 1.58 0.0029 0.0187 6.52
4 560 24 0.56 4.67 0.0030 0.0300 10.11
5 990 29 0.99 8.25 0.0031 0.0362 11.76
6 1430 33 1.43 11.92 0.0032 0.0412 12.84
7 1920 37 1.92 16.00 0.0034 0.0462 13.73
8 2280 40 2.28 19.00 0.0035 0.0500 14.31
9 2640 43 2.64 22.00 0.0036 0.0537 14.82
10 3000 47 3.00 25.00 0.0038 0.0587 15.57
11 3340 51 3.34 27.83 0.0039 0.0637 16.26
Lab data
Load dial, K (kN)
Sample height, H (cm)
Area, Ao (m2)
Dial gauge, Dg (mm)
Sample diameter, D (cm)
0
2
4
6
8
10
12
14
16
18
0 10 20 30
Un
co
nfi
ned
Co
mp
ress
ive S
tren
gth
,
qu
(kN
/m2)
Axial Strain, ɛ (%)
13.6 kPa
ε = 15%

168
Appendix B: Determination of Unconfined Compressive Strength (UCS) of stabilized peat specimens (Example: PC mixtures- Sample 3)
12
6
0.00283
0.001
0.00125
Column 1 Column 2 Column 3 Column 4 Column 5
No. Δh Plab ΔH (mm) ɛ, % Ac (m2) P, kN σ, kN/m
2
1 0 0 0.00 0.00 0.00000 0.0000 0.00
2 64 98 0.06 0.53 0.00284 0.1224 43.07
3 141 295 0.14 1.18 0.00286 0.3685 128.80
4 209 564 0.21 1.74 0.00288 0.7044 244.84
5 289 786 0.29 2.41 0.00290 0.9817 338.90
6 359 883 0.36 2.99 0.00291 1.1029 378.45
7 462 932 0.46 3.85 0.00294 1.1641 395.91
8 533 883 0.53 4.44 0.00296 1.1029 372.79
9 605 784 0.61 5.04 0.00298 0.9792 328.92
10 677 700 0.68 5.64 0.00300 0.8743 291.82
11 751 622 0.75 6.26 0.00302 0.7769 257.61
12 829 554 0.83 6.91 0.00304 0.6919 227.85
13 922 498 0.92 7.68 0.00306 0.6220 203.12
14 997 413 1.00 8.31 0.00308 0.5158 167.31
15 1076 297 1.08 8.97 0.00311 0.3710 119.45
Lab data
Sample height, H (cm)
Area, Ao (m2)
Dial gauge, Dg (mm)
Load dial, K (kN)
Sample diameter, D (cm)
0
50
100
150
200
250
300
350
400
450
0 2 4 6 8 10
Un
co
nfi
ned
Co
mp
ress
ive S
tren
gth
,
qu
(kN
/m2)
Axial Strain, ɛ (%)
396 kPa

169
Appendix C: Stress- strain for all PC and PC mixtures

170
Appendix D: Determination of average Unconfined Compressive Strength (UCS):
Example of PC and PCB1 mixtures
12
Sample diameter, D (cm) 6
Area, Ao (m2) 0.002827
Dial gauge, Dg (mm) 0.001
0.00125
Column 1 Column 2 Column 3 Column 4 Column 5
Sample Δh Plab (max) ΔH ɛ, % Ac (m2) P, kN σ, kN/m
2 Average
1 656 754 0.656 5.4667 0.00299 0.9417 314.91
2 546 731 0.546 4.5500 0.00296 0.9130 308.27
3 591 774 0.591 4.9250 0.00297 0.9667 325.12
1 393 782 0.393 3.2750 0.00292 0.9767 334.18
2 349 745 0.349 2.9083 0.00291 0.9305 319.58
3 375 743 0.375 3.1250 0.00292 0.9280 318.01
1 274 807 0.274 2.2833 0.00289 1.0079 348.40
2 497 768 0.497 4.1417 0.00295 0.9592 325.26
3 357 815 0.357 2.9750 0.00291 1.0179 349.36
1 315 877 0.315 2.6250 0.00290 1.0954 377.30
2 335 889 0.335 2.7917 0.00291 1.1104 381.81
3 324 839 0.324 2.7000 0.00291 1.0479 360.67
1 350 866 0.35 2.9167 0.00291 1.0816 371.45
2 423 923 0.423 3.5250 0.00293 1.1528 393.42
3 462 932 0.462 3.8500 0.00294 1.1641 395.91
1 320 767 0.32 2.6667 0.00290 0.9580 329.83
2 452 837 0.452 3.7667 0.00294 1.0454 355.87
3 385 811 0.385 3.2083 0.00292 1.0129 346.81
1 326 544 0.326 2.7167 0.00291 0.6795 233.82
2 379 648 0.379 3.1583 0.00292 0.8094 277.25
3 364 623 0.364 3.0333 0.00292 0.7781 266.90
1 510 466 0.51 4.2500 0.00295 0.5820 197.13
2 336 473 0.336 2.8000 0.00291 0.5908 203.13
3 531 459 0.531 4.4250 0.00296 0.5733 193.82
Lab data
Sample height, H (cm)
Load dial, K (kN)
PC 316
PCB1-5 324
PCB1-10 341
PCB1-30 259
PCB1-35 198
PCB1-15 373
PCB1-20 387
PCB1-25 344

171
Appendix E: All collected results of Unconfined Compressive Strength (UCS) at various factor in peat stabilization
1 2 3 Avg 1 2 3 Avg 1 2 3 Avg
Original 0 12.80 13.97 13.31 13 5.35 5.49 5.54 5.46 603.24 564.17 572.59 580.00
PC C100 0 314.83 308.18 325.03 316 12.38 12.48 12.01 12.29 75.87 78.94 77.81 77.54
C95B5 5 334.09 319.49 317.92 324 12.11 12.35 12.50 12.32 83.12 79.13 81.65 81.30
C90B10 10 348.30 325.17 349.26 341 12.39 12.19 12.47 12.35 80.84 83.55 83.71 82.70
C85B15 15 377.19 381.70 360.57 373 12.25 12.37 12.61 12.41 81.67 85.08 83.45 83.40
C80B20 20 371.34 393.31 395.80 387 12.39 12.61 12.62 12.54 83.17 85.13 84.03 84.11
C75B25 25 329.74 355.77 346.71 344 12.31 12.43 12.40 12.38 87.34 84.11 86.04 85.83
C70B30 30 233.75 277.17 266.82 259 12.27 12.13 12.17 12.19 86.09 88.82 87.38 87.43
C65B35 35 197.08 203.07 193.76 198 11.83 12.02 11.91 11.92 90.13 87.53 91.02 89.56
C100 0 314.83 308.18 325.03 316 12.38 12.48 12.01 12.29 75.87 78.94 77.81 77.54
C95B5 5 330.72 310.81 325.56 322 12.42 12.51 12.38 12.44 80.18 82.47 81.50 81.38
C90B10 10 246.92 265.37 258.52 257 12.30 12.36 12.32 12.33 82.91 84.45 84.18 83.85
C85B15 15 213.85 244.39 234.12 231 12.26 12.29 12.31 12.29 83.45 85.24 83.87 84.19
C80B20 20 235.61 211.32 223.05 223 12.24 12.21 12.36 12.27 83.62 85.73 83.53 84.29
C75B25 25 217.00 218.72 210.41 215 12.31 12.22 12.18 12.24 83.17 85.13 85.28 84.53
C100 0 314.83 308.18 325.03 316 12.38 12.48 12.01 12.29 75.87 78.94 77.81 77.54
C95B5 5 306.62 348.11 318.17 324 12.38 12.48 12.52 12.46 82.46 78.94 82.59 81.33
C90B10 10 337.45 400.02 351.75 363 12.53 12.35 12.68 12.52 83.12 80.13 85.57 82.94
C85B15 15 296.85 283.53 336.62 306 12.39 12.27 12.39 12.35 84.23 83.55 83.29 83.69
C80B20 20 243.39 261.11 284.97 263 12.25 12.37 12.31 12.31 83.55 85.08 84.27 84.30
C75B25 25 222.17 203.23 252.61 226 12.39 12.18 12.18 12.25 86.34 85.13 84.56 85.34
Effect of OPC-
SCBA
compositions
SCBA 1
SCBA 2
SCBA 3
Mixtures
UCS (kPa) pH w (%)
Test PurposeSamples
1 2 3 Avg 1 2 3 Avg 1 2 3 Avg
Original 0 12.80 13.97 13.31 13 5.35 5.49 5.54 5.46 603.24 564.17 572.59 580.00
D1 7 314.83 308.18 325.03 316
D2 14 335.80 426.99 393.42 385
D3 21 417.00 444.35 455.87 439
D4 28 440.37 483.00 458.87 461
D5 60 460.01 495.94 470.42 475
D1 7 371.34 393.31 395.80 387 12.39 12.61 12.62 12.54 83.17 85.13 84.03 84.11
D2 14 433.15 428.30 - 431 12.51 12.75 12.72 12.66 81.56 84.77 84.77 83.70
D3 21 476.12 469.21 - 473 12.64 12.76 12.97 12.79 81.49 84.05 81.93 82.49
D4 28 501.29 498.86 - 500 12.77 13.02 13.00 12.93 79.48 83.65 80.50 81.21
D5 60 517.93 541.38 - 530 12.49 13.17 13.61 13.09 79.79 81.07 81.45 80.77
D1 7 330.72 310.81 325.56 322
D2 14 346.48 319.39 - 333
D3 21 401.56 328.30 - 365
D4 28 425.41 346.00 - 386
D5 60 452.87 364.50 - 409
D1 7 337.45 400.02 351.75 363
D2 14 403.00 383.33 - 393
D3 21 445.30 384.91 - 415
D4 28 444.38 429.16 - 437
D5 60 468.95 433.02 - 451
Effect of
optimum PCB
mixtures on
curing
duration
Mixtures
PCB1-20
PCB2-5
PCB3-10
PC
UCS (kPa) pH w (%)
Test PurposeSamples

172
Appendix E: All collected results of Unconfined Compressive Strength (UCS) at various factor in peat stabilization: Continued
1 2 3 Avg 1 2 3 Avg 1 2 3 Avg
Original 0 12.80 13.97 13.31 13 5.35 5.49 5.54 5.46 603.24 564.17 572.59 580.00
L0 0 174.86 196.71 - 186
L1 20 314.83 308.18 325.03 316
L2 40 354.04 360.19 - 357
L3 60 422.05 428.43 - 425
L4 80 483.40 468.36 - 476
L5 100 512.31 535.42 - 524
L0 0 200.86 235.49 - 218 12.51 12.12 12.51 12.38 84.23 86.11 85.14 85.16
L1 20 371.34 393.31 395.80 387 12.39 12.61 12.62 12.54 83.47 85.77 83.09 84.11
L2 40 409.22 444.72 - 427 12.57 12.67 12.65 12.63 81.98 84.21 83.53 83.24
L3 60 452.70 493.00 - 473 12.82 12.73 12.61 12.72 81.46 84.01 81.40 82.29
L4 80 530.26 581.19 - 556 12.67 12.88 12.82 12.79 80.03 84.37 80.31 81.57
L5 100 599.29 632.79 - 616 12.69 12.87 12.93 12.83 79.87 81.55 81.07 80.83
L0 0 204.38 189.03 - 197
L1 20 330.72 310.81 325.56 322
L2 40 372.80 362.57 - 368
L3 60 415.62 407.71 - 412
L4 80 482.15 407.23 - 445
L5 100 537.03 414.32 - 476
L0 0 218.85 209.18 - 214
L1 20 337.45 400.02 351.75 363
L2 40 413.30 407.88 - 411
L3 60 483.44 431.81 - 458
L4 80 563.85 504.23 - 534
L5 100 641.42 553.53 - 597
Effect of
optimum PCB
mixtures on
initial loading
variation
Mixtures
PCB1-20
PCB2-5
PCB3-10
PC
UCS (kPa) pH w (%)
Test PurposeSamples
1 2 3 Avg 1 2 3 Avg 1 2 3 Avg
Original 0 12.80 13.97 13.31 13 5.35 5.49 5.54 5.46 603.24 564.17 572.59 580.00
C1 100 27.63 29.38 - 29
C2 150 89.84 83.19 - 87
C3 200 135.76 132.35 - 134
C4 250 167.30 150.29 - 159
C5 300 314.83 308.18 325.03 316
C1 100 24.29 25.22 - 25 11.11 11.67 11.42 11.40 114.73 116.21 115.44 115.46
C2 150 81.72 80.99 - 81 11.59 11.71 12.10 11.80 108.34 106.54 106.94 107.27
C3 200 119.84 117.11 - 118 12.13 12.19 12.28 12.20 100.82 98.99 99.71 99.84
C4 250 178.07 164.86 - 171 12.97 13.29 10.94 12.40 95.21 92.87 93.37 93.82
C5 300 371.34 393.31 395.80 387 12.39 12.61 12.62 12.54 83.17 85.13 84.03 84.11
C1 100 21.15 17.54 - 19
C2 150 70.42 73.45 - 72
C3 200 97.39 110.23 - 104
C4 250 133.83 141.97 - 138
C5 300 330.72 310.81 325.56 322
C1 100 22.77 23.82 - 23
C2 150 76.37 70.29 - 73
C3 200 106.14 108.55 - 107
C4 250 166.27 161.27 - 164
C5 300 337.45 400.02 351.75 363
Effect of
optimum PCB
mixtures on
OPC dosage
PCB1-20
PCB2-5
PCB3-10
Mixtures
PC
UCS (kPa) pH w (%)
Test PurposeSamples

173
Appendix E: All collected results of Unconfined Compressive Strength (UCS) at various factor in peat stabilization: Continued
1 2 3 Avg 1 2 3 Avg 1 2 3 Avg
Original 0 12.80 13.97 13.31 13 5.35 5.49 5.54 5.46 603.24 564.17 572.59 580.00
S0 0 167.43 174.96 - 171
S1 100 174.50 201.27 - 188
S2 200 223.03 255.18 - 239
S3 300 276.69 234.25 - 255
S4 400 299.02 269.17 - 284
S5 500 314.83 308.18 325.03 316
S0 0 169.52 231.87 - 201 12.78 13.04 13.00 12.94 167.98 171.35 172.20 170.51
S1 100 216.60 233.29 - 225 12.73 12.91 12.97 12.87 144.35 147.46 144.18 145.33
S2 200 258.53 265.89 - 262 12.82 12.76 13.00 12.86 123.31 126.76 125.86 125.31
S3 300 295.85 298.40 - 297 12.71 12.93 12.88 12.84 107.59 109.73 107.38 108.23
S4 400 344.33 305.95 - 325 12.67 12.88 12.76 12.77 100.25 98.03 98.26 98.85
S5 500 371.34 393.31 395.80 387 12.39 12.61 12.62 12.54 83.17 85.13 84.03 84.11
S0 0 166.77 150.06 - 158
S1 100 173.98 179.34 - 177
S2 200 218.75 192.83 - 206
S3 300 214.64 253.38 - 234
S4 400 274.23 271.97 - 273
S5 500 330.72 310.81 325.56 322
S0 0 166.92 210.57 - 189
S1 100 197.56 209.13 - 203
S2 200 236.62 252.90 - 245
S3 300 264.36 287.86 - 276
S4 400 291.60 300.41 - 296
S5 500 337.45 400.02 351.75 363
pH w (%)
Test PurposeSamples
PCB1-20
PCB2-5
PCB3-10
UCS (kPa)
Mixtures
PC
Effect of
optimum PCB
mixtures on
K7 dosage
1 2 3 Avg 1 2 3 Avg 1 2 3 Avg
Original 0 12.80 13.97 13.31 13 5.35 5.49 5.54 5.46 603.24 564.17 572.59 580.00
CC0 0 208.57 187.27 - 198
CC1 1 225.91 224.50 - 225
CC2 2 242.07 279.94 - 261
CC3 3 314.83 308.18 325.03 316
CC4 4 338.60 307.33 - 323
CC0 0 279.67 249.13 - 264 12.19 12.44 12.36 12.33 89.54 88.05 88.31 88.63
CC1 1 319.52 335.12 - 327 12.55 12.38 12.39 12.44 89.46 86.94 87.41 87.94
CC2 2 320.79 359.37 - 340 12.63 12.47 12.40 12.50 87.13 88.46 85.86 87.15
CC3 3 371.34 393.31 395.80 387 12.39 12.61 12.62 12.54 83.17 85.13 84.03 84.11
CC4 4 417.36 365.63 - 391 12.59 12.77 12.80 12.72 85.23 82.87 83.83 83.98
CC0 0 161.63 173.18 - 167
CC1 1 177.91 238.3 - 208
CC2 2 185.75 245.99 - 216
CC3 3 330.72 310.81 325.56 322
CC4 4 298.13 351.93 - 325
CC0 0 181.43 233.1 - 207
CC1 1 194.25 248.15 - 221
CC2 2 289.39 352.92 - 321
CC3 3 337.45 400.02 351.75 363
CC4 4 382.04 366.06 - 374
w (%)
Test PurposeSamples
PCB1-20
PCB2-5
PCB3-10
UCS (kPa) pH
Mixtures
PC
Effect of
optimum PCB
mixtures on
CaCl2 dosage

174
Appendix F: Calculation for compressibility test by Oedometer
STEP 1: Laboratory data analysis: Example of untreated peat, P at σ’v = 10kPa
Initial height,
Ho (cm)
Diameter, D
(cm)
Area, A
(cm2)
Specific
gravity, Gs
Water
density, ρ w
(g/cm3)
Dry mass of
sampel, Ms
(g)
Mass of
sampel, M
(g)
w
Mass of
sampel+mould,
M2 (g)
Mass of
mould, M3 (g)
3 6 28.27 1.670 1.000 13.30 90.44 5.8 332.76 242.32
Hence;
Solid height, Hs (cm) 0.282
Dial gauge, Dg 0.002
Time(sec)Settlementlab,
Δhlab(mm)
Settlement,
Δh(mm)
Settlement,
Δh(cm)
Final
height, H
(cm)
Void
height, Hv
(cm)
Void ratio,
e
Time, t
(min)√t (min)
0 0 0.000 0.000 3.000 2.718 9.649 0.00 0.000
6 143 0.286 0.029 2.971 2.690 9.548 0.10 0.316
9 161 0.322 0.032 2.968 2.686 9.535 0.15 0.387
12 175 0.350 0.035 2.965 2.683 9.525 0.20 0.447
18 199 0.398 0.040 2.960 2.678 9.508 0.30 0.548
30 232 0.464 0.046 2.954 2.672 9.484 0.50 0.707
42 260 0.520 0.052 2.948 2.666 9.464 0.70 0.837
60 293 0.586 0.059 2.941 2.660 9.441 1.00 1.000
90 341 0.682 0.068 2.932 2.650 9.407 1.50 1.225
120 380 0.760 0.076 2.924 2.642 9.379 2.00 1.414
180 493 0.986 0.099 2.901 2.620 9.299 3.00 1.732
300 630 1.260 0.126 2.874 2.592 9.202 5.00 2.236
420 712 1.424 0.142 2.858 2.576 9.144 7.00 2.646
600 833 1.666 0.167 2.833 2.552 9.058 10.00 3.162
900 933 1.866 0.187 2.813 2.532 8.987 15.00 3.873
1200 988 1.976 0.198 2.802 2.521 8.948 20.00 4.472
1800 1048 2.096 0.210 2.790 2.509 8.905 30.00 5.477
2400 1078 2.156 0.216 2.784 2.503 8.884 40.00 6.325
3600 1116 2.232 0.223 2.777 2.495 8.857 60.00 7.746
5400 1141 2.282 0.228 2.772 2.490 8.839 90.00 9.487
7200 1158 2.316 0.232 2.768 2.487 8.827 120.00 10.954
10800 1168 2.336 0.234 2.766 2.485 8.820 180.00 13.416
21600 1185 2.370 0.237 2.763 2.481 8.808 360.00 18.974
43200 1201 2.402 0.240 2.760 2.478 8.796 720.00 26.833
86400 1219 2.438 0.244 2.756 2.474 8.784 1440.00 37.947

175
STEP 2: Determination of t90 and secondary compression index, Cα by develop the graph Δh vs √t and e vs log t.
STEP 3: Determination of compression index, Cc, coefficient of compressibility, mv, coefficient of consolidation, Cv and coefficient of
permeability, k.
Pressure, P
(kPa)
Total
settlement,
△H (cm)
Final
height, H
(cm)
Void
height, Hv
(cm)
Void ratio,
e
Specimen
average
height,
Havg (cm)
△ε (%)△p
(kN/m2)
C c m v (m2/kN) t 90 (min) C v (m
2/s) k (m
2/s) C α C c / 1+e o C α/ 1+e o
0 0.000 3.000 2.718 9.649 0.000 0.000 0 0.000 0.000 0.00 0.000 0.000 0.000 0.000 0.0000
10 0.244 2.756 2.474 8.784 2.878 8.471 10 2.875 8.471E-03 18.49 1.58E-07 1.315E-08 0.075 0.270 0.0071
20 0.152 2.604 2.323 8.245 2.680 5.664 10 1.790 5.779E-03 16.00 1.59E-07 8.994E-09 0.113 0.168 0.0106
40 0.268 2.336 2.055 7.293 2.470 10.848 20 3.160 5.424E-03 17.64 1.22E-07 6.505E-09 0.189 0.297 0.0178
80 0.415 1.922 1.640 5.821 2.129 19.483 40 4.891 4.871E-03 36.00 4.45E-08 2.126E-09 0.331 0.459 0.0311
160 0.412 1.510 1.228 4.359 1.716 24.002 80 4.856 3.000E-03 64.00 1.63E-08 4.783E-10 0.348 0.456 0.0327
320 0.309 1.200 0.919 3.261 1.355 22.832 160 3.648 1.427E-03 73.96 8.77E-09 1.228E-10 0.265 0.343 0.0249
640 0.243 0.958 0.676 2.400 1.079 22.482 320 2.861 7.026E-04 90.25 4.56E-09 3.142E-11 0.233 0.269 0.0218
Average 0.3647
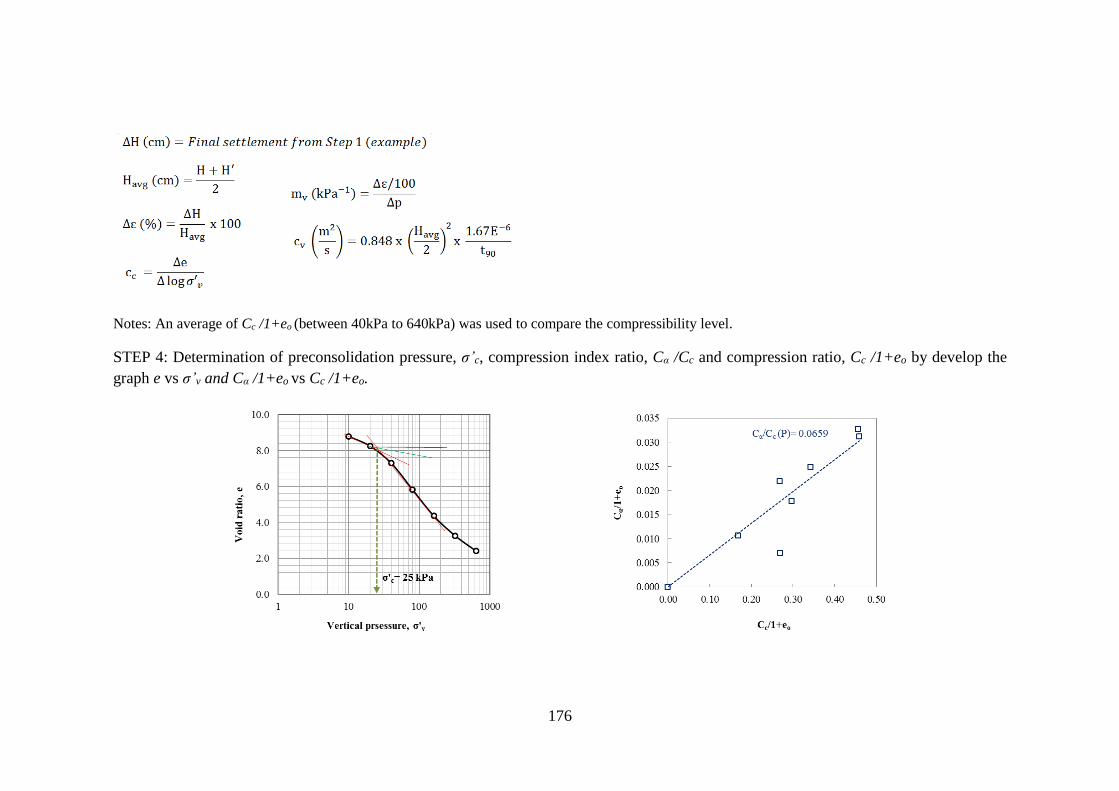
176
Notes: An average of Cc /1+eo (between 40kPa to 640kPa) was used to compare the compressibility level.
STEP 4: Determination of preconsolidation pressure, σ’c, compression index ratio, Cα /Cc and compression ratio, Cc /1+eo by develop the
graph e vs σ’v and Cα /1+eo vs Cc /1+eo.