social ecology - aau
TRANSCRIPT
Social Ecology S o c i a l E c o l o g y W o r k i n g P a p e r 8 7
i f f S o c i a l E c o l o g y | S c h o t t e n f e l d g a s s e 2 9 | A - 1 0 7 0 V i e n n a | w w w . i f f . a c . a t / s o c e c /
Accounting for raw material equivalents of traded goods
A comparison of input-output approaches in physical, monetary, and mixed units
Helga Weisz
January 2006
ISSN 1726-3816
Weisz, Helga 2006: Accounting for raw material equivalents of traded goods. A comparison of input-output approaches in physical, monetary, and mixed units. Social Ecology Working Paper 87. Vienna. Social Ecology Working Paper 87 Vienna, January 2006 ISSN 1726-3816 Institute of Social Ecology IFF - Faculty for Interdisciplinary Studies (Klagenfurt, Graz, Vienna) Klagenfurt University Schottenfeldgasse 29 A-1070 Vienna +43-(0)1-522 40 00-401 www.iff.ac.at/socec [email protected] © 2006 by IFF – Social Ecology
- 1 -
Accounting for raw material equivalents of traded goods.
A comparison of input-output approaches in physical, monetary, and mixed units.
Helga Weisz
1) Institute for Social Ecology, Faculty for Interdisciplinary Studies (IFF)
University of Klagenfurt, Vienna
Schottenfeldgasse 29, A-1070 Vienna, Austria
Contact details: [email protected],
phone +43-1-522 40 00-410, fax +43-1-522 40 00-477
Vienna, January 2006
- 2 -
Abstract
Globalisation results in rapidly growing trade volumes and an increasing international division of
labour. This could lead to a globally uneven distribution of the costs (in terms of environmental
pressure) and the benefits (in terms of material standard of living) of the use of material and
energy. Regarding CO2 emissions, such an uneven distribution has been termed "carbon
leakage", more generally it is referred to as "ecologically unequal trade" or "ecological terms of
trade". If such leakage phenomena will become more important quantitatively, this will have
consequences for measuring dematerialization and ecologically unequal trade. In particular, the
current definition of national indicators must be broadened to take into account also the upstream
environmental pressures associated to the production of traded goods. Regarding indicators
derived from national material flow accounting, Eurostat proposed the concept of raw materiel
equivalents to specify the upstream requirements of imports and exports, in terms of used
extraction. Until now no reliable method has been developed which would allow to compute the
raw material equivalents for a national economy. In this paper we argue that a combination of
input-output analysis and material flow analysis offers the appropriate tools to account for these
raw materials equivalents and illustrate the feasibility with a case study. We present three open
static input-output models, which differ in the units of measurement of sectoral output. Applied
to the case of Denmark in 1990, we show that the three models deliver substantially different
results. We discuss the results in terms of plausibly and accuracy of the concepts and draw
conclusions for a further harmonization in accounting for upstream material requirements.
Keywords: material flow analysis, raw material equivalents, trade and environment, physical
input-output analysis, monetary input output analysis, mixed unit input-output analysis,
dematerialization, ecologically unequal trade.
- 3 -
Introduction
The large quantities of raw materials used in industrial economies and the rapidly increasing
amounts demanded by industrializing economies such as China and India are essential causes of
global environmental change. Decoupling or dematerialization have been proposed as solutions,
and the use of materials has been identified as a key policy area for sustainable development
strategies.1 As a consequence, the need for periodically available and standardized economy-
wide material flow accounts and indicators of material use has increased internationally.2
Economy-wide material flow accounts (MFAs) are consistent compilations of the overall
material inputs into national economies, the material accumulation within the economic system
and the material outputs to other economies or to the environment. MFAs cover all material
inputs except for water and air, the unit of measurement is tons per year (Eurostat 2001a). A
number of MFA derived indicators has been proposed by Eurostat (2001a), and the choice of
appropriate indicators to support strategies of dematerialization and a sustainable use of
recourses is intensively discussed in the OECD and EU.
Recent MFA studies show that the amounts of raw materials extracted annually from the
domestic territories of industrialized countries increased only slightly over the past decades,
whereas the physical quantities of annually imported and exported goods grew at a considerably
higher pace (Eurostat 2002, Weisz et al. 2005). In essence, this reflects that the ongoing
globalisation of economic activities is leading to a growing international division of labour and
spatial separation of production and consumption activities. A national economy thus may, via
imports, externalise to other countries particular stages of the production of its domestically
consumed final goods, and by this also the associated environmental burden. At the same time a
national economy may specialize into producing specific goods for the world market, and thus
via exports internalise the associated environmental burden. This overall tendency of an
- 4 -
increasing international division of labour has important consequences for the definition of
national environmental sustainability targets and indicators if they are defined spatially.
With regards to CO2 emissions this phenomenon has been termed "carbon leakage" (Gielen and
Moriguchi 2002) and is increasingly a matter of concern (c.f. Hoekstra and Janssen 2002, Gielen
and Moriguchi 2002, Machado et al. 2001). The argument goes that established national carbon
accounting frameworks attribute CO2 emissions generated in the course of producing goods for
export to the exporting countries, although the final goods are consumed elsewhere. By the same
token an equally unknown part of the CO2 emissions, which factually serve the domestic final
consumption of the focal economy, is attributed to those countries from which the focal economy
receives its imports. Given further liberalization of the world market and the resulting increase in
physical trade quantities, such “leakage” phenomena will likely become much more important in
the future.
National material flow indicators face an analogous problem. A procedure would be needed by
which the upstream material requirements of traded commodities could be traced back to a
standardized system boundary. Such a procedure is still missing, despite the fact that analogous
“leakage phenomena” or “ecological terms of trade” (Martinez-Alier forthcoming) have been
recognized quite early in material flow analysis as "ecological rucksacks" (Schmidt-Bleek 1993).
This paper takes its start from the assumption that a procedure would be desirable which allowed
deliveries to final domestic consumption of a national economy to be “charged” for in terms of
the raw materials that were directly and indirectly used in the upstream production chain of these
commodities, regardless of which economy the production took place in. We propose a
combination of material flow analysis and input-output economics to account for such upstream -
or in the terminology of Eurostat "raw material equivalents" - of exports and imports. We present
and discuss three input-output approaches which differ in the units of measurement of sectoral
output.
- 5 -
The organization of the remaining paper is as follows. Section 1 presents the concept of raw
material equivalents, section 2 describes the three input-output approaches and the data sources
used in the Danish case study. Section 3 presents the numerical results from an application of the
three models to the case of Denmark in 1990, section 4 discusses and concludes.
The concept of raw material equivalents
In its methodological guide, Eurostat (2001a) introduced a new and improved terminology to
distinguish between different types of upstream material requirements, formerly lumped together
as ‘hidden flows’ or ‘ecological rucksacks’. Eurostat suggests to distinguish between ‘used’ and
‘unused’ extraction on the one hand and ‘direct’ and ‘indirect’ flows on the other hand.
The distinction ‘used’ and ‘unused’ extraction refers to the boundary between an economic
system and its natural environment and specifies what should be regarded as an ‘input’ from the
environment to the economic system, i.e. what should be regarded as a raw material. Eurostat
states: “Inputs from the environment refer to the extraction or movement of natural materials on
purpose and by humans or human controlled means of technology (i.e. involving labour). The
term ‘used’ therefore refers to acquiring value within the economic system, it signifies “an input
for use in any economy, i.e. whether a material acquires the status of a product........’unused
flows’ are materials that are extracted from the environment without the intention of using them
...” ( Eurostat 2001a, p.20). Dredging material, excavation material, overburden from mining (the
sterile material which has to be removed in order to get access to the gross ores) and unused by-
products from biomass harvest are the main components of ‘unused’ extraction.
‘Used’ and ‘unused’ extraction differ greatly in many relevant aspects. Unused flows are huge
flows of minor environmental relevance. In the EU-15, the estimated unused extraction is
roughly twice as large as the used extraction (see Eurostat 2001b). Unused extraction mainly
- 6 -
consists of inert materials, which are not subject to chemical or physical transformation, which
are not accumulated within the socio-economic system, and which do not require considerable
competitive land occupation. Unused materials are of minor if not no economic significance, and
finally, the data quality to account for these materials is particularly poor resulting in poor
comparability of the derived indicators.
Most countries in the world do not report at all on these flows, so their magnitude has to be
estimated, usually using coefficients from technical literature. These coefficients are available
for a few countries and points in time only. If added together with used extraction, as for
example in the MFA indicator "total material requirement" (TMR)3, the substantially higher data
quality of the direct flows (i.e. used extraction and direct imports), as well as their significantly
higher environmental and economic relevance, is masked, and an in-depth analysis of the
physical structure of an economy becomes difficult. For these reasons, an aggregation of ‘used’
and ‘unused’ extraction to one single indicator should be avoided (see also Ayres et al. 2004 for
a similar argument).
In addition, the definition of what has to be considered as “unused” extraction still remains
vague, and it is not clear what is included or not. Some studies for example include soil erosion
into TMR (c.f. Bringezu et al. 2004), although Eurostat recommended not to include it into the
aggregated indicators (Eurostat 2001a).
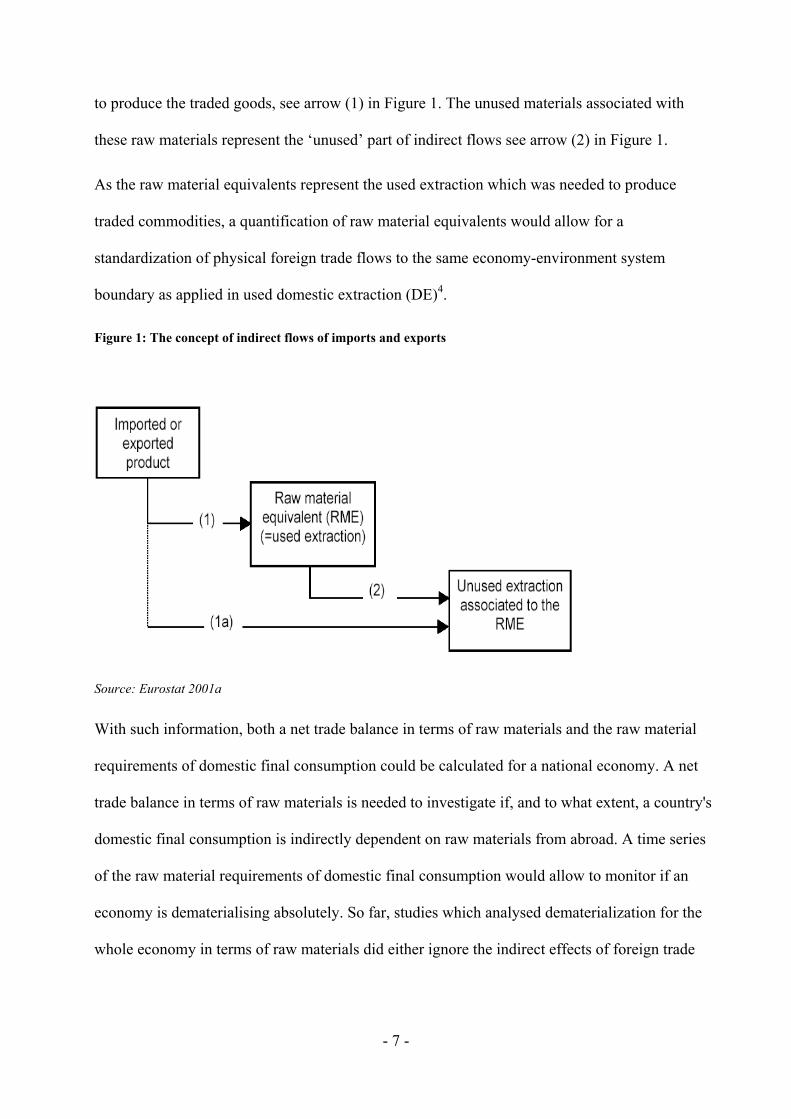
The distinction between ‘direct’ and ‘indirect flows’, on the other hand, refers to the boundary
between a national economy vis a vis other national economies, i.e. to traded goods. All
upstream material requirements which were needed to produce imported or exported
commodities are denoted as ‘indirect flows’, see arrow (1a) in Figure 1. As goods in different
stages of processing are traded, from basic commodities to final products, indirect flows consist
of two fractions: The “raw material equivalents” represent the used extraction which was needed
- 7 -
to produce the traded goods, see arrow (1) in Figure 1. The unused materials associated with
these raw materials represent the ‘unused’ part of indirect flows see arrow (2) in Figure 1.
As the raw material equivalents represent the used extraction which was needed to produce
traded commodities, a quantification of raw material equivalents would allow for a
standardization of physical foreign trade flows to the same economy-environment system
boundary as applied in used domestic extraction (DE)4.
Figure 1: The concept of indirect flows of imports and exports
Source: Eurostat 2001a
With such information, both a net trade balance in terms of raw materials and the raw material
requirements of domestic final consumption could be calculated for a national economy. A net
trade balance in terms of raw materials is needed to investigate if, and to what extent, a country's
domestic final consumption is indirectly dependent on raw materials from abroad. A time series
of the raw material requirements of domestic final consumption would allow to monitor if an
economy is dematerialising absolutely. So far, studies which analysed dematerialization for the
whole economy in terms of raw materials did either ignore the indirect effects of foreign trade
- 8 -
flows (see. e. g. Ayres et al 2004 for the US) or focused merely on the unused extraction
associated with imported goods (Bringezu et al. 2004).
This latter approach to account for indirect flows has been developed by the Wuppertal Institute
and became known as "ecological rucksacks" or "hidden flows". It is a LCA type approach using
coefficients from the literature which are then multiplied by the quantities of the used raw
materials. This method may in principle be appropriate to account for the unused extraction of a
few basic commodities, if regional specific coefficients are available. It cannot be applied,
however, to the much more complex estimation of raw material equivalents of all imported and
exported goods. Not only is the number of coefficients that would be needed by far too large to
be compiled in practice. LCA approaches also lack appropriate standards to guarantee the
consistency and comparability of the accounts, in particular when aggregated to larger scales.
LCA factors cannot account for the so called second and third round effects of the intermediate
use and supply chains of the industrial production system. 5 These intermediate flows have
become extremely large in highly industrialized economies (see Ayres et al. 2004). It is therefore
not surprising that TMR accounts so far hardly include the raw material equivalents of the
imports but simply restrict to the unused extraction associated to some basic imported
commodities (see e.g. Bringezu et al. 2001, Eurostat 2001b, Pedersen 2002, Barbiero et al.
2003). In addition, if fixed coefficients for unused extraction are used in time series analysis, the
results may be deteriorated, because in reality these ratios change over time, in accordance with
changing of ore grades, technologies and production sides.
Finally it should be noted that mere input indicators such as TMR or DMI (direct material input)6
in general may yield misleading results regarding dematerialization or unequal trade, because
these indicators neglect the indirect flows associated to exports. This is relevant as exports are
increasing faster than imports in many countries. In the EU-15, for example, total increase of the
physical import volume was 40% from 1970 to 2001, whereas exports increased by 100% over
- 9 -
the same period. Compared to that the annual amount of raw materials extracted from the
territory of the EU-15, was only 14% higher in 2001 as it was in 1970 (Weisz et al. 2005).
If dematerialization or a possible relocation of raw material intensive production is analysed for
national economies the net effect of the upstream raw material requirements of imports and
exports must be taken into account.
Methods and data sources
Input-output economics is a body of theory created by Nobel Prize laureate Wassily Leontief in
the late 1930s (Leontief 1936, Leontief 1941) and was originally designed to analyse the
interdependence of industries in an economy. Since the late 1960s, IO analysis was extended to
allow for addressing economy-environment relationships, focusing predominantly on energy use
and pollution (Cumberland 1966, Ayres and Kneese 1969, Bullard and Herendeen 1975, Griffin
1976, Leontief 1970, Proops 1977, Duchin et al. 1994, Duchin 1998). Within industrial ecology,
IO analysis has been applied increasingly to LCA in past years (c.f. Lave et al. 1995, Suh 2004b,
Peters and Hertwich in press). Limited work has been done concerning the application of IO
analysis to economy-wide MFA (Konijn et al. 1997, Behrensmeier and Bringezu 1995,
Hinterberger et al. 1998, Hoekstra 2005, Suh forthcoming).
To account for the raw material equivalents of any category of final deliveries we begin with a
basic static open input-output quantity model of the type:
Z + y = x (1)
(I-A) -1*y = x (2)
where Z is the n x n inter-industry table with elements {zij}, y is the n x 1 vector of final
deliveries with elements {yi}, and x is the n x 1 vector of sectoral output with elements {xi}, A
- 10 -
is the n x n matrix of direct input coefficients (also known as technical coefficient matrix),
derived by dividing the n x n inter-industry table Z by the n x 1 vector of sectoral output x.
Thus, A equals Z <x> -1 and the elements of A are {aij = zij/xi}. Finally I is the n x n identity
matrix (with ones down the diagonal and zeros elsewhere). The matrix (I-A) -1 is called the
Leontief inverse.
Further we need a 1 x n vector f (with elements {fj})of material factor inputs. In general, the
concept of "factor inputs" represents the biophysical analogue to the monetised concept of "value
added" and comprises the biophysical factors of production, such as raw materials, land, water,
energy (Duchin forthcoming). For the purpose of computing the raw material equivalents needed
to produce a given bill of exports we consider all raw materials and imported goods as material
factors. This aggregate is known a direct material input (DMI) in economy-wide material flow
accounting.
However, economy wide material flow accounts, so far, do not routinely provide a sectoral
disaggregation of DMI. If a physical input-output table in one single unit of mass (PIOT) is
available, a vector of sectoral material factor inputs (or sectoral DMI) is provided by the factor
input quadrant of the PIOT (see e.g. Stahmer et al. 1998, Pedersen 1999). Still some caution is
required as currently available PIOTs do often not apply the system boundary definitions of
standard economy-wide MFA (Weisz and Duchin in press). An alternative would be an
integrated NAMEA. NAMEA stands for “national accounting matrix including environmental
accounts” (Eurostat 2001c). The environmental accounts typically include air emissions,
emissions to water, energy supply, and waste generation. If also materials flows, in particular
domestic extraction (DE) and DMI, are included, we talk about an integrated NAMEA. An
integrated NAMEA assures full compatibility with the system boundary definitions of an
economy wide MFA.7
- 11 -
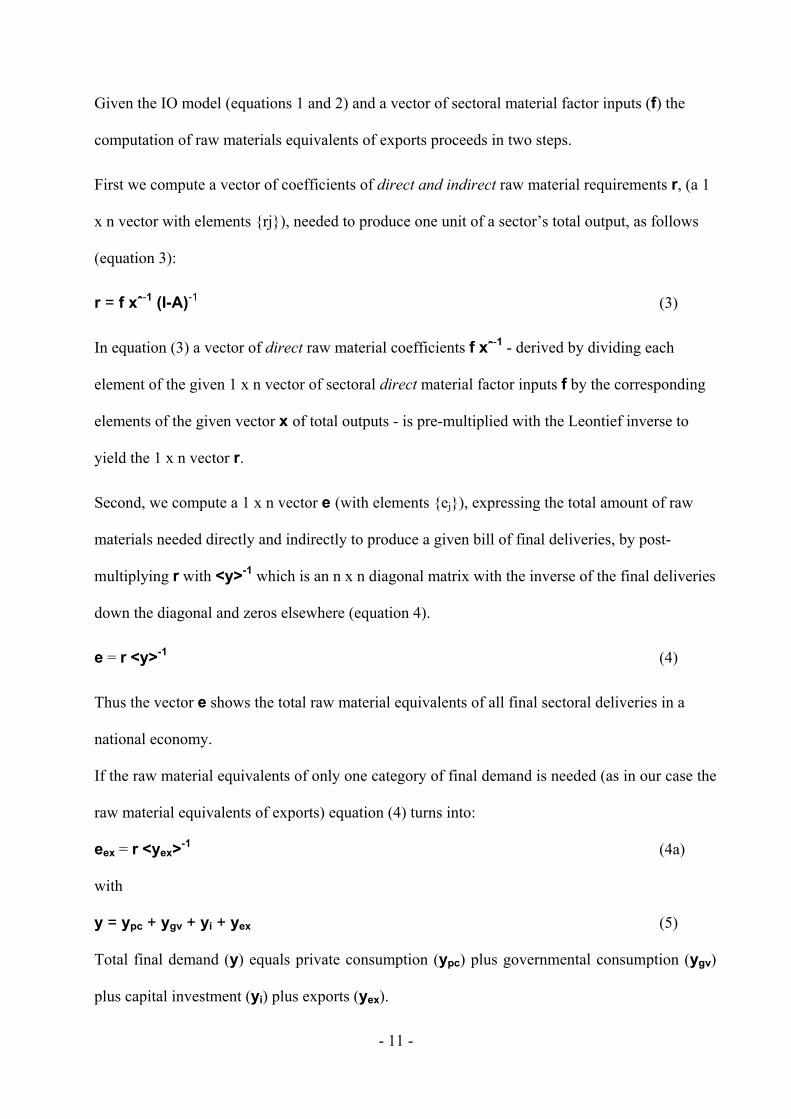
Given the IO model (equations 1 and 2) and a vector of sectoral material factor inputs (f) the
computation of raw materials equivalents of exports proceeds in two steps.
First we compute a vector of coefficients of direct and indirect raw material requirements r, (a 1
x n vector with elements {rj}), needed to produce one unit of a sector’s total output, as follows
(equation 3):
r = f xˆ-1 (I-A)-1 (3)
In equation (3) a vector of direct raw material coefficients f xˆ-1 - derived by dividing each
element of the given 1 x n vector of sectoral direct material factor inputs f by the corresponding
elements of the given vector x of total outputs - is pre-multiplied with the Leontief inverse to
yield the 1 x n vector r.
Second, we compute a 1 x n vector e (with elements {ej}), expressing the total amount of raw
materials needed directly and indirectly to produce a given bill of final deliveries, by post-
multiplying r with <y>-1 which is an n x n diagonal matrix with the inverse of the final deliveries
down the diagonal and zeros elsewhere (equation 4).
e = r <y>-1 (4)
Thus the vector e shows the total raw material equivalents of all final sectoral deliveries in a
national economy.
If the raw material equivalents of only one category of final demand is needed (as in our case the
raw material equivalents of exports) equation (4) turns into:
eex = r <yex>-1 (4a)
with
y = ypc + ygv + yi + yex (5)
Total final demand (y) equals private consumption (ypc) plus governmental consumption (ygv)
plus capital investment (yi) plus exports (yex).
- 12 -
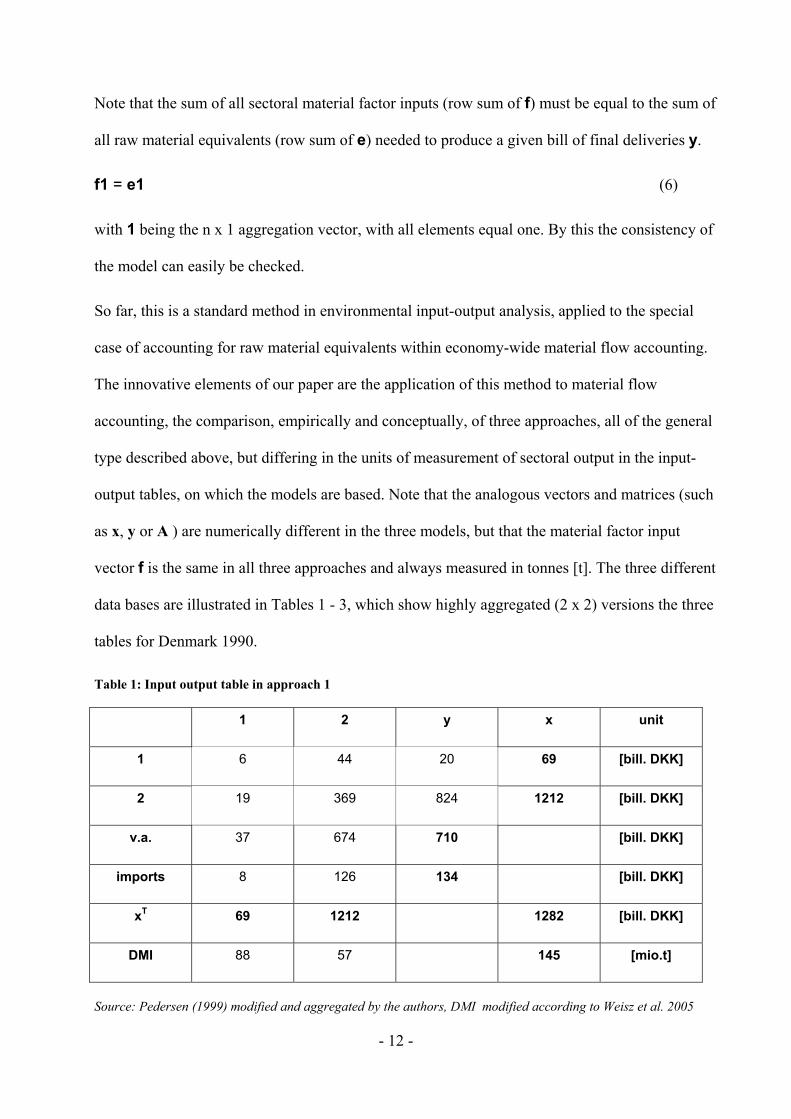
Note that the sum of all sectoral material factor inputs (row sum of f) must be equal to the sum of
all raw material equivalents (row sum of e) needed to produce a given bill of final deliveries y.
f1 = e1 (6)
with 1 being the n x 1 aggregation vector, with all elements equal one. By this the consistency of
the model can easily be checked.
So far, this is a standard method in environmental input-output analysis, applied to the special
case of accounting for raw material equivalents within economy-wide material flow accounting.
The innovative elements of our paper are the application of this method to material flow
accounting, the comparison, empirically and conceptually, of three approaches, all of the general
type described above, but differing in the units of measurement of sectoral output in the input-
output tables, on which the models are based. Note that the analogous vectors and matrices (such
as x, y or A ) are numerically different in the three models, but that the material factor input
vector f is the same in all three approaches and always measured in tonnes [t]. The three different
data bases are illustrated in Tables 1 - 3, which show highly aggregated (2 x 2) versions the three
tables for Denmark 1990.
Table 1: Input output table in approach 1
1 2 y x unit
1 6 44 20 69 [bill. DKK]
2 19 369 824 1212 [bill. DKK]
v.a. 37 674 710 [bill. DKK]
imports 8 126 134 [bill. DKK]
xT 69 1212 1282 [bill. DKK]
DMI 88 57 145 [mio.t]
Source: Pedersen (1999) modified and aggregated by the authors, DMI modified according to Weisz et al. 2005
- 13 -
Approach 1 is the most common approach where the measurement to express the quantities of
output of all sectors of the economy is money value (expressed in national currency and current
prices). Such a table is called a monetary input-output table (MIOT) and its underlying data
structure is shown in Table 1.
Note that the monetary value added and import vectors visible in Table 1 are not needed for the
computation of raw material equivalents. Their integration into Table 1 merely has the purpose
to illustrate that for a full input-output table in monetary units (i.e. one comprising of all three
quadrants) sectoral inputs equal sectoral outputs.
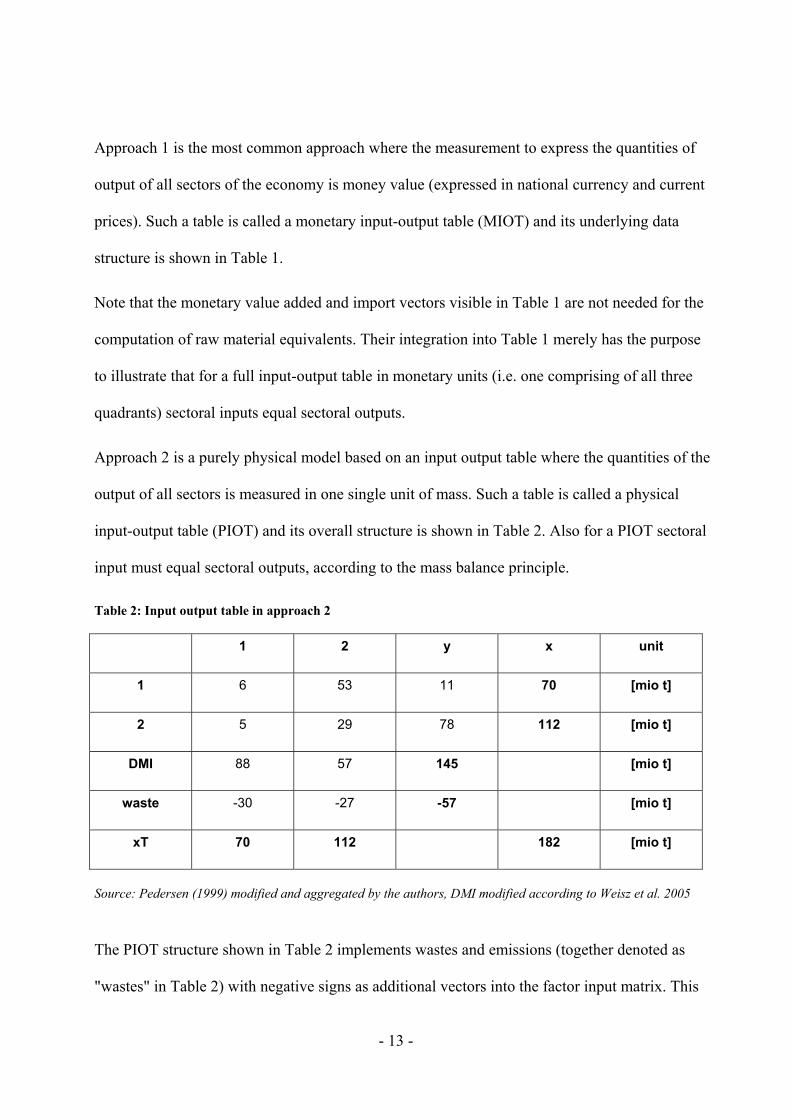
Approach 2 is a purely physical model based on an input output table where the quantities of the
output of all sectors is measured in one single unit of mass. Such a table is called a physical
input-output table (PIOT) and its overall structure is shown in Table 2. Also for a PIOT sectoral
input must equal sectoral outputs, according to the mass balance principle.
Table 2: Input output table in approach 2
1 2 y x unit
1 6 53 11 70 [mio t]
2 5 29 78 112 [mio t]
DMI 88 57 145 [mio t]
waste -30 -27 -57 [mio t]
xT 70 112 182 [mio t]
Source: Pedersen (1999) modified and aggregated by the authors, DMI modified according to Weisz et al. 2005
The PIOT structure shown in Table 2 implements wastes and emissions (together denoted as
"wastes" in Table 2) with negative signs as additional vectors into the factor input matrix. This
- 14 -
interpretation of emissions and wastes as factor inputs is already apparent in early attempts to
apply input-output economics to environmental analysis (see c.f. Leontief 1970), and has been
proposed for single unit mass PIOTs already in 1993 by Fleissner an co-authors (Fleissner et al.
1993) and again recently by Hoekstra (2003), Suh (2004a) and Dietzenbacher (2005).
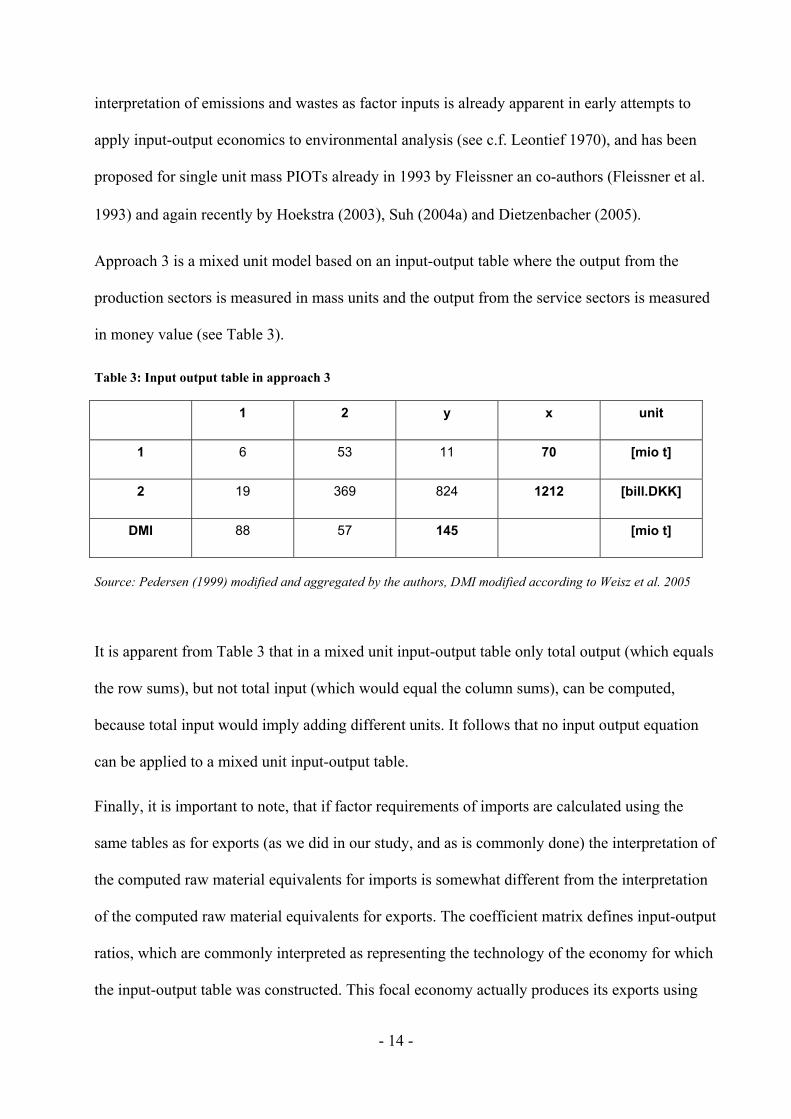
Approach 3 is a mixed unit model based on an input-output table where the output from the
production sectors is measured in mass units and the output from the service sectors is measured
in money value (see Table 3).
Table 3: Input output table in approach 3
1 2 y x unit
1 6 53 11 70 [mio t]
2 19 369 824 1212 [bill.DKK]
DMI 88 57 145 [mio t]
Source: Pedersen (1999) modified and aggregated by the authors, DMI modified according to Weisz et al. 2005
It is apparent from Table 3 that in a mixed unit input-output table only total output (which equals
the row sums), but not total input (which would equal the column sums), can be computed,
because total input would imply adding different units. It follows that no input output equation
can be applied to a mixed unit input-output table.
Finally, it is important to note, that if factor requirements of imports are calculated using the
same tables as for exports (as we did in our study, and as is commonly done) the interpretation of
the computed raw material equivalents for imports is somewhat different from the interpretation
of the computed raw material equivalents for exports. The coefficient matrix defines input-output
ratios, which are commonly interpreted as representing the technology of the economy for which
the input-output table was constructed. This focal economy actually produces its exports using
- 15 -
the technology expressed in the input-output table. Imports, however, are produced by other
economies, which are most probably characterized by different technologies. The computed raw
material equivalents for imports thus no longer show the actual raw material equivalents that
were needed to produce the imported goods, but rather show a biophysical analogy to
opportunity costs, i.e. the factor requirements that would have been needed had the focal
economy been forced to produce all the imported commodities domestically.
For the computation of the raw material equivalents of Danish exports and imports in 1990 we
used the Danish MIOT, a 27 x 27 industry-industry table in million Danish Crones (DKK),
current prices and the Danish PIOT, a 27 x 27 industry-industry table in 1000 metric tones for
the year 1990 both derived from Pedersen (1999). For the physical model we aggregated and
rearranged the tables to a 16 x 16 physical table, as all service sectors except for one had zero
output in the original physical table. The computations with the monetary and the mixed unit
models were done at a 27 n resolution. For reasons of comparability the results were then
aggregated to the same 16 n classification as in the physical model. We distinguished three final
demand vectors (1) private consumption (including government consumption), (2) exports and
(3) capital formation which corresponds to the increase in physical stocks measured in tons. We
corrected the factor input vector “Danish resource extraction” from the PIOT in accordance with
the numerical results for DMI of Denmark in 1990 (Weisz et al. 2005) to ensure that DMI equals
the latest official material flow accounts for Denmark.
- 16 -
Results
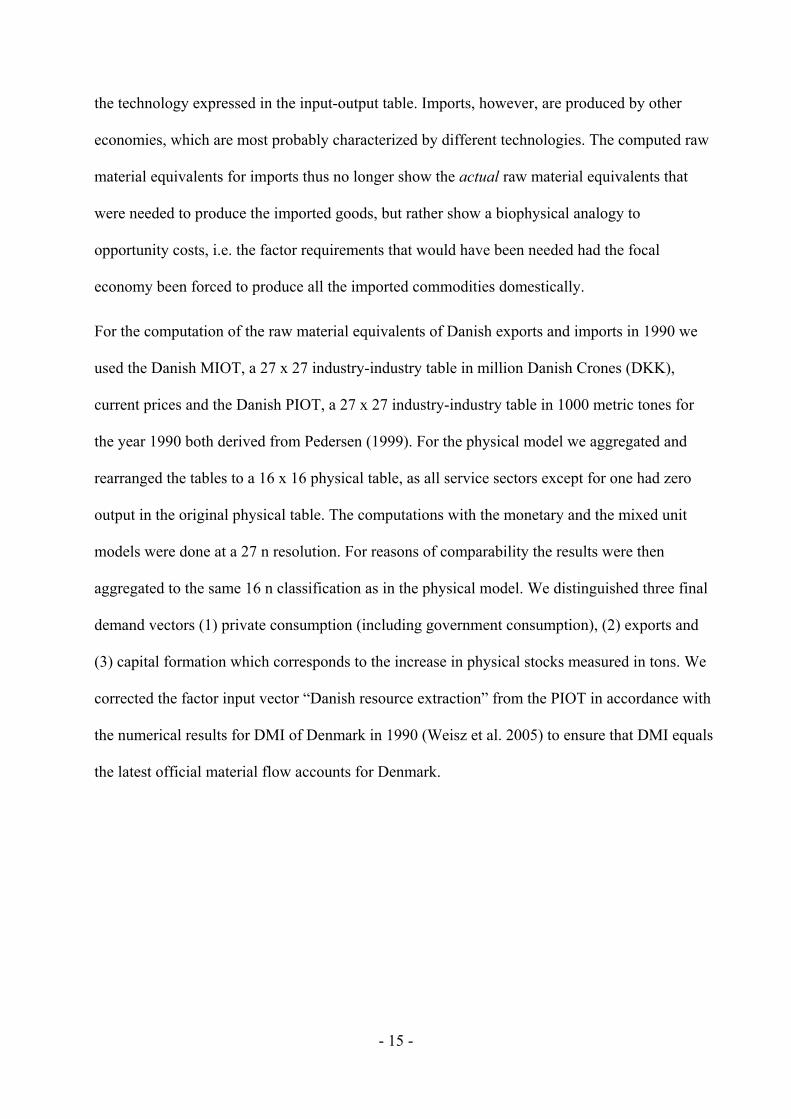
A comparison of the raw material equivalents for total final deliveries (e) computed with the
three models is shown in Table 4.
Unexpectedly, the results obtained from the purely physical model and the results obtained from
the mixed unit model are almost identical, whereas the monetary model gave substantially
different results.
Table 4: Sectoral raw material equivalents of total final deliveries
monetary model
physical model mixed unit model
Agriculture, horticulture etc. 19,2 11,9 19,3 Forestery and logging 0,5 0,8 0,5 Fishing 0,2 1,1 0,2 Mining and quarrying 5,6 18,9 5,6 Manuf. of food, beverages, tobacco 29,2 36,0 29,4 Textile, clothing, leather industry 0,7 0,7 0,7 Manuf. of wood products, incl. Furnit 1,9 1,9 1,9 Manuf. of paper, printing, publishing 1,0 0,6 1,1 Chemical and petroleum industries 6,9 16,5 6,9 Non-metalic mineral products 1,7 1,3 1,7 Basic metal industries 0,6 0,3 0,6 Manuf. of fabricated metal products 2,8 3,9 3,0 Other manufacturing industries 0,1 0,2 0,1 Electricity, gas and water 5,4 8,2 5,4 Construction 57,7 21,1 58,0 Services 9,1 19,4 8,4 SUM 142,5 142,8 142,8
Source: Pedersen 2002, own calculations based on data from Pedersen 1999 and Weisz et al. 2005.
The largest amount of raw material equivalents are attributed to the construction sector in the
physical and the mixed unit model, whereas the monetary model suggests that food
manufacturing would be the most material intensive sector. The row sum of e exactly equals the
row sum of f in the results of the monetary and the mixed unit model. The physical model gives
a slightly different value.
- 17 -
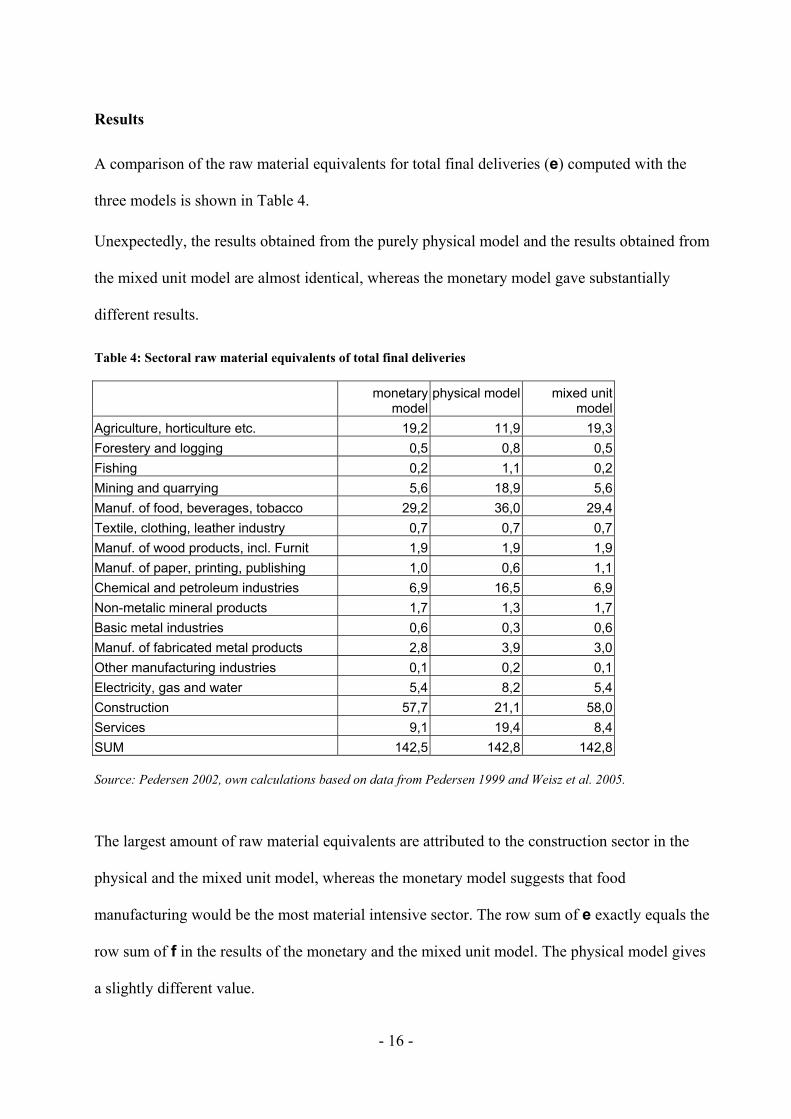
Table 5 gives the same information for exports only (eex). Again the physical and the mixed unit
model gave almost identical results. The calculated total of raw material equivalents of all
exported goods (row sum of of eex) amount to 48 and 49 million tons respectively with the two
models. The corresponding figure from the monetary model is much higher; it amounts to 74
million tons. The monetary model allocates the largest amount of raw material equivalents to the
food manufacturing sector (22 million tons), and the mining and quarrying sector (19 million
tons). The physical and the mixed unit model also allocate the largest fraction of raw materials to
the food manufacturing sector, but the absolute amount is substantially lower (16 million tons).
Second largest according to these two models is the agricultural sector with 14 million tons of
raw material equivalents.
Table 5: Sectoral raw material equivalents of exports
monetary model
physical model mixed unit model
Agriculture, horticulture etc. 8,7 13,8 13,8 Forestery and logging 0,6 0,3 0,3 Fishing 1,0 0,2 0,2 Mining and quarrying 18,6 4,9 4,9 Manuf. of food, beverages, tobacco 22,4 16,1 16,2 Textile, clothing, leather industry 0,4 0,3 0,3 Manuf. of wood products, incl. Furnit 1,4 1,1 1,1 Manuf. of paper, printing, publishing 0,3 0,7 0,7 Chemical and petroleum industries 13,6 4,8 4,9 Non-metalic mineral products 1,2 1,6 1,6 Basic metal industries 0,3 0,6 0,6 Manuf. of fabricated metal products 2,7 2,0 2,2 Other manufacturing industries 0,2 0,1 0,1 Electricity, gas and water 0,5 0,0 0,0 Construction 0,0 0,0 0,0 Services 2,0 2,3 1,3 SUM 73,7 48,8 48,2
Source: Pedersen 2002, own calculations based on data from Pedersen 1999 and Weisz et al. 2005.
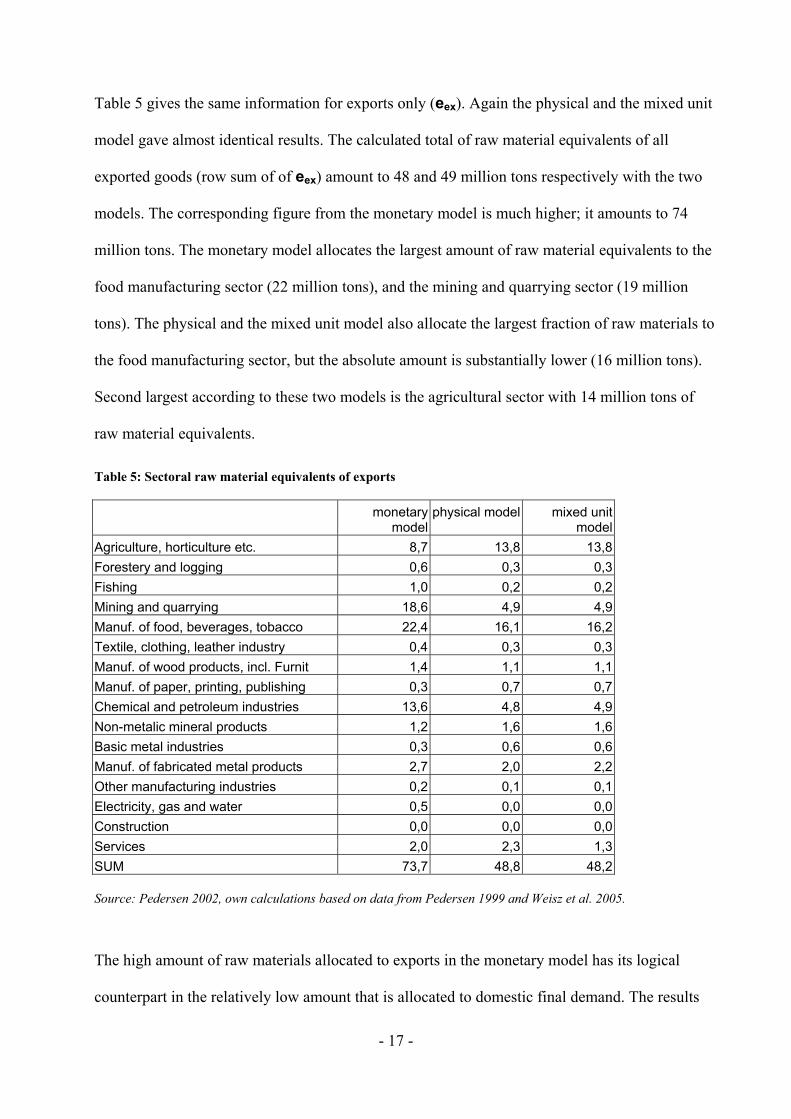
The high amount of raw materials allocated to exports in the monetary model has its logical
counterpart in the relatively low amount that is allocated to domestic final demand. The results
- 18 -
for exports and domestic final demand from the three models are summarized in an aggregated
form in Figure 2. It reveals that the difference in the three models is largely determined by the
attribution of extremely large quantities of raw materials to the construction sector in the
physical and in the mixed unit models. The monetary model allocates roughly the same amount
of raw materials, 70 million tons, to exports and to final goods for domestic consumption. On the
other hand, the physical and the mixed unit model allocate 50 million tonnes to exports, but 95
million tonnes to domestic use.
Figure 2: Raw material equivalents of exports and domestic final demand (in million tonnes)
Source: own calculation based Pedersen (1999) modified and aggregated by the authors, DMI modified according to Weisz et al. 2005
How do these different results translate into the new MFA indicator "raw material trade
balance"? Table 6 and Figure 3 compare aggregates for direct imports, exports, and physical
trade balance derived from standard MFA to the calculated figures for the directly and indirectly
required raw material equivalents of imports, exports and the physical trade balance derived
from the three models applied. All figures refer to Denmark in 1990.
0,0
10,0
20,0
30,0
40,0
50,0
60,0
70,0
80,0
90,0
100,0
monetary model physical model mixed unit model monetary model physical model mixed unit model
exports domestic final demand
Raw
mat
eria
l equ
ival
ents
in m
illio
n to
ns
primary sector secondary sector construction tertiary sector
- 19 -
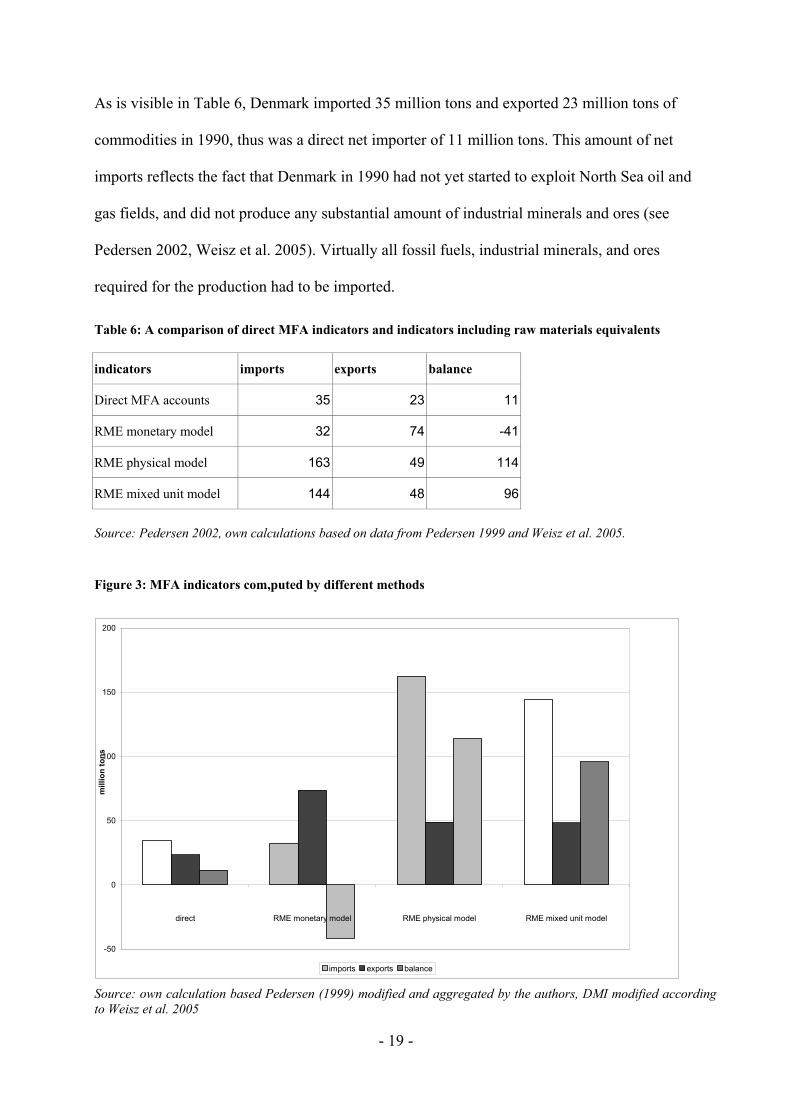
As is visible in Table 6, Denmark imported 35 million tons and exported 23 million tons of
commodities in 1990, thus was a direct net importer of 11 million tons. This amount of net
imports reflects the fact that Denmark in 1990 had not yet started to exploit North Sea oil and
gas fields, and did not produce any substantial amount of industrial minerals and ores (see
Pedersen 2002, Weisz et al. 2005). Virtually all fossil fuels, industrial minerals, and ores
required for the production had to be imported.
Table 6: A comparison of direct MFA indicators and indicators including raw materials equivalents
indicators imports exports balance
Direct MFA accounts 35 23 11
RME monetary model 32 74 -41
RME physical model 163 49 114
RME mixed unit model 144 48 96
Source: Pedersen 2002, own calculations based on data from Pedersen 1999 and Weisz et al. 2005.
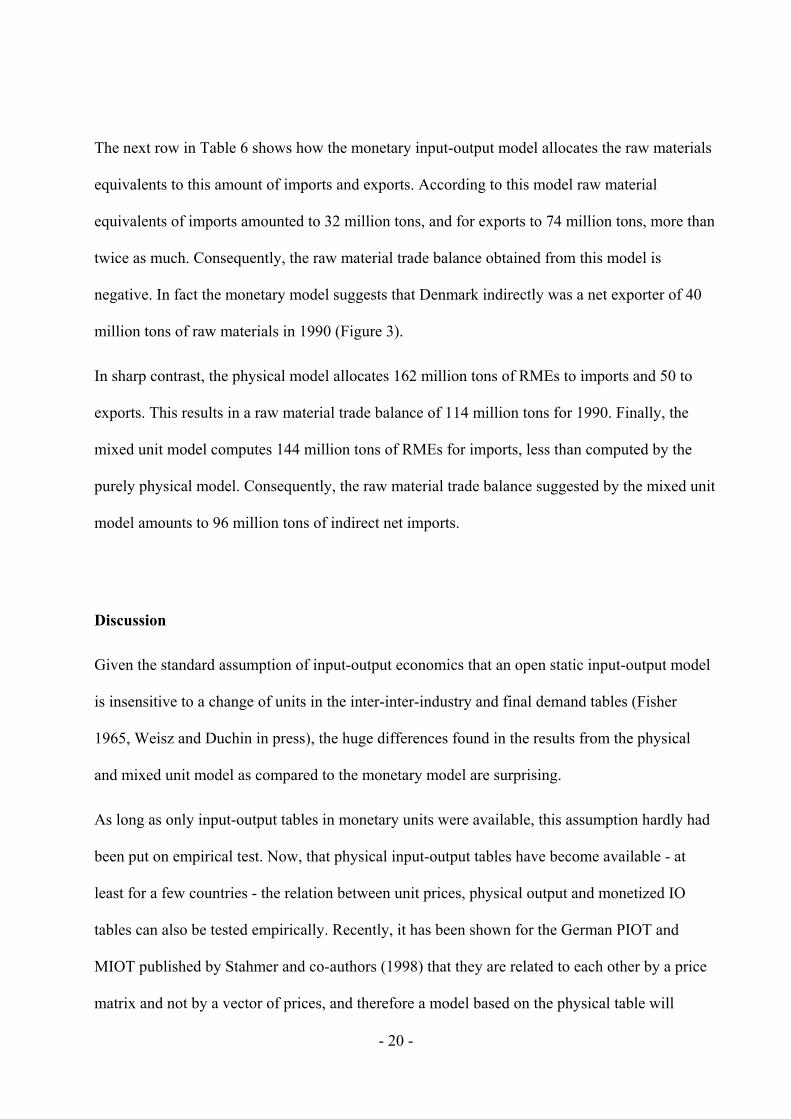
Figure 3: MFA indicators com,puted by different methods
Source: own calculation based Pedersen (1999) modified and aggregated by the authors, DMI modified according to Weisz et al. 2005
-50
0
50
100
150
200
direct RME monetary model RME physical model RME mixed unit model
mill
ion
tons
imports exports balance
- 20 -
The next row in Table 6 shows how the monetary input-output model allocates the raw materials
equivalents to this amount of imports and exports. According to this model raw material
equivalents of imports amounted to 32 million tons, and for exports to 74 million tons, more than
twice as much. Consequently, the raw material trade balance obtained from this model is
negative. In fact the monetary model suggests that Denmark indirectly was a net exporter of 40
million tons of raw materials in 1990 (Figure 3).
In sharp contrast, the physical model allocates 162 million tons of RMEs to imports and 50 to
exports. This results in a raw material trade balance of 114 million tons for 1990. Finally, the
mixed unit model computes 144 million tons of RMEs for imports, less than computed by the
purely physical model. Consequently, the raw material trade balance suggested by the mixed unit
model amounts to 96 million tons of indirect net imports.
Discussion
Given the standard assumption of input-output economics that an open static input-output model
is insensitive to a change of units in the inter-inter-industry and final demand tables (Fisher
1965, Weisz and Duchin in press), the huge differences found in the results from the physical
and mixed unit model as compared to the monetary model are surprising.
As long as only input-output tables in monetary units were available, this assumption hardly had
been put on empirical test. Now, that physical input-output tables have become available - at
least for a few countries - the relation between unit prices, physical output and monetized IO
tables can also be tested empirically. Recently, it has been shown for the German PIOT and
MIOT published by Stahmer and co-authors (1998) that they are related to each other by a price
matrix and not by a vector of prices, and therefore a model based on the physical table will
- 21 -
deliver results different from those obtained with a model based on a monetary table (Weisz and
Duchin in press). We got the same result when dividing each entry of the Danish monetary inter-
industry table by the corresponding entry of the physical input output table. In the sectors
construction and wholesale and retail trade unit prices vary by several thousand Denmark
Kroners (DKK) per kg, in several other manufacturing sector by more than a hundred DKK per
kg. Clearly, the assumption of homogenous prices is not satisfied. It follows that measuring the
quantity of the sectoral output of the primary and the secondary sectors (i.e. all sectors which
produce physical outputs) in tonnes must be regarded as superior to the monetised measurement,
because the assumption of homogenous prices is a necessary condition for measuring the
quantity of sectoral output in monetary units but not for measuring the quantity of sectoral output
in physical units.8 The reverse applies to the service sectors. As services hardly produce any
physical output, mass is certainly an inappropriate unit of measurement. Here money value is a
better choice to measure the quantity of the output than tonnes. Taken together, we therefore
assume that the mixed unit model should provide the most reliable results. Considering the
physical structure of the Danish economy in 1990 (hardly any domestic extraction of fossil fuels
and industrial minerals, imports exceed exports by 30%) the positive raw material trade balance
(indicating a net export of raw materials) obtained by the monetary model is highly implausible.
Some further limitations of the above introduced method must be mentioned. Firstly, the material
factor inputs of a national economy are composed of both raw materials extracted from the
domestic territory and imported commodities in various stages of processing. It is therefore not
quite correct to interpret the calculated direct and indirect material factor input requirements of
exported commodities as “raw material equivalents” of exports. It would be more correct to
denote them as “domestic material input equivalents”.
Second, the use of the same coefficient matrix to compute the raw material equivalents for
exports and imports is not satisfactory and may lead to serious flaws in the results. Essential
- 22 -
methodological improvements can be expected from a world trade models in mixed units (e.g.
Duchin 2005).
Third, in input-output statistics, different methods exist how to allocated imports to the sectors of
the economy (Miller and Blair 1985, Fleissner et al. 1993). The chosen methods, in turn,
determines whether the above proposed method to calculate material factor requirements of
imports is justified or not.
For input-output computations to deliver reliable results, an appropriate level of dis-aggregation
by sectors or commodities is necessary. To our knowledge the resolution of the physical model
we used is the highest ever applied in purely physical input-output models and is also the highest
possible with currently available physical input output tables. Still, the conceptual questions
remains unanswered, which level of resolution would be necessary for this type of analysis.
It is probably too early to draw definite conclusion from these results. However, now that input-
output tables in physical units are gradually used also to construct coefficient matrices and IO
models we can at least expect more explicit empirical information about the relation between
physical quantities of materials used, their unit prices and the money value attributed to the
material flows within and between economies (see Duchin forthcoming). Despite the limited data
base and some open methodological questions we think that mixed unit input-output analysis is
the method of choice to account for raw materials equivalents of imports and exports or more
generally, to account for the implications of trade in economy wide biophysical analysis.
Acknowledgements
I thank Peter Fleissner, Faye Duchin, Marina Fischer-Kowalski, and Fridolin Krausmann for
fruitful discussions on the topics of this paper. I am grateful to Nina Eisenmenger and Helmut
Haberl for their detailed comments on an earlier draft. Support by the Jubiläumsfonds of the
Austrian National Bank, project no 10 430, is greatly acknowledged.
- 23 -
References
Ayres, R. U., Ayres, L. W., and Warr, B. (2004): Is the US economy dematerializing? Main
indicators and drivers. In: van den Bergh, J. C. J. M. and Jannson, A. M. (Eds.):
Economics of Industrial Ecology. Materials, Structural Change, and Spatial Scales.
Cambridge, MA: MIT Press, pp. 57-93
Ayres, R. U. and Kneese, A. V. (1969): Production, Consumption and Externalities. In:
American Economic Review 59(3), pp. 282-297
Barbiero, G., Camponeschi, S., Femia, A., Greca, G., Tudini, A., and Vannozzi, M. (2003):
1980-1998 Material-Input-Based Indicators Time series and 1997 Material Balances of
the Italian Economy. Rome: ISTAT
Behrensmeier, R. and Bringezu, S. (1995): Zur Methodik der volkswirtschaftlichen Material-
Intensitäts-Analyse. Ein quantitativer Vergleich des Umweltverbrauchs der
bundesdeutschen Produktionssektoren. Wuppertal Papers, 34. Wuppertal: Wuppertal
Institut für Klima, Umwelt, Energie
Bringezu, S., Schutz, H., Steger, S., and Baudisch, J. (2004): International comparison of
resource use and its relation to economic growth: The development of total material
requirement, direct material inputs and hidden flows and the structure of TMR. In:
Ecological Economics 51(1-2), pp. 97-124
Bringezu, S., Schütz, H., and Bosch, P. (2001): Total material requirement of the European
Union. Technical Part. Copenhagen: European Evironmental Agency (EEA), 5-61
Bullard, C. and Herendeen, R. A. (1975): The Energy Costs of Goods and Services. In: Energy
Policy 3(4), pp. 268-278
- 24 -
CEC (2002): Environment 2010: Our Future, Our Choice: The sixth Environment Action
Programme of the European Community. Brussels: Official Journal of the European
Communities L 242 of 10.09.2002
Commission of the European Communities (2003): Communication from the Commission to the
Council and the European Parliament. Towards a thematic strategy on the sustainable use
of natural resources. Brussels:
Cumberland, J. (1966): A Regional Interindustry Model for Analysis of Development
Objectives. In: Papers of the Regional Science Association (17), pp. 65-94
Dietzenbacher, E. (2005): Waste treatment in physical input-output analysis. In: Ecological
Economics 55(1), pp. 11-23
Duchin, F. (1998): Structural Economics: Measuring Change in Technology, Lifestyles, and the
Environment. Washington, DC, Covelo, CA: The United Nations University, Island Press
Duchin, Faye (2005): A world trade mosel based on comparative advantage with m regions, n
goods, and k factors. In: Economic Systems Research 17(2), pp. 141-162.
Duchin, F. (forthcoming): Input-Output Economics and Material Flows. In: Suh, S. (ed.):
Handbook on Input-Output Analysis in Industrial Ecology. Springer.
http://www.rpi.edu/dept/economics/www/workingpapers/rpi0424.pdf
Duchin, F., Lange, G.-M., Thonstadt, K., and Idenburg, A. (1994): The Future of the
Environment. Ecological Economics and Technological Change. New York - Oxford:
Oxford University Press
- 25 -
Eurostat (2001a): Economy-wide Material Flow Accounts and Derived Indicators. A
methodological guide. Luxembourg: Eurostat, European Commission, Office for Official
Publications of the European Communities
Eurostat (2001b): Material use indicators for the European Union, 1980-1997. Economy-wide
material flow accounts and balances and derived indicators of resource use. Working
Paper No. 2/2001/B/2. Luxemburg: European Commission/Eurostat, prepared by
Bringezu, S. and Schütz, H.
Eurostat (2001c): NAMEAs for Air Emissions. Results of pilot studies. Luxembourg: Eurostat,
Office for Official Publications of the European Communities
Eurostat (2002): Material use in the European Union 1980-2000. Indicators and Analysis.
Luxembourg: Eurostat, Office for Official Publications of the European Communities,
prepared by Weisz, H., Fischer-Kowalski, Marina, Amann, C., Eisenmenger, N.,
Hubacek, K., and Krausmann, F.
Fisher, F. M. (1965): Choice of Units, Column Sums, and Stability in Linear Dynamic Systems
with Nonnegative Square Matrices. In: Econometrica 33, pp. 445-450.
Fleissner, P., Böhme, W., Brautzsch, H. U., Höhne, J., Siassi, J., and Stark, K. (1993): Input-
Output-Analyse. Eine Einführung in Theorie und Anwendungen. Wien, New York:
Springer Verlag
Gielen, Dolf and Moriguchi, Yuichi (2002): CO2 in the iron and steel industry: an analysis of
Japanese emission reduction potentials. In: Energy Policy 30(10), pp. 849-863.
Griffin, J. (1976): Energy Input-Output Modeling. Palo Alto: Electric Power Research Institute
- 26 -
Hinterberger, F., Moll, S., and Femia, A. (1998): Arbeitsproduktivität, Ressourcenproduktivität
und Ressourcenintensität der Arbeit. Gelsenkirchen: Institut für Arbeit und Technik, 1-39
Hoekstra, R. (2003): Structural Change of the Physical Economy. Decomposition Analysis of
Physical and Hybrid-Unit Input-Output Tables. Research SeriesAmsterdam: Tinbergen
Institute
Hoekstra, R. (2005): Economic Growth, Material Flows and the Environment. New Applications
of Structural Decomposition Analysis and Physical Input-Output Tables. Advances in
Ecological EconomicsCheltenham, UK, Northampton, MA, USA: Edward Elgar
Hoekstra, R. and Janssen, A. M. (2002): Environmental Responsibility and Policy in a Two
Country Dynamic Input-Output Model. Tinbergen Institute
Konijn, P. J. A., de Boer, S., and van Dalen, J. (1997): Input-Output analysis of Material flows
with applications to iron, steel and zinc. In: Structural Change and Economic Dynamics
8, pp. 129-153
Lave, L., Cobas-Flores, E., Hendrickson, C., and McMichael, F. (1995): Using input-output
analysis to estimate economy-wide discharges. In: Environmental Science & Technology
A 29(9), pp. 420 A-426 A
Leontief, W. (1936): Quantitative input-output relations in the economic system. In: Review of
Economics and Statistics 18, pp. 105-125
Leontief, W. (1941): The Structure of American Economy. New York: Oxford University Press
Leontief, W. (1970): Environmental Repercussions and the Economic Structure. An Input-
Output-Approach. In: Review of Economics and Statistics 52(3), pp. 262-271
- 27 -
Machado, G., Schaeffer, R., and Worrel, E. (2001): Energy and Carbon embodied in the
international trade of Brazil: an input - output approach. In: Ecological Economics 39(3),
pp. 409-424
Martinez-Alier, J. (forthcoming): Marxism, Social Metabolism, and Ecologically Unequal
Exchange. In: Hornborg, A. and others (Eds.): Environmental History: World System
History and Global Environmental Change. Lanham: Alta Mira Press
Matthews, E., Amann, C., Fischer-Kowalski, M., Bringezu, S., Hüttler, W., Kleijn, R.,
Moriguchi, Y., Ottke, C., Rodenburg, E., Rogich, D., Schandl, H., Schütz, H., van der
Voet, E., and Weisz, H. (2000): The Weight of Nations: Material Outflows from
Industrial Economies. Washington, D.C.: World Resources Institute
Miller, R. E. and Blair, P. D. (1985): Input-Output Analysis: Foundations and Extensions. New
Jersey: Prentice Hall Inc.
Pedersen, O. G. (1999): Physical Input-Output Tables for Denmark. Products and Materials
1990. Air Emissions 1990-92. Kopenhagen: Statistics Denmark
Pedersen, O. G. (2002): DMI and TMR for Denmark 1981, 1990, 1997. An assessment of the
Material Requirements of the Danish Economy. Statistics Denmark
Peters, G. P. and Hertwich, E. G. (in press): A comment on "Functions, commodities and
environmental impacts in an ecological-economic model". In: Ecological Economics In
Press, Corrected Proof
Proops, J. L. R. (1977): Input-output analysis and energy intensities: a comparison of some
methodologies. In: Applied Mathematical Modelling 1(March), pp. 181-186
- 28 -
Schmidt-Bleek, F. (1993): MIPS Revisited. In: Fresenius Environmental Bulletin 2(8), pp. 407-
412
Stahmer, C., Kuhn, M., and Braun, N. (1998): Physical Input-Output Tables for Germany, 1990.
Suh, S. (2004a): A note on the calculus for physical input–output analysis and its application to
land appropriation of international trade activities. In: Ecological Economics 48(1), pp. 9-
17
Suh, S. (2004b): Functions, commodities and environmental impacts in an ecological–economic
model. In: Ecological Economics 48(4), pp. 451-467
Suh, S. (forthcoming.): Handbook on Input-Output Analysis in Industrial Ecology. Springer.
Weisz, H. and Duchin, F. (in press): Physical and monetary input-output analysis: What makes
the difference. Ecological Economics.
Weisz, H., Krausmann, F., Eisenmenger, N., Amann, C., and Hubacek, K. (2005): Development
of Material Use in the EU-15: 1970-2001: Material composition, cross-country
comparisons and material flow indicators. Luxembourg: Eurostat, Office for Official
Publications of the European Communities.
1 The 6th environmental action programme of the European Commission specified the sustainable use of resources as
one priority field for the period 2002 to 2012 (CEC 2002). A communication towards a thematic strategy on
sustainable use of resources was published by the European Commission in 2003 (Commission of the European
Communities 2003) and the thematic strategy is currently in its final stage of preparation. The G-8 industrial nations
recommendation in 2004 to create an OECD wide material flows and resource productivity work plan created a
decisive momentum towards international commitment. Regarding the use of economy-wide material flow
accounting for target setting targets the Japanese government is a forerunner. In its recent official sustainability
- 29 -
program “Towards Establishing a Sound Material Cycle Society”, MFA derived indicator are used to specify
political targets.
2 The potential of economy wide material flow accounts was first recognized by Eurostat and the WRI. Both
organizations took the lead towards establishing internationally harmonized accounts in the later 1990s (Matthews et
al. 2000, Eurostat 2001a). Recently the OECD and Eurostat joined forces to further promote internationally
harmonized material flow accounts.
3 TMR includes domestic extraction (see footnote 4), imports , and the indirect flows that are associated to imports
but take place in other countries (Eurostat 2001a)
4 Domestic extraction (DE) is the sum of all solid, liquid and gaseous materials (excluding water and air but
including the water and air content of materials) that are extracted from the national territory and enter the economy
for further use (Eurostat 2001a).
5 For these reasons LCA is now increasingly combined with input-output analysis when applied to the whole
economy (Lave et al. 1995; Suh 2004b; Peters and Hertwich in press).
6 DMI is defined as domestic extraction plus imports (Eurostat 2001a).
7 Eurostat currently discusses the feasibility of providing integrated NAMEAs on a routine basis.
8 It is obvious that only if there is one unique sectoral price the money value of the output will proportional to the
quantity of the output. Contrary to this tons are a direct measurement of quantity, assumptions regarding prices are
not necessary.