ss4-3_ajmal.pdf
TRANSCRIPT

8/9/2019 ss4-3_ajmal.pdf
http://slidepdf.com/reader/full/ss4-3ajmalpdf 1/37
Nonlinear Static Pushover Analysis
of a Shear Wall Building in
Madinah
M. Ajmal¥ ,M.K. Rahman¥ and M.H. Baluch¥
¥ King Fahd University of Petroleum & Minerals Dhahran Saudi Arabia

8/9/2019 ss4-3_ajmal.pdf
http://slidepdf.com/reader/full/ss4-3ajmalpdf 2/37
Recent Seismic Activities in KSA
• Recently seismic events that occurred in low to
moderate seismicity
regions
of
Saudi
Arabia
are:
• Otaibah, Makkah (2005)
• Haradh, Eastern
Province
(2006)
• Al‐Hadama, Al‐Amid, Al‐Qarasa and Yanbu (2009)
• Eastern Province (August, 2010)

8/9/2019 ss4-3_ajmal.pdf
http://slidepdf.com/reader/full/ss4-3ajmalpdf 3/37
Why Research is Needed?
1. Some large cities in the Eastern and Western Part of Saudi
Arabia are located close to fault zones. As
the
population
increases
and
new
areas
are
developed,
the
seismic
risk
to
human life and infrastructure increases.
2. Most old structures aredesigned without considering
seismic effect. i.e.
designed
for
gravity
loads.
3. Recent seismic activity in Saudi Arabia have led to concern
about the safety of the existing reinforced concrete
buildings.
4. This research is planned as a joint collaboration between
King Fahd university of Petroleum and Minerals (KFUPM),
Saudi
Arabia
and
Istanbul
Technical
University
(ITU),
Turkey.
8/9/2019 ss4-3_ajmal.pdf
http://slidepdf.com/reader/full/ss4-3ajmalpdf 4/37
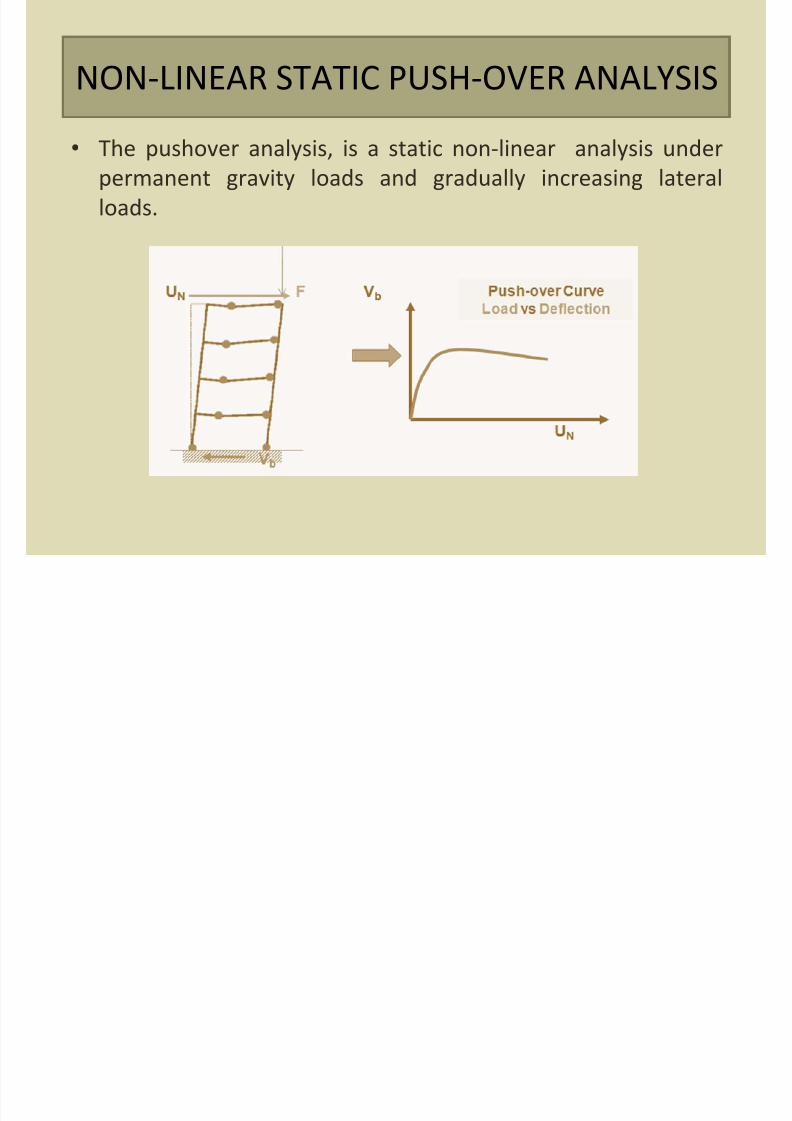
NON‐LINEAR STATIC PUSH‐OVER ANALYSIS
• The pushover analysis, is a static non‐linear analysis under
permanent gravity loads and gradually increasing lateral
loads.

8/9/2019 ss4-3_ajmal.pdf
http://slidepdf.com/reader/full/ss4-3ajmalpdf 5/37
APPLICATION OF PUSHOVER ANALYSIS
• Pushover analysis may be applied to verify the structural
performance
of
newly
designed
and
the
existing
buildings
for
the following purposes:
1. To verify the over strength ratio values.
2. To
estimate
the
expected
plastic
mechanism
and
the
distribution of damage.
3. To assess the structural performance of existing or retrofitted
buildings.4. As an alternative to the design based on linear analysis.
8/9/2019 ss4-3_ajmal.pdf
http://slidepdf.com/reader/full/ss4-3ajmalpdf 6/37
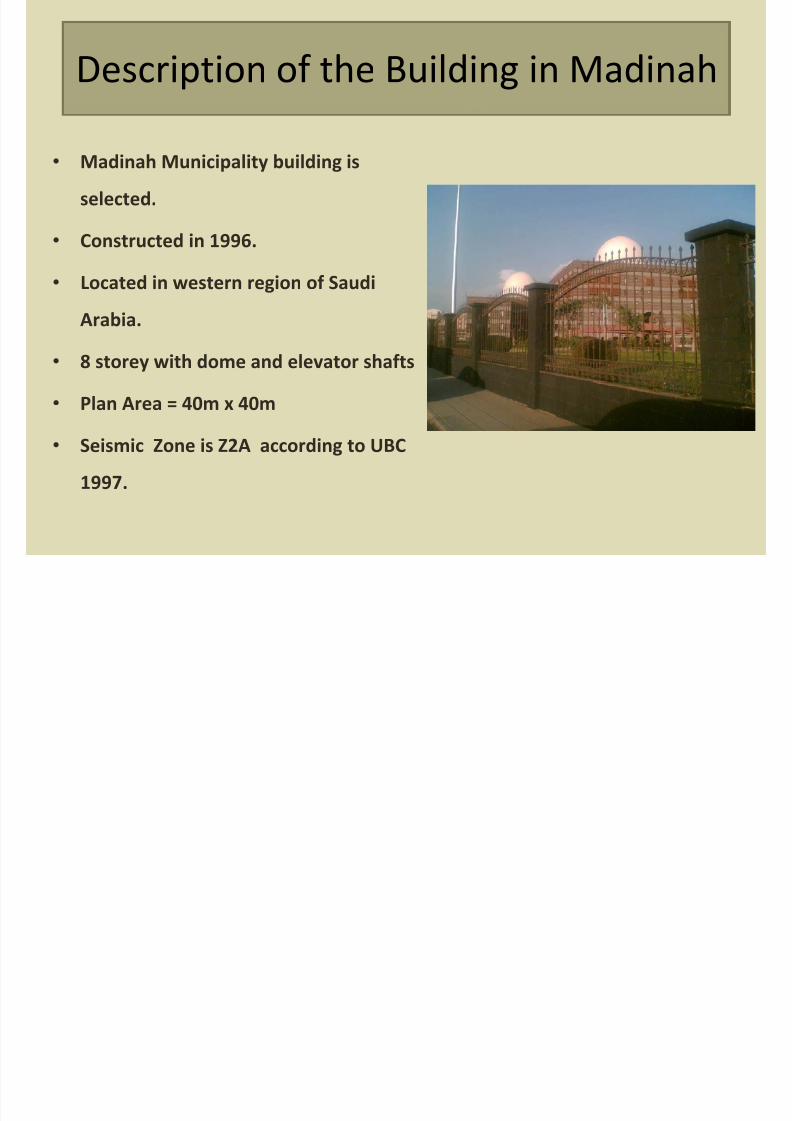
Description of the Building in Madinah
• Madinah Municipality building is
selected.
• Constructed in 1996.
• Located in western region of Saudi
Arabia.
• 8 storey with dome and elevator shafts
• Plan Area = 40m x 40m
• Seismic Zone is Z2A according to UBC
1997.

8/9/2019 ss4-3_ajmal.pdf
http://slidepdf.com/reader/full/ss4-3ajmalpdf 7/37
TYPICAL PLAN – MADINAH
MUNICIPALITY BUILDING
TYPICAL PLAN FROM 1ST TO 6TH STOREY
7TH
STOREY
PLAN
8TH STOREY PLAN
Shear Wall

8/9/2019 ss4-3_ajmal.pdf
http://slidepdf.com/reader/full/ss4-3ajmalpdf 8/37
SELECTED 2‐D FRAME FOR NONLINEAR
PUSHOVER ANALYSIS

8/9/2019 ss4-3_ajmal.pdf
http://slidepdf.com/reader/full/ss4-3ajmalpdf 9/37
ELEVATION OF SELECTED FRAME
300 mm Thick
Shear wall
300 mm Thick
Shear wall 200 mm Thick
Shear wall
200 mm Thick
Shear wall
8/9/2019 ss4-3_ajmal.pdf
http://slidepdf.com/reader/full/ss4-3ajmalpdf 10/37
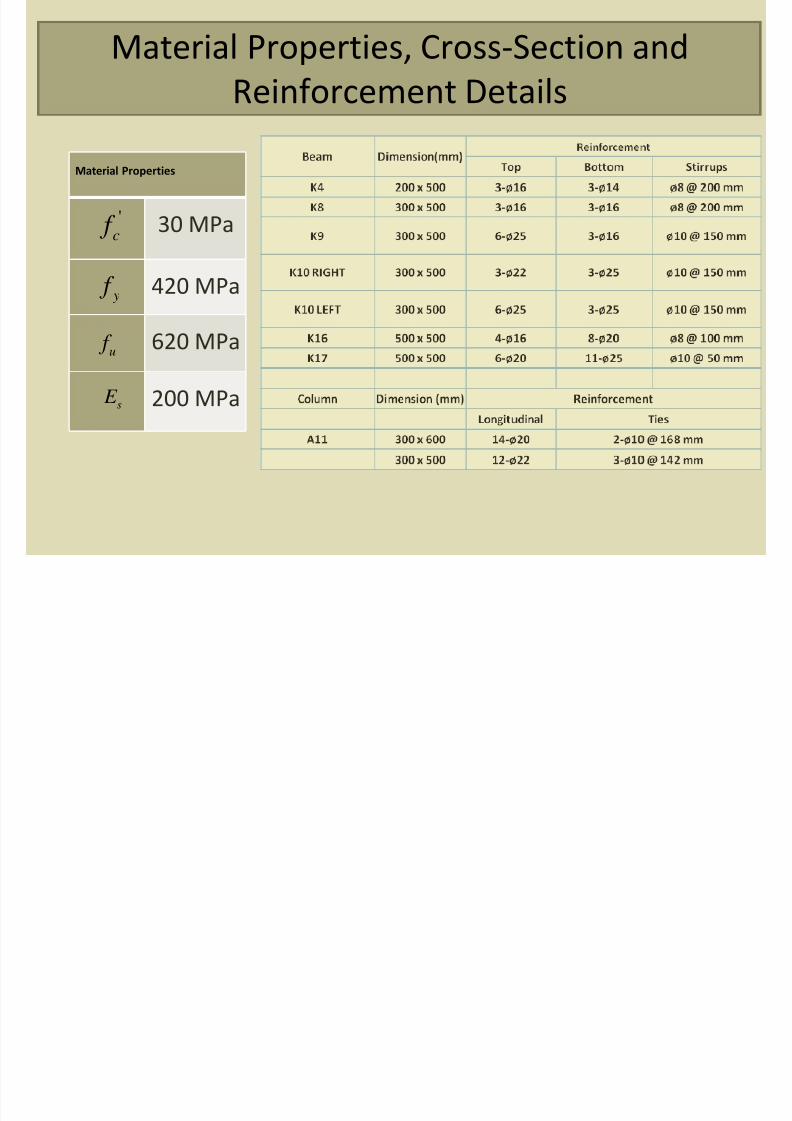
Material Properties, Cross‐Section and
Reinforcement Details
Material Properties
30 MPa
420
MPa
620 MPa
200 MPa
'
c f
y f
u f
s E

8/9/2019 ss4-3_ajmal.pdf
http://slidepdf.com/reader/full/ss4-3ajmalpdf 11/37
SHEAR WALL MODELING IN PUSHOVER
ANALYSIS
• Mid‐pier model
In mid pier model the is generally based on plastic hinge
concept and
bilinear
moment
relationship.
The response of this model is governed by the proper
selection of stiffness of rigid beam because assumption of
infinite rigidity
can
lead
to
over
estimation
of
bending
moment.
• Multilayer shell element model
The shell
element
can
be
used
efficiently
for
the
analysis
of building structures with shear walls.
The multilayer shell element gives a realistic prediction of
stresses and
formation
of
hinges
in
shear
wall.

8/9/2019 ss4-3_ajmal.pdf
http://slidepdf.com/reader/full/ss4-3ajmalpdf 12/37
Smeared Multilayered Shell Element Shell element Model For Shear Wall
Mid Pier Model for Shear wall

8/9/2019 ss4-3_ajmal.pdf
http://slidepdf.com/reader/full/ss4-3ajmalpdf 13/37
SHEAR WALL MODEL
Multi‐layered Shell Element ModelMulti‐layered Shell Element Model Mid Pier ModelMid Pier Model

8/9/2019 ss4-3_ajmal.pdf
http://slidepdf.com/reader/full/ss4-3ajmalpdf 14/37
LOADS
• For intermediate storeys
• Dead loads
• Self weight
of
Slab=4.75
kN/m2
• Floor finish=2.3 kN/m2
• Super imposed load =1 kN/m2
• Live load = 4.8 kN/m2
• For roof storeys
• Dead loads
•
Self
weight
of
slab=4.75
kN/m2
• Floor finish=3.5 kN/m2
• Super imposed load =1 kN/m2
• Live load = 2.4 kN/m2

8/9/2019 ss4-3_ajmal.pdf
http://slidepdf.com/reader/full/ss4-3ajmalpdf 15/37
SEISMIC WEIGHT OF THE BUILDING
• The Seismic weight of the whole building is the sum
of the seismic weights of all the floors.
Floor height from ground level
(m)
Seismic weight Wi
(kN)
27.6 1900
22.6 865
20.2 2780
16 3408
12.8 3320
9.6 3032
6.4 3032
3.2 3030
∑Wi= 21371

8/9/2019 ss4-3_ajmal.pdf
http://slidepdf.com/reader/full/ss4-3ajmalpdf 16/37
MODAL ANALYSIS
• From the modal analysis time period and frequency
for different modes are shown below.
Modal Properties Mode
1 2 3 4 5
Period (sec) 0.602 0.266 0.171 0.133 0.128
Frequency (rad/sec) 1.731 3.756 5.863 7.472 7.812

8/9/2019 ss4-3_ajmal.pdf
http://slidepdf.com/reader/full/ss4-3ajmalpdf 17/37
PARABOLIC LATERAL LOAD FEMA‐356
• The lateral force
at any story (Fi ) is
calculated by
2
i ii t N
2 j j
j=1
W HF =V
W H∑

8/9/2019 ss4-3_ajmal.pdf
http://slidepdf.com/reader/full/ss4-3ajmalpdf 18/37
SECTIONAL ANALYSIS USING XTRACT
• ASSUMPTIONS• Mander confined and unconfined concrete model.
• Elasto‐plastic
steel
model
without
hardening
were
used.
• Software used for Sectional Analysis is XTRACT.
Mander Unconfined, Confined
Concrete Model Elasto
‐plastic
steel
model

8/9/2019 ss4-3_ajmal.pdf
http://slidepdf.com/reader/full/ss4-3ajmalpdf 19/37
PM‐Interaction Diagram For Column A11
PM‐INTERACTION CURVE OBTAINED FROM XTRACT
8/9/2019 ss4-3_ajmal.pdf
http://slidepdf.com/reader/full/ss4-3ajmalpdf 20/37
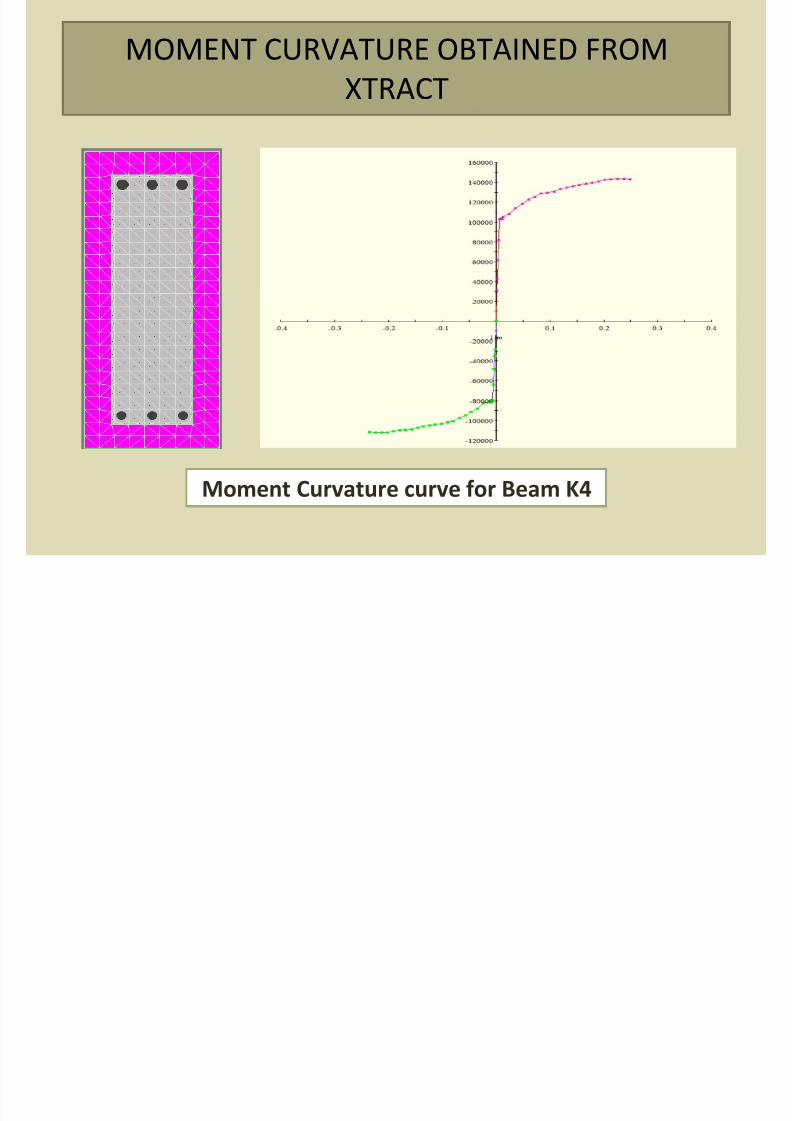
Moment Curvature
curve
for
Beam
K4
MOMENT CURVATURE OBTAINED FROM
XTRACT

8/9/2019 ss4-3_ajmal.pdf
http://slidepdf.com/reader/full/ss4-3ajmalpdf 21/37
PUSHOVER ANALYSIS RESULTS
Pushover curve for 2‐D Frame Analyzed

8/9/2019 ss4-3_ajmal.pdf
http://slidepdf.com/reader/full/ss4-3ajmalpdf 22/37
STOREY DRIFTS RATIOSTOREY DRIFTS RATIO

8/9/2019 ss4-3_ajmal.pdf
http://slidepdf.com/reader/full/ss4-3ajmalpdf 23/37
Plastic Hinge Distribution
PLASTIC HINGES DISTRIBUTION WHEN PUSHED IN POSITIVE X‐DIRECTION
AT 6 cm DISPLACEMENT
Shell Model Pier Model

8/9/2019 ss4-3_ajmal.pdf
http://slidepdf.com/reader/full/ss4-3ajmalpdf 24/37
Plastic Hinge Distribution
PLASTIC HINGES DISTRIBUTION WHEN PUSHED IN POSITIVE X‐DIRECTION
AT 9 cm DISPLACEMENT
Shell Model Pier Model

8/9/2019 ss4-3_ajmal.pdf
http://slidepdf.com/reader/full/ss4-3ajmalpdf 25/37
Plastic Hinge Distribution
PLASTIC HINGES DISTRIBUTION WHEN PUSHED IN POSITIVE X‐DIRECTION
AT 15 cm DISPLACEMENT
Shell Model Pier Model
8/9/2019 ss4-3_ajmal.pdf
http://slidepdf.com/reader/full/ss4-3ajmalpdf 26/37
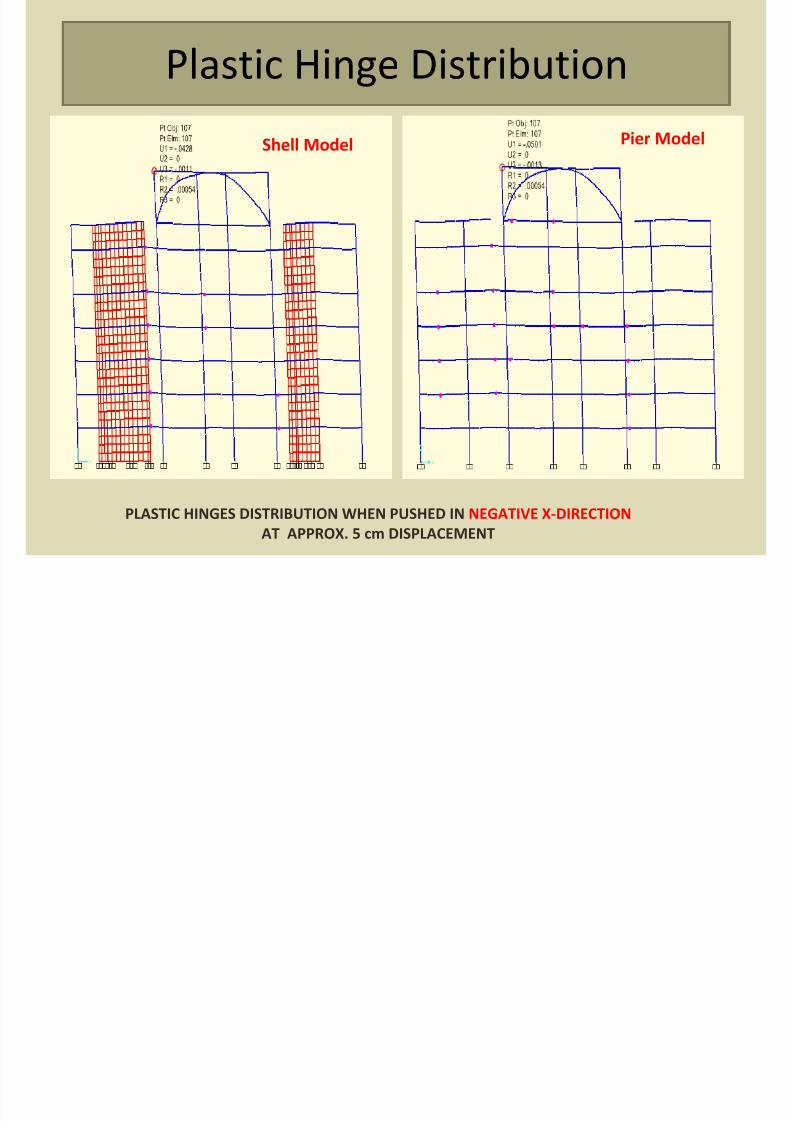
Plastic Hinge Distribution
PLASTIC HINGES DISTRIBUTION WHEN PUSHED IN NEGATIVE X‐DIRECTION
AT APPROX. 5 cm DISPLACEMENT
Shell Model Pier Model

8/9/2019 ss4-3_ajmal.pdf
http://slidepdf.com/reader/full/ss4-3ajmalpdf 27/37
Plastic Hinge Distribution
PLASTIC HINGES DISTRIBUTION WHEN PUSHED IN NEGATIVE X‐DIRECTION
AT APPROX. 7 cm DISPLACEMENT
Shell Model Pier Model

8/9/2019 ss4-3_ajmal.pdf
http://slidepdf.com/reader/full/ss4-3ajmalpdf 28/37
Plastic Hinge Distribution
PLASTIC HINGES DISTRIBUTION WHEN PUSHED IN NEGATIVE X‐DIRECTION
AT APPROX. 14 cm DISPLACEMENT
Shell Model Pier Model

8/9/2019 ss4-3_ajmal.pdf
http://slidepdf.com/reader/full/ss4-3ajmalpdf 29/37
CONCRETE STRESSES IN SHEAR WALL
CONCRETE STRESS WHEN PUSHED IN POSITIVE X‐DIRECTION
Crushing of concrete
as maximum stress
in concrete reaches
ultimate stresses

8/9/2019 ss4-3_ajmal.pdf
http://slidepdf.com/reader/full/ss4-3ajmalpdf 30/37
CONCRETE STRESSES IN SHEAR WALL
CONCRETE STRESS WHEN PUSHED IN NEGATIVE X‐DIRECTION
Crushing of concrete
as maximum stress
in concrete reaches
ultimate stresses
8/9/2019 ss4-3_ajmal.pdf
http://slidepdf.com/reader/full/ss4-3ajmalpdf 31/37
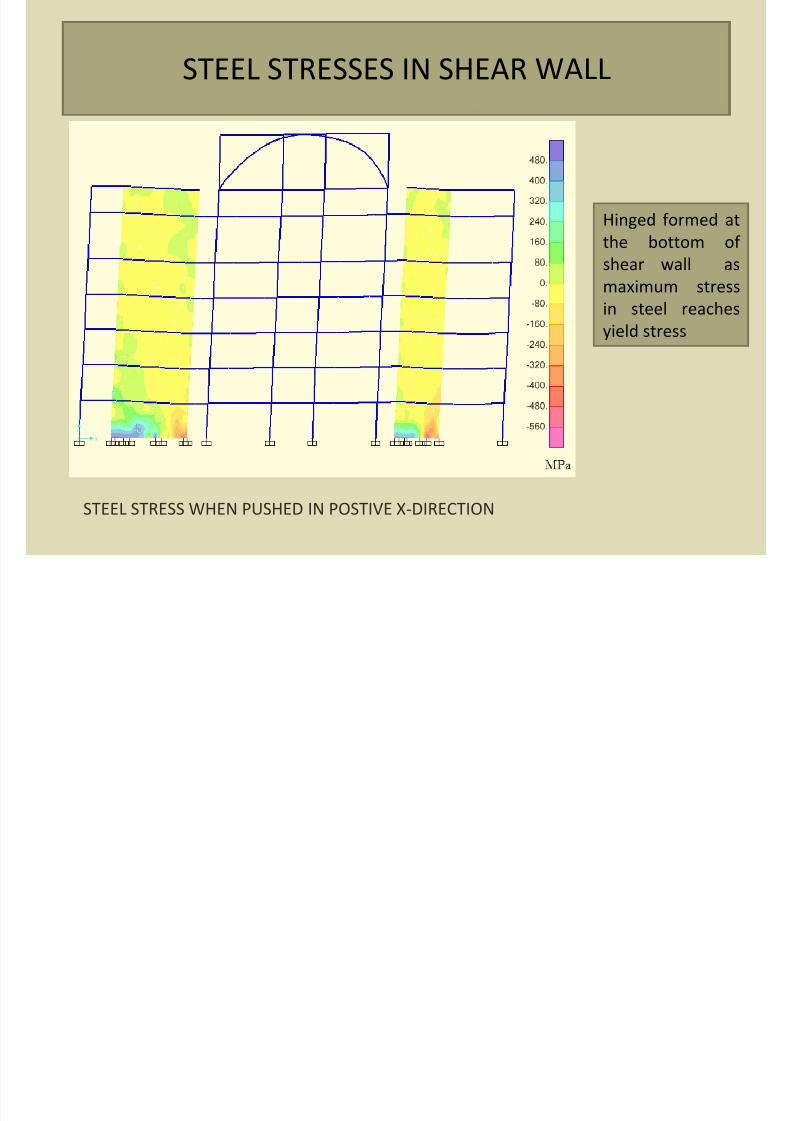
STEEL STRESSES IN SHEAR WALL
STEEL STRESS WHEN PUSHED IN POSTIVE X‐DIRECTION
Hinged formed at
the bottom of
shear wall as
maximum stress
in
steel
reaches
yield stress

8/9/2019 ss4-3_ajmal.pdf
http://slidepdf.com/reader/full/ss4-3ajmalpdf 32/37
STEEL STRESSES IN SHEAR WALL
STEEL STRESS WHEN PUSHED IN NEGATIVE X‐DIRECTION
Hinged formed at
the bottom of
shear wall as
maximum stress
in
steel
reaches
yield stress
PERFORMANCE ASSESSMENT USING

8/9/2019 ss4-3_ajmal.pdf
http://slidepdf.com/reader/full/ss4-3ajmalpdf 33/37
PERFORMANCE ASSESSMENT USING
ATC‐40
PERFORMANCE POINT
BASE SHEAR 7349 KN
DISPLACEMENT 0.07 m
8/9/2019 ss4-3_ajmal.pdf
http://slidepdf.com/reader/full/ss4-3ajmalpdf 34/37
CONCLUSIONS
• The hinge
status
of
Shell
Element
and
Mid
Pier
method
at maximum displacement provide almost the same
pattern.
•
Mid
Pier
method
overestimate
base
shear
because
of
rigid beam rigidity, so appropriate rigidity must be
selected.

8/9/2019 ss4-3_ajmal.pdf
http://slidepdf.com/reader/full/ss4-3ajmalpdf 35/37
ONGOING RESEARCH
•
Time
history
analysis
of
selected
2D
frames
of
the building is in progress.
• Research will be carried out on 3‐D model of
Madinah Municipality Building
by
the
application
of
Pushover and time history analysis.
• Pushover analysis will be subsequently carried out
for building
retrofitted
with
CFRP.
REFERENCES

8/9/2019 ss4-3_ajmal.pdf
http://slidepdf.com/reader/full/ss4-3ajmalpdf 36/37
REFERENCES
1. Ahmet E.T.,Code‐based evaluation of seismic performance levels of reinforced
concrete buildings with linear and non‐linear approaches,MSc,ITU,2008
2. Bahadır A., Comparison of linear and nonlinear methods for seismic evaluation of existing reinforced concrete buildings in the Turkish earthquake code 2007,MSc
Thesis, Bogaziçi University,2007
3. FEMA, NEHRP Improvement of nonlinear static seismic analysis procedures
(FEMA‐ 440). Department of Homeland Security, Federal Emergency Management Agency: Redwood City, CA. 2005.
4. Menjivar, M.A.L. A Review of Existing Pushover Methods for 2D ReinforcedConcrete Building, PhD Thesis, Rose School Italy. 2004
5. Ghobarah, A. Review Article; Performance based design in earthquake
engineering: state of development. J. of Engineering Structures. 2001. 23: 878‐884.
6. [16]. ATC Evaluation and improvement of inelastic seismic analysis procedures
(ATC‐55). Applied Technology Council: Redwood City, CA. 2001.
7. FEMA,
NEHRP
Prestandard and
Commentary
for
the
Seismic
Rehabilitation
of Buildings (FEMA‐356 ). American Society of Civil Engineers (ASCE): Reston, VA.
2000.
8. [17]. Fajfar, P. A nonlinear analysis method for performance based seismic design, J. of Earthquake Spectra 2000. 16: 573‐592
9. ATC
Seismic
evaluation
and
retrofit
of
concrete
buildings‐
Volume1
(ATC‐40).
Applied Technology Council: Redwood City, CA. 1997.
ACKNOWLEDGEMENT

8/9/2019 ss4-3_ajmal.pdf
http://slidepdf.com/reader/full/ss4-3ajmalpdf 37/37
ACKNOWLEDGEMENT
• The study is being funded by King Fahd
University of Petroleum & Minerals under
project number IN101028 which is gratefully
acknowledged.
• The
authors
acknowledge
the
mentoring
provided by ITU to the KFUPM graduate
students involved
in
this
project.