states of amino acid residues in proteins: ii. bound tyrosine residues of chymotrypsinogen,...
TRANSCRIPT
BIOCHIMICA ET BIOPHYSICA ACTA 323
BBA 12317
S T A T E S OF A M I N O ACID R E S I D U E S I N P R O T E I N S
II . BOUND TYR OS INE RESIDUES OF CHYMOTRYPSINOGEN, CHYMOTRYPSIN AND TR YP S IN RELATED TO T H E I R
PROTEOLYTIC ACTIVITIES
YUJI INADA, MASAKO KAMATA, AYAKO MATSUSHIMA AND KAZUO SHIBATA
The Tokugawa Institute for Biological Research, Tokyo', and Tokyo Institute of Technology, Tokyo (Japan)
(Received June I8th, 1963)
SUMMARY
The ionizations of tyrosine residues of chymotrypsinogen, a-chymotrypsin (EC 3.4.4.5) and trypsin (EC 3.4.4.4) were measured spectrophotometrically as a function of pH, immediately after, and several hours after, addition of alkali to protein solutions, and the ionization characteristics of various states of their tyrosine residues were estimated from the results. The four residues of both chymotrypsinogen and a-chymotrypsin were classified into two rapidly ionizing, one slowly ionizing and one non-ionizable residues. However, considerable differences were found in the degree of binding or the p K value between their residues. Ten tyrosine residues in the trypsin molecule were grouped into four slowly ionizing residues with pK ---- lO.8 and m (the number of hy- droxyl ions involved in the ionization) = 2.0, and six rapidly ionizing residues with pK = 1o.o and m ~ I.O. The pH-ac t iv i ty curve for trypsin indicated the deactivation by alkali with the same values of p K and m as for the ionization of the four bound residues. The effect of temperature on the activity curve, and the time course of the activity drop during the incubation with alkali, indicated a close correlation between the ionization of the bound tyrosine residues and the deactivation. The correlation similarly examined for a-chymotrypsin was less satisfactory. A model for the active center of trypsin is proposed to account for both the close correlation found in the present s tudy and the concerted action of serine and histidine residues previously establishcd.
INTRODUCTION
The ultraviolet absorption band of tyrosine at 275 m/~ is transformed with intensifica- tion into a band at 293 mju when the phenol group ionizes with alkali. Since the earliest application by CRAMMER AND NEUBERGER 1, the spectrophotometric t i tration based on this phenomenon has been used for the s tudy of tyrosine residues of proteins, and a number of results were reported by many authors as to the states of the tyrosine residues. By observing the difference spectrum between neutral and alkaline solutions of proteins, or more simply by measuring the difference in absorbance at 295 m#, one can determine the moles of ionized tyrosine residues without interference from the
* Mailing address.
Biochim. Biophys. Acta, 81 (1964) 323-335
3 2 4 Y. INADA, M. KAMATA, A. MATSUSHIMA, K. SHIBATA
overlapping of bands of other aromatic amino acid residues. One of the authors applied this method to insulin, lysozyme (EC 3.2.1.17) and catalase (EC 1.11.1.6) with special attention to the rates of ionization of various states of tyrosine residues, and the results were reported in a previous paper 2, which includes literature on the same lines of investigation by other workers. From the rates of ionization, the tyrosine residues of these proteins could be differentiated into two types. For example, three of the four tyrosine residues in the insulin molecule ionized instantaneously upon addition of alkali, whereas the remaining residue ionized slowly. The pK of this bound residue was 11.4, being higher than IO.O-IO.I (see refs. 2-4), the value for tyrosine, or lO. 4 for the three rapidly ionizing residues of insulin. One of the three tyrosine residues in the lysozyme molecule was found to be more strongly bound than is the slowly ionizing residue of insulin; it ionized more slowly with a pK of 12.8.
These differences are remarkable and bear evidence that the slowly ionizing residues with higher pK values are either hydrogen-bonded or embedded in the interior of protein molecules. It was thought to be of interest to characterize the tyrosine resi- dues of various proteolytic enzymes and their precursors in terms of these ionization characteristics and to see how the conformation change and/or the release of peptides brought about in the activation of precursors affect the states of their tyrosine residues. The present paper deals with the results obtained in this view for chymotrypsinogen, a-chymotrypsin (EC 3.4.4.5) and trypsin (EC 3.4.4.4), and the ionization curves of various types of their tyrosine residues were compared with the pH-act ivi ty curves of a-chymotrypsin and trypsin measured in parallel with the spectroscopic observations.
The tyrosine residues of these enzymes and their precursors have already been studied by several investigators. WILCOX 5 noticed that approximately two of the four tyrosine residues in the chymotrypsinogen molecule ionize in a normal manner, while two others ionize only after exposure to denaturing conditions. CHERVENKA 6,7 studied the ionization of the tyrosine residues of both chymotrypsinogen and chymotrypsin as well as the spectral changes during the activation and urea denaturation of chymo- trypsinogen. His data indicated an instantaneous ionization of two moles of tyrosine residues of these proteins and, in strong alkali (o.I M NaOH), this instantaneous ionization was followed by slow ionization of the remaining two residues. The rate of the spectral change due to this slow ionization was higher for chymotrypsin as compared with that observed for chymotrypsinogen. The later and more precise measurements by HAVSTEEN AND HESS 8 confirmed the presence of two bound tyrosine residues in the a-chymotrypsin and diisopropylphosphoryl-a-chymotrypsin molecules. Because of these successful results in distinguishing between the rapidly and slowly ionizing types, the present experiments on chymotrypsinogen and a-chymotrypsin were directed to further differentiation of each type. The tyrosine residues of trypsinogen were scrutinized by SMILLIE A N D KAY 9, as introduced later. The results obtained in the present study for trypsin were compared with their data on trypsinogen to see the changes brought about by the activation. Throughout this paper, the number of a certain type of tyrosine residues in a protein molecule is expressed by n, and the number of hydroxyl ions involved in the ionization by m.
EXPERIMENTAL
Crystalline chymotrypsinogen was prepared from bovine pancreas by the method of
Biochim. Biophys. Ac/a, 81 (1964) 323-335
BOUND TYROSINE RESIDUES IN PROTEINASES 325
KUNITZ AND NORTHROP TM, and recrystallized three times. Chymotrypsinogen was act ivated with trypsin at 5 ° for 48 h, and a-chymotrypsin formed by this slow activa- tion was crystallized with ammonium sulfate. Trypsin crystals were prepared according to the method of KUNITZ AND NORTHROP 11 from bovine pancreas.
Ionization curves were measured spectrophotometrically in the following manner. A mixture (2 ml) of I M KOH and i M KC1 solution was added to 8 ml of an aqueous solution of protein (pH 6-8). The volume ratio between these KOH and KC1 solutions was varied so as to obtain an alkaline protein solution of a desired pH and I = 0.2. In a few experiments with chymotrypsinogen above pH 13.2, the ionic strength was raised to 0.4 by addition of a more concentrated KOH solution. The difference, AE, in absorbance at 295 m# between the alkaline solution and the same protein solution with 0.2 M phosphate buffer (pH 7.0) was measured at 18 i I ° with a Cary recording spectrophotometer 14 M, using cells of I.O cm optical path length. The AE value was read at two different times; immediately after preparation of the alkaline protein solu- tion, and after a constant reading ofA E was obtained during incubation of the solution at 18 4- 1% I t usually took 1.5-5.o h to obtain the constant reading or to equilibrate the ionization of tyrosine residues, the time being dependent on the sample protein and on the pH and temperature of the solution. The AE values thus measured were reduced to the molar concentrations of ionized tyrosine residues with aid ofAe = 2305 (see ref. 2), the difference in molar extinction coefficient (e) at 295 m# between ionized and non-ionized forms of tyrosine. Molar concentrations of proteins were determined spectrophotometrically assuming the following values of e: 5.0" lO 4 at 282 m# for chymotrypsinogen and chymotrypsin which was calculated from their approximate molecular weight of 25 ooo (see refs. 12, 13) and the absorbance value of 20.0 (see ref. 14) for I °/o chymotrypsinogen solution, and 3.58" lO 4 at 280 m/~ for trypsin which was calculated from the molecular weight of 24 ooo (see ref. 14) and the absorbanee value of 14. 9 (see ref. 14) for 1% trypsin solution.
The proteolytic activity of a-chymotrypsin was measured as a function of pH by the method of KUNITZ 15 with casein as the substrate. The digestion was made at 29.5 ° for IO min. The degree of digestion was estimated from the absorbance value at 280 m# of the trichloroacetic acid soluble fraction of the digest. The pH-ac t iv i ty curve of trypsin was measured similarly but at two different experimental conditions: at IO ° for 16 min and at 3 °0 for IO rain to observe the effect of temperature on the activity curve.
RESULTS
C hymotrypsinogen and a-chymotrypsin
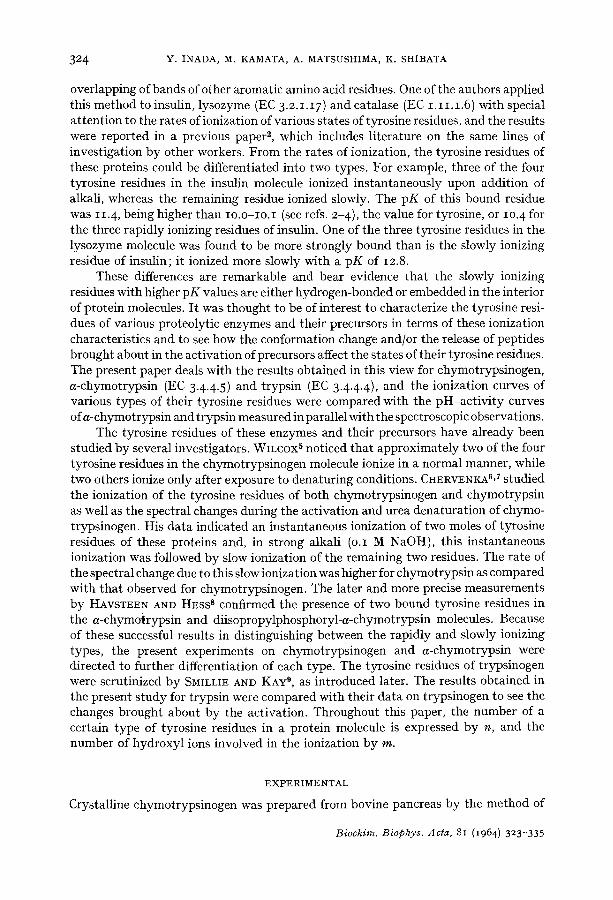
Curve B in Fig. i is the difference spectrum of ionization observed between chymotrypsinogen solutions of pH 13.2 and 7.0. The curve shows a positive peak at 296 m#, the position being in approximate agreement with 295 m/z, the maximum wavelength obtained for tyrosine (Curve A). When the pH of the alkaline solution was raised above I3.2, the peak shifted to 300 m# with a slight intensification, and a shoulder appeared at 290 m/~. This anomalous change has already been observed by CHERVENKA 7 and was at tr ibuted to a change in state of t ryptophan residues. The difference spectrum (Curve C) obtained for a-chymotrypsin showed a single peak at 296 m# below pH 12.2 and, here also, the peak was split into two above this pH value. However, the effect
Biochim. Biophys. Acta, 81 (1964) 323-335
326 Y. INADA, M. KAMATA, A. MATSUSHIMA, K. SHIBATA
+°.'1- I x ,,f,/' 77t L +°. Ikt ,// ,
I t 7--11 .
- 0 2 t I i i 260 280 300 320
Wavelength (mg)
Fig. I. Difference spectra between neutral and alkaline solutions of 2.oo. lO -4 M tyrosine (Curve A, p H 12.o), 1.o2. lO -4 M chymotryps inogen (Curve B, p H I3.2 ), 1.28. lO -4 M a-chymot ryps in (Curve C, p H 12.2) and 2.77,IO-~ M t rypsin (Curve D, p H 12.5). The pH values given above
within parentheses are those of the alkaline solutions.
of these anomalous changes on the AE values at 295 m/~ was found to be small. In fact the moles of the ionizable tyrosine residues per mole of protein estimated at extremely alkaline pH were close to whole number, as demonstrated below.
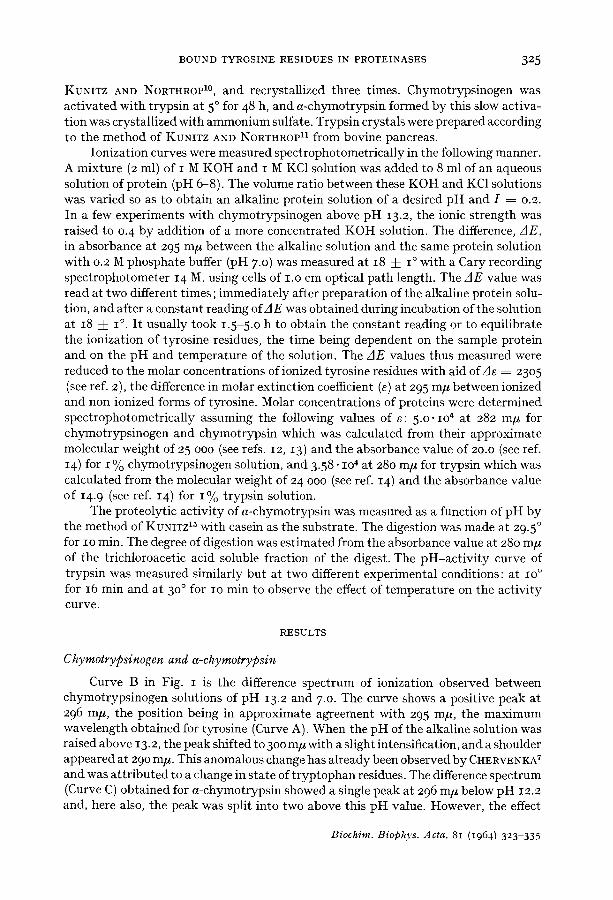
Curve A in Fig. 2 shows the pH dependency of the absorbance change (AE) at 295 m# observed for 2.08. lO -4 M chymotrypsinogen with 6.4 M gaanidine. The ioniza-
2.0 I I I I I
1.5 5 " - s
E
A B o'> n oJ 1.0
"6
L~O. 5 • G I
0 9- I0 II 12 13 0 pH
Fig. 2; Ionization curves of tyrosine residues of 2 .o8 . IO-4M chymotryps inogen; Curve A, with 6. 4 M guanidine; Curve B, wi thout guanidine. Curves C and D are the theoretical curves obtained by calculation for the residues with p K ~ io. 7 (m -- I.O) and with p K = 12. 4 (m = 1.o), respectively. The LIE values shown by O - - O on Curve D were obtained by subtract ing
the values for the residue with p K ~ lO. 7 f rom the observed values on Curve ]3.
Biochim. Biophys. Acta, 81 (1964) 323-335
BOUND TYROSINE RESIDUES IN PROTEINASES 327
t ion curve has the first order s igmoid shape (m = i .o) and shows a p K value of IO.i, which agrees wi th the value ob ta ined for ty ros ine ~-4. The cons tan t level of A E on the a lkal ine side corresponds to n = 4.0, which also agrees wi th the ty ros ine content ob- t a i ned b y chemical and spec t ropho tomet r i c analysesS-S,l=, 16. This indicates t ha t the p ro te in is dena tu red wi th guanid ine such t h a t all of the four residues are free to ionize. The p H - A E curve measured wi thou t guanid ine and i m m e d i a t e l y af ter add i t ion of a lkal i is shown by Curve B in the same figure. The curve measured 4 h af ter the add i t ion was ident ica l wi th this curve, except t ha t s l ight ly higher values of AE were ob ta ined above p H 13.5. Curve B indica tes two steps of ionizat ion. As the p H value increased to 13.2, the AE value increased g radua l ly and t ended to approach a level of n --~ 2.0. Above this pH, the curve rose more s teeply and exceeded this level. The former change of AE confirms the previous observat ions 5-7 t ha t two of the four ty ros ine residues are free to ionize. The l a t t e r change, on the o ther hand, indica tes a pa r t i a l ioniza t ion of an add i t iona l tyros ine residue. The appa ren t order, m, of the s igmoid curve below p H 13.2 was e s t ima ted to be 0.60. This indica tes t ha t the curve is composi te being the sum of two ioniza t ion curves for m --~ I.O wi th different p K values. The best fit of the d a t a was ob ta ined when the i r p K values were t aken to be lO.7 and 12.4, respect ively . Sub t rac t ion of the AE values ca lcu la ted for the residue with p K = lO.7 (Curve C) f rom the observed values gave the results shown b y open circles, which agree nicely wi th those ca lcu la ted on the assumpt ion of p K = 12.4 (Curve D). Four tyros ine residues in the chymot ryps inogen molecule may, therefore, be classified into these comple te ly ionizable residues, one residue p a r t i a l l y ionizable above p H 13.2 and one non-ionizable residue, as l i s ted in Table I.
TABLE I
T H E I O N I Z A T I O N C H A R A C T E R I S T I C S OF T Y R O S I N E R E S I D U E S
OF C H Y M O T R Y P S I N O G E N , ( I - C H Y M O T R Y P S I N A N D T R Y P S I N
Sample n m p K Ionization
I I I o . 7 Rapid Chymotrypsinogen I I 12.4 Rapid
(nt = 4) I - - - - Slow and partial I - - - - None
I i lO.2 Rapid a-Chymotrypsin I i I 1-3 Rapid
(n, = 4) i 2 12. 5 Slow but complete i - - - - None
Trypsin 6 I I o.o Rapid (nt = io) 4 2 lO.8 Slow but complete
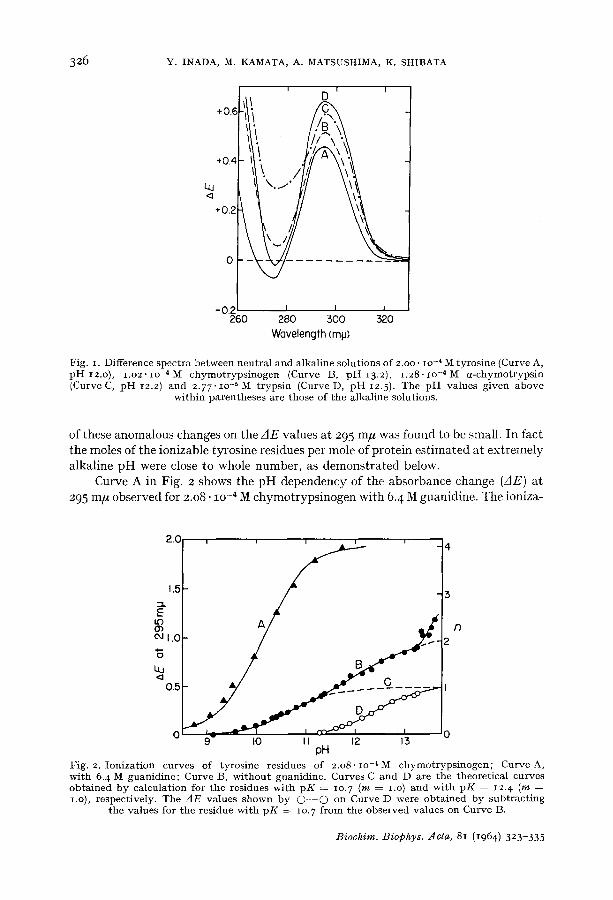
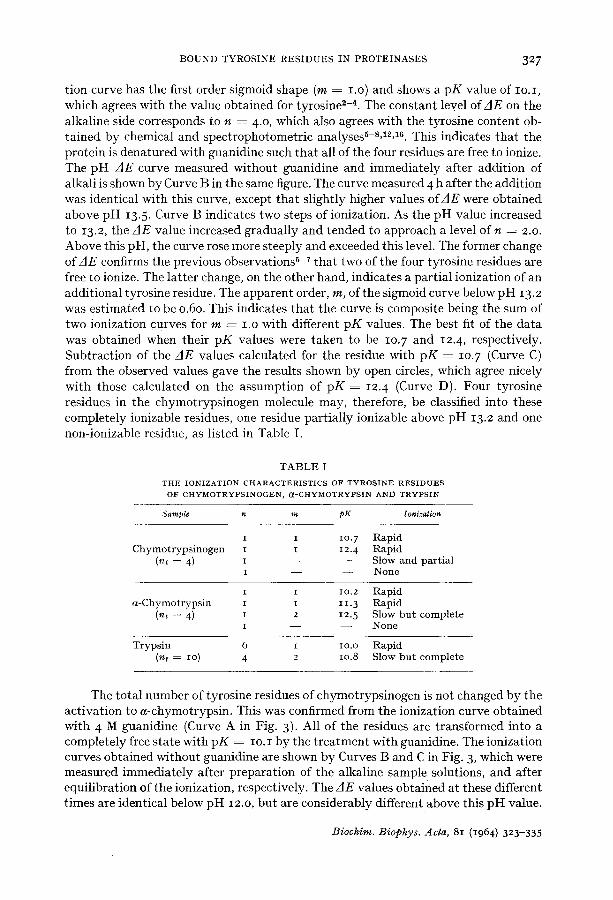
The t o t a l number of ty ros ine res idues of chymot ryps inogen is not changed b y the ac t iva t ion to a -chymot ryps in . This was confirmed from the ioniza t ion curve ob ta ined wi th 4 M guanid ine (Curve A in Fig. 3). Al l of the residues are t r ans fo rmed into a comple te ly free s ta te wi th p K ~ i o . i b y the t r e a t m e n t wi th guanidine. The ionizat ion curves ob ta ined wi thou t guan id ine are shown b y Curves B and C in Fig. 3, which were measured i m m e d i a t e l y af ter p r epa ra t i on of the a lka l ine sample solutions, and after equ i l ib ra t ion of the ionizat ion, respect ively . The A E values ob ta ined at these different t imes are iden t ica l below p H 12.o, bu t are cons iderab ly different above this p H value.
Biochim. Biophys. Acta, 81 (1964) 323-335
328 Y. INADA, M. KAMATA, A. MATSUSHIMA, K. SHIBATA
0.8
0.6 EL
E LO
0b Od0.4
"5
LU
0.2
0 8
o .
9 I0 II 12 13 pH
I0
8
6
413
2
0
Fig. 3. Ion iza t ion curves of ty ros ine residues of I . O 3 . I o - 4 M a - c h y m o t r y p s i n ; Curve A, w i t h 4.o M guan id ine ; Curves B and C, observed w i t h o u t guan id ine i m m e d i a t e l y a f te r p r e p a r a t i o n of a lka l ine sample solut ions and af ter equ i l ib ra t ion of the ionizat ion, respect ive ly . Curves D, F and G are the theore t i ca l curves ob ta ined by ca lcu la t ion for the residues wi th p K = lO.2 (m = I.O), p K = 11. 3 (m = i.o) and p K = 12. 5 (m = 2.o), respect ive ly . The AE va lues shown b y / k - - / k on Curve F were ob t a ined by s u b t r a c t i n g the theore t i ca l va lues for the res idue wi th p K = io.2 f rom the observed va lues on Curve B. The va lues shown b y I I - - I on Curve G were ob t a ined by s u b t r a c t i n g the sums of the va lues ca lcu la ted for the residues w i t h p K = lO.2
and 11. 3 f rom the observed va lues on Curve C.
Above pH 13.o, three of the four residues ionized completely during incubation for 2 h (Curve C), whereas one of these three residues ionized only partially immediately after the addition of alkali. In fact, the readings of AE above pH 12.o on Curve B increased gradually during the incubation at room temperature. These results indicate that one of tile three ionizable residues is the slowly ionizing type. The four tyrosine residues may, therefore, be grouped into two rapidly ionizing, one slowly ionizing, and one non-ionizable residues. Here again, the order of the sigmoid curve below pH 12.5 for the two rapidly ionizing residues is less than I.O. The analysis of the curve revealed that it is composite, being the sum of two ionization curves ofm = I.O with pK values of I o. 2 and I 1.3, respectively (Curves D and F). Subtraction of the A E values calculated for the residue with pK ~ lO.2 from the observed values gave the values shown by open triangles, which fit well with Curve ~ for the residue with pK = 11.3. The sum of the AE values calculated for these residues was subtracted from the observed values on Curve C. The results shown by solid squares indicate the characteristics o fm = 2.0 and pK = 12.5 for the slowly ionizing residue (Curve G).
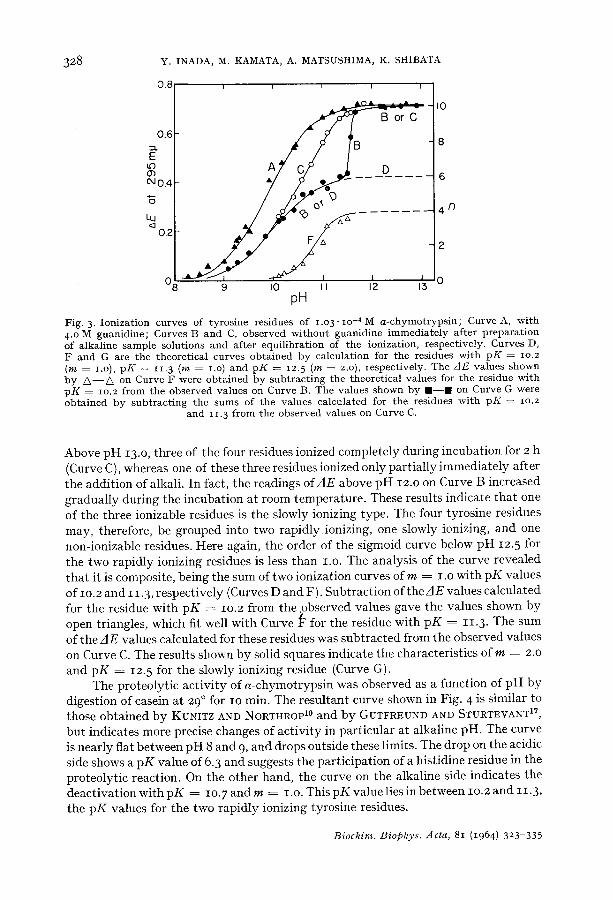
The proteolytic activity of a-chymotrypsin was observed as a function of pH by digestion of casein at 29 ° for IO rain. The resultant curve shown in Fig. 4 is similar to those obtained by KUNITZ AND NORTHROP 1° and by GUTFREUND AND STURTEVANT 17,
but indicates more precise changes of activity in particular at alkaline pH. The curve is nearly flat between pH 8 and 9, and drops outside these limits. The drop on the acidic side shows a pK value of 6.3 and suggests the participation of a histidine residue in the proteolytic reaction. On the other hand, the curve on the alkaline side indicates the deactivation with pK = lO.7 and m = I.O. This pK value lies in between IO. 2 and II.3, the pK values for the two rapidly ionizing tyrosine residues.
Biochim. Biophys. Acta, 81 (1964) 323 335
BOUND TYROSINE RESIDUES IN PROTEINASES 329
, J t J i
1.0
0 .8 • •
._>
"~0.6
._~ _~o.4
0..~
0 6 8 I0 12 - pH
Fig. 4. The p H dependency of the proteolytic activity of a -chymotryps in . The digestion oI casein (0.80%) as the subs t ra te was made with 2.6. lO -6 M a-chymot ryps in at 29 ° for IO min.
Trypsin
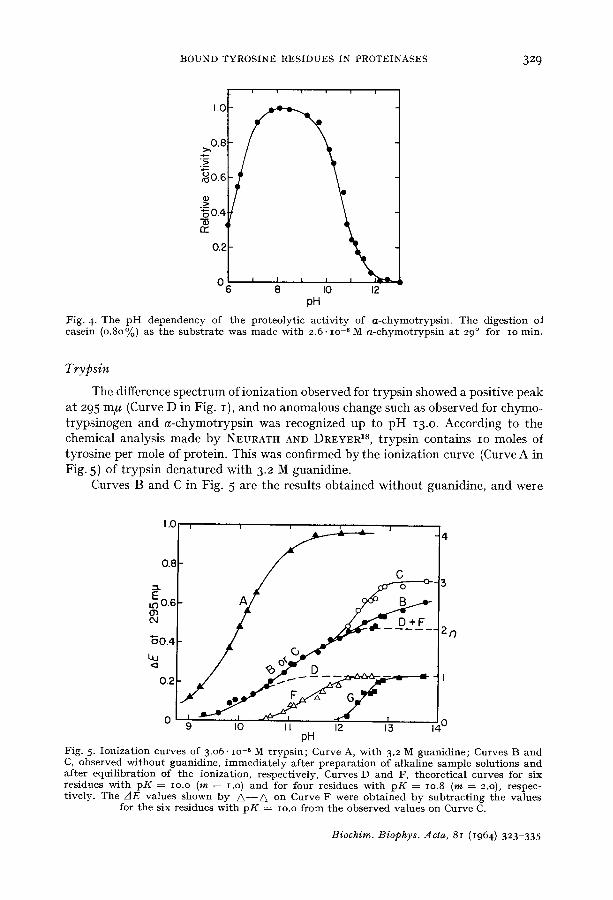
The difference spectrum of ionization observed for trypsin showed a positive peak at 295 m/~ (Curve D in Fig. I), and no anomalous change such as observed for chymo- trypsinogen and a-chymotrypsin was recognized up to pH 13.o. According to the chemical analysis made by NEURATH AND DREYER TM, trypsin contains io moles of tyrosine per mole of protein. This was confirmed by the ionization curve (Curve A in Fig. 5) of trypsin denatured with 3.2 M guanidine.
Curves B and C in Fig. 5 are the results obtained without guanidine, and were
1.0
0.8 ' ' ~ ' ' ' J4
~0.4 .... n
Uu ~ ~ o
0.2
I ~ - t ~ I " r " l I ,
0 9 I0 I I 12 13 I,~, 0 oH
Fig. 5. Ionizat ion curves of 3.06. lO -5 M t rypsin; Curve A, wi th 3.2 M guanidine; Curves B and C, observed wi thou t guanidine, immediate ly after prepara t ion of alkaline sample solutions and after equilibration of the ionization, respectively, Curves D and F, theoretical curves for six residues with p K = io.o (m = i.o) and for four residues wi th p K -- lO.8 (m = 2.o), respec- tively. The / IE values shown by A - - Z / on Curve F were obtained by subt rac t ing the values
for the six residues with p K = io.o f rom the observed values on Curve C.
Biochim. Biophys. Acta, 81 (1964) 323-335
330 v . INADA, M. KAMATA, A. MATSUSHIMA, K. SHIBATA
observed immed ia t e ly af ter the p repa ra t ion of a lkal ine sample solutions, and af ter equi l ibra t ion of the ionizat ion, respect ively. Whereas Curve C has a simple sigmoid shape wi th an appa ren t p K value of lO.4, Curve B has a sharp b reak at p H 11.5. The curve below this b reak tends to approach a level o f n = 6.o wi th p K = IO.O and m = I.O (Curve D). This p K value agrees wi th the value for tyrosine, so t ha t the six residues are inferred to be in a comple te ly free s tate . The ab rup t rise of AE in a nar row p H range of 11.5-11. 7 indica tes the t r ans format ion of the remain ing four bound residues into a free or less bound s ta te . This t r ans format ion m a y have accompanied the dena tu ra t ion of pro te in wi th the s t rong alkali . The ionizat ion curve of the four bound residues can be ob ta ined b y sub t rac t ing the zlE values on Curve B below p H i i . 5 from those on Curve C. The resul t shown b y open t r iangles on Curve F indicates the ionizat ion with p K = lO.8 and m = 2.o. Two h y d r o x y l ions were thus found to be involved in the ioniza t ion of each of these bound residues.
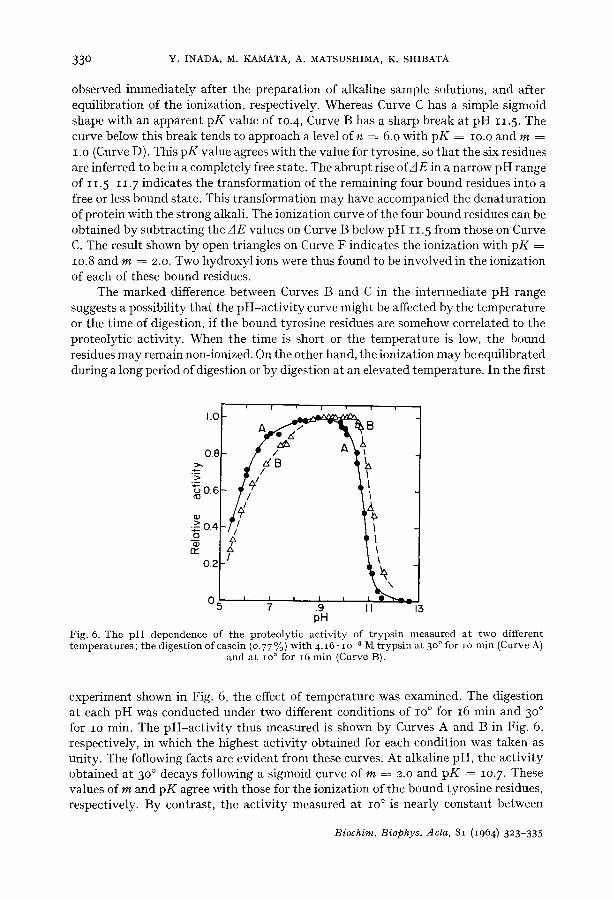
The m a r k e d difference between Curves B and C in the in t e rmed ia te p H range suggests a poss ib i l i ty t ha t the p H - a c t i v i t y curve might be affected by the t empe ra tu r e or the t ime of digest ion, i f the bound tyros ine residues are somehow corre la ted to the pro teo ly t ic ac t iv i ty . When the t ime is short or the t empe ra tu r e is low, the bound residues m a y remain non-ionized. On the other hand, the ionizat ion m a y be equi l ib ra ted dur ing a long per iod of digest ion or b y digest ion at an e levated t empera tu re . In the first
1.0
0.8
>
:~0 .6
~ 0 . 4 tD ..~
n,- 0.2
i I , i , i
I/B
i !
t
13 O~ I I I I
7 9 I pH
Fig. 6. The pH dependence of the proteolytic activity of trypsin measured at two different temperatures; the digestion of casein (o.77%) with 4.16. lO .6 M trypsin at 3 °0 for io min (Curve A)
and at io ° for 16 min (Curve B).
exper iment shown in Fig. 6, the effect of t empe ra tu r e was examined. The digest ion at each p H was conduc ted under two different condi t ions of IO ° for 16 min and 3 °o for IO min. The p H - a c t i v i t y thus measured is shown b y Curves A and B in Fig. 6, respect ively, in which the highest ac t iv i ty ob ta ined for each condi t ion was t aken as uni ty . The following facts are ev ident from these curves. At a lkal ine pH, the ac t iv i ty ob ta ined at 3 °0 decays following a s igmoid curve of m = 2.o and p K = lO.7. These values of m and p K agree wi th those for the ionizat ion of the bound tyros ine residues, respect ively. By contras t , the ac t i v i t y measured at IO ° is near ly cons tant between
Biochim. Biophys. Acta, 81 (1964) 323-335
BOUND TYROSINE RESIDUES IN PROTEINASES 331
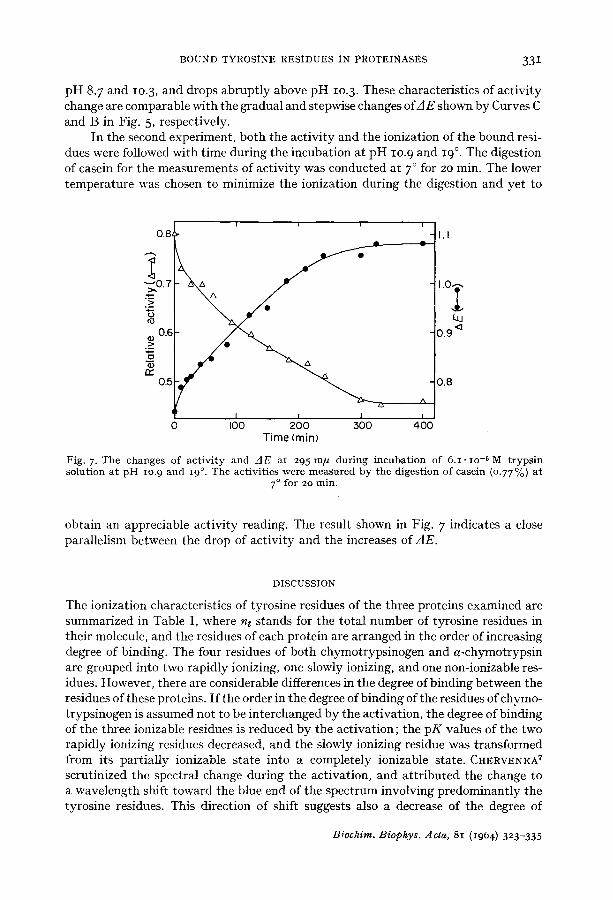
pH 8. 7 and lO.3, and drops abruptly above pH lO.3. These characteristics of activity change are comparable with the gradual and stepwise changes of/IE shown by Curves C and B in Fig. 5, respectively.
In the second experiment, both the activity and the ionization of the bound resi- dues were followed with time during the incubation at pH lO.9 and 19 °. The digestion of casein for the measurements of activity was conducted at 7 ° for 20 min. The lower temperature was chosen to minimize the ionization during the digestion and yet to
i i i i
.... 0.8~ k"~ A A ~ I. I "~0.7 I.Or. ._~
0.6 ID
r r 0.5
I I I t 0 I00 200 300 400
Time {min)
Fig. 7. The changes of act ivi ty and / ]E at 295 m/~ during incubat ion of 6.I • lO -5 M t rypsin solution at p H lO.9 and 19 °. The activities were measured by the digestion of casein (0.77 %) at
7 ° for 20 rain:
obtain an appreciable activity reading. The result shown in Fig. 7 indicates a close parallelism between the drop of activity and the increases of zIE.
DISCUSSION
The ionization characteristics of tyrosine residues of the three proteins examined are summarized in Table I, where nt stands for the total number of tyrosine residues in their molecule, and the residues of each protein are arranged in the order of increasing degree of binding. The four residues of both chymotrypsinogen and a-chymotrypsin are grouped into two rapidly ionizing, one slowly ionizing, and one non-ionizable res- idues. However, there are considerable differences in the degree of binding between the residues of these proteins. If the order in the degree of binding of tile residues of chymo- trypsinogen is assumed not to be interchanged by the activation, the degree of binding of the three ionizable residues is reduced by the activation; the pK values of the two rapidly ionizing residues decreased, and the slowly ionizing residue was transformed from its partially ionizable state into a completely ionizable state. CHERVENKA 7 scrutinized the spectral change during the activation, and attr ibuted the change to a wavelength shift toward the blue end of the spectrum involving predominantly the tyrosine residues. This direction of shift suggests also a decrease of the degree of
Biochim. Biophys. Acla, 81 (1964) 323-335
332 Y, INADA, M. KAMATA, A. MATSUSHIMA, K. SHIBATA
binding. I t may be worth noting that the pK value for one of the residues of a-chymo- trypsin is as low as lO.2, which is close to the value for tyrosine. The fact observed by VISWANATHA AND LAWSON 19 that N-bromosuccinimide reacts with one of the four tyrosine residues of chymotrypsin accords with this result. In the activation, two di- peptides are released, and one of the two C-terminals formed is tyrosine. The residue with pK = lO.2 is, therefore, inferred to be this terminal residue.
Similarly as above, the degree of binding of the tyrosine residues of trypsinogen is reduced by the activation, as discussed below. SMILLIE AND KAY 9 reported that, of the total 9 or IO tyrosine residues in the trypsinogen molecule, four ionized freely and reversibly, and four others were reversibly unmasked above p H I i. 5 at i o °, where- as the unmasking at 25 ° or 37 ° was accompanied by irreversible changes in the molecule, involving the liberation of the remaining tyrosine residues. Since the total number of tyrosine residues in trypsinogen is the same as that for trypsin and, therefore, IO, the number of bound (reversibly and irreversibly unmasked) residues of SMILLIE AND KAY in trypsinogen should be rather 6 than 5. I t is, therefore, evident that, on activation, two of these six bound residues are transformed into the free state with the same pK value as that for trypsin, and four others into a less bound state with pK ---- lO.8. In the activation, a hexapeptide containing four aspartic acid residues is released from the precursor. SCHERAGA et al. 2° from the spectral changes on acidifying insulin and RNAase solutions and on tryptic digestion of insulin, postulated the hydrogen-bonding of some of their tyrosine residues with carboxyl groups of glutamic or aspartic acid residues. Considering these facts, the bound residues freed on the activation would be hydrogen-bonded in the trypsinogen molecule with some of the aspartic acid residues in the hexapeptide. The general trend of decreasing degree of binding found for the tyrosine residues on the activation of both chymotrypsinogen and trypsinogen may be related to the decrease of levorotation observed on the activation of the same pre- cursors by NEURATH, RUPLEY AND DREYER 21 a n d PECHERE AND NEURATH 22. Probably, a strain is imposed on peptide chains in the precursor molecules, and the splitting of peptide bonds in the activation may allow some peptide chains to move more freely and to coil up, which may result in both the reduction of the degree of binding and the increase of the helical content.
A close correlation exists between the ionization of the bound tyrosine residues of trypsin and the deactivation of the enzyme with alkali, as summarized below. (a) The value of both pK and m for the ionization agreed nicely with those estimated from the pH-ac t iv i ty curve measured after the ionization was equilibrated. (b) The activities measured before equilibration were higher than those obtained after, in the same pH range as for the ionization of the bound residues. (c) The deactivation during incubation at pH 10. 9 proceeded in parallel with the ionization. In the case of a-chymo- trypsin, the agreement in pK is less satisfactory; the value, lO.7, estimated from the deactivation is higher than lO.2 and lower than 11.3, the values for the two rapidly Ionizing residues, although the value of m is I.O both for the ionization and for the deactivation.
Extensive studies have been made on the structure of the proteolytic active center of both chymotrypsin and trypsin, and the information concerning the structure is similar for these enzymes. A substantial clue to this problem was obtained by BALLS et al. 2~-~5 with DFP which reacted stoichiometrically with these enzymes and abolished the activities completely and irreversibly. The hydrolysis of diisopropylphosphoryl-
Biochim. Biophys. ,4cta, 81 (I964) 323-335
BOUND TYROSINE RESIDUES IN PROTEINASES 333
enzymes thus derived 26-29 clarified tile fact that the phosphoryl group is attached to a serine residue which belongs to the Gly-Asp-Ser-Gly sequence common to these enzymes29, ~°. On the other hand, DFP does not react with serine and commonly avail- able serine peptides, and the phosphorylation or acylation of chymotrypsin is abolished by prior denaturation of the protein with urea31, 32. These results together with the pH-act ivi ty curves17, 33 and the deactivations by photo-oxidation34, 35 and by dinitro- phenylation36, 37 revealed the concerted action of the serine residue and the non- ionized form of a histidine residue held together by hydrogen-bonding. These are reviewed comprehensively by DESNUELLE 38,39 and by NEURATH AND DIXON 4°, and the latter authors proposed a well known model for the structural change on the activa- tion of trypsinogen, which includes the re-orientation of peptide chains leading to a more nearly helical configuration and the resultant formation of the active center composed of serine and histidine residues.
The structure of the active center seems to be more intricate, considering the close parallelism found for trypsin between the ionization of the bound tyrosine residues and the deactivation accompanied by it. Two interpretations may be given to this phenomenon: one is the participation of the non-ionized form of one of the bound tyrosine residues in the proteolytic reaction; and the other is the effect of a conforma- tion change which might induce both the ionization and the deactivation. The authors suggest that the former mechanism is more likely for the following reasons. (a) A num- ber of hydroxyl ions may be involved in a conformation change, so that one may expect a large value of m. The value m ~ 2.o for the deactivation as well as for the ionization may be too small to be ascribed to a conformation change. (b) Curve B in Fig. 5 rises abruptly to the level of Curve C in a narrow pH range of I i . 5 - I I . 7. This may be due to a conformation change or denaturation, so that the ionization occurring below the abrupt change would not result from it. The instantaneous ionization of the weakly bound residues also supports this point of view.
I I
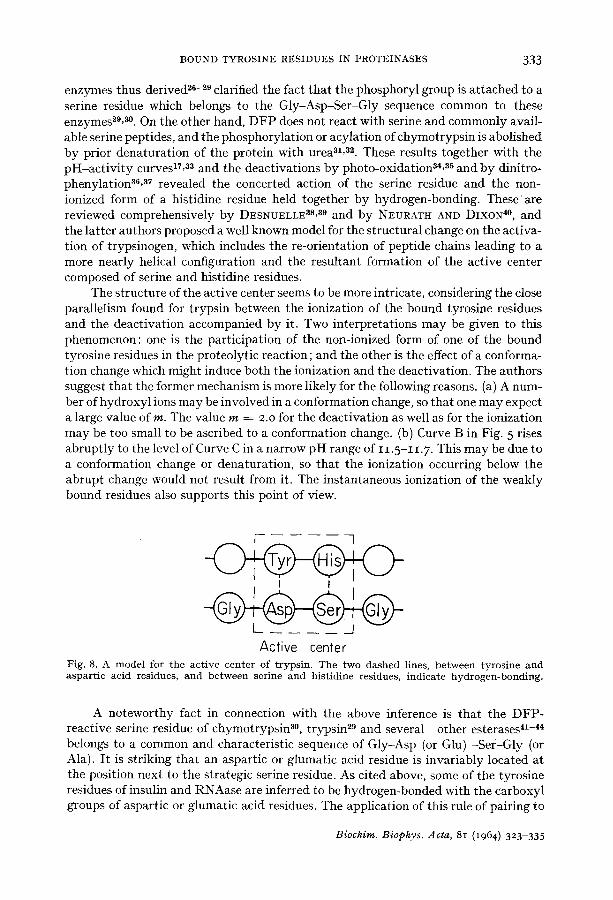
Active center Fig. 8. A model for the act ive center of trypsin. The two dashed lines, be tween tyros ine and aspartic acid residues, and between serine and hist idine residues, indicate hydrogen-bonding.
A noteworthy fact in connection with the above inference is that the DFP- reactive serine residue of chymotrypsin 3°, trypsin 29 and several other esterases 41-44 belongs to a common and characteristic sequence of Gly-Asp (or Glu) -Sel:-Gly (or Ala). It is striking that an aspartic or glumatic acid residue is invariably located at the position next to the strategic serine residue. As cited above, some of the tyrosine residues of insulin and RNAase are inferred to be hydrogen-bonded with the carboxyl groups of aspartic or glumatic acid residues. The application of this rule of pairing to
Biochim. Biophys. Acta, 81 (1964) 323-335
334 Y. INADA, M. KAMATA, A. MATSUSHIMA, K. SHIBATA
trypsin leads to the hydrogen-bonding of one of the weakly bound tyrosine residues with the aspartic acid residue next to the serine residue. In fact, FORMAT obtained Tyr-His by hydrolysis of trypsinogen, whereas no such peptide was identified for chymotrypsinogen . I6 It may, therefore, be stimulative to postulate a structural model for the ative center of trypsin which accounts for both the concerted action of serine and histidine residues and the close correlation between the ionization of the bound tyrosine residues and the deactivation accompanied by it. Fig. 8 illustrates the model, in which the histidine and tyrosine residues are hydrogen-bonded with the serine and aspartic acid residues, respectively. The absence of Tyr-His in chymotrypsinogen as well as the less satisfactory agreement between the pK values for the deactivation and for the ionization of the tyrosine residues leaves a possibility that the counterpart of the aspartic acid residue in chymotrypsin is different from tyrosyl. This would ex- plain the different proteolytic specificities between trypsin and chymotrypsin, but it awaits experimental evidence.
REFERENCES
1 J. L. CRAMMER AND A. NEUBERGER, Biochem. J., 37 (1943) 302. 2 Y. INADA, J. Biochem. Tokyo, 4g (1960) 217. 3 D. I. HITCHCOCK, J. Gen. Physiol., 6 (1924) 747. * P. S. WINNEK AND C. A. SCHMIDT, J. Gen. Physiol., 18 (1935) 889. 5 P. E. WILCOX, Federation Proc., 16 (1957) 270. B C. H. CHERVENKA, Biochim. Biophys. Acta, 26 (1957) 222. 7 C. H. CHERVENKA, Biochim. Biophys. Acta, 31 (1959) 85. 8 B. H. HAVSTEEN AND G. P. HESS, J. Am. Chem. Sot., 84 (1961) 448. 8 L. B. SMILLIEAND C. M. KAY, 1. Biol. Chem., 236 (1961) 112.
lo M. KUNITZ AN& J. H. NOPT.HR~P, J. Gen. PhysiiZ., ‘18 (1935) 433. 11 M. KUNITZ AND 1. H. NORTHROP, 1. Gen. Physiol., rg (1936) 991. 12 P. E. WILCOX, E: C. COIIEN AND W. TAN, J.BioZ. Chem., 228 (1957) ggg. la P. E. WILCOX, J. KRAUT, R. D. WADE AND H. NEURATH, Biochim. Biophys. Acta, 24 (1957)
14 ~:LASKOWSKI, in C. LONG, Biochemists’ Handbook, E. and F. N. Spon Ltd., London, Ig6I.
P. 302, 304. I6 M. KUNITZ, J. Gen. Physiol., 30 (1947) 291. 16 B. KEIL, B. MELOWN, J. VANI%EK, V. KOSTKA, Z. PRUSIL AND F. SORM, Biochim. Biophys.
Acta, 56 (1962) 595. I7 H. GUTFREUND AND J. M. STURTEVANT, Biochem. J., 63 (1956) 656. I8 H. NEURATH AND W. J. DREYER, Discussions Faraday Sot., 2.0 (1955) 32. I9 T. VISWANATHA AND W. B. LAWSON, Arch. Biochem. Biophys., 93 (1961) 128. 20 H. A. SCHERAGA, Protein Structure, Academic Press, New York, 1961, p. 241. 21 H. NEURATH, J. A. RUPLEY AND W. J. DREYER, Arch. Biochem., 65 (1956) 243. 22 J. F. PECHERE AND H. NEURATH, J. Biol. Chem., 229 (1957) 389. aa E. F. JANSEN, M. D. F. NUTTING, R. JANGAND A. K. BALLS, BioZ. I7g (1949) 189,201. 21 E. F. TANSEN. R. TANG AND A. K. BALLS, 1. BioZ. Chem., 196 (19.52) 247. 25 E. F. ~ANSEN’AND”A. K. BALLS, J. Bid. Cl&em., Ig4 (1952) 721’. -- 26 N. K. SCHAFFER, S. C. MAY AND W. H. SUMMERSON, J. Biol. Chem., 202 (1953) 67. 27 N. K. SCHAFFER, R. R. ENGLE, L. SIMET, R. W. DRISKO AND S. HARSHMAN, Federation Proc.,
I5 (1956) 347. 28 G. H. DIXON, D. L. KAUFFMAN AND H. NEURATH, J. Biol. Chem., 233 (1958) 1373. 29 G. H. DIXON, D. L. KAUFFMAN AND H. NEURATH. J. Am. Chem. Sot., 80 (1958) 1260. so R. A. OOSTERBAAN, P. KUNST, 1. VAN ROTTERDAM AND J. A. COHEN, Biochim. Biophys. Acta,
27 (1958) 556. s1 G. H. DIXON AND H. NEURATH, Biochim. Biophys. Acta, 20 (1956) 572. a2 G. H. DIXON, W. J. DREYER AND H. NEURATH, J. Am. Chem. Sot., 78 (1956) 4810. ss H. GUTFREUND, Trans. Faraday SOL, 51 (1955) 441. 34 L. WEIL AND A. R. BUCHERT, Arch. Biochem. Biophys., 46 (1953) 266. 85 B. J. JANDORF, H. 0. MICHEL, N. K. SCHAFFER, E. EGAN AND W. H. SUMMERSON, Discussions
Faraday SOL, 20 (1955) 134.
BiocRim. Biophys. Acta, 81 (1964) 323-335
BOUND TYROSINE RESIDUES IN PROTEINASES 335
as j . R. WHITAKER AND B. J. JANDORF, J. Biol. Chem., 223 (1956) 751. z~ V. MASSEY AND B. S. HARTLEY, Biochim. Biophys. Acta, 21 (1956) 361. 3s p. DtgSNUELLE, in P. D. BOYER, H. LARDY AND K. MYRBACK, The Enzymes, Vol. 4, Academic
Press, New York, 196o, p. 93- a9 p. DESNUELLE, in P. D. BOYER, H. LARDY AND K. ~V[YRBACK, The Enzymes, Vol. 4, Academic
Press, New York, 196o, p. 119. 4o H. NEURATH AND G. H. DixoN, Federation Proc., 16 (1957) 791. 41 j . A. GLADNER AND K. LAKI, J . Am. Chem. Soc., 80 (1958) 1253. 42 H. S. JANSZ, C. H. POSTHUMUS AND J. A. COHEN, Biochim. Biophys. Acta, 33 (1959) 396. 4a H. S. JANSZ, D. BRONS AND ~[. G. P. J. WARRINGA, Biochim. Biophys. Acta, 34 (1959) 573. 44 B. S. HARTLEY, M. H. NAUGHTON AND F. SANGER, Biochim. Biophys. Acta, 34 (I959) 243- 45 F. SORM, in A. NEUBERGER, Symposium on Protein Structure, Methuen and Co. Ltd., London,
1958, p. 77.
Biochim. Biophys. Acta, 81 (1964) 323-335