stora enso financial result q3 2014
TRANSCRIPT

Financial Results Q3 2014
CEO Karl-Henrik Sundström and CFO Seppo Parvi 22 October 2014

It should be noted that certain statements herein which are not historical facts, including, without
limitation those regarding expectations for market growth and developments; expectations for growth
and profitability; and statements preceded by “believes”, “expects”, “anticipates”, “foresees”, or similar
expressions, are forward-looking statements within the meaning of the United States Private Securities
Litigation Reform Act of 1995. Since these statements are based on current plans. estimates and
projections, they involve risks and uncertainties which may cause actual results to materially differ from
those expressed in such forward-looking statements. Such factors include, but are not limited to: (1)
operating factors such as continued success of manufacturing activities and the achievement of
efficiencies therein, continued success of product development, acceptance of new products or services
by the Group’s targeted customers, success of the existing and future collaboration arrangements,
changes in business strategy or development plans or targets, changes in the degree of protection
created by the Group’s patents and other intellectual property rights, the availability of capital on
acceptable terms; (2) industry conditions, such as strength of product demand, intensity of competition,
prevailing and future global market prices for the Group’s products and the pricing pressures thereto.
price fluctuations in raw materials, financial condition of the customers and the competitors of the
Group, the potential introduction of competing products and technologies by competitors; and (3)
general economic conditions, such as rates of economic growth in the Group’s principal geographic
markets or fluctuations in exchange and interest rates.
Stora Enso Q3 2014 Financial Results 2 22 October 2014

Solid quarterly performance –transformation journey
continues Q3 2014 year-on-year
• Renewable Packaging continued its
strong performance for the third
quarter in a row
– Operational EBIT increased by 30%
• Biomaterials improved its performance
despite Montes del Plata ramp-up
• Building and Living performance
similar to last year’s good Q3.
• Stable performance in Printing and
Reading
– Cash flow from operations to sales
ratio 7.5% (5.4%)
• Group operational ROCE 13%
(10.2%) excluding strategic
investments
22 October 2014 Stora Enso Q3 2014 Financial Results 3

1000
1100
1200
1300
1400
1500
1600
13Q3 14Q3
Sales, excluding Printing and Reading, MEUR
4000
4100
4200
4300
4400
4500
4600
4700
4800
Q3 2013 YTD Q3 2014 YTD
Sales, excluding Printing and Reading, MEUR
1000
1200
1400
1600
1800
2000
2200
2400
2600
2800
13Q3 14Q3
Group sales, MEUR
4000
4500
5000
5500
6000
6500
7000
7500
8000
8500
Q3 2013 YTD Q3 2014 YTD
Group sales, MEUR
Quarterly sales at EUR 2 514 million up by 3% y-o-y,
excluding structurally declining paper
22 October 2014 Stora Enso Q3 2014 Financial Results 4
2.8% 1.0%
-3.6% -1.5% 2 553 2 514 7 951
7 661
1 512 1 555
4 686 4 733

0
100
200
300
400
500
600
700
13Q3 14Q3 Q3 2013 YTD Q3 2014 YTD
Operational EBIT increased sequentially by 14% and
YTD y-o-y by 41%
Stora Enso Q3 2014 Financial Results 5
MEUR
22 October 2014
14.1%
41.1%
184 210
426
601

Investing in sustainable business
22 October 2014 Stora Enso Q3 2014 Financial Results 6
Guangxi
Partnering with IFC (equity and loan)
FSC certified plantation
Key equipment selected
Site levelling work mainly completed, next steps
waiting for the permits
Phase one: board machine operational early 2016
as previously announced
Montes del Plata
Pulp mill investment of EUR 1 721 million in
Uruguay, joint operation
Annual production capacity 1.3 million tonnes
- Stora Enso’s share 650 000 tonnes
- Stora Enso’s share of 2014 production
245 000 - 275 000 tonnes, due to typical
instability of the ramp-ups
Virdia – demonstration plant
New investment in a demonstration and market
development plant in the USA for the extraction
and separation of highly pure sugars from
biomass to be converted into differentiated
biochemicals.
Demonstration and market development plant to
be built at Raceland, Louisiana, USA
Varkaus conversion
EUR 110 million for conversion
EBITDA margin above 15%
Start up Q4 2015
Capacity 390 000 tonnes of kraftliner
Uncoated fine paper capacity to reduce
by 280 000 tonnes

Non-core asset divestment and restructuring
• Non-core asset divestments:
– Corenso core and coreboard
operations to Powerflute, cash
consideration approximately EUR
75 million expected Q4, announced
Q3 2014
– Thiele Kaolin, cash consideration
EUR 56 million, Q1 2014
• Restructuring:
– Uetersen Mill sales purchase
agreement was discontinued in Q3
– Planned divestment cancelled
22 October 2014 Stora Enso Q3 2014 Financial Results 7

30 %
70 %
Paper Growth businesses
16 %
11 %
10 %62 %
1 %
Transformation journey continues Sales and operational EBIT
20XX Sales
62 %
6 %
35 %
-3 %
70 %
12 %
21 %
-3 %
2006 Sales
Stora Enso Q3 2014 Financial Results 8 22 October 2014
38 %
11 %17 %
34 %
0 %
Q3 2014 Operational EBIT 2006 Operational EBIT
Q3 2014 Sales


Summary financials Q3 2014
10 Stora Enso Q3 2014 Financial Results 22 October 2014
EUR million Q3/14 Q3/13
Change % Change %
Q3 14 /
Q3 13
Q2/14 Q3 14 /
Q2 14
Sales 2 514 2 553 -1.5 2 579 -2.5
Operational EBITDA 333 319 4.4 326 2.1
Operational EBITDA, % 13.2 12.5 12.6
Operational EBIT 210 184 14.1 209 0.5
Operational EBIT margin, % 8.4 7.2 8.1
Profit before tax excl. NRI 116 126 -7.9 145 -20.0
EPS excl. NRI, EUR 0.12 0.13 0.13
EPS (basic), EUR 0.15 0.11 0.00
Operational ROCE, % 9.7 8.3 9.8
Operational ROCE, % excl. transformation
investments13.0 10.2 12.7
Cash Flow from Operations 257 347 -25.9 288 -10.8
Net debt/last 12 months’ operational
EBITDA 2.8 3.1 2.8
0
500
1000
1500
2000
2500
3000
13Q3 14Q3 Q3 2013 YTD Q3 2014 YTD
Sales, MEUR
0
50
100
150
200
250
300
350
400
13Q3 14Q3 Q3 2013 YTD Q3 2014 YTD
Operational EBIT, MEUR
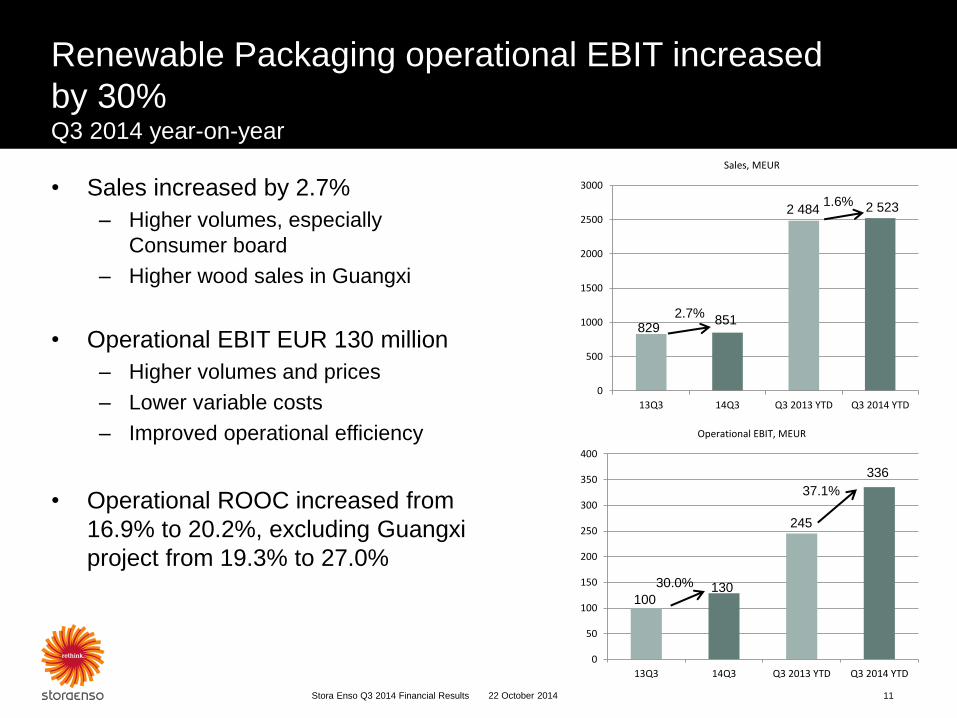
Renewable Packaging operational EBIT increased
by 30% Q3 2014 year-on-year
11 Stora Enso Q3 2014 Financial Results
• Sales increased by 2.7%
– Higher volumes, especially
Consumer board
– Higher wood sales in Guangxi
• Operational EBIT EUR 130 million
– Higher volumes and prices
– Lower variable costs
– Improved operational efficiency
• Operational ROOC increased from
16.9% to 20.2%, excluding Guangxi
project from 19.3% to 27.0%
22 October 2014
2.7%
1.6%
37.1%
30.0%
829 851
2 484 2 523
336
245
130 100

0
100
200
300
400
500
600
700
800
900
13Q3 14Q3 Q3 2013 YTD Q3 2014 YTD
Sales, MEUR
0
10
20
30
40
50
60
13Q3 14Q3 Q3 2013 YTD Q3 2014 YTD
Operational EBIT, MEUR
Biomaterials operational EBIT improved by 41% Q3 2014 year-on-year
12 Stora Enso Q3 2014 Financial Results
• Sales increased by 18.8%
– Mainly due to MdP
• Operational EBIT EUR 24 million
– Higher volumes
– Activity in innovation (lignin and
Virdia) increased fixed costs
– Softwood pulp prices higher,
hardwood lower
• Operational ROOC increased from
3.3% to 4.2%, excluding MdP from
9.0% to 11.1%
22 October 2014
18.8%
3.0%
41.2%
3.8%
239 284
767 790
55 53
24
17

0
200
400
600
800
1000
1200
1400
1600
13Q3 14Q3 Q3 2013 YTD Q3 2014 YTD
Millions
Sales, MEUR
0
10
20
30
40
50
60
70
80
13Q3 14Q3 Q3 2013 YTD Q3 2014 YTD
Millions
Operational EBIT, MEUR
Building and Living operational EBIT EUR 22 million Q3 2014 year-on-year
• Sales decreased by 6.7%
– Lower volumes in Japanese market
• Operational EBIT EUR 22 million
– Lower volumes and slightly lower
prices
– Lower fixed costs
• Operational ROOC decreased from
17.7% to 16.0%
• Murow Sawmill investment
proceeding as planned
22 October 2014 Stora Enso Q3 2014 Financial Results 13
-6.7%
-2.6%
-8.3%
41.1%
460
1 401 1 364
24 22
56
429
79
0
500
1000
1500
2000
2500
3000
3500
13Q3 14Q3 Q3 2013 YTD Q3 2014 YTD
Sales, MEUR
0
50
100
150
200
250
300
13Q3 14Q3 Q3 2013 YTD Q3 2014 YTD
Operational EBITDA, MEUR
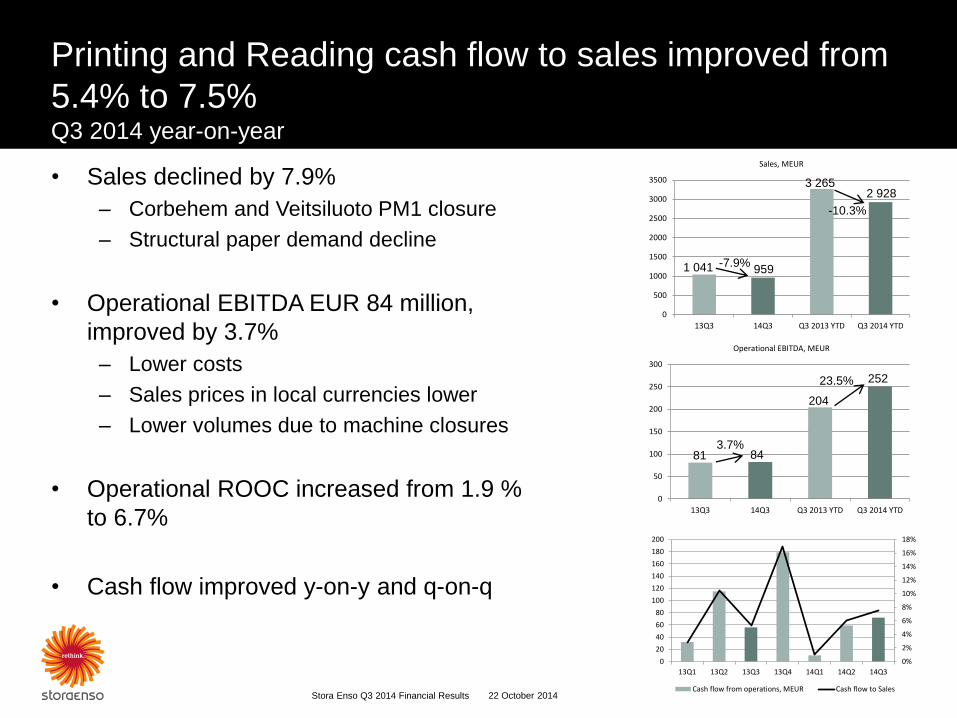
Printing and Reading cash flow to sales improved from
5.4% to 7.5% Q3 2014 year-on-year
• Sales declined by 7.9%
– Corbehem and Veitsiluoto PM1 closure
– Structural paper demand decline
• Operational EBITDA EUR 84 million,
improved by 3.7%
– Lower costs
– Sales prices in local currencies lower
– Lower volumes due to machine closures
• Operational ROOC increased from 1.9 %
to 6.7%
• Cash flow improved y-on-y and q-on-q
Stora Enso Q3 2014 Financial Results 14 22 October 2014
-7.9%
-10.3%
3.7%
23.5%
3 265 2 928
959 1 041
81 84
204
252
0%
2%
4%
6%
8%
10%
12%
14%
16%
18%
0
20
40
60
80
100
120
140
160
180
200
13Q1 13Q2 13Q3 13Q4 14Q1 14Q2 14Q3
Cash flow from operations, MEUR Cash flow to Sales
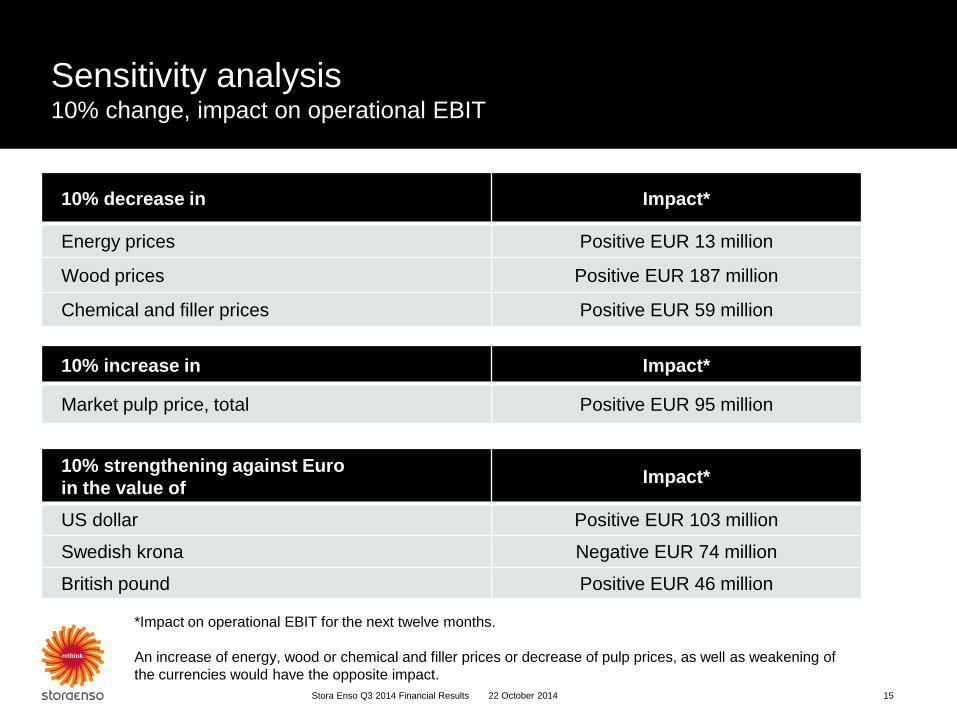
Sensitivity analysis 10% change, impact on operational EBIT
22 October 2014 Stora Enso Q3 2014 Financial Results 15
10% increase in Impact*
Market pulp price, total Positive EUR 95 million
*Impact on operational EBIT for the next twelve months.
An increase of energy, wood or chemical and filler prices or decrease of pulp prices, as well as weakening of
the currencies would have the opposite impact.
10% decrease in Impact*
Energy prices Positive EUR 13 million
Wood prices Positive EUR 187 million
Chemical and filler prices Positive EUR 59 million
10% strengthening against Euro
in the value of Impact*
US dollar Positive EUR 103 million
Swedish krona Negative EUR 74 million
British pound Positive EUR 46 million

Forecast for capex in 2014
EUR million Forecast 2014*
Capital expenditure 790–840
Depreciation 550–560
* Capital expenditure includes approximately EUR 260 million for the project in Guangxi, China. These figures do not include the
acquisition of Bergvik Skog and Virdia shares.
16 Stora Enso Q3 2014 Financial Results 22 October 2014


Guidance for Q4 2014 Compared to Q3 2014
• Sales are estimated to be roughly
similar to the EUR 2 514 million
• Operational EBIT is expected to
be somewhat lower than EUR 210
million
– Due to normal seasonal weakness
in the Renewable Packaging and
Building and Living divisions
22 October 2014 Stora Enso Q3 2014 Financial Results 18

Conclusion y-o-y comparison
• Transformation journey continues
• Solid third quarter
– Operational EBIT increased
by 14%
– Net debt /EBITDA improved from
3.1 to 2.8
– Operational ROCE improved from
8.3% to 9.7%
22 October 2014 Stora Enso Q3 2014 Financial Results 19
22 October 2014 Stora Enso Q3 2014 Financial Results 20
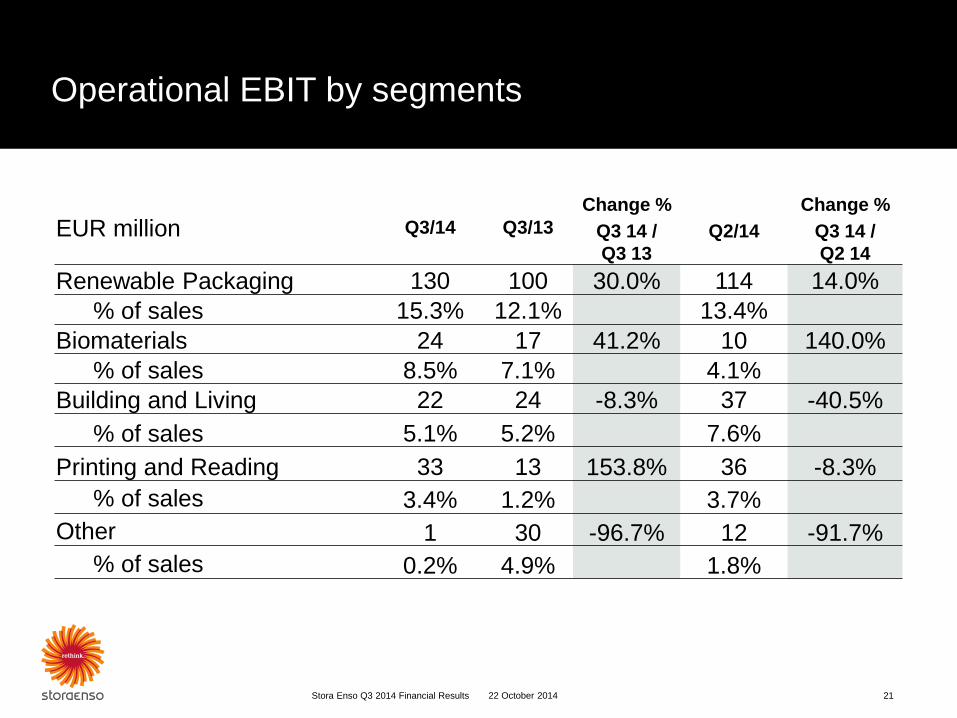
Operational EBIT by segments
21 Stora Enso Q3 2014 Financial Results 22 October 2014
EUR million Q3/14 Q3/13
Change % Change %
Q3 14 /
Q3 13
Q2/14 Q3 14 /
Q2 14
Renewable Packaging 130 100 30.0% 114 14.0%
% of sales 15.3% 12.1% 13.4%
Biomaterials 24 17 41.2% 10 140.0%
% of sales 8.5% 7.1% 4.1%
Building and Living 22 24 -8.3% 37 -40.5%
% of sales 5.1% 5.2% 7.6%
Printing and Reading 33 13 153.8% 36 -8.3%
% of sales 3.4% 1.2% 3.7%
Other 1 30 -96.7% 12 -91.7%
% of sales 0.2% 4.9% 1.8%

0,0
0,5
1,0
1,5
2,0
2,5
3,0
3,5
2 800
2 900
3 000
3 100
3 200
3 300
3 400
3 500
3 600
12Q1 12Q2 12Q3 12Q4 13Q1 13Q2 13Q3 13Q4 14Q1 14Q2 14Q3
Net Debt, MEUR Net Debt/Operational EBITDA*
Balance sheet strength Q1 2012 – Q3 2014
Stora Enso Q3 2014 Financial Results 22
*Last twelve months’ operational EBITDA
22 October 2014

Cash flow from operations
22 October 2014 Stora Enso Q3 2014 Financial Results 23
0%
2%
4%
6%
8%
10%
12%
14%
16%
18%
20%
0
50
100
150
200
250
300
350
400
450
500
13Q1 13Q2 13Q3 13Q4 14Q1 14Q2 14Q3
Cash flow from operations, MEUR Cash flow to sales

Cash flow by divisions in Q3
22 October 2014 Stora Enso Q3 2014 Financial Results 24
-100
-50
0
50
100
150
200
Printing andReading
Biomaterials Building andLiving
RenewablePackaging
Other
Cash flow from operations, MEUR Cash flow after investments, MEUR

Permanent pulp, paper and board capacity reductions since 2006
Stora Enso Q3 2014 Financial Results 25 22 October 2014
Mill Date Grade Capacity reduction, t
Corbehem PM 3 and PM 4 Jun 2006 LWC 250 000
Varkaus PM 1 End 2006 WFC 95 000
Berghuizer Mill Oct 2007 WFU 235 000
Reisholz Mill End 2007 SC 215 000
Summa Mill Jan 2008 Newsprint, uncoated mag, book paper 415 000
Anjala Mill PM1 Feb 2008 Coated magazine paper 155 000
Baienfurt Mill End 2008 FBB 190 000
Kabel Mill PM 3 End 2008 Coated magazine 140 000
Kemijärvi Pulp Mill April 2008 Long-fibre (SW) pulp 250 000
Norrsundet Pulp Mill Dec 2008 Long-fibre (SW), pulp 300 000
Varkaus Mill coreboard machine Dec 2008 Coreboard 100 000
Imatra PM 8 Mar 2010 WFU 210 000
Varkaus PM 2 and PM 4 Sep 2010 Newsprint, directory paper 290 000
Maxau PM 7 Nov 2010 Newsprint 195 000
Hylte PM1 Dec 2012 Newsprint 180 000
Ostroleka PM2 Jan 2013 Containerboard 85 000
Hylte PM2 May 2013 Newsprint 205 000
Kvarnsveden PM11 May 2013 Newsprint 270 000
Veitsiluoto PM1 Apr 2014 Coated magazine 190 000
Corbehem MIll July 2014 LWC 330 000
Total 4 300 000

Permanent sawn wood capacity reductions since 2006
Stora Enso Q3 2014 Financial Results 26 22 October 2014
Mill Date Capacity reduction, m3
Veitsiluoto Sawmill 2006 100 000
Honkalahti Sawmill 2006 90 000
Sauga Sawmill Jun 2007 130 000
Sollenau Sawmill 2007 110 000
Näpi Sawmill 2007-2008 100 000
Kotka Sawmill 2007-2008 70 000
Paikuse Sawmill End 2008 220 000
Zdirec Sawmill 2008 120 000
Ybbs Sawmill 2008 & Jun 2009 200 000
Kitee Sawmill 2008 & Jun 2009 130 000
Varkaus Sawmill Jun 2009 60 000
Tolkkinen Sawmill End 2009 260 000
Kopparfors Sawmill End 2011 310 000
Sollenau Sawmill Mar 2014 150 000
Total 2 050 000

Net financial items
22 October 2014 Stora Enso Q3 2014 Financial Results 27
*Not hedge accounted interest rate derivatives.
EUR millionQ3/
2014
Q3/
2013
Change %
Q314/
Q313
Q2/
2014
Change %
Q314/
Q214
Net interest expense -48 -53 9 -45 -7
Foreign exchange gains and losses -16 11 n/m 15 n/m
Other financial items. of which -7 -11 36 -16 56
PIK notes - 3 -
Fair valuation of interest rate derivatives* - -4 -9
Fair valuation of long-term debt - - -
Pension costs (IAS 19R) -2 -4 -3
Other items -5 -6 -4
Total net financial items -71 -53 -34 -46 -54

Net cash flows and foreign exchange hedges Q3 2014
Stora Enso Q3 2014 Financial Results 28 22 October 2014
Additionally there are USD hedges for 13-15 months worth of EUR 30
million.
€ million USD SEK GBP
Estimated annual net operating cash flow exposure 1030 -740 460
Transaction hedges -480 390 -230
Hedging percentage for the next 12 months 47%* 53% 50%

0
2
4
6
8
10
12
14
16
11Q111Q211Q311Q412Q112Q212Q312Q413Q113Q213Q313Q414Q114Q214Q3
Paper and Board Wood Products
Curtailments of capacity
29 Stora Enso Q3 2014 Financial Results
% of the
capacity
22 October 2014

Softwood pulp prices Stora Enso’s market pulp is softwood
Stora Enso Q3 2014 Financial Results 30
Source: FOEX
22 October 2014
450
550
650
750
850
950
1 050
07Q
107Q
207Q
307Q
408Q
108Q
208Q
308Q
409Q
109Q
209Q
309Q
410Q
110Q
210Q
310Q
411Q
111Q
211Q
311Q
412Q
112Q
21
2Q
312Q
413Q
113Q
213Q
313Q
414Q
114Q
214Q
3
US
D/t
on
ne
Bleached softwoodkraft pulp
Bleached hardwoodkraft pulp

Pulp sensitivity analysis 10% change in prices, impact on operational EBIT
22 October 2014 Stora Enso Q3 2014 Financial Results 31
* Impact on operational EBIT for the next twelve months. A decrease of pulp prices would have the opposite impact.
** Includes 550 000 tonnes from Montes del Plata
10% increase in Impact*
Hardwood pulp** prices Positive EUR 35 million
Softwood pulp prices Positive EUR 35 million
Fluff pulp prices Positive EUR 15 million
Dissolving pulp prices Positive EUR 10 million
Market pulp price, total Positive EUR 95 million

Pulp wood and saw log prices Wood prices in Finland
Source: METLA
32 Stora Enso Q3 2014 Financial Results 22 October 2014
0
10
20
30
40
50
60
70
80
06
Q1
06
Q2
06
Q3
06
Q4
07
Q1
07
Q2
07
Q3
07
Q4
08
Q1
08
Q2
08
Q3
08
Q4
09
Q1
09
Q2
09
Q3
09
Q4
10
Q1
10
Q2
10
Q3
10
Q4
11
Q1
11
Q2
11
Q3
11
Q4
12
Q1
12
Q2
12
Q3
12
Q4
13
Q1
13
Q2
13
Q3
13
Q4
14
Q1
14
Q2
14
Q3
EU
R/m
3
Pulpwood, Pine Sawlogs, Pine

0,0
40,0
80,0
120,0
160,0
200,00
7Q
1
07
Q3
08
Q1
08
Q3
09
Q1
09
Q3
10
Q1
10
Q3
11
Q1
11
Q3
12
Q1
12
Q3
13
Q1
13
Q3
14
Q1
14
Q3
EU
R/t
onn
e
Mixed OCC De-inking
Paper for recycling prices
Stora Enso Q3 2014 Financial Results 33
German RCP price development. free delivered
Source: Verband Deutscher Papierfabriken/Stora Enso
22 October 2014

MEUR
Other loans / liabilities Bonds Commercial paper
Revolving Credit Facility € 700 million matures in January 2017 and is fully undrawn
Maturity profile Q3 2014 (including joint arrangements according to IFRS11)
22 October 2014 Stora Enso Q3 2014 Financial Results 34
0
100
200
300
400
500
600
700
800
900
1 000
2014 2015 2016 2017 2018 2019 2020 2021-2035 2036

Energy balance* Q3 2014
22 October 2014 Stora Enso Q3 2014 Financial Results 35
Impact** on operating profit from
10% change in: EUR million p.a.
Electricity market price ~3
Fossil fuel price ~10
**) Remaining impact on non-hedged volume *) Pulp. paper and board mills. Europe and overseas

Stora Enso electricity procurement* Q3 2014
22 October 2014 Stora Enso Q3 2014 Financial Results 36
*) Pulp. paper and board mills. Europe and overseas
36