stratéole/vorcore—long-duration, superpressure balloons to
TRANSCRIPT
Stratéole/Vorcore—Long-duration, Superpressure Balloons to Study the AntarcticLower Stratosphere during the 2005 Winter
ALBERT HERTZOG,* PHILIPPE COCQUEREZ,� CLAUDE BASDEVANT,# GILLIAN BOCCARA,#
JÉRÔME BORDEREAU,# BERNARD BRIOIT,# ALAIN CARDONNE,@ RENÉ GUILBON,� ALAIN RAVISSOT,@
ÉRIC SCHMITT,@ JEAN-NOËL VALDIVIA,� STÉPHANIE VENEL,� AND FRANÇOIS VIAL#
*Laboratoire de Météorologie Dynamique, Université Pierre et Marie Curie, IPSL, CNRS, Palaiseau, France�Centre National d’Études Spatiales, Toulouse, France
#Laboratoire de Météorologie Dynamique, École Polytechnique, IPSL, CNRS, Palaiseau, France@Centre National d’Études Spatiales, Aire-sur-l’Adour, France
(Manuscript received 5 December 2006, in final form 4 April 2007)
ABSTRACT
In September and October 2005, the Stratéole/Vorcore campaign flew 27 superpressure balloons fromMcMurdo, Antarctica, into the stratospheric polar vortex. Long-duration flights were successfully achieved,16 of those flights lasting for more than 2 months. Most flights were terminated because they flew out of theauthorized flight domain or because of energy shortage in the gondola. The atmospheric pressure (1-Paprecision) was measured every minute during the flights, whereas air temperature observations (0.25-Kaccuracy) and balloon positions (absolute GPS observations, 10-m accuracy) were obtained every 15 min.Fifteen-minute-averaged horizontal velocities of the wind were deduced from the successive balloon posi-tions with a corresponding accuracy �0.1 m s�1. The collected dataset (more than 150 000 independentobservations) provides a thorough high-resolution sampling of the polar lower stratosphere in the SouthernHemisphere from its wintertime state up to the establishment of the summer circulation in December–January. Most of the balloons stayed inside the vortex until its final breakdown, although a few were ejectedtoward the midlatitudes in November during filamention events associated with an increase in planetarywave activity. The balloons behaved as quasi-Lagrangian tracers during the first part of the campaign(quiescent vortex) and after the vortex breakdown in early December. Large-amplitude mountain gravitywaves were detected over the Antarctic Peninsula and caused one flight termination associated with thesudden burst in the balloon superpressure.
1. Introduction
Shortly after the discovery of the Antarctic ozonehole by Farman et al. (1985), the dynamical isolation ofair parcels located well inside the stratospheric polar-night vortex was identified as a key factor in the pro-cesses that led to ozone depletion (McIntyre 1989).Since then, it has been acknowledged that besideschemistry, dynamics play a major role in determiningthe geographical structure, intensity, and variability ofthe ozone hole (e.g., WMO 2003, and referencestherein). In the late 1980s and beginning of the 1990s,however, the degree of isolation of air parcels located in
the inner vortex, as well as how they could eventuallybe transported to the midlatitude stratosphere and beirreversibly mixed there, was not fully understood. Inthis context, Vial et al. (1995) suggested that a set ofquasi-Lagrangian, balloonborne observations could bevery useful to document the dynamics and chemistry inthe otherwise poorly observed Southern Hemisphere(SH) polar stratosphere in winter.
This project, named Stratéole, consisted in launching200 superpressure balloons (SPBs) able to fly for a fewmonths at about 50 and 70 hPa in and around the polarvortex. Those balloons actually have the property tostay on constant-density (isopycnic) surfaces (e.g., Le-vanon et al. 1974), and thus to provide a good estimateof the motions of stratospheric air parcels that are isen-tropic to first order. In the 1960s–70s, a number of su-perpressure balloon flights already demonstrated thepotential interest of those devices for scientific pur-
Corresponding author address: A. Hertzog, Laboratoire deMétéorologie Dynamique, École Polytechnique, F-91128 Pal-aiseau CEDEX, France.E-mail: [email protected]
2048 J O U R N A L O F A T M O S P H E R I C A N D O C E A N I C T E C H N O L O G Y VOLUME 24
DOI: 10.1175/2007JTECHA948.1
© 2007 American Meteorological Society
JTECH2114

poses. For instance, the Global Horizontal SoundingTechnique (GHOST; 1966–70), Éole (1971–72), andGlobal Atmospheric Research Programme (GARP)-related Tropical Wind, Energy Conversion, and Refer-ence Level Experiment (TWERLE; 1975) campaignstogether flew hundreds of superpressure balloons in theSH upper troposphere (Lally et al. 1966; Morel andBandeen 1973; TWERLE Team 1977). Flight durationslonger than 3 months were frequently achieved. At thesame time, about 50 stratospheric flights of superpres-sure balloons (float level between 50 and 18 hPa) werealso performed (Angell 1972; Schumann 1980; Oliveroet al. 1984). Though the dataset gathered during thoseearly flights allowed the documenting of characteristicsof the atmospheric dynamics that were unaccessible tothe contemporary techniques, the lack of global com-munication and positioning systems significantly lim-ited the observation frequency and accuracy. The situ-ation changed in the 1980s, and Stratéole proposed tobenefit from the assets of global-scale superpressureballoon flights and from modern, satelliteborne com-munication and positioning systems to provide an un-precedented in situ sampling of the polar stratosphere.
However, the project had to cope with a number oflogistic and technological difficulties, and in the late1990s it was decided to split Stratéole into two separatephases: the first one, called Vorcore, was devoted to thestudy of the vortex core and needed a few tens of bal-loons only. After several years of development and testcampaigns, the Vorcore campaign finally took place inMcMurdo, Antarctica, in August–October 2005. Theoriginal scientific objectives were refined in light of ourcurrent knowledge of the ozone hole, but the techno-logical preparatory campaigns confirmed that the origi-nality of the Vorcore observing system could providenew insights into stratospheric dynamics (Vial et al.2001; Hertzog and Vial 2001; Hertzog et al. 2002b).More specifically, the Vorcore goals now include thestudy of gravity wave activity in the SH high latitudes, thecharacterization of the dispersion regime inside the vortexcore, the quantification of ozone depletion rates in spring,and the assessment of the operational analysis accuracy.
This paper is aimed at presenting the observing sys-tem used during Vorcore, as well as the main featuresof the observation set that has been collected during thecampaign. It is organized as follows. Section 2 describesthe Vorcore balloons and briefly reviews their physics.The scientific and technological observations per-formed by the payload are also presented in this sec-tion. Section 3 is devoted to the campaign itself. It givesdetails on the flight configuration used during Vorcore,the set of flights performed during the campaign, andthe various events that caused their terminations. Sec-
tion 4 reviews more precisely the Vorcore dataset. Inparticular, the geographical distribution of the observa-tions and the balloon behavior in the stratospheric floware emphasized. The last section is devoted to the pre-sentation of foreseen developments for long-durationsuperpressure balloon flights and to their possible im-plications for the study of the stratosphere.
2. Observation technique
a. Superpressure balloons
1) BALLOON CHARACTERISTICS AND LAUNCHING
TECHNIQUE
The balloons used during Vorcore are helium filledand have a spherical-shaped, closed envelope. Al-though their design mainly relies on the main charac-teristics of the balloons used in the successful 1970s–80sexperiments, a dedicated development program hadnevertheless been necessary in order to extend the mis-sion capability to winter polar flights and to improvethe balloon reliability (Cocquerez et al. 2001). In par-ticular, the envelopes were made of a trilaminate poly-ester/polyamide film especially designed for the experi-ment. This film provides high stiffness in flight condi-tions and is flexible enough at room temperature formanufacturing and packaging. The film stiffness wasone of the key design requirements, since it ensures thatthe balloon volume will stay constant during the flight,even though the helium overpressure inside the balloonmay vary (see, e.g., Fig. 1). The film also provides theneeded levels of strength and gas tightness for achiev-ing long-duration flights.
To sample two density levels in the stratosphere(roughly corresponding to the 50- and 70-hPa pressuresurfaces), two balloon sizes were developed: 10- and8.5-m diameter. This solution was preferred to usingonly 10-m balloons with some ballast in order to fly ata lower level, since this would have induced more strin-gent requirements on the gas tightness of the envelopes.
A new concept for suspending the payload to theenvelope was developed. Whereas the Éole payloadswere attached to the balloons with the help of a net, themajor feature of this new system was to distribute theloads induced by the payload only at the bottom of theenvelope.
Finally, the development program also focused onredefining the classical techniques for launching super-pressure balloons. This last point was needed to suc-cessfully perform launches in the severe polar surfaceconditions in winter and early spring. In particular, aspecial effort was devoted to avoiding the need forlarge and costly dedicated ground infrastructures.
DECEMBER 2007 H E R T Z O G E T A L . 2049
Namely, the balloons are now inflated while lying on an18-m-long table that can easily be moved from thepreparation building to the launchpad when the meanwind velocity is forecast to stay below 4 m s�1 for morethan 30 min. The inflation operations are performedoutside, which allows the use of a small-height building(see Fig. 5). An inflation bench, based on a sonic-nozzleflowmeter, was also specially designed to work at verylow temperatures.
2) BALLOON PHYSICS
One of the most critical parameters when flying su-perpressure balloons is to carefully determine the massof lifting gas that fills the balloon. The gas amount ac-tually controls the superpressure in the balloon, andone has to avoid both an excess of superpressure thatwould cause the balloon to burst and a vanishing su-perpressure that may destabilize the balloon. The maxi-mum superpressure that the balloon can bear is theo-retically computed from the mechanical properties ofthe envelope film and from a stress analysis. But theactual gas pressure during the flight (or, equivalently,the gas temperature once the balloon volume and gasamount are known) results from a complex radiative–convective equilibrium between the gas, the balloon
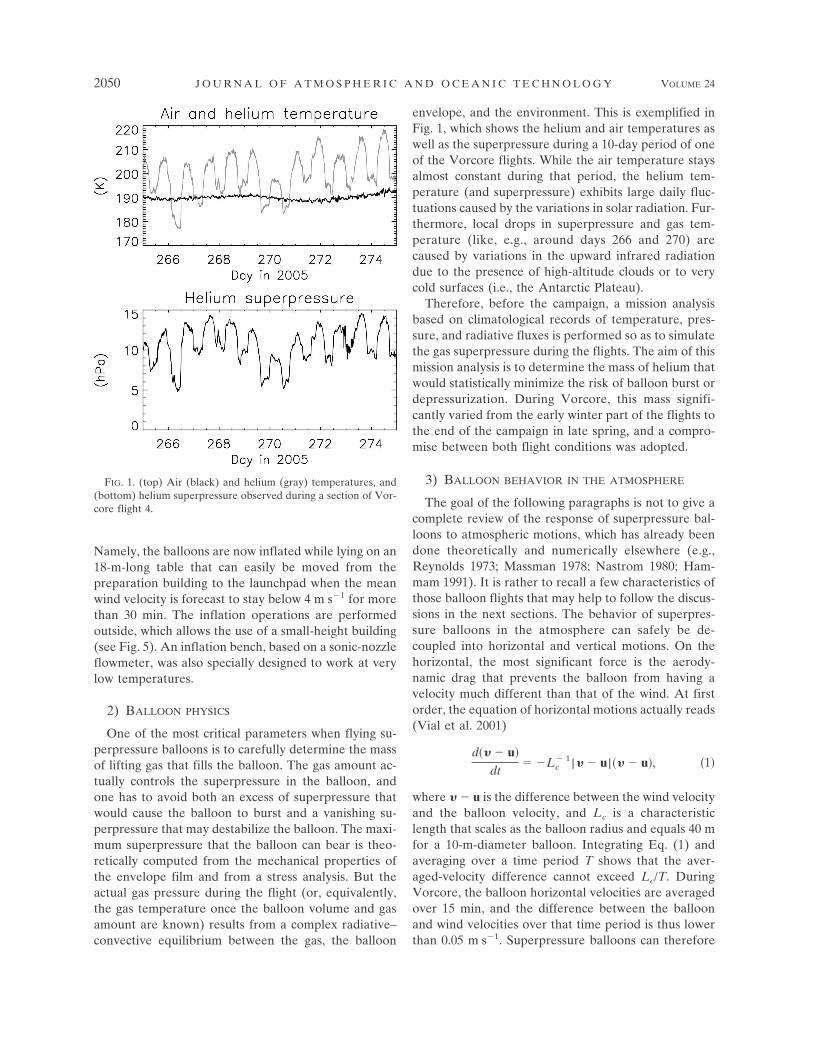
envelope, and the environment. This is exemplified inFig. 1, which shows the helium and air temperatures aswell as the superpressure during a 10-day period of oneof the Vorcore flights. While the air temperature staysalmost constant during that period, the helium tem-perature (and superpressure) exhibits large daily fluc-tuations caused by the variations in solar radiation. Fur-thermore, local drops in superpressure and gas tem-perature (like, e.g., around days 266 and 270) arecaused by variations in the upward infrared radiationdue to the presence of high-altitude clouds or to verycold surfaces (i.e., the Antarctic Plateau).
Therefore, before the campaign, a mission analysisbased on climatological records of temperature, pres-sure, and radiative fluxes is performed so as to simulatethe gas superpressure during the flights. The aim of thismission analysis is to determine the mass of helium thatwould statistically minimize the risk of balloon burst ordepressurization. During Vorcore, this mass signifi-cantly varied from the early winter part of the flights tothe end of the campaign in late spring, and a compro-mise between both flight conditions was adopted.
3) BALLOON BEHAVIOR IN THE ATMOSPHERE
The goal of the following paragraphs is not to give acomplete review of the response of superpressure bal-loons to atmospheric motions, which has already beendone theoretically and numerically elsewhere (e.g.,Reynolds 1973; Massman 1978; Nastrom 1980; Ham-mam 1991). It is rather to recall a few characteristics ofthose balloon flights that may help to follow the discus-sions in the next sections. The behavior of superpres-sure balloons in the atmosphere can safely be de-coupled into horizontal and vertical motions. On thehorizontal, the most significant force is the aerody-namic drag that prevents the balloon from having avelocity much different than that of the wind. At firstorder, the equation of horizontal motions actually reads(Vial et al. 2001)
d�� � u�
dt� �Lc
� 1 |� � u |�� � u�, �1�
where � � u is the difference between the wind velocityand the balloon velocity, and Lc is a characteristiclength that scales as the balloon radius and equals 40 mfor a 10-m-diameter balloon. Integrating Eq. (1) andaveraging over a time period T shows that the aver-aged-velocity difference cannot exceed Lc/T. DuringVorcore, the balloon horizontal velocities are averagedover 15 min, and the difference between the balloonand wind velocities over that time period is thus lowerthan 0.05 m s�1. Superpressure balloons can therefore
FIG. 1. (top) Air (black) and helium (gray) temperatures, and(bottom) helium superpressure observed during a section of Vor-core flight 4.
2050 J O U R N A L O F A T M O S P H E R I C A N D O C E A N I C T E C H N O L O G Y VOLUME 24

be considered very accurate tracers of horizontal mo-tions.
In contrast, superpressure balloons cannot follow thevertical motions of air parcels: while the balloons havea constant volume (and thus are constrained to stay onisopycnic surfaces), air parcels undergo adiabatic varia-tions of their volume when moving upward or down-ward. The relative (vertical) displacement of isentropicand isopycnic surfaces therefore determines howLagrangian superpressure balloons are. For instance,let us consider the response of both surfaces to a localincrease in temperature �T. The associated increase inpotential temperature reads
�� ���
�T�T �2�
and the corresponding vertical displacement of theisentrope is
��� ���
d�
dz
�
��
�T
d�
dz
�T. �3�
Similarly, the vertical displacement of the isopycnic sur-face induced by this temperature increase reads
��� �
��
�T
d�
dz
�T. �4�
Hence, the ratio of both displacements is obtained as
r ����
���
�
��
�T
d�
dz
d�
dz
��
�T
. �5�
Typical values relevant for the Vorcore campaign (i.e.,pressure: 60 hPa, temperature: 200 K, and Brunt–Väisälä frequency: 2 10�2 rad s�1) lead to r � 4, and airparcels typically undergo vertical displacements 4 timesas large as those of the balloons.
Based on this simple calculus, Fig. 2 illustrates themotions of isentropic and isopycnic surfaces induced bya small-amplitude atmospheric wave. The disturbancesin potential temperature observed by the balloons canbe inferred from this figure: local coolings induce nega-tive potential temperature disturbances in the balloonobservations. The air parcels, on the other hand, evolveadiabatically and there are obviously no Lagrangianvariations in potential temperature. The horizontal axisin Fig. 2 could also be the time in which case the figure
grossly illustrates the annual cycle of stratospheric tem-perature at high latitudes. In winter, the temperaturesare lower than the annual mean, and the transition fromwinter to summer is associated with an increase of po-tential temperatures in the balloon data.
A more complete calculation would, of course, con-sider the response of isopycnic and isentropic surfacesto pressure disturbances as well. On the one hand, at-mospheric waves induce relative pressure disturbancesthat are one order of magnitude smaller than relativetemperature disturbances. On the other hand, applyingthe same argument as above to a localized pressuredisturbance shows that in that case both surfaces un-dergo almost similar displacements. The previous cal-culation and Fig. 2 therefore retain the essence of bal-loon motions with respect to those of air parcels.
b. Payload
The gondola (named Rumba) used during Vorcoreperforms the scientific and housekeeping observations,and checks that the balloon flight is safe. The gondolawas designed to work in the very cold conditions metduring Vorcore (air temperature lower than �90°C), soa 10-cm-thick polystyrene coating isolates the electron-ics from the environment. Furthermore, the electronics
FIG. 2. Sketch of the relative displacement of isentropic surfaces(dashed) and isopycnic surfaces (solid) induced by an atmosphericwave (or by the annual cycle of stratospheric temperatures).Three isentropic surfaces (with �1 �2 �3) are displayed. Su-perpressure balloons drift on isopycnic surfaces and “see” higher(lower) potential temperatures where the local Eulerian tempera-ture disturbance is positive (negative). A horizontal dotted line isshown for reference.
DECEMBER 2007 H E R T Z O G E T A L . 2051

is heated during daytime through a resistor powered bysolar generators. The electronics and sensors are pow-ered by nonrechargeable batteries. The energy set wasdesigned to allow 3-month flights, although the gondolaconsumption may slightly vary from one flight to theother. The gondola mass, including the coating, the bat-teries, the sensors devoted to atmospheric observations,as well as the straps for the mechanical connection withthe flight train, is �10 kg.
With the exception of atmospheric pressure, which ismeasured every minute, all the other observations areperformed every 15 min. The data are stored for 24 h inthe gondola and sent to the ground via the satellite-borne Argos communication system. The communica-tion bandwidth provided by Argos is very small (typi-cally 30 Kb day�1) and determines the sampling fre-quency. The various sensors used during Vorcore, aswell as the processing performed to compensate forpotential sensor biases, are now described.
1) PRESSURE
The barometer on board the Rumba gondola is aParoscientific analog pressure transducer (model 216B)with an accuracy of 10 Pa and a precision of 1 Pa. Thebarometer, which is located inside the gondola, is com-pensated in temperature down to �54°C. Tempera-tures inside the gondolas were very rarely colder than�54°C, and hence no further laboratory calibration ofthe barometers was needed.
The pressure is used to monitor the balloon verti-cal motions in the atmosphere. At the balloon flightlevel (i.e., atmospheric density �0.1 kg m�3), the 1-Paprecision corresponds to a vertical position precisionof 1 m.
2) HORIZONTAL POSITION AND WIND VELOCITIES
The balloon horizontal positions are obtained by ab-solute GPS measurements, with an accuracy of 15 m.With the exception of a few hour-long flight segmentsat the beginning of the campaign where the tempera-tures inside the gondolas were very cold, GPS fixeswere nominally obtained during the flights.
The horizontal wind velocities are deduced from thesuccessive GPS positions by centered finite differences.Since positions are recorded every 15 min, the accuracyon the 15-min-averaged balloon horizontal velocities is0.02 m s�1. As shown previously, the difference be-tween the balloon and wind horizontal velocities cannotbe significantly larger than 0.05 m s�1 during that timeinterval. Estimates of the 15-min-averaged horizontalwind velocities are thus obtained with an accuracy bet-ter than 0.1 m s�1.
3) TEMPERATURE
The air temperature is measured by two indepen-dent, 120-m-diameter microbead YSI thermistors thathang 5 m below the gondola. The thermistors are cali-brated in the laboratory with respect to a standardPt100 platine probe down to �80°C. To minimize thedaytime radiative heating of the thermistor and its en-vironment, thermistors are aluminized and mounted onsmall transparent glass plates (Fourrier et al. 1970).
The accurate measure of temperature on superpres-sure balloon flights is, however, particularly difficult: incontrast to classical radiosoundings that continuouslyascend in the atmosphere, superpressure balloons movewith the wind, and the temperature sensors are poorlyventilated. It has thus been observed that Rumba tem-perature measurements are warm biased during theday. This is exemplified in Fig. 3, which shows the tem-perature measurement bias versus solar zenith angles(SZAs) for one of the Vorcore flights. As detailed inHertzog et al. (2004), that curve is obtained empiricallyby first computing the derivative of the temperaturebias with respect to SZA and then integrating it. In thecase of the Vorcore campaign, most of the observationswere made at high SZAs, and the temperature biasestimates are therefore more accurate at those solarangles.
Figure 3 clearly shows that temperature observationsare warmer during day than during night since no di-urnal cycle with such an amplitude is expected in thelower stratosphere. The daytime bias may slightly varyfrom one thermistor to the other due to the proximityof the microbead with the glass plate or to the amountof metal deposited on the plate for the electrical con-
FIG. 3. Bias of temperature measurements (crosses) for one ofthe Vorcore flights (flight 13): first thermistor (black) and secondthermistor (gray). Corrections subtracted from the raw tempera-ture records (solid lines).
2052 J O U R N A L O F A T M O S P H E R I C A N D O C E A N I C T E C H N O L O G Y VOLUME 24

nection between the thermistor and the gondola. How-ever, most of the thermistors exhibit a �1.5-K bias atlow SZAs. An exponential is used to fit the daytimebias of each thermistor and then substracted from theraw temperature measurements.
After correction, the accuracy of temperature mea-surements, which can be estimated with the two inde-pendent temperature measurements performed oneach flight, is found to be 0.25 K during the night and0.3 K during the day. The temperature accuracy can befurther improved by a factor �2 by taking the mean ofboth thermistor measurements.
4) HOUSEKEEPING PARAMETERS
Apart from the previous measurements that are in-tended for scientific use, Rumba also performs house-keeping observations. In brief, the balloon superpres-sure and gas temperature are measured by a Honeywellpressure tranducer and a 240-m-diameter YSI ther-mistor, with respective accuracies of 10 Pa and 0.5 K.The gondola internal temperature, as well as the bat-tery voltage, is also monitored during the flight.
3. Vorcore experiment
a. Flight safety and configuration
The flight configuration used during Vorcore isshown in Fig. 4. The thermistors are at the bottom ofthe flight train to avoid the balloon wake. A radarreflector and a flash lamp are used to signalize the flighttrain when it crosses the airplane space during theascent and final descent. The end of the flight can beautomatically commanded by the gondola as soonas one of the following safety criteria is no longermet:
• flight domain: the balloon must stay south of 40°S,• altitude: the balloon has to fly above 100 hPa,• energy: the battery voltage has to be higher than a
predetermined threshold,• flight length: a maximum lifetime of 110 days is al-
lowed.
In that case, the flight train is separated from theballoon and descends with a parachute. The unbal-lasted balloon rapidly ascends and explodes because ofthe superpressure increase. The flight domain and alti-tude limitations have been imposed to minimize theprobability of flying above populated areas or throughairplane corridors. Finally, a secondary redundant de-vice located just above the parachute is also able to
check the altitude and flight length criteria and to com-mand the flight termination.
b. Balloon campaign
The Vorcore campaign took place in McMurdo, Ant-arctica. McMurdo is actually the only Antarctic basissouth of 60°S that can be reached during winter andthat provides sufficient logistic capabilities to supportsuch a large balloon campaign. The launching site(77.85°S, 166.65°E) was located on the sea ice, 300 m infront of the main station, in order to be as much pro-tected as possible from the prevailing southeasterly sur-face winds that descend from the Antarctic Plateau andcirculate around Ross Island. Figure 5 shows thelaunchpad that consisted of two 25-m-long, semicylin-drical “Jamesways” in which the balloons were pre-pared before launch, two power generators, a few con-tainers, and a regularly desnowed, 100 m � 100 msquared area for the launches.
The first launch took place on 5 September and thelast one on 28 October. A total of 27 launches were
FIG. 4. The flight train configuration during Vorcore.
DECEMBER 2007 H E R T Z O G E T A L . 2053

performed during this period. The weather limitations,imposed so as to minimize the risk of damaging theballoon during the final operational phases (i.e., meansurface–wind velocity smaller than 4 m s�1 and gustssmaller than 6 m s�1), somewhat limited the number oflaunch opportunities. However, windows long enoughto launch the balloons were found on average 66%of the days in September and October. Two con-secutive launches were even performed on seven oc-casions when calm surface conditions lasted for morethan 3 h.
Details on the 27 flights are given in Table 1. Themean flight duration achieved during the campaign isabout 2 months (58.5 days), while the longest flight(flight 8) lasted 109 days. Gondolas running out of en-ergy or balloons crossing the flight-domain boundarywere the two main causes of flight terminations. Pre-mature ends of the flights were otherwise principallycaused by leaking balloon envelops (3 flights), balloonbursts due to a weakness of the envelops (2 flights), andballoon bursts due to atmospheric gravity waves withdramatic amplitudes (2 flights), as shown below.
Figure 6 shows the number of balloons in flight ver-sus time. The launching period extended from the be-ginning of September to the end of October 2005, atwhich point a maximum of 21 balloons in flight wasreached. In December 2005, this number rapidly felldue to the progressive breakdown of the stratosphericvortex that pushed the balloons toward the limits of theflight domain. Each balloon/gondola typically performs
100 observations per day, so that a total of 150 743observations were finally gathered during the cam-paign.
c. Complementary observations
Complementary observations associated with theVorcore campaign have been performed in severalAntarctic stations to complement the balloon observa-tions. In particular, an emphasis has been put on ozoneobservations since no such observations are performedby the Vorcore gondola. To this end, ozone sondeswere launched on alert in Davis (68.58°S, 77.97°E), Ma-rambio (64.24°S, 56.66°W), McMurdo, and Neumayer(70.65°S, 8.25°W) when superpressure balloons wereflying close by. The balloon trajectories in conjunctionwith the ozone profiles will help to study the ozonedepleting rates in the vortex core.
Rayleigh lidar observations to document the pres-ence of polar stratospheric clouds were also performedin Davis, Dumont D’Urville (66.67°S, 140.01°E), andMcMurdo. Finally, on several occasions when Vorcoreballoons were launched from or were flying above Mc-Murdo, a high-resolution vertical profile of aerosol wasobtained by the University of Wyoming aerosol counter(Deshler et al. 2003). These aerosol data will be usedwith the parcel-based history of air temperature pro-vided by superpressure balloons to assess our under-standing of microphysical processes in the polar strato-sphere.
FIG. 5. A 10-m superpressure balloon just after launch. The Vorcore launchpad, with thetwo dark Jamesways used as preparation buildings, was located 300 m in front of McMurdoon the sea ice.
2054 J O U R N A L O F A T M O S P H E R I C A N D O C E A N I C T E C H N O L O G Y VOLUME 24

4. Some characteristics of the Vorcore dataset
a. Geographical sampling
Figure 7 shows the geographical distribution of theVorcore observations. Because of the nonstationarityof the stratospheric flow and the long duration of theflights, the balloon flotilla thoroughly sampled thewhole Antarctic continent and the ocean up to 55°S.
Note also that the cloud of observations is slightly dis-placed toward the Atlantic Ocean due to the preferredposition of the 2005 vortex.
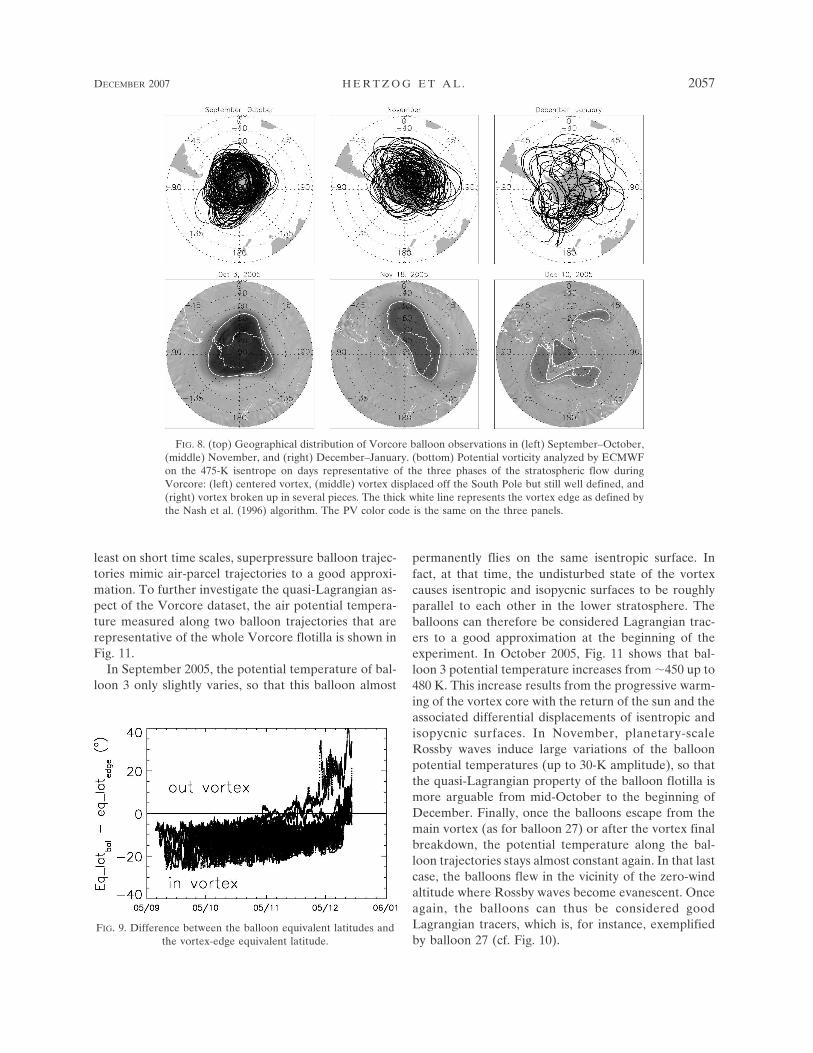
This apparently almost homogeneous sampling nev-ertheless hides varying geographical features of the ob-servation set associated with the evolution of the strato-spheric vortex in the 2005 winter and spring. Thosefeatures can be roughly divided into three periods, asshown in Fig. 8. At the beginning of the campaign (Sep-tember–October), the stratospheric vortex was verystable and the flow was almost symmetric about thePole. The observations performed during this periodare associated with almost circular trajectories aroundthe vortex center. In November, the vortex began to bestretched and displaced off the Pole by planetary waveswith increasing amplitudes, and the sampling of thestratosphere slightly extends to the midlatitudes. Dur-ing this month, the vortex center was most of the timelocated either in the Atlantic or in the western Indiansector of Antarctica, so that the balloons only occasion-ally flew above the Antarctica Pacific sector. Finally, inDecember and at the beginning of 2006, the strato-spheric vortex broke into several pieces and most of theremaining balloons were ejected toward midlatitudeswhere some eventually crossed the 40°S parallel.
FIG. 6. Number of balloons in flight during the Vorcorecampaign (September 2005–February 2006).
TABLE 1. Summary of Vorcore flights. Flights associated with the same Greek letter were launched consecutively.
Flight No. Launch End Duration (day) Balloon diameter (m) Reason for flight termination
1 5 Sep 2005 11 Sep 2005 6 10 Leaking balloon2 6 Sep 2005 6 Dec 2005 90 10 Energy3 9 Sep 2005 5 Dec 2005 86 10 Energy4 9 Sep 2005 6 Nov 2005 57 8.5 Flight domain5 12 Sep 2005 27 Sep 2005 15 8.5 Leaking balloon6� 17 Sep 2005 17 Sep 2005 0 10 Incident on flight train7� 17 Sep 2005 18 Dec 2005 91 10 Flight domain8 20 Sep 2005 7 Jan 2006 109 8.5 Flight domain9� 22 Sep 2005 24 Sep 2005 2 8.5 Balloon burst
10� 22 Sep 2005 17 Dec 2005 87 10 Flight domain11 23 Sep 2005 26 Dec 2005 95 8.5 Energy12 23 Sep 2005 8 Oct 2005 13 10 Mountain wave13 26 Sep 2005 13 Dec 2005 79 8.5 Energy14 28 Sep 2005 26 Dec 2005 89 10 Energy15 4 Oct 2005 7 Dec 2005 64 10 Communication lost16 5 Oct 2005 5 Jan 2006 93 8.5 Energy17� 5 Oct 2005 2 Nov 2005 28 10 Leaking balloon18� 6 Oct 2005 20 Dec 2005 75 10 Flight domain19� 14 Oct 2005 14 Jan 2006 93 10 Energy20� 14 Oct 2005 30 Oct 2005 16 10 Mountain wave21 14 Oct 2005 14 Oct 2005 0 8.5 Balloon burst22 16 Oct 2005 23 Dec 205 68 10 Flight domain23 18 Oct 2005 24 Dec 2005 66 10 Flight domain24� 25 Oct 2005 27 Jan 2006 94 10 Energy25� 25 Oct 2005 15 Dec 2005 51 10 Flight domain26� 28 Oct 2005 15 Nov 2005 17 10 Flight domain27� 28 Oct 2005 1 Feb 2006 96 10 Energy
DECEMBER 2007 H E R T Z O G E T A L . 2055

Thanks to the long flight duration achieved duringthe campaign, the Vorcore balloon flotilla thereforedocumented the 2005 SH stratospheric vortex from itsvery stable winter state up to its total breakdown inearly December.
b. Observations with respect to the stratosphericvortex
To monitor the positions of the balloons with respectto the vortex, the equivalent latitude of each observa-tion has been computed. The equivalent latitude is thelatitude of the parallel that encircles the same polar-caparea as the potential vorticity (PV) contour that passesby the balloon position. The 90° equivalent latitudethus corresponds to the point with the lowest PV in theSouthern Hemisphere vortex (the vortex center), whilelower equivalent latitudes correspond to midlatitudeair. The vortex edge is associated with a strong hori-zontal PV gradient on an isentropic surface (McIntyreand Palmer 1984), and is therefore computed as theextremum of the first derivative of PV with respect toequivalent latitude (Nash et al. 1996). Here, we usedthe PV fields provided by the European Centre forMedium-Range Weather Forecasts (ECMWF) opera-tional analyses on 60 vertical levels at 0.5° � 0.5° hori-zontal resolution.
The differences between the balloon equivalent lati-tudes and the vortex-edge equivalent latitude are
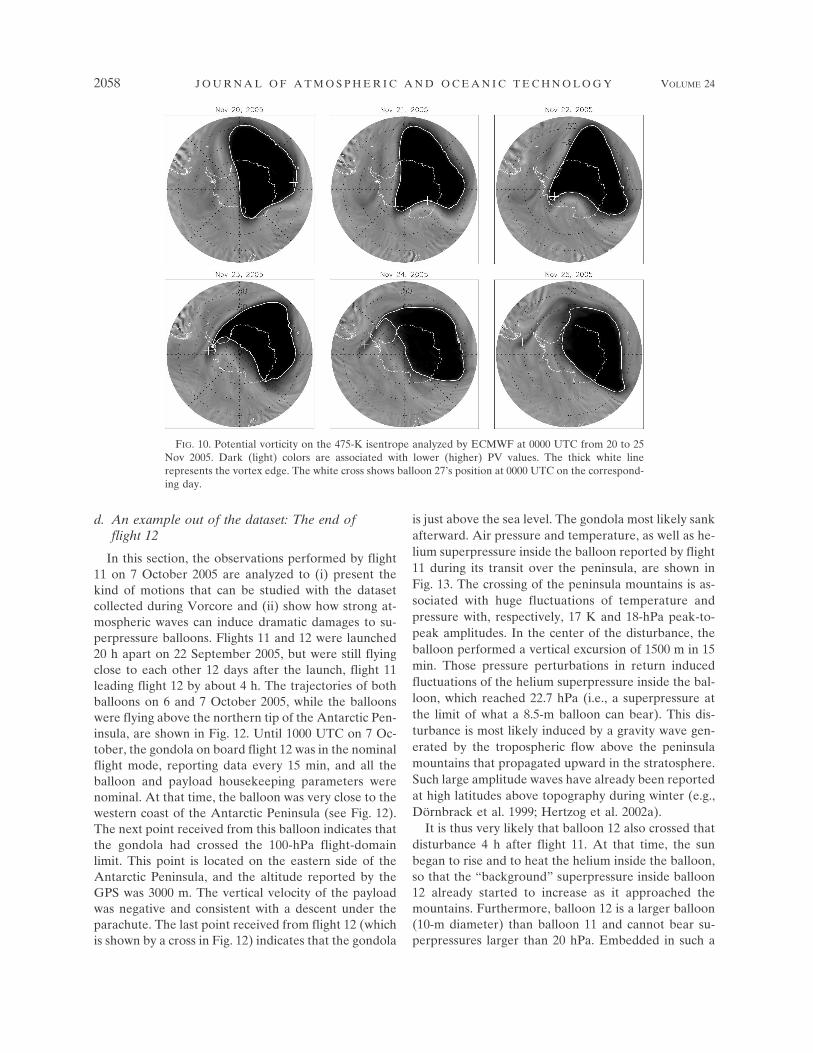
shown in Fig. 9. As mentioned in the introduction, theaim of the Vorcore campaign was primarily to docu-ment the small to mesoscale dynamics in the core of thepolar stratospheric vortex. Launches were conse-quently restricted to time periods when the vortex waslocated above the McMurdo station, and the ballooninitial positions are located inside the vortex. As goodtracers of air parcel motions, the superpressure bal-loons did not cross the dynamical barrier associatedwith the vortex edge during the first two months of thecampaign. From October on, nevertheless, the progres-sive shift of the Vorcore observations toward the vortexedge reflects the regular shrinking of the vortex areathat usually occurs in spring. In December, as shown inFig. 8, the vortex splits in several pieces and finallydisappears. At that time, a number of balloons are stilllocated inside the remaining low-PV regions, and theVorcore observations sample both sides of the vanish-ing vortices. However, some of the balloons escapedthe vortex as soon as mid-November (i.e., much beforethe vortex breakdown). This was the case of balloon 27,whose positions between 20 and 27 November arereported in Fig. 10. This balloon, which was locatedclose to the vortex edge at the beginning of the period,was embedded in a PV filament that was ultimatelyejected from the main vortex. Those kinds of vortexerosion events are responsible for most of the ex-change of air masses between the stratospheric vortexand the “surf zone” and are caused by breakingplanetary-scale Rossby waves (McIntyre and Palmer1983; Waugh et al. 1994; Koh and Plumb 2000;Moustaoui et al. 2003). After 23 November, balloon 27,though outside of the vortex, was still drifting in an airmass with a PV value lower than its surrounding, mid-latitude air, and which is furthermore connected by athin filament to the main vortex. During this periodtherefore, the balloon stayed in the air mass ejectedfrom the vortex and thus achieved a Lagrangian sam-pling of the atmosphere. This quasi-Lagrangian aspectof superpressure balloon flights is further discussed inthe next section.
c. Quasi-Lagrangian observations
Superpressure balloons do not drift on isentropicsurfaces and as such are not perfect tracers of airmasses in the stratosphere. Note, however, that al-though diabatic heating rates are quite low in thestratosphere (typically on the order of 1 K day�1), theycannot be neglected on time scales corresponding tolong-duration flights, so that even a pure isentropic bal-loon would not be a perfect tracer of air motion. Theabove example of balloon 27 nevertheless shows that at
FIG. 7. Geographical distribution of Vorcore balloon observa-tions. The flight domain was limited to latitudes southward of40°S.
2056 J O U R N A L O F A T M O S P H E R I C A N D O C E A N I C T E C H N O L O G Y VOLUME 24
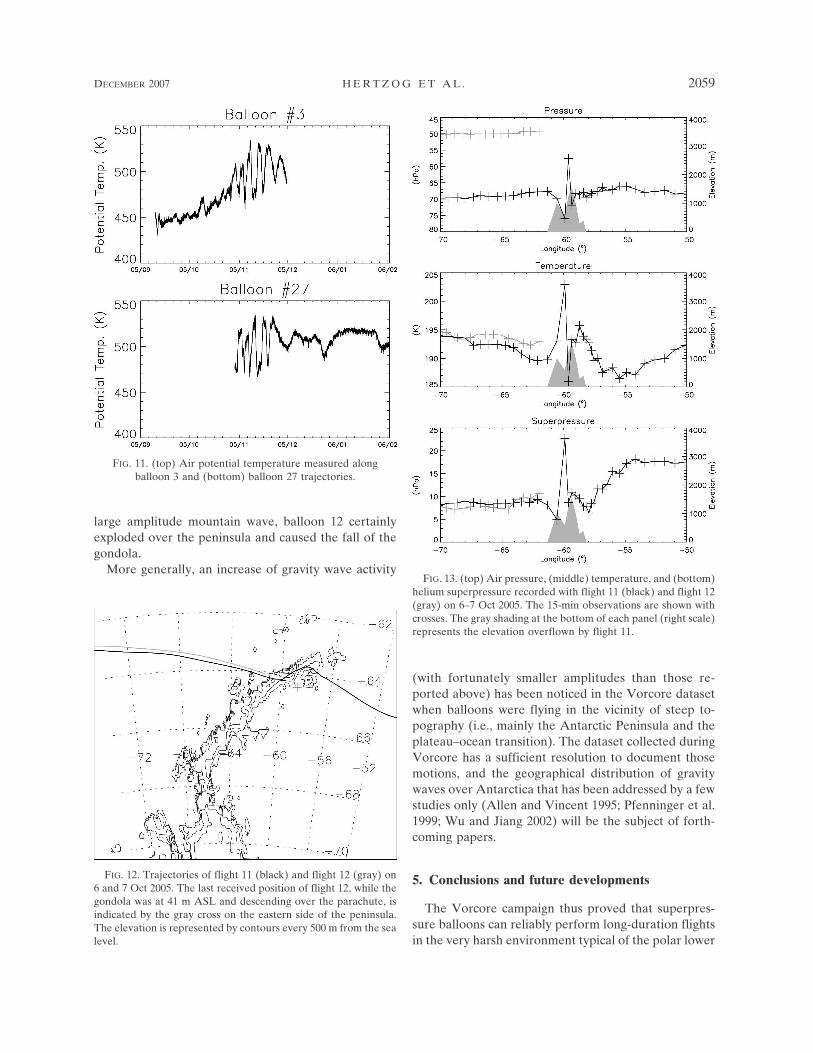
least on short time scales, superpressure balloon trajec-tories mimic air-parcel trajectories to a good approxi-mation. To further investigate the quasi-Lagrangian as-pect of the Vorcore dataset, the air potential tempera-ture measured along two balloon trajectories that arerepresentative of the whole Vorcore flotilla is shown inFig. 11.
In September 2005, the potential temperature of bal-loon 3 only slightly varies, so that this balloon almost
permanently flies on the same isentropic surface. Infact, at that time, the undisturbed state of the vortexcauses isentropic and isopycnic surfaces to be roughlyparallel to each other in the lower stratosphere. Theballoons can therefore be considered Lagrangian trac-ers to a good approximation at the beginning of theexperiment. In October 2005, Fig. 11 shows that bal-loon 3 potential temperature increases from �450 up to480 K. This increase results from the progressive warm-ing of the vortex core with the return of the sun and theassociated differential displacements of isentropic andisopycnic surfaces. In November, planetary-scaleRossby waves induce large variations of the balloonpotential temperatures (up to 30-K amplitude), so thatthe quasi-Lagrangian property of the balloon flotilla ismore arguable from mid-October to the beginning ofDecember. Finally, once the balloons escape from themain vortex (as for balloon 27) or after the vortex finalbreakdown, the potential temperature along the bal-loon trajectories stays almost constant again. In that lastcase, the balloons flew in the vicinity of the zero-windaltitude where Rossby waves become evanescent. Onceagain, the balloons can thus be considered goodLagrangian tracers, which is, for instance, exemplifiedby balloon 27 (cf. Fig. 10).
FIG. 8. (top) Geographical distribution of Vorcore balloon observations in (left) September–October,(middle) November, and (right) December–January. (bottom) Potential vorticity analyzed by ECMWFon the 475-K isentrope on days representative of the three phases of the stratospheric flow duringVorcore: (left) centered vortex, (middle) vortex displaced off the South Pole but still well defined, and(right) vortex broken up in several pieces. The thick white line represents the vortex edge as defined bythe Nash et al. (1996) algorithm. The PV color code is the same on the three panels.
FIG. 9. Difference between the balloon equivalent latitudes andthe vortex-edge equivalent latitude.
DECEMBER 2007 H E R T Z O G E T A L . 2057
d. An example out of the dataset: The end offlight 12
In this section, the observations performed by flight11 on 7 October 2005 are analyzed to (i) present thekind of motions that can be studied with the datasetcollected during Vorcore and (ii) show how strong at-mospheric waves can induce dramatic damages to su-perpressure balloons. Flights 11 and 12 were launched20 h apart on 22 September 2005, but were still flyingclose to each other 12 days after the launch, flight 11leading flight 12 by about 4 h. The trajectories of bothballoons on 6 and 7 October 2005, while the balloonswere flying above the northern tip of the Antarctic Pen-insula, are shown in Fig. 12. Until 1000 UTC on 7 Oc-tober, the gondola on board flight 12 was in the nominalflight mode, reporting data every 15 min, and all theballoon and payload housekeeping parameters werenominal. At that time, the balloon was very close to thewestern coast of the Antarctic Peninsula (see Fig. 12).The next point received from this balloon indicates thatthe gondola had crossed the 100-hPa flight-domainlimit. This point is located on the eastern side of theAntarctic Peninsula, and the altitude reported by theGPS was 3000 m. The vertical velocity of the payloadwas negative and consistent with a descent under theparachute. The last point received from flight 12 (whichis shown by a cross in Fig. 12) indicates that the gondola
is just above the sea level. The gondola most likely sankafterward. Air pressure and temperature, as well as he-lium superpressure inside the balloon reported by flight11 during its transit over the peninsula, are shown inFig. 13. The crossing of the peninsula mountains is as-sociated with huge fluctuations of temperature andpressure with, respectively, 17 K and 18-hPa peak-to-peak amplitudes. In the center of the disturbance, theballoon performed a vertical excursion of 1500 m in 15min. Those pressure perturbations in return inducedfluctuations of the helium superpressure inside the bal-loon, which reached 22.7 hPa (i.e., a superpressure atthe limit of what a 8.5-m balloon can bear). This dis-turbance is most likely induced by a gravity wave gen-erated by the tropospheric flow above the peninsulamountains that propagated upward in the stratosphere.Such large amplitude waves have already been reportedat high latitudes above topography during winter (e.g.,Dörnbrack et al. 1999; Hertzog et al. 2002a).
It is thus very likely that balloon 12 also crossed thatdisturbance 4 h after flight 11. At that time, the sunbegan to rise and to heat the helium inside the balloon,so that the “background” superpressure inside balloon12 already started to increase as it approached themountains. Furthermore, balloon 12 is a larger balloon(10-m diameter) than balloon 11 and cannot bear su-perpressures larger than 20 hPa. Embedded in such a
FIG. 10. Potential vorticity on the 475-K isentrope analyzed by ECMWF at 0000 UTC from 20 to 25Nov 2005. Dark (light) colors are associated with lower (higher) PV values. The thick white linerepresents the vortex edge. The white cross shows balloon 27’s position at 0000 UTC on the correspond-ing day.
2058 J O U R N A L O F A T M O S P H E R I C A N D O C E A N I C T E C H N O L O G Y VOLUME 24
large amplitude mountain wave, balloon 12 certainlyexploded over the peninsula and caused the fall of thegondola.
More generally, an increase of gravity wave activity
(with fortunately smaller amplitudes than those re-ported above) has been noticed in the Vorcore datasetwhen balloons were flying in the vicinity of steep to-pography (i.e., mainly the Antarctic Peninsula and theplateau–ocean transition). The dataset collected duringVorcore has a sufficient resolution to document thosemotions, and the geographical distribution of gravitywaves over Antarctica that has been addressed by a fewstudies only (Allen and Vincent 1995; Pfenninger et al.1999; Wu and Jiang 2002) will be the subject of forth-coming papers.
5. Conclusions and future developments
The Vorcore campaign thus proved that superpres-sure balloons can reliably perform long-duration flightsin the very harsh environment typical of the polar lower
FIG. 11. (top) Air potential temperature measured alongballoon 3 and (bottom) balloon 27 trajectories.
FIG. 12. Trajectories of flight 11 (black) and flight 12 (gray) on6 and 7 Oct 2005. The last received position of flight 12, while thegondola was at 41 m ASL and descending over the parachute, isindicated by the gray cross on the eastern side of the peninsula.The elevation is represented by contours every 500 m from the sealevel.
FIG. 13. (top) Air pressure, (middle) temperature, and (bottom)helium superpressure recorded with flight 11 (black) and flight 12(gray) on 6–7 Oct 2005. The 15-min observations are shown withcrosses. The gray shading at the bottom of each panel (right scale)represents the elevation overflown by flight 11.
DECEMBER 2007 H E R T Z O G E T A L . 2059

stratosphere in winter. A mean flight duration of al-most 2 months was achieved, and 16 flights out of 27were actually longer that 2 months. The balloons wereresponsible for only 25% of the flight termination. Fur-thermore, thanks to modern satelliteborne communica-tion and positioning systems, the dataset gathered dur-ing this campaign has typically the same size (and muchbetter accuracy) as those of the early 1970s campaigns,although Vorcore only flew 27 balloons versus, for ex-ample, 480 during Éole.
Vorcore has provided a very valuable scientificdataset, which is original in many respects. For in-stance, its high resolution and global sampling of theSH polar stratosphere will be very helpful to documentthe dynamics of that region, from the short-period grav-ity waves up to the long Rossby planetary waves. Be-sides, the Vorcore observations were performed in aquasi-Lagrangian framework, which is a unique featurethat is enabled by superpressure balloons. This charac-teristic is very useful to compute the momentum fluxcarried by gravity waves, and hence their potential forc-ing on the middle atmosphere (Hertzog and Vial 2001).With the help of ozone soundings performed along theballoon trajectories, the quasi-Lagrangian observationsmay also provide new insights on ozone depletion.
In the near future, several improvements of the ob-serving system will be addressed in order to furtherincrease its scientific interest. A higher sampling ratewill be enabled by the use of satellite phone communi-cations. New instruments aimed at measuring chemicalspecies (e.g., ozone, water vapor) or particles and spe-cially designed to bear the requirements of long-duration flights in the lower stratosphere are under de-velopment. In parallel, larger balloons (12-m diameter)able to carry heavier payloads (up to 40 kg) have al-ready been successfully tested during tropical flights in2006. Such new systems could be very useful to provideglobal-scale observations of still poorly sampled re-gions, such as, for instance, the equatorial lower strato-sphere.
Acknowledgments. The Vorcore team is much in-debted to R. Sadourny and H. Teitelbaum, who firstproposed Stratéole, and more generally to all the sci-entists who supported the project through the ages. Theauthors are also grateful to the French Space Agency(CNES) and the Institut National des Sciences del’Univers (INSU) for their longstanding support, and tothe CNES, Zodiac, and CNRS staff involved in theproject. The Vorcore campaign would not have beenpossible without the involvement of the NSF and of theFrench Polar Institute (IPEV). The whole NSF andRPSC teams in McMurdo are gratefully acknowledged
for their outstanding help during the campaign. TheVorcore team would also like to thank T. Deshler andhis team for their friendly support in McMurdo. Finally,the devotion of winter-over personnel who performedVorcore-related observations in several Antarctic sta-tions is gratefully acknowledged.
REFERENCES
Allen, S. J., and R. A. Vincent, 1995: Gravity wave activity in thelower atmosphere: Seasonal and latitudinal variations. J.Geophys. Res., 100, 1327–1350.
Angell, J. K., 1972: Air motions in the tropical stratosphere de-duced from satellite tracking of horizontally floating bal-loons. J. Atmos. Sci., 29, 570–582.
Cocquerez, P., P. Guigue, R. Guilbon, T. Phulpin, M. Durand,J.-P. Lefèvre, M. Eymard, and M. Lafourcade, 2001: Testflights of CNES stratospheric superpressure balloons in ex-perimental Arctic campaigns 2000–2001: Objectives and re-sults. Proc. 15th ESA Symp. on European Rocket and Bal-loon Programmes and Related Research, SP-471, Noordwijk,Netherlands, European Space Agency, 597–601.
Deshler, T., M. E. Hervig, D. J. Hofmann, J. M. Rosen, and J. B.Liley, 2003: Thirty years of in situ stratospheric aerosol sizedistribution measurements from Laramie, Wyoming (41°N),using balloon-borne instruments. J. Geophys. Res., 108, 4167,doi:10.1029/2002JD002514.
Dörnbrack, A., M. Leutbecher, R. Kivi, and E. Kyrö, 1999: Moun-tain-wave-induced record low stratospheric temperaturesabove northern Scandinavia. Tellus, 51A, 951–963.
Farman, J. C., B. G. Gardiner, and J. D. Shanklin, 1985: Largelosses of ozone in Antarctica. Nature, 315, 207–210.
Fourrier, J., P. Morel, and P. Sitbon, 1970: Ambient temperaturemeasurements from constant-level balloons. J. Appl. Meteor.,9, 154–157.
Hammam, A., 1991: Application des ballons à volume constant àl’étude de la basse atmosphère. Ph.D. thesis, Université PaulSabatier, 210 pp.
Hertzog, A., and F. Vial, 2001: A study of the dynamics of theequatorial lower stratosphere by use of ultra-long-durationballoons, 2: Gravity waves. J. Geophys. Res., 106, 22 745–22 762.
——, ——, A. Dörnbrack, S. D. Eckermann, B. M. Knudsen, andJ.-P. Pommereau, 2002a: In situ observations of gravity wavesand comparisons with numerical simulations during theSOLVE/THESEO 2000 campaign. J. Geophys. Res., 107,8292, doi:10.1029/2001JD001025.
——, ——, C. R. Mechoso, C. Basdevant, and P. Cocquerez,2002b: Quasi-Lagrangian measurements in the lower strato-sphere reveal an energy peak associated with near-inertialwaves. Geophys. Res. Lett., 29, 1229, doi:10.1029/2001GL014083.
——, C. Basdevant, F. Vial, and C. R. Mechoso, 2004: The accu-racy of stratospheric analyses in the Northern Hemisphereinferred from long-duration balloon flights. Quart. J. Roy.Meteor. Soc., 130, 607–626.
Koh, T.-Y., and A. Plumb, 2000: Lobe dynamics applied to baro-tropic Rossby-wave breaking. Phys. Fluids, 12, 1518–1528.
Lally, V. E., E. W. Lichfield, and S. B. Solot, 1966: The SouthernHemisphere GHOST experiment. WMO Bull., 15, 124–128.
Levanon, N., R. A. Oehlkers, S. D. Ellington, W. J. Massman, and
2060 J O U R N A L O F A T M O S P H E R I C A N D O C E A N I C T E C H N O L O G Y VOLUME 24

V. E. Suomi, 1974: On the behavior of superpressure bal-loons at 150 mb. J. Appl. Meteor., 13, 494–504.
Massman, W. J., 1978: On the nature of vertical oscillations ofconstant volume balloons. J. Appl. Meteor., 17, 1351–1356.
McIntyre, M. E., 1989: On the Antarctic ozone hole. J. Atmos.Terr. Phys., 51, 29–43.
——, and T. N. Palmer, 1983: Breaking planetary waves in thestratosphere. Nature, 305, 593–600.
——, and ——, 1984: The “surf zone” in the stratosphere. J. At-mos. Terr. Phys., 46, 825–849.
Morel, P., and W. Bandeen, 1973: The EOLE experiment: Earlyresults and current objectives. Bull. Amer. Meteor. Soc., 54,298–306.
Moustaoui, M., H. Teitelbaum, and F. P. J. Valero, 2003: Ozonelaminae inside the Antarctic vortex produced by polewardfilaments. Quart. J. Roy. Meteor. Soc., 129, 3121–3136.
Nash, E. R., P. A. Newman, J. E. Rosenfield, and M. R. Schoe-berl, 1996: An objective determination of the polar vortexusing Ertel’s potential vorticity. J. Geophys. Res., 101, 9471–9478.
Nastrom, G. D., 1980: The response of superpressure balloons togravity waves. J. Appl. Meteor., 19, 1013–1019.
Olivero, J. J., A. W. Shaw, P. R. Williamson, and L. R. Megill,1984: Mid-stratospheric circulations in the Southern Hemi-sphere from super pressure balloon trajectories. J. Geophys.Res., 89, 2595–2600.
Pfenninger, M., A. Z. Liu, G. C. Papen, and C. S. Gardner, 1999:Gravity wave characteristics in the lower atmosphere atSouth Pole. J. Geophys. Res., 104, 5963–5984.
Reynolds, R. D., 1973: Superpressure balloons as isentropic/isopycnic tracers. J. Appl. Meteor., 12, 369–373.
Schumann, A. P., 1980: Carrier balloon trajectories in the strato-sphere. J. Appl. Meteor., 19, 705–714.
The TWERLE Team, 1977: The TWERL Experiment. Bull.Amer. Meteor. Soc., 58, 936–948.
Vial, F., and Coauthors, 1995: STRATÉOLE: A project to studyAntarctic polar vortex dynamics and its impact on ozonechemistry. Phys. Chem. Earth, 20, 83–96.
——, A. Hertzog, C. R. Mechoso, C. Basdevant, P. Cocquerez, V.Dubourg, and F. Nouel, 2001: A study of the dynamics of theequatorial lower stratosphere by use of ultra-long-durationballoons, 1: Planetary scales. J. Geophys. Res., 106, 22 725–22 743.
Waugh, D. W., and Coauthors, 1994: Transport out of the lowerstratospheric Arctic vortex by Rossby wave breaking. J. Geo-phys. Res., 99, 1071–1088.
WMO, 2003: Scientific assessment of ozone depletion: 2002.WMO/Global Ozone Research and Monitoring Project Rep.47, 498 pp.
Wu, D. L., and J. H. Jiang, 2002: MLS observations of atmo-spheric gravity waves over Antarctica. J. Geophys. Res., 107,4773, doi:10.1029/2002JD002390.
DECEMBER 2007 H E R T Z O G E T A L . 2061