study on the deployment of c-its in europe: summary report - downloads/wg1-annex-2...study on the...
TRANSCRIPT

Study on the Deployment of C-ITS in Europe: Summary Report Framework Contract on Impact Assessment and Evaluation Studies in the Field of Transport МOVE/А3/119-2013-Lot № 5 "Horizontal" ___________________________________________________
Report for DG MOVE MOVE/C.3./№ 2014-794
ED 60721 | Issue Number 1 | Date 13/11/2015 Ricardo in Confidence
Study on the Deployment of C-ITS in Europe: Summary Report | i
Ricardo in Confidence Ref: Ricardo/ED60721/Issue Number 1
Ricardo Energy & Environment
Customer: Contact:
DG MOVE Nick Asselin-Miller Ricardo Energy & Environment 30 Eastbourne Terrace, London, W2 6LA United Kingdom
t: +44 (0) 1235 75 3292
Ricardo-AEA Ltd is certificated to ISO9001 and ISO14001
Customer reference:
MOVE/C.3/No. 2014-795
Confidentiality, copyright & reproduction:
This report is the Copyright of DG MOVE. It has been prepared by Ricardo Energy & Environment, a trading name of Ricardo-AEA Ltd, under contract to DG MOVE dated 01/04/2015. The contents of this report may not be reproduced in whole or in part, nor passed to any organisation or person without the specific prior written permission of DG MOVE. Ricardo Energy & Environment accepts no liability whatsoever to any third party for any loss or damage arising from any interpretation or use of the information contained in this report, or reliance on any views expressed therein.
Author:
Nick Asselin-Miller, Marius Biedka
Approved By:
Sujith Kollamthodi
Date:
13 November 2015
Ricardo Energy & Environment reference:
Ref: ED60721- Issue Number 1

Study on the Deployment of C-ITS in Europe: Summary Report | 1
Ricardo in Confidence Ref: Ricardo/ED60721/Issue Number 1
Ricardo Energy & Environment
Table of contents
1 Overview and context ................................................................................................ 3 1.1 Background ....................................................................................................................... 3 1.2 Purpose and scope of the study ........................................................................................ 3
2 Methodology and modelling environment ............................................................... 4 2.1 Overall project methodology and objectives ..................................................................... 4 2.2 Overview of modelling approach ....................................................................................... 4 2.3 Scenario and baseline definition ....................................................................................... 5
2.3.1 Bundles of services .................................................................................................. 5 2.3.2 Baseline definition .................................................................................................... 7 2.3.3 Scenario definitions .................................................................................................. 7
2.3.3.1 In-vehicle ITS sub-systems ............................................................................ 8 2.3.3.2 Personal ITS sub-systems ............................................................................. 9 2.3.3.3 Roadside ITS sub-systems .......................................................................... 10 2.3.3.4 Central ITS sub-systems .............................................................................. 10
2.4 Modelling inputs............................................................................................................... 11 2.4.1 Cost-benefit data input categories ......................................................................... 11 2.4.2 Methodology for data collection ............................................................................. 12
2.4.2.1 Literature review ........................................................................................... 12 2.4.2.2 Expert input .................................................................................................. 12
3 Problem definition ................................................................................................... 13 3.1 Introduction ...................................................................................................................... 13 3.2 Summary of preliminary outcomes .................................................................................. 13
4 Case studies ............................................................................................................. 15 4.1 Overview .......................................................................................................................... 15 4.2 High-level summary of outcomes .................................................................................... 15
5 Assessment of impacts ........................................................................................... 16 5.1 Modelling outputs ............................................................................................................ 16
5.1.1 Scenario overview .................................................................................................. 16 5.1.2 Economic impacts .................................................................................................. 17
5.1.2.1 Overview ...................................................................................................... 17 5.1.2.2 In-vehicle ITS sub-systems .......................................................................... 18 5.1.2.3 Personal ITS sub-systems ........................................................................... 19 5.1.2.4 Roadside ITS sub-systems .......................................................................... 19 5.1.2.5 Central ITS sub-systems .............................................................................. 20
5.1.3 Efficiency/time-related impacts .............................................................................. 20 5.1.4 Safety impacts ........................................................................................................ 21 5.1.5 Fuel consumption and CO2 impacts ....................................................................... 22 5.1.6 Emissions impacts .................................................................................................. 24 5.1.7 Overall benefit-cost ratio ........................................................................................ 25
5.2 Other impacts .................................................................................................................. 26 5.2.1 Distributional impacts ............................................................................................. 26
5.2.1.1 Assignment of costs and benefits ................................................................ 26 5.2.1.2 Transport expenditure by income group ...................................................... 27
5.2.2 Impacts on job creation .......................................................................................... 27 5.2.3 Impacts on GDP and fuel duty revenue ................................................................. 28 5.2.4 Modal shift .............................................................................................................. 29 5.2.5 Other relevant impact categories ........................................................................... 29
5.3 Comparison between scenarios ...................................................................................... 30 5.3.1 Scenario comparison .............................................................................................. 30
5.3.1.1 Scenario costs .............................................................................................. 30 5.3.1.2 Scenario benefits ......................................................................................... 31 5.3.1.3 Net benefits and benefit-cost ratio (BCR) .................................................... 32
5.3.2 Sensitivity analysis ................................................................................................. 33 5.3.2.1 ‘Low’ vs. ‘Central’ sensitivity ........................................................................ 33

Study on the Deployment of C-ITS in Europe: Summary Report | 2
Ricardo in Confidence Ref: Ricardo/ED60721/Issue Number 1
Ricardo Energy & Environment
5.3.2.2 ‘High’ cellular-led C-ITS deployment ............................................................ 34
6 Conclusions and recommendations ....................................................................... 36

Study on the Deployment of C-ITS in Europe: Summary Report | 3
Ricardo in Confidence Ref: Ricardo/ED60721/Issue Number 1
Ricardo Energy & Environment
1 Overview and context
1.1 Background
As outlined in the Transport White Paper (2011), the increasing road transport volumes in the European Union are the primary cause of growing congestion and rising energy consumption, as well as a source of environmental and social problems. Coordinated action across a number of fronts is required to tackle these issues and prevent them from becoming major influences on the European population, economy, environment and climate.
The development of new technologies aimed at improving the efficiency, safety and environmental performance of road transport are playing a significant role in achieving the Commission’s goals in this area. One such emerging field is that of Cooperative Intelligent Transport Systems (C-ITS). In road transport, C-ITS typically involves communication between vehicles (vehicle-to-vehicle, V2V), between vehicles and infrastructure (vehicle-to-infrastructure, V2I) and/or infrastructure-to-infrastructure (I2I). The benefits span a range of areas, including improving road safety, reducing congestion, optimising transport efficiency, enhancing mobility, increasing service reliability, reducing energy use and environmental impacts, and supporting economic development.
Over the past decade, there have been remarkable new developments in technologies that facilitate C-ITS; however, these are far from being used at their full potential despite the benefits they could bring.
In recognition of the high potential of С-ITS, the Commission has taken the initiative to develop a strategy on the deployment of С-ITS. To support the shaping of this strategy the Commission has set up a dedicated C-ITS Platform bringing together representatives from a wide range of stakeholders. The aim of the Platform is to build a shared vision of options for overcoming issues which hamper the co-ordinated deployment of C-ITS across the EU and supporting their actual deployment.
This study supports the development of this shared vision and a common deployment strategy, principally by carrying out an analysis of the costs and benefits that different deployment scenarios could deliver.
1.2 Purpose and scope of the study
Ricardo Energy and Environment together with our partners Trasporti e Territorio srl (TRT), were commissioned to deliver this study, entitled “Study on the Deployment of C-ITS in Europe”.
The aim of the study is to assess the benefits and costs that could be achieved through a series of potential European C-ITS deployment scenarios, to be developed as part of the study. A major desk research, consultation and data collection exercise fed into a full cost-benefit-analysis (CBA) modelling phase. In addition to the modelling outputs, a series of international case studies were carried out to identify best practice and lessons learned elsewhere which may be relevant to the EU.
The outputs of the study will provide guidance to DG MOVE as to the relative impact of different bundles of C-ITS services and paces for deployment. It will contribute to the development by DG MOVE and the C-ITS Platform of a strategy in the form of a Commission Communication on the deployment of Cooperative Intelligent Transport Systems (С-ITS) in the EU.
This document is a summary report of the main findings from the project and includes the following sections:
Section1: Overview and context of the study
Section 2: An introduction to the outputs from the problem definition task carried out as part of the extensive literature review carried out
Section 3: A high-level overview of the case studies carried out and key findings
Section 4: An overview of the study methodology and modelling environment used
Section 5: A detailed assessment of the impacts of the services evaluated in the cost-benefit-analysis
Section 6: The main conclusions and recommendations made from the analysis.

Study on the Deployment of C-ITS in Europe: Summary Report | 4
Ricardo in Confidence Ref: Ricardo/ED60721/Issue Number 1
Ricardo Energy & Environment
2 Methodology and modelling environment
2.1 Overall project methodology and objectives
This project was comprised of seven key tasks, as summarised below in Figure 2-1. The main tasks included:
Task 1: a detailed desk-based literature review of over 120 sources containing information on various aspects of C-ITS, from a range of countries
Task 2: a series of nine case studies that were carried out to identify key issues and best practice from elsewhere that could be relevant to the deployment of C-ITS in Europe
Task 3: an identification of the key issues and barriers that are currently preventing the deployment of C-ITS in Europe
Task 4: development of a series of five deployment scenarios and the collection of all necessary modelling input data in consultation with the C-ITS Platform Working Group 1 (WG1)
Task 5: the evaluation of the scenarios in the ASTRA/TRUST modelling environment and subsequent cost-benefit-analysis (CBA) of the modelling outputs
Task 6: assessment of the outputs from the CBA analysis
Task 8: ongoing stakeholder engagement throughout the course of the project to gather and validate data with key industry stakeholders.
Further detail on the methodology used to carry out each individual task can be found in the Final report.
Figure 2-1 – Overview of methodology
2.2 Overview of modelling approach
A series of steps were required to produce the outputs from the cost-benefit-analysis (CBA). This involved an extensive data collection exercise (described in more detail in Section 2.3.3.4) and definition of a series of deployment scenarios (described in Section 2.3), followed by a series of modelling steps centred around TRT’s ASTRA and TRUST models, as shown in Figure 2-2.

Study on the Deployment of C-ITS in Europe: Summary Report | 5
Ricardo in Confidence Ref: Ricardo/ED60721/Issue Number 1
Ricardo Energy & Environment
ASTRA is a strategic model based on the Systems Dynamics Modelling approach, which simulates the EU transport system in combination with the economy and the environment. It is calibrated to reproduce major indicators such as fuel consumption, CO2 emissions and GDP. On the other hand, TRUST is a European transport network model that can compute energy consumption, polluting emissions and accidents by road classification (TEN-T Corridors, Core TEN-T etc). The outputs from these two models were processed and combined during the cost-benefit analysis to produce the final outputs discussed in Section 3.
Figure 2-2 – Key steps in producing CBA modelling outputs
2.3 Scenario and baseline definition
At the July 2015 meeting of WG1, a matrix-based, ‘building block’ approach to developing deployment scenarios was agreed and implemented. The main steps of the approach are shown in Figure 2-3. The baseline scenario was also developed in a similar way.
Figure 2-3 – Scenario definition methodology overview
2.3.1 Bundles of services
For the purposes of modelling, C-ITS services were grouped into a series of service bundles, based on a number of metrics, including: whether they are V2V or V2I; whether they are day 1 or day 1.5 services; their primary targeted geographic deployment areas (TEN-T corridors, core TEN-T, TEN-T comprehensive, urban); the communications technology they employ; their primary targeted vehicle type(s); and their primary purpose. The process for developing these service bundles was heavily informed by our extensive literature review and consultations with WG1 members, as well as the outputs of the various WG1 meetings in the early stages of the project.
Based on these inputs, a series of nine self-contained C-ITS service bundles were defined, each comprised of similar or linked services, as described in Table 2-1 below.

Study on the Deployment of C-ITS in Europe: Summary Report | 6
Ricardo in Confidence Ref: Ricardo/ED60721/Issue Number 1
Ricardo Energy & Environment
Table 2-1 C-ITS service bundles for scenario building
Service bundle C-ITS Services Rationale
Bundle 1 Day 1, V2V, ITS-G5
• Emergency brake light • Emergency vehicle approaching • Slow or stationary vehicle(s) • Traffic jam ahead warning • Hazardous location notification
• Day 1 safety-based V2V services based on ITS-G5 communication, likely to be deployed to vehicles supported by US legislation
Bundle 2 Day 1, V2I, mainly applicable to motorways
• In-vehicle signage • In-vehicle speed limits • Probe vehicle data • Shockwave damping • Road works warning • Weather conditions
• Day 1 V2I, services that deliver most benefit to motorways. Some services listed here may also be applicable to other road types
Bundle 3 Day 1, V2I, mainly applicable to urban areas
• Green Light Optimal Speed Advisory (GLOSA) / Time To Green (TTG)
• Signal violation/Intersection safety
• Traffic signal priority request by designated vehicles
• Day 1 V2I, services expected to only be applicable in urban areas. Therefore, these services are in a separate bundle to those in Bundle 2
Bundle 4 Day 1.5, V2I, Parking Information
• Off street parking information • On street parking management
and information • Park & Ride information • Information on AFV fuelling &
charging stations
• C-ITS services intended to provide information regarding parking (and refuelling) to drivers
Bundle 5 Day 1.5, V2I, Traffic and other information
• Traffic information and smart routing
• C-ITS services intended to provide traffic information to drivers
Bundle 6 Day 1.5, Freight specific services
• Loading zone management • Zone access control
management
• Zone management services
Bundle 7 Day 1.5, V2X (mainly applicable to urban areas), likely to be ITS-G5
• Vulnerable road user protection (pedestrians and cyclists)
• V2X service expected to be post day 1. Communication method is likely to be ITS-G5. Main benefits are likely to be seen in urban areas.
Bundle 8 Day 1.5, V2V, likely to be ITS-G5
• Cooperative collision risk warning • Motorcycle approaching
indication
• Post day 1 V2V services that are likely to be based on ITS-G5. As for Day 1 services, V2V and V2I services are in separate service bundles.
Bundle 9 Day 1.5, V2I
• Wrong way driving • Post day 1 V2I service. As for Day 1 services, V2V and V2I services are in separate service bundles.

Study on the Deployment of C-ITS in Europe: Summary Report | 7
Ricardo in Confidence Ref: Ricardo/ED60721/Issue Number 1
Ricardo Energy & Environment
2.3.2 Baseline definition
The matrix methodology described above was used to combine the individual bundles of services into a baseline and a series of scenarios. The baseline is defined as the scenario in which “no additional EU action" is taken beyond on-going activities. Expected developments already initiated by national or regional public authorities are included, as well as their continuation for the duration of the modelling period (to 2030). In order to define uptake and penetration rates in the baseline, two key elements were assessed:
A review of existing and forthcoming large scale С-ITS deployment initiatives (such as those supported by the Connecting Europe Facility and Horizon 2020) was carried out, allowing all EU Member States to be ranked into three ‘Country Groupings’ corresponding to different levels of ambition. Average infrastructure penetration rates were then estimated for each of these Country Groupings to calculate an overall average EU-level penetration rate for infrastructure in the baseline.
The uptake rate for hardware required to support C-ITS services in vehicles and in the aftermarket is based primarily on expectations that a bundle of safety-based C-ITS services would be mandated in the US from 2018. It is assumed that there will be a diffusion of these basic V2V safety services (mainly Bundle 1 services) from the US to the European market (as has been the case for other vehicle technologies), primarily in premium D and E segment vehicles, with some additional uptake of aftermarket devices offering a series of V2I services from Bundles 2, 4, 5 and 6.
2.3.3 Scenario definitions
Using the matrix methodology to build on the baseline scenario, a series of independent and additional scenarios were developed, with each scenario building on the previous through the deployment of additional bundles and thereby representing an increased level of ambition. Figure 2-4 below shows the final scenario definitions within the scenario definition matrix.
Uptake assumptions for the individual scenarios are based on the hardware that supports the C-ITS services, rather than on the bundles of services themselves. In order to fully define the uptake rates for this hardware (and in order to fully understand the costs associated with the deployment of C-ITS services in the CBA analysis), it is necessary to divide the hardware/devices and associated software and services used to facilitate those C-ITS services into four main categories1:
1. In-vehicle ITS sub-system, which are either fitted by the vehicle manufacturer or retrofitted to the vehicle, and are attached to the vehicle communication buses – these can enable both V2V communications and V2I along suitably equipped roads/regions. Note that retrofitted vehicle ITS sub-systems are outside the scope of this study.
2. Personal ITS sub-systems such as mobile phones, tablets, personal navigation satnav-type devices, and other hand-held devices not attached to the vehicle’s information bus – these can enable V2I communications along suitably equipped roads/regions, or in the future, may be able to support V2V communications if equipped to use the correct communications protocols.
3. Roadside ITS sub-systems such as beacons on gantries, poles, smart traffic lights, etc. which allow V2I communications along specific stretches of roads.
4. Central ITS sub-systems, which may be part of a centralised traffic management system. One such sub-system is able to manage C-ITS services for an entire city, or road operator, or national highway system etc. Deployment of other ITS sub-systems, such as C-ITS infrastructure/roadside units will require a central system for management purposes.
The uptake/penetration rates for each of these categories is defined below.
1 ERTICO, “Communication Technologies for future C-ITS service scenarios” (2015)

Study on the Deployment of C-ITS in Europe: Summary Report | 8
Ricardo in Confidence Ref: Ricardo/ED60721/Issue Number 1
Ricardo Energy & Environment
Figure 2-4 – Scenario definition matrix
Legend
A: Scenario A B: Scenario B C: Scenario C D: Scenario D E: Scenario E
2.3.3.1 In-vehicle ITS sub-systems
Uptake rates for in-vehicle ITS sub-systems are split by vehicle type and whether they are designed to deliver primarily V2V services (which are more likely to require a basic display/warning) or both V2V and V2I services (which are more likely to require a complex display such as an infotainment system to display the richer information that they produce). Deployments start from 2018 in passenger cars2 and freight vehicles and 2020 in buses, except for the hardware that is required to support Day 1.5 services, which starts being deployed in 2025.
2 A recent announcement made on the 30th October 2015 by the Car2Car consortium suggests that initial rollout will begin in Europe from 2019 (CAR 2 CAR Communication Consortium, 2015). This announcement was not made in time to be included in the modelling inputs. As a result of this updated timeline, it could be expected that some of the costs and benefits determined by the modelling may be shifted by one year in time, however the overall magnitude of costs and benefits and their long-term trajectory would not be affected by this change.
Bundle of servicesTEN-T
Corridors
TEN-T
Core
TEN-T
Comprehensive
Non m-way non
urbanUrban Services
Personal transport A A A A A
Public transport C C C C C
Freight A A A A A
Personal transport B B C C/D C
Public transport
Freight B B C C/D C
Personal transport C/D C
Public transport C/D C
Freight C/D C
Personal transport D D E E C
Public transport
Freight E E E E C
Personal transport A A B C/D C
Public transport
Freight B B B C/D C
Personal transport D
Public transport
Freight D D D
Personal transport E E
Public transport E E
Freight E E
Personal transport E E E E E
Public transport E E E E E
Freight E E E E E
Personal transport E E E E
Public transport
Freight E E E E
Bundle 9Day 1.5 V2I - safety
I Wrong way driving
Bundle 7Day 1.5 - V2X
(mainly applicable to
urban areas)
X Vulnerable road user protection
Bundle 8Day 1.5 V2V -
safety
VMotorcycle approaching indication
Cooperative collision risk warning
Bundle 5 Day 1.5 V2I -
Traffic information
I Traffic information & smart routing
Bundle 6Day 1.5 V2I - Zone
management
services
ILoading zone management
Urban zone access control
Bundle 3 Day 1 V2I (mainly
applicable to urban
areas)
I
GLOSA/TTG
Signal violation/intersection safety
Traffic signal priority request by
designated vehicles
Bundle 4 Day 1.5 V2I -
Park ing information
I
Off street parking information
On street parking management and
information
Park & Ride information
Information on fuelling & charging
stations for AFVs
Bundle 1Day 1 V2V - safety
ITS-G5
V
Emergency brake light
Emergency vehicle approaching
Slow or stationary vehicle(s)
Traffic jam ahead warning
Hazardous location notification
Bundle 2 Day 1 V2I (mainly
applicable to
motorways)
I
Road works warning
Weather conditions
In-vehicle signage
In-vehicle speed limits
Probe vehicle data
Shockwave damping
Study on the Deployment of C-ITS in Europe: Summary Report | 9
Ricardo in Confidence Ref: Ricardo/ED60721/Issue Number 1
Ricardo Energy & Environment
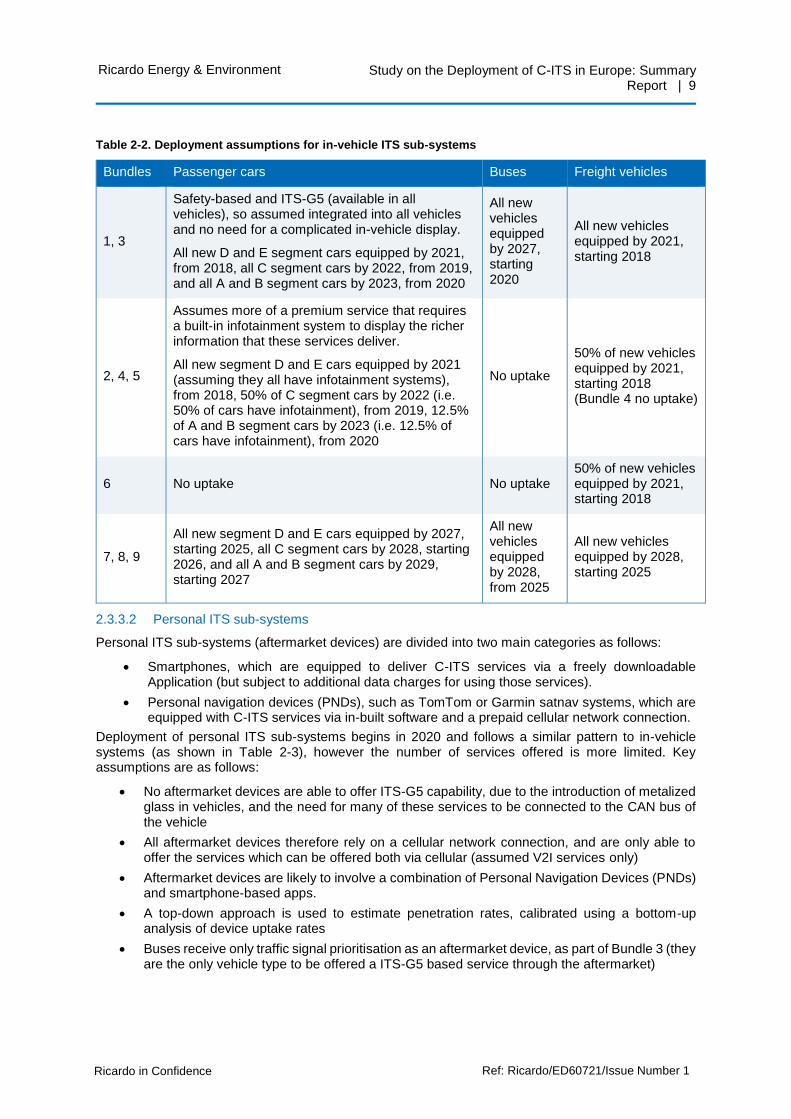
Table 2-2. Deployment assumptions for in-vehicle ITS sub-systems
Bundles Passenger cars Buses Freight vehicles
1, 3
Safety-based and ITS-G5 (available in all vehicles), so assumed integrated into all vehicles and no need for a complicated in-vehicle display.
All new D and E segment cars equipped by 2021, from 2018, all C segment cars by 2022, from 2019, and all A and B segment cars by 2023, from 2020
All new vehicles equipped by 2027, starting 2020
All new vehicles equipped by 2021, starting 2018
2, 4, 5
Assumes more of a premium service that requires a built-in infotainment system to display the richer information that these services deliver.
All new segment D and E cars equipped by 2021 (assuming they all have infotainment systems), from 2018, 50% of C segment cars by 2022 (i.e. 50% of cars have infotainment), from 2019, 12.5% of A and B segment cars by 2023 (i.e. 12.5% of cars have infotainment), from 2020
No uptake
50% of new vehicles equipped by 2021, starting 2018 (Bundle 4 no uptake)
6 No uptake No uptake 50% of new vehicles equipped by 2021, starting 2018
7, 8, 9
All new segment D and E cars equipped by 2027, starting 2025, all C segment cars by 2028, starting 2026, and all A and B segment cars by 2029, starting 2027
All new vehicles equipped by 2028, from 2025
All new vehicles equipped by 2028, starting 2025
2.3.3.2 Personal ITS sub-systems
Personal ITS sub-systems (aftermarket devices) are divided into two main categories as follows:
Smartphones, which are equipped to deliver C-ITS services via a freely downloadable Application (but subject to additional data charges for using those services).
Personal navigation devices (PNDs), such as TomTom or Garmin satnav systems, which are equipped with C-ITS services via in-built software and a prepaid cellular network connection.
Deployment of personal ITS sub-systems begins in 2020 and follows a similar pattern to in-vehicle systems (as shown in Table 2-3), however the number of services offered is more limited. Key assumptions are as follows:
No aftermarket devices are able to offer ITS-G5 capability, due to the introduction of metalized glass in vehicles, and the need for many of these services to be connected to the CAN bus of the vehicle
All aftermarket devices therefore rely on a cellular network connection, and are only able to offer the services which can be offered both via cellular (assumed V2I services only)
Aftermarket devices are likely to involve a combination of Personal Navigation Devices (PNDs) and smartphone-based apps.
A top-down approach is used to estimate penetration rates, calibrated using a bottom-up analysis of device uptake rates
Buses receive only traffic signal prioritisation as an aftermarket device, as part of Bundle 3 (they are the only vehicle type to be offered a ITS-G5 based service through the aftermarket)

Study on the Deployment of C-ITS in Europe: Summary Report | 10
Ricardo in Confidence Ref: Ricardo/ED60721/Issue Number 1
Ricardo Energy & Environment
Table 2-3. Deployment assumptions for personal (aftermarket) ITS sub-systems
Bundles Passenger cars Buses Freight vehicles
1, 3 No uptake, as requires ITS-G5
Bundle 3 only: 50% of all vehicles that can be fitted with an aftermarket device receive this service by 2026, starting 2020
No uptake, as requires ITS-G5
2, 4, 5
50% of all cars that can be fitted with an aftermarket device receive this service by 2026, starting 2020
No uptake
50% of all freight vehicles that can be fitted with an aftermarket device receive this service by 2026, starting 2020
6 No uptake No uptake
50% of all freight vehicles that can be fitted with an aftermarket device receive this service by 2026, starting 2020
7, 8, 9 No uptake, as requires ITS-G5
2.3.3.3 Roadside ITS sub-systems
Roadside ITS sub-systems (roadside infrastructure) are divided into two main categories as follows:
New roadside ITS sub-systems, which are assumed to be roadside base units with traffic monitoring sensors and are deployed to all equipped inter-urban roads at 1km intervals.
Upgrades to existing roadside infrastructure, which are assumed to be devices such as plug-in units situated on top of existing poles/gantries and are deployed to equipped urban areas, with one unit required per signalised intersection.
All roadside ITS sub-systems are assumed to contain an omnidirectional antenna, processor, security chip and be capable of 802.11p wireless communication. Their penetration rates are defined by road type only, with deployments beginning in 2020 for all road types and the rate of penetration varying by road type. For example, by 2026 100% deployment along TEN-T Corridors is assumed, while penetration is limited to 20% on non-urban non-motorway roads. Table 2-4 summarises the main penetration assumptions for the deployment of roadside ITS sub-systems.
Other key assumptions for infrastructure penetration rates are as follows:
For all inter-urban roads, deployment extent is determined as percentage of total road length for each road type. One roadside ITS sub-system is included per km of road equipped
For all urban roads, deployment extent is determined as a percentage of total signalised intersections. One roadside ITS sub-system upgrade is included per signalised intersection.
Table 2-4. Deployment assumptions for roadside ITS sub-systems
Road type Infrastructure penetration
TEN-T Corridor 100% by 2026, starting 2020
TEN-T Core 100% by 2026, starting 2020
TEN-T Comprehensive
50% by 2026, starting 2020
Non-Urban Non-Motorway
20% by 2026, starting 2020
Urban 8% x 50% per year from 2020-23, then 8% per year from 2024-26
2.3.3.4 Central ITS sub-systems
Central ITS sub-systems are defined as the back-office systems and software required to link roadside infrastructure and individual user applications to centralised traffic management centre (TMC) and local

Study on the Deployment of C-ITS in Europe: Summary Report | 11
Ricardo in Confidence Ref: Ricardo/ED60721/Issue Number 1
Ricardo Energy & Environment
controller interfaces. One such sub-system is able to manage C-ITS services for an entire city, or road operator, or national highway system etc.
Uptake of central ITS sub-systems is linked to the uptake of roadside ITS sub-systems, as follows:
Based on conversations with industry experts, it is assumed that each EU Member State operates with different road traffic standards/protocols and that each Member State is likely to have different urban traffic standards and inter-urban traffic standards, i.e. a total of two standards per Member State.
It is assumed that each roadside unit will be connected to a TMC once a certain threshold roadside infrastructure penetration is reached. A central ITS sub-system is assumed to be deployed in each Member State once roadside ITS sub-system penetration reaches 5% and 10% across inter-urban and urban areas respectively.
2.4 Modelling inputs
2.4.1 Cost-benefit data input categories
Three main data inputs are required to carry out the cost-benefit assessment (CBA) of the various C-ITS deployment scenarios developed in conjunction with the C-ITS Platform Working Group 1 (WG1), namely:
C-ITS service and infrastructure uptake and penetration rates:
o Vehicle penetration/uptake rates allow an estimation to the total number of vehicles within the vehicle fleet for each vehicle category (or amongst new vehicles) equipped with the technologies required to support C-ITS services.
o Separate penetration rates are also necessary to represent the extent of different road types equipped with C-ITS supporting infrastructure, allowing them to offer Vehicle-to-Infrastructure (V2I) services.
o Uptake and penetration rates were determined for the baseline and each scenario based on consultation with WG1 members. The full list of uptake/penetration assumptions are summarised in a separate Excel spreadsheet circulated alongside this document.
C-ITS service impact data:
o These are the impacts of C-ITS services on individual vehicles when installed across different vehicle and road types.
o Impacts can be in terms of reduced congestion/average journey speed, fuel consumption, CO2 emissions, polluting emissions, or accident rates.
o Individual impacts are combined with C-ITS deployment scenario service bundle uptake and penetration rates in the ASTRA/TRUST modelling environments to estimate the total EU-level impact of services for each deployment scenario.
o The EU-level impacts can be converted to monetised benefits through using typical values for the external cost of transport from the Handbook on External Costs of Transport (Ricardo-AEA et al., 2014).
C-ITS supporting technology and service costs:
o Cost data makes up the final main input element for the CBA, allowing the uptake and penetration rates for different services to be translated into costs, in order to compare them directly to the estimated benefits from the various EU-level impacts calculated from the modelling.
o The full list of cost data assumptions are summarised in a separate Word document circulated alongside this document.
A series of appendices in the main report provide a detailed overview of the assumptions used for each of the three data input categories described above.

Study on the Deployment of C-ITS in Europe: Summary Report | 12
Ricardo in Confidence Ref: Ricardo/ED60721/Issue Number 1
Ricardo Energy & Environment
2.4.2 Methodology for data collection
2.4.2.1 Literature review
The impacts data collection exercise built on our extensive literature review of over 100 documents covering various aspects of C-ITS services and related technologies. A full list of the sources reviewed is included in the appendices, with the key sources contributing to each of the data input categories described above listed in the relevant appendix in the final report.
Where the modelling input data was not directly available from literature, a number of approaches were used to fill the data gaps, including:
Identifying costs or impacts from other non-C-ITS services or technologies which are expected to operate through a similar mechanism to specific C-ITS services.
Estimating costs or impacts from first principles based on, for example, using known accident data linked to specific accident types targeted by certain C-ITS services to estimate the impact of a specific C-ITS service on accident rates.
2.4.2.2 Expert input
In addition to the desk-based data collection, various draft uptake, cost and impacts data points were discussed with individual experts from within and outside of WG1 over the course of July-October 2015. For example, where data was inconsistent between studies or where gaps remained from the literature review, a number of industry experts (mainly from within WG1) were contacted either unilaterally or in groups (via email or by teleconference) as part of Task 8 (cross cutting stakeholder engagement task). Ricardo Energy & Environment invited industry experts to:
Comment on the data collected or suggested assumptions
Suggest further sources of information or references
Suggest changes to input data where sufficient evidence was not available in the literature.
This consultative approach resulted in a number of revisions to the data used in the modelling.
Study on the Deployment of C-ITS in Europe: Summary Report | 13
Ricardo in Confidence Ref: Ricardo/ED60721/Issue Number 1
Ricardo Energy & Environment
3 Problem definition
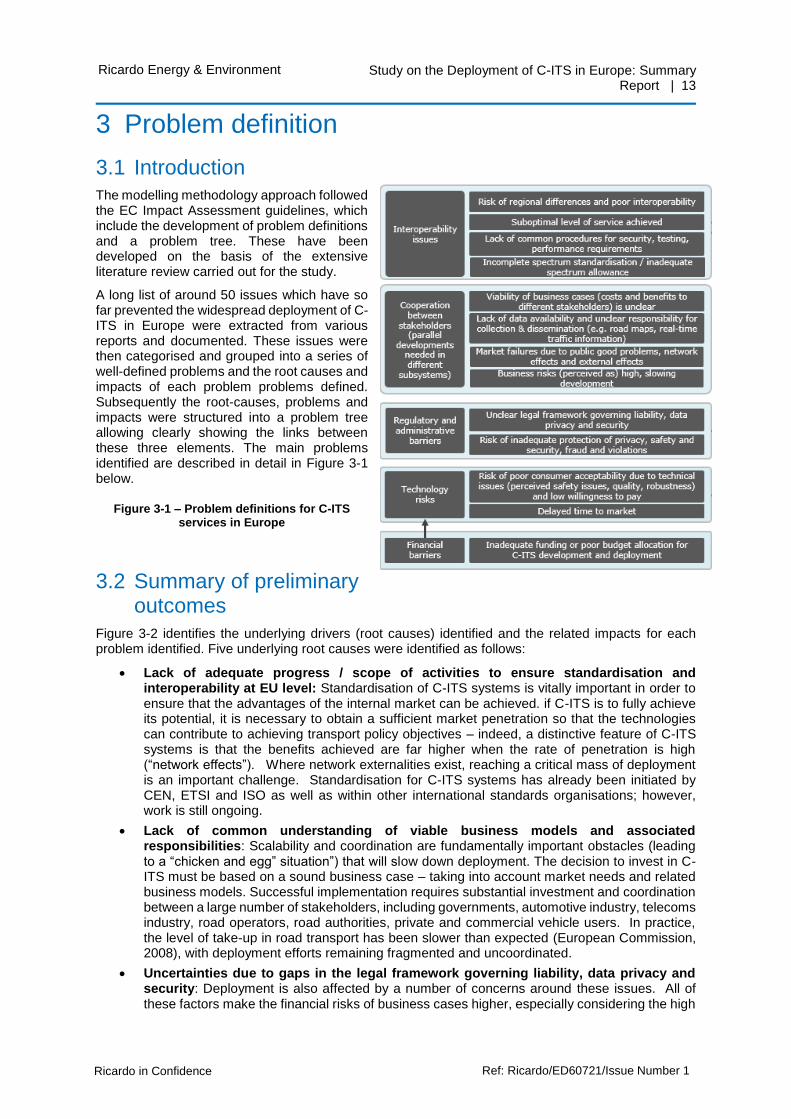
3.1 Introduction
The modelling methodology approach followed the EC Impact Assessment guidelines, which include the development of problem definitions and a problem tree. These have been developed on the basis of the extensive literature review carried out for the study.
A long list of around 50 issues which have so far prevented the widespread deployment of C-ITS in Europe were extracted from various reports and documented. These issues were then categorised and grouped into a series of well-defined problems and the root causes and impacts of each problem problems defined. Subsequently the root-causes, problems and impacts were structured into a problem tree allowing clearly showing the links between these three elements. The main problems identified are described in detail in Figure 3-1 below.
Figure 3-1 – Problem definitions for C-ITS services in Europe
3.2 Summary of preliminary outcomes
Figure 3-2 identifies the underlying drivers (root causes) identified and the related impacts for each problem identified. Five underlying root causes were identified as follows:
Lack of adequate progress / scope of activities to ensure standardisation and interoperability at EU level: Standardisation of C-ITS systems is vitally important in order to ensure that the advantages of the internal market can be achieved. if C-ITS is to fully achieve its potential, it is necessary to obtain a sufficient market penetration so that the technologies can contribute to achieving transport policy objectives – indeed, a distinctive feature of C-ITS systems is that the benefits achieved are far higher when the rate of penetration is high (“network effects”). Where network externalities exist, reaching a critical mass of deployment is an important challenge. Standardisation for C-ITS systems has already been initiated by CEN, ETSI and ISO as well as within other international standards organisations; however, work is still ongoing.
Lack of common understanding of viable business models and associated responsibilities: Scalability and coordination are fundamentally important obstacles (leading to a “chicken and egg” situation”) that will slow down deployment. The decision to invest in C-ITS must be based on a sound business case – taking into account market needs and related business models. Successful implementation requires substantial investment and coordination between a large number of stakeholders, including governments, automotive industry, telecoms industry, road operators, road authorities, private and commercial vehicle users. In practice, the level of take-up in road transport has been slower than expected (European Commission, 2008), with deployment efforts remaining fragmented and uncoordinated.
Uncertainties due to gaps in the legal framework governing liability, data privacy and security: Deployment is also affected by a number of concerns around these issues. All of these factors make the financial risks of business cases higher, especially considering the high

Study on the Deployment of C-ITS in Europe: Summary Report | 14
Ricardo in Confidence Ref: Ricardo/ED60721/Issue Number 1
Ricardo Energy & Environment
development costs combined with uncertain profit margins. Work is ongoing through the C-ITS Platform and by the UNECE Working Party 1 on Road Safety to evaluate the legal obstacles for new technologies and make recommendations on updates to or compatibility with existing legislation.
Further development of system reliability, quality, durability is needed: There are a variety of technical issues that are being addressed – including frequencies, hybrid communication, decentralised congestion control and interfaces for access to services and vehicle resources. There has been significant progress in carrying out the necessary preparatory work, notably in relation to "ID management". However, there are still open issues related to “misbehaviour detection” (European Commission C-ITS Platform, 2015). On the side of public acceptability, communication and education is needed to inform the public about the technological possibilities, benefits, and contribution to societal goals in order to ensure acceptance and mitigate fears.
Stakeholders have other funding priorities and budget constraints: In the past, the Commission has given substantial support to the development of C-ITS via research and development funding. Ongoing funding is available through Horizon 2020 and infrastructure funds. There is now a need to focus on the commercialisation and market deployment of technologies, for which a different emphasis is required.
Figure 3-2: Problem tree
The impacts at the EU level stem from the central issue that the deployment of C-ITS technologies is fragmented and delayed. The consequences are concerned with the loss or postponement of potential benefits that could be achieved with a more coordinated approach. These impacts represent the risks of inaction.

Study on the Deployment of C-ITS in Europe: Summary Report | 15
Ricardo in Confidence Ref: Ricardo/ED60721/Issue Number 1
Ricardo Energy & Environment
4 Case studies
4.1 Overview
A series of nine case studies were carried out, aiming to understand the approach adopted in different deployment projects, international markets and across different key issues in supporting the deployment of C-ITS, as well as the key challenges and best practice from each market which may be relevant to the European context. For each case study, a detailed desk-based analysis of the market in question was carried out, followed by at least one interview with a key local stakeholder using targeted questions to guide the conversation.
The case study outputs produced also helped to improve our understanding of existing national funding and policy initiatives designed to support C-ITS, as well as providing data into the development of the baseline and deployment scenarios
The full list of case studies carried out is as follows:
Consortia:
o Car2Car Communication Consortium: a non-profit, industry-driven organisation initiated by European vehicle manufacturers, first founded in 2002 with the primary objectives of securing a royalty-free frequency band for V2X and standardisation.
o Amsterdam Group: a strategic alliance with the objective to facilitate joint deployment of C-ITS in Europe in recognition of the fact that deployment needs a multi-stakeholder cooperation.
Deployment projects:
o С-ITS deployment corridor NL-DE-AT: joint deployment initiative of a C-ITS corridor between Vienna, Munich/Frankfurt and Rotterdam
o С-ITS initiative SCOOP@F: a pre-deployment project for various C-ITS technologies based in France, following successful completion of the field test project SCORE@F.
A number of national markets:
o UK
o Czech Republic
o USA
o Australia
ITS-G5: a European set of protocols and parameters for V2V and V2I communications based on the IEEE standard 802.11p on wireless access in vehicular environments.
4.2 High-level summary of outcomes
A detailed summary of each case study is included in the main report. Overall however, the case study results show that C-ITS is a wide, technically complex field, which means that developing an interoperable, future-proofed and secure system with involvement from a large variety of stakeholders and Member States poses a significant challenge.
The process of C-ITS deployment requires strong cooperation amongst stakeholders and the EU Member States. The Commission is aware of the challenge and is viewed as a supportive element in the process. Some lessons can be learned from Japan and the USA on overcoming technical issues in deployment and multi-party coordination challenges, respectively.
Study on the Deployment of C-ITS in Europe: Summary Report | 16
Ricardo in Confidence Ref: Ricardo/ED60721/Issue Number 1
Ricardo Energy & Environment
5 Assessment of impacts
Three key categories of impact-related outputs have been produced by the cost-benefit-analysis (CBA):
Environmental impacts:
o Fuel consumption and CO2 emissions
o Air quality
Social impacts:
o Health and safety
o Jobs and employment market
o Privacy and personal data
Economic impacts:
o Direct economic impacts
o Secondary impacts such as changes in competitiveness, congestion, reliability and distributional impacts
o Impacts on GDP.
Note the sub-categories listed in italics represent outputs that are only discussed qualitatively, rather than as direct quantitative outputs from the modelling as for the other sub-categories.
5.1 Modelling outputs
The quantitative modelling outputs from the ASTRA/TRUST models and post-processing CBA model are discussed in this section, both in absolute terms (e.g. the total number of fatalities avoided) and in monetised terms (e.g. the equivalent societal benefit in € of the reduction in fatalities, based on the external cost of fatalities). All costs and benefits are quoted in 2015 prices, using a 4% social discount rate for future costs/benefits.
The majority of the systems deployed to support the rollout of C-ITS services are currently at a relatively early stage of maturity and costs are likely to improve through time. To account for this, an initial learning rate of 10% is applied to all up-front costs for personal, in-vehicle and roadside ITS sub-systems. That is, for every doubling in installed volume, up-front costs reduce by 10%. This learning rate is applied until costs have dropped by 20% (with a cap of a maximum 10% per year cost reductions), after which learning rates are reduced to 3% per doubling of installed capacity. These learning rates are based on an analysis of low CO2 technologies performed by the US EPA and NHTSA, which states that different learning rates apply depending on the level of maturity of the technology (US EPA, NHTSA, 2012).
It should be noted that the outputs discussed in this section are based on a modelling exercise which builds on a large data collection and consultation exercise from a variety of sources. As a result, there is some uncertainty in the outputs produced – the key areas of uncertainty and their likely impact on overall outputs are discussed in each relevant results section.
5.1.1 Scenario overview
As discussed in Section 2.3, five main scenarios were developed for modelling purposes, each representing an increase in penetration of C-ITS services across Europe, compared to the previous scenario. The main distinction between the five scenarios are described below:
Scenario A:
o Bundle 1 safety-based V2V services are deployed
o Bundle 5 (traffic information and smart routing) deployed to equipped TEN-T corridors and core roads in passenger cars
Scenario B:
o Roadside infrastructure extends to all specified motorways and inter-urban roads
o V2I services from bundle 2 (mainly motorway-based services) are deployed to equipped roads
o Bundle 5 (Traffic information and smart routing) extends to equipped roads
Study on the Deployment of C-ITS in Europe: Summary Report | 17
Ricardo in Confidence Ref: Ricardo/ED60721/Issue Number 1
Ricardo Energy & Environment
Scenario C:
o Urban deployments begin for bundles 2, 3 (intersection-related services), 4 (parking information) and 5 (traffic information/smart routing)
o Buses equipped with bundle 1 safety-based V2V services
Scenario D: Bundle 6 (loading zone management) deployed to freight vehicles
Scenario E: Bundles 7-9 (day 1.5 V2X services) are deployed across all vehicle types.
Clearly a wide range of input data and assumptions (as described in Section 2.3.3.4) feed into the modelling for each scenario. The inputs with the largest uncertainties and which have the biggest impact on the outputs produced are the penetration/uptake assumptions. In order to minimise the impact of variations in these assumptions, three sensitivities (‘low’, ‘medium’ and ‘high’) were developed for each of the five scenarios described above, with each showing a varying degree of ambition with respect to deployment levels.
In order to be able to easily compare the various impact categories from the CBA, the outputs included in this section are all presented for the ‘central’ sensitivity Scenario E. This ensures that all the benefits associated with the various bundles are discussed. A comparison between scenarios and between the various sensitivities is included in Section 5.3 below.
5.1.2 Economic impacts
In order to fully understand the costs associated with the deployment of C-ITS services, it is necessary to consider the cost of the hardware/devices and associated software and services used to facilitate those C-ITS services. These devices are broadly categorised into four types3 (as discussed in Section 2.3.3 above), i.e. central, personal, in-vehicle and roadside ITS sub-systems. The analysis of economic impacts in this Section is therefore divided into the four ITS sub-systems described above.
5.1.2.1 Overview
The economic impacts evaluated in the CBA are mainly driven by the equipment costs for the technologies required to support the deployment of C-ITS services. These include costs associated with in-vehicle, personal, roadside and central ITS sub-systems and were evaluated as part of the ASTRA/TRUST output post-processing.
Figure 5-1 shows the annual deployment of C-ITS systems to 2030 over and above the baseline for Scenario E ‘central’. In comparison with the baseline, additional annual deployment increases rapidly ramping up to c. 30 million new vehicles (in-vehicle ITS sub-systems) and 15 million aftermarket devices (personal ITS sub-systems) equipped to offer C-ITS services by 2023. The sudden drop in aftermarket device sales from 2026 reflects the market saturating due to the growing stock of factory-equipped vehicles. In reality this drop-off would occur more gradually, but the overall effect on the CBA of this modelling construct is minimal.
Infrastructure (roadside ITS sub-system) deployment ramps up rapidly beyond 2020 with c. 11,000 roadside units deployed in urban and inter-urban areas respectively up to 2026 when maximum penetration is achieved. Beyond this, a small turnover of replacement systems is seen as the older vintage installations reach the end of their lifetime.
3 ERTICO, “Communication Technologies for future C-ITS service scenarios” (2015)

Study on the Deployment of C-ITS in Europe: Summary Report | 18
Ricardo in Confidence Ref: Ricardo/ED60721/Issue Number 1
Ricardo Energy & Environment
Figure 5-1. Scenario E ‘central’ total additional annual deployments relative to baseline
Total ongoing costs for Scenario E ‘central’ increase rapidly from 2018 onwards, in line with the first vehicle deployments, peaking around €3.2bn per year in 2023, after which costs drop to around €2.5bn per year from 2027, as shown in Figure 5-2 below.
Figure 5-2. Scenario E ‘central’ total additional annual equipment costs relative to baseline
5.1.2.2 In-vehicle ITS sub-systems
As shown in Figure 5-2, by far the dominant cost item is the new vehicle (in-vehicle ITS sub-system) cost which makes up €2.5bn of the €3.2bn peak cost. Costs ramp up rapidly from 2018 onwards reflecting the rapid move towards all new vehicles being equipped with C-ITS service capability by 2025. Costs level off around €2.5bn per year after 2023, mainly due to the technology learning rates bringing down unit costs despite a gradual increase in annual vehicle sales.
Total 2015 up-front costs to the consumer to equip new vehicles with the technology required to deliver C-ITS services are estimated at c. €270-280 per vehicle, with c. €19-22 per vehicle per year ongoing costs also applied. Technology learning rates result in up-front costs reducing to €170-190 per vehicle by 2030. These numbers are broadly in-line with estimates from a number of studies in the US and Europe and have been peer-reviewed by the WG1 Platform members over the course of this project.
0
3
6
9
12
15
18
21
24
0
5
10
15
20
25
30
35
2015 2020 2025 2030
Ro
ad
sid
e IT
S s
ub
-syste
ms (
Th
ou
san
ds
)
Pers
on
al an
d V
eh
icle
IT
S s
ub
-syste
ms
(Mil
lio
ns)
Axis Title
Infrastructure -new
Infrastructure -upgrades
New vehicles
Total vehicles
Aftermarket
€ 0.0
€ 0.5
€ 1.0
€ 1.5
€ 2.0
€ 2.5
€ 3.0
€ 3.5
2015 2017 2019 2021 2023 2025 2027 2029
Ad
dit
ion
al
co
st
(Bil
lio
ns
)
New vehicles
Aftermarket
Infrastructure- upgrades
Infrastructure- new
Central ITSsub-systems
Total

Study on the Deployment of C-ITS in Europe: Summary Report | 19
Ricardo in Confidence Ref: Ricardo/ED60721/Issue Number 1
Ricardo Energy & Environment
However, whilst we have attempted to include all in-vehicle equipment and installation costs based on an extensive literature review and estimated vehicle integration and software integration costs based on a consultation with WG1 experts, there remains some uncertainty around in-vehicle costs due to the nascent nature of the market. Additionally, there may some second-order impacts on vehicle running costs such as lower insurance costs due to a lower risk of accidents, however there is insufficient data available to support these assumptions so they have not been included in the modelling.
Whilst we have not performed a full sensitivity analysis on cost (given that the main uncertainty in the modelling is linked to uptake/penetration numbers), the impact of a +/- 50% variation on in-vehicle costs can easily be estimated at around +/- €1.25bn per year in 2030. Although not an insignificant variation, the impact of this on the overall benefit-cost ratio (BCR – as discussed in Section 5.1.7) is likely to be limited due to the much larger magnitude of the benefits achieved.
5.1.2.3 Personal ITS sub-systems
Aftermarket devices (personal ITS sub-systems) make the second biggest contribution to overall costs, with 22:78% split of cumulative 2030 costs between smartphone-related data costs and personal navigation device (PNDs) up-front purchase costs respectively. There is a rapid ramp-up of costs from 2020 to c. €700mn when aftermarket devices begin to be deployed, followed by a gradual decline in expenditure as prices decline due to technology learning.
The sudden drop in expenditure from 2026 reflects the market saturating due to the growing stock of factory-equipped vehicles. In reality this drop-off would occur more gradually, but the overall effect on economic impacts would be minimal.
As for in-vehicle ITS sub-systems there is some uncertainty around the nature and cost of aftermarket C-ITS devices, as well as the business model that might be used to deliver the services. This must be taken into account when interpreting results, however even a +/-50% variation in costs is unlikely to have a significant impact on the overall BCR due to the magnitude of the benefits available.
5.1.2.4 Roadside ITS sub-systems
Roadside infrastructure (roadside ITS sub-systems) make up only a relatively small contribution to overall economic impact, dominated by new roadside infrastructure (on inter-urban roads) which contributes up to €95mn per year of cost during the infrastructure rollout phase (2020-2026).
Roadside infrastructure upgrades in urban areas contribute a smaller 20% to total roadside infrastructure costs during the peak rollout phase, due the lower cost of these units despite similar annual installation numbers as for new roadside infrastructure.
Total 2015 up-front costs for new and upgraded roadside infrastructure are estimated at c. €14,000 and €4,500 respectively, with c. €600 and €400 per year ongoing costs respectively also applied. Technology learning rates result in up-front costs reducing to c. €3,000 and €9,000 respectively by 2030. These numbers are broadly in-line with estimates from a number of studies in the US and Europe and have been peer-reviewed by the WG1 Platform members over the course of this project.
However, some uncertainty remains about the real cost of roadside infrastructure deployment. In particular, there is very little evidence to support an estimation of savings/costs that may need to be included in any detailed analysis from for example:
Deploying the roadside ITS sub-systems alongside other planned infrastructure upgrades, thereby reducing the costs associated with the C-ITS deployment (e.g. through spreading civil works costs more thinly)
The need to install power supplies in areas where this is not already present
The need to keep existing traditional infrastructure and services in-place and running in parallel with new C-ITS equipment and services, during a transitional period over which the gradual switch-over to C-ITS services occurs – thereby resulting in increased operation costs
The cost of decommissioning roadside infrastructure that is made obsolete due to the advent of C-ITS services, which could add significant costs to the costs estimated above.
Given the relatively limited nature of the roadside ITS sub-system costs compared to in-vehicle and personal ITS sub-systems, it is unlikely that any of the above additional costs/benefits would have a major impact on the overall EU-level benefit-cost ratio (BCR) estimated from this study.

Study on the Deployment of C-ITS in Europe: Summary Report | 20
Ricardo in Confidence Ref: Ricardo/ED60721/Issue Number 1
Ricardo Energy & Environment
However, whilst relatively insignificant at an EU-level, clearly the above areas of uncertainty will be very important to national highways agencies and urban transport authorities when making their local business case for investing in roadside infrastructure and these should be considered in any such local/regional/national analysis.
5.1.2.5 Central ITS sub-systems
The contribution to overall economic impact from central ITS sub-systems (i.e. integration costs to national traffic management centres, C-ITS app software development costs, etc.) is also relatively small, peaking during the infrastructure rollout at c. €47mn per year in 2020.
Total 2015 up-front costs for introducing central ITS sub-systems (i.e. integrating roadside ITS sub-systems into central management centres and existing infrastructure, developing software applications etc.) are estimated at c. €2.5mn, with c. €550,000 per year ongoing costs also applied. It is assumed that up to two central ITS sub-systems are required by EU Member State, introduced once infrastructure penetration reaches a certain level, as described in Section 2.3.3.4.
With very limited data in the literature to support these assumptions, these numbers were estimated through consulting with WG1 Platform experts. Clearly this means there remains some uncertainty as to the exact cost of central ITS sub-systems. Given the relatively limited nature of overall costs compared to in-vehicle and personal ITS sub-systems, it is unlikely that any of the above additional costs/benefits would have a major impact on the overall EU-level BCR estimated from this study. However, again the uncertainty in these numbers will be very important to national highways agencies and urban transport authorities when making their local business case for investing in central ITS sub-systems and further certainty will be required for any such local/regional/national analysis.
5.1.3 Efficiency/time-related impacts
A number of C-ITS services (e.g. traffic signal priority, parking information, smart routing, etc.) lead to significant increases in average speed/reduced congestion by targeting some of the most important areas where delays occur. The impact on time spent driving was modelled in the ASTRA/TRUST modelling environment for passenger cars and buses in urban areas only, which is where these services are expected to have their biggest impact.
Overall, the impact of time saved in Scenario E ‘central’ was estimated at approximately 2 billion hours per year saved, which equates to c. 3% of total time spent on roads, a significant saving. The largest contribution (1.65 billion hours) comes from cars due to the significantly larger amount of time spent in cars in the baseline (c. 55 billion hours for cars vs. 10 billion hours for buses), with the remainder coming from buses, as shown in Figure 5-3. The majority of these services come from bundles 3 (intersection-related services), 4 (parking information) and 5 (traffic information/smart routing).
Figure 5-3. Scenario E ‘central’ total additional time-related impacts relative to baseline
-2.5
-2.0
-1.5
-1.0
-0.5
0.0
0.5
2015 2017 2019 2021 2023 2025 2027 2029
Tra
vel
tim
e (
bil
lio
n h
ou
rs)
Cars
Buses
Total

Study on the Deployment of C-ITS in Europe: Summary Report | 21
Ricardo in Confidence Ref: Ricardo/ED60721/Issue Number 1
Ricardo Energy & Environment
With the very high value of time (assumed at €8.80 per hour in 2015 (Ricardo-AEA et al., 2014)), clearly the significant time savings above will have provide a large monetised benefit, equivalent to nearly €10bn per year in 2030. This benefits category provides the largest overall monetised contribution to the overall benefits achieved. It alone is equivalent to c. four times the total annual cost of the scenario E ‘central’ deployment in 2030.
With such a large contribution (approximately 2/3) to total annual 2030 benefits, it is important to consider uncertainty in the modelling outputs for time-related impacts. Despite their significant beneficial potential, many of the urban-focused services such as ‘parking information’, ‘smart routing’ and ‘traffic signal priority’ which contribute strongly to the significant time-saving benefits observed from the modelling are relatively poorly-understood. In particular, limited or no data is available on the impacts of these services and as a result some of the impacts were estimated from first principles using data from non-C-ITS related literature and from consultation with industry experts. Given the fact that a +/- 50% variation in impacts for these services could vary total benefits by +/- €5bn per year in 2030 (for scenario E ‘central’), this points to a clear need to carry out further work to evaluate the impact of these services, ideally through field trials in a number of European cities.
5.1.4 Safety impacts
Several C-ITS services (such as hazardous location warning, in-vehicle speed limits, intersection safety, etc.) specifically aim to improve road safety and to decrease both the number and the severity of accidents. These impacts were modelled in the ASTRA/TRUST modelling environment and despite a significant reduction in accidents in the baseline (at a rate of c. 4.9% per year for fatalities), significant further benefits are observed in all accident categories in Scenario E ‘central’, as shown in Figure 5-4. Compared to the baseline the impact on each accident category for the year 2030 was estimated at:
Fatalities: reduced by c. 500/year by 2030, representing a c. 7% reduction in estimated fatalities
Serious injuries: reduced by c. 14,000/year by 2030, representing a c. 7% reduction in estimated serious injuries
Minor injuries: reduced by c. 46,500/year by 2030, representing a c. 7% reduction in estimated minor injuries
Material damages: reduced by c. 46,000/year by 2030, representing a c. 7% reduction in estimated material damages
Figure 5-4. Scenario E ‘central’ total additional accidents relative to baseline
Despite the relatively smaller reductions in serious injuries and fatalities compared to other accident types modelled, the societal costs of these types of serious accident are much higher than other accident categories. As such, the benefits for these two categories, alongside minor injuries, dominate the total monetised impacts of C-ITS services on safety.
-120
-100
-80
-60
-40
-20
0
20
2015 2017 2019 2021 2023 2025 2027 2029
Th
ou
san
d a
ccid
en
ts
Fatalities
Seriousinjuries
Minor injuries
Materialdamages
Total

Study on the Deployment of C-ITS in Europe: Summary Report | 22
Ricardo in Confidence Ref: Ricardo/ED60721/Issue Number 1
Ricardo Energy & Environment
The largest contributor to total monetised impacts are serious injuries with a c. €2bn monetised benefit per year in 2030, followed by minor injuries and fatalities at c. €650mn and €500mn respectively. Total monetised safety benefits are estimated at c. €3.4bn per year in 2030. On its own this benefit is sufficient to achieve a BCR greater than 1 and this demonstrates the significant potential of C-ITS services to improve safety on European roads.
Accident-related benefits provide the second largest monetised benefit after time-related impacts and, whilst the impacts data that was collected to estimate the benefits from reduced accident rates was relatively robust (often being based on field trial data), any inaccuracies in this data could have a significant impact on the overall cost effectiveness estimates for C-ITS deployment in Europe. For example, a 50% over-estimation of safety-related impacts could result in benefits being over-estimated by up to €1.7bn in 2030, or 11% of total benefits in 2030 in scenario E ‘central’. Conversely if the baseline assumption of a 4.9% annual reduction in accident rates proves overly-optimistic, accident-related benefits may be under-estimated.
Figure 5-5. Scenario total additional accident-related impacts relative to baseline
5.1.5 Fuel consumption and CO2 impacts
A number of C-ITS services are aimed at improving the smoothness of traffic flow (e.g. green light optimal speed advisory), or at reducing congestion and time spent travelling (e.g. smart routing, parking information, etc.). These services will in many cases contribute to improved fuel consumption and CO2 emissions, with these impacts captured by the ASTRA/TRUST modelling environment.
Outputs from the modelling estimate significant benefits in fuel consumption and CO2 emissions for C-ITS services, although these are not as large as those calculated for safety and time efficiency. As shown in Figure 5-6, a gradual improvement in fuel consumption and CO2 emissions is observed from 2021 onwards for Scenario E ‘central’:
Fuel consumption is reduced by c. 2,400 toe/year by 2030, or c. 1.2% of baseline fuel consumption
CO2 emissions are reduced by c. 7,500t/year by 2030, or c. 1.2% of baseline emissions
-€ 4.0
-€ 3.5
-€ 3.0
-€ 2.5
-€ 2.0
-€ 1.5
-€ 1.0
-€ 0.5
€ 0.0
€ 0.52015 2017 2019 2021 2023 2025 2027 2029
Net
be
nefi
ts c
om
pa
red
to
ba
seli
ne
(B
illi
on
s)
Fatalities
SeriousinjuriesMinor injuries
MaterialdamagesTotal

Study on the Deployment of C-ITS in Europe: Summary Report | 23
Ricardo in Confidence Ref: Ricardo/ED60721/Issue Number 1
Ricardo Energy & Environment
Figure 5-6. Scenario E ‘central’ total additional CO2 and fuel consumption relative to baseline
When the external costs of CO2 emissions and fuel consumption impacts are taken into account, fuel consumption benefits dominate due to the high value associated with fuel savings (c. €1mn per toe vs. €5 per tonne of CO2 in 2015). As a result total monetised fuel savings contribute c. €1.4bn of benefits per year by 2030, as shown in Figure 5-7, whilst as expected CO2 savings contribute only one tenth of this amount per year (€141mn).
The impacts of fuel consumption and CO2 emission reductions account for over 50% of the total cost of the deployment in 2030 (i.e. they could achieve a BCR of 0.5 without any other benefits), which shows the importance of benefits in this impact category.
Figure 5-7. Scenario E ‘central’ total additional CO2 and fuel-related impacts relative to baseline
The above analysis assumes a relatively steady price of oil over the period 2015-2030 with only minor variations around the average of €1mn per 1,000 toe (E3MLab, 2014), as well as a low predicted CO2 prices which increase from c. €5/tonne in 2015 to c. €35/tonne in 2030. Clearly both of these elements are subject to market forces and predicted their value to 2030 can lead to a significant amount of uncertainty. For example:
A renewed oil shock could lead to a significant increase in the overall benefits achieved from fuel savings, whilst a sustained dip in oil prices as seen over the last 12 months could result in much reduced benefits.
-3
-2
-1
0
-8
-7
-6
-5
-4
-3
-2
-1
0
2015 2017 2019 2021 2023 2025 2027 2029
Fu
el co
ns
um
pti
on
(M
illio
n to
e)
CO
2 e
mis
sio
ns
(T
ho
us
an
d t
on
ne
s)
CO2 (tonnes)
Fuelconsumption
-€ 1.8
-€ 1.6
-€ 1.4
-€ 1.2
-€ 1.0
-€ 0.8
-€ 0.6
-€ 0.4
-€ 0.2
€ 0.02015 2017 2019 2021 2023 2025 2027 2029
Ad
dit
ion
al
co
st
(Bil
lio
ns
) CO2
Fuelconsumption
Total

Study on the Deployment of C-ITS in Europe: Summary Report | 24
Ricardo in Confidence Ref: Ricardo/ED60721/Issue Number 1
Ricardo Energy & Environment
A global agreement to introduce market-based climate change mechanisms could result in a significant increase in CO2 prices, significantly increasing the monetised benefits achieved from reduced emissions.
This strong variation must be taken into account in assessing the overall benefits of C-ITS services. However, even a +/-50% variation in the above estimates is unlikely to have a major impact on the overall EU-level BCR, given that the benefits are dominated by time- and accident-related benefits.
5.1.6 Emissions impacts
The emissions impacts of individual C-ITS services are limited in percentage terms, with some services contributing an improvement and other services (e.g. those focused on achieving other impacts such as efficiency or safety impacts) even contributing to an increase in emissions. These impacts were modelled in the ASTRA/TRUST modelling environment.
Overall the impacts estimated were relatively small for Scenario E ‘central’ and were dominated by NOx and CO emissions savings, as described below:
NOx emissions are reduced by c. 4,500t/year by 2030, or c. 0.7% of baseline emissions in that year
CO emissions are reduced by c. 4,300t/year by 2030, or c. 0.4% of baseline emissions
VOC emissions are reduced by c. 700t/year by 2030, or c. 0.4% of baseline emission
PM emissions are reduced by c. 150t/year by 2030, or c. 0.5% of baseline emissions
Figure 5-8. Scenario E ‘central’ total additional annual emission relative to baseline
Taking into account the monetised costs of emissions impacts, NOx and PM savings dominate due to the high value of each tonne saved for these emissions. Total emissions savings contribute c. €33mn of benefits per year by 2030, as shown in Figure 5-9. This is relatively insignificant in comparison to the total cost of the deployment, or benefits achieved from other impact categories.
-12
-10
-8
-6
-4
-2
0
2
2015 2017 2019 2021 2023 2025 2027 2029
Th
ou
san
d t
on
ne
s
PM
NOx
VOC
CO
Total

Study on the Deployment of C-ITS in Europe: Summary Report | 25
Ricardo in Confidence Ref: Ricardo/ED60721/Issue Number 1
Ricardo Energy & Environment
Figure 5-9. Scenario E ‘central’ total additional emissions-related impacts relative to baseline
Whilst the monetised emissions-related benefits of C-ITS services are estimated to be relatively minimal, a number of recent developments in Europe could contribute towards increasing the attractiveness of C-ITS services for their potential to tackle emissions, including:
With the emergence of the recent Volkswagen emissions scandal, there is strong evidence to suggest that actual engine emissions factors are being significantly underestimated by manufacturers, resulting in an overly-optimistic view of emissions caused by vehicles on European roads. Whilst the modelling takes into account ‘real life’ emissions factors, it does not account for any inaccurate emissions estimates from automotive OEMs. If baseline emissions were to be re-evaluated based on updated ‘real life’ emissions factors, the result could be significant increases in baseline emissions with a resulting significant increase in benefits achieved by eliminating those emissions using C-ITS services.
At a more local level, a large number of cities in Europe are suffering from air quality problems, with emissions levels often far exceeding EU limit values in local areas. There is a growing group of cities that are planning to tackle these issues through a variety of ways, including introducing cleaner buses and taxis, introducing ultra-low emissions zones and supporting automotive technologies and services that can help to reduce overall emissions in problem areas. Should certain C-ITS services offer the opportunity to significantly reduce emissions from city centres, it is likely that their emissions benefits would be valued much higher than might otherwise be estimated using traditional external cost of transport conversion factors.
Whilst no concrete conclusions can be drawn today through these early developments in relation to C-ITS emissions-related benefits, these issues are likely to play a significant role in making the business case for deploying C-ITS services, particularly at a local city level.
5.1.7 Overall benefit-cost ratio
Based on the above analysis for scenario E ‘central’, it is clear that at an EU-level, overall benefits (at c. €15bn per year in 2030) far exceed total costs (at c. €2.5bn per year in 2030), with the overall BCR in 2030 achieved being in the region of 6:1. This illustrates that there is a strong argument for the deployment of C-ITS services in Europe.
Despite this number appearing very high, it is in line with other studies which have estimated BCRs in the range 1.5 to 6.8, as shown in the EasyWay and DRIVE C2X studies (Table 5-1). Whilst these numbers are slightly lower than the BCR estimated here, they cover a much smaller range of services than those covered by this study. An estimate of BCR from Scenarios A and B only (with a more limited range of services deployed) results in BCRs that are more in-line with the findings of these studies (2.7 and 3.1 respectively), as discussed in more detail in Section 5.3.1.
-€ 35
-€ 30
-€ 25
-€ 20
-€ 15
-€ 10
-€ 5
€ 0
€ 52015 2017 2019 2021 2023 2025 2027 2029
Ad
dit
ion
al
co
st
(mil
lio
ns
)
PM
NOx
VOC
CO
Total

Study on the Deployment of C-ITS in Europe: Summary Report | 26
Ricardo in Confidence Ref: Ricardo/ED60721/Issue Number 1
Ricardo Energy & Environment
Table 5-1. Benefit-cost ratio comparison with other EU C-ITS studies
Study Benefit-cost ratio
Comments
This study 5.4 – 7.4 Relatively high BCR is due to deployment of a wide range of C-ITS services which deliver benefits in a number of areas including safety, time savings and fuel consumption.
EasyWay 1.5 – 1.8
BCR varies depending on whether V2V focussed (1.5) or V2I focussed services (1.8) are deployed. Overall, a limited number of C-ITS services are assumed to be deployed in the EasyWay scenarios. The majority of benefits are attributed to reduction in time spent travelling.
DRIVE C2X 2.0 – 6.8
BCR varies depending on the level of penetration in cars in 2030. The low penetration scenario envisages 26% penetration, whereas the high scenario assumes 100% penetration. The majority of benefits are attributed to an increase in safety.
Sources: (TNO, 2014; EasyWay Cooperative Systems Task Force, 2012)
5.2 Other impacts
In addition to the quantified impacts assessed by the ASTRA/TRUST modelling environment and the subsequent CBA analysis, a number of additional impact categories were assessed either semi-quantitatively or qualitatively. These are discussed in this Section.
5.2.1 Distributional impacts
5.2.1.1 Assignment of costs and benefits
A full assessment of the business models, money transfers and assignment of the expenditure and benefits to the different key stakeholders involved in the deployment of C-ITS was not within the scope of this study. However, a number of important inferences can be drawn from the CBA outputs as to the distribution of benefits and expenditure amongst these stakeholders, as follows:
Equipment providers and OEMs: Whilst significant investments will need to be made to develop the hardware, software and back-office systems required to deliver C-ITS services to various vehicles in Europe, the expectation is that all of these investments and the ongoing costs required to equip vehicles and infrastructure with C-ITS capability will be recovered from the end-users. Additionally, the development of new services has the potential to open up new business models for equipment providers and OEMs, for example through added value information or entertainment services – potentially providing a significant source of additional revenue for these stakeholders.
Highways agencies and urban transport authorities: It is likely that the majority of roadside and central ITS sub-system-related investments will be led by highways agencies and urban transport authorities, based on local business cases developed for each nation/region/city. Significant expenditure will be required to deploy all the roadside infrastructure required, back-office systems and applications, with no clear route for recovering this investment given that the majority of the benefits are societal. As such, new business models may need to be developed, or additional charges applied elsewhere (e.g. through road tolling, congestion charging, parking fees, etc.) to recover the investment costs in C-ITS.
Vehicle operators and owners: Ultimately the increased cost of vehicles equipped to deliver C-ITS services, or the cost of aftermarket devices, or even the cost of roadside infrastructure is likely to be recovered from vehicle operators and owners, whether they be personal drivers or businesses. Whilst some of the benefits of C-ITS services may be felt directly (e.g. reduced time spent driving), others (e.g. reduced accidents or improved air quality) are societal benefits whose benefits may not be valued strongly by vehicle owners, thereby limiting their willingness to pay extra for these services. As such, other mechanisms may be required to encourage vehicle owners to adopt C-ITS services (e.g. through offering value-added or entertainment services), or to compensate them for any additional expenditure they must incur (e.g. through subsidies or incentives).

Study on the Deployment of C-ITS in Europe: Summary Report | 27
Ricardo in Confidence Ref: Ricardo/ED60721/Issue Number 1
Ricardo Energy & Environment
Local and national Governments: Given that the majority of the benefits of deploying C-ITS services are societal benefits, it is likely that Governments may benefit through e.g. improved tax revenue due to increased productivity in businesses, or reduced expenditure due to lower healthcare spending. It is not expected that Governments would bear any large portion of the deployment costs (assuming infrastructure deployment is private-sector led), although given the long investment time horizons needed to invest in C-ITS services, they may be asked to provide financing support to willing private sector investors.
Telecom operators: In the case of a cellular-led infrastructure rollout, it is likely that telecom operators would benefit significantly from increased data usage of their networks from vehicles accessing V2I services. This may be countered by a need to invest in upgrading networks to ensure strong coverage along major road networks, however any such expenditure would most likely be recovered from the vehicle operators/owners.
5.2.1.2 Transport expenditure by income group
The ASTRA model computes transport expenditure for different income segments. Since the relevance of transport expenditure and use of transport mode change across the segments, the variations of travel costs and times can affect such segments in different ways. The effects of the modelling scenarios are computed at a Member State level depending on inputs such as the different penetration of drivetrain technologies, the relevance of congestion, and the amount of emissions, before being aggregated at an EU level.
Overall the modelling estimates a small reduction (c. 1%) in transport expenditure across all income groups, with the impact being marginally higher in the ‘high’ income group, as shown in Table 5-2 below. No significant distributional impact on transport expenditure is therefore predicted.
Table 5-2. Impact on transport expenditure in 2030 – comparison of Scenario E ‘central’ with baseline
EU-27 transport expenditure in 2030
(€ per person/year) Low income Medium income High Income
Baseline 604.73 930.39 1317.05
Scenario E 'central' 599.90 921.53 1302.47
Reduction in transport expenditure 0.80% 0.95% 1.11%
5.2.2 Impacts on job creation
The deployment of C-ITS services could have an impact on job creation, as additional workers are likely to be required to support the manufacturing, installation, maintenance and operation of C-ITS systems. The impact on job creation is estimated using multipliers, since the use of general equilibrium models is not considered in the scope of this study. In general, the use of multipliers should be interpreted with caution because of the need to ensure additionality. Nevertheless, this analysis should give a guide to the potential magnitude of any employment impacts.
The impact on EU-28 employment in 2030 has been estimated to be an additional c. 25,000 jobs, taking into account employment effects for relevant industries based on the additional costs of deploying C-ITS services in Scenario E ‘central’ relative to the baseline. The steps used to estimate job-related impacts are as follows:
Additional annual cost of deploying C-ITS services in 2030 for Scenario E ‘central’: €2.4bn
Multiply this by the average employment effect for relevant industries (estimated to be 12.21 FTE change per €1.2mn of output)4 = (€2.42bn / €1.2mn) x 10.47 = c. 25,000 jobs
This is equivalent to approximately 0.012% of total EU-28 jobs (Eurostat, 2010), or c. 0.2% of total EU automotive employment (ACEA, 2014).
The number indirect jobs created can also be estimated via the use of employment multipliers, as shown in Table 5-3. Assuming an employment multiplier of 2.5 for the manufacture of motor vehicles results, an estimated 62,500 indirect jobs created due to the deployment of C-ITS services. The total direct and
4 Source for employment effects: UK Office for National Statistics (ONS, 2014). Employment effect in 2010, in terms of FTE change per £1mn of output for the manufacture of electrical equipment = 11.21, for the manufacture of motor vehicles = 9.73. Average of the two industries is 10.47. Converting this to Euros gives an employment effect of 10.47 per €1.165mn (using an average GBP/EUR exchange rate of 1.1658 for the period 1 Jan 2010 – 31 Dec 2010).

Study on the Deployment of C-ITS in Europe: Summary Report | 28
Ricardo in Confidence Ref: Ricardo/ED60721/Issue Number 1
Ricardo Energy & Environment
indirect jobs created represents c. 0.035% of total EU employment, or c. 0.5% of total EU automotive employment.
Table 5-3: Type I employment multipliers
Industry Employment multiplier (Type I)
Notes on scope
Manufacture of motor vehicles
2.0 – 3.1
A range of employment multipliers were found for the automotive industry. Many of the sources suggested an average employment multiplier of 2.5.
ICT 1.4 - 1.8 Recently estimated in a report published by DG CONNECT.
Sources: ICT sector multipliers from (DG CONNECT, 2012); Manufacture of motor vehicles multipliers from (Hungarian Ministry of Foreign Affairs and Trade, 2015; European Commission, 2014; ONS, 2014; The Conference Board, 2014)
5.2.3 Impacts on GDP and fuel duty revenue
When transport conditions are improved, Total Factor Productivity (TFP) is increased and this has a positive effect on potential GDP. C-ITS services can therefore influence TFP and GDP through reducing congestion and the cost of transport.
The ASTRA model includes transport as one determinant of TFP. Using the estimates of impacts on congestion and on costs, the input of ASTRA has been adapted to reflect the improvements of transport conditions. The model then provides a quantitative calculation of the impact on GDP growth.
A small positive effect (0.01%) on GDP is seen in later years of the cost-benefit analysis, as deployment of C-ITS services increases. Table 5-4 shows the differences between the baseline scenario and Scenario E ‘central’, as computed by the ASTRA model. By 2030, the impact on GDP is estimated to be c. €1.8bn. A key factor contributing to this is likely to be the increased traffic efficiency, as highlighted in Section 5.1.3. Note that this does not include the GVA estimated from the deployment costs and benefits of C-ITS estimated from the CBA.
Table 5-4. Impact on GDP – comparison of Scenario E ‘central’ with baseline
EU-27 GDP
(€mn per year) 2015 2020 2025 2030
Baseline 12,429,115 13,949,713 15,137,592 16,184,179
Scenario E ‘central’ 12,429,115 13,949,746 15,138,494 16,185,956
% change 0.00% 0.00% 0.01% 0.01%
Additionally, fuel duty revenues (a revenue for Governments, but a burden for motorists) are quantified in ASTRA, the results show a c. 1% reduction in fuel duty revenues by 2030 for Scenario E ‘central’, as shown in Table 5-5 below.
Table 5-5. Impact on fuel duty revenues - comparison of Scenario E 'central' with baseline
EU-27 fuel duty revenues
(€mn per year) 2015 2020 2025 2030
Baseline 153048 146593 142557 146422
Scenario E 'central' 153048 146585 141794 145034
% reduction in fuel duty revenues 0.00% 0.01% 0.53% 0.95%
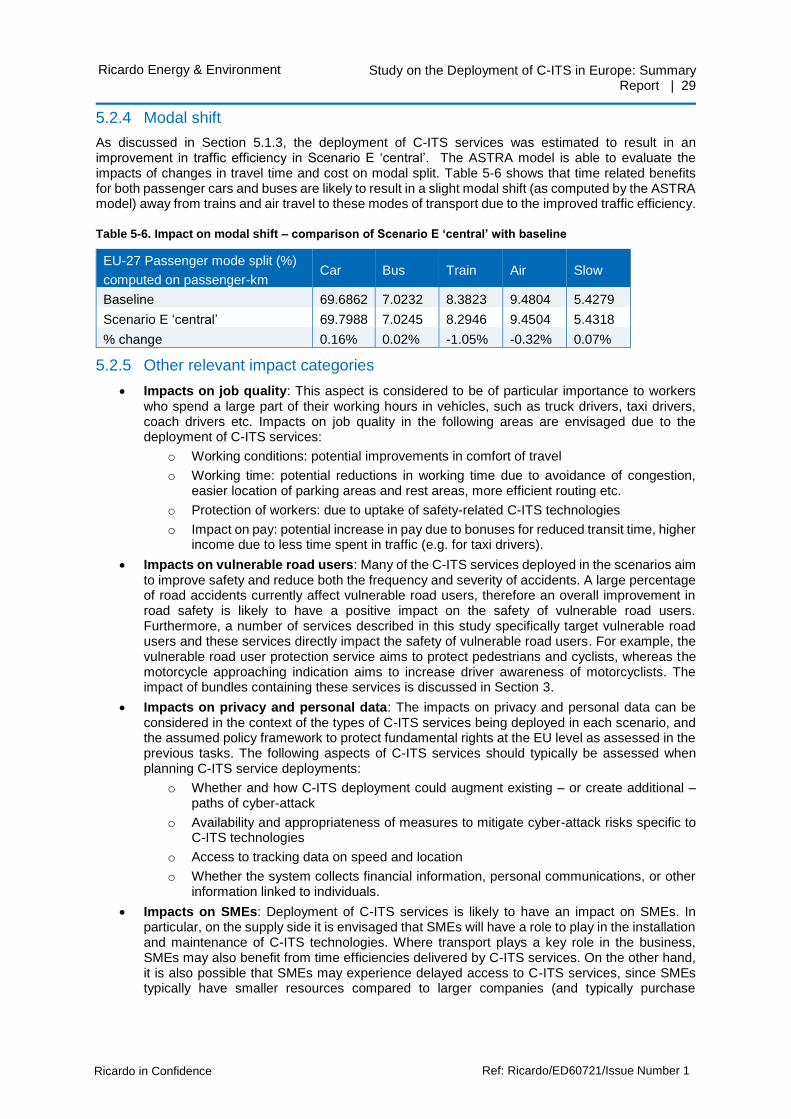
Study on the Deployment of C-ITS in Europe: Summary Report | 29
Ricardo in Confidence Ref: Ricardo/ED60721/Issue Number 1
Ricardo Energy & Environment
5.2.4 Modal shift
As discussed in Section 5.1.3, the deployment of C-ITS services was estimated to result in an improvement in traffic efficiency in Scenario E ‘central’. The ASTRA model is able to evaluate the impacts of changes in travel time and cost on modal split. Table 5-6 shows that time related benefits for both passenger cars and buses are likely to result in a slight modal shift (as computed by the ASTRA model) away from trains and air travel to these modes of transport due to the improved traffic efficiency.
Table 5-6. Impact on modal shift – comparison of Scenario E ‘central’ with baseline
EU-27 Passenger mode split (%)
computed on passenger-km Car Bus Train Air Slow
Baseline 69.6862 7.0232 8.3823 9.4804 5.4279
Scenario E ‘central’ 69.7988 7.0245 8.2946 9.4504 5.4318
% change 0.16% 0.02% -1.05% -0.32% 0.07%
5.2.5 Other relevant impact categories
Impacts on job quality: This aspect is considered to be of particular importance to workers who spend a large part of their working hours in vehicles, such as truck drivers, taxi drivers, coach drivers etc. Impacts on job quality in the following areas are envisaged due to the deployment of C-ITS services:
o Working conditions: potential improvements in comfort of travel
o Working time: potential reductions in working time due to avoidance of congestion, easier location of parking areas and rest areas, more efficient routing etc.
o Protection of workers: due to uptake of safety-related C-ITS technologies
o Impact on pay: potential increase in pay due to bonuses for reduced transit time, higher income due to less time spent in traffic (e.g. for taxi drivers).
Impacts on vulnerable road users: Many of the C-ITS services deployed in the scenarios aim to improve safety and reduce both the frequency and severity of accidents. A large percentage of road accidents currently affect vulnerable road users, therefore an overall improvement in road safety is likely to have a positive impact on the safety of vulnerable road users. Furthermore, a number of services described in this study specifically target vulnerable road users and these services directly impact the safety of vulnerable road users. For example, the vulnerable road user protection service aims to protect pedestrians and cyclists, whereas the motorcycle approaching indication aims to increase driver awareness of motorcyclists. The impact of bundles containing these services is discussed in Section 3.
Impacts on privacy and personal data: The impacts on privacy and personal data can be considered in the context of the types of C-ITS services being deployed in each scenario, and the assumed policy framework to protect fundamental rights at the EU level as assessed in the previous tasks. The following aspects of C-ITS services should typically be assessed when planning C-ITS service deployments:
o Whether and how C-ITS deployment could augment existing – or create additional – paths of cyber-attack
o Availability and appropriateness of measures to mitigate cyber-attack risks specific to C-ITS technologies
o Access to tracking data on speed and location
o Whether the system collects financial information, personal communications, or other information linked to individuals.
Impacts on SMEs: Deployment of C-ITS services is likely to have an impact on SMEs. In particular, on the supply side it is envisaged that SMEs will have a role to play in the installation and maintenance of C-ITS technologies. Where transport plays a key role in the business, SMEs may also benefit from time efficiencies delivered by C-ITS services. On the other hand, it is also possible that SMEs may experience delayed access to C-ITS services, since SMEs typically have smaller resources compared to larger companies (and typically purchase

Study on the Deployment of C-ITS in Europe: Summary Report | 30
Ricardo in Confidence Ref: Ricardo/ED60721/Issue Number 1
Ricardo Energy & Environment
second-hand commercial vehicles rather than new). However, access will still be possible via aftermarket devices.
5.3 Comparison between scenarios
5.3.1 Scenario comparison
As discussed in Sections 2.3 and 5.1.1, five main scenarios were developed in conjunction with the C-ITS Platform WG1 for modelling purposes, each representing an increase in penetration of C-ITS services across Europe compared to the previous scenario. Each scenario was designed to be independent and additional in order to allow easy comparison between scenarios.
Whilst the previous section evaluated the detailed costs and benefits for Scenario E, this section compares the overall costs and benefit estimated for Scenarios A-E in the ‘central’ sensitivity. The following Section 5.3.2 makes a comparison between the three sensitivities.
5.3.1.1 Scenario costs
As can be seen from Figure 5-10 the variation in costs between scenarios is only a fraction of overall costs, for example Scenario E total annual costs in 2030 are only 1.7% higher than Scenario A costs in 2030. The main reason for this is that in order to deliver the services in Scenario A (mainly Bundle 1 V2V services, with some Bundle 5 V2I), all of the in-vehicle ITS sub-systems and personal ITS sub-systems needed to support V2V and V2I communications are required in the targeted vehicles (passenger cars and freight vehicles in Scenario A). Once these in-vehicle and personal ITS sub-systems are deployed, all additional V2V and V2I services can be rolled out to these vehicles in subsequent scenarios, but without the need for additional in-vehicle equipment costs.
Figure 5-10. Total annual additional equipment costs relative to baseline
As such, the main differences between Scenario A and subsequent scenarios in terms of economic impact are the additional costs of rolling out personal and roadside ITS sub-systems as these systems begin to be deployed through Scenarios B and C, as well as the cost of equipping buses with in-vehicle ITS sub-systems in Scenario C. These additional costs can be seen in particular in the slightly higher peak costs observed from one Scenario to the next in 2023.
However, as discussed in Section 5.1.2, the dominant cost category for the rollout of C-ITS services is that of in-vehicle ITS sub-systems (making up 95% of total annual costs in 2030 and 86% of cumulative costs to 2030 in Scenario E ‘central’), followed by personal, roadside and central ITS sub-systems. Given this sequence and the fact that most in-vehicle ITS sub-systems are deployed in Scenario A, it is not surprising that the difference in total costs between scenarios is so small.
0.0 €
0.5 €
1.0 €
1.5 €
2.0 €
2.5 €
3.0 €
3.5 €
2015 2017 2019 2021 2023 2025 2027 2029
Co
st
(Bil
lio
ns
)
Scenario A
Scenario B
Scenario C
Scenario D
Scenario E
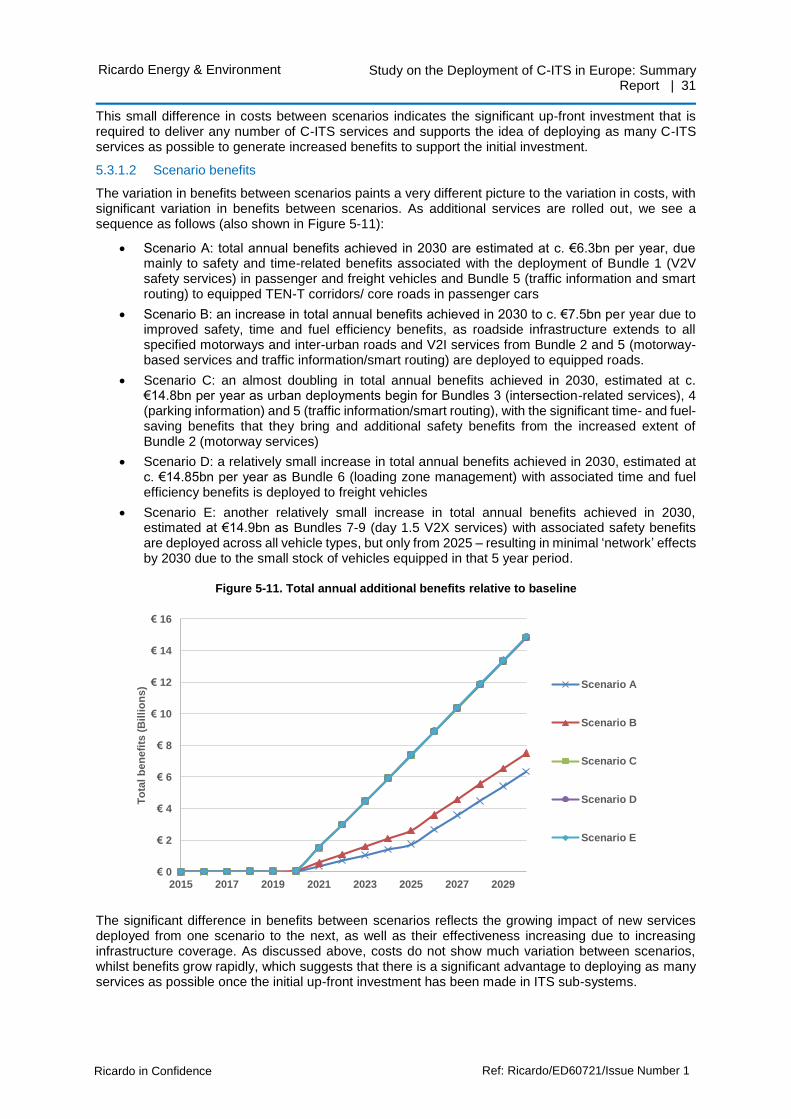
Study on the Deployment of C-ITS in Europe: Summary Report | 31
Ricardo in Confidence Ref: Ricardo/ED60721/Issue Number 1
Ricardo Energy & Environment
This small difference in costs between scenarios indicates the significant up-front investment that is required to deliver any number of C-ITS services and supports the idea of deploying as many C-ITS services as possible to generate increased benefits to support the initial investment.
5.3.1.2 Scenario benefits
The variation in benefits between scenarios paints a very different picture to the variation in costs, with significant variation in benefits between scenarios. As additional services are rolled out, we see a sequence as follows (also shown in Figure 5-11):
Scenario A: total annual benefits achieved in 2030 are estimated at c. €6.3bn per year, due mainly to safety and time-related benefits associated with the deployment of Bundle 1 (V2V safety services) in passenger and freight vehicles and Bundle 5 (traffic information and smart routing) to equipped TEN-T corridors/ core roads in passenger cars
Scenario B: an increase in total annual benefits achieved in 2030 to c. €7.5bn per year due to improved safety, time and fuel efficiency benefits, as roadside infrastructure extends to all specified motorways and inter-urban roads and V2I services from Bundle 2 and 5 (motorway-based services and traffic information/smart routing) are deployed to equipped roads.
Scenario C: an almost doubling in total annual benefits achieved in 2030, estimated at c. €14.8bn per year as urban deployments begin for Bundles 3 (intersection-related services), 4 (parking information) and 5 (traffic information/smart routing), with the significant time- and fuel-saving benefits that they bring and additional safety benefits from the increased extent of Bundle 2 (motorway services)
Scenario D: a relatively small increase in total annual benefits achieved in 2030, estimated at c. €14.85bn per year as Bundle 6 (loading zone management) with associated time and fuel efficiency benefits is deployed to freight vehicles
Scenario E: another relatively small increase in total annual benefits achieved in 2030, estimated at €14.9bn as Bundles 7-9 (day 1.5 V2X services) with associated safety benefits are deployed across all vehicle types, but only from 2025 – resulting in minimal ‘network’ effects by 2030 due to the small stock of vehicles equipped in that 5 year period.
Figure 5-11. Total annual additional benefits relative to baseline
The significant difference in benefits between scenarios reflects the growing impact of new services deployed from one scenario to the next, as well as their effectiveness increasing due to increasing infrastructure coverage. As discussed above, costs do not show much variation between scenarios, whilst benefits grow rapidly, which suggests that there is a significant advantage to deploying as many services as possible once the initial up-front investment has been made in ITS sub-systems.
€ 0
€ 2
€ 4
€ 6
€ 8
€ 10
€ 12
€ 14
€ 16
2015 2017 2019 2021 2023 2025 2027 2029
To
tal
be
nefi
ts (
Bil
lio
ns
) Scenario A
Scenario B
Scenario C
Scenario D
Scenario E

Study on the Deployment of C-ITS in Europe: Summary Report | 32
Ricardo in Confidence Ref: Ricardo/ED60721/Issue Number 1
Ricardo Energy & Environment
Another interesting observation from the benefits analysis is the size of the difference between Scenarios B and C, with an almost doubling in benefits achieved by 2030 when C-ITS services are deployed in urban areas. This illustrates the importance of deploying services and the supporting infrastructure in cities in order to access the full range of benefits available from C-ITS. However, despite the clear advantages that these urban services could offer, the data available to support the analysis of urban services was considerably less robust than that for inter-urban services. Particularly for services such as parking information and smart routing, very little data was available in the literature to support the analysis. Given the significant benefits available from urban services, this points to a clear need for additional research and field trials to prove out the impacts of these services.
5.3.1.3 Net benefits and benefit-cost ratio (BCR)
The overall BCR for the various scenarios varies as shown in Figure 5-12 and summarised below:
Scenario A: BCR = 2.7 based on annual costs and benefits in 2030 or 1.0 based on cumulative costs and benefits to 2030
Scenario B: BCR = 3.1 based on annual costs and benefits in 2030 or 1.3 based on cumulative costs and benefits to 2030
Scenarios C-E: BCR = 6.1-6.2 based on annual costs and benefits in 2030 or 2.8 based on cumulative costs and benefits to 2030
Based on the above, clearly the deployment of C-ITS systems is cost-effective when viewed over a long-term (c. 10-15 years) time horizon.
Figure 5-12. Benefit-cost ratio relative to baseline
As shown in Figure 5-13 however, net benefits turn negative in the first year after deployments begin in 2018, with the various Scenarios breaking even (on a cashflow basis) at different points between 2023 and 2027. Whilst all scenarios become strongly net beneficial by 2030, there is a varying degree of time spent in the investment ‘valley of death’, whereby significant investments are required early to access significant long-term benefits. Clearly this requires investors to have a long-term investment time horizon.
However, the bulk of the costs (in-vehicle costs, as discussed above) will be borne by the consumer, who typically do not have a long-term investment time horizon and do not always make investment decisions based on a rational analysis of the business case. Additionally, many of the benefits achieved are societal benefits (such as reduced accidents, reduced congestion, improved emissions performance, etc.). There may nevertheless be a need to encourage consumers to invest in higher up-front and running costs for their vehicles in order to access some of these benefits, e.g. through the provision of value-added services, or through highlighting the safety and health benefits of C-ITS services.
0.0
1.0
2.0
3.0
4.0
5.0
6.0
7.0
2015 2017 2019 2021 2023 2025 2027 2029
BC
R
Scenario A -annual
Scenario A -cumulative
Scenario B -annual
Scenario B -cumulative
Scenario E -annual
Scenario E -cumulative

Study on the Deployment of C-ITS in Europe: Summary Report | 33
Ricardo in Confidence Ref: Ricardo/ED60721/Issue Number 1
Ricardo Energy & Environment
Figure 5-13. Net benefits relative to baseline
5.3.2 Sensitivity analysis
As discussed in Section 5.1.1, in addition to the five main scenarios, three sensitivities were introduced to account for the uncertainty in uptake numbers assumed in the scenario definition, as well as to evaluate the impact of cellular networks in providing the infrastructure for V2I services, as follows:
‘Central’ sensitivity: uptake and penetration rates in this scenario are summarised in Section 2.3.3 and are used as the basis of the analysis in the rest of this document
‘Low’ sensitivity:
o In-vehicle and personal ITS sub-systems: Final penetration levels were kept constant relative to the ‘central’ sensitivity, but the deployment rates were spread out through time, i.e. for any penetration which takes 6 years to achieve in the ‘central’ scenario, this takes 10 years in the ‘low scenario’
o Roadside ITS sub-systems: The same transformation in time was carried out for roadside ITS sub-systems, whilst the absolute final penetration rates across different road types were also lowered
‘High’ sensitivity: this sensitivity was designed to represent the impact of using the cellular network (with very high penetration from Day 1) to provide V2I services
o In-vehicle and personal ITS sub-systems: These remained unchanged from the ‘central’ sensitivity.
o Roadside ITS sub-systems: Roadside infrastructure penetration for all inter-urban roads was set equal to cellular internet penetration in Europe, i.e. 97%, whilst urban penetration was also increased to account for the use of cellular networks.
This section compares the overall costs and benefit from the three sensitivities, for Scenario C, as shown in Figure 5-14.
5.3.2.1 ‘Low’ vs. ‘Central’ sensitivity
The more rapid and extensive deployment in the ‘central’ sensitivity results in a more rapid cost ramp-up than the ‘low’ sensitivity. However, given the ‘network’ effects of deploying larger numbers of vehicles and infrastructure, the impacts of C-ITS services are felt earlier and benefits accrue at a much faster rate. As a result, cashflow break-even is achieved earlier in 2022 in the ‘central’ sensitivity, compared to 2027 for the ‘low’ sensitivity, with 2030 net benefits c. €1.5bn per year higher and a higher BCR of 6.1 vs. 5.4.
This clearly illustrates the advantages of a more rapid rollout, which allows the ‘network’ effects of C-ITS services to be felt earlier and achieves a more rapid break-even point.
-€ 4
-€ 2
€ 0
€ 2
€ 4
€ 6
€ 8
€ 10
€ 12
€ 14
2015 2017 2019 2021 2023 2025 2027 2029
Net
be
nefi
ts (
Bil
lio
ns
)
Scenario A
Scenario B
Scenario C
Scenario D
Scenario E
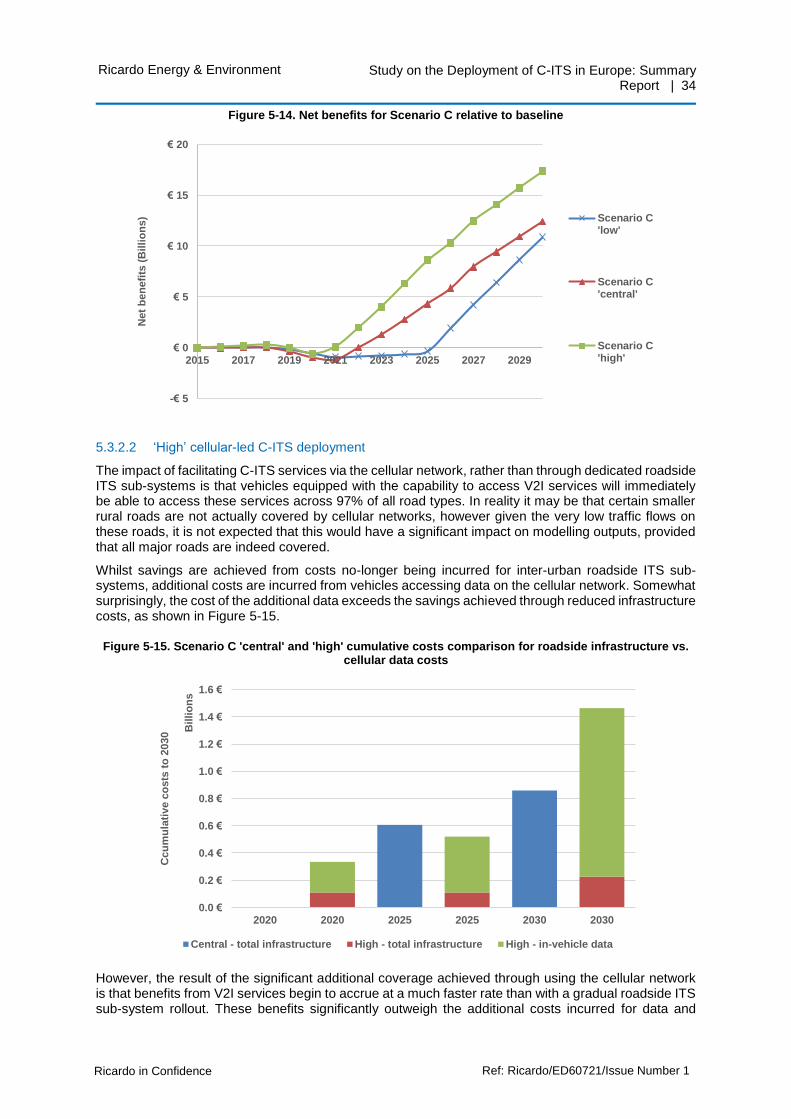
Study on the Deployment of C-ITS in Europe: Summary Report | 34
Ricardo in Confidence Ref: Ricardo/ED60721/Issue Number 1
Ricardo Energy & Environment
Figure 5-14. Net benefits for Scenario C relative to baseline
5.3.2.2 ‘High’ cellular-led C-ITS deployment
The impact of facilitating C-ITS services via the cellular network, rather than through dedicated roadside ITS sub-systems is that vehicles equipped with the capability to access V2I services will immediately be able to access these services across 97% of all road types. In reality it may be that certain smaller rural roads are not actually covered by cellular networks, however given the very low traffic flows on these roads, it is not expected that this would have a significant impact on modelling outputs, provided that all major roads are indeed covered.
Whilst savings are achieved from costs no-longer being incurred for inter-urban roadside ITS sub-systems, additional costs are incurred from vehicles accessing data on the cellular network. Somewhat surprisingly, the cost of the additional data exceeds the savings achieved through reduced infrastructure costs, as shown in Figure 5-15.
Figure 5-15. Scenario C 'central' and 'high' cumulative costs comparison for roadside infrastructure vs. cellular data costs
However, the result of the significant additional coverage achieved through using the cellular network is that benefits from V2I services begin to accrue at a much faster rate than with a gradual roadside ITS sub-system rollout. These benefits significantly outweigh the additional costs incurred for data and
-€ 5
€ 0
€ 5
€ 10
€ 15
€ 20
2015 2017 2019 2021 2023 2025 2027 2029
Net
be
nefi
ts (
Bil
lio
ns
) Scenario C'low'
Scenario C'central'
Scenario C'high'
0.0 €
0.2 €
0.4 €
0.6 €
0.8 €
1.0 €
1.2 €
1.4 €
1.6 €
2020 2020 2025 2025 2030 2030
Ccu
mu
lati
ve c
os
ts t
o 2
030
Bil
lio
ns
Central - total infrastructure High - total infrastructure High - in-vehicle data

Study on the Deployment of C-ITS in Europe: Summary Report | 35
Ricardo in Confidence Ref: Ricardo/ED60721/Issue Number 1
Ricardo Energy & Environment
cashflow break-even is achieved one year earlier than for the ‘central’ sensitivity and only three years after the initial vehicle deployments, making the investment a much more attractive proposition than in the ‘low’ and ‘central’ sensitivities. Annual net benefits in 2030 increase by nearly €5bn to €17.3bn, with the BCR increasing to 7.4 from 6.1.
The ‘high’ sensitivity illustrates the strong potential for cellular networks to improve the payback period and total benefits achieved from the deployment of C-ITS services through enabling much wider coverage of V2I services from day 1. A Whilst many uncertainties remain around the possibility of using cellular networks in this way (including latency times for safety-based services, lack of understanding of future business models or roaming issues, costs, effect on individual service impacts, etc.), there is a clear argument for carrying out additional research and early deployment efforts in this area with the aim of clarifying uncertainties and supporting accelerated deployment of C-ITS services in Europe, with the associated improved benefits that this could bring.

Study on the Deployment of C-ITS in Europe: Summary Report | 36
Ricardo in Confidence Ref: Ricardo/ED60721/Issue Number 1
Ricardo Energy & Environment
6 Conclusions and recommendations
Alongside an extensive literature review, case study assessment and problem definition, a detailed data collection and modelling exercise has provided a series of insights into the costs and benefits of deploying C-ITS services in Europe. Clearly the deployment of C-ITS services is beneficial at a European level and can contribute significantly to the Europe 2020 goals, as well as the strategic priorities of the Commission that have been published in its new work plan.
Whilst the scope of this study does not attempt to provide specific policy recommendations to the Commission, a number of clear conclusions and recommendations can be drawn from the outputs of the cost-benefit-analysis in particular, as well as from the case studies developed.
These are summarised in the boxes below and can be used by the DG MOVE and the C-ITS Platform to support the development of a shared vision and a common deployment strategy for C-ITS in Europe, as well as by DG MOVE in preparing a Commission Communication on the deployment of С-ITS.
A small number of cost and benefit categories dominate overall cost-effectiveness of C-ITS
The CBA analysis clearly illustrates the dominance of a small number of cost and benefit items to the overall cost-effectiveness of C-ITS services in Europe. In particular:
Dominant costs: the in-vehicle ITS sub-system costs, i.e. the costs of the hardware required to support the deployment C-ITS services to vehicles, make up by far the greatest portion of total costs of the C-ITS rollout (c. 86% of total cumulative costs to 2030 in Scenario E ‘central’), followed personal ITS sub-systems, i.e. aftermarket devices, which make up c. 10% of total cumulative costs to 2030. Together these cost items make up over 96% of total cumulative costs in Scenario E ‘central’.
Dominant benefits: the biggest contributor to monetised benefits are benefits from reduced travel times/increased efficiency, totalling 66% of total cumulative benefits to 2030 in Scenario E ‘central’, followed by reduced accident rates (22%) and fuel consumption savings (11%). Together these three elements make up c. 99% of total cumulative benefits in Scenario E ‘central’, with monetise benefits from emissions and CO2 savings being minimal
There is a significant benefit from deploying more services due to initial investment costs
In order to deploy even the most basic safety-related V2V and V2I C-ITS services, a significant investment is required in in-vehicle hardware/aftermarket devices and roadside infrastructure. The result is that when deploying a small number of services (as in Scenario A), costs ramp up rapidly, but benefits remain relatively low.
Whilst overall cost-effectiveness is still achieved (with an annual/cumulative BCR of 2.7 and 1.0 respectively for Scenario A ‘central’), adding additional services enables significant additional benefits to be accrued with minimal additional investment costs (e.g. Scenario E ‘central’ has an annual/cumulative BCR of 6.2 and 2.8 respectively with total cumulative costs only c. 4% higher).
More rapid deployment results in faster break-even due to ‘network’ effects
Through evaluating a number of sensitivities for the rollout rates of C-ITS in Europe, it has been established that increasing the rollout rate of C-ITS services and supporting infrastructure results in higher initial costs, but a more rapid break-even and better overall benefits. This due to the ‘network’ effects of larger numbers of equipped vehicles and infrastructure resulting in a much more rapid accrual of benefits in early deployment years.
For example cashflow break-even is achieved in 2022 in the ‘central’ sensitivity, compared to 2027 for the ‘low’ sensitivity, with 2030 net benefits c. €1.5bn per year higher and a higher BCR of 6.1 vs. 5.4 in the ‘central’ sensitivity – clearly demonstrating the benefits of targeting a more rapid rollout, to enable quicker payback periods and higher overall benefits.

Study on the Deployment of C-ITS in Europe: Summary Report | 37
Ricardo in Confidence Ref: Ricardo/ED60721/Issue Number 1
Ricardo Energy & Environment
Using cellular networks to provide V2I services can have immediate benefits
The ‘high’ sensitivity considered in the CBA analysis evaluated the impact of using the cellular network to provide V2I services, rather than dedicated roadside infrastructure – thereby achieving a very high infrastructure penetration across all roads from day 1. The results indicate a significantly faster ramp-up of benefits in the early years of deployment, with cashflow break-even occurring earlier and annual net benefits in 2030 increasing by nearly €5bn to €17.3bn, with the BCR increasing to 7.4 from 6.1.
Whilst many uncertainties remain around the possibility of using cellular networks in this way (including latency times for safety-based services, lack of understanding of future business models or roaming issues, costs, effect on individual service impacts, etc.), there is a clear argument for carrying out further work on this topic with the aim of clarifying uncertainties and supporting accelerated deployment of C-ITS services in Europe, with the associated improved benefits that this could bring.
C-ITS deployment is highly beneficial at an EU level, but coordinated action is required
The CBA analysis estimates very high benefit-cost-ratios (BCR) for the deployment of C-ITS in Europe, for example a BCR of 6.2 annually or 2.8 cumulatively for Scenario E ‘central’ by 2030.
However, whilst many of the benefits are relatively long-term societal benefits which may be felt by a range of stakeholders, the main investors in the deployment are likely to be the consumers who pay for the C-ITS hardware on-board new vehicles, or in aftermarket devices, as well as the highways agencies/urban transport authorities that invest in infrastructure. As such, it is unlikely that C-ITS deployments and associated investment decisions will be made at a European level.
However, the success of C-ITS deployment relies on achieving significant ‘network’ effects through the rapid rollout of both vehicles and infrastructure across a large number of Member States. As such, strong coordination will be required to support a successful, widespread rollout across Europe, including:
Standards: Ensuring interoperability of services between regions within and between Member States will be essential for a successful rollout of C-ITS in Europe.
Industry: A wide range of industry players are preparing to enter the market for C-ITS services, many through already-established public-private partnerships aimed at removing the ‘chicken and egg’ situation of infrastructure and vehicle rollout, as well as ensuring a coordinated approach to deployment. Continued cooperation through these channels will be essential in ensuring a widespread and rapid rollout of C-ITS services aimed at maximising the benefits achievable.
Consumers: Consumers tend to have a relatively short-term time horizon when considering investment decisions, whilst many of the benefits accrued through the deployment of C-ITS services are longer-term and may not be felt by the consumer directly. As such, efforts must be made to provide services that provide added value to consumers, as well to engage with consumers to highlight the less tangible benefits of investing in C-ITS, e.g. improved safety, health and travel times.
Highway agencies and urban transport authorities: Despite the fact that roadside ITS sub-system and associated traffic management system integration and software development costs make up only a small proportion of overall C-ITS deployment costs, at a local or regional level these investments may still make up a significant portion of investment budgets. Given the uncertainty in the cost data available for estimating these costs and the wide range of local factors that could impact individual business plans, there is a need for further work to evaluate the true costs and benefits of C-ITS deployments at a more local and regional level.
National and European Government: the benefits of C-ITS deployment should be highlighted to key policymakers across Europe and any support required to facilitate the deployment of C-ITS (e.g. through standards, regulations, financial support, coordination support, etc.) should be requested in a timely manner and in a coordinated fashion.

Study on the Deployment of C-ITS in Europe: Summary Report | 38
Ricardo in Confidence Ref: Ricardo/ED60721/Issue Number 1
Ricardo Energy & Environment
Additional evidence is required in a number of fields to support the deployment of C-ITS
Whilst the data collection and stakeholder consultation exercise identified sufficient evidence to enable a full assessment of the costs and benefits of C-ITS services, evidence and data was significantly stronger in some areas than others. In particular data on the impacts of safety-related services was quite strong, whilst cost data for in-vehicle and roadside sub-systems was widely available. However, additional detailed assessments in a number of fields would benefit any future analysis, including:
Urban-related services: Despite urban-related services contributing c. 50% of total benefits achievable from the rollout of C-ITS (as measured in Scenario E ‘central’), the data behind the services which enable many of these benefits is very limited – particularly services such as ‘parking information’, ‘smart routing’, ‘traffic light optimisation’. etc. In order to confirm the benefits available from these services and support local investment decisions into the hardware and infrastructure required to support them, additional work is required, ideally in the form of field operational trials (FOTs) to prove the benefits in the real world.
Personal ITS sub-system (aftermarket device) costs: Whilst it is generally accepted that aftermarket devices will make up a significant portion of future sales, there is very little evidence to show what form these devices will take, nor what the likely costs or business models will be for these systems. The analysis in this study was based on simple business models and assumptions around adapting known devices (e.g. personal navigation devices and smartphones) to deliver C-ITS services, however additional work in this field, particularly around the likely services that could be offered via these devices, the business models associated with them, their likely market penetration and costs would be beneficial to any future analysis or real-life business planning.
Central ITS sub-system costs: Central ITS sub-systems refer to the back-office systems that would be required to link roadside units, vehicles and national/regional traffic management centres. There is a clear requirement for these systems to be developed for a successful rollout of C-ITS services, yet only limited information exists on their capabilities and costs. Additional research in this field, ideally based on planned/existing large-scale deployment trials would be beneficial.
Local and national costs and impacts: The analysis in this study assumes uniform impacts of services across all Member States and uniform costs for all hardware and infrastructure deployed. It is unlikely that this would be the case in practice due to the different driving practices, regulations and standards in place and the different business models and existing infrastructure in place across different Member States. As investors move towards developing business cases at a national/regional/local level for the deployment of C-ITS services, it is therefore essential that more localised data becomes available on both the costs and impacts of deploying C-ITS services. Ideally this data would come from additional FOT projects in a range of representative Member States.

The Gemini Building Fermi Avenue Harwell Didcot Oxfordshire OX11 0QR United Kingdom
t: +44 (0)1235 753000 e: [email protected]
ee.ricardo.com