supporting information manganese buffer induced high
TRANSCRIPT

Supporting Information
Manganese Buffer Induced High-performance Disordered MnVO
Cathodes in Zinc Battery
Shiqiang Weia,†, Shuangming Chena,†, Xiaozhi Sub, Zhenghang Qia, Changda Wanga, Babu Gangulid, Pengjun Zhanga,
Kefu Zhua, Yuyang Caoa, Qun Hea, Dengfeng Caoa, Xin Guoa, Wen Wenb, Xiaojun Wuc, Pulickel M. Ajayand and Li
Songa* a. National Synchrotron Radiation Laboratory, CAS Center for Excellence in Nanoscience, University of Science
and Technology of China, Hefei, Anhui 230029, P.R. China.
b. Shanghai Synchrotron Radiation Facility, Shanghai Advanced Research Institute, Chinese Academy of
Sciences, Shanghai 201204, P.R. China.
c. School of Chemistry and Material Sciences, University of Science and Technology of China, Hefei, Anhui
230026, P.R. China.
d. Department of Materials Science and Nano Engineering, Rice University, Houston, TX 77005, USA.
Email: [email protected]
† These authors contributed equally to this work.
Electronic Supplementary Material (ESI) for Energy & Environmental Science.This journal is © The Royal Society of Chemistry 2021
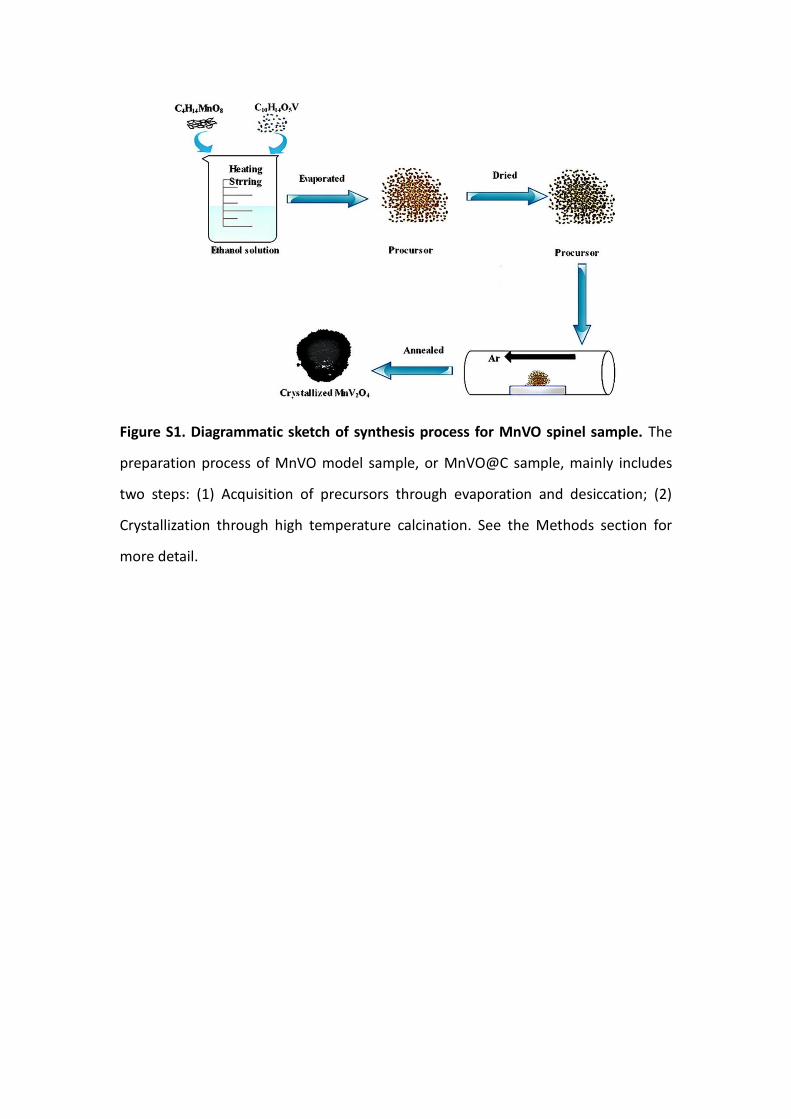
Figure S1. Diagrammatic sketch of synthesis process for MnVO spinel sample. The
preparation process of MnVO model sample, or MnVO@C sample, mainly includes
two steps: (1) Acquisition of precursors through evaporation and desiccation; (2)
Crystallization through high temperature calcination. See the Methods section for
more detail.

Figure S2. Scanning electron microscope (SEM) image of MnVO spinel. The
morphology of MnVO sample is micron-nano-sized particles, which assure the full
contact of active material and electrolyte. These particles have the same traditional
morphology as other spinels synthesized by high temperature calcination, like spinels
for lithium ion battery (LIB) and spinels for zinc ion battery (ZIB).1, 2

Figure S3. Transmission electron microscope. (a) High resolution transmission
electron microscope (HR-TEM) image of MnVO spinel, inset is the magnification of
local image. It is clearly shown that the well crystallized and orderly structure can be
obtained. The high crystallinity is attributed to the high temperature of 800 ℃ used in
annealed process. The crystalline interplanar spacing of 2.57 Å is indexed to
crystallographic planes of (311) of MnVO spinel, indicating the successful preparation
for structure model. (b) Atomic resolution HAADF-STEM image of MnVO spinel. The
features of high crystallization and free of defects for MnVO spinel are further shown
in atomic resolution STEM image.
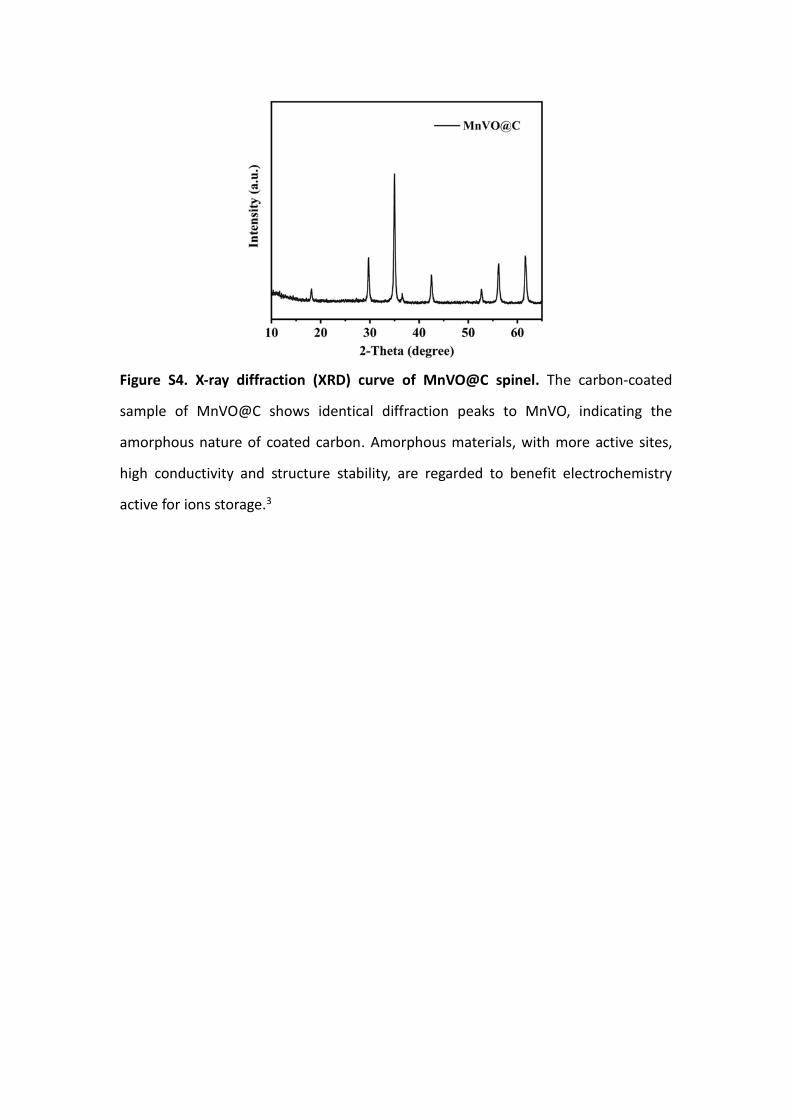
Figure S4. X-ray diffraction (XRD) curve of MnVO@C spinel. The carbon-coated
sample of MnVO@C shows identical diffraction peaks to MnVO, indicating the
amorphous nature of coated carbon. Amorphous materials, with more active sites,
high conductivity and structure stability, are regarded to benefit electrochemistry
active for ions storage.3

Figure S5. High resolution transmission electron microscope (HR-TEM) image of
MnVO@C spinel. It is clearly shown that the amorphous carbon layer with a thickness
of about 6 nm is coated on the surface of MnVO uniformly. Besides, crystallographic
planes with 2.57 Å and 3.00 Å interplanar spacing correspond to (311) and (220) of
MnVO, respectively.

Figure S6. SEM element mapping of MnVO@C spinel. The elements of Mn, V, O and
C are homogeneously dispersed in the entire area of MnVO@C. In the method for
preparation of samples, the homogeneous precursor can be successfully obtained by
using the liquid phase method under rapid agitation. High quality samples gauged by
XRD originate in the uniformity of precursor.
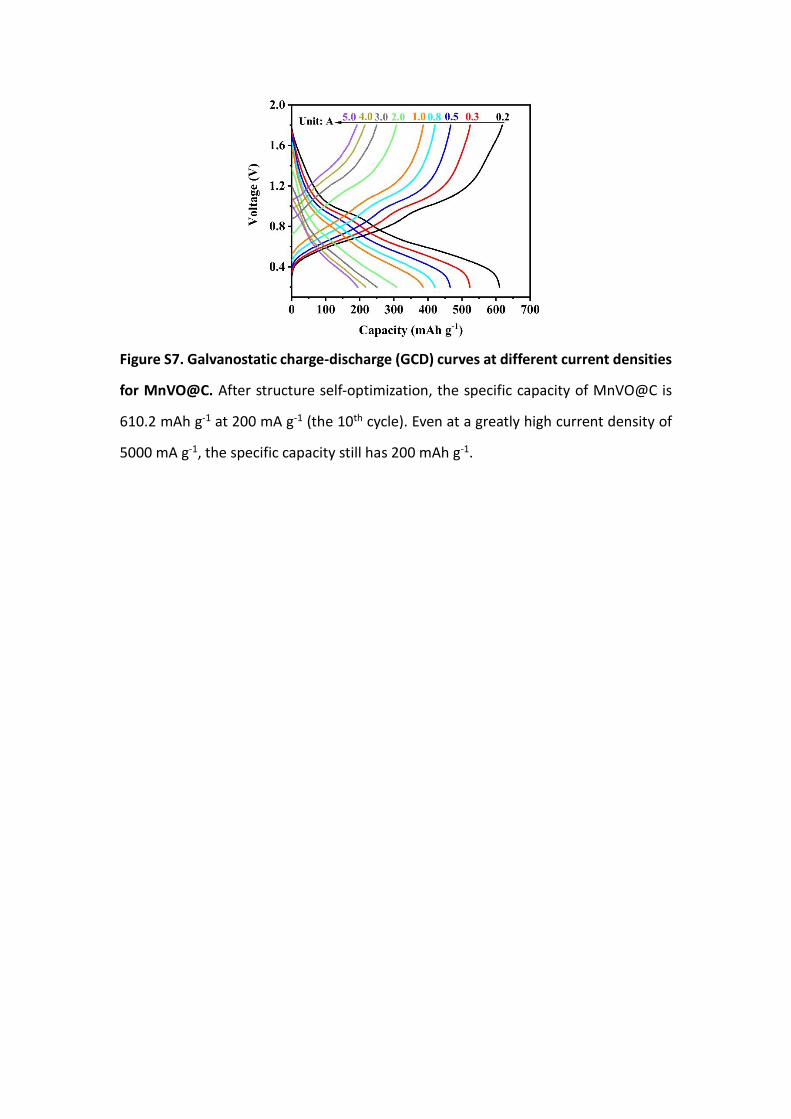
Figure S7. Galvanostatic charge-discharge (GCD) curves at different current densities
for MnVO@C. After structure self-optimization, the specific capacity of MnVO@C is
610.2 mAh g-1 at 200 mA g-1 (the 10th cycle). Even at a greatly high current density of
5000 mA g-1, the specific capacity still has 200 mAh g-1.

Figure S8. Specific discharged capacities of three batteries at the 10th cycles for
MnVO@C. Three batteries were assembled to assess the capacity undulations. It can
be seen that the battery 1, 2 and 3 have specific capacities of 615.5, 610.2 and 601.3
mAh g-1, respectively. We chose the median value of 610.2 mAh g-1 as the
representative capacity value in the main text. The average specific capacity is 609.0
mAh g-1 with a standard deviation of 5.86. Besides, the Coulombic efficiency of these
three batteries is100.10%, 98.71% and 99.24%, respectively. The average Coulombic
efficiency is 99.35% with a standard deviation of 0.99%.

Figure S9. Cyclic stability at low current density of 1.0 A g-1 for MnVO@C, ZnVO@C,
and V3O7. The cyclic stability of MnVO@C electrode at low current density was
measured at 1.0 A g-1. The MnVO@C electrode exhibits stable cycling with a high
specific capacity of 370 mAh g-1 after 100 cycles, contrasting sharply with the ZnVO@C
electrode and V3O7 electrodes without manganese (only 118.1 mAh g-1 for ZnVO@C
and 224.8 mAh g-1 after 100 cycles).

Table S1. The comparision of specific capacity between MnVO@C and other
cathodes. The recent preeminent scientific reseaches on Zn ion batteries (ZIBs) are
selected to compare with this work, including V-based, Mn-based oxide and other
compounds. Attentively, the current density and electrolyte used in these works are
noted in the table.
Serial
number
Cathode capacity
(mA h g-1)
Current
(mA g-1)
Electrolyte
1 Na0.33V2O54 367.1 100 3M Zn(CF3SO3)2
2 V2O55 470 200 3M Zn(CF3SO3)2
3 MgxV2O5·nH2O6 353 100 3M Zn(CF3SO3)2
4 V2O5·nH2O7 381 300 3M Zn(CF3SO3)2
5 MnVO8 415 50 3M Zn(CF3SO3)2
6 CaVO9 466 100 3M Zn(CF3SO3)2
1 K0.8Mn8O1610 320 100 2 M ZnSO4/0.1 M
MnSO4
2 α-MnO211 290 90 2 M ZnSO4/0.2 M
MnSO4
3 MGS12 362.2 300 2 M ZnSO4/0.2 M
MnSO4
4 Od-MnO213 345 200 1 M ZnSO4/0.2 M
MnSO4
5 P-MnO2-x14 302.8 500 2 M ZnSO4/0.2 M
MnSO4
6 cw-MnO215 350 100 1 M ZnSO4
1 VS216 190.3 50 1 M ZnSO4
2 CoFe(CN)617 173.4 300 4 m Zn(OTf)2
3 ZnMn2O4/C1 150 50 3M Zn(CF3SO3)2
4 MgV2O418 272 200 2 M Zn(TFSI)2
5 Na0.14TiS219 140 50 2M Zn(CF3SO3)2
6 Bi2S320 161 200 2 M ZnSO4
This
work
MnVO@C 615 200 3M Zn(CF3SO3)2

Table S2. The comparison between MnVO@C and other vanadium- based cathodes
using two common descriptors of specific capacity and cycle life. The performance of
MnVO@C is benchmarked with the state-of-the-art ones using specific capacity and
cycle life as descriptors to illustrate the significant buffer role of Mn ions in the self-
optimized cathode.
Description Cathode Capacity (current
density A g-1)
Cycle life (current
density A g-1)
Mn-optimized
vanadium oxide
MnVO8 415 (50) 2000 (4)
MnVO-30021 357 (500) 1500 (10)
Other metal ions-optimized
vanadium oxide
Zn0.25V2O5·nH2O22 300 (300) 1000 (2.4)
MgxV2O5·nH2O6 353 (100) 2000 (5.0)
δ-Ni0.25V2O5·nH2O23 402 (0.2) 1200 (5.0)
No metal ions-optimized
vanadium oxide
PVO-6024 400 (0.1) 1000 (10.0)
VN0.9O0.1525 603 (0.12) 1800 (25C)
V2O5·nH2O7 381 (0.06) 900 (6.0)
Amorphous vanadium oxide A-V2O5/G26 489 (0.1) 3000 (30.0)
This work MnVO@C 615 (0.2) 4000 (5.0)

Figure S10. The diagram of hole-opening coin cell used for operando SXRD test. A
hole-opening coin cell is designed based on the conventional coin cells used in
laboratory. In order to pass through the X-ray, holes are punched on the center of
positive shell, negative shell, gasket and Zn foil. Different from sodium and lithium, it
is crucial that a hole should be bored in the center of zinc wafer in older to avert the
strong adsorption of Zn for X-ray. After assembled, the holes on positive and negative
shells are sealed by Kapton tapes.

Figure S11. The measurement environment of operando SXRD test. The operando
SXRD is carried on at the beamline BL14B1 in Shanghai Synchrotron Radiation Facility
(SSRF), which equips with a Huber 5021 six-circle diffractometer system and a Mythen
1K linear detector. The above mentioned hole-opening coin cell (Figure S10), pasted
on synchrotron radiation device, is operated on Land CT2001A battery test system.

Figure S12. The separators unfolded after suffering different cut-off voltage cycles.
The batteries are separated at different representative voltage states to observe what
has happened inside. It is found that the separator is in white after first discharged to
0.2 V, however, the separators become darker black after first charged to 1.8 V (after
structure self-optimization) and remain unchanged on subsequent cycles. The same
results are also obtained for the surface of Zn anode.
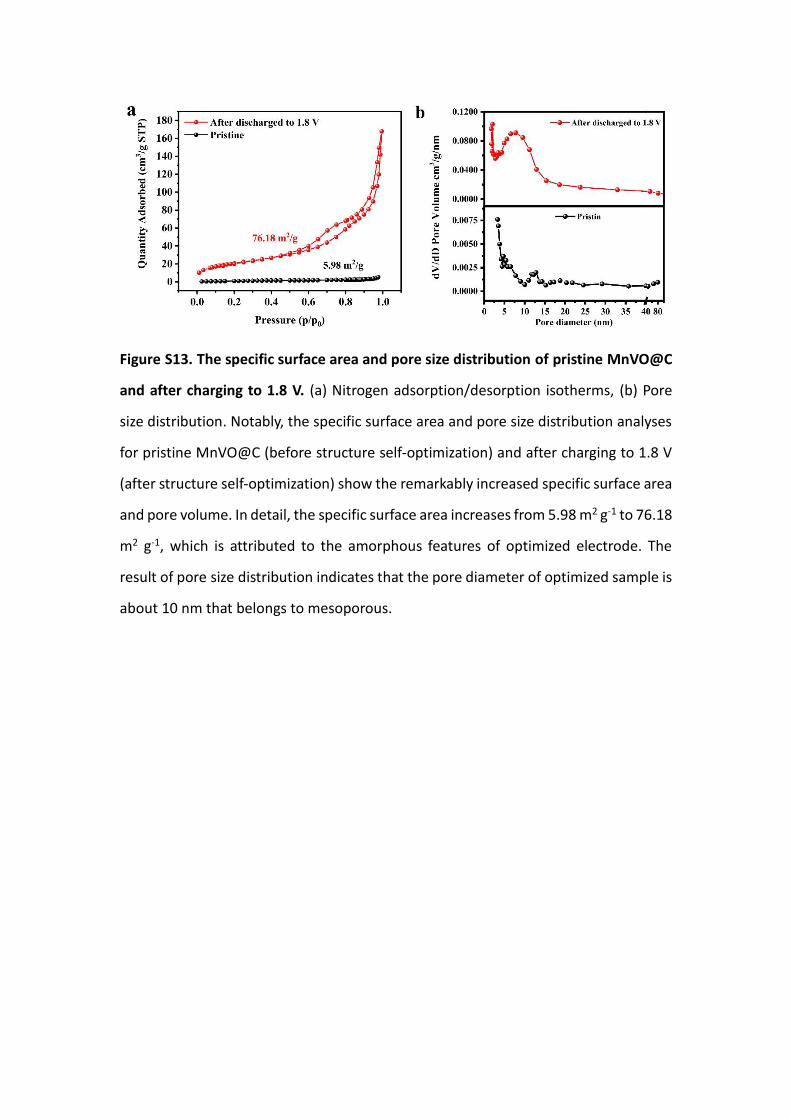
Figure S13. The specific surface area and pore size distribution of pristine MnVO@C
and after charging to 1.8 V. (a) Nitrogen adsorption/desorption isotherms, (b) Pore
size distribution. Notably, the specific surface area and pore size distribution analyses
for pristine MnVO@C (before structure self-optimization) and after charging to 1.8 V
(after structure self-optimization) show the remarkably increased specific surface area
and pore volume. In detail, the specific surface area increases from 5.98 m2 g-1 to 76.18
m2 g-1, which is attributed to the amorphous features of optimized electrode. The
result of pore size distribution indicates that the pore diameter of optimized sample is
about 10 nm that belongs to mesoporous.

Figure S14. The electrochemical impedance spectroscopy (EIS) spectra of the
MnVO@C model before (Initial) and after structure self-optimization (After 1st-C1.8).
The diameter of semicircle at high frequency region represents the charge transfer
resistance (Rct) of the electrode/electrolyte interface. The value of Rct for initial state is
about 40 Ω while 1000 Ω for the state of 1st-C1.8. The rapidly descended Rct is induced
by structure self-optimization.

Figure S15. Kinetic analysis of Zn2+ for MnVO@C electrode. (a) The cyclic voltammetry
(CV) curves at different scan rates. (b) The b values calculated from the CV curves. In
CV, the current density i (A) and scan rate ν (V/s) conform to a formula i=aνb, where a
and b are constants. When b=0.5, it denotes a diffusion-controlled electrochemical
process, and while b=1 implies a surface-controlled or capacitive electrochemical
process.27 In MnVO@C for Zn2+ storage, the b values calculated from peaks a, b, c and
d are 0.68, 0.90, 0.91 and 0.89 respectively. It hints that the charge is stored with both
diffusion-controlled and capacitance processes.

Figure S16. (a-d) V K-edge EXAFS spectra and corresponding fitting curves of MnVO@C
electrodes at different states.
Table S3. V K-edge EXAFS fitting parameters.
Sample Path N R (Å) σ2(10-3 Å2)
1st D0.2 V-O 5.6 2.03 5.4
V-V 6.1 3.02 6.8
1st C1.8 V-O 2.9 1.52 2.5
V-O 1.5 1.99 2.8
2nd D0.2 V-O 3.3 1.54 2.7
V-O 1.7 2.03 3.2
2nd C1.8 V-O 2.4 1.52 2.5
V-O 2.3 1.98 4.9
V2O3 V-O 3.0* 1.93 3.2
V-O 3.0* 2.04 2.1
N, coordination number; R, distance between absorber and backscatter atoms; σ2,
Debye-Waller factor to account for both thermal and structural disorders. Error limits
(accuracies) were estimated as follows: CN, ±10%; bond length, ±1%; σ2, ±10%. * refers
to the fixed coordination number according to the standard crystal structure.

Figure S17. V K-edge XAFS study for MnVO@C electrodes. (a) The V K-edge XANES
spectra of MnVO@C at various states, VO2 and V2O5, (b) Average valence of V in VO2,
V2O5, MnVO@C electrode at 2nd D0.2 V, and 2nd C1.8 V. The energy of absorption edge
is located at 5478.637 eV and 5484.542 eV for standard VO2 (+4) and V2O5 (+5),
respectively. According the linear relationship between valence and absorption energy,
the average valence for MnVO@C electrode at 2nd D0.2 V (energy: 5482.998 eV) is
+4.73 and for MnVO@C electrode at 2nd D0.2 V (energy: 5483.767 eV ) is 4.87. Here,
we got the energy of absorption edge from the position where the first-order
derivative value reaches maximum.

Figure S18. Mn K-edge XAFS study for MnVO@C electrodes. (a) The Mn K-edge XANES
spectra of MnVO@C at various states, MnO, Mn2O3, MnO2, (b) Average valence of Mn
in MnO, MnO2, Mn2O3, MnVO@C electrode at 1st C1.8 V, 2nd D0.2 V and 2nd C1.8 V. The
energy of absorption edge is located at 6544.56 eV, 6550.17 eV and 6557.652 eV for
standard MnO (+2), Mn2O3 (+3) and Mn2O5 (+4), respectively. According the linear
relationship between valence and absorption energy, the average valence for
MnVO@C electrode at 2nd D0.2 V (energy: 6547.197 eV) is +2.39 and for MnVO@C
electrode at 2nd D0.2 V (energy: 6548.002 eV ) is 2.55. Here, we got the energy of
absorption edge from the position where the first-order derivative value reaches
maximum.
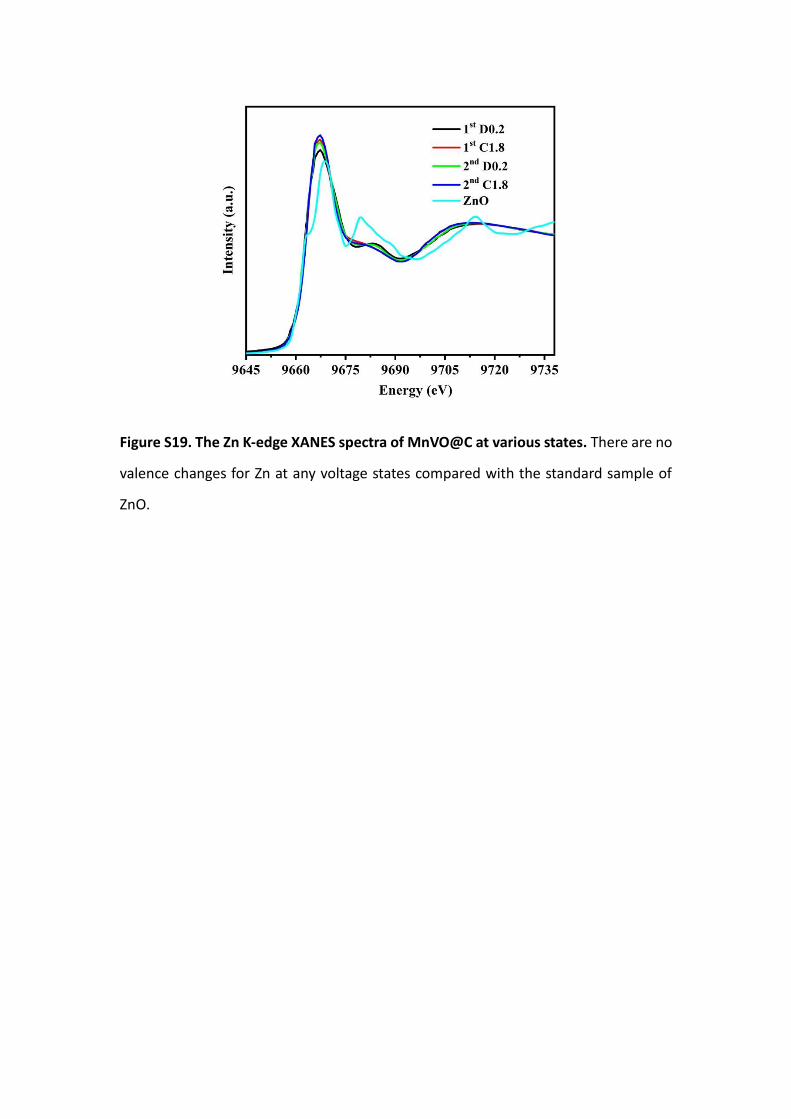
Figure S19. The Zn K-edge XANES spectra of MnVO@C at various states. There are no
valence changes for Zn at any voltage states compared with the standard sample of
ZnO.

Figure S20. (a-d) Mn K-edge EXAFS spectra and corresponding fitting curves of
MnVO@C electrodes at different states.
Table S4. Mn K-edge EXAFS fitting parameters.
Sample Path N R (Å) σ2(10-3 Å2)
1st D0.2
Mn-O 4.5 2.01 6.7
Mn-V/O 11.4 3.54 6.3
Mn-Mn 3.5 3.74 3.5
1st C1.8
Mn-O 4.9 2.08 5.2
Mn-V/O 6.2 3.52 13.2
Mn-Mn 0.8 3.08 5.8
2nd D0.2
Mn-O 4.4 2.00 5.7
Mn-V/O 8.4 3.53 5.4
Mn-Mn 3.1 3.72 3.7
2nd C1.8
Mn-O 5.0 2.09 6.4
Mn-V/O 3.9 3.52 9.7
Mn-Mn 2.0 3.07 14.4
MnO2 Mn-O 3.0 * 1.84 1.8
Mn-O 3.0 * 1.90 1.9
N, coordination number; R, distance between absorber and backscatter atoms; σ2,
Debye-Waller factor to account for both thermal and structural disorders. Error limits
(accuracies) were estimated as follows: CN, ±10%; bond length, ±1%; σ2, ±10%. * refers
to the fixed coordination number according to the standard crystal structure.

Figure S21. (a-d) Zn K-edge EXAFS spectra and corresponding fitting curves of
MnVO@C electrodes at different states.
Table S5. Zn K-edge EXAFS fitting parameters.
Sample Path N R (Å) σ2(10-3 Å2)
1st D0.2
Zn-O 5.9 2.02 11.3
Zn-V 1.0 3.05 5.6
Zn-V 3.4 3.44 9.0
1st C1.8 Zn-O 5.6 2.05 9.1
2nd D0.2
Zn-O 6.2 2.03 11.5
Zn-V 0.8 2.92 8.1
Zn-V 2.9 3.42 10.2
2nd C1.8 Zn-O 6.1 2.05 9.5
1 M ZnSO4 Zn-O 6.0* 2.08 7.5
The different tetrahedron or octahedron cation sites are comformed by EXAFS,
more precisely reflected in refinement results. Elaborately, it has been shown in the
literature that the chemical bond between metal atoms in tetrahedron and oxygen
ions is slightly shorter than the counterpart in octahedron (M-Otetra < M-Oocta)28, 29.
According to the refinement results in Table S4, it is finding that the length of Mn-O
bond at the fully discharged (2.00 and 2.01 Å) is shorter than the bond at fully charged
(2.08 and 2.09 Å). Besides, the Mn-Mn bonds at fully discharged are 3.74 and 3.72 Å,

which are longer than the Mn-Mn bonds at fully charged of 3.08 and 3.07 Å,
conforming to the law of the distance between two octahedron sites is commonly
shorter than the bonds between two tetrahedron sites. Therefore, it can be concluded
that Mn2+ is in tetrahedron sites when Zn2+ is intercalated and in octahedron sites
when Zn2+ is extracted. Additional information can be obtained for the fitting results
of Zn K-edge is the near six-coordinated environment of Zn2+ at the intercalated states,
which indicates that the Zn2+ is in octahedron sites after fully discharged (Figure S21
and Table S5).
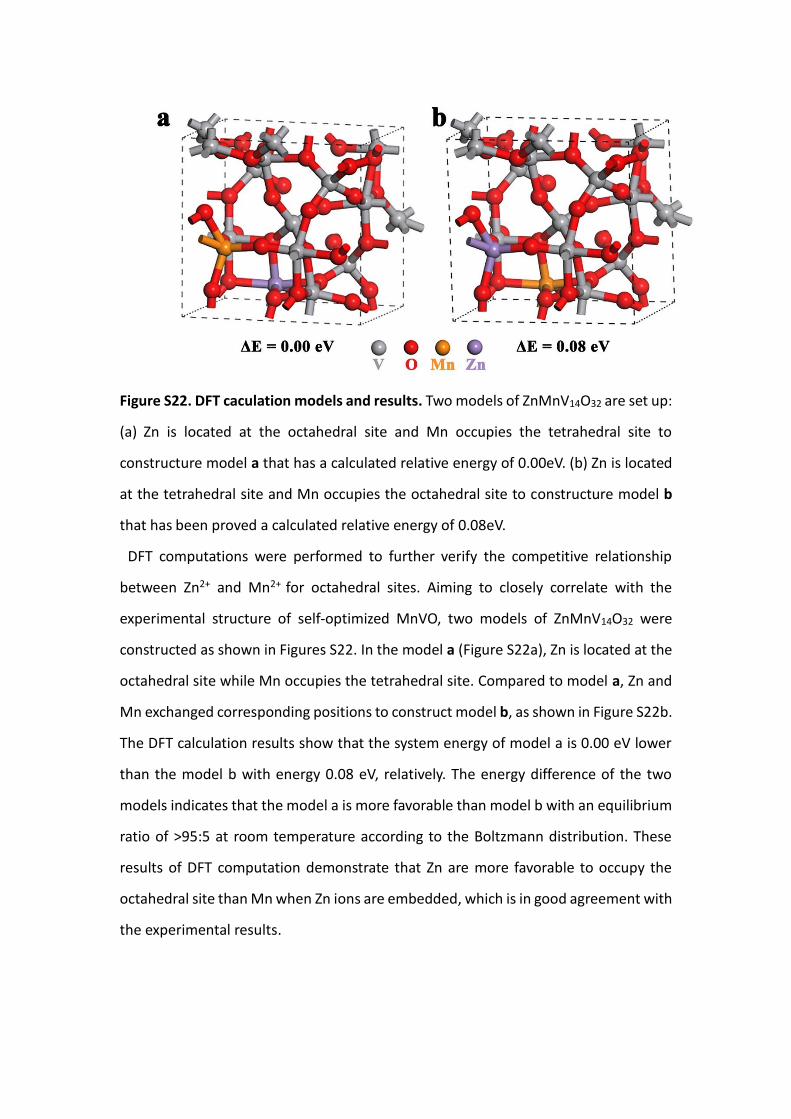
Figure S22. DFT caculation models and results. Two models of ZnMnV14O32 are set up:
(a) Zn is located at the octahedral site and Mn occupies the tetrahedral site to
constructure model a that has a calculated relative energy of 0.00eV. (b) Zn is located
at the tetrahedral site and Mn occupies the octahedral site to constructure model b
that has been proved a calculated relative energy of 0.08eV.
DFT computations were performed to further verify the competitive relationship
between Zn2+ and Mn2+ for octahedral sites. Aiming to closely correlate with the
experimental structure of self-optimized MnVO, two models of ZnMnV14O32 were
constructed as shown in Figures S22. In the model a (Figure S22a), Zn is located at the
octahedral site while Mn occupies the tetrahedral site. Compared to model a, Zn and
Mn exchanged corresponding positions to construct model b, as shown in Figure S22b.
The DFT calculation results show that the system energy of model a is 0.00 eV lower
than the model b with energy 0.08 eV, relatively. The energy difference of the two
models indicates that the model a is more favorable than model b with an equilibrium
ratio of >95:5 at room temperature according to the Boltzmann distribution. These
results of DFT computation demonstrate that Zn are more favorable to occupy the
octahedral site than Mn when Zn ions are embedded, which is in good agreement with
the experimental results.
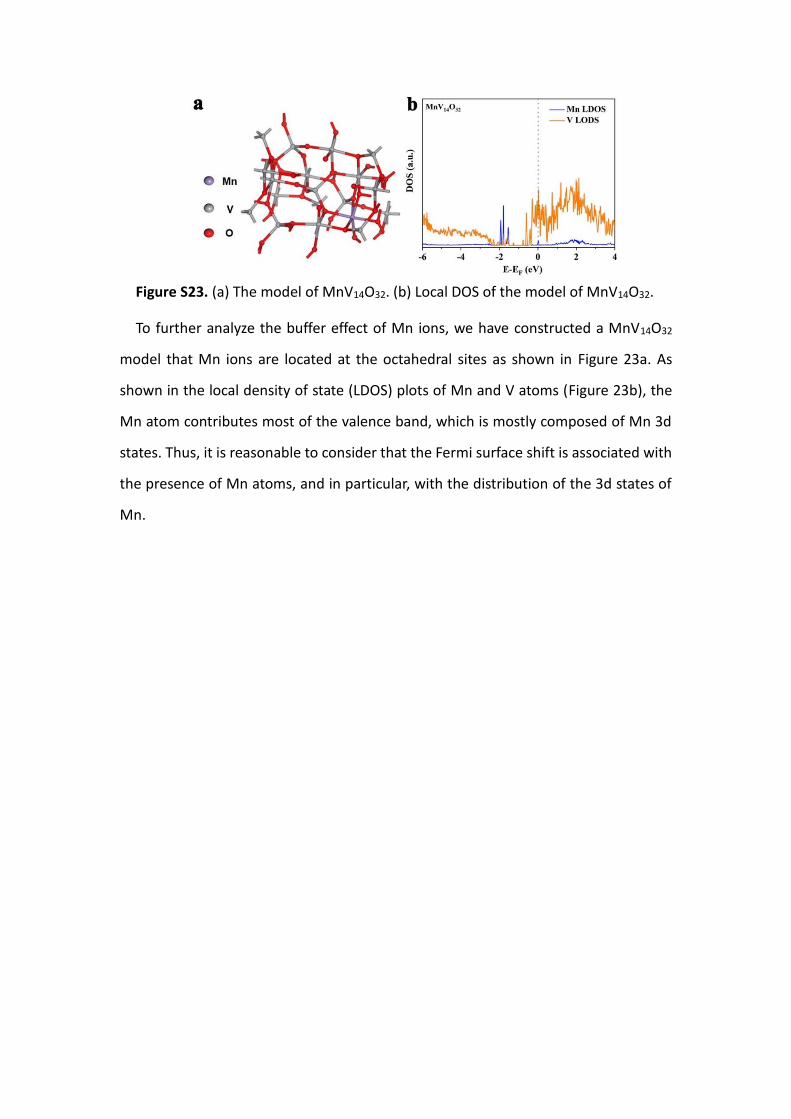
Figure S23. (a) The model of MnV14O32. (b) Local DOS of the model of MnV14O32.
To further analyze the buffer effect of Mn ions, we have constructed a MnV14O32
model that Mn ions are located at the octahedral sites as shown in Figure 23a. As
shown in the local density of state (LDOS) plots of Mn and V atoms (Figure 23b), the
Mn atom contributes most of the valence band, which is mostly composed of Mn 3d
states. Thus, it is reasonable to consider that the Fermi surface shift is associated with
the presence of Mn atoms, and in particular, with the distribution of the 3d states of
Mn.

Figure S24. The dQ/dV curves at 0.2 A g-1 for MnVO@C electrode (a) and ZnVO@C
electrode (b).
For comparison of the difference with or without Mn buffer, the electrochemical
behavior during Zn2+ insertion and prolapse of MnVO@C and ZnVO@C is analyzed by
dQ/dV curves. Two takeaways can be drawn from Figure S24: (1) The MnVO@C
electrode shows higher reduction potential and lower oxidation potential.
Specifically, the last reduction reaction of V in MnVO@C electrode happens at 0.586 V
while 0.563 V for no Mn buffer one. For oxidation process, the right-most oxidation
peak is at 1.01 V for MnVO@C while a new peak at 1.16 V is observed for ZnVO@C.
These results indicate that in MnVO@C electrode the valence of V would not be
reduced as much as ZnVO@C and equally would not be oxidized to 1.15 V like in
ZnVO@C electrode as the result of Mn buffer (voltage change become smaller). In
other words, the Fermi surface of V 3d in MnVO@C electrode would not
ascend/decline as much as ZnVO@C during Zn2+ de/intercalated process with the help
of Mn buffer. (2) The MnVO@C electrode shows lower overpotential and polarization.
Specifically, the two coupled redox waves in MnVO@C electrode show an
overpotential 0.088 and 0.068 V, respectively. For ZnVO@C electrode, the ZnVO@C
electrode shows an overpotential of 0.116 V at the low voltage region, and at high
voltage, the reduction peak corresponds to two oxidation peaks that with an
overpotential of 0.053 and 0.198 V, respectively. Besides, an obvious polarization peak
is found at 1.65 V for ZnVO@C, conversely, no polarization exists in MnVO@C at the
high voltage region. Lower overpotential and free polarization would be instrumental

in the stability of electrode host during Zn2+ de/intercalation process. In consequence,
such Mn-migration not only stabilizes the main structure of vanadium-based electrode,
but also modulates the Fermi surface of V 3d against overmuch drift.
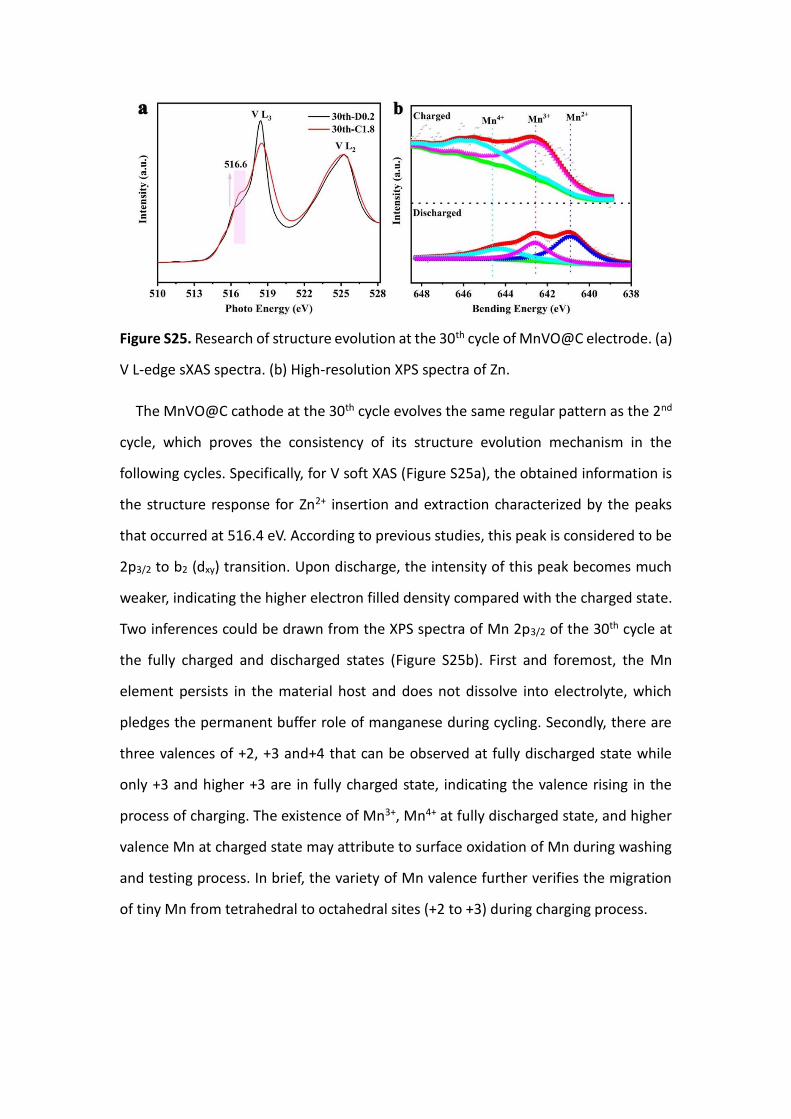
Figure S25. Research of structure evolution at the 30th cycle of MnVO@C electrode. (a)
V L-edge sXAS spectra. (b) High-resolution XPS spectra of Zn.
The MnVO@C cathode at the 30th cycle evolves the same regular pattern as the 2nd
cycle, which proves the consistency of its structure evolution mechanism in the
following cycles. Specifically, for V soft XAS (Figure S25a), the obtained information is
the structure response for Zn2+ insertion and extraction characterized by the peaks
that occurred at 516.4 eV. According to previous studies, this peak is considered to be
2p3/2 to b2 (dxy) transition. Upon discharge, the intensity of this peak becomes much
weaker, indicating the higher electron filled density compared with the charged state.
Two inferences could be drawn from the XPS spectra of Mn 2p3/2 of the 30th cycle at
the fully charged and discharged states (Figure S25b). First and foremost, the Mn
element persists in the material host and does not dissolve into electrolyte, which
pledges the permanent buffer role of manganese during cycling. Secondly, there are
three valences of +2, +3 and+4 that can be observed at fully discharged state while
only +3 and higher +3 are in fully charged state, indicating the valence rising in the
process of charging. The existence of Mn3+, Mn4+ at fully discharged state, and higher
valence Mn at charged state may attribute to surface oxidation of Mn during washing
and testing process. In brief, the variety of Mn valence further verifies the migration
of tiny Mn from tetrahedral to octahedral sites (+2 to +3) during charging process.

Figure S26. Mass change of MnVO@C electrode after first structure reconstruction.
We measured the mass decrement after first fully charged, it is finding that the average
mass lose is 10.4 wt. %. The measured mass decrement is less than the theoretical
value of Mn dissolution due to the compensation of oxygen.
REFERENCES 1 N. Zhang, F. Cheng, Y. Liu, Q. Zhao, K. Lei, C. Chen, X. Liu and J. Chen, J. Am. Chem. Soc., 2016, 138,
12894-12901.
2 Y. Tao, Z. Li, L. Tang, X. Pu, T. Cao, D. Cheng, Q. Xu, H. Liu, Y. Wang and Y. Xia, Electrochim. Acta, 2020,
331, 135296.
3 Y. Li, Q. Zhang, Y. Yuan, H. Liu, C. Yang, Z. Lin and J. Lu, Adv. Energy Mater., 2020, 10, 2000717.
4 P. He, G. Zhang, X. Liao, M. Yan, X. Xu, Q. An, J. Liu and L. Mai, Adv. Energy Mater., 2018, 8, 1702463.
5 N. Zhang, Y. Dong, M. Jia, X. Bian, Y. Wang, M. Qiu, J. Xu, Y. Liu, L. Jiao and F. Cheng, ACS Energy Lett.,
2018, 3, 1366-1372.
6 F. Ming, H. Liang, Y. Lei, S. Kandambeth, M. Eddaoudi and H. N. Alshareef, ACS Energy Lett., 2018, 3,
2602-2609.
7 M. Yan, P. He, Y. Chen, S. Wang, Q. Wei, K. Zhao, X. Xu, Q. An, Y. Shuang, Y. Shao, K. T. Mueller, L.
Mai, J. Liu and J. Yang, Adv. Mater., 2018, 30, 1703725.
8 C. Liu, Z. Neale, J. Zheng, X. Jia, J. Huang, M. Yan, M. Tian, M. Wang, J. Yang and G. Cao, Energy
Environ. Sci., 2019, 12, 2273-2285.
9 K. Zhu, T. Wu and K. Huang, ACS Nano, 2019, 13, 14447-14458.
10 G. Fang, C. Zhu, M. Chen, J. Zhou, B. Tang, X. Cao, X. Zheng, A. Pan and S. Liang, Adv. Funct. Mater.,
2019, 29, 1808375.
11 W. Sun, F. Wang, S. Hou, C. Yang, X. Fan, Z. Ma, T. Gao, F. Han, R. Hu, M. Zhu and C. Wang, J. Am.
Chem. Soc., 2017, 139, 9775-9778.
12 B. Wu, G. Zhang, M. Yan, T. Xiong, P. He, L. He, X. Xu and L. Mai, Small, 2018, 14, e1703850.
13 T. Xiong, Z. G. Yu, H. Wu, Y. Du, Q. Xie, J. Chen, Y. W. Zhang, S. J. Pennycook, W. S. V. Lee and J. Xue,
Adv. Energy Mater., 2019, 9, 1803815.
14 Y. Zhang, S. Deng, G. Pan, H. Zhang, B. Liu, X. L. Wang, X. Zheng, Q. Liu, X. Wang, X. Xia and J. Tu,
Small Methods, 2020, 4, 1900828.
15 K. W. Nam, H. Kim, J. H. Choi and J. W. Choi, Energy Environ. Sci., 2019, 12, 1999-2009.
16 P. He, M. Yan, G. Zhang, R. Sun, L. Chen, Q. An and L. Mai, Adv. Energy Mater., 2017, 7, 1601920.
17 L. Ma, S. Chen, C. Long, X. Li, Y. Zhao, Z. Liu, Z. Huang, B. Dong, J. A. Zapien and C. Zhi, Adv. Energy
Mater., 2019, 9, 1902446.
18 W. Tang, B. Lan, C. Tang, Q. An, L. Chen, W. Zhang, C. Zuo, S. Dong and P. Luo, ACS Sustain. Chem.
Eng., 2020, 8, 3681-3688.
19 W. Li, K. Wang, S. Cheng and K. Jiang, Adv. Energy Mater., 2019, 9, 1900993.
20 T. Xiong, Y. Wang, B. Yin, W. Shi, W. S. V. Lee and J. Xue, Nano-Micro Lett., 2019, 12, 8.
21 Y. Yang, Y. Tang, S. Liang, Z. Wu, G. Fang, X. Cao, C. Wang, T. Lin, A. Pan and J. Zhou, Nano Energy,
2019, 61, 617-625.
22 D. Kundu, B. D. Adams, V. Duffort, S. H. Vajargah and L. F. Nazar, Nat. Energy, 2016, 1, 16119.
23 J. Li, K. McColl, X. Lu, S. Sathasivam, H. Dong, L. Kang, Z. Li, S. Zhao, A. G. Kafizas, R. Wang, D. J. L.
Brett, P. R. Shearing, F. Corà, G. He, C. J. Carmalt and I. P. Parkin, Adv. Energy Mater., 2020, 10,
2000058.
24 S. Liu, H. Zhu, B. Zhang, G. Li, H. Zhu, Y. Ren, H. Geng, Y. Yang, Q. Liu and C. C. Li, Adv. Mater., 2020,
32, e2001113.
25 J. Ding, Z. Du, B. Li, L. Wang, S. Wang, Y. Gong and S. Yang, Adv. Mater., 2019, 31, 1904369.
26 X. Wang, Y. Li, S. Wang, F. Zhou, P. Das, C. Sun, S. Zheng and Z. S. Wu, Adv. Energy Mater., 2020, 10,
2000081.

27 S. Wei, C. Wang, S. Chen, P. Zhang, K. Zhu, C. Wu, P. Song, W. Wen and L. Song, Adv. Energy Mater.,
2020, 10.
28 M. Harada, M. Kuwa, R. Sato, T. Teranishi, M. Takahashi and S. Maenosono, ACS Appl. Nano Mater.,
2020, 3, 8389-8402.
29 F. Carraro, O. Vozniuk, L. Calvillo, L. Nodari, C. La Fontaine, F. Cavani and S. Agnoli, J. Mater. Chem.
A, 2017, 5, 20808-20817.