survey of resident/fellow stipends and benefits report · pdf filesurvey of resident/fellow...
TRANSCRIPT
Survey of Resident/Fellow Stipends and Benefits Report 2014-2015
November 2014

2014-2015 Survey of Resident/Fellow Stipends and Benefits Report
© 2014 AAMC. May not be reproduced or distributed without prior written permission. 1
Section and Table Listing
Executive Summary……………………………………………………………….……………………………….……………. 5
Background………………………………………………………………………………………………………….……….. 5
Methodology………………………………………………………………………………………………………………….. 5
Selected Findings………………………………………………………………………………………..…………………... 6
Explanation of Tables…………………………………..……………………………………………………………………….. 6
States by Region Chart…………………………………………………………………………………………………………. 7
Section One: Resident/Fellow Stipends………………………………...…………………………………………………….. 8
Table 1. Resident/Fellow Current Year Actual Stipends Nationwide, Dollar Change from Prior Year, and
Percent Change from Prior Year, Academic Year 2014-2015………………………………….……...…….. 8
Table 2. Resident/Fellow First-Year Stipends Nationwide, Mean Actual Stipends and Mean Inflation-Adjusted
Stipends, 1969-1970 through 2014-2015……………………..………………………….…………………….. 10
Table 3. Resident/Fellow Dollar Change and Percent Change in Actual Stipends Nationwide,
Received by Academic Cohorts of Residents Advancing One Year, Academic Years
2013-2014 to 2014-2015……………...………………………………………………………………………….. 11
Table 4. Resident/Fellow Weighted Mean Stipends, by Region, Academic Year 2014-2015………...…………….. 12
Table 5. Resident/Fellow Actual Stipends for All Regions, by Ownership, Academic Year 2014-2015……………. 13
Table 6. Resident/Fellow Actual Stipends for Northeastern Region, by Ownership,
Academic Year 2014-2015…………………………………………………………………………....…………. 14
Table 7. Resident/Fellow Actual Stipends for Southern Region, by Ownership,
Academic Year 2014-2015…………………………………………………………..………………..…………. 15
Table 8. Resident/Fellow Actual Stipends for Midwestern Region, by Ownership,
Academic Year 2014-2015……………………………………..………………………………….…….………. 16
Table 9. Resident/Fellow Actual Stipends for Western Region, by Ownership,
Academic Year 2014-2015………………………………………………………………………..……..………. 17
2014-2015 Survey of Resident/Fellow Stipends and Benefits Report
© 2014 AAMC. May not be reproduced or distributed without prior written permission. 2
Table 10. Percent of Institutions That Estimated Their Stipends, Academic Year 2014-2015…………………..….. 18
Table 11. Percent of Institutions Whose Base Stipends Are the Same across All Specialties,
Academic Year 2014-2015…………………………………………………………….……………….………. 18
Table 12. Percent of Institutions That Provide Higher Stipends to Chief Residencies,
Academic Year 2014-2015…………………….……………………………………………….………………. 18
Table 13. Percent of Institutions That Provide Higher Stipends to Residents/Fellows Other Than Chief
Residencies, Academic Year 2014-2015…………………………………………….……………….………. 18
Table 14. How Often Stipends Are Adjusted, Academic Year 2014-2015…………………………………………….. 19
Section Two: Resident/Fellow Health Benefits………………………………………...…………………………………….. 20
Table 15. Number of Respondents Offering Residents/Fellows Premium Medical Coverage, by
Ownership, Academic Year 2014-2015………………………………………….……...………………….…. 20
Table 16. Number of Respondents Including Selected Benefits in Medical Coverage, by
Ownership, Academic Year 2014-2015..……………………………………………………………..….……. 21
Table 17. Percent of Respondents That Provide Own Health Insurance Product (Self-Insured),
Academic Year 2014-2015…………………………………………………….…………….…………………. 22
Table 18. Percent of Respondents Requiring Copayments and/or Deductibles in Medical Coverage
Contract, Academic Year 2014-2015………………………….………………………………………………. 22
Table 19. Whether Dollar or Service Limits Are Placed on Benefits for Certain Health Care Services,
Academic Year 2014-2015……………………………..………………………………………………………. 22
Table 20. Whether Resident Health Benefits Begin on the First Recognized Day of Residency,
Academic Year 2014-2015…………………………..…………………………………………………………. 22
Table 21. Whether Residents/Fellows Are Eligible to Receive Services, Academic Year 2014-2015…………...… 23
Section Three: Resident/Fellow Non-Health Benefits……………………………………………………………………….. 24
Table 22. Whether There Were Significant Changes in Benefits This Year, Academic Year 2014-2015…………. 24
Table 23. Whether Institution Offers a Flexible or "Cafeteria Style" Benefits Plan to Residents/Fellows,
Academic Year 2014-2015……………………………………………………………………….…………….. 24
Table 24. Life Insurance and Long-term Disability Insurance Premiums, All Respondents,
Academic Year 2014-2015……………………………………………………………………………….…….. 24

2014-2015 Survey of Resident/Fellow Stipends and Benefits Report
© 2014 AAMC. May not be reproduced or distributed without prior written permission. 3
Table 24b. Institution-Paid Supplemental Life Insurance and Long-Term Disability Insurance
Above and Beyond What Was Described in Table 24, Academic Year 2014-2015…..………………….. 25
Table 25. Maximum Amount of Life Insurance Benefit, All Respondents, Academic Year 2014-2015………..…… 25
Table 26. Maximum Amount of Long-Term Disability Insurance Benefit, All Respondents,
Academic Year 2014-2015………………..……………………………………………………………………. 25
Table 27. Length of Coverage of Long-Term Disability Insurance Benefit, All Respondents,
Academic Year 2014-2015……………………………………………………………………………………... 26
Table 28. Portion of Respondents by Level of Coverage for Selected Resident/Fellow Benefits,
by Ownership, Academic Year 2014-2015………………………………………………………………....…. 27
Table 29. Whether Residents/Fellows Are Able to Save Unused On-Call Meal Stipends,
Academic Year 2014-2015………………………..……………………………………………………………. 28
Table 30. Whether Institutions Offer a Retirement Plan to Residents/Fellows,
Academic Year 2014-2015………………………..……………………………………………………………. 28
Table 30b. Whether Institutions Offer a Defined-Benefit Retirement Plan to Residents/Fellows,
Academic Year 2014-2015………………………………………………………………………………..……. 28
Table 30c. Whether Institutions Offer a Mandatory Retirement Plan to Residents/Fellows,
Academic Year 2014-2015……………………………………………………………………………..………. 29
Table 31. Annual Vacation and Other Paid Leave for Residents, Academic Year 2014-2015……………………… 30
Table 32. Time Allotted to Residents/Fellows to Attend Seminar, Academic Year 2014-2015……………………... 31
Table 33. Whether Time Off to Attend Seminars Is In Addition to Vacation Leave,
Academic Year 2014-2015……………………………………………………………………………..………. 31
Table 34. Whether the Institution or Program Contributes To Meeting Costs,
Academic Year 2014-2015………………………………………………………………..……………………. 31
Table 35. Contribution Type and Maximum Benefit to Meeting Costs, All Respondents,
Academic Year 2014-2015………………..……………………………………………………………………. 32
Table 36. Whether Institutions Provide Child Care for Children of Residents/Fellows, All Respondents,
Academic Year 2014-2015……………………………………………………………………..………………. 32
Table 37. Whether Institutions That Do Not Provide Child Care Assist Residents/Fellows with Locating
Child Care, Academic Year 2014-2015………………………………………………….……………………. 32
2014-2015 Survey of Resident/Fellow Stipends and Benefits Report
© 2014 AAMC. May not be reproduced or distributed without prior written permission. 4
Table 38. Whether Institutions Offer Financial Counseling and Educational Debt Management Services to
Resident/Fellows, Academic Year 2014-2015……….………………………………………………..…..…. 33
Table 39. Whether Institutions Offer Career Counseling or Placement Services to Residents/Fellows,
Academic Year 2014-2015…………………………………………….………………………………….……. 33
Table 40. Whether Institutions Require Various Drug and/or Alcohol Testing for Residents/Fellows,
All Respondents, Academic Year 2014-2015……………………….…………………….…………………. 33
Table 41. Drugs and Alcohol Rehabilitation Services Covered under Resident/Fellow Health Benefits,
Academic Year 2014-2015…………………………………………….……………………………….………. 34
Table 42. Whether Institutions Experienced Residents/Fellows Requiring Reasonable Accommodations
Under Americans with Disabilities Act (ADA), Academic Year 2014-2015…………………………..……. 34
Table 43. Whether Institutions Require Background Investigations of Residents/Fellows, All Respondents,
Academic Year 2014-2015………………………………………………………..……………………………. 35
Table 44. Whether Institutions Provide Funds or Tools to Residents/Fellows, All Respondents,
Academic Year 2014-2015…………………………………..…………………………………………………. 35

2014-2015 Survey of Resident/Fellow Stipends and Benefits Report
© 2014 AAMC. May not be reproduced or distributed without prior written permission. 5
Executive Summary
Background
Since 1968, the Association of American Medical Colleges has published the AAMC Survey of Resident/Fellow Stipends and Benefits. The purpose of the survey is to provide benchmarking data for AAMC member institutions to use in setting resident/fellow stipends.
Only institutions that submitted survey data are eligible to receive customized analyses of the survey report. To request a special analysis, or if there are questions about the survey report, please email [email protected].
Methodology The 2014 AAMC Survey of Resident/Fellow Stipends and Benefits launched on July 18, 2014. The survey was administered to 141 LCME-accredited U.S. medical schools and 352 non-VA Council of Teaching Hospitals and Health Systems (COTH) members. Invitations were sent to Group on Resident Affairs (GRA) representatives. If there was not a GRA representative at an institution, the invitation was sent to the Dean (at medical schools) or the CEO (at hospitals/health systems). The instrument collected data for the 2014-2015 academic year that began July 1, 2014. Unless stated otherwise, all respondents were eligible to answer each question. Institutions were not required to answer every question. Refer to the institution count in each table to see how many institutions responded to a particular question. To comply with anti-trust and confidentiality policies, compensation statistics are provided only when at least five respondents are represented. Of the 493 institutions that were invited to the survey, 247 institutions responded (a 50 percent response rate). Of those 247 responding institutions, 59 indicated that they do not issue the check for resident/fellow stipends (these institutions did not submit data on stipends or benefits and are not included in the report). This report summarizes the responses from 186 institutions that indicated that they do issue the check for resident/fellow stipends (these institutions submitted data on stipends and benefits). Of the 186 institutions submitting stipends and benefits data, 49 were medical schools (a 35 percent response rate for medical schools) and 137 were COTH members (a 39 percent response rate for hospitals and health systems). However, the total number of hospital respondents may be an underestimate as several institutions operate as part of multi-hospital consortia and some consortia reported their data jointly rather than on an institution-specific basis. The low response rates may suggest potential bias that reduces the reliability and validity of the information collected. Therefore, this survey’s results should be used with caution when generalizing the findings from this study to inform decisions. The response rates for both hospitals and medical schools may be understated since the denominator for the response rate is all LCME-accredited U.S. medical schools and non-VA COTH hospitals. However, the true denominator for the response rate is the number of U.S. medical schools and non-VA COTH hospitals that pays residents directly. The 2014 report includes stipends data for 86,660 in academic year 2014-2015. Resident counts are not yet known for the 2014-2015 academic year. According to the Accreditation Council for Graduate Medical Education (ACGME), the total number of on-duty residents were 121,713 in academic year 2013-2014. This suggests an approximate coverage rate of 71 percent for the 2014-2015 report.
Some tables in the report display unweighted means while other tables display weighted means. Unweighted means are means where each institution has the same weight, regardless of the size of the institution’s training program. Weighted means are means that are weighted by the number of residents and fellows.
2014-2015 Survey of Resident/Fellow Stipends and Benefits Report
© 2014 AAMC. May not be reproduced or distributed without prior written permission. 6
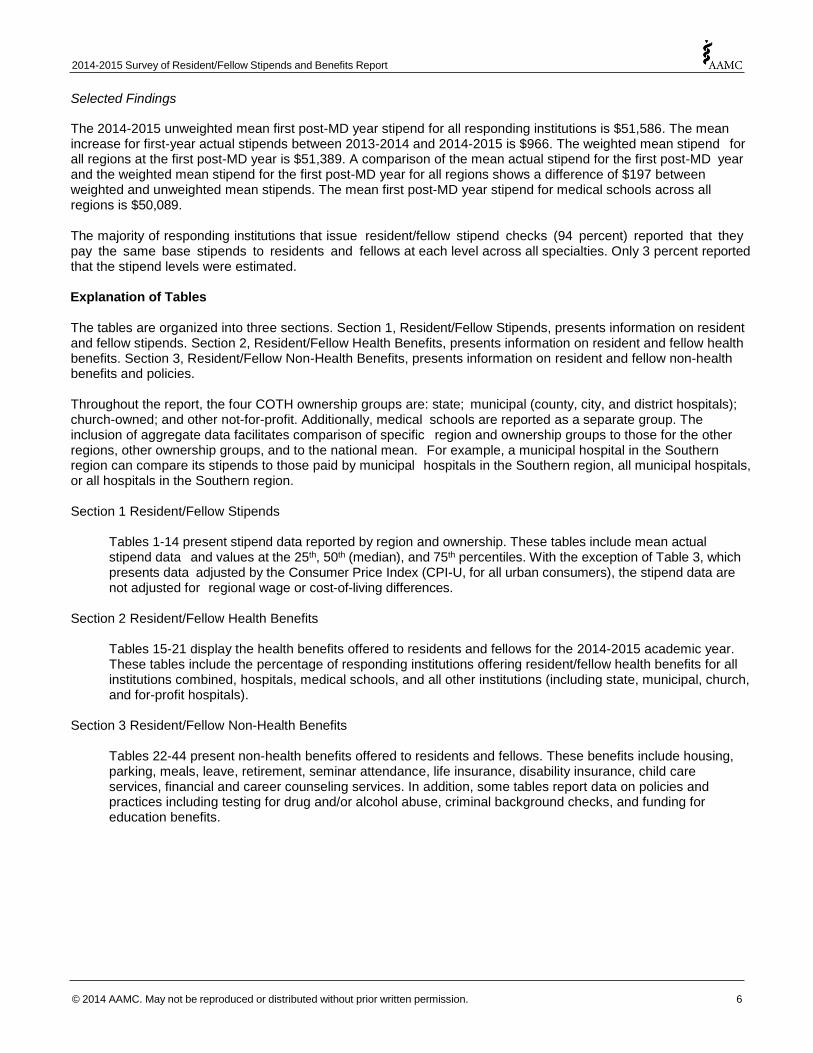
Selected Findings
The 2014-2015 unweighted mean first post-MD year stipend for all responding institutions is $51,586. The mean increase for first-year actual stipends between 2013-2014 and 2014-2015 is $966. The weighted mean stipend for all regions at the first post-MD year is $51,389. A comparison of the mean actual stipend for the first post-MD year and the weighted mean stipend for the first post-MD year for all regions shows a difference of $197 between weighted and unweighted mean stipends. The mean first post-MD year stipend for medical schools across all regions is $50,089. The majority of responding institutions that issue resident/fellow stipend checks (94 percent) reported that they pay the same base stipends to residents and fellows at each level across all specialties. Only 3 percent reported that the stipend levels were estimated.
Explanation of Tables The tables are organized into three sections. Section 1, Resident/Fellow Stipends, presents information on resident and fellow stipends. Section 2, Resident/Fellow Health Benefits, presents information on resident and fellow health benefits. Section 3, Resident/Fellow Non-Health Benefits, presents information on resident and fellow non-health benefits and policies. Throughout the report, the four COTH ownership groups are: state; municipal (county, city, and district hospitals); church-owned; and other not-for-profit. Additionally, medical schools are reported as a separate group. The inclusion of aggregate data facilitates comparison of specific region and ownership groups to those for the other regions, other ownership groups, and to the national mean. For example, a municipal hospital in the Southern region can compare its stipends to those paid by municipal hospitals in the Southern region, all municipal hospitals, or all hospitals in the Southern region. Section 1 Resident/Fellow Stipends
Tables 1-14 present stipend data reported by region and ownership. These tables include mean actual stipend data and values at the 25th, 50th (median), and 75th percentiles. With the exception of Table 3, which presents data adjusted by the Consumer Price Index (CPI-U, for all urban consumers), the stipend data are not adjusted for regional wage or cost-of-living differences.
Section 2 Resident/Fellow Health Benefits
Tables 15-21 display the health benefits offered to residents and fellows for the 2014-2015 academic year. These tables include the percentage of responding institutions offering resident/fellow health benefits for all institutions combined, hospitals, medical schools, and all other institutions (including state, municipal, church, and for-profit hospitals).
Section 3 Resident/Fellow Non-Health Benefits
Tables 22-44 present non-health benefits offered to residents and fellows. These benefits include housing, parking, meals, leave, retirement, seminar attendance, life insurance, disability insurance, child care services, financial and career counseling services. In addition, some tables report data on policies and practices including testing for drug and/or alcohol abuse, criminal background checks, and funding for education benefits.

2014-2015 Survey of Resident/Fellow Stipends and Benefits Report
© 2014 AAMC. May not be reproduced or distributed without prior written permission. 7
States by Region Chart
The AAMC Survey of Resident/Fellow Stipends and Benefits report uses the following chart to classify states by region:
Northeast Midwest South West
Connecticut Delaware District of Columbia Maine Maryland Massachusetts New Hampshire New Jersey New York Pennsylvania Rhode Island Vermont
Illinois Indiana Iowa Kansas Michigan Minnesota Missouri Nebraska North Dakota Ohio South Dakota Wisconsin
Alabama Arkansas Florida Georgia Kentucky Louisiana Mississippi North Carolina Oklahoma Puerto Rico* South Carolina Tennessee Texas Virginia West Virginia
Alaska Arizona California Colorado Hawaii Idaho Montana Nevada New Mexico Oregon Utah Washington Wyoming
*Puerto Rico is classified in the Southern region. However, as noted in most tables, Puerto Rican institutions are not included in regional breakdowns. They are included only in the calculation of All Regions.

2014-2015 Survey of Resident/Fellow Stipends and Benefits Report
© 2014 AAMC. May not be reproduced or distributed without prior written permission. 8
Section One: Resident/Fellow Stipends Table 1 presents summary data on national resident/fellow stipends for each of eight post-MD years. The 2014-2015 mean first post-MD year actual stipend for all responding institutions is $51,586. The mean is an unweighted mean, with each institution having the same weight, regardless of the size of its training program. This approach prevents larger institutions from skewing the mean, resulting in a mean that is close to the median value.
Table 1 displays the percent and dollar changes in mean actual stipends from 2013-2014 to 2014-2015 calculated for respondents reporting in both years. Dollar and percent increases are reported only for institutions that responded to both the 2013-2014 and 2014-2015 AAMC Resident/Fellow Surveys (184 institutions at the first post-MD year, declining to 89 institutions at the eighth year). The mean increase for first-year actual stipends between 2013-2014 and 2014-2015 is $966. The percent increase over the first-year actual stipend for the 2013-2014 academic year is 1.9 percent. The mean percent increases across residency years range from 1.8 percent for the third postgraduate year to 2.2 percent for the eighth postgraduate year. Table 1. Resident/Fellow Current Year Actual Stipends Nationwide, Dollar Change from Prior Year, and Percent Change from Prior Year, Academic Year 2014-2015
Year of Training Institution
Count Mean Actual
Stipend 25th
Percentile Median 75th
Percentile
Current Year Stipends
1st Post-MD Year 184 $51,586 $49,396 $51,250 $53,273
2nd Post-MD Year 184 $53,500 $51,156 $52,949 $55,338
3rd Post-MD Year 184 $55,502 $52,818 $55,029 $57,135
4th Post-MD Year 182 $57,682 $54,677 $57,201 $59,723
5th Post-MD Year 175 $60,023 $56,771 $59,542 $62,306
6th Post-MD Year 165 $62,379 $58,911 $61,755 $64,684
7th Post-MD Year 150 $64,775 $60,827 $63,809 $67,737
8th Post-MD Year 89 $67,236 $62,380 $67,167 $70,597
Dollar Change from Prior Year
1st Post-MD Year 140 $966 $582 $995 $1,275
2nd Post-MD Year 140 $981 $641 $945 $1,230
3rd Post-MD Year 140 $999 $589 $1,000 $1,367
4th Post-MD Year 139 $1,068 $651 $1,054 $1,543
5th Post-MD Year 135 $1,107 $517 $1,103 $1,614
6th Post-MD Year 128 $1,143 $537 $1,124 $1,531
7th Post-MD Year 116 $1,299 $871 $1,205 $1,835
8th Post-MD Year 63 $1,399 $894 $1,332 $2,009
Percent Change from Prior Year
1st Post-MD Year 140 1.9% 1.1% 2.0% 2.5%
2nd Post-MD Year 140 1.9% 1.2% 1.8% 2.4%
3rd Post-MD Year 140 1.8% 1.1% 1.9% 2.5%
4th Post-MD Year 139 1.9% 1.1% 2.0% 2.8%
5th Post-MD Year 135 1.9% 1.0% 2.0% 2.8%
6th Post-MD Year 128 1.9% 1.0% 2.0% 2.6%
7th Post-MD Year 116 2.1% 1.4% 2.0% 3.0%
8th Post-MD Year 63 2.2% 1.3% 2.0% 3.0%
2014-2015 Survey of Resident/Fellow Stipends and Benefits Report
© 2014 AAMC. May not be reproduced or distributed without prior written permission. 9
Table 2 displays mean first post-MD year stipends for each academic year from 1969-1970 to 2014-2015. Since a different group of institutions responds each year, changes in stipends from year-to-year may reflect characteristics of different cohorts of institutions responding to the survey each year, in addition to actual stipend changes. Table 2 also displays actual and adjusted stipends by the Consumer Price Index for All Urban Consumers (CPI-U) All Items from 1969-1970 to 2014-2015. Stipend data are shown in actual dollars and adjusted to constant 1969 dollars. Between academic years 2013-2014 and 2014-2015, stipends paid by respondents to the 2014-2015 survey were 1.62 percent or $821 higher than stipends paid by 2013-2014 respondents. CPI-U-adjusted stipends decreased by $32 (from $7,544 to $7,512). The CPI-U-adjusted mean first-year stipend for 2014-2015 is 7,512, which represents an 8.2 percent real increase over the $6,945 mean first-year stipend that residents were paid in 1969-1970.

2014-2015 Survey of Resident/Fellow Stipends and Benefits Report
© 2014 AAMC. May not be reproduced or distributed without prior written permission. 10
Table 2. Resident/Fellow First-Year Stipends Nationwide, Mean Actual Stipends and Mean Inflation-Adjusted Stipends, 1969-1970 through 2014-2015
Survey Year Mean Actual
Stipend Percent Change from Prior Year
Dollar Change from Prior Year CPI-U
Mean Inflation-Adjusted Stipend
2014-2015 $51,586 1.6% $821 238.3 $7,512
2013-2014 $50,765 1.0% $491 233.5 $7,544
2012-2013 $50,274 1.8% $880 229.5 $7,601
2011-2012 $49,394 1.9% $934 225.7 $7,594
2010-2011 $48,460 2.1% $1,002 218.0 $7,714
2009-2010 $47,458 2.6% $1,213 215.7 $7,635
2008-2009 $46,245 3.4% $1,498 218.8 $7,334
2007-2008 $44,747 3.4% $1,481 208.4 $7,451
2006-2007 $43,266 2.8% $1,196 202.9 $7,399
2005-2006 $42,070 3.1% $1,282 194.5 $7,506
2004-2005 $40,788 2.5% $979 189.7 $7,461
2003-2004 $39,809 4.1% $1,562 183.7 $7,520
2002-2003 $38,238 2.3% $855 179.9 $7,376
2001-2002 $37,383 4.6% $1,655 178.0 $7,288
2000-2001 $35,728 2.1% $743 172.4 $7,191
1999-2000 $34,985 2.6% $881 166.2 $7,304
1998-1999 $34,104 2.1% $717 163.0 $7,260
1997-1998 $33,387 1.8% $598 160.3 $7,227
1996-1997 $32,789 3.6% $1,139 156.7 $7,261
1995-1996 $31,650 2.9% $897 152.5 $7,202
1994-1995 $30,753 3.8% $1,121 148.0 $7,210
1993-1994 $29,632 3.5% $1,014 144.4 $7,121
1992-1993 $28,618 5.2% $1,407 140.2 $7,083
1991-1992 $27,211 5.2% $1,353 136.0 $6,943
1990-1991 $25,858 4.9% $1,209 129.9 $6,907
1989-1990 $24,649 3.9% $920 124.1 $6,892
1988-1989 $23,729 4.5% $1,013 118.0 $6,978
1987-1988 $22,716 3.3% $722 113.5 $6,945
1986-1987 $21,994 2.5% $538 109.5 $6,970
1985-1986 $21,456 3.1% $642 107.6 $6,919
1984-1985 $20,814 4.5% $895 103.7 $6,965
1983-1984 $19,919 5.1% $958 99.5 $6,947
1982-1983 $18,961 7.5% $1,320 97.0 $6,783
1981-1982 $17,641 9.0% $1,453 90.6 $6,757
1980-1981 $16,188 9.0% $1,335 82.7 $6,792
1979-1980 $14,853 6.4% $888 72.3 $7,129
1978-1979 $13,965 5.9% $779 65.2 $7,432
1977-1978 $13,186 4.4% $558 60.7 $7,538
1976-1977 $12,628 8.1% $943 56.8 $7,715
1975-1976 $11,685 9.3% $993 53.6 $7,565
1974-1975 $10,692 5.7% $578 49.0 $7,572
1973-1974 $10,114 4.3% $416 44.2 $7,940
1972-1973 $9,698 5.4% $500 41.7 $8,070
1971-1972 $9,198 13.30% $1,083 40.6 $7,861
1970-1971 $8,115 10.80% $790 38.8 $7,258
1969-1970 $7,325 18.10% $1,125 36.6 $6,945
2014-2015 Survey of Resident/Fellow Stipends and Benefits Report
© 2014 AAMC. May not be reproduced or distributed without prior written permission. 11
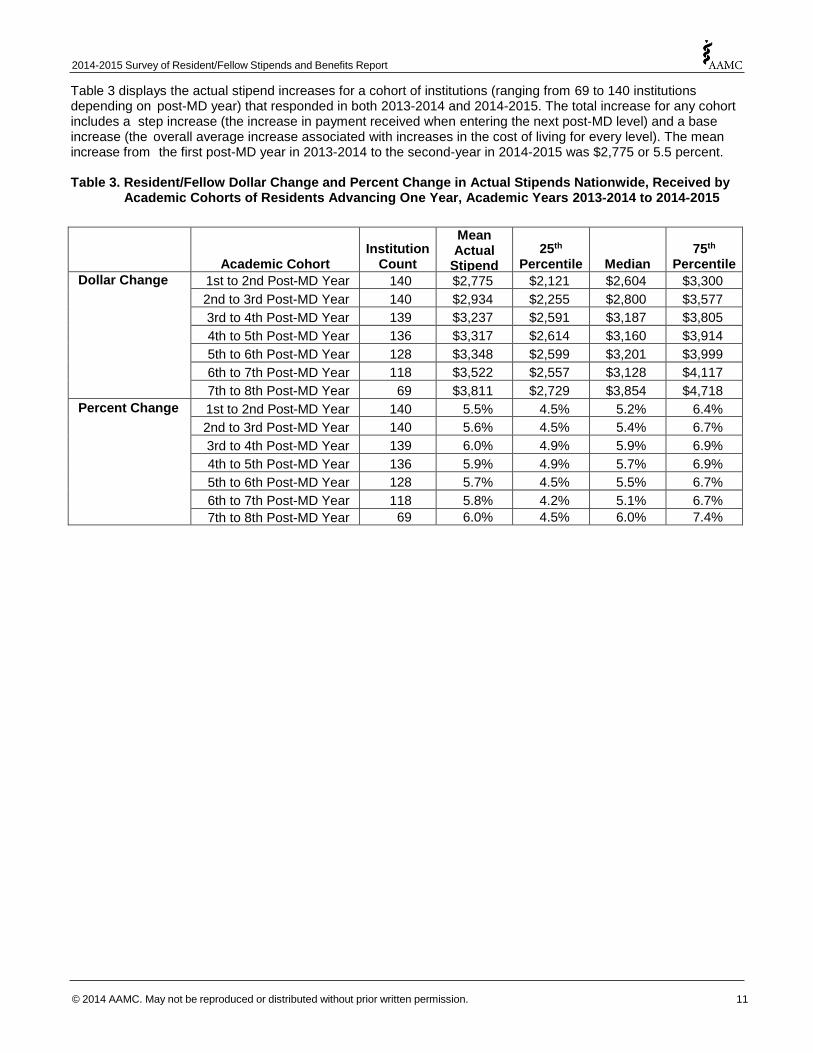
Table 3 displays the actual stipend increases for a cohort of institutions (ranging from 69 to 140 institutions depending on post-MD year) that responded in both 2013-2014 and 2014-2015. The total increase for any cohort includes a step increase (the increase in payment received when entering the next post-MD level) and a base increase (the overall average increase associated with increases in the cost of living for every level). The mean increase from the first post-MD year in 2013-2014 to the second-year in 2014-2015 was $2,775 or 5.5 percent. Table 3. Resident/Fellow Dollar Change and Percent Change in Actual Stipends Nationwide, Received by Academic Cohorts of Residents Advancing One Year, Academic Years 2013-2014 to 2014-2015
Academic Cohort Institution
Count
Mean Actual
Stipend
25th Percentile Median
75th Percentile
Dollar Change 1st to 2nd Post-MD Year 140 $2,775 $2,121 $2,604 $3,300
2nd to 3rd Post-MD Year 140 $2,934 $2,255 $2,800 $3,577
3rd to 4th Post-MD Year 139 $3,237 $2,591 $3,187 $3,805
4th to 5th Post-MD Year 136 $3,317 $2,614 $3,160 $3,914
5th to 6th Post-MD Year 128 $3,348 $2,599 $3,201 $3,999
6th to 7th Post-MD Year 118 $3,522 $2,557 $3,128 $4,117
7th to 8th Post-MD Year 69 $3,811 $2,729 $3,854 $4,718
Percent Change 1st to 2nd Post-MD Year 140 5.5% 4.5% 5.2% 6.4%
2nd to 3rd Post-MD Year 140 5.6% 4.5% 5.4% 6.7%
3rd to 4th Post-MD Year 139 6.0% 4.9% 5.9% 6.9%
4th to 5th Post-MD Year 136 5.9% 4.9% 5.7% 6.9%
5th to 6th Post-MD Year 128 5.7% 4.5% 5.5% 6.7%
6th to 7th Post-MD Year 118 5.8% 4.2% 5.1% 6.7%
7th to 8th Post-MD Year 69 6.0% 4.5% 6.0% 7.4%

2014-2015 Survey of Resident/Fellow Stipends and Benefits Report
© 2014 AAMC. May not be reproduced or distributed without prior written permission. 12
Table 4 displays the number of residents and fellows at each institution and the weighted mean stipend for each post-MD year. The mean is weighted by the number of residents and fellows. The weighted mean stipend for all regions at the first post-MD year is $51,389. The All Regions category includes all participating institutions, including four for-profit hospitals and no Puerto Rican medical schools. A comparison of the mean stipend for the first post-MD year in table 1 and the weighted mean stipend for the first post-MD year for all regions in table 4 shows a difference of $197 between weighted and unweighted mean stipends. Table 4. Resident/Fellow Weighted Mean Stipends, by Region, Academic Year 2014-2015
Years of Training Aggregate Residents
Weighted Mean Stipend
All Regions 1st Post-MD Year 18,391 $51,389
2nd Post-MD Year 18,556 $53,348
3rd Post-MD Year 18,076 $55,355
4th Post-MD Year 13,956 $57,879
5th Post-MD Year 9,847 $60,325
6th Post-MD Year 5,566 $63,070
7th Post-MD Year 1,824 $65,660
8th Post-MD Year 444 $69,664
Northeast 1st Post-MD Year 4,999 $54,029
2nd Post-MD Year 5,096 $56,194
3rd Post-MD Year 4,855 $58,588
4th Post-MD Year 3,843 $61,380
5th Post-MD Year 2,558 $64,138
6th Post-MD Year 1,410 $67,597
7th Post-MD Year 437 $70,392
8th Post-MD Year 113 $79,062
South 1st Post-MD Year 5,571 $49,475
2nd Post-MD Year 5,545 $51,139
3rd Post-MD Year 5,368 $52,917
4th Post-MD Year 4,285 $55,071
5th Post-MD Year 2,970 $57,327
6th Post-MD Year 1,680 $59,725
7th Post-MD Year 535 $62,108
8th Post-MD Year 114 $64,583
Midwest 1st Post-MD Year 5,100 $51,007
2nd Post-MD Year 5,068 $52,797
3rd Post-MD Year 4,957 $54,538
4th Post-MD Year 3,585 $56,781
5th Post-MD Year 2,653 $58,868
6th Post-MD Year 1,482 $61,356
7th Post-MD Year 543 $63,797
8th Post-MD Year 133 $65,625
West 1st Post-MD Year 2,721 $51,172
2nd Post-MD Year 2,847 $53,533
3rd Post-MD Year 2,896 $55,854
4th Post-MD Year 2,243 $59,003
5th Post-MD Year 1,666 $62,136
6th Post-MD Year 994 $64,858
7th Post-MD Year 309 $68,395
8th Post-MD Year 84 $70,315

2014-2015 Survey of Resident/Fellow Stipends and Benefits Report
© 2014 AAMC. May not be reproduced or distributed without prior written permission. 13
Table 5 displays actual stipends for institutions in all U.S. regions. The All Respondents category includes four for-profit hospitals that are not categorized as a state hospital, municipal hospital, church hospital or other non-profit hospital and no Puerto Rican medical schools. Actual stipends were reported for 184 institutions for the first post-MD year. Table 5. Resident/Fellow Actual Stipends for All Regions, by Ownership, Academic Year 2014-2015
Year of Training Institution
Count Mean Actual
Stipend 25th
Percentile Median 75th
Percentile All Respondents 1st Post-MD Year 184 $51,586 $49,396 $51,250 $53,273
2nd Post-MD Year 184 $53,500 $51,156 $52,949 $55,338
3rd Post-MD Year 184 $55,502 $52,818 $55,029 $57,135
4th Post-MD Year 182 $57,682 $54,677 $57,201 $59,723
5th Post-MD Year 175 $60,023 $56,771 $59,542 $62,306
6th Post-MD Year 165 $62,379 $58,911 $61,755 $64,684
State Hospitals 1st Post-MD Year 18 $51,096 $48,283 $50,250 $52,009
2nd Post-MD Year 19 $53,071 $49,978 $52,020 $53,840
3rd Post-MD Year 19 $55,138 $51,593 $53,906 $55,899
4th Post-MD Year 19 $57,383 $53,520 $55,931 $58,400
5th Post-MD Year 18 $59,867 $55,441 $58,620 $60,533
6th Post-MD Year 18 $62,167 $57,608 $60,710 $62,963
Municipal Hospitals
1st Post-MD Year 13 $50,714 $49,651 $50,812 $51,850
2nd Post-MD Year 13 $52,770 $51,428 $52,464 $53,752
3rd Post-MD Year 13 $54,955 $54,024 $54,350 $55,841
4th Post-MD Year 13 $57,455 $55,750 $56,455 $58,568
5th Post-MD Year 12 $60,101 $57,994 $59,080 $62,679
6th Post-MD Year 12 $62,693 $60,254 $61,526 $65,636
Church Hospitals 1st Post-MD Year 10 $51,403 $49,914 $51,465 $52,633
2nd Post-MD Year 10 $53,072 $51,882 $52,706 $53,533
3rd Post-MD Year 10 $55,015 $53,627 $54,234 $54,916
4th Post-MD Year 10 $56,910 $55,062 $55,852 $56,798
5th Post-MD Year 9 $58,069 $56,389 $57,458 $58,968
6th Post-MD Year 9 $59,742 $57,269 $59,375 $60,963
Other Non-Profit Hospitals
1st Post-MD Year 91 $52,655 $50,315 $51,871 $55,013
2nd Post-MD Year 91 $54,684 $52,350 $53,766 $56,486
3rd Post-MD Year 91 $56,776 $53,870 $56,000 $58,727
4th Post-MD Year 89 $59,048 $55,950 $58,241 $61,122
5th Post-MD Year 87 $61,550 $57,974 $60,782 $64,024
6th Post-MD Year 81 $64,163 $60,000 $63,441 $67,030
Medical Schools 1st Post-MD Year 48 $50,089 $48,281 $49,706 $51,871
2nd Post-MD Year 47 $51,767 $49,899 $51,364 $53,794
3rd Post-MD Year 47 $53,560 $51,557 $53,026 $55,740
4th Post-MD Year 47 $55,581 $53,257 $54,788 $58,004
5th Post-MD Year 45 $57,687 $55,000 $57,329 $60,402
6th Post-MD Year 42 $59,636 $56,340 $59,348 $62,491

2014-2015 Survey of Resident/Fellow Stipends and Benefits Report
© 2014 AAMC. May not be reproduced or distributed without prior written permission. 14
Table 6 displays actual stipends for institutions in the Northeastern region. The All Respondents category includes two for-profit hospitals that are not categorized as a state hospital, municipal hospital, church hospital, or other non-profit hospital. Actual stipends were reported for 52 institutions for the first post-MD year. Table 6. Resident/Fellow Actual Stipends for Northeastern Region, by Ownership, Academic Year 2014-2015
Year of Training Institution
Count
Mean Actual
Stipend
25th Percentile Median
75th Percentile
All Respondents 1st Post-MD Year 52 $54,443 $52,100 $53,947 $56,571
2nd Post-MD Year 52 $56,761 $53,698 $56,054 $58,602
3rd Post-MD Year 52 $59,189 $56,180 $58,727 $61,306
4th Post-MD Year 50 $61,627 $57,907 $61,363 $64,405
5th Post-MD Year 48 $64,321 $60,396 $64,043 $67,337
6th Post-MD Year 46 $67,225 $63,232 $66,978 $71,917
State Hospitals 1st Post-MD Year 4
2nd Post-MD Year 4
3rd Post-MD Year 4
4th Post-MD Year 4
5th Post-MD Year 4
6th Post-MD Year 4
Municipal Hospitals
1st Post-MD Year 1
2nd Post-MD Year 1
3rd Post-MD Year 1
4th Post-MD Year 1
5th Post-MD Year 1
6th Post-MD Year 1
Church Hospitals 1st Post-MD Year 2
2nd Post-MD Year 2
3rd Post-MD Year 2
4th Post-MD Year 2
5th Post-MD Year 1
6th Post-MD Year 1
Other Non-Profit Hospitals
1st Post-MD Year 39 $54,623 $52,046 $53,849 $56,797
2nd Post-MD Year 39 $56,872 $53,908 $55,941 $59,019
3rd Post-MD Year 39 $59,267 $56,377 $58,485 $61,752
4th Post-MD Year 37 $61,634 $58,252 $60,994 $64,504
5th Post-MD Year 36 $64,425 $60,945 $63,949 $67,533
6th Post-MD Year 34 $67,367 $63,232 $66,978 $72,300
Medical Schools 1st Post-MD Year 4
2nd Post-MD Year 4
3rd Post-MD Year 4
4th Post-MD Year 4
5th Post-MD Year 4
6th Post-MD Year 4

2014-2015 Survey of Resident/Fellow Stipends and Benefits Report
© 2014 AAMC. May not be reproduced or distributed without prior written permission. 15
Table 7 displays actual stipends for institutions in the Southern region. Actual stipends were reported for 57 institutions for the first post-MD year. Table 7. Resident/Fellow Actual Stipends for Southern Region, by Ownership, Academic Year 2014-2015
Year of Training
Institution Count
Mean Actual Stipend
25th Percentile Median
75th Percentile
All Respondents 1st Post-MD Year 57 $49,648 $48,024 $49,310 $51,146
2nd Post-MD Year 57 $51,315 $49,547 $50,946 $52,573
3rd Post-MD Year 57 $53,099 $50,988 $52,525 $54,579
4th Post-MD Year 57 $55,191 $52,990 $54,662 $57,037
5th Post-MD Year 51 $57,369 $54,974 $56,809 $59,160
6th Post-MD Year 48 $59,305 $56,603 $59,131 $60,972
State Hospitals 1st Post-MD Year 8 $48,376 $47,568 $48,106 $48,795
2nd Post-MD Year 9 $50,095 $49,395 $49,795 $50,500
3rd Post-MD Year 9 $51,772 $50,790 $51,500 $52,154
4th Post-MD Year 9 $53,711 $51,791 $53,062 $54,590
5th Post-MD Year 8 $55,640 $54,349 $55,176 $56,449
6th Post-MD Year 8 $57,540 $56,261 $57,030 $59,182
Municipal Hospitals
1st Post-MD Year 6 $50,578 $48,742 $49,933 $50,913
2nd Post-MD Year 6 $52,219 $50,410 $51,738 $52,442
3rd Post-MD Year 6 $54,162 $52,282 $53,739 $54,356
4th Post-MD Year 6 $56,201 $54,222 $55,893 $56,294
5th Post-MD Year 5 $58,680 $57,873 $58,034 $58,599
6th Post-MD Year 5 $60,696 $59,991 $60,342 $60,972
Church Hospitals 1st Post-MD Year 0
2nd Post-MD Year 0
3rd Post-MD Year 0
4th Post-MD Year 0
5th Post-MD Year 0
6th Post-MD Year 0
Other Non-Profit Hospitals
1st Post-MD Year 20 $50,280 $48,445 $49,960 $51,603
2nd Post-MD Year 20 $51,999 $50,368 $51,408 $52,909
3rd Post-MD Year 20 $53,830 $52,216 $52,910 $55,076
4th Post-MD Year 20 $56,144 $54,085 $55,108 $57,321
5th Post-MD Year 19 $58,430 $55,786 $56,988 $59,796
6th Post-MD Year 17 $60,605 $57,429 $59,185 $62,005
Medical Schools 1st Post-MD Year 23 $49,298 $47,617 $49,294 $50,674
2nd Post-MD Year 22 $50,946 $48,715 $50,821 $52,512
3rd Post-MD Year 22 $52,687 $50,425 $52,486 $54,790
4th Post-MD Year 22 $54,654 $52,048 $54,662 $56,878
5th Post-MD Year 19 $56,690 $54,027 $56,756 $58,836
6th Post-MD Year 18 $58,476 $56,185 $59,028 $60,003

2014-2015 Survey of Resident/Fellow Stipends and Benefits Report
© 2014 AAMC. May not be reproduced or distributed without prior written permission. 16
Table 8 displays actual stipends for institutions in the Midwestern region. The All Respondents category includes two for-profit hospitals that are not categorized as a state hospital, municipal hospital, church hospital or other non-profit hospital. Actual stipends were reported for 53 institutions for the first post-MD year. Table 8. Resident/Fellow Actual Stipends for Midwestern Region, by Ownership, Academic Year 2014-2015
Year of Training Institution
Count Mean Actual
Stipend 25th
Percentile Median 75th
Percentile All Respondents 1st Post-MD Year 53 $51,082 $50,161 $50,930 $52,200
2nd Post-MD Year 53 $52,774 $51,468 $52,611 $54,000
3rd Post-MD Year 53 $54,510 $53,310 $54,270 $55,673
4th Post-MD Year 53 $56,432 $54,923 $56,000 $58,002
5th Post-MD Year 54 $58,427 $56,536 $58,174 $60,446
6th Post-MD Year 49 $60,473 $58,268 $60,420 $62,803
State Hospitals 1st Post-MD Year 3
2nd Post-MD Year 3
3rd Post-MD Year 3
4th Post-MD Year 3
5th Post-MD Year 3
6th Post-MD Year 3
Municipal Hospitals
1st Post-MD Year 2
2nd Post-MD Year 2
3rd Post-MD Year 2
4th Post-MD Year 2
5th Post-MD Year 2
6th Post-MD Year 2
Church Hospitals 1st Post-MD Year 7 $50,671 $49,992 $51,100 $52,056
2nd Post-MD Year 7 $51,893 $51,783 $52,611 $52,975
3rd Post-MD Year 7 $53,433 $53,548 $53,836 $54,458
4th Post-MD Year 7 $54,969 $54,897 $55,479 $55,852
5th Post-MD Year 7 $56,808 $56,148 $56,560 $57,756
6th Post-MD Year 7 $58,272 $57,106 $58,268 $59,577
Other Non-Profit Hospitals
1st Post-MD Year 26 $51,707 $50,455 $51,475 $52,466
2nd Post-MD Year 26 $53,602 $52,275 $53,544 $54,634
3rd Post-MD Year 26 $55,422 $53,703 $55,266 $56,814
4th Post-MD Year 26 $57,504 $55,552 $57,577 $59,392
5th Post-MD Year 26 $59,666 $57,568 $59,441 $61,685
6th Post-MD Year 24 $61,987 $60,029 $61,988 $63,644
Medical Schools 1st Post-MD Year 13 $50,495 $49,025 $50,756 $51,500
2nd Post-MD Year 13 $52,016 $50,810 $51,468 $53,461
3rd Post-MD Year 13 $53,679 $52,281 $52,979 $55,391
4th Post-MD Year 13 $55,520 $54,230 $54,500 $57,168
5th Post-MD Year 14 $57,309 $55,589 $56,399 $58,918
6th Post-MD Year 12 $59,096 $57,275 $58,257 $61,568

2014-2015 Survey of Resident/Fellow Stipends and Benefits Report
© 2014 AAMC. May not be reproduced or distributed without prior written permission. 17
Table 9 displays actual stipends for institutions in the Western region. Actual stipends were reported for 22 institutions for the first post-MD year. Table 9. Resident/Fellow Actual Stipends for Western Region, by Ownership, Academic Year 2014-2015
Year of Training
Institution Count
Mean Actual Stipend
25th Percentile Median
75th Percentile
All Respondents 1st Post-MD Year 22 $51,066 $50,442 $51,850 $51,871
2nd Post-MD Year 22 $53,199 $52,297 $53,759 $53,877
3rd Post-MD Year 22 $55,404 $54,405 $55,582 $55,841
4th Post-MD Year 22 $58,181 $57,734 $58,241 $58,612
5th Post-MD Year 22 $60,720 $59,899 $60,533 $61,121
6th Post-MD Year 22 $63,199 $62,298 $62,984 $63,624
State Hospitals 1st Post-MD Year 3
2nd Post-MD Year 3
3rd Post-MD Year 3
4th Post-MD Year 3
5th Post-MD Year 3
6th Post-MD Year 3
Municipal Hospitals
1st Post-MD Year 4
2nd Post-MD Year 4
3rd Post-MD Year 4
4th Post-MD Year 4
5th Post-MD Year 4
6th Post-MD Year 4
Church Hospitals 1st Post-MD Year 1
2nd Post-MD Year 1
3rd Post-MD Year 1
4th Post-MD Year 1
5th Post-MD Year 1
6th Post-MD Year 1
Other Non-Profit Hospitals
1st Post-MD Year 6 $51,883 $50,736 $51,438 $51,836
2nd Post-MD Year 6 $54,098 $52,827 $53,456 $54,017
3rd Post-MD Year 6 $56,279 $54,113 $55,193 $55,850
4th Post-MD Year 6 $59,466 $58,064 $58,434 $58,742
5th Post-MD Year 6 $62,347 $60,625 $61,048 $61,839
6th Post-MD Year 6 $64,783 $63,126 $63,600 $63,807
Medical Schools 1st Post-MD Year 8 $50,933 $50,339 $51,861 $52,220
2nd Post-MD Year 8 $52,760 $52,332 $53,759 $53,857
3rd Post-MD Year 8 $54,754 $54,528 $55,512 $55,816
4th Post-MD Year 8 $57,170 $56,980 $58,107 $58,241
5th Post-MD Year 8 $59,546 $59,267 $60,458 $60,625
6th Post-MD Year 8 $61,893 $61,594 $62,686 $63,126

2014-2015 Survey of Resident/Fellow Stipends and Benefits Report
© 2014 AAMC. May not be reproduced or distributed without prior written permission. 18
Table 10 displays which portion of respondents estimated the stipends offered by their institutions for the 2014-2015 academic year. Table 10. Percent of Institutions That Estimated Their Stipends, Academic Year 2014-2015
Institution
Count
Percent Responded
Yes
Percent Responded
No
All Respondents 185 3.2% 96.8%
Table 11 displays which portion of respondents’ base stipends are the same across all specialties for the 2014 -2015 academic year. Table 11. Percent of Institutions Whose Base Stipends Are the Same across All Specialties,
Academic Year 2014-2015
Institution
Count
Percent Responded
Yes
Percent Responded
No
All Respondents 185 94.1% 5.9%
Table 12 displays which portion of respondents paid higher stipends to chief residencies for the 2014-2015 academic year. Table 12. Percent of Institutions That Provide Higher Stipends to Chief Residencies, Academic Year 2014-2015
Institution
Count
Percent Responded
Yes
Percent Responded
No
All Respondents 183 67.8% 32.2%
Table 13 displays what portion of respondents paid higher stipends to residents/fellows other than chief residencies for the 2014-2015 academic year. Table 13. Percent of Institutions That Provide Higher Stipends to Residents/Fellows Other Than Chief Residencies, Academic Year 2014-2015
Institution
Count
Percent Responded
Yes
Percent Responded
No
All Respondents 185 10.8% 89.2%

2014-2015 Survey of Resident/Fellow Stipends and Benefits Report
© 2014 AAMC. May not be reproduced or distributed without prior written permission. 19
Table 14 displays the frequency with which stipends are adjusted at each institution for the 2014-2015 academic year. Table 14. How Often Stipends Are Adjusted, Academic Year 2014-2015
Institution Count Percent
Annually 153 82.3%
Every Other Year 3 1.6%
Every Three Years 3 1.6%
Other 27 14.5%
Total 186 100.0%
2014-2015 Survey of Resident/Fellow Stipends and Benefits Report
© 2014 AAMC. May not be reproduced or distributed without prior written permission. 20
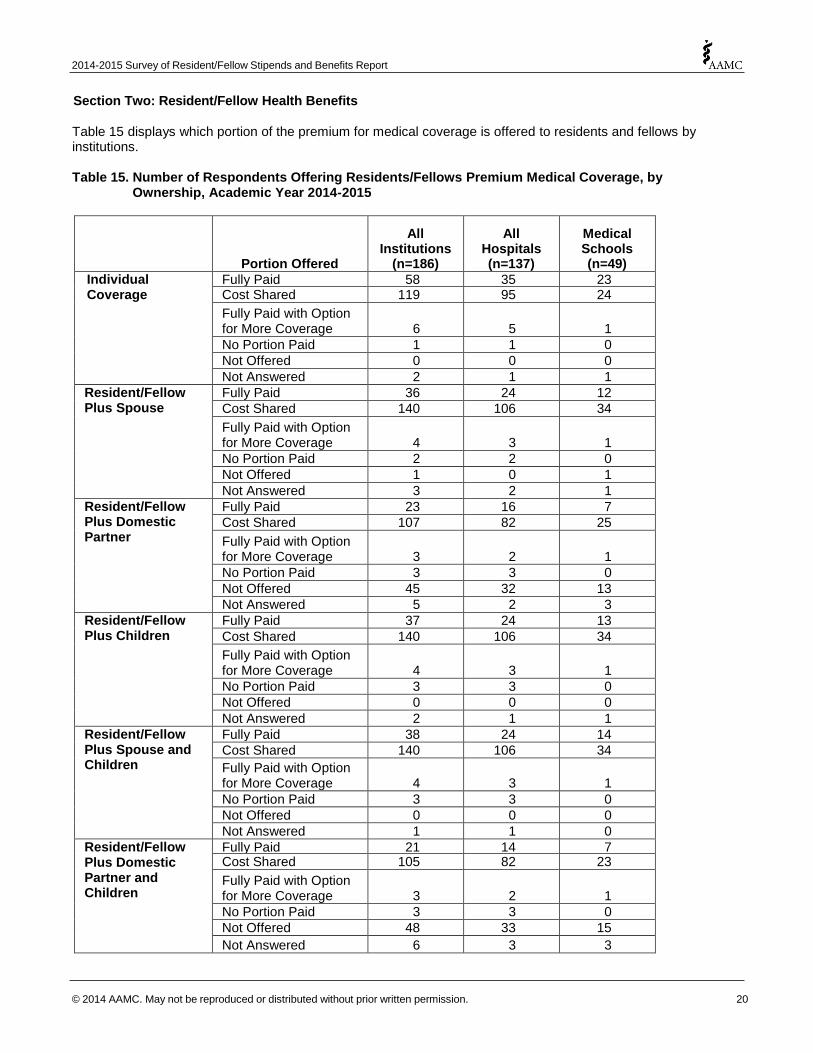
Section Two: Resident/Fellow Health Benefits Table 15 displays which portion of the premium for medical coverage is offered to residents and fellows by institutions. Table 15. Number of Respondents Offering Residents/Fellows Premium Medical Coverage, by Ownership, Academic Year 2014-2015
Portion Offered
All Institutions
(n=186)
All Hospitals (n=137)
Medical Schools (n=49)
Individual Coverage
Fully Paid 58 35 23 Cost Shared 119 95 24
Fully Paid with Option for More Coverage 6 5 1
No Portion Paid 1 1 0
Not Offered 0 0 0
Not Answered 2 1 1
Resident/Fellow Plus Spouse
Fully Paid 36 24 12
Cost Shared 140 106 34
Fully Paid with Option for More Coverage 4 3 1
No Portion Paid 2 2 0
Not Offered 1 0 1
Not Answered 3 2 1
Resident/Fellow Plus Domestic Partner
Fully Paid 23 16 7
Cost Shared 107 82 25
Fully Paid with Option for More Coverage 3 2 1
No Portion Paid 3 3 0
Not Offered 45 32 13
Not Answered 5 2 3
Resident/Fellow Plus Children
Fully Paid 37 24 13
Cost Shared 140 106 34
Fully Paid with Option for More Coverage 4 3 1
No Portion Paid 3 3 0
Not Offered 0 0 0
Not Answered 2 1 1
Resident/Fellow Plus Spouse and Children
Fully Paid 38 24 14
Cost Shared 140 106 34
Fully Paid with Option for More Coverage 4 3 1
No Portion Paid 3 3 0
Not Offered 0 0 0
Not Answered 1 1 0
Resident/Fellow Plus Domestic Partner and Children
Fully Paid 21 14 7 Cost Shared 105 82 23
Fully Paid with Option for More Coverage 3 2 1
No Portion Paid 3 3 0
Not Offered 48 33 15
Not Answered 6 3 3

2014-2015 Survey of Resident/Fellow Stipends and Benefits Report
© 2014 AAMC. May not be reproduced or distributed without prior written permission. 21
Table 16 displays which selected benefits are included in the institutions’ medical coverage for residents and fellows. Table 16. Number of Respondents Including Selected Benefits in Medical Coverage, by Ownership, Academic Year 2014-2015
All
Institutions (n=186)
All Hospitals (n=137)
Medical Schools (n=49)
Vision Care Included in Group Medical Insurance 68 48 20
Separate Plan Offered 113 87 26
Not Offered 5 2 3
Not Answered 0 0 0 Prescription Drugs
Included in Group Medical Insurance 170 123 47
Separate Plan Offered 16 14 2
Not Offered 0 0 0
Not Answered 0 0 0 Behavioral and Mental Health Care
Included in Group Medical Insurance 176 128 48
Separate Plan Offered 7 7 0
Not Offered 1 1 0
Not Answered 2 1 1 Substance Abuse Treatment
Included in Group Medical Insurance 175 126 49
Separate Plan Offered 6 6 0
Not Offered 3 3 0
Not Answered 2 2 0 Dental Care Included in Group
Medical Insurance 39 28 11
Separate Plan Offered 143 108 35
Not Offered 3 0 3
Not Answered 1 1 0

2014-2015 Survey of Resident/Fellow Stipends and Benefits Report
© 2014 AAMC. May not be reproduced or distributed without prior written permission. 22
Table 17 displays the number and percentage of institutions that provide their own health insurance product to residents and fellows for the 2014-2015 academic year.
Table 17. Percent of Respondents That Provide Own Health Insurance Product (Self-Insured), Academic Year 2014-2015
Institution
Count
Percent Responded
Yes
Percent Responded
No
All Respondents 182 50.5% 49.5%
Table 18 displays the number and percentage of institutions that require copayments or deductibles for inpatient, ambulatory, and other services in the residents/fellows medical coverage contract for the 2014-2015 academic year. Table 18. Percent of Respondents Requiring Copayments and/or Deductibles in Medical Coverage Contract, Academic Year 2014-2015
Institution Count
Percent Responded
Yes
Percent Responded
No
Inpatient Services 184 88.0% 12.0%
Ambulatory Services 184 93.5% 6.5%
Other Services 109 74.3% 25.7%
Table 19 displays the number and percentage of institutions that place dollar or service limits on health care benefits for the 2014-2015 academic year. Table 19. Whether Dollar or Service Limits Are Placed on Benefits for Certain Health Care Services, Academic Year 2014-2015
Institution
Count
Percent Responded
Yes
Percent Responded
No
All Respondents 182 45.6% 54.4%
Table 20 displays the number and percentage of institutions that begin health benefits on the first day of residency for the 2014-2015 academic year. Table 20. Whether Resident Health Benefits Begin on the First Recognized Day of Residency, Academic Year 2014-2015
Institution
Count
Percent Responded
Yes
Percent Responded
No
All Respondents 182 90.7% 9.3%

2014-2015 Survey of Resident/Fellow Stipends and Benefits Report
© 2014 AAMC. May not be reproduced or distributed without prior written permission. 23
Table 21 displays the number and percentage of institutions that offer an employee assistance program and/or employee health services for the 2014-2015 academic year. Table 21. Whether Residents/Fellows Are Eligible to Receive Services, Academic Year 2014-2015
Institution Count
Percent Responded
Yes
Percent Responded
No
All Respondents Employee Assistance Program 184 96.7% 3.3%
Employee Health Services 181 90.1% 9.9%

2014-2015 Survey of Resident/Fellow Stipends and Benefits Report
© 2014 AAMC. May not be reproduced or distributed without prior written permission. 24
Section Three: Resident/Fellow Non-Health Benefits Table 22 displays the number and percentage of institutions that indicated a significant change in benefits from previous years in the 2014-2015 academic year. Table 22. Whether There Were Significant Changes in Benefits This Year, Academic Year 2014-2015
Institution
Count
Percent Responded
Yes
Percent Responded
No
All Respondents 184 14.1% 85.9%
Table 23 displays the number and percentage of institutions that offer a flexible benefits plan to residents/fellows for the 2014-2015 academic year. Table 23. Whether Institution Offers a Flexible or "Cafeteria Style" Benefits Plan to Residents/Fellows, Academic Year 2014-2015
Institution
Count
Percent Responded
Yes
Percent Responded
No
All Respondents 183 57.9% 42.1%
Table 24 displays the number and percentage of institutions that offer life insurance and long-term disability insurance premiums to residents/fellows for the 2014-2015 academic year. Table 24. Life Insurance and Long-term Disability Insurance Premiums, All Respondents, Academic Year 2014-2015
Institution
Count Percent
Life Insurance Premium Coverage
Fully Paid 141 77.1%
Cost Shared 29 15.9%
Available, but not paid by institution 10 5.5%
Not Offered 3 1.6%
Total 183 100.0%
Long-term Disability Insurance Premium Coverage
Fully Paid 129 70.9%
Cost Shared 32 17.6%
Available, but not paid by institution 17 9.3%
Not Offered 4 2.2%
Total 182 100.0%
2014-2015 Survey of Resident/Fellow Stipends and Benefits Report
© 2014 AAMC. May not be reproduced or distributed without prior written permission. 25
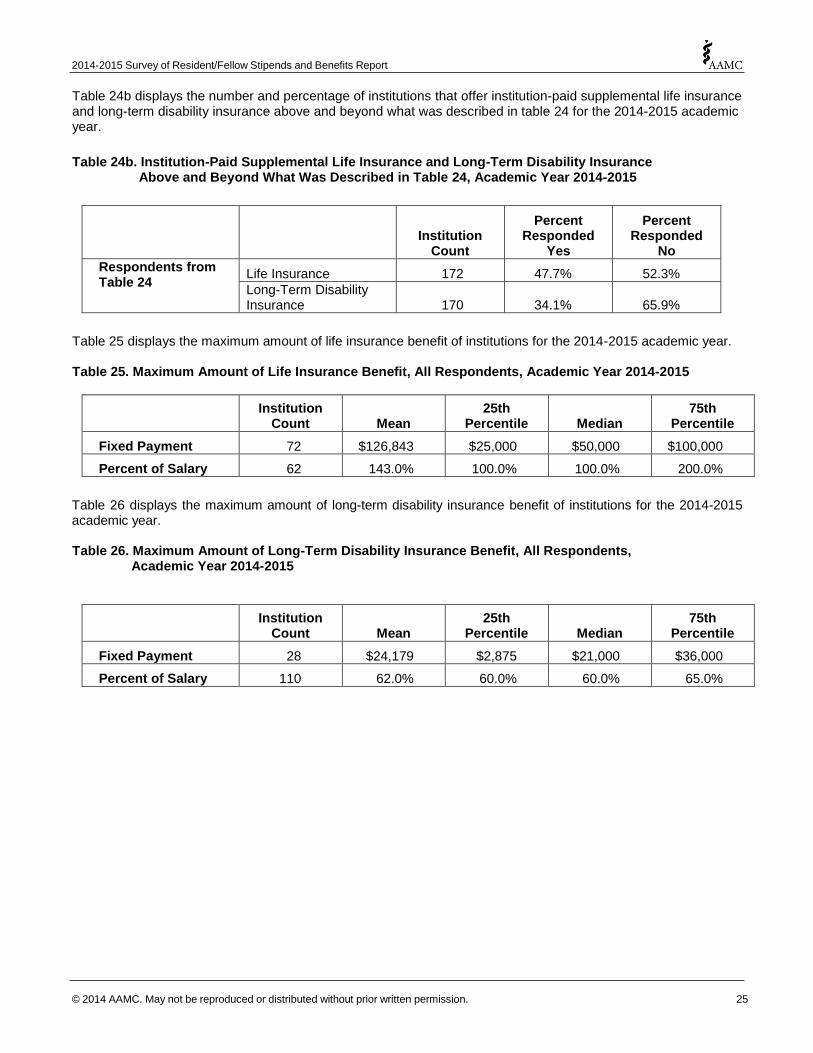
Table 24b displays the number and percentage of institutions that offer institution-paid supplemental life insurance and long-term disability insurance above and beyond what was described in table 24 for the 2014-2015 academic year.
Table 24b. Institution-Paid Supplemental Life Insurance and Long-Term Disability Insurance Above and Beyond What Was Described in Table 24, Academic Year 2014-2015
Institution Count
Percent Responded
Yes
Percent Responded
No
Respondents from Table 24
Life Insurance 172 47.7% 52.3%
Long-Term Disability Insurance 170 34.1% 65.9%
Table 25 displays the maximum amount of life insurance benefit of institutions for the 2014-2015 academic year. Table 25. Maximum Amount of Life Insurance Benefit, All Respondents, Academic Year 2014-2015
Institution
Count Mean 25th
Percentile Median 75th
Percentile
Fixed Payment 72 $126,843 $25,000 $50,000 $100,000
Percent of Salary 62 143.0% 100.0% 100.0% 200.0%
Table 26 displays the maximum amount of long-term disability insurance benefit of institutions for the 2014-2015 academic year. Table 26. Maximum Amount of Long-Term Disability Insurance Benefit, All Respondents, Academic Year 2014-2015
Institution
Count Mean 25th
Percentile Median 75th
Percentile
Fixed Payment 28 $24,179 $2,875 $21,000 $36,000
Percent of Salary 110 62.0% 60.0% 60.0% 65.0%

2014-2015 Survey of Resident/Fellow Stipends and Benefits Report
© 2014 AAMC. May not be reproduced or distributed without prior written permission. 26
Table 27 displays the length of coverage of long-term disability insurance benefit provided by institutions for the 2014-2015 academic year. Table 27. Length of Coverage of Long-Term Disability Insurance Benefit, All Respondents, Academic Year 2014-2015
Institution
Count Mean 25th
Percentile Median 75th
Percentile
Length of Coverage: To Age 103 66 65 65 65
Length of Coverage: In Years 7 57 35 65 83

2014-2015 Survey of Resident/Fellow Stipends and Benefits Report
© 2014 AAMC. May not be reproduced or distributed without prior written permission. 27
Table 28 displays the level of coverage for selected resident and fellow benefits offered by institutions. Table 28. Portion of Respondents by Level of Coverage for Selected Resident/Fellow Benefits,
by Ownership, Academic Year 2014-2015
All
Institutions (n=186)
All Hospitals (n=137)
Medical Schools (n=49)
Housing Costs
Fully Paid 2 2 0
Cost Shared 9 9 0
Not Paid 21 16 5
Not Offered 150 106 44
Not Answered 4 4 0
Parking
Fully Paid 102 78 24
Cost Shared 33 25 8
Not Paid 35 22 13
Not Offered 15 11 4
Not Answered 1 1 0
Meals When Working
Fully Paid 44 31 13
Cost Shared 53 38 15
Not Paid 42 31 11
Not Offered 44 35 9
Not Answered 3 2 1
Meals When On Call
Fully Paid 134 104 30
Cost Shared 41 26 15
Not Paid 5 3 2
Not Offered 5 3 2
Not Answered 1 1 0
Scrubs Fully Paid 169 127 42
Cost Shared 3 3 0
Not Paid 6 2 4
Not Offered 7 4 3
Not Answered 1 1 0

2014-2015 Survey of Resident/Fellow Stipends and Benefits Report
© 2014 AAMC. May not be reproduced or distributed without prior written permission. 28
Table 29 displays the number and percentage of institutions that allow residents/fellows to save unused on-call meal stipends for the 2014-2015 academic year. Table 29. Whether Residents/Fellows Are Able to Save Unused On-Call Meal Stipends, Academic Year 2014-2015
Institution
Count
Percent Responded
Yes
Percent Responded
No
All Respondents 183 44.8% 55.2%
Table 30 displays the number and percentage of institutions that offer a retirement plan to residents/fellows for the 2014-2015 academic year. Table 30. Whether Institutions Offer a Retirement Plan to Residents/Fellows, Academic Year 2014-2015
Institution
Count
Percent Responded
Yes
Percent Responded
No
All Respondents 181 73.5% 26.5%
Table 30b displays the number and percentage of 132 of the 133 institutions that answered “Yes” in table 30 (offering a retirement plan to resident/fellows) responding to whether they provide a defined-benefit retirement plan to residents/fellows for the 2014-2015 academic year. Table 30b. Whether Institutions Offer a Defined-Benefit Retirement Plan to Residents/Fellows, Academic Year 2014-2015
Institution
Count
Percent Responded
Yes
Percent Responded
No
"Yes" Respondents from Table 30 132 47.7% 52.3%

2014-2015 Survey of Resident/Fellow Stipends and Benefits Report
© 2014 AAMC. May not be reproduced or distributed without prior written permission. 29
Table 30c displays the number and percentage of 133 of the 133 institutions that answered “Yes” in table 30 (offering a retirement plan to resident/fellows) responding to whether they require residents/fellows to have a retirement plan for the 2014-2015 academic year. Table 30c. Whether Institutions Offer a Mandatory Retirement Plan to Residents/Fellows, Academic Year 2014-2015
Institution
Count
Percent Responded
Yes
Percent Responded
No
"Yes" Respondents from Table 30 133 21.8% 78.2%
2014-2015 Survey of Resident/Fellow Stipends and Benefits Report
© 2014 AAMC. May not be reproduced or distributed without prior written permission. 30
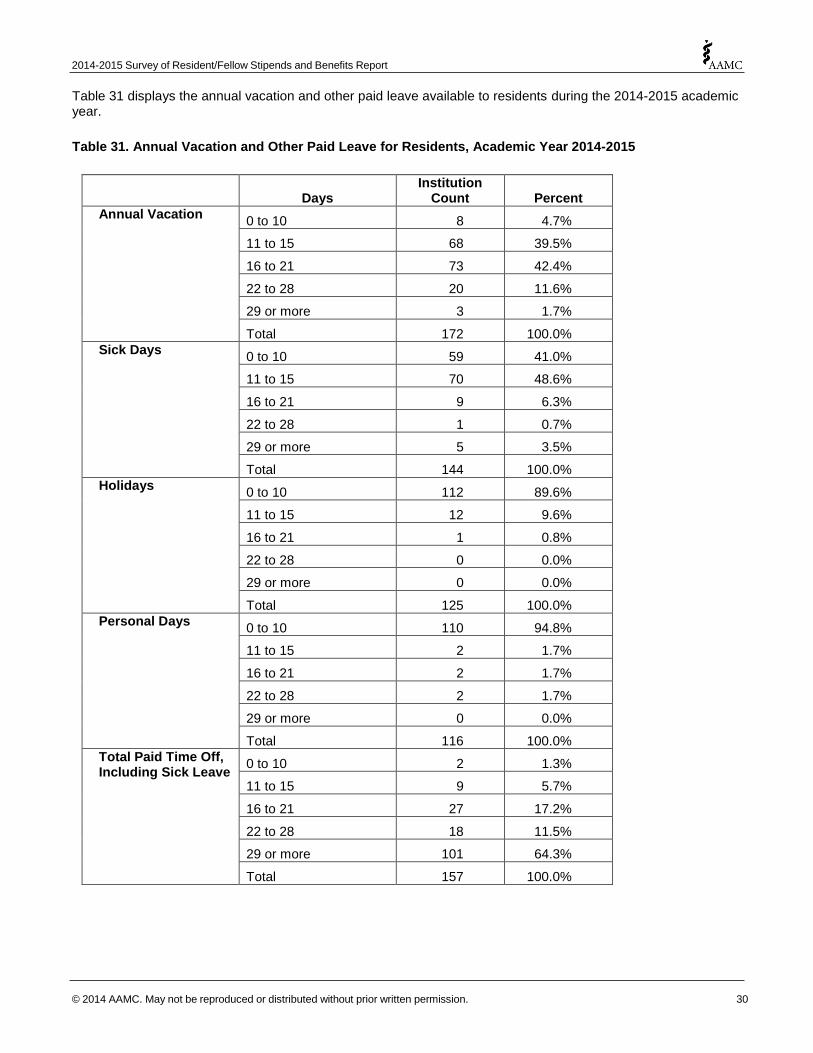
Table 31 displays the annual vacation and other paid leave available to residents during the 2014-2015 academic year.
Table 31. Annual Vacation and Other Paid Leave for Residents, Academic Year 2014-2015
Days Institution
Count Percent
Annual Vacation 0 to 10 8 4.7%
11 to 15 68 39.5%
16 to 21 73 42.4%
22 to 28 20 11.6%
29 or more 3 1.7%
Total 172 100.0%
Sick Days 0 to 10 59 41.0%
11 to 15 70 48.6%
16 to 21 9 6.3%
22 to 28 1 0.7%
29 or more 5 3.5%
Total 144 100.0%
Holidays 0 to 10 112 89.6%
11 to 15 12 9.6%
16 to 21 1 0.8%
22 to 28 0 0.0%
29 or more 0 0.0%
Total 125 100.0%
Personal Days 0 to 10 110 94.8%
11 to 15 2 1.7%
16 to 21 2 1.7%
22 to 28 2 1.7%
29 or more 0 0.0%
Total 116 100.0%
Total Paid Time Off, Including Sick Leave
0 to 10 2 1.3%
11 to 15 9 5.7%
16 to 21 27 17.2%
22 to 28 18 11.5%
29 or more 101 64.3%
Total 157 100.0%

2014-2015 Survey of Resident/Fellow Stipends and Benefits Report
© 2014 AAMC. May not be reproduced or distributed without prior written permission. 31
Table 32 displays the percentages of time first- and second-year residents are allotted to attend educational seminars for the 2014-2015 academic year. Of the 186 institutions, 148 reported that they could not report this because the number of days varies by department. Table 32. Time Allotted to Residents/Fellows to Attend Seminar, Academic Year 2014-2015
Educational Seminar
Days Institution
Count Percent
First Year 0 8 24.2%
1 to 5 20 60.6%
6 to 9 5 15.2%
10 or more 0 0.0%
Total 33 100.0%
Second Year 0 0 0.0%
1 to 5 24 70.6%
6 to 9 9 26.5%
10 or more 1 2.9%
Total 34 100.0%
Table 33 displays the number and percentage of institutions that allow time off to attend seminars in addition to the vacation leave for the 2014-2015 academic year. Table 33. Whether Time Off to Attend Seminars Is In Addition to Vacation Leave, Academic Year 2014-2015
Institution
Count
Percent Responded
Yes
Percent Responded
No
All Respondents 175 88% 12%
Table 34 displays the number and percentage of institutions that contribute a per-diem stipend or contribute to payments for meeting costs for the 2014-2015 academic year. Table 34. Whether the Institution or Program Contributes To Meeting Costs, Academic Year 2014-2015
Institution
Count
Percent Responded
Yes
Percent Responded
No
All Respondents 174 81.6% 18.4%

2014-2015 Survey of Resident/Fellow Stipends and Benefits Report
© 2014 AAMC. May not be reproduced or distributed without prior written permission. 32
Table 35 displays the specific fees and maximum amounts of institutions who contributes a per-diem stipend or contribute to payments for meeting costs for the 2014-2015 academic year. Only institutions responding “Yes” in table 34 were eligible to answer this question. Respondents can select more than one contribution type. Table 35. Contribution Type and Maximum Benefit to Meeting Costs, All Respondents, Academic Year 2014-2015
Contribution Type All Respondents
First Year Registration Fee 69
Per Diem 55
Unspecified 73
Median Maximum Amount $1,000
Second Year Registration Fee 79
Per Diem 59
Unspecified 80
Median Maximum Amount $1,200
Table 36 displays the number and percentage of institutions that provide child care, and the portion offered, for children of residents/fellows for the 2014-2015 academic year. Table 36. Whether Institutions Provide Child Care for Children of Residents/Fellows, All Respondents, Academic Year 2014-2015
Portion Offered Institution
Count Percent
On-site Care Fully Paid 1 0.5%
Cost Shared 12 6.5%
Available, but Not Paid by Institution 43 23.4%
Not Offered 128 69.6%
Total 184 100.0%
Off-site Care Fully Paid 0 0.0%
Cost Shared 8 4.5%
Available, but Not Paid by Institution 42 23.7%
Not Offered 127 71.8%
Total 177 100.0%
Table 37 displays the number and percentage of institutions that do not provide child care, but assist residents/fellows with locating child care. Table 37. Whether Institutions That Do Not Provide Child Care Assist Residents/Fellows with Locating Child Care, Academic Year 2014-2015
Institution
Count
Percent Responded
Yes
Percent Responded
No
All Respondents 163 38% 62%

2014-2015 Survey of Resident/Fellow Stipends and Benefits Report
© 2014 AAMC. May not be reproduced or distributed without prior written permission. 33
Table 38 displays the number and percentage of institutions that offer financial counseling and educational debt management services to residents/fellows for the 2014-2015 academic year. Table 38. Whether Institutions Offer Financial Counseling and Educational Debt Management Services to Resident/Fellows, Academic Year 2014-2015
Institution
Count
Percent Responded
Yes
Percent Responded
No
All Respondents 184 69.6% 30.4%
Table 39 displays the number and percentage of institutions that offer career counseling or placement services to residents/fellows for the 2014-2015 academic year. Table 39. Whether Institutions Offer Career Counseling or Placement Services to Residents/Fellows, Academic Year 2014-2015
Institution
Count
Percent Responded
Yes
Percent Responded
No
All Respondents 184 51.1% 48.9%
Table 40 displays the number and percentage of institutions that require different types of drug and/or alcohol testing for residents/fellows for the 2014-2015 academic year. Table 40. Whether Institutions Require Various Drug and/or Alcohol Testing for Residents/Fellows, All Respondents, Academic Year 2014-2015
Institution
Count
Percent Responded
Yes
Percent Responded
No
Pre-Appointment Testing 130 71% 29%
Random Testing 22 12.2% 87.8%
Testing When Probable Cause Is Present 170 93.9% 6.1%
Repeat Testing in the Absence of Probable Cause 46 26.1% 73.9%
2014-2015 Survey of Resident/Fellow Stipends and Benefits Report
© 2014 AAMC. May not be reproduced or distributed without prior written permission. 34
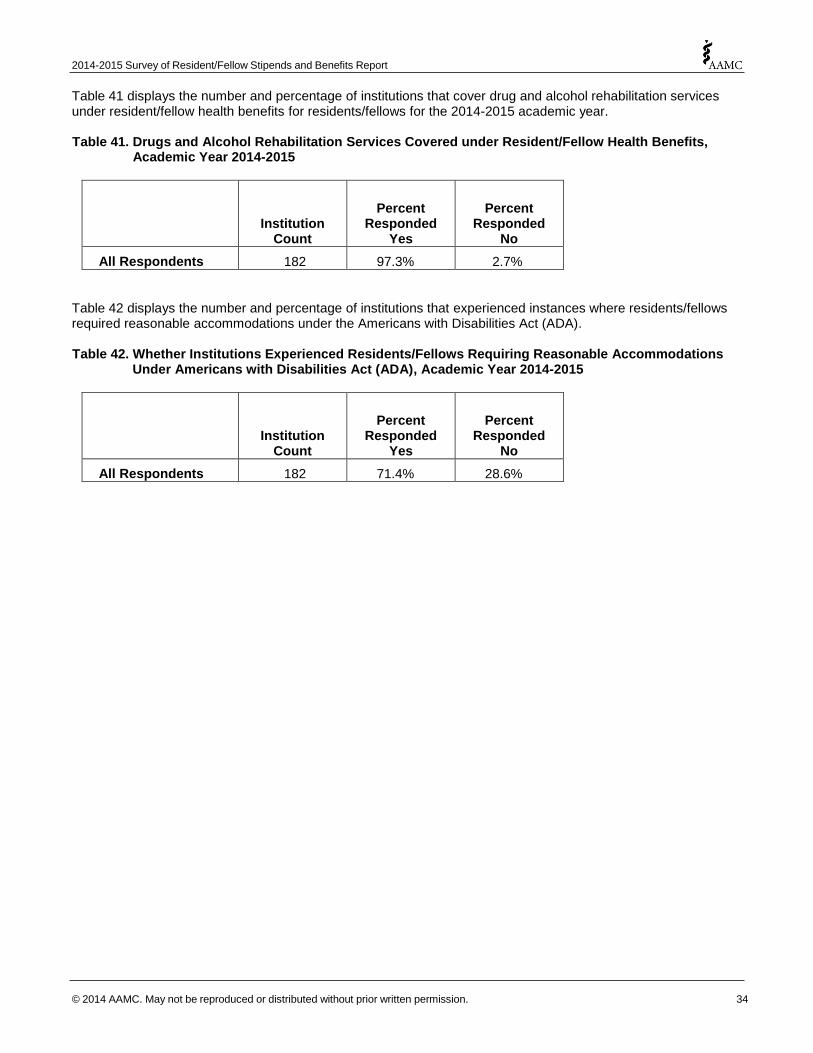
Table 41 displays the number and percentage of institutions that cover drug and alcohol rehabilitation services under resident/fellow health benefits for residents/fellows for the 2014-2015 academic year. Table 41. Drugs and Alcohol Rehabilitation Services Covered under Resident/Fellow Health Benefits, Academic Year 2014-2015
Institution
Count
Percent Responded
Yes
Percent Responded
No
All Respondents 182 97.3% 2.7%
Table 42 displays the number and percentage of institutions that experienced instances where residents/fellows required reasonable accommodations under the Americans with Disabilities Act (ADA). Table 42. Whether Institutions Experienced Residents/Fellows Requiring Reasonable Accommodations Under Americans with Disabilities Act (ADA), Academic Year 2014-2015
Institution
Count
Percent Responded
Yes
Percent Responded
No
All Respondents 182 71.4% 28.6%

2014-2015 Survey of Resident/Fellow Stipends and Benefits Report
© 2014 AAMC. May not be reproduced or distributed without prior written permission. 35
Table 43 displays the number of institutions that require background investigations, by type, of residents/fellows for the 2014-2015 academic year. Table 43. Whether Institutions Require Background Investigations of Residents/Fellows, All Respondents, Academic Year 2014-2015
All Respondents
Criminal Background Checks
At Entry 175
During the Residency Program 8
At the End of the Program 1
Not at All 8
Checks of State's Child Abuse Registry
At Entry 119
During the Residency Program 8
At the End of the Program 1
Not at All 50
Check of State's Sex Offender Registry
At Entry 120
During the Residency Program 5
At the End of the Program 0
Not at All 53
Table 44 displays the number and percentage of institutions (not departments) that provide various tools, or funds for tools, to residents/fellows for the 2014-2015 academic year. Table 44. Whether Institutions Provide Funds or Tools to Residents/Fellows, All Respondents, Academic Year 2014-2015
Institution
Count
Percent Responded
Yes
Percent Responded
No
Books 176 38.1% 61.9%
Computer 175 29.7% 70.3%
Generic "Education Allowance" 181 46.4% 53.6%
Mobile Devices (e.g., phones, tablets, data plan) 178 39.9% 60.1%
Other 85 23.5% 76.5%
Preparation of Posters 178 43.8% 56.2%
Professional Society Dues 177 39.5% 60.5%
Thank you to all the AAMC members who responded to the 2014-2015 Survey of Resident/Fellow Stipends and Benefits and helped make this report possible.