team members - edudel.gov.in5 xii – economics unit 1 intr oduction study of economics is divided...
TRANSCRIPT

1 XII – Economics
LIST OF MEMBERS WHO PREPAREDQUESTION BANK FOR ECONOMICS FOR CLASS XII
TEAM MEMBERS
Sl. No. Name Designation
1. Mrs. Neelam Vinayak V. Principal(Team Leader) G.G.S.S. Deputy Ganj, Sadar Bazar
Delhi-110006
2. Sh. S.P.S. Rathi P.G.T. (Economics)Rajkiya Pratibha Vikas VidyalayaBT Block, Shalimar Bagh, Delhi-88
3. Sh. Sanjeev Kumar P.G.T. (Economics)G.B.S.S.S. No. 2,Ghonda, Delhi-110053

XII – Economics 2
ECONOMICS
Time : 3 hours Maximum Marks : 100
The weightage to marks over different dimensions of the question paper shall beas under.
Part A : WEIGHTAGE TO CURRENT/SUBJECT UNITS
S.No. Content Unit Mark
Part A : Introductory Micro Economics
1. Introduction 4
2. Consumer Behaviour and Demand 18
3. Producer Behaviour and Supply 18
4. Forms of Market and Price Determination 10
5. Simple applications of Tools of demand and supply curves
Total 50
Part B : INTRODUCTORY MACRO ECONOMICS
1. National Income and Related Aggregates 15
2. Determination of Income and Employment 12
3. Money and Banking 8
4. Government Budget and the Economy 8
5. Balance of payments 7
Total 50
Grand Total 100

3 XII – Economics
S.No. Forms of Questions Marks for each No. Totalquestion question Mark
1. Very short answer type (VSA) 1 10 10
2. Short answer type (SAI) 3 10 30
3. Short answer type (SAII) 4 6 24
4. Long answer type (LA) 6 6 36
Total 32 100
C. No. of Sections
The questions paper will have two section A and B.
D. Scheme of Option
There will be no overall choice. However, there is internal choice in onequestion of 3 marks and one question of 4 marks and one question of 6 marksin each section.
E. Weightage to forms of Questions
S.No. Estimated Difficulty PercentageLevel of Questions
1. Easy 30%
2. Average 50%
3. Difficult 20%
F. Typology of Questions
In order to asses different abilities related to the subject, the question paperis likely to include open-ended questions and numerical questions.
XII – Economics 4
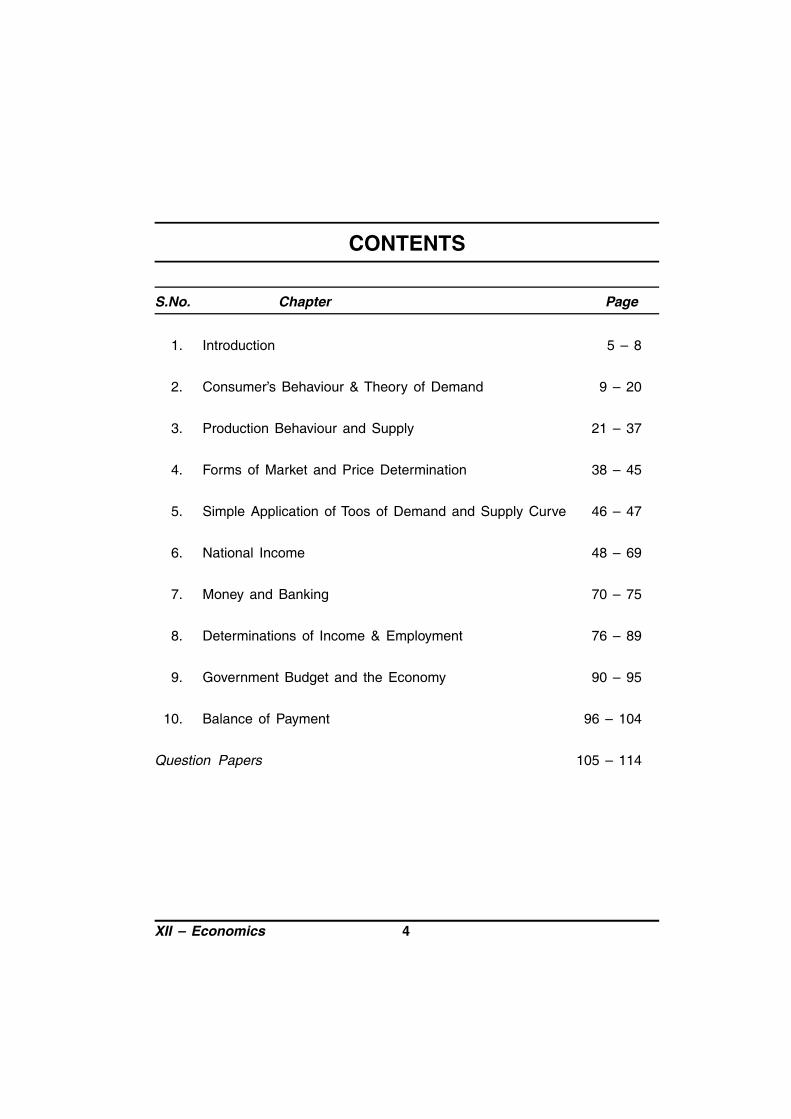
CONTENTS
S.No. Chapter Page
1. Introduction 5 – 8
2. Consumer’s Behaviour & Theory of Demand 9 – 20
3. Production Behaviour and Supply 21 – 37
4. Forms of Market and Price Determination 38 – 45
5. Simple Application of Toos of Demand and Supply Curve 46 – 47
6. National Income 48 – 69
7. Money and Banking 70 – 75
8. Determinations of Income & Employment 76 – 89
9. Government Budget and the Economy 90 – 95
10. Balance of Payment 96 – 104
Question Papers 105 – 114
5 XII – Economics
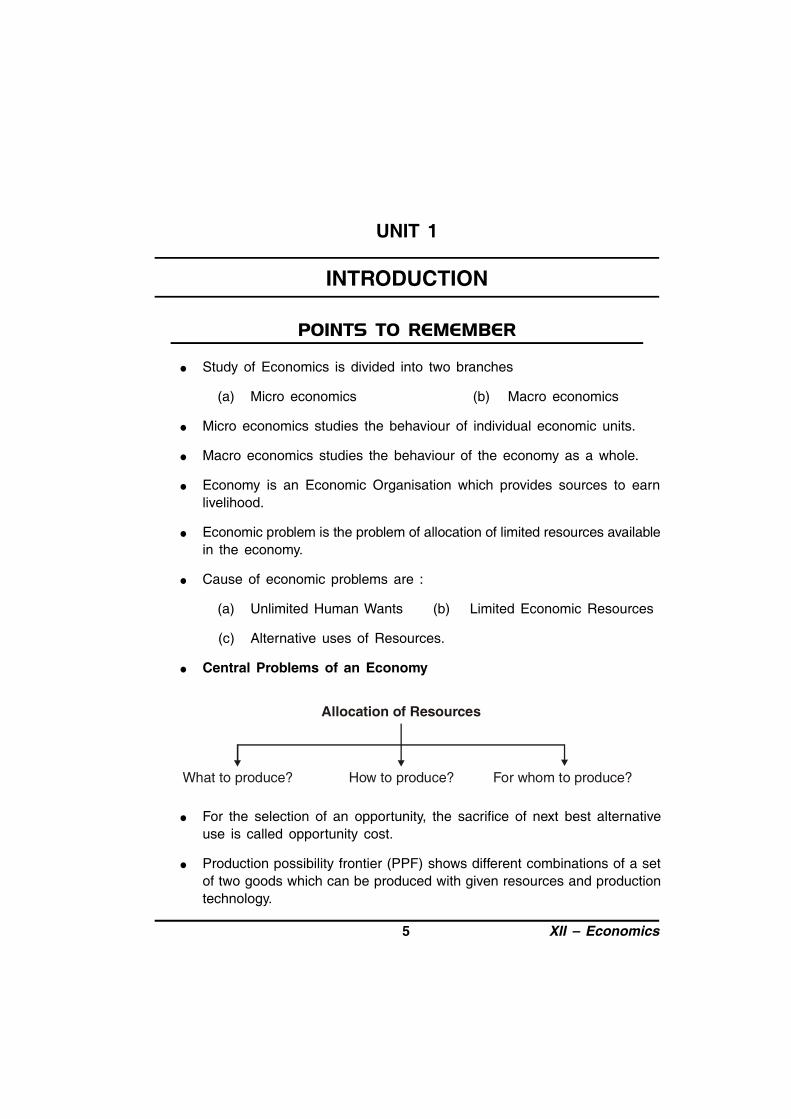
UNIT 1
INTRODUCTION
Study of Economics is divided into two branches
(a) Micro economics (b) Macro economics
Micro economics studies the behaviour of individual economic units.
Macro economics studies the behaviour of the economy as a whole.
Economy is an Economic Organisation which provides sources to earnlivelihood.
Economic problem is the problem of allocation of limited resources availablein the economy.
Cause of economic problems are :
(a) Unlimited Human Wants (b) Limited Economic Resources
(c) Alternative uses of Resources.
Central Problems of an Economy
Allocation of Resources
What to produce? How to produce? For whom to produce?
For the selection of an opportunity, the sacrifice of next best alternativeuse is called opportunity cost.
Production possibility frontier (PPF) shows different combinations of a setof two goods which can be produced with given resources and productiontechnology.

XII – Economics 6
Production possibility curve PPF
(a) Slopes downward from left to right
(b) Concave to the origin.
Rightward shift of PPF indicates increase in resources and improvementin technology.
Marginal Rate of Transformation (MRT) is the ratio of number of units ofa good sacrificed to increase one more unit of the other good.
MRT can also called Marginal opportunity cost. It is defined as the additionalcost in terms of number of units of a good sacrificed to increase anadditional unit of the other good.
VERY SHORT ANSWER TYPE QUESTIONS (1 MARK)
1. With the help of an example, define micro economics.
2. Define macro economics with the help of an example.
3. Define opportunity cost.
4. Why does an economic problem arise?
5. Write two characteristics of resources.
6. What do you mean by scarcity?
7. Define Marginal Rate of Transformation.
8. What do you mean by an economy?
HOTS
9. Sugar industry is a subject matter of micro economics. Give reason.
10. What do you mean by alternative uses of resources?
11. What will be the shape of PPF when MRT is constant?
12. Unemployment in India is a subject matter of Microeconomics orMarcoeconomics, give reason.

7 XII – Economics
SHORT ANSWER TYPE QUESTIONS (3/4 MARKS)
1. Distinguish between microeconomics and macroeconomics. Give example.
2. Why does an economic problem arise? Explain the problem of 'How toProduce'?
3. Explain the problem of 'What to Produce' with the help of an example.
4. ‘For whom to produce’ is a central problem of an economy. Explain.
5. Why is a production possibility curve concave? Explain.
6. Define opportunity cost with the help of an example, how does it differ frommarginal opportunity cost?
HOTS
7. What is PP Frontier? Explain it with the help of an imaginary schedule anddiagram.
8. Show the following situation with PPF
(a) Fuller utilisation of resources (b) Growth of resources.
(c) Under utilisation of resources.
9. How is PPC affected by unemployment in the economy? Explain.
10. Define opportunity cost and explain it with the help of an example.
11. Explain how a PPC is affected where resources are in efficiently employedin an economy.
12. Calculate MRT from following table. What will be the shape of PPF andwhy?
Combinations Good A (units) Good B (units)
A 20 0
B 18 1
C 14 2
D 8 3
E 0 4
13. Explain features of P.P.C.

XII – Economics 8
ANSWER OF VERY SHORT TYPE QUESTIONS
1. Micro Economics is that branch of economics in which economic problemsare studied at individual level e.g. the behaviour of consumer, firms, etc.
2. Macro economics is that branch of economics which studies the economyas a whole and its aggregates e.g. National income, the level of employment.
3. An economic problem arises due to scarcity of resources having alternativeuses in relation to unlimited wants.
4. Resources are scare (limited) and they have alternative uses.
5. Scarcity refers to a situation in which demand is more than supply.
6. Marginal rate of transformation (MRT) is the ratio of one good sacrificedto increase one more unit of the other good.
8. An economy is an economic organisation which provides sources to earnlivelihood.
9. Sugar industry is a subject matter of micro economics because it is onlya unit of industries.
10. Alternate use of resources mean, more than one uses to which a resourcecan be put.
11. Shape of PPF will be a straight line sloping down ward.
12. Unemployment in India is a subject matter of macroeconomics because itrelates to economy as whole.
HINTS [3 MARKS QUESTIONS]12.
Combinations Good A Good B MRT = A/ B
A 20 0 –
B 18 1 2 : 1
C 14 2 4 : 1
D 8 3 6 : 1
E 0 4 8 : 1

9 XII – Economics
UNIT 2
CONSUMER'S BEHAVIOUR &THEORY OF DEMAND
Consumer : is an economic agent who consumes final goods and services.
Total utility : It is the sum of satisfaction from consumption of all the unitsof a commodity at a given time.
Marginal Utility : It is a net increase in total utility by consuming anadditional unit of a commodity.
Law of Diminishing Marginal Utility : As consumer consumes more andmore units of commodity. The Marginal utility derived from the last unitgoes declining.
Consumer’s Bundle : It is a quantitative combination of two goods whichcan be purchased by a consumer from his given income.
Budget set : It is quantitative combination of those bundles which aconsumer can purchase his from given income at prevailing market prices.
Consumer Budget : It states the real income or purchasing power of theconsumer from which he can purchase the certain quantitative bundles oftwo goods at given price.
Budget Line : Shows those combinations of two goods which a consumercan buy from limited income on same curve.
• Monotonic Preferences : Consumer’s preferences are called monotonicwhen between any two bundles, one bundle has more of one good and noless of other good.
Change in Budget Line : There can be parallel shift (leftwards orrightwards) due to change in income of the consumer.
XII – Economics 10
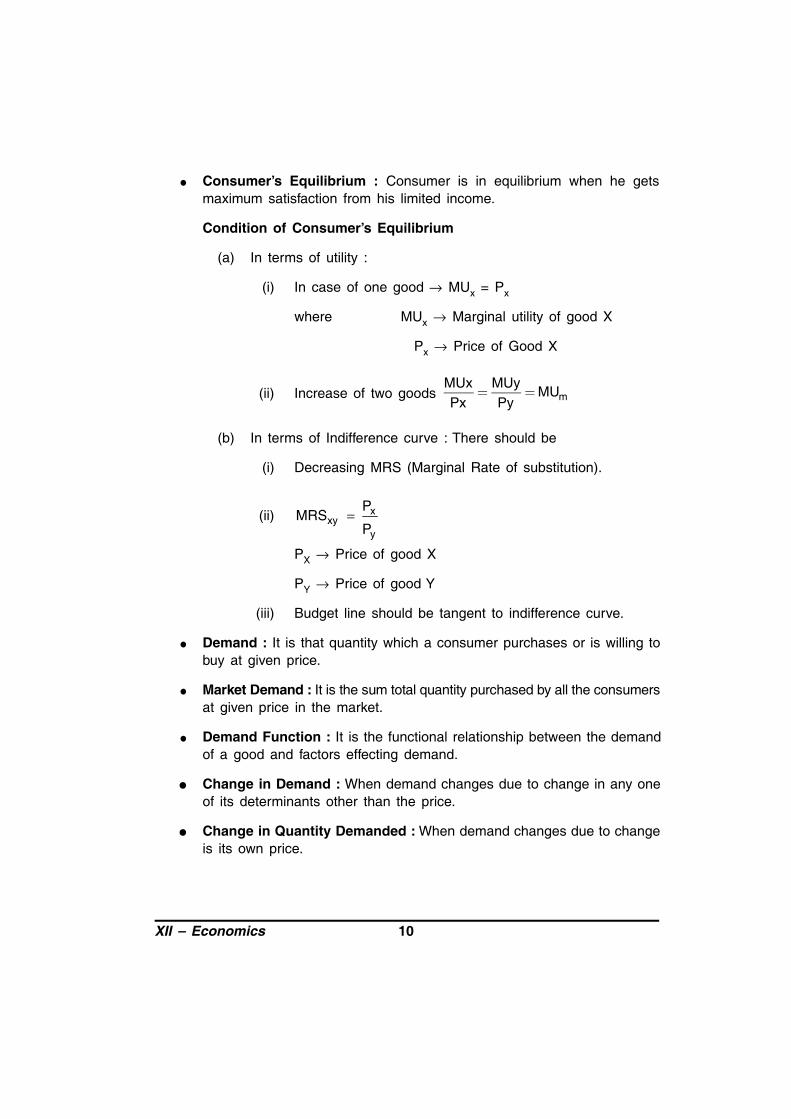
Consumer’s Equilibrium : Consumer is in equilibrium when he getsmaximum satisfaction from his limited income.
Condition of Consumer’s Equilibrium
(a) In terms of utility :
(i) In case of one good MUx = Px
where MUx Marginal utility of good X
Px Price of Good X
(ii) Increase of two goods mMUx MUy
MUPx Py
(b) In terms of Indifference curve : There should be
(i) Decreasing MRS (Marginal Rate of substitution).
(ii) xxy
y
PMRS
P
PX Price of good X
PY Price of good Y
(iii) Budget line should be tangent to indifference curve.
Demand : It is that quantity which a consumer purchases or is willing tobuy at given price.
Market Demand : It is the sum total quantity purchased by all the consumersat given price in the market.
Demand Function : It is the functional relationship between the demandof a good and factors effecting demand.
Change in Demand : When demand changes due to change in any oneof its determinants other than the price.
Change in Quantity Demanded : When demand changes due to changeis its own price.

11 XII – Economics
Determinants of Demand
Extension in Demand
Decrease in price
Downward movement along a Demand curve
Other Factors
Consumer Income
Taste and Preference
Change in price of related good
Future expectation to change in price
Change in number of consumer.
Contraction in Demand
Increase in price
Upward movement along a Demand curve
Change in price
Change in Quantity Demanded
Change in Demand
Increase in Demand
Rightward shift of Demand curve
Causes(i) Increase in consumers income
(ii) Increase in price of substitute good
(iii) fall in price of complementary good.
(iv) Increase in number of consumer
(v) Future expectation of Increase in price.
Decrease in Demand
Leftward shift of Demand Curve
Causes(i) Decrease in income of consumer
(ii) Decrease in price of substitute good
(iii) Increase in price of complementary good.
(iv) Decrease in number of consumer
(v) Future expectation of Decrease in price.
Price Elasticity of Demand : It measures the degree of responsivenessof demand to change in price of the commodity.
Methods of Measuring Price Elasticity of Demand
Percentage method Total expenditure methodor
Outlay method
Geometric method
Percentage Method
1 0 0d
1 0 0
Q Q PQ PE or Ed
P Q P P Q
Ed Elasticity of Demand
Q Change in quantity

XII – Economics 12
P Change in Price
P Initial Price
Q Initial Quantity
Or dPercentage Change in Quantity
EPercentage Change in Price
Total Expenditure Method : It measures price elasticity of demand on thebasis of change in total expenditure incurred on the commodity by ahousehold as a result of change in its price.
Geometric Method : Elasticity of demand at any point is measured bydividing the length of lower segment of the demand curve with the lengthof upper segment of demand curve at that point.
Lower segment of the demand curveEd
Upper segment of the demand curve
Degree of Price Elasticity of Demand
Quantity
Y
X
Pric
e
Perfe
ctly
inel
astic
elastic less than one
Unitary elasticelastic more than one
Perfectly Elastic
O
Factors effecting Price elasticity of Demand
(a) Behaviour of the consumer
(b) Nature of the commodity
(c) Possibility of postponement of consumption.
(d) Part of income to be spent on the commodity
13 XII – Economics
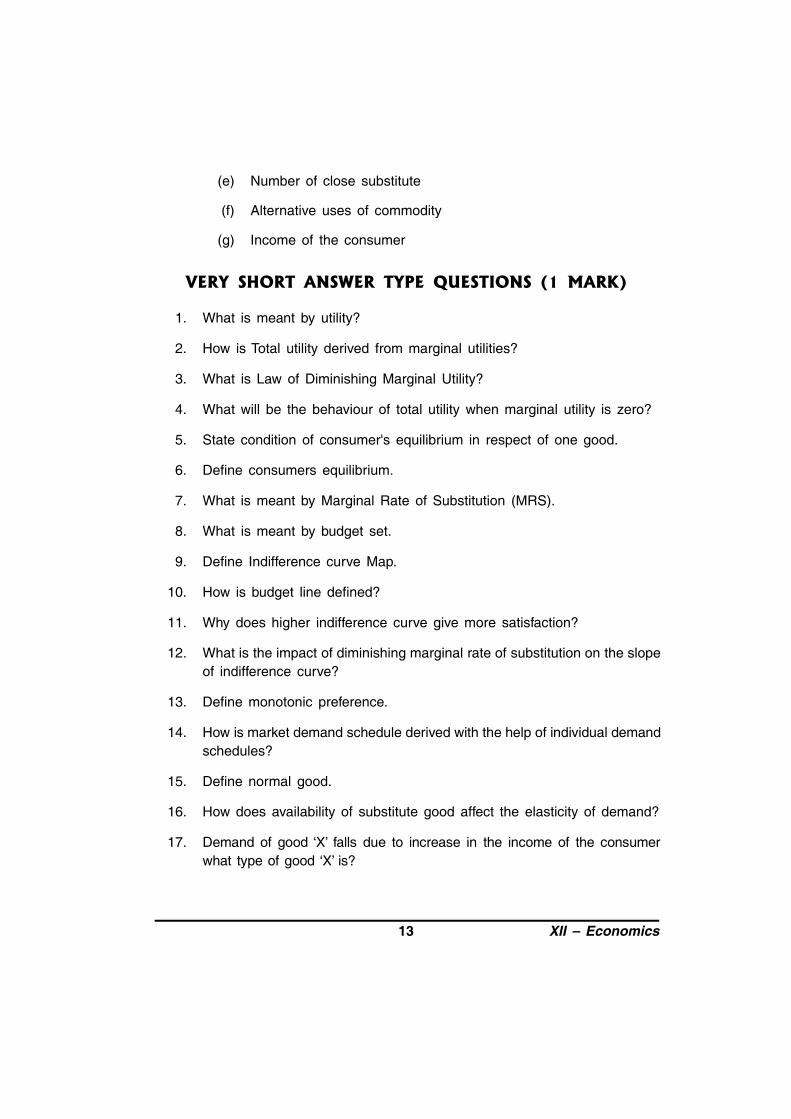
(e) Number of close substitute
(f) Alternative uses of commodity
(g) Income of the consumer
VERY SHORT ANSWER TYPE QUESTIONS (1 MARK)
1. What is meant by utility?
2. How is Total utility derived from marginal utilities?
3. What is Law of Diminishing Marginal Utility?
4. What will be the behaviour of total utility when marginal utility is zero?
5. State condition of consumer's equilibrium in respect of one good.
6. Define consumers equilibrium.
7. What is meant by Marginal Rate of Substitution (MRS).
8. What is meant by budget set.
9. Define Indifference curve Map.
10. How is budget line defined?
11. Why does higher indifference curve give more satisfaction?
12. What is the impact of diminishing marginal rate of substitution on the slopeof indifference curve?
13. Define monotonic preference.
14. How is market demand schedule derived with the help of individual demandschedules?
15. Define normal good.
16. How does availability of substitute good affect the elasticity of demand?
17. Demand of good ‘X’ falls due to increase in the income of the consumerwhat type of good ‘X’ is?

XII – Economics 14
18. What will be the impact on demand of the good due to increase in priceof the substitute good?
19. A rise in price of a good results in a decrease in expenditure of it. Is itsdemand elastic or inelastic?
20. What is meant by market demand?
21. Define demand schedule.
22. What cause an upward movement along a demand curve?
23. If the number of consumers increase, in which direction will the demandcurve shift?
24. A straight line demand curve is given. What will be elasticity of demand onthe mid point of this curve.
25. If the slope of a demand curve is parallel to X-axis, what will be theelasticity of demand?
26. Why is demand of water inelastic?
H.O.T.S.
27. What happens to total expenditure of a commodity when its price fallsand its demand is unit elastic?
28. Why does total utility increases at diminishing rate due to continuousincrease in consumption?
29. Due to decrease in price of pen why does the demand of ink increase?
30. What will be the behaviour of total utility when marginal utility curve liesbelow X-axis?
SHORT ANSWER TYPE QUESTIONS (3-4 MARKS)
1. Explain the law of diminishing marginal utility with the help of a utilityschedule.
2. Explain consumers equilibrium with utility approach in case of single good.
3. What do you mean by budget line? What are the reasons of change inbudget line?

15 XII – Economics
4. Explain the relationship between total utility and marginal utility with thehelp of schedule.
Or
What changes will take place in total utility when –
(a) Marginal utility curve remains above X–axis
(b) Marginal utility curve touches X–axis
(c) Marginal utility curve lies below X–axis.
5. State three features of indifference curve.
6. Why does two indifference curves not intersect each other?
7. Under what situations there will be parallel shift in budget line?
8. Explain the effect of a rise in the prices of ‘related goods’ on the demandfor a good X.
9. Why does demand of a normal good increases due to increase inconsumer’s income?
10. Explain by giving an example, how price elasticity of demand of a gooddepends on the nature of good.
11. State elasticity of demand of followings :
(a) Luxurious goods
(b) Goods of alternate use
(c) Necessity goods.
12. Distinguish between expansion of demand and increase in demand withthe help of diagram.
13. Measure Price Elasticity of Demand on the following points of a straightline demand curve :
(a) Centre point of the demand curve.
(b) Demand curve intercepting y-axis
(c) Demand curve intercepting x-axis.
XII – Economics 16
14. What is an inferior good? In what manner does the demand curve of sucha good affected when income of the consumer increase? Use diagrams.
15. Distinguish between change in demand and change in quantity demanded.
16. What will be the effect of following on elasticity of demand.
(a) time factor (b) nature of the product.
17. How is price elasticity of demand of a good influenced by availability of itsclose substitute? Explain by giving an example.
18. “A good may be inferior for one consumer and normal for another”. Do youagree with this statement. Give reasons in support of your answer.
19. What will be the slope of demand curve under following situations.
(a) Perfectly elastic demand
(b) Perfectly inelastic demand
(c) Unit elastic demand.
20. State the factors of rightward shift of demand curve. Explain any one.
21. State the factors of leftward shift of demand curve. Explain any one.
22. How does ‘a portion of income spent on a good’ effect elasticity of demand.
23. What will be elasticity of demand if
(a) Total expenditure increases due to increase in price.
(b) Total expenditure increases due to fall in price.
24. The price elasticity of Demand of commodity X and Y are equal. The priceof X falls from Rs. 10 to Rs. 8 per unit and its quantity demanded increaseby 16 percent. The price of Y rises by 10 percent. Calculate the percentagedecrease in its demand.
25. The price elasticity of demand of good ‘X’ and ‘Y’ is same. If price of good‘X’ falls by 10% and price of good ‘Y’ increase by 10% then what changeswill take place is demand of good ‘X’ and good ‘Y’.

17 XII – Economics
26. If the price of a commodity rises from Rs. 8 per unit to Rs. 10 per unit, aconsumers demand falls from 110 units to 100 units. Find out the priceelasticity of demand for this commodity.
27. At the price of Rs. 4 per unit, a elasticity of demand is –2. How many unitswill the consumer buy at Rs. 3 per unit?
28. When the price of a commodity falls by Rs. 2 per unit, its quantity demandedincreases by 10 units. Its price elasticity of demand is (–) 1. Calculate itsquantity demanded at the price before change which was Rs. 10 per unit.
29. The price elasticity of demand of a commodity is –0.5. At a price of Rs.20 per unit, total expenditure on it is Rs. 2,000. Its price is reduced by 10percent. Calculate its demand at the reduced price.
H.O.T.S.
30. State four determinants of price elasticity of demand.
31. Fill in the gaps in the following equations :
(i)?
MUQ
(ii) ? = MU
(iii) MUn = TUn – ?
(iv) Dq P
e? Q
32. Differentiate between :
(i) Normal goods and Inferior goods
(ii) Complimentary goods and substitute goods.
33. Why should the budget line be tangent to the indifference curve at thepoint of consumer’s equilibrium.
34. Distinguish between rightward shift of demand curve and downwardmovement along the demand curve.
35. Why does consumer stop consumption in case where marginal utility isless than price of a good?

XII – Economics 18
LONG QUESTIONS (6 MARKS)
1. Explain the conditions of consumer’s equilibrium with the help of theindifference curve analysis. Represent the same in a diagram.
2. Explain the determination of consumers equilibrium with the help of aschedule in case of two commodities by using utility approach.
3. Why does demand curve slope downward?
4. Explain the determinants of price elasticity of demand.
5. Explain the causes of increase in demand (rightward shift of demandcurve).
6. With the help of diagrams, explain the effect of following changes on thedemand of a commodity.
(a) A fall in the income of its buyer.
(b) A rise in price of complementary good.
7. What are the conditions of consumer’s equilibrium under the indifferencecurve approach? What changes will take place if the conditions are notfulfilled to reach equilibrium?
H.O.T.S.
8. With the help of numerical example measure price elasticity of demand inthe following conditions by total expenditure method :
(i) Demand falls when price is constant.
(ii) Price falls while demand is constant.
9. How will a fall in the price of tea affect the equilibrium price of coffee?Explain the chain of effects.
10. Whether the following statements are true or false? Give reasons.
(i) Two indifference curves never intersects each other.
(ii) Income effect of inferior good is positive.
(iii) Change in quantity demanded is the explanations of law of demand.
19 XII – Economics
11. Following statements are true or false give reasons :
(i) Increase in number of consumers shifts the demand curve rightward.
(ii) The demand of a commodity becomes elastic if its substitute goodis available in the market.
(iii) The price elasticity of demand is equal to unity at a point situatedin the middle of a straight line demand curve.
VERY SHORT ANSWER TYPE QUESTIONS
1. Utility is the power of goods to satisfy human wants.
2. Total utility is derived by summing up the marginal utilities TU = MU.
3. Law of diminishing marginal utility states that as more and more units of acommodity are consumed marginal utility derived from every additionalunit must decline.
4. Total utility will be maximum.
5. MUX = Px
6. Consumers equilibrium refers to a situations in which a consumer getsmaximum satisfaction from his given income and market price.
7. MRS is the rate of sacrifice of one good to get an additional unit of othergood.
8. The set of bundles available to the consumer with his given income atprevailing market price is called the budget set.
9. A family of indifference curve indicating different levels of satisfaction calledindifference map.
10. Budget line is a line showing all different possible combinations of twogoods which a consumer can buy in given his budget and the price of bothgoods.
11. Higher difference curve shows a higher level of satisfactions. It shows thevarious combinations of excess quantity of both goods than lowerindifference curve.
XII – Economics 20
12. Indifference curve become convex towards the origin.
13. Consumer’s preferences are called monotonic when between any twobundles, one bundle has more of one good and no less of other good.
14. By summations of individual schedules.
15. Normal goods are those goods, the demand for which increases as incomeof the buyer rise. There in positive relation between income and demandof these goods.
16. The demand of a good becomes elastic if its substitute good is availablein the market.
17. Good ‘X’ is an inferior good.
18. The demand of the good will increase.
19. Elastic.
20. Market demand is the sum of total demand of all the consumers in themarket at a particular time and at a given price.
21. Demand schedule is a tabular representation which represent differentquantities of the commodity demanded at different prices.
22. Increase in price while other factors are constant.
23. Rightward.
24. Equal to unit.
25. Perfectly elastic.
26. Because water is a necessity good.
H.O.T.S. (ANSWERS)
27. Total expenditure will remains unchanged.
28. As more and more units of commodity are consumed, marginal utilityderived from each successive unit tends to diminish so total utility increasesat diminishing rate up.
29. These are complimentary goods.
30. Total utility start to decline.

21 XII – Economics
UNIT 3
PRODUCTION BEHAVIOUR AND SUPPLY
Production function shows the functional relationship between physicalinput and physical output.
Ox = F (i., i2 ... in)
Ox Production of Good X
f function of
i, i2 ..... in inputs
Total production refers to the sum total of production done by using allunits of variable factors over a given period of time.
Average production is the per unit output of variable factor (labour) employed.
TPAP Variable input
Marginal product is addition to total product resulting from employing oneadditional unit of variable input.
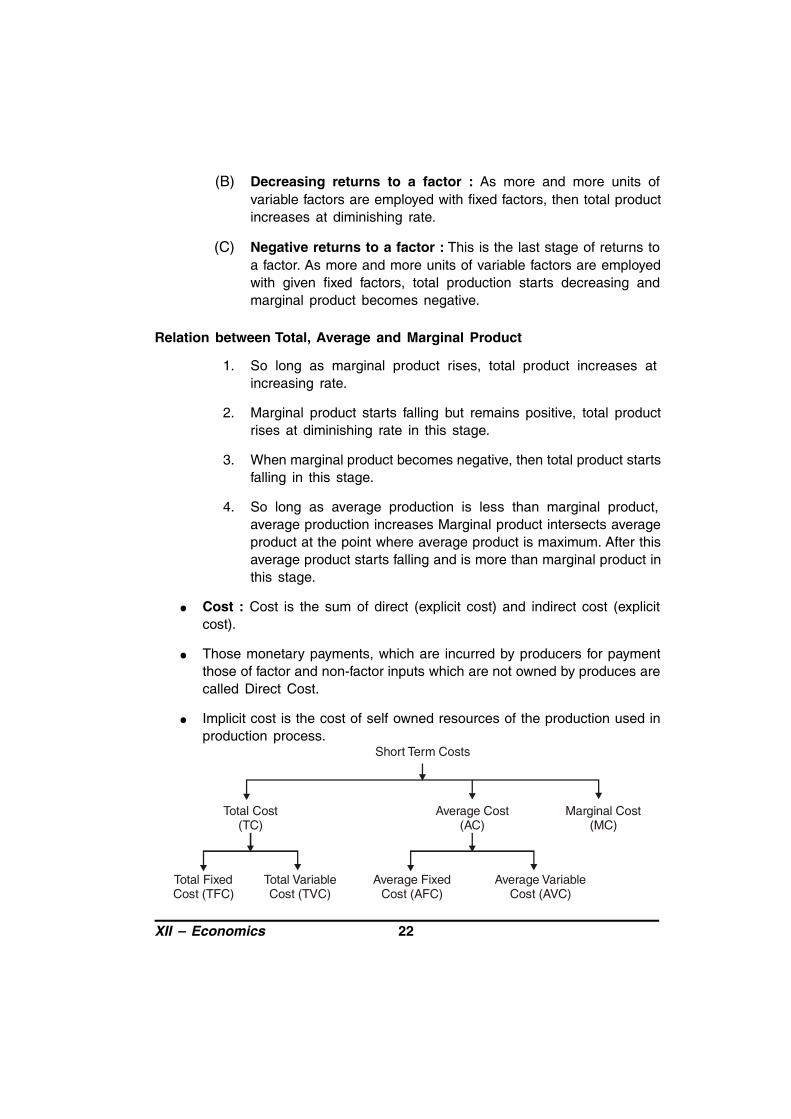
Returns to a factor : In a short period when additional units of variablefactors are employed with given fixed factors, then returns to a factoroperates. Returns to a factor shows the changes in total products, marginalproduct which arises due to change in ratio between fixed and variablefactor. They are as follows :
(A) Increasing returns to a factor : In the initial stage as more andmore units of variable factor are employed with fixed factor totalphysical production increases at increasing rate.
XII – Economics 22
(B) Decreasing returns to a factor : As more and more units ofvariable factors are employed with fixed factors, then total productincreases at diminishing rate.
(C) Negative returns to a factor : This is the last stage of returns toa factor. As more and more units of variable factors are employedwith given fixed factors, total production starts decreasing andmarginal product becomes negative.
Relation between Total, Average and Marginal Product
1. So long as marginal product rises, total product increases atincreasing rate.
2. Marginal product starts falling but remains positive, total productrises at diminishing rate in this stage.
3. When marginal product becomes negative, then total product startsfalling in this stage.
4. So long as average production is less than marginal product,average production increases Marginal product intersects averageproduct at the point where average product is maximum. After thisaverage product starts falling and is more than marginal product inthis stage.
Cost : Cost is the sum of direct (explicit cost) and indirect cost (explicitcost).
Those monetary payments, which are incurred by producers for paymentthose of factor and non-factor inputs which are not owned by produces arecalled Direct Cost.
Implicit cost is the cost of self owned resources of the production used inproduction process.
Short Term Costs
Total FixedCost (TFC)
Total VariableCost (TVC)
Total Cost(TC)
Average Cost(AC)
Marginal Cost(MC)
Average FixedCost (AFC)
Average VariableCost (AVC)
23 XII – Economics
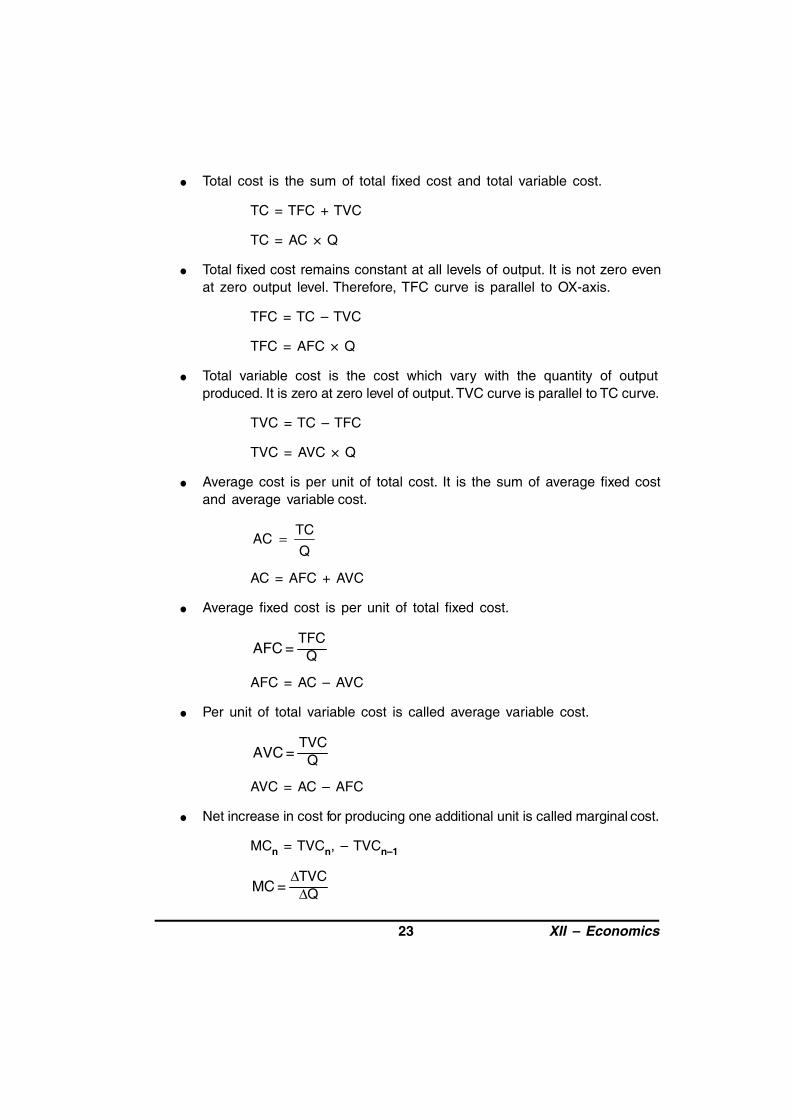
Total cost is the sum of total fixed cost and total variable cost.
TC = TFC + TVC
TC = AC × Q
Total fixed cost remains constant at all levels of output. It is not zero evenat zero output level. Therefore, TFC curve is parallel to OX-axis.
TFC = TC – TVC
TFC = AFC × Q
Total variable cost is the cost which vary with the quantity of outputproduced. It is zero at zero level of output. TVC curve is parallel to TC curve.
TVC = TC – TFC
TVC = AVC × Q
Average cost is per unit of total cost. It is the sum of average fixed costand average variable cost.
TCAC
Q
AC = AFC + AVC
Average fixed cost is per unit of total fixed cost.
TFCQAFC =
AFC = AC – AVC
Per unit of total variable cost is called average variable cost.
TVCQAVC =
AVC = AC – AFC
Net increase in cost for producing one additional unit is called marginal cost.
MCn = TVCn, – TVCn–1
TVCQMC =

XII – Economics 24
Relation Between Short-Term Costs
Total cost curve and total variable cost curve remains parallel to eachother. The vertical distance between these two curves is equal to totalfixed cost.
With increase in level of output, the vertical distance between AFC curveand AC curve goes on increasing. On contrary the vertical distance betweenAC curve and AVC curve goes on decreasing but these two curves neverintersect because average fixed cost is never zero.
Marginal cost curve intersects average cost curve and average variablecost curve at their minimum point. After the point of intersection withincrease in output, AC curve and AVC curve starts rising.
Average cost and average variable cost falls till they are more then marginalcost. When these two costs are less than marginal cost, in that situationboth (AC and AVC) rise.
Money received from the sale of product is called revenue.
Total revenue is the amount received from the sale of given units of acommodity over a particular period of time.
TR = AR × Q
MRTR =
Per unit revenue received from the sale of given units of a commodity iscalled average revenue. Average revenue is equal to price.
TR P Qor P Price.
Q QAR =
Marginal revenue is net addition to total revenue when one additional unitof output is sold.
TRQ
MR =
Behaviour of TR, AR and MR when per unit price remains constant orthere is perfect competition in the market.
(a) Average revenue and marginal revenue remains constant at alllevels of output and AR and MR curves are parallel to ox-axis.

25 XII – Economics
(b) Total revenue increases at constant rate and TR curve is positivelysloped straight line passing through the origin.
Behaviour of TR, AR and MR when price falls with additional unit of outputsold or there is monopoly or monopolistic competition in the market.
(a) Average revenue and marginal revenue curves have negative slope.MR curve lies below AR curve.
(b) Marginal revenue falls, twice the rate of average revenue.
(c) So long as marginal revenue is positive, total revenue increases.When marginal revenue is zero, total revenue is maximum andwhen marginal revenue becomes negative, TR starts falling.
Concept of Producer’s Equilibrium : If refers the stage where producergetting maximum profit.
(A) MR and MC Approach : Conditions of producers equilibrium according tothis approach are :
(a) Equality between MR and MC
(b) MC curve should cut the MR curve from below at the point ofequilibrium.
Or
MC should be more than MR after the equilibrium point, with increase inoutput.
Supply : Refers to the amount of the commodity that a firm or seller iswilling to offer or to sell in a given period of time at various prices.
Individual Supply : Refers to quantity of a commodity that an individualfirm is willing and able to offer for sale at each possible price during agiven period of time.
Stock : Refers to the total quantity of a particular commodity available withthe firm at a particular point of time.
Supply Schedule : Refers to a tabular presentation which shows variousquantities of a commodity that a producer is willing to supply at differentprices, during a given period of time.

XII – Economics 26
Supply curve : Refers to the graphical representation of supply schedulewhich represents various quantities of a commodity that a producer iswilling to supply at different during given period of time.
Law of Supply : States the direct relationship between price and quantitysupplied, keeping other factors constant.
Exceptions to Law of Supply
1. Future Expectation 2. Agricultural goods
3. Perishable goods 4. Rare goods
5. Backward countries.
Supply Function : Refers to functional relationship between supply anddeterminants of supply. Mathematically it can be expressed :
Sx = F(Px, T, Nf, Pf, Gp, Ex)
Price Elasticity of Supply : Refer to the degree of responsiveness ofsupply of a commodity with reference to a change in price of suchcommodity. It is always positive due to direct relationship between priceand quantity supplied.
Percentage change in quantity suppliedPrice Elasticity of Supply Es =
Percentage change in price
Methods for measuring price elasticity of supply :
1. Percentage Method 2. Geometric Method
Degrees of Elasticity of Supply : (a) If the tangent to the supply curvepasses through the point of origin, Es at that point is equal to unity.(b) If the tangent intersects the x-axis, Es at that point is less than unity(c) if tangent intersects the y-axis Es at that point will be greater thanunity.
27 XII – Economics
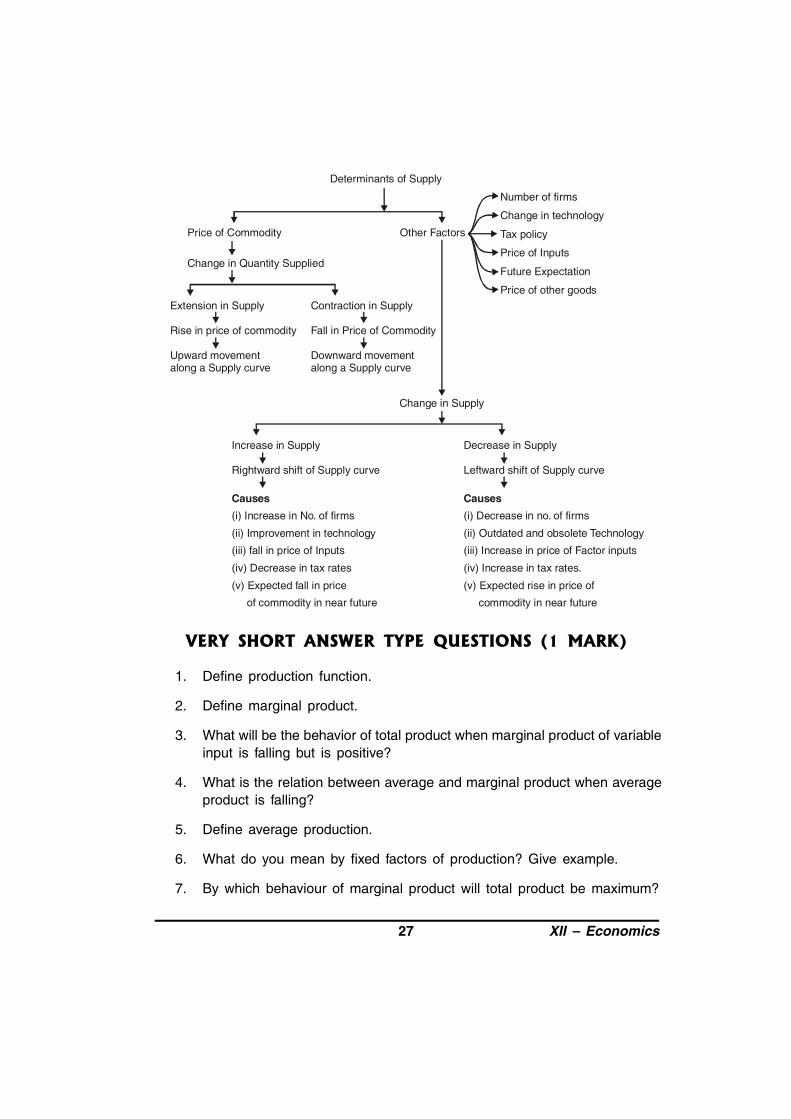
Extension in Supply
Rise in price of commodity
Upward movement along a Supply curve
Other Factors
Number of firms
Change in technology
Tax policy
Price of Inputs
Future Expectation
Price of other goodsContraction in Supply
Fall in Price of Commodity
Downward movement along a Supply curve
Price of Commodity
Change in Quantity Supplied
Change in Supply
Increase in Supply
Rightward shift of Supply curve
Causes(i) Increase in No. of firms
(ii) Improvement in technology
(iii) fall in price of Inputs
(iv) Decrease in tax rates
(v) Expected fall in price
of commodity in near future
Decrease in Supply
Leftward shift of Supply curve
Causes(i) Decrease in no. of firms
(ii) Outdated and obsolete Technology
(iii) Increase in price of Factor inputs
(iv) Increase in tax rates.
(v) Expected rise in price of
commodity in near future
Determinants of Supply
VERY SHORT ANSWER TYPE QUESTIONS (1 MARK)
1. Define production function.
2. Define marginal product.
3. What will be the behavior of total product when marginal product of variableinput is falling but is positive?
4. What is the relation between average and marginal product when averageproduct is falling?
5. Define average production.
6. What do you mean by fixed factors of production? Give example.
7. By which behaviour of marginal product will total product be maximum?

XII – Economics 28
8. How does fall in total product affects marginal product?
9. What do you mean by cost?
10. Define explicit costs.
11. Which cost curve is parallel to ox-axis? Why?
12. What do you mean by implicit costs?
13. Define marginal cost.
14. Why does the difference between average total cost and average variablecost falls with increase in output?
15. Define Revenue.
16. At what rate average and marginal revenue falls, with fall in per unit priceof a good?
17. What will be the behaviour of Average revenue when total revenue increasesat constant rate?
18. What do you mean by marginal revenue?
19. What will be the behaviour of total revenue when marginal revenue is zero?
20. Why does average cost curve and averages variable cost curve neverintersect each other?
21. What do you mean by producer’s equilibrium?
22. State any two conditions of producers equilibrium according to marginalrevenue and marginal cost approach.
23. What do you mean by normal profit?
24. What do you mean by break-even point?
25. Define supply.
26. What do you mean by individual supply schedule?
27. What is meant by market period?
28. What is supply function?
29. Name two determinants of supply.
29 XII – Economics
30. What is meant by change in supply?
31. What type of change in price is the cause of upward movement along asupply curve?
32. What effect does an increase is tax rates have on supply of a commodity?
33. What causes a downward movement along a supply curve?
34. What is meant by leftward shift of supply curve?
35. How does a decrease in price of input effect supply curve of the commodity?
36. Why does a supply curve have a positive slope?
37. What is meant by elasticity of supply?
38. What is the price elasticity of supply, if supply curve is parallel to y-axis.
39. When does the elasticity of supply of commodity called equal to unity?
40. When does the producer increase the supply of a good at given price, givetwo reasons.
41. What is meant by Law of Supply?
42. Write two exceptions of law of supply.
43. What causes an extension in supply?
44. If the price of a commodity falls by 10% and, consequently, the quantitysupplied decreases by 20%. What will be its price elasticity of supply?
H.O.T.S.
45. Why is total variable cost curve parallel to total cost curve?
46. Why does average fixed cost fall with increase in output?
47. Why is total fixed cost curve parallel to ox-axis.
48. Under which situation will MR fall when an additional quantity of a goodis sold?
49. What behaviour of per unit price will cause the equality of average andmarginal revenue.

XII – Economics 30
50. Give one differences between law of supply and price elasticity of supply.
51. What is the price elasticity of supply associated when the supply curvepassing through to intersect to x-axis?
52. Why does a producer moves downward along a supply curve due todecrease in price of commodity?
53. What is the price elasticity of supply associated with when a supply curvepasses through the origin at 40° angle?
54. When does the supply curve shift rightward while price remains constant.
55. What effect does an increase in price of competitive good have on thesupply of a commodity?
56. How does the imposition of a tax affect the supply curve of a firm?
SHORT ANSWER TYPE QUESTIONS (3-4 MARKS)
1. Why does the law of diminishing returns apply?
2. How does total product behave with change in marginal product?
3. Briefly explain the causes of increasing returns to a factor with the help ofmarginal product.
4. Distinguish between total fixed cost and total variable cost.
5. Explain with the help of a diagram the relationship between Average cost,Average variable cost and Marginal cost.
6. Why is short run average cost curve ‘U’ shaped?
7. Explain diagrammatically the relationship between Average cost, Averagevariable cost and Average fixed cost.
8. What changes will take place in total revenue when
(a) Marginal revenue is falling but is positive.
(b) Marginal revenue is zero.
(c) Marginal revenue is negative.
9. Define marginal revenue. Explain the relationship between average andmarginal revenue when price is constant at all levels of output.

31 XII – Economics
10. How does marginal revenue effect total revenue when price decreases toincrease sale.
11. What do you mean by producers equilibrium? State the conditions ofproducer’s equilibrium with Marginal Revenue and Marginal Cost Curves.
12. Explain producers equilibrium using marginal revenue and marginal costapproach.
13. Explain producer’s equilibrium with the help of a numerical example usingmarginal revenue and marginal cost approach.
14. Draw in a single diagram the average revenue and marginal revenue curvesof a firm which can sell any quantity of the good at a given price. Explain.
15. Complete the following table :
Output Total Cost Average Variable Cost Marginal Cost(Units) (Rs.) (Rs.) (Rs.)
1 90 – 30
2 – – –
3 – – –
4 180 30 –
16. Given below is the cost schedule of a firm. Its average fixed cost is Rs.20 when it produces 3 units.
Output (units) 1 2 3
Average variable cost (Rs.) 30 28 32
Calculate its marginal cost and average total cost at each given level ofoutput.
17. Complete the following table :
Output Average Variable Cost Total Cost Marginal Cost(Units) (Rs.) (Rs.) (Rs.)
1 18 60 202 – – –3 – – –4 20 120 –5 22 – –
XII – Economics 32
18. Define market supply. Explain its two determinants.
19. Distinguish between ‘Change in Supply’ and change in quantity supplied.
20. Explain briefly two causes of a rightward shift of supply curve.
21. Differentiate between contraction in supply and decrease in supply.
22. What is meant by elasticity of supply? What will be the price elasticityunder following conditions :
(a) Percentage change in quantity is greater than percentage changein price.
(b) Supply remain constant due to increase or decrease in price of thegood.
23. A seller of potatoes sells 80 quintals a day when the price of potatoes isRs. 4 per kg. The price elasticity of supply of potatoes is known to be 2.How much quantity of potatoes will the seller supply when the price risesto Rs. 5 per kg.
24. The coefficient of elasticity of supply of a commodity is 3. A seller supplies20 units of the commodity. How much quantity of this commodity will theseller supply. When price rises by Rs. 2 per unit?
25. The ratio of elasticity of supply of commodities A and B is 1 : 1.5. 20percent fall in price of A results in a 40 percent fall in its supply. Calculatethe percentage increase in supply of B if its price rises from Rs. 10 perunit to Rs. 11 per unit.
H.O.T.S.
1. State the causes by which marginal product of a variable factor changefrom increasing return to diminishing return.
2. What would be the shape of average revenue curve when total revenue ispositively stopped straight line passing through origin. Explain with thehelp of schedule and diagram.
3. What is a supply schedule? Explain how does change in technology ofproducing a good affect the supply of that good.
4. Following statements are true or false. Give reasons :
(a) At the stage of producer’s equilibrium, marginal cost will bedecreasing.

33 XII – Economics
(b) AR curve always remain above MR curve.
5. Whether following statements are true or false. Give reasons.
(a) Marginal revenue falls twice the rate at which average revenuefalls.
(b) Average cost starts increasing when rising portion of marginal costintersects.
6. Following statements are true or false. Give reasons :
(a) Diminishing returns to a factor is applicable only when averageproduct starts falling.
(b) AC and AVC curves do not intersect each other
7. Distinguish between leftward shift to supply curve and downward movementalong a supply curve.
8. “The change in quantity supplied is explanation of law of supply”. Explain.
9. Either following statements are true or false. Give reasons.
(a) Supply remains constant in market period.
(b) Future expectation to increase in price increases the market supplyof a commodity.
10. Explain the geometric method of measuring price elasticity of supply withthe help of diagram.
LONG ANSWER TYPE QUESTIONS (6 MARKS)
1. Explain diagrammatically the effect on total output when units of one factoris increased and all other inputs are held constant.
2. Complete the following table
Output Total Cost Average Fired Average Variable Marginal(Units) (Rs.) Cost Cost Cost
0 361 – – – 182 – – – 143 – – 16 –4 – – – 24

XII – Economics 34
3. What is producer’s equilibrium? Explain the conditions of producer’sequilibrium through the ‘marginal cost and marginal revenue’ approach.Use diagram.
4. State whether true or false. Give reasons.
(a) Total product is the area under the marginal product curve.
(b) When marginal product falls, average product always falls.
(c) For the first unit of output MC = AVC.
5. State whether True or False. Give reasons.
(a) When marginal revenue is constant and not equal to zero, thentotal revenue will also be constant.
(b) As soon as marginal cost rises, average variable cost also startsrising.
(c) Total product always increases whether there is increasing returnsor Diminishing return to a factor.
6. State whether the following statements are true or false. Give reasons foryour answer.
(a) When total revenue is constant average revenue will also beconstant.
(b) Average variable cost can fall even when marginal cost is rising.
(c) When marginal product falls, average product will also fall.
1 MARK QUESTIONS
1. Production function shows the functional relationship between physicalinput and output.
2. Marginal product is net addition to total product when one additional unitof variable factor is used.
3. Total product increases at diminishing rate.
4. MP falls but it falls at faster rate than AP

35 XII – Economics
5. AP is a per unit output of a variable factor.
6. These factors of production which cannot be varied in short period e.g.machine, land.
7. When marginal product of a factor is zero, then total product will bemaximum.
8. When total product falls, marginal product becomes negative.
9. Cost is the sum of explicit and implicit cost.
10. Those monetary payments by producer on factor and non factor paymentsis called explicit cost. Which are not owned by himself.
11. Total fixed cost because TFC remain constant at all level of output.
12. Implicit cost is the cost of self owned resources of producer.
13. Marginal cost is the net addition to total cost when one additional unit ofoutput is produced.
14. It is because average fixed cost goes on falling with increase in output.
15. Revenue is the amount received from sale of output.
16. Marginal revenue falls twice the rate of average revenue.
17. Average revenue remains constant.
18. Marginal revenue is net additions to total revenue by sale of one additionalunit of output.
19. Total revenue will be maximum.
20. Because AFC can never be zero at any level of output.
21. Producer’s equilibrium is a situation where he gets maximum profit.
22. 1. MR = MC
2. Rising portion of Marginal cost curve intersects marginal revenuecurve.
23. Normal profit is a situation where total cost of a firm is equal to totalrevenue.

XII – Economics 36
24. At the point where TR = TC.
25. Supply refers to the amount of the commodity that a firm or seller is willingto offer for sale in a given period of time at various prices.
26. Individual supply schedule is a tabular representation showing variousquantities of a commodity which a firm is ready to sell at different pricesduring a given period of time.
27. A very short period in which no adjustment can take place in supply inresponse to a change in demand/price.
28. Supply function state the functional relation between supply of a commodityand determinants of supply.
29. 1. Number of firms
2. Change in technology
30. Change in supply refers to increase or decrease in supply of a commoditydue to change in factors other than price like technology, price of inputs,Goal of producer, Number of firms etc.
31. Due to increase in price.
32. As a result of increase in tax rates production cost increase, so the profitmargin of producer will fall and producer will decrease the supply.
33. Decrease in price.
34. Due to change in other factors the supply of a commodity falls at sameprice than supply curve shifted to leftward.
35. As a result of decrease in price of input producer cost falls than producersprofit margin will increase so producer will increase the supply of commodity.
36. Because of positive relation between price and supply.
37. Price Elasticity of Supply (Es) is a measure of degree of response ofsupply for a good to change in its price.
38. Perfectly elastic.
39. When percentage change in price is equal to percentage change in supply.
37 XII – Economics
40. Due to change in other factor like improvement in technology, decrease inprice of inputs.
41. Law of supply states that other things remaining constant, quantity suppliedof a commodity increases with increase in the price and decreases witha fall in its price.
42. (i) Score goods
(ii) Market period
43. Increase in price of a commodity.
44.% change in quantity 20%
Es 2% change in price 10%
H.O.T.S.
45. Total cost is the sum of total fixed cost and total variable cost. TFC remainsconstant at all levels of output.
46. AFC can be calculated from TFC. Which remains constant at all level ofoutput.
47. TFC remains constant at all levels of output.
48. When per unit price falls by selling an additional unit of a good.
49. Per unit price remains constant.
50. Law of supply reflects the direction of change in supply where as priceelasticity of supply measures the magnitude of change in supply.
51. Inelastic.
52. Because profit margin of firm (producer) decreases.
53. Equal to unity elastic.
54. When the supply of commodity increases due to change in other factors.
55. Supply of the commodity will fall.
56. The supply curve will shift to the left side.
XII – Economics 38
UNIT 4
FORMS OF MARKET & PRICE DETERMINATION
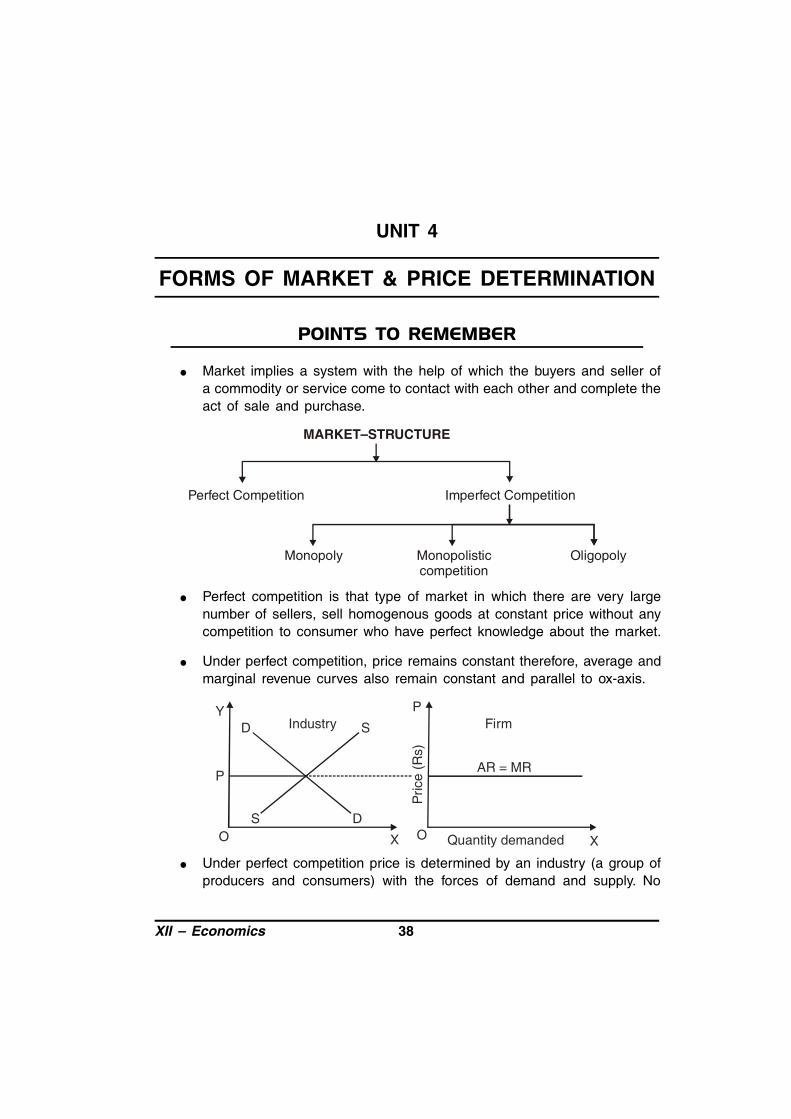
Market implies a system with the help of which the buyers and seller ofa commodity or service come to contact with each other and complete theact of sale and purchase.
MARKET–STRUCTURE
Monopoly Monopolistic competition
Perfect Competition Imperfect Competition
Oligopoly
Perfect competition is that type of market in which there are very largenumber of sellers, sell homogenous goods at constant price without anycompetition to consumer who have perfect knowledge about the market.
Under perfect competition, price remains constant therefore, average andmarginal revenue curves also remain constant and parallel to ox-axis.
Pric
e (R
s)
Quantity demanded
P
O X
AR = MR
D S
DS
Y
P
O X
Industry Firm
Under perfect competition price is determined by an industry (a group ofproducers and consumers) with the forces of demand and supply. No

39 XII – Economics
individual firm or buyer can influence the price or supply of the product. Soindustry is price maker and firm is price taker.
MONOPOLY MARKET
Monopoly is that type of market where there is a single seller, selling aproduct which does not have close substitutes.
Under monopoly, due to absence of free entry and exit, firm earn abnormalprofit in the long run.
Under monopoly, monopolist himself determines price of the productaccording to the elasticity of demand as he has full control over the supplyof the product.
Under monopoly elasticity of demand for the good is less than one, therefore,demand curve has steeper slope. (Ed < 1).
Under monopoly, average revenue and marginal revenue has negativeslope, as per unit price falls with increase in output sold.
MONOPOLISTIC COMPETITION
Monopolistic competition is that type of market in which there are largenumber of firms, sell differentiated product to the consumers who haveimperfect knowledge about the product and there is tough competitionbetween firms.
Under monopolistic competition due to lack of control over supply eachfirm determines the price of their product, keeping in view the price levelset by other firms.
Under monopolistic competition elasticity of demand for the product isgreater than one therefore demand curve (AR curve) has flatter slope.
OLIGOPOLY
Oligopoly is the form of market in which there are few sellers. All the firmsproduce a certain amount of output of total market supply.
All the firms under oligopoly produce homogenous or differentiated product.
Under oligopoly entry of firms is not restricted but difficult.

XII – Economics 40
Under oligopoly demand curve is undefined.
All the firms are interdependent in respect of price determination underoligopoly market.
On the basis of production, oligopoly can be categorised in two categories.
(i) Collusive oligopoly is that form of oligopoly in which all the firmsdetermine price and quantity of output on the basis of cooperativebehaviour.
(ii) Non-collusive oligopoly is that form of oligopoly is which all thefirms determine the price and quantity of output according to theaction and reaction of the firms.
FORMS OF MARKET STRUCTURE
Perfect Competition Monopolistic Competition
Very large No. of buyers and sellers
Homogeneous product
Free entry and exit of firm
Perfect knowledge
Perfect mobility
AR (demand) curve parallel to X-axis
No control over price
Absence of selling and advertisement cost
Single firm (seller
No substitute Product
Restriction on entry of firm
Price discrimination
AR curve down-ward sloping
Great controlover price (e.g.Posts and Telegraphs)
Large No. of firms
Differentiatedproduct
Free entry and exit
Selling cost
AR curve down-ward sloping
Cut throat competition
A few firm
Homogeneous and differentiated products
Difficult entry of new firms
Selling costs
Demand curve undefined
Price rigidity
Indeterminate demand curve (e.g. firms mfg. cars, steel, cement, etc.)
Monopoly Oligopoly
Imperfect Competition(Non-competitive Markets)

41 XII – Economics
VERY SHORT ANSWER TYPE QUESTIONS (1 MARK)
1. Define market.
2. What do you mean by homogenous product?
3. How is price determined under perfect competition?
4. What is the common feature shared by perfect and monopolisticcompetition?
5. If the firms are earning abnormal profits, how will the number of firms inthe industry change?
6. Define the monopoly market.
7. Under which market there is no difference between firm and industry?
8. What is normal profit?
9. Under which form of market the firm is price taker.
10. What is cartel?
11. What is the relationship between AR curve and demand curve in a monopolymarket?
12. What do you mean by price discrimination?
13. Define oligopoly.
14. Define equilibrium price.
15. When does the situation of excess supply arise?
16. What will be the effect on equilibrium price when increase in demand ismore than increase in supply?
17. Under what situation does the equilibrium price remains unaffected whenthere is simultaneous increase in demand and supply.
H.O.T.S.
18. What is the relation between average revenue curve and demand curveunder monopolistic competition?

XII – Economics 42
SHORT ANSWER TYPE QUESTIONS (3-4 MARKS)
1. Why is firm under perfect competition a price taker and under monopolisticcompetition is price maker. Explain?
2. How is the demand curve under monopolistic competition different fromdemand curve of a firm under perfect competition?
3. Why is a firm under perfect competition a price taker? Explain.
4. Explain three features of perfect competition.
5. Explain the implication of large number of seller feature of perfectcompetition.
6. What will happen if the price prevailing in the market is above the equilibriumprice.
7. Distinguish between monopoly and oligopoly.
8. Explain the concept of excess demand with the help of diagram.
9. Differentiate between ‘Collusive and non-collusive oligopoly.
10. Explain the determination of equilibrium price under perfect competitionwith the help of schedule.
H.O.T.S.
11. MR = AR in perfect competition but MR < AR in monopoly and monopolisticcompetition why?
12. In which condition decrease in demand can not change the price ofcommodity?
14. Why there are entry barriers in oligopoly?
15. In which competition the availability of close substitutes is present? Howdoes it effect the price?
LONG ANSWER TYPE QUESTIONS (6 MARKS)
1. Explain the characteristics of monopolistic competition.

43 XII – Economics
2. Explain the following features of perfect competition.
(i) Large number of firms or Sellers and Buyers
(ii) Homogeneous Product.
3. Explain features of Oligopoly.
4. Explain equilibrium price. How is it determined? Explain with the help ofschedule.
5. Explain how change in price of a substitute commodity would affect marketequilibrium of the commodity X.
6. Market for a good is in equilibrium. There is ‘increase’ in supply of thatgood. Explain the chain of effects of this change. Use a numerical example.
Distinguish between ‘non-collusive’ and ‘collusive’ oligopoly. Explain thefollowing features of oligopoly:
(i) Few firms (ii) Non-price competition
7. With the help of a diagram explain the effect of “decrease” in demand ofa commodity on its equilibrium price and quantity.
8. There is simultaneous decrease in demand and supply of a commodity,when it result in
(i) no change in equilibrium price
(ii) a fall in equilibrium price.
1 MARK QUESTIONS
1. Market is a system with the help of it the buyers and seller of a commodityor service come to contact with each other.
2. It means product produced by different firms is identical in all respect likequality, colour, size, weight etc. such products are perfect substitutes.
3. Price is determined by an industry by the forces of demand andsupply.
XII – Economics 44
4. (i) Free entry and exit of firms
(ii) Perfect mobility of factors.
5. The number of firms in the industry will increase.
6. It is a form of market under which there is a single seller, selling a productwhich does not have close substitutes.
7. Monopoly.
8. It is the minimum profit which a firm must get to stay in business.
9. Perfect competition.
10. A cartel is a group of firms which jointly set ‘output and price’ policy of itsproduct in such a way so as to reap benefits of monopoly.
11. Both AR curve and demand curve are the same in a monopoly market.
12. Price discrimination is a policy under which a seller sells a similar productat different prices to different buyers.
13. Oligopoly is a market structure where there are few firms competing fortheir homogenous or differentiated products.
14. It is the price at which demand = supply.
15. When market price is more than equilibrium price and market supply ismore than market demand.
16. When increase in demand is more than increase in supply, equilibriumprice will increase.
17. When increase demand is equal to increase in supply the equilibrium pricewill remain same.
H.O.T.S.
18. Both AR and MR curves have negative slope.
45 XII – Economics
3-4 MARKS QUESTIONS
11. Profit maximising condition for perfect competition P = MR = MC.
Monopoly MR = MC
Monopoly competition P > MR = MC
14. In oligopoly there are some few big firms controlling the market by mutualunderstanding and they try that no other firm can enter the market.
6 MARKS QUESTIONS
4. (i) Due to increase in supply equilibrium price will low and due todecrease in supply equilibrium price will high if demand is perfectlyelastic.
(ii) equilibrium price will remain same.
6. Increase in the price of the substitute commodity (y) would cause increasein demand for X, implying a forward shift in demand curve for X conversely,decrease in the price of y would cause backward shift in demand curvefor X.
7. Increase in demand and decrease in supply, equilibrium price will rise andif decrease in demand and increase in supply equilibrium price will low.

XII – Economics 46
UNIT 5
SIMPLE APPLICATION OF TOOLS OFDEMAND AND SUPPLY CURVE
With the help of curves, these variables can be studied, which representpositive or negative relation.
Variables are of two types (i) dependent variables (ii) independent variables.
Generally independent variables are represented on OY-axis, where asdependent variables are represented on OX-axis.
While plotting curves, value on OX-axis or OY-axis should be according toreasonable proportion.
Relationship between variables can be understood easily through curvesbecause their effect is long lasting on our minds.
In Economics demand and supply curves are used to express following :
1. Data relating to demand and supply.
2. To determine equilibrium in various economic activities.
3. To show the effect of change in demand and supply on equilibriumand market price.
4. For graphic representation of different categories of elasticity ofdemand and supply.
5. Determination of floor price and price ceiling in situation of excessdemand and excess supply.
Govt. determines maximum and minimum price ceiling with the help ofdemand and supply.
Govt. determines tax rate in accordance with elasticity of demand andsupply.

47 XII – Economics
Demand and supply curve explain equilibrium under following situations :
1. Rate of interest (Demand for money and supply for money)
2. Wage rate
3. Price determination of factors of production.
4. Determination of foreign exchange rate.
5. Determination of tax.
6. Saving of consumer.

XII – Economics 48
UNIT 6
NATIONAL INCOME
Good : In economics a good is defined as any physical object, natural orman-made, that could command a price in the market.
Consumption Goods : Those goods which satisfy human wants directly.
Capital Goods : Those final goods which help in production. These goodsare used for generating income.
Final Goods are those goods which are used either for final consumptionor for investment.
Intermediate Goods refers to those goods and services which are usedfor further production or for resale. These goods do not fulfil needs ofmankind directly.
Investment : Addition made to the stock of capital during a period is calledinvestment. It is also called capital formation.
Depreciation : is expected fall in value of fixed capital goods due tonormal wear and tear and obsolescence.
Gross Investment : Total addition of capital goods to the existing stock ofcapital during a time period at market price.
Net Investment : is a measure of net availability of new capital or newaddition to capital stock in an economy.
Net Investment = Gross investment – Depreciation.
Stocks : Variables whose magnitude is measured at a particular point oftime are called stock variables.
Flows : Variables whose magnitude is measured over a period of time arecalled flow variable.

49 XII – Economics
Economic Territory : Economic (or domestic) Territory is the geographicalterritory administrated by a Government within which persons, goods, andcapital circulate freely.
Scope of Economic Territory :
(a) Political frontiers including territorial waters and airspace.
(b) Embassies, consulates, military bases etc. located abroad.
(c) Ships and aircraft operated by the residents between two or morecountries.
(d) Fishing vessels, oil and natural gas rigs operated by residents in theinternational waters.
• Normal Resident of a country : is a person or an institution who ordinarilyresides in a country and whose centre of economic interest lies in thatcountry.
NATIONAL INCOME AGGREGATES
Domestic Aggregates
• Gross domestic Product at Market Price (GDPMP) is the market valueof all the final goods and services produced by all producing units locatedin the domestic territory of a country during a financial year.
• Net Domestic Product at Market Price (NDPMP) : NDPMP = GDPMP –Depreciation (consumption of Fixed capital)
• Domestic Income : (NDPFC) : It is the factor income accruing to ownersof factors of production for suppling factor services with in domestic territoryduring an accounting year.
NATIONAL AGGREGATES
• Gross National Product at Market Price (GNPMP) is the market value ofall the final goods and services produced by all producing units (in thedomestic territory and abroad) of a country during a financial year.GDPMP + NFIA = GNPMP
XII – Economics 50
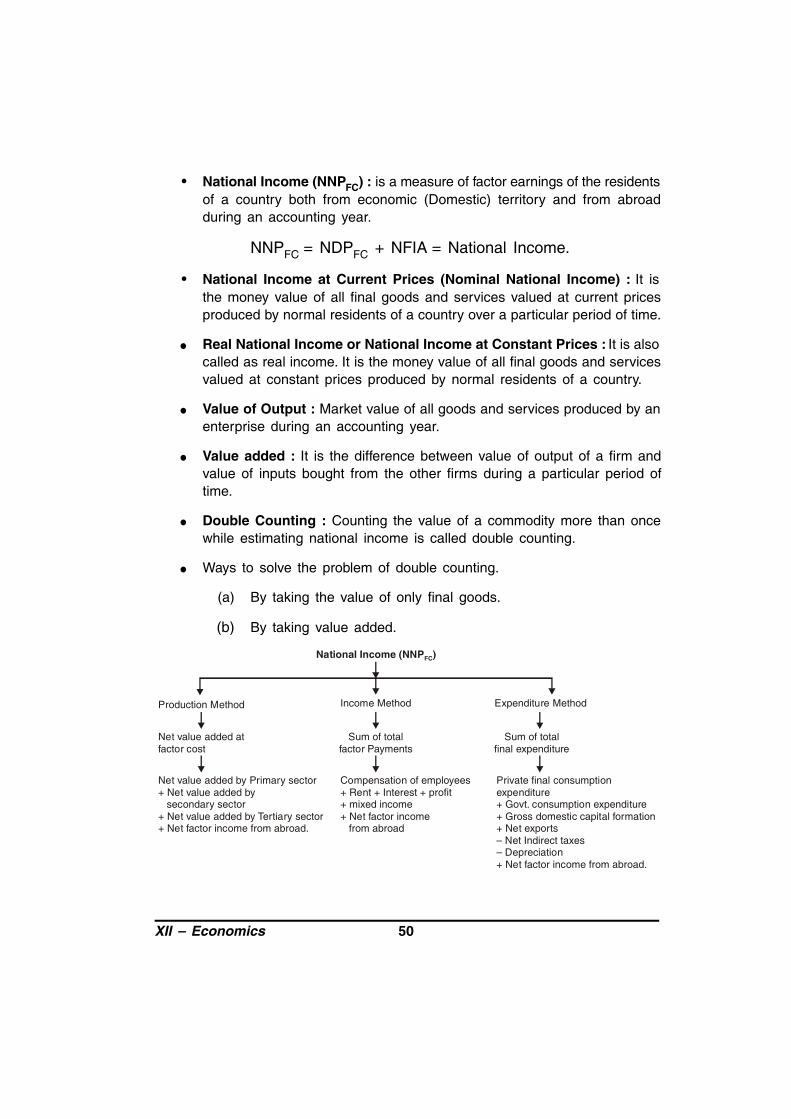
• National Income (NNPFC) : is a measure of factor earnings of the residentsof a country both from economic (Domestic) territory and from abroadduring an accounting year.
NNPFC = NDPFC + NFIA = National Income.
• National Income at Current Prices (Nominal National Income) : It isthe money value of all final goods and services valued at current pricesproduced by normal residents of a country over a particular period of time.
Real National Income or National Income at Constant Prices : It is alsocalled as real income. It is the money value of all final goods and servicesvalued at constant prices produced by normal residents of a country.
Value of Output : Market value of all goods and services produced by anenterprise during an accounting year.
Value added : It is the difference between value of output of a firm andvalue of inputs bought from the other firms during a particular period oftime.
Double Counting : Counting the value of a commodity more than oncewhile estimating national income is called double counting.
Ways to solve the problem of double counting.
(a) By taking the value of only final goods.
(b) By taking value added.
National Income (NNP )FC
Production Method Income Method Expenditure Method
Net value added at factor cost
Net value added by Primary sector+ Net value added by secondary sector+ Net value added by Tertiary sector+ Net factor income from abroad.
Sum of total factor Payments
Compensation of employees+ Rent + Interest + profit+ mixed income+ Net factor income from abroad
Sum of total final expenditure
Private final consumption expenditure+ Govt. consumption expenditure+ Gross domestic capital formation+ Net exports– Net Indirect taxes– Depreciation+ Net factor income from abroad.

51 XII – Economics
National Disposable Income (NDI) : It is defined as net national productat Market price (NNPMP) plus net current transfer from rest of the world.
NDI = NNPMP + Net current transfers from rest of the world.
OR
= National income + net indirect tax + net current transfers from the restof the world.
Gross National Disposable Income (Gross NDI)
= GNPMP + Net current Transfers from rest of the world.
Net National Disposable Income (Net NDI)
= NNPMP + Net current Transfers from rest of the world.
OR
= Gross NDI – Depreciation.
Concept of Value Added of One Sector or One Firm
1. Value output = Sales + Net Stock.
2. Gross Value added at market prices (GVAMP) = Value of output –Intermediate consumption
3. Net value added at market price (NVAMP) = GVAMP – Depreciation.
4. Net value added at factor cost (NVAFC) = NVAMP – Net indirect tax.
Note: By adding up NVAFC of all the sectors, we get NDPFC or Domestic Income.
Final Consumption Expenditure
Gross Domestic Capital formation
Net exports of goods
and services
Private final Consumption expenditure
+Govt. final
consumptionexpenditure
Gross Domestic fixedcapital formation
+Change in
stocks
Exports(–)
Imports
(Closing stock–Opening stock)
XII – Economics 52
Compensation of Employees
Rent+
Interest+
Profit
Mixed Income of
Self employed
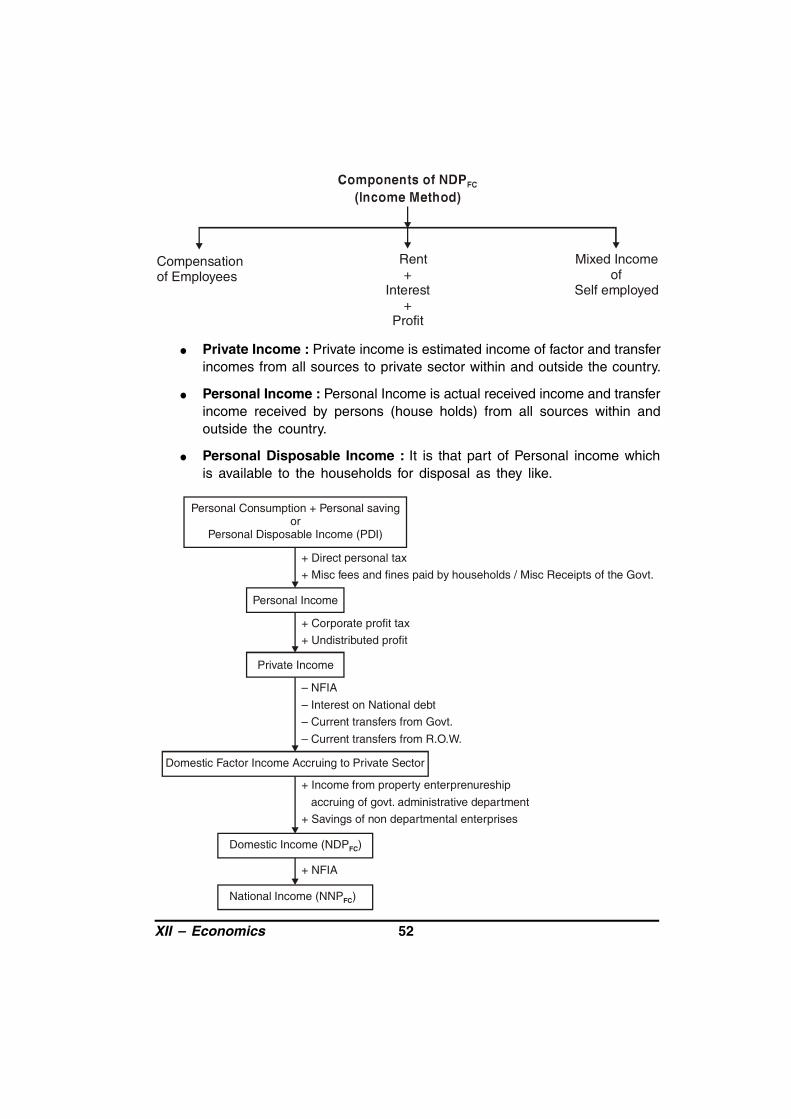
Private Income : Private income is estimated income of factor and transferincomes from all sources to private sector within and outside the country.
Personal Income : Personal Income is actual received income and transferincome received by persons (house holds) from all sources within andoutside the country.
Personal Disposable Income : It is that part of Personal income whichis available to the households for disposal as they like.
Domestic Income (NDP )FC
+ NFIA
National Income (NNP )FC
+ Income from property enterprenureship accruing of govt. administrative department+ Savings of non departmental enterprises
Domestic Factor Income Accruing to Private Sector
– NFIA– Interest on National debt– Current transfers from Govt.– Current transfers from R.O.W.
Private Income
+ Corporate profit tax+ Undistributed profit
Personal Income
Personal Consumption + Personal savingor
Personal Disposable Income (PDI)
+ Direct personal tax+ Misc fees and fines paid by households / Misc Receipts of the Govt.
53 XII – Economics
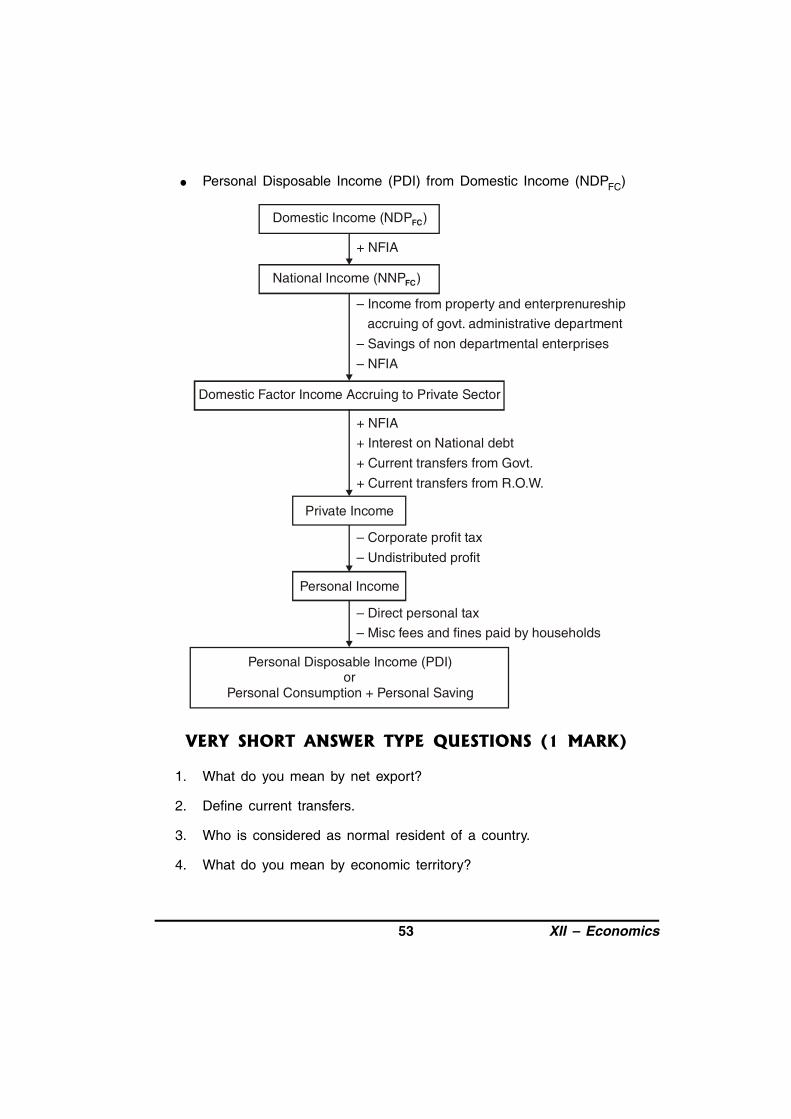
Personal Disposable Income (PDI) from Domestic Income (NDPFC)
Domestic Income (NDP )FC
+ NFIA
National Income (NNP )FC
– Income from property and enterprenureship accruing of govt. administrative department– Savings of non departmental enterprises– NFIA
Domestic Factor Income Accruing to Private Sector
+ NFIA+ Interest on National debt+ Current transfers from Govt.+ Current transfers from R.O.W.
Private Income
– Corporate profit tax– Undistributed profit
Personal Income
– Direct personal tax– Misc fees and fines paid by households
Personal Disposable Income (PDI)or
Personal Consumption + Personal Saving
VERY SHORT ANSWER TYPE QUESTIONS (1 MARK)
1. What do you mean by net export?
2. Define current transfers.
3. Who is considered as normal resident of a country.
4. What do you mean by economic territory?

XII – Economics 54
5. When will be NDPMP be less than NDPFC?
6. State the meaning of consumption of fixed capital?
7. State the meaning of injection in income flow, with the help of an example.
8. What do you mean by leakage in income flow?
9. State whether the following are stock or flow :
(i) Losses (ii) Capital
(iii) Production (iv) Wealth
10. Define ‘Nominal GNP’
11. What do you mean by ‘Real GNP’?
H.O.T.S.
12. Which of the two NVAFC and NVAMP is equal to sum of factor income.
13. Why is money received from sale of shares is not included in domesticfactor income.
14. What aggregate do we get, when we add up the net value added of allproducing sectors of an economy?
15. How value added method solve the problem of double counting?
16. What is per capita real GDP.
17. Complete the following aggregates.
(i) National Income = Domestic income .......................
(ii) Personal Income = Private income .......................
(iii) Net value added at FC = Gross output .......................
SHORT ANSWER TYPE QUESTIONS (3 MARKS)
1. Distinguish between real and nominal gross domestic product.
2. Explain the basis of classifying goods into intermediate and final goods.Give suitable examples.

55 XII – Economics
3. Distinguish between consumer goods and capital goods. Which of theseare final goods?
4. Explain how distribution of G.D.P. is its limitation as a measure of economicwelfare.
5. Explain the meaning of “Domestic Territory of a country”.
6. Distinguish between ‘factor income’ and ‘transfer income’.
7. Classify the following into stock and flow :
(i) Population of India (ii) Exports
(iii) Investment (iv) Expenditure on food by household.
(v) National Capital (vi) Deposits in saving account of bank.
8. Explain how distribution of Gross domestic product is a limitation in takingdomestic product as an Index of welfare.
9. How can externalities be a limitation of using gross domestic product asan index of welfare.
10. Giving reasons, classify the following into intermediate and final goods :
(i) Machines purchased by a dealer of machines.
(ii) A car purchased by a house hold.
11. Distinguish between stock and flows. Give an example of each.
12. What is meant by a normal resident? State which of the followings aretreated as normal resident of India.
(i) An American working in the office of WHO located in India.
(ii) Indian working in U.S.A. embassy located in India.
13. Which of the following is factor income from abroad for an Indian residentand why?
(a) Interest income received by Indian resident on the bonds ofcompanies operating in USA.
(b) Remittances by Indians settled abroad to their families in India.

XII – Economics 56
H.O.T.S.
14. Explain why subsidies are added to and indirect taxes deducted fromdomestic product at market price to arrive at domestic product at factorcost.
15. Giving reasons, explain how are the following treated in estimating nationalIncome by the income method.
(a) Interest on a car loan paid by an individual
(b) Interest on a car loan paid by a Govt. owned company.
16. Why do we include the imputed value of goods but not services whileestimating production for self consumption?
17. Define operating surplus, write its components.
18. Distinguish between domestic product and national product. When candomestic product be more than National Product.
LONG ANSWER QUESTIONS (6 MARKS)
1. How will you treat the following while estimating national income of India.
(a) Dividend received by an Indian from his investment in shares of aforeign company.
(b) Money received by a family in India from relatives working abroad.
(c) Interest received on loan given to a friend for purchasing a car.
2. How will you treat the following while estimating national income of India?Give reason for your answer?
(a) Dividend received by a foreigner from investment in shares of anIndian Company.
(b) Money received by a family in India from relatives working abroad.
(c) Interest received on loan given to a Friend for purchasing a car.
3. Explain the problem of double counting in estimating national income, withthe help of an example. Also explain two alternative ways of avoiding theproblem.

57 XII – Economics
4. Distinguish between real gross domestic product and nominal grossdomestic product. Can gross domestic product be used as an index ofwelfare of the people? Give two reasons.
5. How will you treat the following in estimating national income of India?Give reasons for your answer.
(a) Value of bonus shares received by share holders of a company.
(b) Fees received from students.
(c) Interest received on loan given to a foreign company in India.
6. Explain the steps of measuring national income by income method.
7. Explain value added method of estimating National Income with the helpof suitable example.
8. Giving reasons, categories following into transfer payment or factorpayments.
(a) financial help gives to flood victims
(b) Old age pension.
(c) Imputed rent.
9. Calculate private income :
Rs. (Crore)
(i) National interest 10
(ii) Personal disposable income 150
(iii) Corporate Profit Tax 25
(iv) Personal Taxes 50
(v) Retained earnings of private corporations 05
[Ans. : Rs. 230 crores]
10. Giving reasons explain whether the following are included in domesticproduct of India.
(i) Profit earned by a branch of foreign bank in India.
(ii) Payment of salaries to its staff by an embassy located in NewDelhi.

XII – Economics 58
(iii) Interest received by an Indian resident from firms abroad.
11. How will you treat the following while estimating national income. Givereasons for your answer.
(i) Capital gain on sale of house.
(ii) Prize won is lottery.
(iii) Interest on public debt.
12. While estimating national income. How will you treat the following. Givereason for your answer.
(i) Imputed rent of occupied house.
(ii) Interest received on debentures.
(iii) Financial help received by Flood victims.
1. Calculate (i) gross domestic product at factor cost and (ii) net nationaldisposable income : 6
Rs. (in Crores)
(i) Net indirect tax 130
(ii) Government final consumption expenditure 100
(iii) Profit 90
(iv) Net domestic capital formation 120
(v) Change in stocks (–) 10
(vi) Private final consumption expenditure 500
(vii) Net imports 20
(viii) Net current transfers to abroad 10
(ix) Net factor income to abroad 30
(x) Gross domestic capital formation 160
2. From the following data calculate GNP at FC by (a) Income method(b) Expenditure method.

59 XII – Economics
Rs. (Crore)
(i) Net domestic capital formation 500
(ii) Compensation of employees 1850
(iii) Consumption of fixed capital 100
(iv) Govt. final consumption expenditure 1100
(v) PVT. final consumption expenditure 2600
(vi) Rent 400
(vii) Dividend 200
(viii) Interest 500
(ix) Net Exports (—) 100
(x) Profits 1100
(xi) NFIA (–) 50
(xi) Net Indirect taxes 250
[Ans. : Rs. 3900 Crore]
3. There are only two producing sectors A and B in an economy. Calculate:
(a) Gross value added at market price by each sector
(b) National income.
Rs. (Crore)
(i) Net factor income from Abroad. 20
(ii) Sales by A 1000
(iii) Sales by B 2000
(iv) Change in stock of B (–) 200
(v) Closing stock of A 50
(vi) Opening stock of A 100
(vii) Consumption of fixed capital by A and B 180
(viii) Indirect taxes paid by A and B 120
(ix) Purchase of raw material by A 500
(x) Purchase of raw material by B 600
(xi) Exports by B 70
[Ans. : Rs. 1370 Crore]
XII – Economics 60
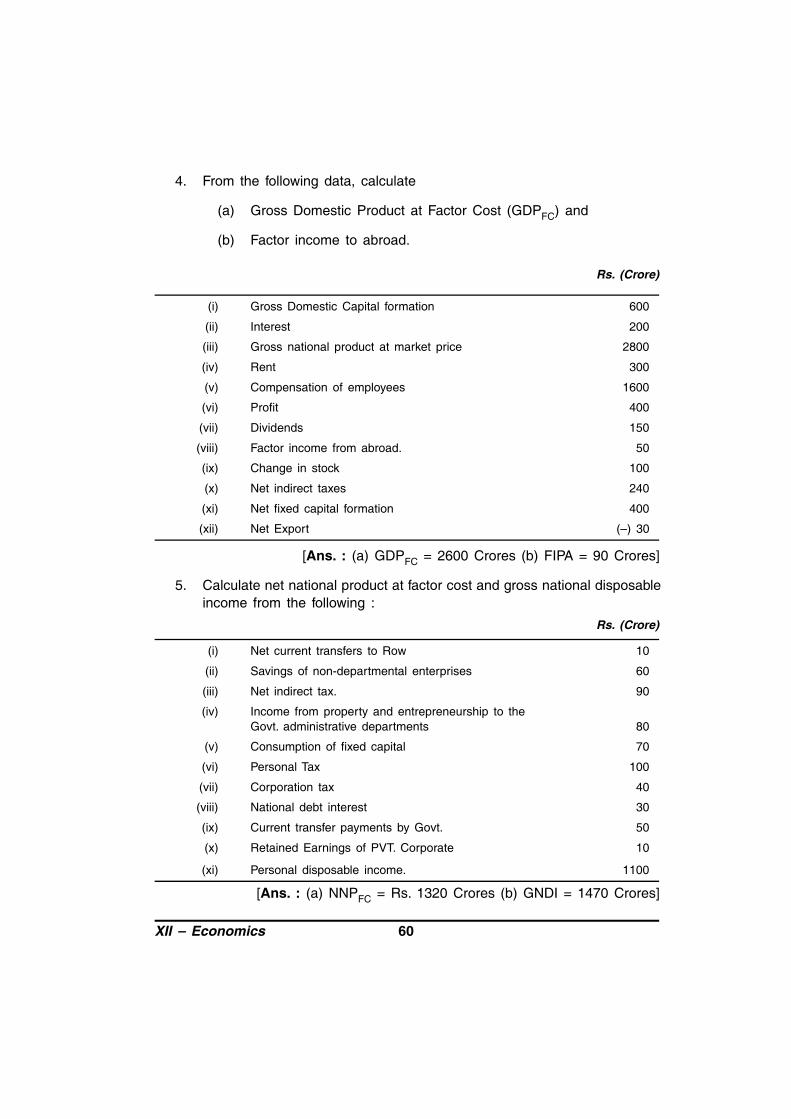
4. From the following data, calculate
(a) Gross Domestic Product at Factor Cost (GDPFC) and
(b) Factor income to abroad.
Rs. (Crore)
(i) Gross Domestic Capital formation 600
(ii) Interest 200
(iii) Gross national product at market price 2800
(iv) Rent 300
(v) Compensation of employees 1600
(vi) Profit 400
(vii) Dividends 150
(viii) Factor income from abroad. 50
(ix) Change in stock 100
(x) Net indirect taxes 240
(xi) Net fixed capital formation 400
(xii) Net Export (–) 30
[Ans. : (a) GDPFC = 2600 Crores (b) FIPA = 90 Crores]
5. Calculate net national product at factor cost and gross national disposableincome from the following :
Rs. (Crore)
(i) Net current transfers to Row 10
(ii) Savings of non-departmental enterprises 60
(iii) Net indirect tax. 90
(iv) Income from property and entrepreneurship to theGovt. administrative departments 80
(v) Consumption of fixed capital 70
(vi) Personal Tax 100
(vii) Corporation tax 40
(viii) National debt interest 30
(ix) Current transfer payments by Govt. 50
(x) Retained Earnings of PVT. Corporate 10
(xi) Personal disposable income. 1100
[Ans. : (a) NNPFC = Rs. 1320 Crores (b) GNDI = 1470 Crores]

61 XII – Economics
6. Calculate (a) Gross domestic product at market price (GDPMP) (b) Factorincome from abroad.
Rs. (Crore)
(i) Profit 500
(ii) Export 40
(iii) Compensation of Employees 1500
(iv) Net current transfer from Row 2800
(v) Rent 90
(vi) Interest 300
(vii) Factor income to abroad 400
(viii) Net indirect tax 120
(ix) Gross fixed capital formation 250
(x) Net domestic capital formation 650
(xi) Gross fixed capital formation 700
(xii) Change in stock 50
[Ans. : GDPMP = 3050 Crores (b) FIRA = 120 Crores]
7. From the following data calculate (a) GDPMP and (b) Factor income fromabroad.
Rs. (Crore)
(i) Gross national product at factor cost 6150
(ii) Net export (–) 50
(iii) Compensation of Employees 3000
(iv) Rent 800
(v) Interest 900
(vi) Profit 1300
(vii) Net Indirect tax 300
(viii) Net domestic capital formation 800
(ix) Gross fixed capital formation 850
(x) Change in stock 50
(xi) Dividend 300
(xi) Factor income to abroad. 80
[Ans. : GDPMP = 6400 Crores; FIFA = 130 Crores]

XII – Economics 62
8. Calculate ‘Net National Disposable Income’ and ‘Personal Income’ from thefollowing data.
Rs. (Crore)
(i) Personal tax 212
(ii) Net national product at factor cost 2500
(iii) Net indirect tax 180
(iv) Domestic product accruing to Govt. 500
(v) Retained earnings of PVT. Corporations 80
(vi) NFIA 23
(vii) National debt interest 100
(viii) Net current transfer from abroad 20
(ix) Corporation tax 70
(x) Current transfer from Government 30
[Ans. : NNDI = 2700 Crore; P.I. = 2000 Crore]
9. Calculate National Income by the (a) Expenditure method and (b) Productionmethod from the following data
Rs. (Crore)
(i) Gross value added at market price by the primary sector 300
(ii) PVT. final consumption expd. 750
(iii) Consumption of Fixed capital 150
(iv) Net Indirect Taxes 120
(v) Gross value added at market price by the secondary sector 200
(vi) Net domestic fixed capital formation 200
(vii) Change in stock (–) 20
(viii) Gross value added at market price by the tertiary sector 700
(ix) Net imports 50
(x) Govt. final consumption expd. 150
(xi) Net factor income from abroad. 20
[Ans. : 950 Crores]
10. From the following data show that net value added at factor cost (NVAFC)is equal to the sum of factor incomes.

63 XII – Economics
Rs. (Crore)
(i) Purchase of raw material and other input fromthe domestic market 600
(ii) Increase in stock 200
(iii) Domestic sales 1800
(iv) Import of raw material 100
(v) Exports 200
(vi) Depreciation of fixed capital 75
(vii) Salaries and wages 600
(viii) Interest payments 450
(ix) Rent 75
(x) Dividends 150
(xi) Undistributed profits. 80
(xi) Corporate profit tax 20
(xii) Indirect tax 50
[Ans. : 1375 Crores]
11. From the following data calculate (a) Private income (b) Personal income(c) Personal disposable income.
Rs. (Crore)
(i) Income from property and entrepreneurship accruing to theGovt. administrative Dept. 100
(ii) Saving of non-departmental enterprises 80
(iii) Factor income from NDP occurring to Private sector 500
(iv) Corporation tax 30
(v) Saving of Pvt. corporate sector 65
(vi) Direct taxes paid by house hold 20
(vii) Current transfers from Govt. Administrative departments 10
(viii) Current transfer from Row 20
(ix) Factor income from abroad 5
(x) Operating surplus 150
(xi) Factor income to abroad 15
[Ans. : (a) 520 Crore (b) 425 Crore (c) 405 Crore]

XII – Economics 64
1 MARK QUESTIONS
1. Net Export means the difference between export and imports.
Net export = Export – Imports
2. Current transfers are those transfers which are paid from current incomeand are added in current income of recipient.
3. Normal resident of a country is that person or institution whose centre ofeconomic interest lies in that country.
4. Economic territory means that geographical territory administrated by aGovt. within which persons, goods and capital circulates freely.
5. When subsidies are more than indirect taxes.
6. It decreases in the value of fixed capital due to normal wear and tear andforeseen obsolescence.
7. ‘Injection’ is that economic concept, which add to flow of income andgoods e.g., investment, Exports.
8. “Leakage” is that economic concept, which has negative impact on flow ofincome.
9. (i) Flow (ii) Stock (iii) Flow (iv) Stock
10. It is the gross money value of National Product of current year valued atcurrent prices.
11. It is the gross money value of National product of current year valued atbase year price.
12. NVAFC
13. It is the financial transactions and does not have any impact on production.
14. NDP.
15. By deducting intermediate consumption from value of output, the problemof double counting can be solved.

65 XII – Economics
16. When per capita income is measured from real GDP (measured at constantprice) is called per capita real GDP.
17.(i) National income = Domestic Income + Net factor income from
abroad.
(ii) Personal income = Private income – Corporate tax – Undistributedprofit.
(iii) Net value added at FC = Gross Output – Intermediate Consumption– Depreciation – Net Indirect Tax
3-4 MARKS QUESTIONS
7. (a) Stock (b) Flow
(c) Flow (d) Stock
(e) Stock (f) Stock
10. (a) Intermediate good because it is for resale
(b) final good because purchased by ultimate consumer.
15. (a) Not include as paid for consumption expd.
(b) Included as paid for production expd.
NUMERICAL QUESTIONS (6 MARKS)
1. (i) G.D.P.F.C. :
VI + II – VII + X – I
500 + 100 – 20 + 160 – 130
760 – 150 = 610
(ii) NNDI
610 – (160 – 120) – 30 + 130 – 10
740 – 80 = 660
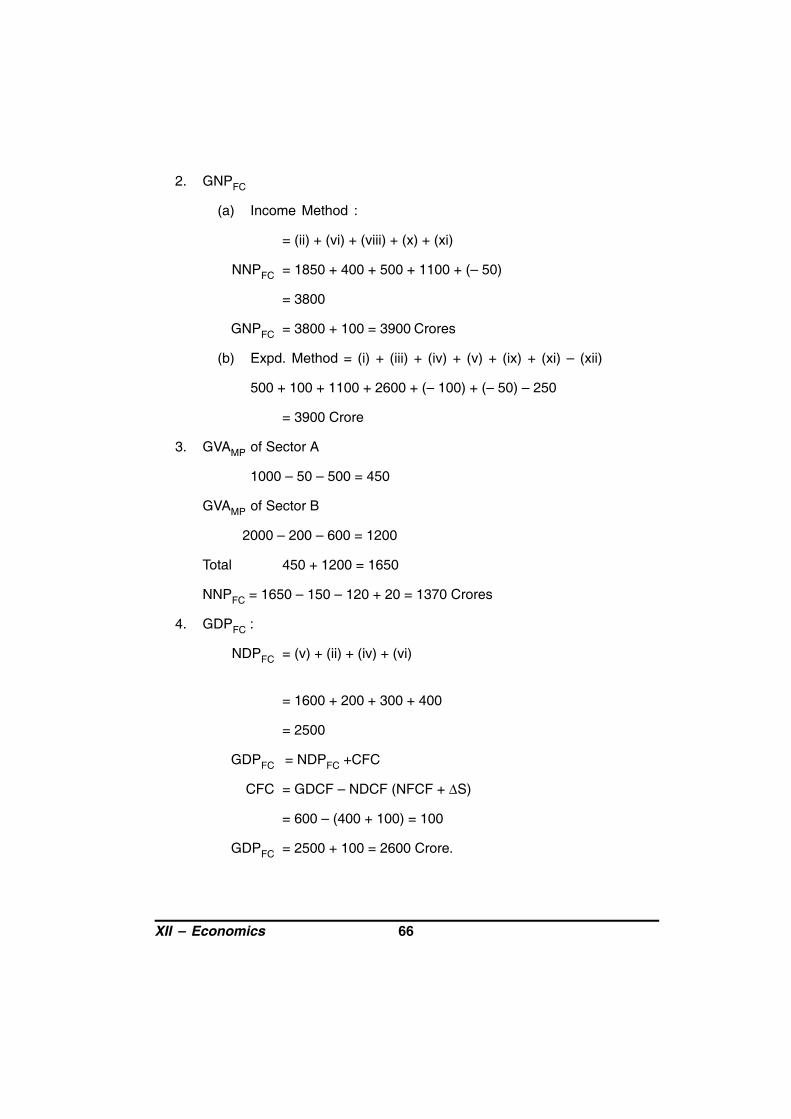
XII – Economics 66
2. GNPFC
(a) Income Method :
= (ii) + (vi) + (viii) + (x) + (xi)
NNPFC = 1850 + 400 + 500 + 1100 + (– 50)
= 3800
GNPFC = 3800 + 100 = 3900 Crores
(b) Expd. Method = (i) + (iii) + (iv) + (v) + (ix) + (xi) – (xii)
500 + 100 + 1100 + 2600 + (– 100) + (– 50) – 250
= 3900 Crore
3. GVAMP of Sector A
1000 – 50 – 500 = 450
GVAMP of Sector B
2000 – 200 – 600 = 1200
Total 450 + 1200 = 1650
NNPFC = 1650 – 150 – 120 + 20 = 1370 Crores
4. GDPFC :
NDPFC = (v) + (ii) + (iv) + (vi)
= 1600 + 200 + 300 + 400
= 2500
GDPFC = NDPFC +CFC
CFC = GDCF – NDCF (NFCF + S)
= 600 – (400 + 100) = 100
GDPFC = 2500 + 100 = 2600 Crore.

67 XII – Economics
FIPA
GNPMP = GDPFC + NFIA + NIT
2800 = 2600 + NFIA + 240
NFIA = – 40
NFIA = FIFA – FIPA
– 40 = 50 – FIPA
FIPA = 50 + 40 = 90 Crores
5. NNPFC = (xi) + (vi) + (vii) + (x) – (viii) – (ix) + (i) + (ii) + (iv)
= 1100 +100 + 40 + 10 – 30 – 50 + 10 + 60 + 80
= 1320 Crores
GNDI = NNPFC + (iii) + (v) – (i)
= 1320 + 90 +70 – 10
= 1470 Crores
6. (a) GDPMP :
NDPFC = (iii) + (v) + (vi) + (vii)
= 1500 + 500 + 300 + 400
= 2700 Crores
GDPMP = NDPFC + CFC + NIT
CFC = (GFCF + S) – 650
= (700 + 50) – 650
= 100
NIT = 250
GDPMP = 2700 + 100 + 250
= 3050

XII – Economics 68
(b) FIFA
GNPFC = GDPMP + NFIA – NIT
2800 = 3050 + NFIA – 250
NFIA = 0
NFIA = FIFA – FIPA
0 = FIFA – 120
FIFA = 120 Crores
7. GDPMP :
NDPFC = (iii) + (iv) + (v) + (vi)
= 3000 + 800 +900 + 1300 = 6000
GDPMP = NDPFC + CFC + NIT
CFC = GDCF – NDCF
= (GFCF + s) – NDCF
= (850 + 50) – 800
= 100
NIT = 300
GDPMP = 6000 + 100 + 300 = 6400 Crores
FIFA :
GNPFC = GDPMP + NFIA – NIT
6150 = 6400 + NFIA – 300
NFIA = 50
NFIA = FIFA – FIPA
50 = FIFA – 80
FIFA = 130

69 XII – Economics
8. NNDI = (ii) + (iii) + (viii)
= 2500+ 180 + 20
= 2700
Pr. I = (ii) – (iv) + (vii) + (viii) + (x) – (ix) – (v)
= 2500 – 500 + 100 + 20 + 30 – 70 – 80
= 2000 Crores
9. N.I.
Expd. Method
= (ii) + (x) + (vi) + (vii) – (ix) + (xi) – (iv)
= 750 + 150 + 220 + (– 20) – 50 + 20 – 120
= 950 Crores
N.I. By production method
= (i) + (v) + (viii) – (iii) – (iv) + (xi)
= 300 + 200 + 700 – 150 – 120 + 20
= 950 Crores
10. NVAFC = (ii) + (iii) + (v) – (i) – (iv) – (vi) – (xiii)
= 200 +1800 + 200 – 600 – 100 – 75 – 50
= 1375 Crores
Sum of factor income = (vii) + (viii) + (ix) + (x) + (xi) + (xii)
= 600 + 450 + 75 + 150 + 80 + 20
= 1375
11. (a) PVT Income – Rs. 520 Crore
(b) P.I. – Rs. 425 Crore
(c) P.D.I. = Rs. 405 Crore

XII – Economics 70
UNIT 7
MONEY AND BANKING
Money : Money may be defined as anything which is generally acceptableas a medium of exchange and does the function of ‘unit of account’ andmeasures of value.
Barter Exchange : It is a system of exchange in which transactions aremade by exchange of goods.
Difficulties involved in the Barter Exchange
1. Absence of a common unit.
2. The lack of double coincidence of wants
3. Lacks of any satisfactory units to engage in contracts involvingfuture payments.
4. Does not provide for any method of storing generalised purchasingpower.
5. Lack of divisibility.
Supply of Money : Total stock of money with the public at a given pointof time.
Commercial Banks : Commercial Banks is a financial institution whoaccepts deposits from the general public and provide loans facilities.
Central Banks : The central Bank is the apex institution of monetary andbanking system of country.

71 XII – Economics
Functions of Money
Primary Functions Secondary Functions
Medium of exchange
Measure of value
Store ofvalue
Standard of Deferred Payment
Transfer ofvalue
M1
Measures of Money Supply
M2 M3
Currency held by public
Demand deposits in banks
Other deposits in R.B.I.
Saving depositswith banks
Saving deposits withpost office
M1 M1 Time depositsof banks M4
Total deposits with post office saving
organisation(except NSC)
1
2
3
1
2
M3
Bank
Central Bank Commercial BankIs the apex institution of monetary
and banking system of accountIs a financial institution which acceptsdeposits from the general public and
giving loans for investment
Functions of Central Banks
1. Currency Authority
2. Banker to Govt.
3. Banker’s Bank and Supervisor.
4. Lender of Last resort
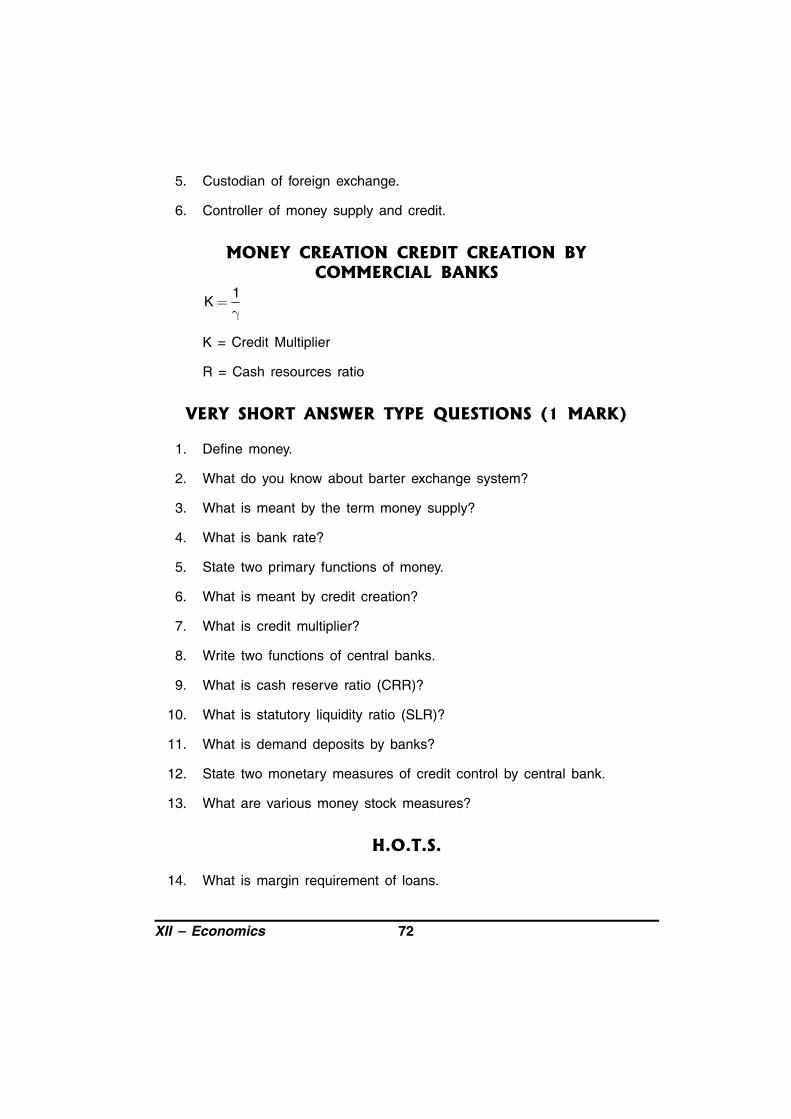
XII – Economics 72
5. Custodian of foreign exchange.
6. Controller of money supply and credit.
MONEY CREATION CREDIT CREATION BYCOMMERCIAL BANKS
1K
K = Credit Multiplier
R = Cash resources ratio
VERY SHORT ANSWER TYPE QUESTIONS (1 MARK)
1. Define money.
2. What do you know about barter exchange system?
3. What is meant by the term money supply?
4. What is bank rate?
5. State two primary functions of money.
6. What is meant by credit creation?
7. What is credit multiplier?
8. Write two functions of central banks.
9. What is cash reserve ratio (CRR)?
10. What is statutory liquidity ratio (SLR)?
11. What is demand deposits by banks?
12. State two monetary measures of credit control by central bank.
13. What are various money stock measures?
H.O.T.S.
14. What is margin requirement of loans.

73 XII – Economics
SHORT ANSWER TYPE QUESTIONS (3-4 MARKS)
1. Explain the function of money as ‘Unit of value’.
2. How does money solve the problem of double coincidence of wants?
3. Explain ‘ Store of value’ function of money.
4. What are open market operations? What is their effect on availability ofcredit?
5. Explain the ‘lender of last resort’ function of central bank.
6. Distinguish between SLR and CRR. Explain the Role of SLR and CRR incredit control.
7. How does changes in Bank rate affect money creation by commercialBank? Explain.
8. State the role of central Bank as a banker of the Government.
9. State any four functions of money.
10. Explain the ‘Standard of deferred payment’.
11. How central bank is controller of credit?
12. Explain how does followings helps to control the credit creation.
(i) Open market operation
(ii) Margin requirement of loans
H.O.T.S.
13. What is meant by statutory liquidity ratio (SLR). State the effect of rise inrate of SLR on creation of credit.
14. Explain ‘currency authority’ and ‘controller of credit’ functions of centralbank.
15. Explain effect of increase in bank rate on credit creation by commercialbanks.

XII – Economics 74
LONG ANSWER TYPE QUESTIONS (6 MARKS)
1. Define Central Bank. What are the functions of Central Bank?
2. Explain any four functions of money.
3. How does a central bank influence credit creation by commercial banksthrough ‘open market operation’ explain.
4. Explain the process of credit creation or money creation by commercialbanks with the help of numerical example.
1 MARK QUESTIONS
1. Any thing which is generally acceptable by the people as medium ofexchange, measure of value, standard of deferred payment and performsthe function of store of value.
2. It is the system of exchange in which transactions are made by exchangeof goods.
3. Total stock of money which are held by the public at a particular point oftime in an Economy.
4. Rate at which central bank lends to the commercial bank.
5. 1. Medium of Exchange
2. Measure of value
6. Credit creation means power to expand demand deposits of CommercialBanks.
7. Credit multiplier measures, number of times deposits are multiplied ascredit.
1Credit multiplier
LRR
8. (i) Currency Authority
(ii) Controller of money and credit

75 XII – Economics
9. Commercial Banks are required under law to keep a certain percentageof their total deposit in the central banks in the form of cash reserves. Thisis called CRR.
10. Every Commercial Bank is required to keep a fixed percentage (ratio) ofits assets in cash, called SLR.
11. Demand deposits are deposits which can be withdrawn from bank at anytime by the account holder.
12. (i) Bank Rate policy.
(ii) Open market operation
13. Following four measures of money stock are used.
M1 = C + DD + OD
M2 = M1 + Saving deposit in Post Office Saving banks.
M3 = M1 + Net time deposit of banks
M4 = M3 + Total deposits with post office saving organisation (exceptNSC).
HOTS
14. Marginal requirement of loan means the difference in percentage betweenthe amount of the loan and market value of the security offered by theborrower against the loan.
3-4 MARKS QUESTIONS
11. Quantitative measures and qualitative measures of monetary policy.
13. Increase in SLR reduces credit availability.

XII – Economics 76
UNIT 8
DETERMINATIONS OF INCOME & EMPLOYMENT
• Aggregate demand refers to total demand for goods and services in theeconomy. AD represents the total expenditure on goods and services in aneconomy.
• Main components of Aggregate demand are :
(i) Household consumption expenditure (C).
(ii) Investment expenditure (I).
(iii) Govt. consumption expenditure (G).
(iv) Net export (X – M).
In two sector economy AD = C + I.
• Aggregate supply is the total supply of goods and services in the economy.It is also the value of total output available is an economy during a givenperiod of time.
AS = C + S
• Aggregate supply represents the national income of the country.
AS = Y (National Income)
• Consumption function shows functional relationship between consumptionand Income.
C = F(Y)
where C = Consumption
Y = National Income
F = Functional relationship.

77 XII – Economics
• Consumption function (propensity to consume) is of two types.
(a) Average propensity to consume (APC)
(b) Marginal propensity to consume (MPC)
• Average propensity to Consume (APC) : Average propensity to consumerefers to the ratio of consumption expenditure to the corresponding levelof income.
Consumption CAPC
Income Y
Important Points about APC
(i) APC is more than 1 : as long as consumption is more than nationalincome before the break-even point, APC > 1.
(ii) APC = 1, at the break-even point, consumption is equal to national income.
(iii) APC is less than 1 : beyond the break-even point. Consumption is lessthan national income.
(iv) APC falls with increase in income.
(v) APC can never be zero : because even at zero level of national income,there is autonomous consumption.
• Marginal Propensity to Consume (MPC) : Marginal propensity to consumerefers to the ratio of change in consumption expenditure to change in totalincome.
Change in consumption CMPC
Change in Income Y
Important Points about MPC
(1) Value of MPC varies between O and 1 : If the entire additional incomeis consumed, then C = Y, making MPC = 1. However, if entire additionalincome is saved, than C = 0, making MPC = 0
• Saving function refers to the functional relationship between saving andnational income.

XII – Economics 78
S = f (y)
where S = saving
Y = National Income
F = Functional relationship.
• Saving function (Propensity to Save) is of two types.
(i) Average Propensity to Save (APS)
(ii) Marginal propensity to Save (MPS)
• Average Propensity to Save (APS) : Average propensity to save refersto the ratio of savings to the corresponding level of income.
Savings SAPS
Income Y
• Important Point about APS
(1) APS can never be 1 or more than 1 : As saving can never beequal to or more than income.
(2) APS can be zero : At break even point C = Y, hence S = 0
(3) APS can be negative or less than 1 : At income levels which arelower than the break-even point, APS can be negative as there willbe dissavings in the economy.
(4) APS rises with increase in income.
• Marginal Propensity to Save (MPS) : Marginal propensity to save refersto the ratio of change in savings to change in total income.
Change in Savings ( S)MPS =
Change in Income ( Y)
• MPS varies between 0 and 1
(i) MPS = 1 if the entire additional income is saved. In such a case,S = Y.
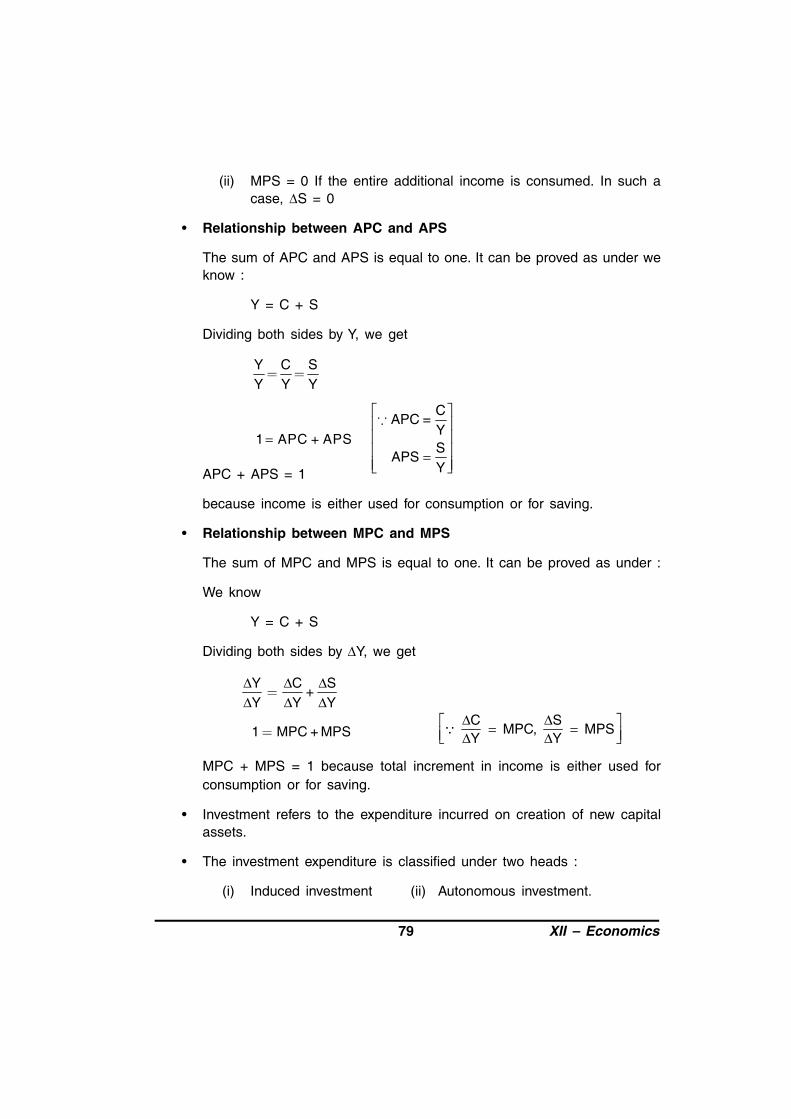
79 XII – Economics
(ii) MPS = 0 If the entire additional income is consumed. In such acase, S = 0
• Relationship between APC and APS
The sum of APC and APS is equal to one. It can be proved as under weknow :
Y = C + S
Dividing both sides by Y, we get
Y C SY Y Y
1 APC + APS
CAPC =
YS
APSY
APC + APS = 1
because income is either used for consumption or for saving.
• Relationship between MPC and MPS
The sum of MPC and MPS is equal to one. It can be proved as under :
We know
Y = C + S
Dividing both sides by Y, we get
Y C S +
Y Y Y
1 MPC + MPSC S
MPC, MPSY Y
MPC + MPS = 1 because total increment in income is either used forconsumption or for saving.
• Investment refers to the expenditure incurred on creation of new capitalassets.
• The investment expenditure is classified under two heads :
(i) Induced investment (ii) Autonomous investment.

XII – Economics 80
• Induced Investment : Induced investment refers to the investment whichdepends on the profit expectations and is directly influenced by incomelevel.
• Autonomous Investment : Autonomous investment refers to the investmentwhich is not affected by changes in the Level of income and is not inducedsolely by profit motive.
• Marginal Efficiency of Investment (MEI) : MEI refers to the expectedrate of return from an additional investment.
• Ex-Ante Savings : Ex-ante saving refers to amount of savings whichhousehold intended to save at different levels of income in the economy.
• Ex-Ante Investment : Ex-ante investments refers to amount of investmentwhich firm plan to invest at different level of income in the economy.
• Ex-Post Saving : Ex-post savings refer to the actual or realised savingsin an economy during a financial year.
• Ex-Post Investment : Ex-post investment refers to the actual or realisedinvestment in an economy during a financial year.
• Equilibrium level of income is determined only at the point where AD = ASor S = I. But it cannot always be at full employment level also as it can beat less than full employment.
• Full employment is a situation when all those who are able and willing towork at prevailing wage rate, get the opportunity to work.
• Voluntary unemployment is a situation where person is able to work butnot willing to work at prevailing wage rate.
• Involuntary unemployment is a situation where worker is able to willing towork at current wage rate but does not get work.
• Under employment is a situation where AD is less than required AS at fullemployment level.
• Investment multiplier (K) is the ratio of increase in income ( Y) due tochange in investment I.
YK =
I1 1
K or K1– MPC MPS

81 XII – Economics
• Excess demand refers to the situations when aggregate demand is inexcess of aggregate supply corresponding to full employment.
• Deficient demand refers to a situation when aggregate demand is short ofaggregate supply corresponding to full employment.
• Inflationary gap is the gap by which actual aggregate demand exceeds thelevel of aggregate demand required to establish full employment. It measuresthe amount of excess of aggregate demand.
• Deflationary gap is the gap by which actual aggregate supply is less thanthe level of aggregate demand required to establish full employment. Itmeasures the amount of deficiency of aggregate demand.
1 MARK QUESTIONS
1. Define aggregate demand.
2. Define aggregate supply.
3. What is meant by Ex-Post investment?
4. What is meant by average propensity to consume?
5. Define marginal propensity to consume.
6. What is autonomous consumption?
7. What is Ex-ante aggregate demand?
8. Can the value of APC be greater than one?
9. Can APC be ever zero?
10. What is the relationship between APC and APS?
11. If APS is 0.6, how much will be the APC?
12. What is meant by Ex-ante saving?
13. If MPC and MPS are equal, what is the value of the multiplier?
14. What can be the minimum value of investment multiplier?
15. What can be the maximum value of multiplier?
16. Can average propensity to consume be negative?
XII – Economics 82
17. What do you mean by investment multiplier?
18. What will be the impact of increase in cash reserve ratio on the aggregatedemand?
19. What is investment?
20. Why can the value of marginal propensity to consume not be greater thanone?
H.O.T.S.
21. What is the impact of deficient demand on production and employment?
22. Define inflationary gap.
23. Under which situation is consumption function represented by a straightline.
24. What is the impact of continuous increase in income on average propensityto consume?
25. How much additional income will be generated in an economy with additionalinvestment of Rs. 100 crore, when MPC = 1/2?
SHORT ANSWER TYPE QUESTIONS (3-4 MARKS)
1. Define aggregate demand. State its components.
2. Distinguish between average propensity to consume and marginalpropensity to consume with the help of numerical examples.
3. Savings and investment are always equal discuss.
4. What is meant by investment multiplier? Explain the relationship betweenMPC and K?
5. State briefly the effect of excess demand on output, employment and price.
6. Explain the concept of inflationary gap with the help of a diagram?
7. Explain the situation of deficient demand in an economy with the help ofa diagram.
8. State briefly any three measures to control excess demand in an economy.

83 XII – Economics
9. What is monetary policy? Explain the role of (i) Bank rate and (ii) Marginrequirements in influencing the availability of credit in an economy.
10. Give the meaning of excess demand? Explain any two fiscal measures tocurrent excess demand.
11. What is fiscal policy? What possible fiscal measures can be taken withrespect to deficient demand in an economy?
12. What do you mean by full employment equilibrium? Explain with the helpof diagram.
13. Explain with the help of diagram the concept of under-employmentequilibrium.
14. Distinguish between induced investment and autonomous investment?
15. Explain the concept of consumption function.
16. Briefly explain the relationship between MPC and MPS.
17. Giving reasons, state whether the following statements are true or false :
(i) When marginal propensity to consume is zero, the value ofinvestment multiplier will also be zero.
(ii) Value of average propensity to save can never be less than zero.
18. If national income is 50 crore and saving Rs. 5 crore, find out APC. Whenincome rises to Rs. 60 crore and saving to Rs. 9 crore. What will be theAPC and MPS.
19. An economy is in equilibrium. Its national income is Rs. 5000 andautonomous consumption expenditure is Rs. 500. What is the totalconsumption expenditure if MPC is 0.7?
20. Complete the following table :
Level of Income Savings MPC APC APS
0 – (80) – – –
100 – 0.7 – –
200 – 0.7 – –
300 – 0.7 – –
400 – 0.7 – –
XII – Economics 84
21. Given marginal propensity to save equal to 0.25, what will be the increasein national income if investment increases by Rs. 125 crore. Calculatemultiplier.
22. Find out equilibrium level of income, when S = –40 + 0.25 Y and investmentis Rs. 60.
23. Can an economy be is equilibrium when there is unemployment in theeconomy? Explain.
24. How does change in bank rate controls the situations of excess and deficientdemand?
25. Briefly explain with the help of diagram the relationship between savingsand income?
H.O.T.S.
26. Does an excess of AD over AS always imply a situation of inflationarygap? Explain.
27. What happens if AD > AS prior to the full employment level of output?
28. Find saving function when consumption function is given as :
C = 100 + .64.
29. In a two sector economy, the saving function is given as :
S = –10 + 0.2Y
and investment function is expressed as
I = –3 + 0.1Y.
Calculate the equili brium level of income?
30. State whether the following statement are true or false. Give reasons foryour answer
(a) When investment multiplier is 1, the value of MPC is zero.
(b) The value of average propensity to save can never be greater than 1.
31. Giving reasons, state whether the following statements are true or false :
(i) When marginal propensity to consumer is zero, the value ofinvestment multiplier will also be zero.

85 XII – Economics
(ii) Value of average propensity to save can never be less than zero.
LONG ANSWER TYPE QUESTIONS (6 MARKS)
1. Why must aggregate demand be equal to aggregate supply at theequilibrium level of income and output? Explain with the help of a diagram?
2. Explain the equilibrium level of income with the help of saving andinvestment curves. If saving exceed planned investment, what changeswill bring about the equality between them?
3. Explain the working of multiplier with the help of a numerical example.
4. When planned investment is more than planned savings, what will be itsimpact on income and employment. Explain with the help of diagram.
5. What do you mean by Fiscal Policy? How it helps in controlling excessdemand?
6. Can there be equilibrium in case of underemployment. Explain with thehelp of a diagram?
7. How quantitative and qualitative instruments of Govt. monetary policycontrols deficient demand?
8. Distinguish between inflationary gap and deflationary gap. Show deflationarygap on a diagram. Can this gap exist at equilibrium level of income?Explain.
9. In an economy S = –50 + 0.5Y is the saving function (where S = savingand Y = national income) and investment expenditure is 7000. Calculate.
(i) Equilibrium level of national income
(ii) Consumption expenditure at equilibrium level of national income.
10. C = 100 + 0.75y is a consumption function where C = consumptionexpenditure and Y = national income and investment expenditure is 800.On the basis of this information calculate.
(i) Equilibrium level of national income.
(ii) Saving at equilibrium level of national income.

XII – Economics 86
11. Given below is the consumption function in an economy.
C = 100 + 0.5Y
with the help of a numerical example show that in this economy, as incomeincrease APC will decrease.
HOTS (6 MARKS QUESTIONS)
12. Draw on a diagram a straight line saving line curve for an economy. Fromit derive the consumption curve, explaining the method of derivation. Showa point on the consumption curve at which APC is equal to 1.
13. How increase in investment will effect income level of an economy? Explainwith the help of an example and diagram.
14. Briefly explain the concept of under employment equilibrium with the helpof diagram. How increase in investment helps in achieving, full employmentequilibrium?
15. What is ‘deficient demand’ in macroeconomics? Explain the role of openmarket operations in correcting it.
16. Explain the step taken in derivation of the saving curve from the consumptioncurve use. Use diagram.
1 MARK QUESTIONS
1. Aggregate demand refers to total demand for goods & services in aneconomy, measured in terms of total expenditure.
2. Aggregate supply is the money value of the final goods and services ornational product produced in an economy during one year.
3. Ex-post investment refers to the actual or realised investment in an economyduring a financial year.
4. Average propensity to consume is the ratios of consumption expenditureto income.
CAPC =
Y
87 XII – Economics
5. Marginal propensity to consume is the ratio of change in consumption tochange in income.
CMPS =
Y
6. Autonomous consumption refers to minimum level of consumption, evenwhen income is zero.
7. Estimated demand of goods and service in an economy during a financialyear.
8. Yes, the value of APC > 1 before the break-even point is attained.
9. APC can never be equal to zero as consumption can never be zero at anylevel of income.
10. The sum of APC and APS is equal to one.
APC + APS = 1
11. APC = 1 – APS = 1 – 0.6 = 0.4
12. Exante-saving refers to amount of saving which household intended tosave at different level of income in an economy.
13. We know that
MPS + MPC = 1
MPS + MPC = 1 Give that MPS = MPC
1MPS =
2
1 1K =
MPS 1 2
K = 2
14. The minimum value of K = 1, when MPC = O
15. The maximum value of k = when MPC = 1
16. No, because consumption can never be zero even at zero level of income.
17. Investment multiplier measures the ratio of change in investment and changein income.
XII – Economics 88
18. Aggregate demand will fall.
19. Investment is an addition to capital stock. It is also called capital formation.
20. It is because change in consumption cannot be greater than change inincome.
21. Production and employment will decrease due to shortage of aggregatedemand.
22. Inflationary gap refers the situation under which AD is excess than requiredAS at full employment equilibrium.
23. When marginal propensity to consume remains constant.
24. APC falls with continuous increase in income.
25.1 1 1
K = 211 – MPC 0.51 –2
and Y = K . I
= 2 x 100
= 200 Crore.
3-4 MARKS QUESTIONS
18. (i) 200 Crore (ii) 400 Crore
19. (i) I = 7000 Crore. (ii) C = 6300 Crore.
20. APC = –, 1.5, 1.1, 0.96, 0.9
APS = –, (–), .5, (–) 0.1, .033, .1
S = –80, –50, –20, 10, 40
21. K = 4
Y = 4 x 125
= 500 Crore.

89 XII – Economics
22. Rs. 400
29. Rs. 70
6 MARKS QUESTIONS
9. (i) National income (Y) = 14100
(ii) Consumption expenditure (C) = 7100
10. (i) Equilibrium National Income (Y) = 3600
(ii) Saving = 800
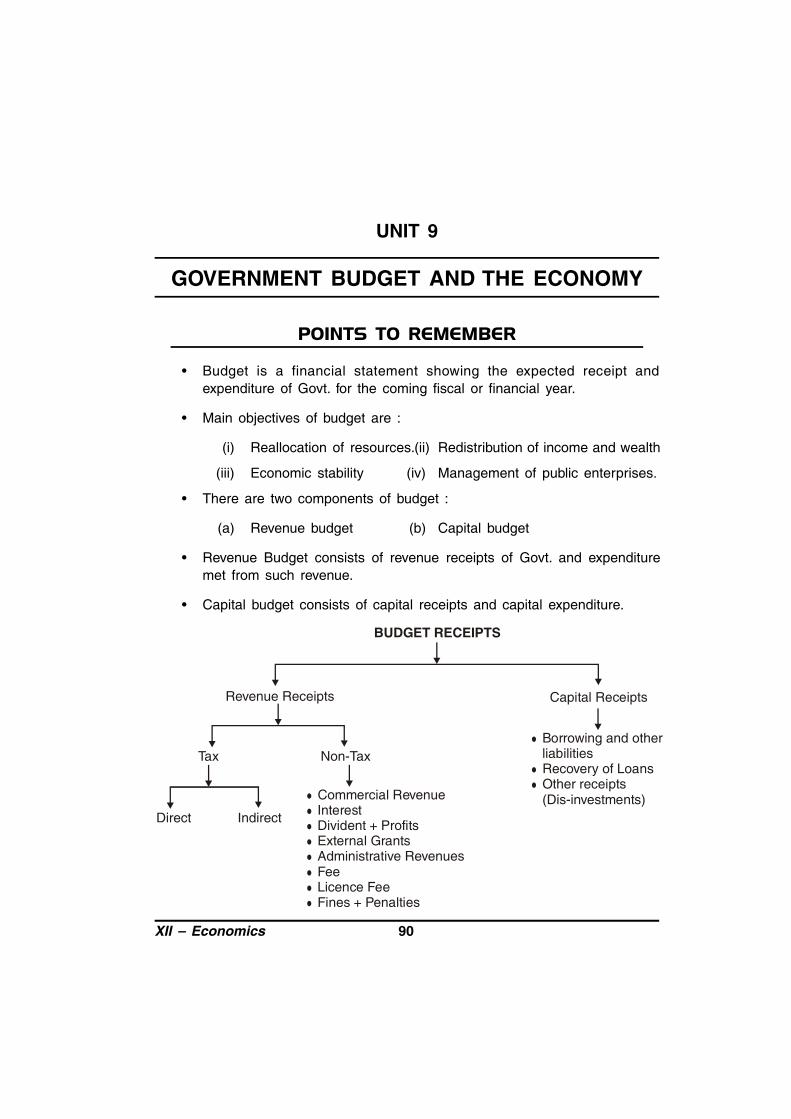
XII – Economics 90
UNIT 9
GOVERNMENT BUDGET AND THE ECONOMY
• Budget is a financial statement showing the expected receipt andexpenditure of Govt. for the coming fiscal or financial year.
• Main objectives of budget are :
(i) Reallocation of resources.(ii) Redistribution of income and wealth
(iii) Economic stability (iv) Management of public enterprises.
• There are two components of budget :
(a) Revenue budget (b) Capital budget
• Revenue Budget consists of revenue receipts of Govt. and expendituremet from such revenue.
• Capital budget consists of capital receipts and capital expenditure.
BUDGET RECEIPTS
Revenue Receipts Capital Receipts
Tax Non-Tax
Direct Indirect
Commercial RevenueInterestDivident + ProfitsExternal GrantsAdministrative RevenuesFeeLicence FeeFines + Penalties
Borrowing and other liabilities
Recovery of Loans Other receipts
(Dis-investments)
91 XII – Economics
• Revenue Receipts :
(i) Neither creates liabilities for Govt.
(ii) Nor causes any reduction in assets.
• Capital Receipts :
(i) It creates liabilities or (ii) It reduces assets.
BUDGET EXPENDITURE
Revenue Expenditure Capital Expenditure
• Revenue Expenditure :
(i) Neither creates assets (ii) Nor reduces liabilities
• Capital Expenditure :
(i) It creates assets (ii) It reduces liabilities.
• Revenue Deficit : Total revenue expenditure > Total revenue receipts
• Revenue deficit when total revenue expenditure excess total revenuereceipts.
• Implications of Revenue Deficit are :
(i) It leads to repayment burden in future without investment.
(ii) It shows wasteful expenditures of Govt. on administration.
(iii) It increase the burden of taxes.
• Fiscal Deficit : Total expenditures > Total Receipts excluding borrowing.
Fiscal deficit : When total expenditure exceeds total receipts excludingborrowing.
• Implications of Fiscal Deficits are :
(i) It leads to inflationary pressure.
(ii) A country has to face debt trap.

XII – Economics 92
(iii) It reduces future growth + development.
• Primary Deficit : Fiscal deficit – Interest payments.
Primary Deficit : By deducting Interest payment from fiscal deficit we getprimary deficit.
• Budgetary Deficit : Total Expenditure > Total Receipts.
Budgetary Deficit : Total expenditure exceeds total receipts.
VERY SHORT ANSWER TYPE QUESTIONS (1 MARK)
1. Define Budget.
2. What is meant by non-tax receipts?
3. What are revenue receipts?
4. What are capital receipts?
5. Give two examples of non-tax revenue receipts.
6. What are the two sources of capital receipts?
7. Define revenue deficit.
8. Define fiscal deficit.
9. Why is repayment of loan a capital expenditure?
10. Why is recovery of loan treated a capital receipt?
11. What is a balanced budget.
12. Define capital expenditure.
13. In a Govt. Budget primary deficit is Rs. 25,000 Cr. and interest paymentsare Rs. 15,000 Cr. How much is the fiscal deficit?
H.O.T.S.
14. What are Budget Receipts?
15. In a Govt. Budget, revenue deficit is Rs. 8,00,000 Cr. and borrowings areRs. 50,000 Cr. How much is the fiscal deficit?

93 XII – Economics
16. What is disinvestment?
17. What does zero primary deficit mean?
SHORT ANSWER TYPE QUESTIONS (3-4 MARKS)
1. Explain the allocation of resources objective of Govt. budget.
2. What is the difference between revenue budget and capital budget?
3. What is meant by revenue receipts? Explain the components of revenuereceipts of the Govt.
4. Distinguish between direct tax and indirect tax.
5. What do you mean by capital receipts? What are the main components ofthe capital receipts?
6. Give the meaning of revenue deficit and fiscal deficit. What problems canthe fiscal deficit create?
7. What is fiscal deficit? What are its implications?
8. Distinguish between revenue expenditure and capital expenditure with anexample of each.
9. Explain the “redistribution of income” objective of Govt. budget.
10. Explain the ‘Economic stability’ objective of Govt. budget.
HOTS (3-4 MARKS)
11. Under which situations deficit budget is beneficial for the economy.
12. Are fiscal deficits necessarily inflationary? Give reasons in support of yourview.
13. Discuss the issue of deficit reduction.
14. How can surplus budget be used during inflation.
15. Giving reasons, classify the following as direct and indirect taxes.
(i) Entertainment tax (ii) Corporation tax
(iii) Excise tax (iv) Capital gains tax.

XII – Economics 94
16. From the following data about a government budget find (a) revenue deficit,(b) fiscal deficit and (c) primary deficit.
(Rs. arab)
(i) Plan capital expenditure 120
(ii) Revenue expenditure 100
(iii) Non-plan capital expenditure 80
(iv) Revenue receipts 70
(v) Capital receipts net of borrowing 140
(vi) Interest payments 30
17. Distinguish between :
(i) Capital expenditure and Revenue expenditure
(ii) Fiscal deficit and Primary deficit.
1 MARK QUESTIONS
1. Budget is a financial statement showing the estimated receipts andestimated expenditure of the Govt. for coming fiscal year.
2. All the revenue receipt of Govt. other than tax receipts.
3. Revenue receipts are those receipts which neither creates liabilities forGovt. nor cause any reduction in assets.
4. Capital receipts are those receipts which either creates a liability or leadsto reduction in assets.
5. Interest, Fee.
6. Borrowings, Recovery of loans.
7. When total revenue expenditure exceeds total revenue receipts.
8. When total expenditure exceeds total receipts excluding borrowing.
9. As it leads to reduction in liability.
95 XII – Economics
10. As it leads to reduction in assets.
11. Balanced budget is that when estimated receipts are equal to estimatedexpenditure.
12. Capital expenditure is that which creates assets and which reduces liabilities.
13. Fiscal Deficit = Primary Deficit + Interest Payment
= 25,000 + 15,000
= 40,000 Crore.
14. Estimated money receipt received by the Govt. from different sources infiscal year are called budgetary receipts.
15. Rs. 50,000 Crore.
16. Disinvestment refers to withdrawal of existing investment.
17. Zero primary deficit means that interest commitment on earlier loans havecompelled the Govt. to borrow.
3-4 MARKS QUESTIONS
15. (i) Indirect tax
(ii) Direct tax
(iii) Indirect tax
(iv) Direct tax

XII – Economics 96
UNIT 10
BALANCE OF PAYMENT
• The balance of payment is annual record of the transaction in goods,services and assets between residents of a country with the rest of theworld.
ACCOUNTS OF BALANCE OF PAYMENTS
The current account recordsexports and imports of goodsand services and unilateral transfers.
Capital AccountCurrent Account
The Capital account recordsall international purchases andsale of assets such as money-stocks. bond etc.
• Components of Components ofCurrent Account Capital Account
1. Visible items (import and export 1. Foreign Direct investment.of goods)
2. Invisible items (import and 2. Loansexport of services.)
3. Unilateral transfers. 3. Portfolio investment.
4. Banking capital transactions.
• The components of current • The components of capital accountsaccount do not cause a change cause in change in assets or Liabili-in assets or Liabilities status of ty status of the residents and thethe residents of a country or its Government of a country.Government.

97 XII – Economics
• Balance of trade is the net difference of Import and export of all visibleitems between the normal residents of a country and rest of the world.
• Autonomous items are those items of balance of payment which are relatedto such transaction as are determined by the motive of profit maximisationand not to maintain equilibrium in balance of payments. These items aregenerally called ‘Above the Line items’ in balance of payment.
• Accommodating item refers to transactions that take place because ofother activity in Balance of Payment. Then transactions are meant to restorethe Balance of Payment identity. These items are generally called ‘Belowthe Line items’.
• Foreign exchange rate refers to the rate at which one unit of currency ofa country can be exchanged for the number of units of currency of anothercountry.
SYSTEM OF EXCHANGE RATE
Fixed exchange rate Flexible exchange rate.
• The epitome of the fixed exchange rate system was the gold standard inwhich each participant country committed itself to convert freely its currencyinto gold at a Fixed Price.
• Merit of Fixed Exchange Rate
(i) Stability in exchange rate
(ii) Promotes capital movement and international trade.
(iii) No scope for speculation.
• Demerits of Fixed Exchange Rate
(i) Need to hold foreign exchange reserves.
(ii) No automatic adjustment in the ‘Balance of payments.’
(iii) Enhance dependence on external sources.
• In a system of flexible exchange rate (also known as floating exchangerates), the exchange rate is determined by the forces of market demandand supply of foreign exchange.

XII – Economics 98
• The demand of foreign exchange have inverse relation with flexible exchangerate. If flexible exchange rate rise the demand of foreign exchange falls.Vice versa.
• Sources of Demand for Foreign Exchange
(a) To purchase goods and services from the rest of world.
(b) To purchase financial assets (i.e., to invest in bonds and equityshares) in a foreign country.
(c) To invest directly in shops, factories, buildings in foreign countries.
(d) To send gifts and grants to abroad.
(e) To speculate on the value of foreign currency.
(f) To undertake foreign tours.
• The supply of foreign exchange have positive relation with foreign exchangerate. If foreign exchange rate rise the supply of foreign exchange rate alsorise and vice versa.
• Sources of Supply of Foreign Exchange
(i) Direct purchase by foreigners in domestic market.
(ii) Direct investment by foreigners in domestic market.
(iii) Remittances by non-residents living abroad.
(iv) Flow of foreign exchange due to speculative purchases by N.R.I.
(v) Exports of goods and services.
• Merits of Flexible Exchange Rate
(i) No need to hold foreign exchange reserves
(ii) Leads to automatic adjustment in the ‘balance of payments’.
(iii) To increase the efficiency in the economy by achieving optimumresources allocation.
(iv) To remove obstacles in the transfer of capital and trade.
99 XII – Economics
• Demerits of Flexible Exchange Rate
(i) Fluctuations in future exchange rate.
(ii) Encourages speculation.
(iii) Discourages international trade and investment.
• In currency depreciation, there is a fall in the value of domestic currencyin term of foreign currency. In currency appreciation, there is a rise in thevalue of domestic currency in term of foreign currency.
• In currency appreciation, there is a rise in the value of domestic currencyin terms of foreign currency.
• Equilibrium flexible exchange rate is determined at a level where demandfor and supply of foreign exchange are equal to each other.
• Managed floating system is a system in which the central bank allows theexchange rate to be determined by market forces but intervenes at timesto influence the rate.
VERY SHORT ANSWER TYPE QUESTIONS (1 MARK)
1. What is meant by balance of trade?
2. Define balance of payment.
3. When is there a deficit in the balance of trade.
4. The balance of trade shows a deficit of Rs. 300 crs. and the value ofexports is Rs. 500 crs. What is the value of imports?
5. List two items included in the balance of trade account.
6. List two items of the capital accounts of balance of payment.
7. Define visible items with the help of an example.
8. What is meant by invisible items?
9. What is meant by unilateral transfer?
10. What is meant by Autonomous transactions?
11. Write the name of those economic transactions which are made by thegovernment to make equilibrium in balance of payment.

XII – Economics 100
12. What do you mean by Fixed Exchange Rate?
13. Define Flexible Exchange rate?
14. Name the forces that determine flexible exchange rate.
15. State two merits of Flexible Exchange Rate.
16. State two demerits of Flexible Exchange Rate.
17. State two merits of fixed exchange rate.
18. State two demerits of fixed exchange rate.
19. What is the slope of demand curve of foreign exchange like?
20. What is the slope of supply curve of Foreign Exchange?
21. What will be the effect on exports, if foreign exchange rate increases?
22. What will be the effect on imports if foreign exchange rate increases.
23. Define Devaluation of Domestic Currency.
24. What is meant by Depreciation of Domestic Currency?
25. What is meant by Appreciation of Domestic Currency?
HOTS (1 MARK)
26. In which circumstances, the devaluation of currency will be in favour ofeconomy?
27. In which circumstances the appreciation of currency will be non favourablefor the economy?
28. Under which circumstances, the purchasing power of foreign currencyincreases in comparison to domestic currency?
29. With the help of which item BOP gets balanced?
30. Does BOP always remain balanced?
SHORT ANSWER TYPE QUESTIONS (3-4 MARKS)
1. Write any three points of difference between BOT and BOP.

101 XII – Economics
2. Distinguish between current account and capital account of BOP.
3. How can deficit in BOP be financed?
4. What are the components of the current account of the balance of paymentaccount.
5. Give difference between the autonomous and accommodating itemsincluded in BOP.
6. Distinguish between autonomous and accommodating transaction in thebalance of payment account. Give an example each.
7. Give three reasons why people desire to have foreign exchange.
8. Give any three/four sources of supply of foreign exchange.
9. Explain the relationship between foreign exchange rate and demand for it.
10. Explain the relationship between foreign exchange rate and supply of foreignexchange.
11. Explain the terms ‘appreciation and depreciation of currency.’
12. Explain the merit and demerits of fixed exchange rate.
13. Explain the merits and demerits of flexible exchange rate.
14. How is flexible exchange rate determined in a free market economy?Explain with the help of diagram.
15. Higher the foreign exchange rate, lower the demand fore foreign exchange.Explain why?
16. Lower the foreign exchange rate, higher the demand for foreign exchange.Explain why?
17. Explain the impact of Devaluation of domestic currency on the export andimports of an economy.
18. Give the meaning of fixed flexible and managed floating exchange rate.
19. Why the demand for foreign exchange falls when the foreign exchangerate rise explain with the help of an example.

XII – Economics 102
HOTS
20. What is the impact of appreciation of currency on the demand for foreignexchange?
21. What is the impact of appreciation of currency on the supply of foreignexchange?
22. What is the impact of depreciation of currency on the demand for foreignexchange?
23. What is the impact of depreciation of currency on the supply of foreignexchange?
24. Distinguish between devaluation and depreciation of domestic currency.
25. Giving reasons state whether the following statements are true or false :
(i) Excess of foreign exchange receipts over foreign exchangepayments on account of accommodating transactions equals deficitin the balance of payments.
(ii) Export and import of machines are recorded in capital account ofthe balance of payments account.
1 MARK QUESTIONS
1. It is the difference between monetary value of exports and imports ofmaterial goods or visible items.
2. A balance of payment is a statement of double entry system of all economictransactions between residents of a country and the residents of foreigncountries during a given period of time.
3. When the value of imports is more than value of exports.
4. 800 Crores.
5. Visible items Watch, Petrol, Electronic item.
6. (i) Direct Foreign Investment
(ii) Loans
103 XII – Economics
7. The visible items are all those types of physical goods which are exportedand imported.
8. Invisible items are all those type of services which are exported andimported.
9. These refers to one sided transfers from one country to other. These arenot trading transactions.
10. Autonomous transactions refer to international economic transactions inthe current and capital account that are undertaken for profit.
11. Accommodating items.
12. Fixed exchange rate is the rate which is officially fixed in terms of fold orany other currency by the govt. or adjusted only frequently.
13. Flexible exchange rate is determined by demand for and supply of a givencurrency in foreign exchange market.
14. (i) Market demand for foreign exchange
(ii) Market supply of foreign exchange.
15. (i) No need to hold foreign exchange reserve.
(ii) Optimum resource allocation.
16. (i) Fluctuations in figure exchange rate.
(ii) Encourages speculation.
17. (i) Stability in Exchange rate.
(ii) No scope for speculation.
18. (i) Need to hold foreign exchange reserves.
(ii) No automatic adjustment in the ‘Balance of Payments.’
19. Negative slope.
20. Positive slope.
21. Exports will increase because Indian goods have become cheaper forforeigners.

XII – Economics 104
22. Import will decrease because foreign goods have become costlier forIndians.
23. Devaluations means to reduce parity rate of its currency with respect ofgold or any other currency by the Government.
24. When the value of domestic currency reduce with respect to other currencyby the demand and supply forces of foreign exchange in a free exchangemarket.
25. Appreciation of currency refer when the value of foreign currency reducewith respect to domestic currency. It occurs in a free exchange market bythe forces of demand and supply of currency.
1 MARK HOTS QUESTIONS
26. When economy adopt the policy of Export Promotions.
27. When we adopt the policy of Import Substitution.
28. Capital account records capital transfer such as loans and investmentbetween one country and the rest of the world which causes a change inthe asset or liability status of the residents of a country or its government.
29. With the help of international loans.
30. They may be disequilibrium in BOP but in according sense, it is alwaysbalanced.
105 XII – Economics
SAMPLE QUESTION PAPER – SET I
ECONOMICS
Time : 3 Hours Maximum Marks : 100
General Instructions :
(i) All questions in both the sections are compulsory.
(ii) Marks for questions are indicated against each.
(iii) Question Nos. 1–5 and 17–21 are very short-answer questions carrying 1mark each. They are required to be answered in one sentence each.
(iv) Question Nos. 6-10 and 22-26 are short-answer questions carrying 3 markseach.
(v) Question Nos. 11-13 and 27-29 are also short-answer questions carrying4 marks each. Answer to them should not normally exceed 70 words each.
(vi) Question Nos. 14-16 and 30-32 are long-answer questions carrying 6marks each. Answer to them should not normally exceed 100 words each.
(vii) Answer should be brief and to the point and the above word limit beadhered to as far as possible.
1. Define microeconomics. 1
2. What is market equilibrium? 1
3. Define market demand. 1
4. Give meaning of "Change in quantity supplied." 1
5. Define 'Revenue'. 1
6. Explain how a production possibility curve is affected when resources areinefficiently employed in an economy. 3

XII – Economics 106
7. A consumer buys 17 units of a good at a price Rs. 10 per unit. When pricefalls to Rs. 8 per unit the consumer buys 23 units. Using the expenditureapproach, what will you say about price elasticity of demand of thegood? 3
8. Giving examples, distinguish between fixed cost and variable cost. 3
9. Draw Total Revenue Curve and Marginal Revenue Curve of a firm whichis free to sell any quantity of the good at a given price. Explain. 3
Note : The following question is for the Blind Candidates only, in lieu ofQ.No. 9.
Explain the relation between Total Revenue and Marginal Revenue of afirm which is free to sell any quantity it likes at a given price. 3
10. Explain the implication of the feature 'freedom of entry and exit to firms'under perfect competition.
Or
Explain the implication of the feature 'large number of sellers' under perfectcompetition. 3
11. Derive the inverse relation between price of a good and its demand fromthe ingle commodity equilibrium condition 'Marginal utility = Price'. 4
12. Explain how a fall in prices of the related goods affects the demand for thegiven period. Give example. 4
13. What is supply schedule? Explain how does change in technology ofproducing a good effect the supply of that good.
Or
Define supply curve. How does fall in price of an input affect the supplyof the good using that input? 4
14. Given reasons, explain the behaviour of total product under the Law ofVariable Proportions. Use diagram. 6
Note : The following question is for the Blind Candidates only, in lieu ofQ.No. 14.
Give reasons, explain the behaviour of total product under the law ofvariable proportions. Use a schedule. 6
107 XII – Economics
15. Explain the conditions of consumer's equilibrium with the help of indifferencecurve analysis. 6
16. Market for a good is in equilibrium. Supply of the good 'decreases'. Explainthe chain of effect of this change. Use diagram.
Or
Distinguish between 'cooperative' and 'non-cooperative' oligopoly. Explainthe following feature of oligopoly: 6
(i) Barriers to the entry of firms
(ii) Non-price competition
Note : The following question is for the Blind Candidates only, in lieu ofQ.No. 16.
Market for a good is in equilibrium. Supply of the good 'decreases'. Explainthe chain of effects of this change. Use numerical example. 6
17. Define 'capital goods'. 1
18. Define 'real' gross domestic product. 1
19. Define Legal Reserve Ratio. 1
20. What are demand deposits? 1
21. What is balance of payments? 1
22. What are components of the current account of the balance of paymentsaccount? 3
23. Explain how 'externalities' are a limitation of taking gross domestic productas an index of welfare. 3
24. An economy is in equilibrium. Its consumption function is C = 300 + 0.8Ywhere C is consumption expenditure and Y is income and investment isRs. 700. Find national income. 3
25. Explain with the help of examples, the distinction between direct tax andindirect tax. 3

XII – Economics 108
26. When price of a foreign currency rises its supply also rises. Explain, why.
Or
When price of a foreign currency falls its demand rises. Explain, why. 3
27. Explain the 'economy stability' objective of a government budget.
Or
Explain the 'allocation of resources' objective of a government budget.4
28. From the following data about a government budget find (a) revenue deficit,(b) fiscal deficit and (c) primary deficit : 4
(i) Plan capital expenditure 20
(ii) Revenue expenditure 100
(iii) Non-plan capital expenditure 80
(iv) Revenue receipts 140
(v) Capital receipts net of borrowing 30
(vi) Interest payments 30
29. Giving reasons, explain the treatment assigned to the following whileestimating national income : 4
(i) Payment of income tax by a firm
(ii) Festival gift to employees
30. Explain the role of the following in correcting deficient demand in aneconomy :
(i) Government expenditure
(ii) Legal reserve
Or
Explain the role of the following in correcting inflationary gap in aneconomy: 6
(i) Open market operations
(ii) Government expenditure

109 XII – Economics
31. How do commercial banks create credit? 6
32. Calculate National Income and Personal Disposable Income from thefollowing : 6
(Rs. Crore)
(i) Personal tax 150
(ii) Net imports (–) 10
(iii) Private final consumption expenditure 700
(iv) Private income 600
(v) Undistributed profit 20
(vi) Net domestic capital formation 120
(vii) Government final consumption expenditure 200
(viii) Net factor income to abroad (–) 5
(ix) Corporation tax 100
(x) Net indirect tax 105
32. Calculate 'Net National Product at Factor Cost' and 'Gross NationalDisposable Income' from the following : 6
(Rs. Crore)
(i) Profits 200
(ii) Net current transfers to abroad (–) 10
(iii) Royalty 10
(iv) Wages and salaries 600
(v) Consumption of fixed capital 60
(vi) National debt interest 8
(vii) Interest paid by production units 120
(viii) Social security contributions by employers 100
(ix) Net factor income to abroad (–) 20
(x) Rent 50
(xi) Net indirect tax 70

XII – Economics 110
SET II
Time : 3 Hours Maximum Marks : 100
General Instructions :
(i) All questions in both the sections are compulsory.
(ii) Marks for questions are indicated against each.
(iii) Question Nos. 1–5 and 17–21 are very short-answer questions carrying 1mark each. They are required to be answered in one sentence each.
(iv) Questions Nos. 6-10 and 22-26 are short-answer questions carrying 3marks each.
(v) Question Nos. 11-13 and 27-29 are also short-answer questions carrying4 marks each. Answer to them should not normally exceed 70 words each.
(vi) Question Nos. 14-16 and 30-32 are long-answer questions carrying 6marks each. Answer to them should not normally exceed 100 words each.
(vii) Answer should be brief and to the point and the above word limit beadhered to as far as possible.
1. Define a budget line. 1
2. What is meant by inferior good in economics? 1
3. In which market form can a firm not influence the price of the product?1
4. Define monopoly. 1
5. What can you say about the number of buyers and sellers undermonopolistic competition? 1
6. Explain the effect of the following on the price elasticity of demand of acommodity : 3
(i) Number of substitutes.
(ii) Nature of commodity

111 XII – Economics
7. Explain any two causes of 'increase' in demand of a commodity.
Or
Explain the inverse relationship between price and quantity demand of acommodity. 3
8. A firm's average fixed cost, when it produces 2 units, is Rs. 30. Its averagetotal cost schedule is given below. Calculate its marginal cost and averagevariable cost at each level of output. 3
Output (units) 1 2 3
Average Total Cost (Rs.) 80 48 40
9. Total revenue is Rs. 400 when the price of the commodity is Rs. 2 per unit.When price rises to Rs. 3 per unit, the quantity supplied is 300 units.Calculate the price elasticity of supply. 3
10. Why is the number of firms small in an oligopoly market? Explain. 3
11. Explain the problem of 'how to produce'.
Or
Explain the properties of PPC. 4
12. When price of a commodity falls by Re. 1 per unit, its quantity demandedrises by 3 units. Its price elasticity of demand is (–) 2. Calculate its quantitydemanded if the price before the change was Rs. 10 per unit. 4
13. How does the equilibrium price of a 'normal' commodity change whenincome of its buyers falls? Explain the chain of effects. 4
14. State whether the following statements are true or false. Give reasons foryour answer : 6
(i) When marginal revenue is constant and not equal to zero, thentotal revenue will also be constant.
(ii) As soon as marginal cost starts rising, average variable cost alsostarts rising.
(iii) Total product always increases whether there is increasing returnsor diminishing returns to a factor.
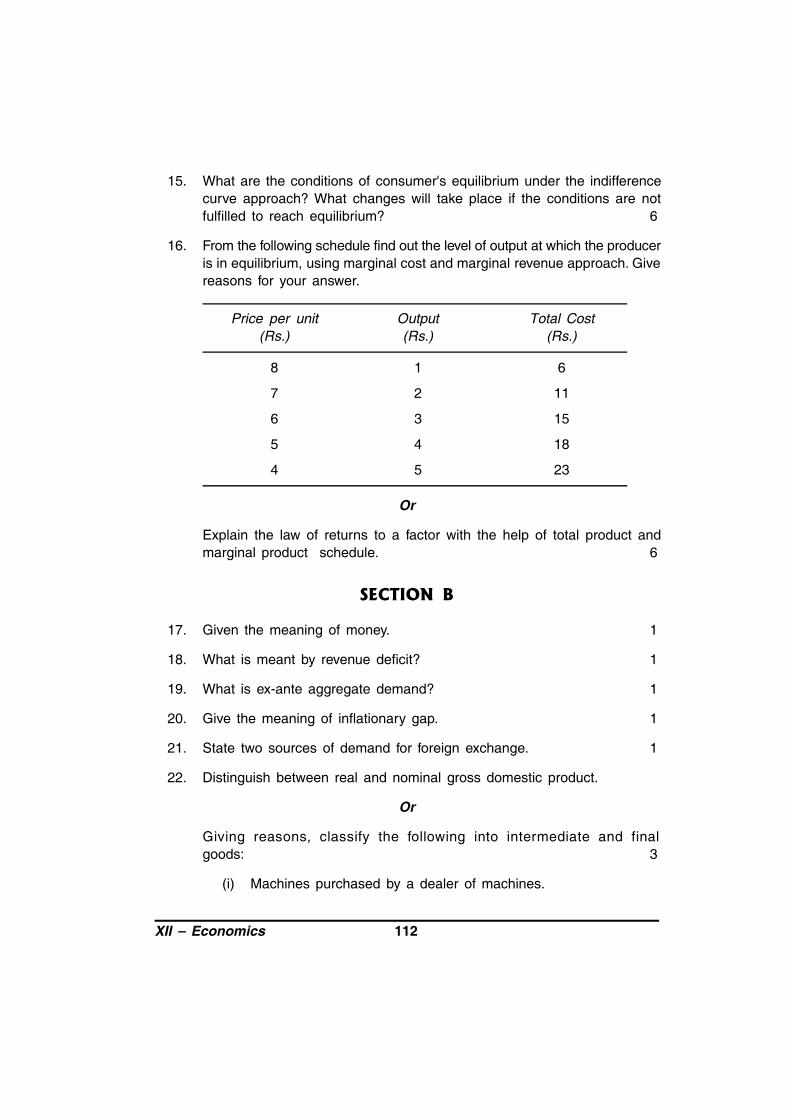
XII – Economics 112
15. What are the conditions of consumer's equilibrium under the indifferencecurve approach? What changes will take place if the conditions are notfulfilled to reach equilibrium? 6
16. From the following schedule find out the level of output at which the produceris in equilibrium, using marginal cost and marginal revenue approach. Givereasons for your answer.
Price per unit Output Total Cost(Rs.) (Rs.) (Rs.)
8 1 6
7 2 11
6 3 15
5 4 18
4 5 23
Or
Explain the law of returns to a factor with the help of total product andmarginal product schedule. 6
SECTION B
17. Given the meaning of money. 1
18. What is meant by revenue deficit? 1
19. What is ex-ante aggregate demand? 1
20. Give the meaning of inflationary gap. 1
21. State two sources of demand for foreign exchange. 1
22. Distinguish between real and nominal gross domestic product.
Or
Giving reasons, classify the following into intermediate and finalgoods: 3
(i) Machines purchased by a dealer of machines.
113 XII – Economics
(ii) A car purchased by a household.
23. Explain the 'banker to the government' function of the central bank. 3
24. Explain the allocation function of a government budget. 3
25. Distinguish between autonomous and accommodating transactions ofbalance of payments account. 3
26. Giving two examples, explain why there is a rise in demand for a foreigncurrency when its price falls. 3
27. How does a commercial bank create money?
Or
Explain how do 'open market operations' by the central bank affect moneycreation by commercial banks. 4
28. Giving reasons, state whether the following statements are true orfalse: 4
(i) When marginal propensity to consumer is zero, the value ofinvestment multiplier will also be zero.
(ii Value of average propensity to save can never be less than zero.
29. Distinguish between : 4
(i) Capital expenditure and Revenue expenditure.
(ii) Fiscal deficit and Primary deficit
30. How will you treat the following while estimating national income of India?Give reasons for your answer.
(i) Dividend received by a foreigner from investment in shares of anIndian company.
(ii) Profits earned by a branch of an Indian Bank in Canada.
(iii) Scholarship given to Indian students studying in India by a foreigncompany.
Or

XII – Economics 114
Explain the problem of double counting in estimating national income, withthe help of an example. Also explain two alternative ways of avoiding theproblem. 6
31. In an economy the equilibrium level of income is Rs. 12,000 crore. Theratio of marginal propensity to consume and marginal propensity to saveis 3:1. Calculate the additional investment needed to reach a new equilibriumlevel of income of Rs. 20,000 crore. 6
32. Calculate (a) Gross domestic product at market price, and (b) Factorincome from abroad from the following data : (3+3) = 6
(Rs. in crores)
(i) Profits 500
(ii) Exports 40
(iii) Compensation of employees 1,500
(iv) Gross national product at factor cost 2,800
(v) Net current transfers from rest of the world 90
(vi) Rent 300
(vii) Interest 400
(viii) Factor income to abroad 120
(ix) Net indirect taxes 250
(x) Net domestic capital formation 650
(xi) Gross fixed capital formation 700
(xii) Change in stock 50