the busy java developer's guide to websphere …€¦ · may 1, 2010 ibm websphere application...
TRANSCRIPT
IBM WebSphere Application ServerMay 1, 2010
THE BUSY JAVA DEVELOPER'S GUIDE TO
WEBSPHERE DEBUGGING &
TROUBLESHOOTING
ROHIT KELAPURE
IBM ADVISORY SOFTWARE ENGINEER
HTTP://WWW.LINKEDIN.COM/IN/ROHITKELAPURE
HTTP://TWITTER.COM/RKELA
HTTP://WASDYNACACHE.BLOGSPOT.COM/
2
Agenda
WebSphere Application Server component overview
IBM Support Assistant
JVM Troubleshooting Tools
WebSphere Problem Determination Tools
Scenario based problem resolution
How customers get in trouble
BadApp Demo
Q&A
3
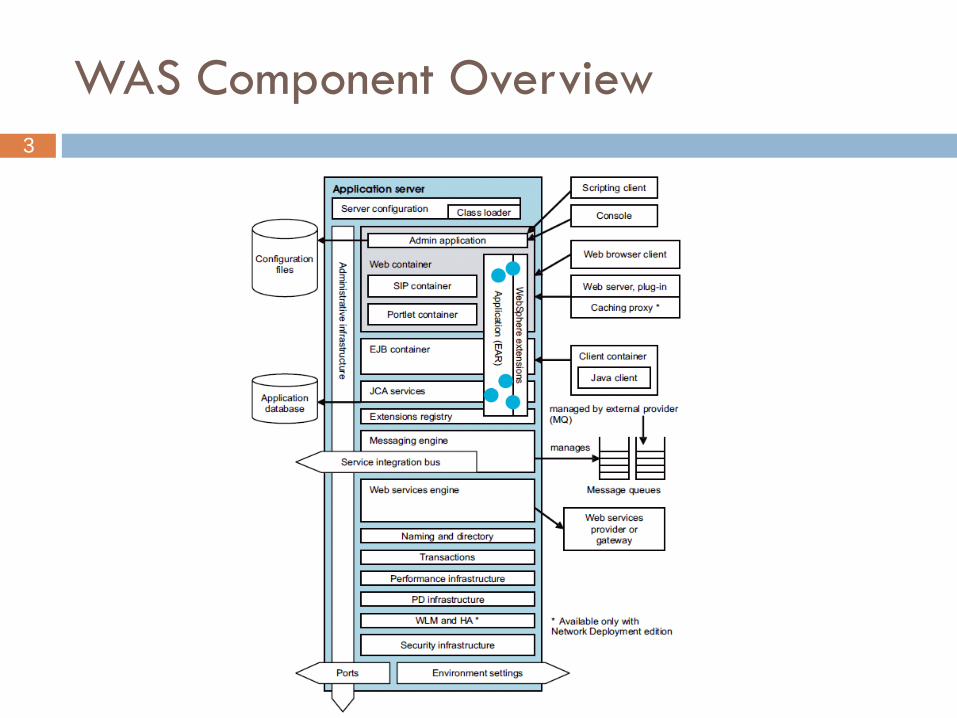
WAS Component Overview
4
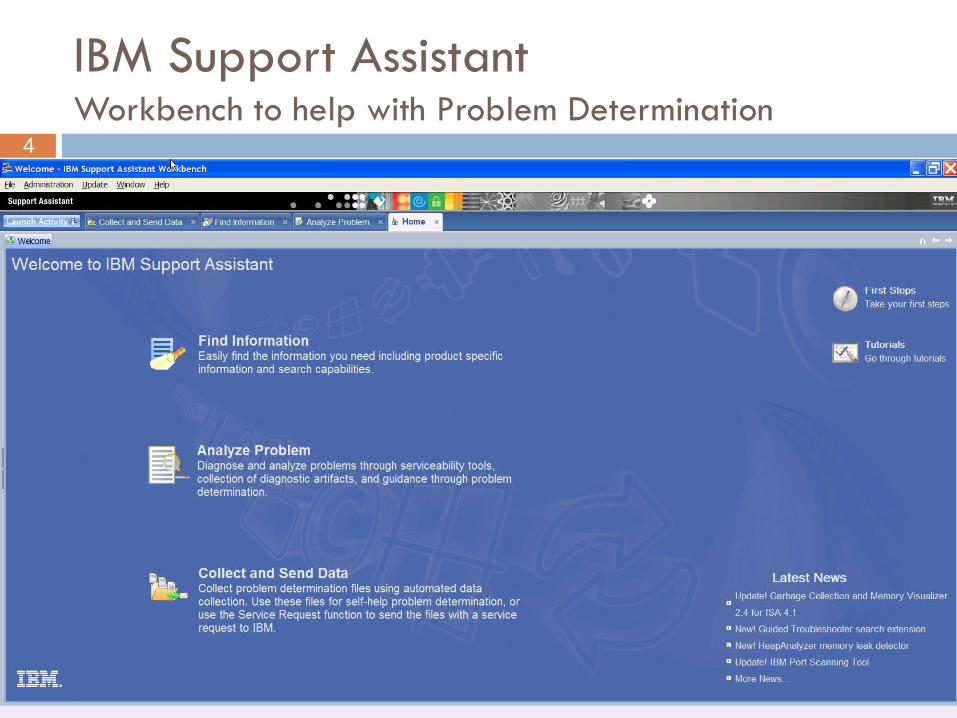
IBM Support Assistant Workbench to help with Problem Determination
5
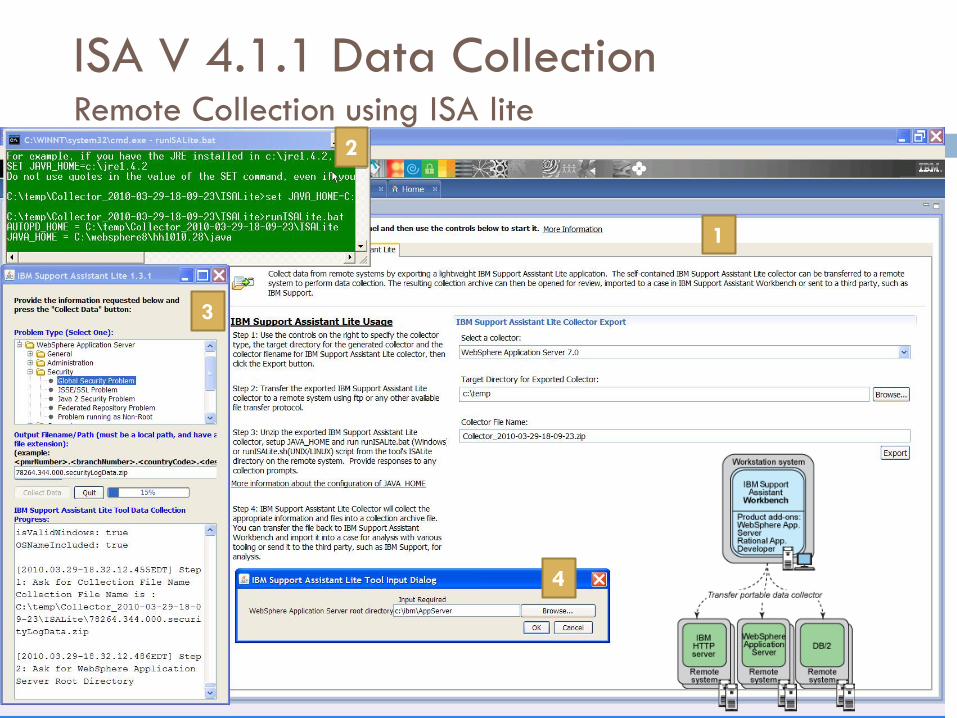
ISA V 4.1.1 Data Collection Remote Collection using ISA lite
1
2
3
4
6
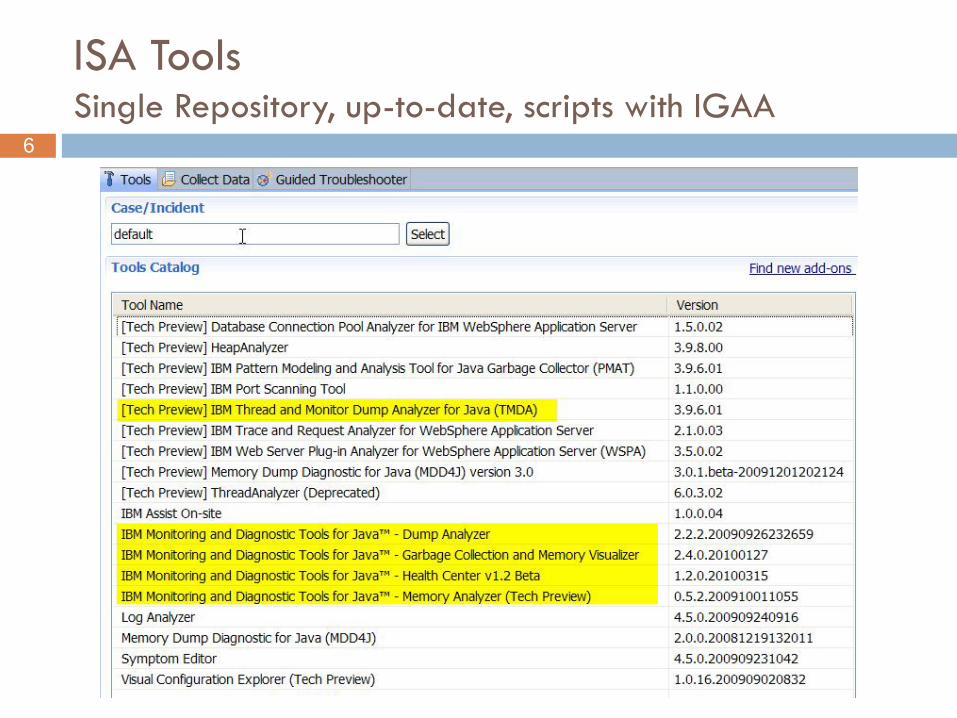
ISA ToolsSingle Repository, up-to-date, scripts with IGAA
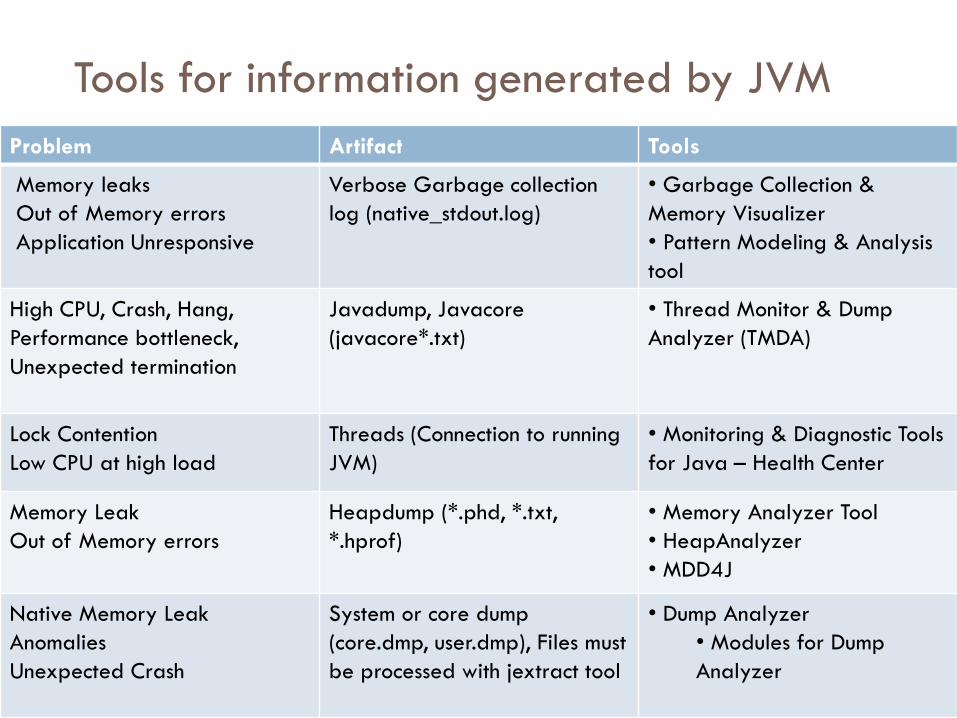
7Problem Artifact Tools
Memory leaks
Out of Memory errors
Application Unresponsive
Verbose Garbage collection
log (native_stdout.log)
• Garbage Collection &
Memory Visualizer
• Pattern Modeling & Analysis
tool
High CPU, Crash, Hang,
Performance bottleneck,
Unexpected termination
Javadump, Javacore
(javacore*.txt)
• Thread Monitor & Dump
Analyzer (TMDA)
Lock Contention
Low CPU at high load
Threads (Connection to running
JVM)
• Monitoring & Diagnostic Tools
for Java – Health Center
Memory Leak
Out of Memory errors
Heapdump (*.phd, *.txt,
*.hprof)
• Memory Analyzer Tool
• HeapAnalyzer
• MDD4J
Native Memory Leak
Anomalies
Unexpected Crash
System or core dump
(core.dmp, user.dmp), Files must
be processed with jextract tool
• Dump Analyzer
• Modules for Dump
Analyzer
Tools for information generated by JVM
8
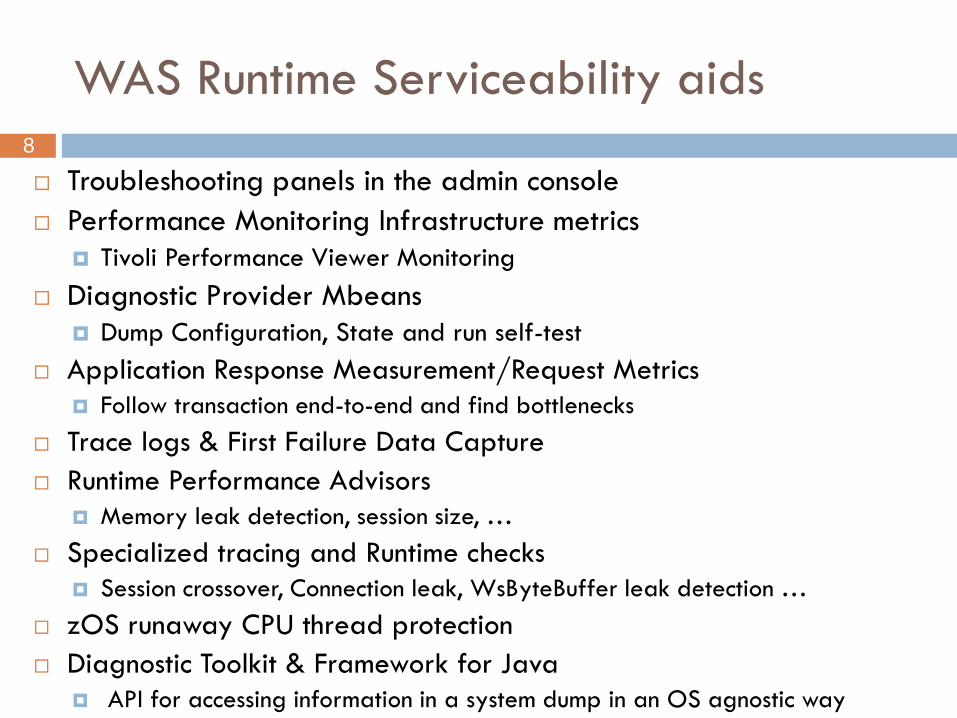
Troubleshooting panels in the admin console
Performance Monitoring Infrastructure metrics
Tivoli Performance Viewer Monitoring
Diagnostic Provider Mbeans
Dump Configuration, State and run self-test
Application Response Measurement/Request Metrics
Follow transaction end-to-end and find bottlenecks
Trace logs & First Failure Data Capture
Runtime Performance Advisors
Memory leak detection, session size, …
Specialized tracing and Runtime checks
Session crossover, Connection leak, WsByteBuffer leak detection …
zOS runaway CPU thread protection
Diagnostic Toolkit & Framework for Java
API for accessing information in a system dump in an OS agnostic way
WAS Runtime Serviceability aids
9
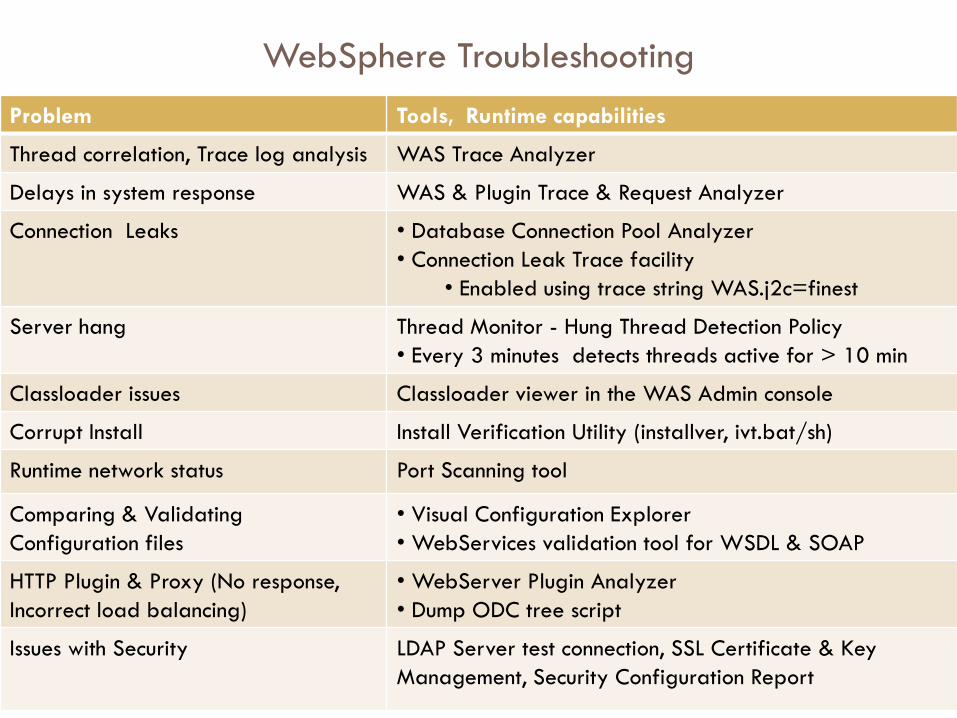
Problem Tools, Runtime capabilities
Thread correlation, Trace log analysis WAS Trace Analyzer
Delays in system response WAS & Plugin Trace & Request Analyzer
Connection Leaks • Database Connection Pool Analyzer
• Connection Leak Trace facility
• Enabled using trace string WAS.j2c=finest
Server hang Thread Monitor - Hung Thread Detection Policy
• Every 3 minutes detects threads active for > 10 min
Classloader issues Classloader viewer in the WAS Admin console
Corrupt Install Install Verification Utility (installver, ivt.bat/sh)
Runtime network status Port Scanning tool
Comparing & Validating
Configuration files
• Visual Configuration Explorer
• WebServices validation tool for WSDL & SOAP
HTTP Plugin & Proxy (No response,
Incorrect load balancing)
• WebServer Plugin Analyzer
• Dump ODC tree script
Issues with Security LDAP Server test connection, SSL Certificate & Key
Management, Security Configuration Report
WebSphere Troubleshooting

One more tool and I am going to scream
11
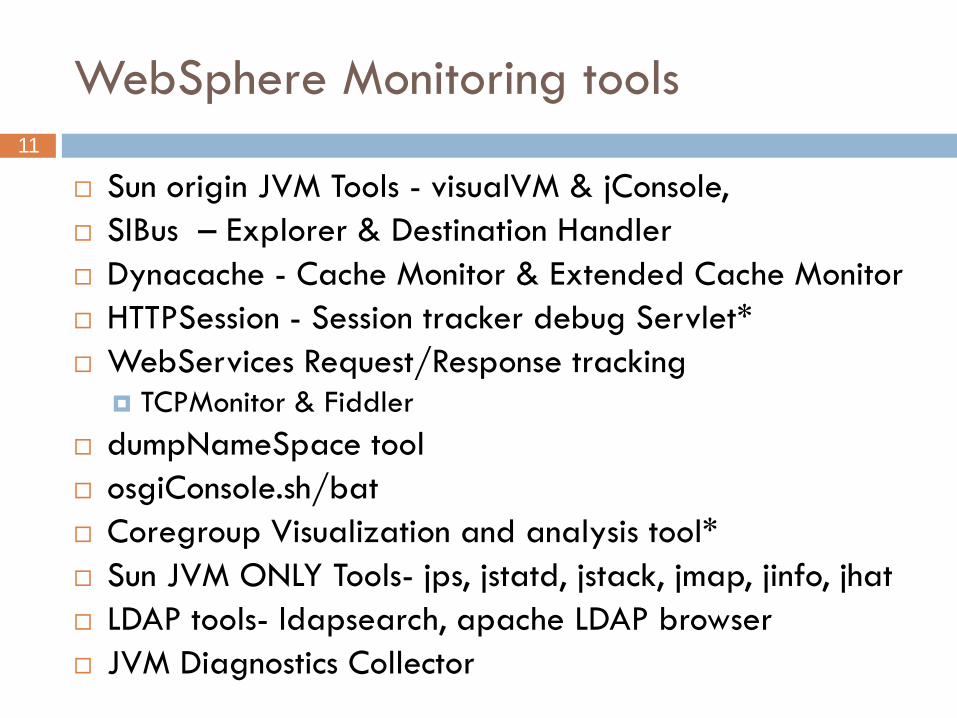
Sun origin JVM Tools - visualVM & jConsole,
SIBus – Explorer & Destination Handler
Dynacache - Cache Monitor & Extended Cache Monitor
HTTPSession - Session tracker debug Servlet*
WebServices Request/Response tracking
TCPMonitor & Fiddler
dumpNameSpace tool
osgiConsole.sh/bat
Coregroup Visualization and analysis tool*
Sun JVM ONLY Tools- jps, jstatd, jstack, jmap, jinfo, jhat
LDAP tools- ldapsearch, apache LDAP browser
JVM Diagnostics Collector
WebSphere Monitoring tools
12
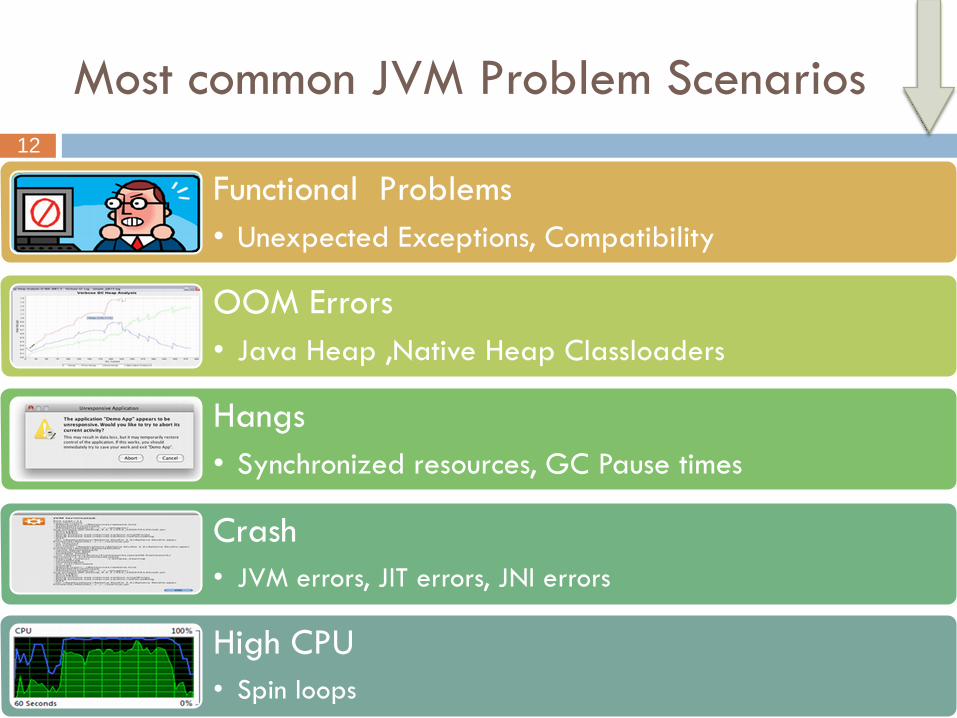
Most common JVM Problem Scenarios
Functional Problems
• Unexpected Exceptions, Compatibility
OOM Errors
• Java Heap ,Native Heap Classloaders
Hangs
• Synchronized resources, GC Pause times
Crash
• JVM errors, JIT errors, JNI errors
High CPU
• Spin loops
13
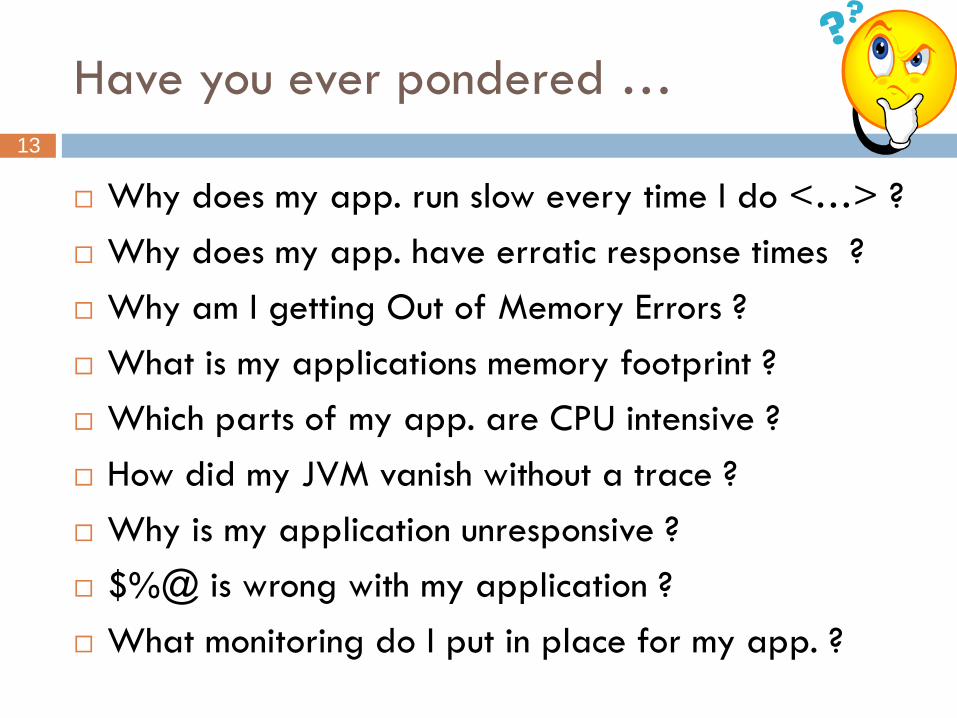
Why does my app. run slow every time I do <…> ?
Why does my app. have erratic response times ?
Why am I getting Out of Memory Errors ?
What is my applications memory footprint ?
Which parts of my app. are CPU intensive ?
How did my JVM vanish without a trace ?
Why is my application unresponsive ?
$%@ is wrong with my application ?
What monitoring do I put in place for my app. ?
Have you ever pondered …
14
Understand impact of activity on WAS components Look at the thread & method profiles in the IBM Java Health Center
Set IBM JVM method & dump trace - pinpoint performance problems.
Shows entry & exit times of any Java method Method to trace to file for all methods in tests.mytest.package
-Xtrace:maximal=mt,output=trace.out,methods={tests/mytest/*.*}
Allows taking javadump, heapdump, etc when a method is hit Dump javacore when method testInnerMethod in an inner class
TestInnerClass of a class TestClass is called -Xtrace:trigger=method{com/ibm/TestClass$TestInnerClass.testInnerMethod,javadump,,,5}
-Xtrace and -Xdump can be triggered on a huge range of events … with filters and ranges gpf, user, abort, fullgc, slow, allocation, thrstop, throw …
Stack traces, tool launching
Why does my app run slow when I do xxx ?
15
Verbose gc should be enabled by default
(<2%) impact on performance
GCMV &PMAT : Visualize gc output & look @ recos.
In use space after GC
Positive gradient indicates memory leak
Increased load (use for capacity plan) OR memory leak (take HDs for PD.)
Chose the right GC policy -Xgcpolicy:optthruput - optimized for “batch” type applications, consistent allocation profile
-Xgcpolicy:optavgpause - tight responsiveness criteria, allocations of large objects
-Xgcpolicy:gencon - high rates of object “burn”, large # of transitional objects
-Xgcpolicy:subpools - 12, 16 core SMP systems with allocation contention (AIX only)
GC overhead > 10% wrong policy or more tuning
Enable compressed References enabled for 64 bit JVM ?
Why does my application have erratic
response times ?
16
Java 1.4.* -look for heap fragmentation (rare for Java 5/6)
Set –Xp and –Xk for pinned and dosed objects
JVM Heap sized incorrectly IBM JDK Team does NOT recommend Xms == Xmx
GC adapts heap size to keep occupancy [40, 70]%
Determine heap occupancy of the app. under load Xmx = 43% larger than max. occupancy of app.
For 700MB occupancy , 1000MB Max. heap is reqd. (700 +43% of 700)
Analyze heapdumps & system dumps with dump tools Lack of Java heap or Native heap
Finding which methods allocated large objects Prints stacktrace for all objects above 1K
-Xdump:stack:events=allocation,filter=#1k
Enable Java Heap and Native heap monitoring JMX and PMI metrics output by WAS JVM
Classloader exhaustion in pre Java 5 SR3
Why am I getting Out Of Memory
Errors ?
17
HPROF – profiler shipped with JDK – uses JVMTI
Analysis of memory usage -Xrunhprof:heap=all
Performance Inspector tools - JPROF Java Profiling Agent
Capture state of the Java Heap later processed by HDUMP
Use MAT to investigate heapdumps & system dumps
Find large clumps, Inspect those objects, What retains them ? Why is this object not being garbage collected
List Objects > incoming refs, Path to GC roots, Immediate dominators
Limit analysis to a single application in a JEE environment
Dominator tree grouped by Class Loader
Set of objects that can be reclaimed if we could delete X
Retained Size Graphs
Traditional memory hogs like Session, Dynacache
Use Object Query Language (OQL)
What is my applications memory
footprint ?
18
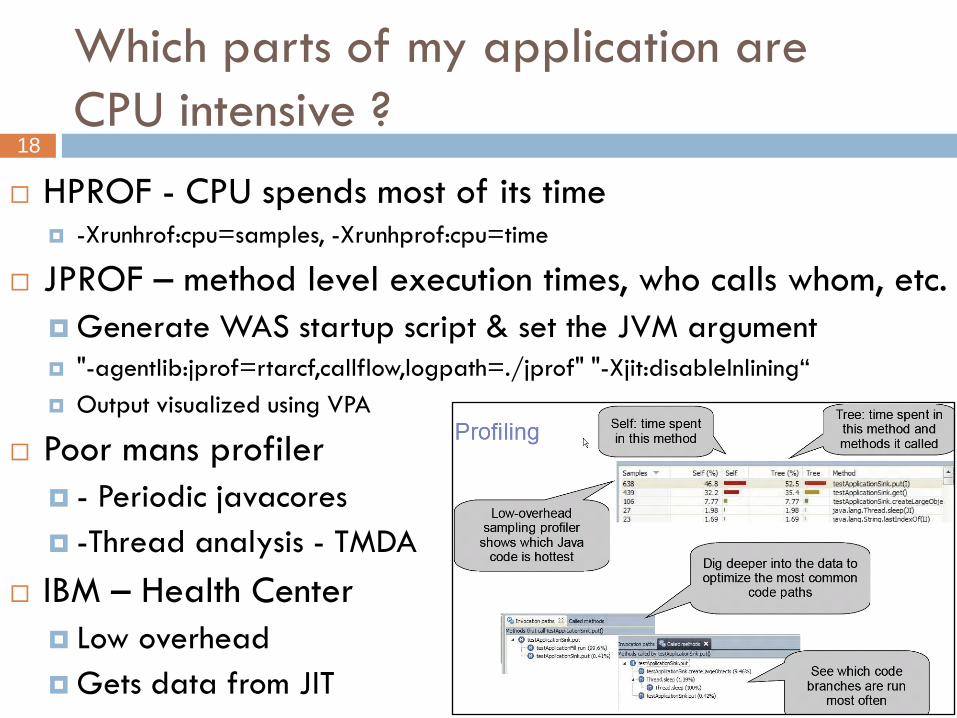
HPROF - CPU spends most of its time -Xrunhrof:cpu=samples, -Xrunhprof:cpu=time
JPROF – method level execution times, who calls whom, etc.
Generate WAS startup script & set the JVM argument
"-agentlib:jprof=rtarcf,callflow,logpath=./jprof" "-Xjit:disableInlining“
Output visualized using VPA
Poor mans profiler
- Periodic javacores
-Thread analysis - TMDA
IBM – Health Center
Low overhead
Gets data from JIT
Which parts of my application are
CPU intensive ?
19
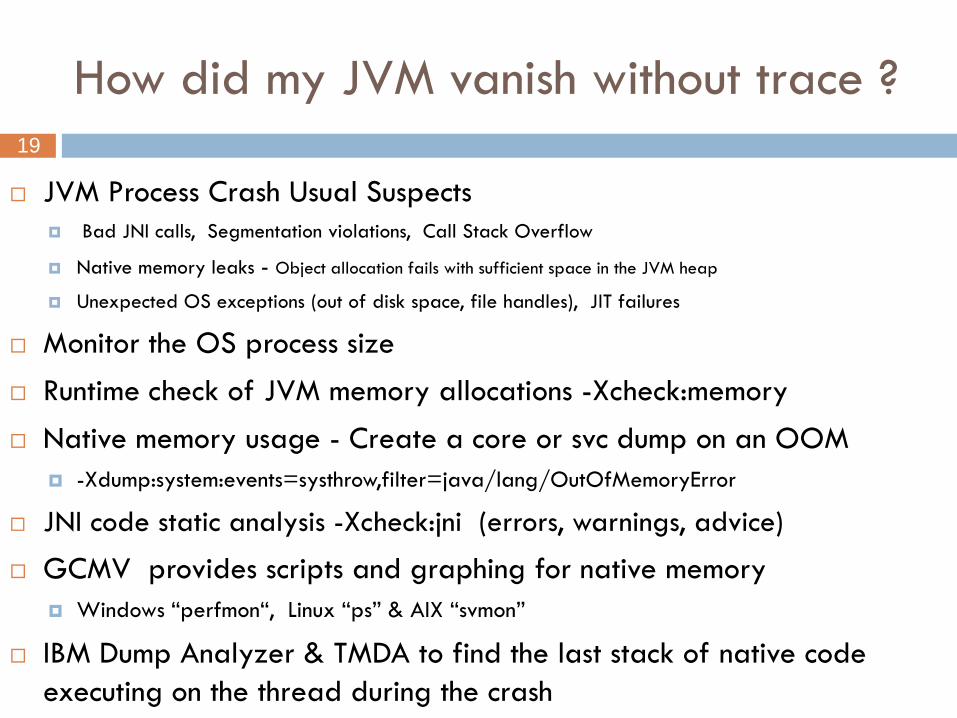
JVM Process Crash Usual Suspects
Bad JNI calls, Segmentation violations, Call Stack Overflow
Native memory leaks - Object allocation fails with sufficient space in the JVM heap
Unexpected OS exceptions (out of disk space, file handles), JIT failures
Monitor the OS process size
Runtime check of JVM memory allocations -Xcheck:memory
Native memory usage - Create a core or svc dump on an OOM
-Xdump:system:events=systhrow,filter=java/lang/OutOfMemoryError
JNI code static analysis -Xcheck:jni (errors, warnings, advice)
GCMV provides scripts and graphing for native memory
Windows “perfmon“, Linux “ps” & AIX “svmon”
IBM Dump Analyzer & TMDA to find the last stack of native code
executing on the thread during the crash
How did my JVM vanish without trace ?
20
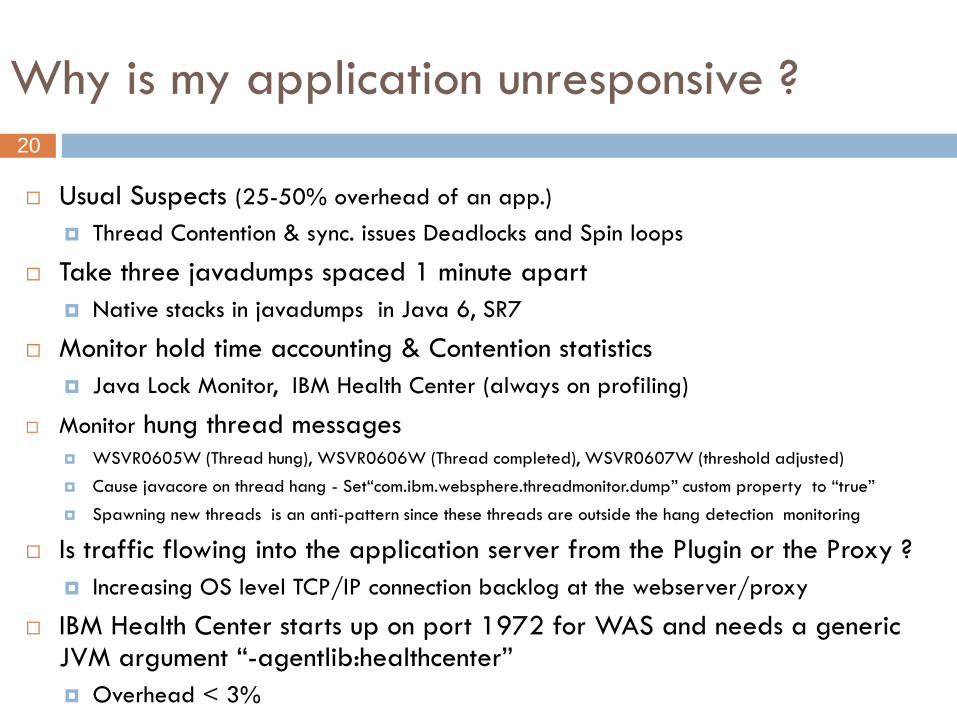
Usual Suspects (25-50% overhead of an app.)
Thread Contention & sync. issues Deadlocks and Spin loops
Take three javadumps spaced 1 minute apart
Native stacks in javadumps in Java 6, SR7
Monitor hold time accounting & Contention statistics
Java Lock Monitor, IBM Health Center (always on profiling)
Monitor hung thread messages WSVR0605W (Thread hung), WSVR0606W (Thread completed), WSVR0607W (threshold adjusted)
Cause javacore on thread hang - Set“com.ibm.websphere.threadmonitor.dump” custom property to “true”
Spawning new threads is an anti-pattern since these threads are outside the hang detection monitoring
Is traffic flowing into the application server from the Plugin or the Proxy ?
Increasing OS level TCP/IP connection backlog at the webserver/proxy
IBM Health Center starts up on port 1972 for WAS and needs a generic JVM argument “-agentlib:healthcenter”
Overhead < 3%
Why is my application unresponsive ?
21
Finding the Bottleneck CPU, Memory, I/O, Network
Systems Resource Usage
top, perfmon, svmon, tasklist, ps, <add your favorite utility here …>
JVM Heap Sizing Setting Correct GC Policy, Heap occupancy
JIT Compilation & Performance
Application Profiling Inbuilt hprof, Health Center
Free - Performance Inspector tools (JPROF, TPROF, JLM, Jinsight …)
Commercial- RAD, Jprofiler, Yourkit …
OS specific tuning Setting TCP TIME_WAIT
What is wrong with my application ?General problem determination steps
22
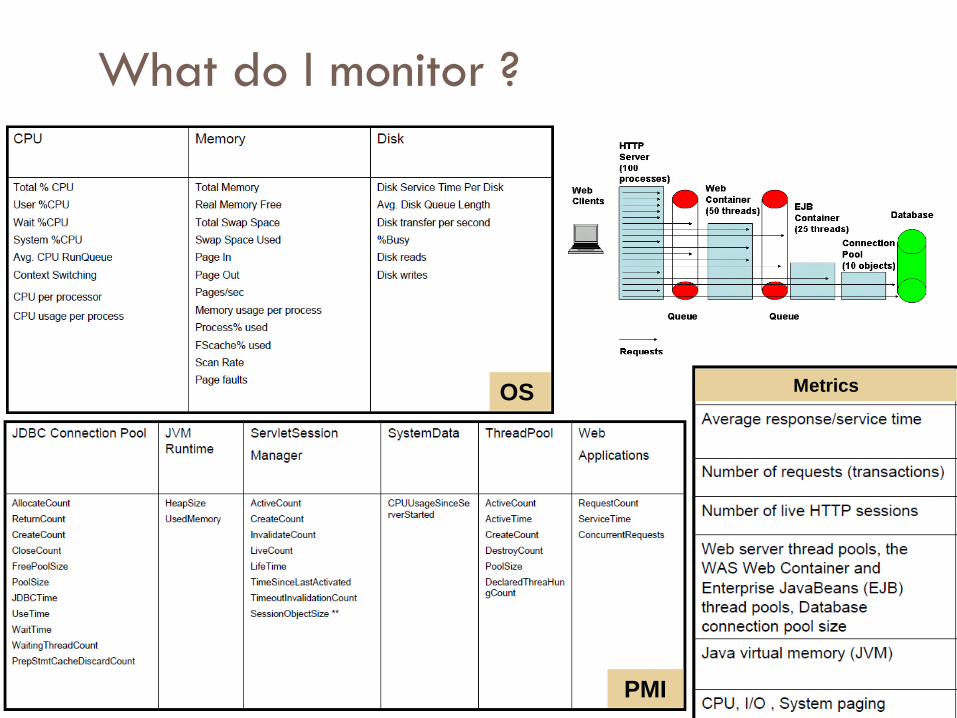
What do I monitor ?
OS
PMI
Metrics
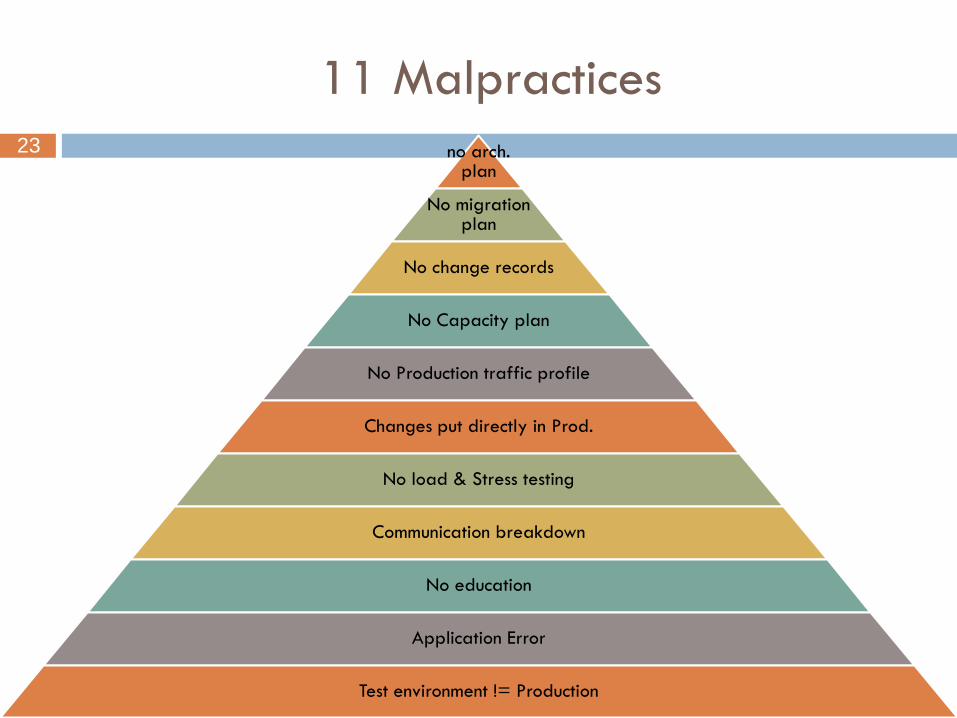
23 no arch. plan
No migration plan
No change records
No Capacity plan
No Production traffic profile
Changes put directly in Prod.
No load & Stress testing
Communication breakdown
No education
Application Error
Test environment != Production
11 Malpractices

24
Demo, Q&A
25
Daniel Julin (IBM Lab)
John Pape (SWAT)
Kevin Grigorenko (SWAT)
Art Jolin (ISSW)
Chris Bailey (JDK)
Katie Barett (Serviceability
team)
Russell Wright (ISA)
Thomas Alcott (Tech. Sales)
I would like to thank …
Please google & read their blogs & articles

26