the evolution to real value - 日本特殊陶業株式会社 · the evolution to real value annual...
TRANSCRIPT

The Evolution to Real Value
Annual Report 2014Fiscal year ended March 31, 2014
14-18 Takatsuji-cho, Mizuho-ku, Nagoya 467-8525, Japanhttp://www.ngkntk.co.jp
An
nu
al R
ep
ort 2
01
4
Printed in Japan
005_0653701372608.indd 1-3 2014/08/13 15:41:37

Strong Potential for Future Growth
090_0653701372608.indd 2 2014/08/13 14:44:52
NGK SPARK PLUG ANNUAL REPORT 2014
ProfileNGK SPARK PLUG CO., LTD., established in 1936 as a manufacturer of spark plugs, has always cultivated ceramics as its core competence. The Company has a distinguished track record of applying the expertise cultivated in the field of ceramics in other fields to create new value. Today, NGK SPARK PLUG CO., LTD. is a leading manufacturer supplying its products to major manufacturers worldwide in the automotive, electronics and other industries. The Company’s prod-ucts are vital components of a host of finished products manufactured on production lines the world over. NGK SPARK PLUG CO., LTD. is at the forefront of innovation in the information and communications and automotive industries that are destined to underpin the 21st century society. The Company is also increasingly active in the medical field, attuning its expertise to the needs of the aging society, and in the environmental sphere. Drawing on a wealth of experience, NGK SPARK PLUG CO., LTD. continues to deploy its technological prowess in the service of its customers and society.
Contents
● Profile● Global Network● Financial Highlights● A Message from the President● Special Feature● Review of Operations● CSR● CSR [Governance]● CSR [Social]● CSR [Environment]● Six-Year Summary●Management’s Discussion and Analysis● Consolidated Balance Sheets● Consolidated Statements of Income● Consolidated Statements of Comprehensive Income● Consolidated Statements of Changes in Net Assets● Consolidated Statements of Cash Flows● Notes to Consolidated Financial Statements● Independent Auditor’s Report● Stock Information● Corporate Data● Directors, Corporate Officers and Corporate Auditors
1
2
4
6
10
14
17
18
20
21
22
23
28
30
31
32
33
34
46
47
48
49
No.1Spark Plugs World Share
¥329,758 million
Net Sales
¥51,662 million
OperatingIncome
11.5%ROE
83%Rate ofOverseas Sales
Japan 17%
North America 26%
Europe 25%
Asia 19%
Latin America 8%Other 5%
Representative Director, Chief Executive Officerand President Officer
Shinichi Odo*1
Takeshi Nakagawa
Representative Director, Vice Chief Executiveand Vice President Officer
Takafumi Oshima*1
Shinji Shibagaki*1
Shogo Kawajiri
Representative Director, Vice Chief Executiveand Vice President Officer
Member of the BoardVice President Officer
Member of the BoardSenior Executive Officer
Kenichi Masuda*3
Member of the BoardExecutive Officer
TeppeiOkawa
Masami Asai
Shigehisa Sao*3
Standing Corporate Auditor
Hideyuki Koiso
MorihikoOtaki*2
KanemaruYasui*2
Keiichi Matsunari
Member of the Board
Corporate Auditor
Executive Officer
Hitoshi Iimi
Takahiro Suzuki
Takao Hamada
Tadao Kawai
Corporate Officer
Hisashi Nakanishi
Takeshi Kawai
NoboruIshida
YoshihiroMatsubara
TakioKojima
MasahikoOkuyama
YoshitakaNarita
KozoYamasaki
KozoAmano
NobuyukiTokioka
Corporate Officer
*1Representative Director*2Outside Director
*3Outside Auditor
(As of June 27, 2014)
Directors, Corporate Officers and Corporate Auditors
005_0653701372608.indd 4-6 2014/08/13 15:41:41

Strong Potential for Future Growth
090_0653701372608.indd 1 2014/08/13 14:44:52
NGK SPARK PLUG ANNUAL REPORT 2014 1
Forward-Looking StatementsThis Annual Report contains information about forward-looking statements related to such matters as the Company’s plans, strategies, and business results. These forwardlooking statements represent judgments made by the Company based on information available at present and are inherently subject to a variety of risks and uncertainties. The Company’s actual activities and business results could differ significantly due to changes including, but not limited to, changes in the economic environment, business environment, ex-change rates, laws, regulations, government policies, political circumstances, market demand for products, and price competition.
SloganWith established trust and confidence inside and outside the company, we aim to contribute to the peoples of the world by creating and putting at their disposal new values for the future.
1. CommitmentWith full use of the most suitable technology and our accumulated experience, we continue striving to offer new values to the peoples of the world.
2. Management PolicyWe offer a working environment in which each one of us is encouraged to make full use of his or her person-ality and capabilities.With all our power we are dedicated to pursue management based on trust and confidence.
3. Action GuidelineEver onward ! Always mindful of what is the best course, we swiftly put it into action.
CorporatePhilosophy
Commitment
ManagementPolicy
ActionGuideline
12 3
Automotive Components GroupIn the Automotive Components Business, we manufacture and sell spark plugs, glow plugs, various automotive sensors, ceramic engine parts and other automotive components.
In Japan, NGK SPARK PLUG CO., LTD. manufactures and sells these products. In addition, the Company supplies raw materials and parts to Ceramic Sensor Co., Ltd., Nittoku Seisakusho Co., Ltd, and five other sub-sidiaries in Japan to which manufacturing is consigned and from which the Company purchases finished products, semi-products and assembly parts and sells them. Overseas, Ceramica e Velas de Ignicao NGK do Brasil Ltda., a subsidiary in Brazil, is an integrated operation that manufactures and sells spark plugs, and NGK Spark Plugs (U.S.A.), Inc. and eleven other manufac-turing and sales subsidiaries and associates in North America, China, South Korea, Southeast Asia and Europe purchase parts and raw materials from the Company, assemble finished products and sell them in their respective regions. Some of the semi-products and components manufactured at overseas factories are utilized as assembly parts by the Company and other manufacturing sites.
In addition, the above-mentioned overseas manufacturing and sales subsidiaries, NGK Spark Plug Europe GmbH and ten other overseas sales subsidiaries sell finished products procured from the Company and the overseas manufacturing subsidiaries to customers in their regions.
Technical Ceramics GroupSemiconductor Division
In the Semiconductor Business, we manufacture and sell IC packages and other semiconductor components.
In Japan, NGK SPARK PLUG CO., LTD. and one associate manufacture and sell these components. In addition, the Company supplies raw materi-als and parts to NTK Ceramic Co., Ltd., a subsidiary, to which manufactur-ing is consigned and from which the Company purchases finished prod-ucts, semi-products and parts and sells them.
Overseas, NTK Technologies, Inc. and four other overseas sales subsid-iaries sell finished products procured from the Company to customers in their regions.
Ceramics Division
In the Ceramics Business, we manufacture and sell cutting tools for ma-chining, components for semiconductor manufacturing equipment, and other ceramics products for industrial applications.
In Japan, NGK SPARK PLUG CO., LTD. manufactures and sells these products. In addition, the Company supplies raw materials and parts to Kamioka Ceramic Co., Ltd. and three other subsidiaries and associates in Japan to which manufacturing is consigned, purchases finished products, semi-products and parts from them and sells them. Overseas, Ceramica e Velas de Ignicao NGK do Brasil Ltda., a subsidiary in Brazil, is an integrated operation that manufactures and sells ceramics products for industrial ap-plications and NTK Technical Ceramics Korea Co., Ltd. purchases semi-products and some raw materials from the Company, assembles finished cutting tools and sells them directly to customers or via the Company and its sales subsidiaries.
NGK Spark Plug Europe GmbH and eight other overseas sales subsid-iaries sell finished products procured from the Company and the above-mentioned overseas manufacturing subsidiaries to customers in their regions.
Our Operation
010_0653701372608.indd 1 2014/08/20 16:52:20

NGK SPARK PLUG ANNUAL REPORT 20142
Global Network
NGK Spark Plugs (U.S.A.), Inc. NGK Spark Plugs Malaysia Berhad Siam NGK Spark Plug Co., Ltd. P.T. NGK Busi Indonesia
NGK Spark Plugs (Thailand) Co., Ltd. Woojin Industry Co., Ltd. NGK Spark Plugs (France) S.A.S.Ceramica e Velas de Ignicao NGK do Brasil Ltda.
NTK Technical Ceramics Korea Co., Ltd. NGK Spark Plug (Shanghai) Co., Ltd. NGK Spark Plugs (India) Pvt, Ltd.NGK Spark Plugs SA (Pty) Ltd.
NGK Spark Plugs Canada Limited
NGK Spark Plugs (India) Pvt. Ltd.
NGK Spark Plugs SA (Pty) Ltd.
NGK Spark Plugs (Philippines), Inc.
NGK Spark Plugs (UK) Ltd.
NGK Spark Plug Europe GmbH
LLC NGK Spark Plugs (Eurasia)
NGK Spark Plug Middle East FZE
Headquarters
Headquarters
NGK Spark Plugs Malaysia Berhad
Siam NGK Spark Plug Co.,LtdNGK Spark Plugs (Thailand)Co.,Ltd
SparkTec (Thailand) Co.,Ltd
NTK Technical Ceramics Korea Co., Ltd.
Taiwan NGK Spark Plug Co., Ltd.
NGK Spark Plugs (Vietnam) Co., Ltd.
P.T. NGK Busi Indonesia
NGK Spark Plug (Shanghai) Co., Ltd.
NGK Spark Plugs (France) S.A.S.
Ceramica e Velas de Ignicao NGK do Brasil Ltda.
Manufacturing & Sales OrganizationSales OrganizationHolding Company
NGK Spark Plug (Australia) Pty. Ltd.
Woojin Industry Co., Ltd.NTK Technologies, Inc.
Bujias NGK de Mexico S.A. de C.V.
NGK Spark Plugs (U.S.A.) Holding, Inc.Changshu NGK Spark Plug Co., Ltd.
NGK Spark Plugs (U.S.A.), Inc.
Overseas Sites(As of March 31, 2014)
26
Employees(As of March 31, 2014)
12,760
010_0653701372608.indd 2 2014/08/20 16:52:23
NGK SPARK PLUG ANNUAL REPORT 2014 3
Domestic Subsidiaries
Ceramic Sensor Co., Ltd.Production of automotive sensors
Nittoku Seisakusho Co., Ltd.Production of spark plug parts andautomotive sensor parts
Nichiwa Kiki Co., Ltd.Production of spark plug resistorcovers and cables, and automotivesensor parts
Kamioka Ceramic Co., Ltd.Production of glow plugs and cut-ting tools
NTK Ceramic Co., Ltd.Production of IC packages andautomotive sensor parts
SparkTec TONO Co., Ltd.Production of spark plug parts
Nansei Ceramic Co., Ltd.Production of electronic components
Nittoku Unyu Co., Ltd.Transportation of the Companyproducts
Nittoku Alpha Service Co., Ltd.Welfare services for Companyemployees
Overseas Subsidiaries
NGK Spark Plugs (U.S.A.)Holding, Inc.Holding company for U.S.subsidiaries
NGK Spark Plugs (U.S.A.), Inc.Production and sale of spark plugsand automotive sensors, sale ofcutting tools
NTK Technologies, Inc.Sale of semiconductorcomponents and ceramics
NGK Spark Plugs Canada LimitedSale of automotive components
NGK Spark Plug Europe GmbHSale of automotive components,semiconductor componentsand ceramics
NGK Spark Plugs (UK) Ltd.Sale of automotive components,semiconductor componentsand ceramics
NGK Spark Plugs (France) S.A.S.Production of spark plugs, sale ofautomotive components, semiconductor components and ceramics
LLC NGK Spark Plugs (Eurasia)Sale of automotive components
Taiwan NGK Spark Plug Co., Ltd.Sale of automotive components
NTK Technical Ceramics KoreaCo., Ltd.Production and sale of cutting tools
P.T. NGK Busi IndonesiaProduction and sale of spark plugs, sale of automotive sensors
NGK Spark Plug (Shanghai) Co., Ltd.Production and sale of spark plugsand automotive sensors, sale of cutting tools
Changshu NGK Spark Plug Co., Ltd.Production and sales of automotive sensors
NGK Spark Plugs Malaysia BerhadProduction and sale of spark plugs,sale of automotive sensors
NGK Spark Plugs (Philippines), Inc.Sale of spark plugs
Siam NGK Spark Plug Co., Ltd.Production and sale of spark plugsand glow plugs, sale of automotivesensors
NGK Spark Plugs (Thailand) Co., Ltd.Production of automotive sensors, sale of automotive components and ceramics
SparkTec (Thailand) Co.,LtdProduction and sale of spark plug parts
NGK Spark Plugs (Vietnam)Co., Ltd.Sales of automotive components
NGK Spark Plugs (India) Pvt. Ltd.Production and sale of spark plugs,sale of automotive sensors
Ceramica e Velas de Ignicao NGK do Brasil Ltda.Production and sale of automotivecomponents and ceramics
Bujias NGK de Mexico S.A. de C.V.Sale of automotive components
NGK Spark Plug Middle East FZESale of spark plugs
NGK Spark Plugs SA (Pty) Ltd.Production and sale of spark plugs
NGK Spark Plug (Australia) Pty. Ltd.Sale of automotive componentsand ceramics
Associates
Woojin Industry Co., Ltd.Production and sale of automotivecomponents
Tokai Taima Kogu Co., Ltd.Production and sale of mold tools
Eastern Co., Ltd.Production and sale of IC packages
NGK Spark Plugs Canada Limited
NGK Spark Plugs (India) Pvt. Ltd.
NGK Spark Plugs SA (Pty) Ltd.
NGK Spark Plug(Philippines), Inc.
NGK Spark Plugs (UK) Ltd.
NGK Spark Plug Europe GmbH
LLC NGK Spark Plugs (Eurasia)
NGK Spark Plug Middle East FZE
Headquarters
Headquarters
NGK Spark Plugs Malaysia Berhad
Siam NGK Spark Plug Co.,LtdNGK Spark Plugs (Thailand)Co.,Ltd
SparkTec (Thailand) Co.,Ltd
NTK Technical Ceramics Korea Co., Ltd.
Taiwan NGK Spark Plug Co., Ltd.
NGK Spark Plugs (Vietnam) Co., Ltd.
P.T. NGK Busi Indonesia
NGK Spark Plug (Shanghai) Co., Ltd.
NGK Spark Plugs (France) S.A.S.
Ceramica e Velas de Ignicao NGK do Brasil Ltda.
Manufacturing & Sales OrganizationSales OrganizationHolding Company
NGK Spark Plug (Australia) Pty. Ltd.
Woojin Industry Co., Ltd.NTK Technologies, Inc.
Bujias NGK de Mexico S.A. de C.V.
NGK Spark Plugs (U.S.A.) Holding, Inc.Changshu NGK Spark Plug Co., Ltd.
NGK Spark Plugs (U.S.A.), Inc.
Overseas Sites(As of March 31, 2014)
26
Employees(As of March 31, 2014)
12,760
010_0653701372608.indd 3 2014/08/20 16:52:24

NGK SPARK PLUG ANNUAL REPORT 20144
Financial HighlightsNGK SPARK PLUG CO., LTD. and Consolidated SubsidiariesYears ended March 31, 2014, 2013 and 2012
Millions of yen Change (%) Thousands of U.S. dollars
2014 2013 2012 2014/2013 2014
For the year:
Net sales: ¥329,758 ¥302,799 ¥284,746 8.9% $3,201,534
Automotive Components 271,835 248,795 222,636 9.3% 2,639,175
Technical Ceramics:
Semiconductor division 29,713 28,239 33,892 5.2% 288,476
Ceramics division 24,461 22,054 23,738 10.9% 237,485
Subtotal 54,174 50,293 57,630 7.7% 525,961
Other 3,749 3,711 4,480 1.0% 36,398
Operating income 51,662 23,754 24,478 117.5% 501,573
Net income 32,704 20,910 25,524 56.4% 317,515
At year-end:
Total assets ¥458,149 ¥366,489 ¥340,296 25.0% $4,448,049
Net assets 302,794 268,309 235,613 12.9% 2,939,748
%
Ratios:
Equity ratio 65.6% 72.7 % 68.8 %
ROA (Return on assets) 7.9 5.9) 7.5)
ROE (Return on equity) 11.5 8.4) 11.3)
Yen Change (%) U.S. dollars
Per share data:
Net income:
—Basic ¥150.26 ¥96.06 ¥117.25 56.4% $1.46
—Diluted — — — — —
Change (Yen)
Cash dividends 28.00 22.00 22.00 ¥6.0 0.28
Notes 1: U.S. dollar amounts above and elsewhere in this Annual Report are converted from yen, for convenience only, at the rate of ¥103=U.S.$1
Notes 2: In April 2013, the “Communication media components” segment and “Technical ceramics” segment were integrated and changed the name to the “Technical ceramics” segment. The
“Communication media components” segment and the “Technical ceramics” segment in the Segment information of the Notes of the Consolidated Financial Statements correspond to
each of the “Semiconductor” division and the “Ceramics” division in the Technical Ceramics Group.
010_0653701372608.indd 4 2014/08/20 16:52:24
NGK SPARK PLUG ANNUAL REPORT 2014 5
Net Sales Operating Income Net Income
1413121110
(Millions of yen)
350,000
280,000
210,000
140,000
70,000
0
329,758
1413121110
(Millions of yen)
50,000
40,000
30,000
20,000
10,000
0
51,662
1413121110
(Millions of yen)
35,000
28,000
21,000
14,000
7,000
0
32,704
Total Assets Net Assets Net Income per Share (Basic)
1413121110
(Millions of yen)
500,000
400,000
300,000
200,000
100,000
0
458,149
1413121110
(Millions of yen)
300,000
240,000
180,000
120,000
60,000
0
302,794
1413121110
(Yen)
200
160
120
80
40
0
150.26
Equity Ratio Return on Assets Return on Equity
1413121110
(%)
100
80
60
40
20
0
65.6
1413121110
(%)
10
8
6
4
2
0
7.9
1413121110
(%)
15
12
9
6
3
0
11.5
010_0653701372608.indd 5 2014/08/20 16:52:24

Financial results for the fiscal year ended March 31st, 2014
In the fiscal year ended March 31st, 2014, opposing trends
became apparent in the world economy, with a mod-
est recovery in developed countries and the slowdown in
emerging economies. The situation varied greatly among
regions. In particular, European economies were on a re-
covery path and their exports, mainly to the U.S. and Chi-
na, started to gain momentum. On the other hand, in the
ASEAN region, political instability in certain areas became
more serious from the second half of the fiscal year and
private-sector demand remained sluggish. In Japan, under
the Abe administration, stock prices rose and deprecia-
tion of the yen continued in the foreign exchange market,
creating a tailwind for financial results of export-related
companies including our company.
In these circumstances, for the fiscal year ended March
31st, 2014, an increase in net sales for the fourth con-
secutive year, an increase in operating income for the first
time in three years, and the highest-ever ordinary income
were achieved. Consolidated net sales increased 8.9%
to ¥329,758 million, and operating income increased
117.5% to ¥51,662 million.
Going forward, the Group’s business environment is
expected to remain challenging in view of the fiscal prob-
lems in the U.S., uncertain prospects of the European
6
We seek to become the No. 1 manufacturer in the industry with unique technological abilities
A Message from the President
Shinichi OdoPresident and Chief Executive Officer
6
010_0653701372608.indd 6 2014/08/20 16:52:25
economies, and concerns about the business slowdown
of emerging economies. For the fiscal 2014, we assume
an exchange rate of ¥95 to the U.S. dollar and ¥135 to
the euro, and the plan calls for consolidated net sales of
¥334.0 billion, an increase of 1.3% year on year, and op-
erating income of ¥62.0 billion, an increase of 20%.
NITTOKU SHINKARON (The Evolution of NGK Spark Plug) Reaches the Halfway Mark to the Goal
In fiscal 2010, the Group formulated a management
plan—NITTOKU SHINKARON (The Evolution of NGK Spark
Plug)—and defined its vision of what NGK Spark Plug
should be in 2020, namely, a distinguished manufactur-
ing company, a highly profitable company, a progressive
company, and a personnel “assets” company, aimed to ul-
timately provide “real value” to all stakeholders. The road-
map for realization of this vision consists of three phases
of every three-year term : The 1st SHINKA (Delving), the
2nd SHINKA (Renovating), and the 3rd SHINKA (Evolving).
We launched the sixth medium-term management plan
(the 2nd SHINKA “three years devoted to renovating”) in
the fiscal 2013. The fiscal 2013 is halfway through the pe-
riod covered by the NITTOKU SHINKARON.
In the 1st SHINKA (Delving) phase ending in the fis-
cal 2012, we focused on the reform of the organizational
structure and culture, which is the basis of our company,
introduced the corporate officers system and designed
a new personnel system. The new personnel system in-
troduced in April 2014 offers employees flexibility in the
career path they choose to pursue. We have put in place
systems for planning a career path for each individual, by
fostering personnel “assets” who are capable of adapting
to changes in the Group’s business environment, and for
promoting diversity so that our versatile human resources
can bring their capabilities into full play.
The 2nd SHINKA (“three years devoted to renovat-
ing”) is an important phase before the final phase, the 3rd
SHINKA, of accelerated development of our company. For
renovating, it is important to strengthen the existing core
businesses as well as introducing new products and estab-
lishing new businesses. We aim to maximize earnings of
the strong Automotive Components business and use the
profit gained from that to create new businesses.
We completed the first year of the 2nd SHINKA in accor-
dance with this direction and I am convinced that we have
successfully reached the halfway mark to the goal. Our
direction is shared throughout our members and we are
steadily heading toward the 3rd SHINKA (Evolving).
With regard to the Automotive Components business,
the Nino Plant of Spark Tech TONO Co., Ltd. started oper-
ations in April 2014. This plant manufactures insulators for
NGK SPARK PLUG ANNUAL REPORT 2014 7
Points of “the 2nd SHINKA”
Delving EvolvingRenovatingRealValue
NGKSpark Plug
existingbusiness
1st SHINKA 3rd SHINKA2nd SHINKA
Further strengthening of the automotive
components business
Withdrawal from or restructuring of
unprofitable businesses
Establishment of new businesses
010_0653701372608.indd 7 2014/08/20 16:52:25
spark plugs, which are our key products, and it is of crucial
importance in the Company’s drive to be the No.1 spark
plug manufacturer. Responding to the growing demand
mainly in emerging economies, we established the Nino
Plant to hold a firm position as the No.1 global spark plug
manufacturer.
For the semiconductor-related business, through the
capital and business alliance with Eastern Co., Ltd., we
have established a new business model based on a fabless
structure. By integrating our scaling technology cultivated
through IC packaging, and Eastern’s ultrathin sheet pro-
cessing and manufacturing technology cultivated through
memory chip packaging, we intend to establish competi-
tive superiority in the growing smartphone and tablet mar-
kets.
Become the “No. 1” and “Only 1” manufacturer in our industry with unique technological abilities
For the 2nd SHINKA (three years devoted to renovating)
launched in April 2013, in accordance with the basic policy
of “utilizing corporate resources at most, toward the 3rd
SHINKA (Evolving) phase, boldly challenge new industrial
domains and fields”, we are striving to launch new prod-
ucts and new businesses by increasing the speed of deci-
sion-making and execution on the foundation laid during
the 1st SHINKA phase of three years devoted to delving.
Strengthening new businesses and the non-Automo-
tive Components business as new sources of earnings
will raise the Company’s profile and is expected to greatly
expand the scale of our business. We are seizing the op-
portunity for change by leveraging the Company’s mani-
fold strengths. Without change, it would be impossible to
respond to the new environment. In the automotive com-
ponents business, which is our main source of earnings at
present, we aim to maintain our overwhelming presence
by introducing a stream of new products. We intend to
position the automotive components business and non-au-
tomotive components business as the two wheels driving
our growth. With regard to unprofitable businesses, we
intend to formulate a roadmap for making them profitable
through reorganization and restructuring.
In my opinion, our core competence in manufacturing
capabilities is the key to raising our presence in the world.
A mere extension of the past experience of success would
NGK SPARK PLUG ANNUAL REPORT 20148
A Message from the President
010_0653701372608.indd 8 2014/08/20 16:52:27
not allow us to prevail over manufacturers based in emerg-
ing economies that compete on the basis of low prices.
We aim to realize new creations by enhancing productivity
of not only manufacturing workplaces but also indirect
operations, and by proposing new added value. We also
intend to invest in a timely manner to increase the capacity
of each plant, as necessary, so as not to lose opportuni-
ties. We also aim to realize efficient production operations
globally in order to maximize our earnings.
We have three indispensable tasks to ensure our sus-
tainable development for the future; further strengthening
of the automotive components business, withdrawal from
or restructuring of unprofitable businesses, and establish-
ment of new businesses. By accomplishing these three
tasks without fail, we seek to become the No. 1 manufac-
turer in the industry with unique technological abilities,
capable of contributing to the world with ceramics at the
core and through combining metal, organic and other ma-
terials.
Dividend policy
At NGK Spark Plug, we regard returning profits to share-
holders as one of our most important management poli-
cies. While comprehensively taking into consideration R&D
investment, capital expenditure for business expansion and
for rationalization of operations, we prioritize stable divi-
dend payment. Our policy is to maintain a dividend payout
ratio of at least 20% of consolidated net income for the
time being.
In accordance with this policy, we paid dividends per
share of ¥28.0 for the fiscal 2013. While adhering to the
basic policy of maintaining stable dividends, we aim to
increase the payout ratio. Taking into consideration the
improving performance of each business, we plan to pay
dividends per share of ¥32.0 for the fiscal 2014.
I greatly appreciate your understanding on our business
and direction for the future growth, and also your continu-
ous support.
NGK SPARK PLUG ANNUAL REPORT 2014 9
Shinichi OdoPresident and Chief Executive Officer
1413121110
11.0
22.0
20.218.8 18.6
22.9
22.0
28.0
22.0Cash dividends (¥)
Payout ratio (%)17.7
010_0653701372608.indd 9 2014/08/20 16:52:27

NGK SPARK PLUG ANNUAL REPORT 201410
OPERATION STRATEGY
Automotive
Components
Automotive
Components
S p e c i a l F e a t u r e 1
Toward Production Capacity of One Billion Spark Plugs a Year
Environmental Regulations Create Business Opportunities
With the aim of becoming the “No. 1” manufacturer capable of delivering products with added value worldwide, we are tackling business innovation by reinforcing our strengths, remedying our weaknesses and creating new businesses.
Our target is to achieve annual production capacity of one billion spark plugs by 2020. For this purpose, we established the Nino Plant in Kani-shi, Gifu Prefecture, as the principal factory for production of insulators,
which require high technology. The Nino Plant started operation in April 2014. For metal shells of spark plugs, we have established SparkTec (Thailand) Co., Ltd., our third plant in Thailand, which is scheduled
to start production in April 2015.
Increasingly stringent environmental regulations worldwide in response to ever more pressing environmental issues are creating new business opportunities for NGK SPARK PLUG. In North America and Europe, demand for small-diameter, high-ignitability plugs is expanding in line with engine downsizing and there is a shift to UEGO (Universal Exhaust Gas Oxygen) sensors. Prompted by these trends, we will leverage our technological capabilities. In China, there is a trend toward both precious metal plugs and oxygen sensors, volumes of which are expected to increase.
Production of metal shells for spark plugs SparkTec (Thailand) Co., Ltd.Production capacity 18 million units/year in 2016; to be increased to 140
million units/year in 2020.Start of operation April 2015
Investment amount Approx. 3 billion yen
Production of insulators for spark plugs Nino PlantProduction capacity Approx. 13.5 million/month (to be increased gradually)
Site area 52,800m2
Start of operation April 2014Investment amount Approx. 28 billion yen (for the building and primary
equipment)
Metal shells
Production plan
Approx.13.5 million/month (2016)
Production plan
Approx.18 million/year (2016)
Insulators
Products whose volumes are expected to increase in line with stricter environmental regulations
Plugs: Small-diameter, high-ignitability plugsSensors: UEGO (Universal Exhaust Gas Oxygen) sensors
Products whose volumes are expected to increase in line with stricter environmental regulations
Plugs: Small-diameter, high-ignitability plugsSensors: UEGO (Universal Exhaust Gas Oxygen) sensors
Products whose volumes are expected to increase in line with stricter environmental regulations
Plugs: Precious metal plugsSensors: Oxygen sensors
010_0653701372608.indd 10 2014/08/20 16:52:28
NGK SPARK PLUG ANNUAL REPORT 2014 11
Semiconductor
~Organic IC package~Focus on Growth Fields for Business Restructuring
Create New Products and Businesses to Unlock the Future
We consider our current business structure dependent on plugs and sensors to be exposed to high risks from a long-
term perspective. Thus, with a view to creating new businesses for the future, we are directing our attention to such
themes as next-generation automobiles, the medical field, and the environment and energy, and are developing new
technologies linked to those themes.
Restore the business to profitability by the end of March 2016
CPU BusinessShift to royalty businessTransfer of the commercial rights to a Taiwanese partner was completed. As a result, the CPU business is now a royalty busi-ness without manufacturing, selling and inventory risks.
Non-CPU BusinessMinimization of risks, maximization of profitProduction was transferred to Eastern Co., Ltd. and it has just started the shipment of FCBGA (Flip Chip-Ball Grid Array) products mass-produced by Eastern in April 2014. Reduction of fixed costs of the non-CPU business is expected for fiscal 2014 because of the termination of operations of one manufacturing plant and the redeployment of labor from the non-CPU business to the Automo-tive business.
Next-generation vehicle
Medical Environment and energy
Compact electric vehicle “FOMM Con-cept One” developed in cooperation with FOMM Corporation
Bone prosthesis for restoration and cure by supplementing a missing or void part Developing solid oxide fuel cells (SOFCs)
enabling high-efficiency power genera-tion at low cost for cogeneration and automotive applications
With regard to restructuring of the organic IC package business operations, we have implemented measures for CPU and non-CPU businesses, respectively, and prospects are becoming clearer. From now on, we will sharpen our focus on development of the non-CPU business with the aim of restoring the business to profitability by the end of March 2016.
New Businesses
010_0653701372608.indd 11 2014/08/20 16:52:30

Guided by our Corporate Philosophy, the Group’s R&D initiatives emphasize creation of new value through deployment of industry-leading technologies and our accumulated ex-perience. R&D is executed by the Engineering R&D Group and the New Business Advance-ment Group, which are corporate organiza-tions, the SOFC Project, which was previously a part of the New Business Advancement Group and became an independent unit as of April 1, 2013, and divisional engineering departments. We are striving to enhance the quality of R&D outcomes by exploiting the latest technologies through vigorous participation in technology conferences and industry associations as well as joint research with universities and research institutions in Japan and around the world.
R&D expenses in the fiscal year under review amounted to ¥19,401 million, which included expenses related to improvements of existing products and applied research. The “research and development cost” pursuant to the “Accounting Standard for Research and Development Cost” (Business Accounting Council) amounted to ¥4,018 million.
Initiatives in Business Fields
Automotive ComponentsAutomotive engines are evolving ever more rapidly to respond to environmental issues and to demanding regulatory regimes requiring low fuel consumption and low emissions. In response to these trends, we are increasing the temperature resistance, voltage resistance, and ignitability of our spark plugs, as well as making them more compact and elongated. With these objec-tives in mind, we are promoting comprehensive development from materials to product design, including development of manufacturing methods. Regarding sensors, we are enhancing their abilities to endure harsh environments, including resistance to high temperature, thermal shock, vibration, and water, and are also developing energy- and resource-saving sensors.
Technical CeramicsWith regard to semiconductors, we are developing coreless packaging and high-strength packaging in response to growing needs for thinner and more compact IC packages.
As for ceramics, we are developing tools suitable for machin-ing components applied in the automotive, aerospace and other industries. In addition, we are also developing and commercial-izing bearing balls, large-diameter vacuum chuck plates for semi-conductor manufacturing equipment, oxygen concentrators for home medical care, and ultrasonic wave oscillators for medical applications.
New BusinessesFuel cells are a promising next-generation energy source. In pursuit of clean energy, we are vigorously engaged in fuel-cell-related R&D, including jointly with research institutions, such as participation in a project of the New Energy and Industrial Tech-nology Development Organization (NEDO) of Japan. Leveraging our unique functional ceramics material technology and process technology, we are promoting development of solid oxide fuel cells (SOFCs), which have great potential as high-efficiency, clean power generation systems.
NGK SPARK PLUG ANNUAL REPORT 201412
S p e c i a l F e a t u r e 2
R&D
Thomson Reuters Selects NGK Spark Plug as a Top 100 Global Innovators 2013 Winner
Our company was selected as a Thomson Reuters Top 100 Global Innovators 2013 winner in October 2013. This award is presented to companies recognized as innovative by Thomson Reuters based on its stringent methodology focused on four criteria (success, global, influence, and volume). For the global and influence criteria, our company judged to be a particularly high performer.
2010 2011 2012 2013 2014
13,90715,763 16,036
17,101
19,401
R&D Expenses
(Millions of Yen)
20,000
15,000
10,000
5,000
0
Technological development capabilities are among the vital elements for growth of our businesses. We are investing strategically in R&D in order to deliver “real value,” which is the ultimate goal of the NITTOKU SHINKARON.
010_0653701372608.indd 12 2014/08/20 16:52:30
Q1. You are participated in NGK SPARK PLUG’s management as an outside director. How
would you characterize NGK SPARK PLUG?
A1.NGK SPARK PLUG is an earnest and sturdy manufacturer with a grand tradition. “Prudent,” “history,” “technology” and “humane” are the words that come into my mind. I would describe NGK SPARK PLUG as a well-rounded, well-balanced enterprise worthy of respect.
Q2. What impression do you have on our corporate governance?
A2.We have the culmination of a long, distinguished history and draws strength from the achievements of previous generations. I feel the governance is considering the external environment, our history, and accumulated expertise. With the clear vision of top management, all of us are moving forward to achieve the NITTOKU SHINKARON (The Evolution of NGK SPARK PLUG), which is our long term management plan. I am also impressed by the breadth and depth of communication.
As we endeavor to take its business to a new level, I think we should not be satisfied with the status quo, seeking improvements wherever possible and vigorously embracing new ideas. I expect we will align its activities with ambitious targets.
Q3. How do you fill the role as an outside director?
A3.I worked at both Japanese and foreign companies and gained broad experiences in the variety of businesses namely HR services, printing/publishing, and healthcare industries. Our top management is seeking to adopt new perspectives and ideas with a global viewpoint for new businesses such as the healthcare and other than the automotive industry. To meet top management’s expectations, I am making proposals on corporate governance and new businesses with a view to enhancing corporate value.
In my judgment, NGK SPARK PLUG has appropriate corporate governance. My role is to bring a perspective different from that of an insider and confirm whether its operations are appropriate. I am vigorously making proposals for the future by fully utilizing my expertise. I recognize that NGK SPARK PLUG expects me to introduce a new, external and global viewpoint flexibly and appropriately.
Q4. To increase our corporate value, what do you think we need to do?
A4.Sound business operations are a prerequisite for enhancing corporate value. In addition, it is crucially important to ensure that stakeholders are kept informed about NGK SPARK PLUG through PR and IR activities attuned to each type of stakeholder.In general, stakeholders of a company are classified into four categories: customers, employees, local communities and shareholders. It is pointed out that many Japanese companies do not sufficiently consider or implement activities for employees or local communities. I believe it is a driver of growth that management regularly confirms the employees’ understanding on the company’s goals so that they can align their own efforts with the goals. With respect to local communities, we need to take action as the same local member of the communities. It may take a long time for such activities to take root. At present, we are strengthening its communication with the employees and thus their understanding of the company’s goals is deepening. I think we need to continue this proactive communication. It would be crucial to have employees’ feedbacks on these activities. We have just launched a new initiative focused on contributions to local communities. It is important that such initiatives are not be just one-shot but continued.
It is also essential to cultivate a corporate culture harnessing new knowledge flexibly from both inside and outside. In this regard, we are making a corporate-wide effort led by top management. I strongly believe that NGK SPARK PLUG to be a gem to shine far more brightly by bringing our best efforts. I also do my best to play my role as outside director for the same goals we shared.
NGK SPARK PLUG ANNUAL REPORT 2014 13
S p e c i a l F e a t u r e 3
GOVERNANCE
Outside Director
Morihiko Otaki(June 11, 1954–)
To strengthen our corporate governance, Mr. Otaki joined us as our first outside director 1 year ago. We have received his review about our corporate governance.
August, 1996 Johnson & Johnson K.K., President of Vision Care Company
August, 2011 Pasona Inc., Vice Chairman (up to the present)
June, 2013 NGK SPARK PLUG CO., LTD., Member of the Board (Outside Director)
Profile
010_0653701372608.indd 13 2014/08/20 16:52:30

NGK SPARK PLUG ANNUAL REPORT 201414
Review of Operations
Review of Results
Sales of automotive components both for factory installation in new
vehicles and for aftermarkets were robust centering on North America
and emerging-market countries. A weaker yen also contributed to
higher sales. In order to meet the robust demand, we increased
production capacity. We prepared for the establishment of a new plant
at a subsidiary in Japan and established a new company overseas.
As a result, net sales of the Automotive Components Group
increased 9.3% year on year to ¥271,835 million and operating
income rose 77.6% to ¥58,893 million.
Outlook
Robust demand for automotive components overseas, mainly in the
U.S. and China, is expected to continue from the fiscal 2013. For the
fiscal year ending March 31, 2015, we forecast net sales of ¥278,520
million, an increase of 2.5% year on year, and operating income of
¥65,700 million, an increase of 11.6%.
Automotive Components Group
Spark Plugs NHTC (New High Temperature Ceramic) Glow Plugs
Zirconia Exhaust Gas Oxygen Sensors
Universal A/F Heated Exhaust Gas Oxygen Sensors
Wide Range Exhaust Gas Temperature Sensors
1413121110
(Millions of yen)
300,000
200,000
100,000
0
271,835Net Sales
1413121110
(Millions of yen)
60,000
45,000
30,000
15,000
0
58,893Operating Income
82.4%
Net Sales Ratio
010_0653701372608.indd 14 2014/08/20 16:52:33
NGK SPARK PLUG ANNUAL REPORT 2014 15
Review of Operations
Review of Results
Demand was sluggish for IC packages both for mobile phones and
personal computer CPUs, partly because of customers’ inventory
adjustment. In these circumstances, the Semiconductor Division strove
to improve profitability through productivity enhancement, cost
reduction and other rationalization initiatives. Production of certain IC
packages was transferred to an outsourcee in Japan and commercial
rights for the CPU business to a partner overseas.
As a result, the Semiconductor Division’s net sales increased 5.2%
year on year to ¥29,713 million and the operating loss was ¥8,711
million compared with the operating loss of ¥9,677 million recorded
for fiscal 2012.
Outlook
Transfer of production to outsourcees has been proceeding smoothly.
We are shifting the semiconductor operations to a fabless business
model emphasizing design and development. For the fiscal year
ending March 31, 2015, we forecast net sales of ¥33,070 million, an
increase of 11.3% year on year, and an operating loss of ¥3,840
million compared with the operating loss of ¥8,711 million recorded
for the fiscal 2013.
*In the Technical Ceramics Group, whereas all ceramics products for industrial applications had been included in the Ceramics Division, products for semiconductor manufacturing equipment are now included in the Semiconductor Division as a result of the segment reclassification, reflecting the organizational change in April 2014 to enhance operational efficiency. The impact of this change is an increase of ¥3,400 million in net sales and an improvement of ¥600 million in operating income/loss.
Technical Ceramics Group Semiconductor Division
Ceramic IC Packages (for crystal device and SAW filter)
Organic IC Packages
Large-Scale Substrate for Wafer Tester
Optical Device Package
LED Package
1413121110
(Millions of yen)
60,000
40,000
20,000
0
29,713Net Sales
1413121110
(Millions of yen)
0
(2,500)
(5,000)
(7,500)
(10,000)
(8,711)Operating Loss
9.0%
Net Sales Ratio
010_0653701372608.indd 15 2014/08/20 16:52:35

NGK SPARK PLUG ANNUAL REPORT 201416
Review of Operations
Review of Results
The Ceramics Division’s shipments of products for machine tools were
robust centering on those for machining automotive components.
Regarding shipments of products for industrial equipment, sales of
products for semiconductor manufacturing equipment were robust.
As a result, net sales of the Ceramics Division increased 10.9%
year on year to ¥24,461 million and operating income surged 765.1%
to ¥1,461 million.
Outlook
We are working to establish a stable earnings structure for the
ceramics business. For the fiscal year ending March 31, 2015, we
forecast net sales of ¥18,630 million, a decrease of 23.8% year on
year, and operating income of ¥140 million, a decrease of 90.4%.
Cutting Tools Electro-Static Chuck, Vacuum Chuck
Ultrasonic Transducer Bio Ceramics
Oxygen Concentrator
1413121110
(Millions of yen)
28,000
21,000
14,000
7,000
0
24,461Net Sales
1413121110
(Millions of yen)
2,000
1,000
0
(1,000)
(2,000)
1,461Operating Income
7.4%
Net Sales Ratio
Technical Ceramics GroupCeramics Division
010_0653701372608.indd 16 2014/08/20 16:52:38
CSR
CSR of NGK Spark Plug GroupWe view CSR not just as a responsibility but as an opportunity to be accountable through review of the NGK Spark Plug Group’s economic, environmental and social activities from a global perspective, to enhance corporate value, and to contribute to the sustainable development of society in accordance with our Corporate Philosophy. Our CSR activities are wide ranging and diverse. They include offering excellent products to customers, disclosing corporate information to shareholders and the wider investor community in an optimal, easy-to-understand manner, collaborating with suppliers for mutual development, ensuring a safe and employee-friendly working environment, and participating in and supporting activities in the local community. To articulate the Group’s action guidelines for CSR activities, we established the CSR Policy in April 2011, which comprises the Compliance Policy and nine other policies. In accordance with the CSR Policy, we intend to review and promote CSR based on a
multifaceted approach far into the future.
CSR Promotion SystemAs well as determining each year’s key tasks for implementation of the CSR Policy, the CSR Committee oversees and evaluates the CSR-related activities implemented by the respective committees, working groups and divisions, and makes proposals regarding them, in order to achieve total optimization of CSR activities, thereby strengthening the business foundation. The CSR Promotion Sub-Committee establishes working groups as necessary to d i scuss spec i f i c themes and deve lops countermeasures. Through close collaboration among the CSR Committee, the CSR Promotion Sub-Committee, and the task force committees, a company-wide CSR promotion system is put in place. We publish an annual CSR report on our CSR activities and results, which is also available on our website.
NGK SPARK PLUG ANNUAL REPORT 2014 17
Enhancement of corporate value
Corporate Philosophy
Corporate Code of Conduct
CSR Policy
Promotion of CSR
CSR Committee CSR Promotion Office (secretariat)
CSR Promotion Sub-Committee
CSR promotion organizations
Export ControlCommittee
ConfidentialityManagement Committee
ComplianceCommittee
RiskManagement Disclosure Human
RightsSocial
ContributionCSR
ProcurementEnvironmentCommittee
Safety andHealth
Committee
QualityCommittee
Commitment to CSR
CSR Report 2014
011_0653701372608.indd 17 2014/08/20 16:08:37

CSR [Governance]
Corporate GovernanceWe believe that one of our most important managerial tasks is to establish and maintain a fair and efficient management system, thus securing soundness and transparency in management.
Management OrganizationThe Board of Directors, consisting of nine directors (two of whom are outside directors), deliberates and makes decisions on matters stipulated by laws or bylaws and management-related matters of importance, and supervises the execution of operations by each director. In April 2012, to meet the need for greater speed in both decision-making and business execution, we introduced the corporate officers system and a performance-based system for officers’ remuneration. The 21 corporate officers, seven of whom concurrently serve as directors, execute business in accordance with the policies decided by the Board of Directors. At the corporate officers’ meeting held once a month, corporate officers report on the progress of business execution, share information and exchange opinions in order to enhance operational efficiency. The term of office of a corporate officer and that of a director are one year.
Management Oversight FunctionsThe Company employs the Board of Corporate Auditors System and
the Board of Corporate Auditors consists of four corporate auditors (two of whom are external corporate auditors).The corporate auditors attend the meetings of the Board of Directors and, if necessary, various other meetings and committee meetings, to grasp important issues. Through audits of the Company’s offices and subsidiaries, they also supervise directors’ execution of duties. In June 2013, we appointed an outside director for the first time with the aim of strengthening corporate governance. The outside director attend the meetings of the Board of Directors and state their opinions as necessary, based on their great experience at global companies and deep insight.
Internal AuditsThe Internal Auditing Office performs audits of our company and its subsidiaries and affiliates, reports the audit results to management, and makes proposals to correct problems and improve business operations as necessary. A department that receives a proposal for improvement formulates and implements an improvement plan and the Internal Auditing Office investigates and confirms the implementation status. The department assesses the effectiveness of internal control over financial reporting in accordance with the requirements for the internal control report system pursuant to the Financial Instruments and Exchange Act so as to secure the reliability of the Group’s financial reporting, thereby maintaining and improving internal control.
NGK SPARK PLUG ANNUAL REPORT 201418
Disclosure
Audit
General Meeting of Shareholders
Corporate Governance Structure
Board of Corporate Auditors (including external auditors)
Independent Auditor
Various Conference and Committees (CSR Committee etc.) Business Operating Section / Group Companies
Cooperates mutually
Cooperates mutually
Internal Auditing Office
Audit
Appointment/DismissalAppointment/Dismissal
Appointment/Dismissal
Indication
Indication
Indication
Board of Directors (including outside directors)
Administration Officer in charge
Corporate Officers’ Meeting Corporate OfficersIndication
Corporate Management Committee President and CEO
011_0653701372608.indd 18 2014/08/20 16:08:37
ComplianceRecognizing that NGK Spark Plug is a member of society, we enhance corporate ethics, comply with laws and ordinances, international rules, and company regulations, striving to become a company trusted by the international community.
Action Guidelines• We comply with all relevant laws and ordinances, the Corporate
Code of Conduct, and company regulations.• We regularly educate and raise the awareness of all our employees
so that they independently act ethically and knowledgably to prevent compliance problems.
• Should a problem occur, we promptly deal with it and fulfill our accountabil ity, striving to identify the causes and prevent recurrence.
Compliance Promotion StructureIn August 2013, we established a new framework for promoting compliance at workplaces. Heads of all departments of our company and presidents of Group companies have been appointed as “compliance leaders,” and “compliance promoters” have been assigned under them. In addition, the Compliance Committee, chaired by the corporate officer responsible for general affairs and consisting of the departments responsible for laws and regulations and the heads of divisions, meets every three months to monitor key issues and actions concerning them and to implement corrections.
Corporate Ethics HelplineWe have the Corporate Ethics Helpline in place so that our employees can receive consultation or make a report about compliance. The helpline is available inside and outside the Company and employees may use it anonymously. The Helpline received 21 cases of consultation and reporting in fiscal 2013, most of which concerned labor issues, the workplace environment, and information management. In some cases, the reporting prompted revision of the internal regulations.
Export ControlsTo ensure appropriate security export controls in compliance with the Foreign Exchange and Foreign Trade Control Act of Japan, we have the Export Control Rules and an export control organization in house as a framework enabling us to flexibly respond to amendments of the law. We also have put in place an antiterrorism security control system for air cargo in accordance with the guidance of the authorities. As part of our efforts for appropriate cargo management, metal detectors have been introduced at our logistics centers.
Security Control / Information SecurityWe have established the Confidentiality Management Regulations and strive to appropriately manage confidential information of the
Company, our customers, and our suppliers. Our Privacy Policy is available on our website.
Protection and Utilization of Intellectual Property RightsNGK Spark Plug is active in the acquisition and utilization of intellectual property rights to protect its current and newly developed products. We investigate third-party intellectual property rights to confirm whether IP provisions in agreements are appropriate. It is our intention to strengthen management of intellectual property throughout the Group, including countermeasures for counterfeit products.
Risk ManagementNGK Spark Plug has made preparations to deal with various possible risks, such as natural disasters, accidents, and infectious diseases. If such a risk should arise, we will act to minimize the impact on our stakeholders. We will also work to restore and maintain the continuity of business operations, thereby earning the continued trust of our stakeholders.
Action Guidelines• We strive to prevent factors that could affect business continuity.• We conduct our activities, always according top priority to the
protection of human life.• We minimize the impact on other parties.• We strive to rapidly restore business operations and maintain stable
supply of products and services.• We implement measures to prevent the recurrence
Review of the Business Continuity Plan (BCP)We have conducted maintenance, operat ion and ongoing improvement of business continuity through PDCA cycle for the business continuity plan (BCP) formulated in 2012. In addition, we have implemented a recovery strategy including contingency plans so that the resumption of operations is within the target recovery time set in accordance with the results of business impact analysis (BIA). In order to inculcate measures at every workplace, we conducted a corporate-wide disaster drill, assuming the occurrence of a major earthquake, in November 2013, and a BCP drill in February 2014. Moreover, off-grid power generators have been installed for the Headquarters and the Komaki Machine Room to safely stop the main server in the event of disruption of power supply due to a major incident.
Response to New Infectious DiseasesMindful of the importance of protecting employee health, we are working to prevent the spread of influenza in the workplace. As group infection at workplaces may affect the performance of duties, we are implementing measures that are timely and focused with the departments concerned.
NGK SPARK PLUG ANNUAL REPORT 2014 19
011_0653701372608.indd 19 2014/08/20 16:08:37

CSR [Social]
Giving Classes on Traffic Safety and Environmen-tal Protection at Schools for Migrant Workers’ Children in China
NGK Spark Plug (Shanghai) Co., Ltd., our subsidiary in China, gives classes on traffic safety and environmental protection at schools in Shanghai where children of rural migrants study, in order to help reduce traffic accidents and raise environmental awareness as befits a company involved in t h e a u t o m o t i v e i ndu s t r y. I n f i s c a l 2013, several hundred children received the class at five schools.
Becoming an Official Sponsor of FC Gifu
We have signed an official partnership agreement with FC Gifu, a J. League Division 2 football club based in Gifu Prefecture. Not only are three Group companies based in Gifu Prefecture, but the new plant of Group company SparkTech TONO Co., Ltd. recently started operation, further strengthening our ties with the prefecture. Thus, aspiring to contribute to the community where we do business, we have engaged in the o f f i c i a l p a r t n e r s h i p agreement. Not only the three Group companies o p e r a t i n g i n t h e prefecture but all of us at the company will be cheering for the club.
Inviting Families in the Region to a Musical
At NTK Hall, a cultural complex of Nagoya City for which we acquired the naming right in July 2012, we hosted a performance of the musical Town Musicians of Bremen by Theater Company HIKOSEN to express our appreciation to people in the region for their patronage. We invited people displaced by the Great East Japan Earthquake who are currently living in Nagoya and children raised in orphanages as well as other families in the region. Some 3,700 children and accompanying adults enjoyed the musical.
The NGK Spark Plug Group endeavors to identify the expectations of its stakeholders, respond to them and enhance corporate value, capitalizing on stakeholders’ confidence in the Group.
With Our CustomersIn order to grasp the diverse and evolving needs of customers and to create safe and reliable products that deliver greater customer satisfaction, we are promoting total quality management (TQM). At the same time, we are applying the SDCA (standardize-do-check-act) cycle at workplaces to facilitate standardization of business processes and production processes in order to ensure that we offer consistent quality throughout the world.
With Our Shareholders and InvestorsThe Group is working to ensure the transparency and fairness of information disclosure to shareholders and investors. In addition to visiting institutional investors overseas, we are holding increasing the number of meetings for individual shareholders as part of our efforts to deepen investors’ understanding of NGK Spark Plug.
With Our EmployeesRecognizing that employees are the most important management resource, we respect their diversity and individuality. In April 2014 we launched a new personnel system designed to cultivate highly capable human resources.
With Our SuppliersWith a view to global optimization of procurement, we are strengthening cooperation with suppliers. We have released the NGK Spark Plug Group CSR Procurement Guidelines and are promoting CSR-oriented procurement throughout the supply chain. We hold an annual seminar for our main suppliers in order to share our policies with them.
With Local Communities and International SocietyAs part of our concerted effort to fulfill our responsibility as a good corporate citizen, we are involved in various social contribution activities in communities where our production sites are located. In conducting business around the world, we respect local cultures and customs and engage in activities that contribute to the development of local communities.
Social Contribution Activities of Our Sites Worldwide
We received many letters of gratitude from children who participated.
NGK SPARK PLUG ANNUAL REPORT 201420
011_0653701372608.indd 20 2014/08/20 16:08:38
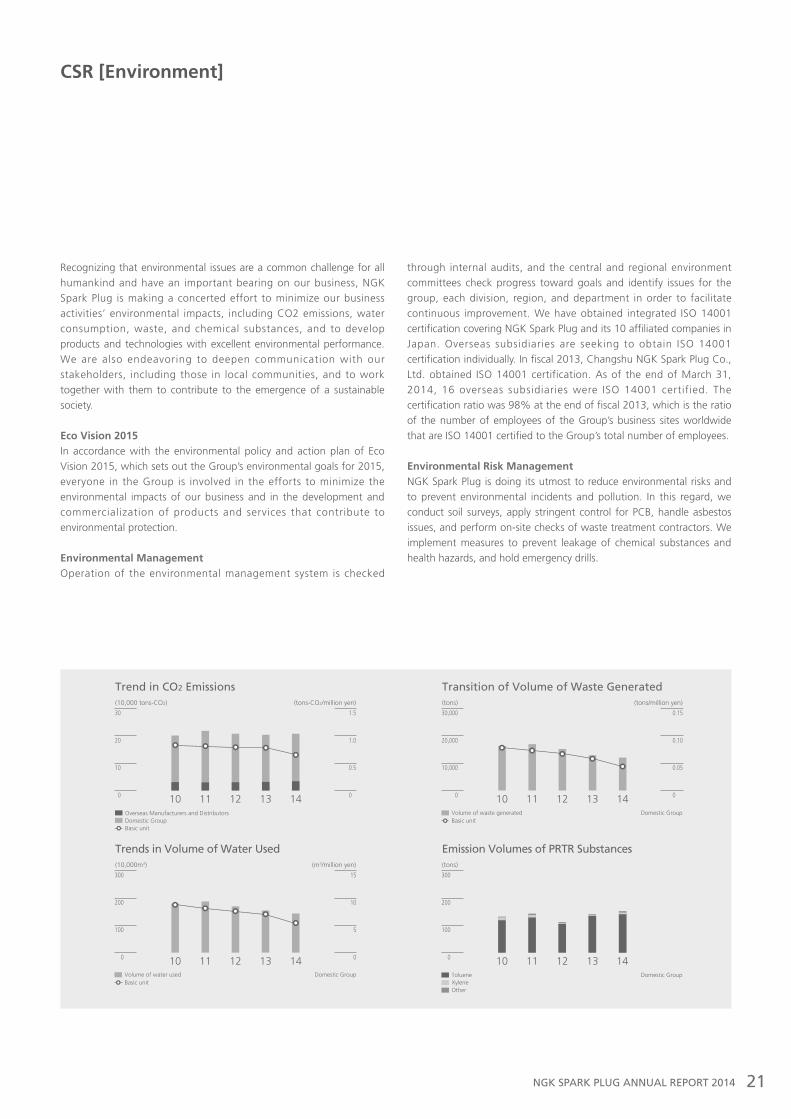
11 12 13
(10,000 tons-CO2)
30
20
10
0 10 14
Trend in CO2 Emissions(tons)
30,000
20,000
10,000
0
(tons/million yen)
0.15
0.10
0.05
010 11 12 13 14
10 11 12 13 14
Transition of Volume of Waste Generated
(tons)
300
200
100
0
Emission Volumes of PRTR Substances
(tons-CO2/million yen)
1.5
1.0
0.5
0
(10,000m3)
300
200
100
0 10 11 12 13 14
Trends in Volume of Water Used
Volume of waste generated Domestic Group
Toluene Domestic GroupXyleneOther
Basic unitBasic unit
Volume of water used Domestic Group
Overseas Manufacturers and DistributorsDomestic Group
Basic unit
(m3/million yen)
15
10
5
0
CSR [Environment]
Recognizing that environmental issues are a common challenge for all humankind and have an important bearing on our business, NGK Spark Plug is making a concerted effort to minimize our business activities’ environmental impacts, including CO2 emissions, water consumption, waste, and chemical substances, and to develop products and technologies with excellent environmental performance. We are also endeavoring to deepen communication with our stakeholders, including those in local communities, and to work together with them to contribute to the emergence of a sustainable society.
Eco Vision 2015In accordance with the environmental policy and action plan of Eco Vision 2015, which sets out the Group’s environmental goals for 2015, everyone in the Group is involved in the efforts to minimize the environmental impacts of our business and in the development and commercialization of products and services that contribute to environmental protection.
Environmental ManagementOperation of the environmental management system is checked
through internal audits, and the central and regional environment committees check progress toward goals and identify issues for the group, each division, region, and department in order to facilitate continuous improvement. We have obtained integrated ISO 14001 certification covering NGK Spark Plug and its 10 affiliated companies in Japan. Overseas subsidiaries are seeking to obtain ISO 14001 certification individually. In fiscal 2013, Changshu NGK Spark Plug Co., Ltd. obtained ISO 14001 certification. As of the end of March 31, 2014, 16 overseas subsidiaries were ISO 14001 certified. The certification ratio was 98% at the end of fiscal 2013, which is the ratio of the number of employees of the Group’s business sites worldwide that are ISO 14001 certified to the Group’s total number of employees.
Environmental Risk ManagementNGK Spark Plug is doing its utmost to reduce environmental risks and to prevent environmental incidents and pollution. In this regard, we conduct soil surveys, apply stringent control for PCB, handle asbestos issues, and perform on-site checks of waste treatment contractors. We implement measures to prevent leakage of chemical substances and health hazards, and hold emergency drills.
NGK SPARK PLUG ANNUAL REPORT 2014 21
011_0653701372608.indd 21 2014/08/20 16:08:38

Six-Year SummaryNGK SPARK PLUG CO., LTD. and Consolidated SubsidiariesYears Ended March 31, 2014, 2013, 2012, 2011, 2010 and 2009
Millions of yen Thousands of U.S. dollars
2014 2013 2012 2011 2010 2009 2014
For the year:
Net sales ¥329,758 ¥302,799 ¥284,746 ¥269,233 ¥243,914 ¥292,122 $3,201,534
Costs of goods sold 222,383 229,530 213,409 195,461 192,722 251,833 2,159,058
Selling, general and administrative expenses 55,713 49,515 46,859 45,001 40,508 45,511 540,903
Operating income (loss) 51,662 23,754 24,478 28,771 10,684 (5,222) 501,573
Net income (loss) 32,704 20,910 25,524 23,680 13,510 (71,669) 317,515
Cash flows from operating activities 54,698 26,194 21,080 35,399 34,255 36,604 531,049
Cash flows from investing activities (61,149) (15,443) (15,851) (20,412) (17,271) (27,154) (593,680)
Cash flows from financing activities 24,123 (15,495) (4,688) (7,154) 865 (10,461) 234,204
Depreciation 11,567 12,798 15,439 16,646 18,826 31,767 112,301
Capital expenditures 41,034 24,013 14,005 8,767 10,978 24,173 398,388
At year-end:
Total assets ¥458,149 ¥366,489 ¥340,296 ¥337,318 ¥331,476 ¥275,995 $4,448,049
Net assets 302,794 268,309 235,613 218,159 207,007 184,385 2,939,748
Sales by Reportable Segments:
Automotive components ¥271,835 ¥248,795 ¥222,636 ¥197,214 ¥166,067 ¥186,685 $2,639,175
Technical Ceramics:
Semiconductor 29,713 28,239 33,892 44,472 55,031 77,410 288,476
Ceramics 24,461 22,054 23,738 23,053 19,155 23,531 237,485
Subtotal 54,174 50,293 57,630 67,525 74,186 100,941 525,961
Other 3,749 3,711 4,480 4,494 3,661 4,496 36,398
Other Data:
Number of shareholders 10,070 10,701 11,666 12,744 12,102 16,280
Number of employees (Consolidated) 12,760 12,563 12,064 11,767 11,795 11,979
Yen U.S. dollars
Per Share Data:
Net income (loss)
—Basic ¥150.26 ¥96.06 ¥117.25 ¥108.71 ¥62.01 ¥(328.90) $1.46
—Diluted – – – 107.83 61.46 (328.90) –
Cash dividends 28.00 22.00 22.00 22.00 11.00 13.50 0.28
Net assets 1,381.38 1,223.41 1,075.24 994.36 942.41 838.11 13.41
%
Ratios (Figures in parentheses arenegative):
Operating income ratio 15.7% 7.8% 8.6% 10.7% 4.4% (1.8)%
Equity ratio 65.6 72.7 68.8 64.2 61.9 66.2
Return on net sales 9.9 6.9 9.0 8.8 5.5 (24.5)
Return on assets 7.9 5.9 7.5 7.1 4.4 (20.8)
Return on equity 11.5 8.4 11.3 11.2 7.0 (30.6)
Note: U.S. dollar amounts above and elsewhere in this Annual Report are converted from yen, for convenience only, at the rate of ¥103=U.S.$1
NGK SPARK PLUG ANNUAL REPORT 201422
011_0653701372608.indd 22 2014/08/20 16:08:38
Management’s Discussion and Analysis
Overview of Results
During the fiscal year ended March 31, 2014, with regard to
conditions overseas, the Chinese economy continued to grow
though at a slower pace due to stagnating domestic and
foreign demand. In ASEAN countries, foreign demand
experienced a slowdown, and domestic demand, which had
been robust, began to lose momentum. In particular, from the
second half of the fiscal year under review, political instability in
Thailand was prominent and demand from the private sector
continued to slump. In contrast, the European economies
headed toward recovery and in the Eurozone, exports picked
up centering on those for the U.S. and China. The U.S.
economy continued to recover at a modest pace in line with
the recovery of the manufacturing industry and improvement in
the labor market. The Japanese economy continued to
recover, supported by publ ic investment in l ine with
government economic policies. Toward the end of the fiscal
year under review, there was a spike in consumer spending in
Japan as last-minute demand surged before the consumption
tax increase, giving the economy a boost. In the financial
market, the trend in low yen and high share prices continued,
and improvement in the financial results of companies,
particularly those engaged in export, became evident.
In the automotive industry, which is the principal market for
the NGK Spark Plug Group's products, worldwide automotive
sales grew steadily, led by brisk sales in the U.S. and China. In
Japan, automotive sales were also robust as sales of compact
cars, whose prices and running costs are relatively low,
remained high and also thanks to last-minute demand prior to
the consumption tax increase.
In the semiconductor industry, the markets for smartphones
and tablets continued to expand while demand for PCs
remained weak worldwide.
As a result, consolidated net sales for the fiscal year ended
March 31, 2014 increased 8.9% year on year to ¥329,758
million. Operating income surged 117.5% to ¥51,662 million,
and net income increased 56.4% to ¥32,704 million.
Results of Operation
Net Sales
Consolidated net sales increased ¥26,959 million or 8.9% year
on year to ¥329,758 million. Although sales in Thailand,
Malaysia, and certain other countries in the ASEAN region
were lackluster, sales of automotive components both for
factory installation and for aftermarkets were robust, centering
on North America and emerging economies. Demand in
Europe, which had been lackluster, started to recover gradually
in the second half of the fiscal year under review.
(Millions of yen)
360,000
270,000
180,000
90,000
0 10 11 12 13
Net Sales by Business Segment
Technical Ceramics:Semiconductor divisionTechnical Ceramics:Ceramics divisionOther
Automotive Components
14
NGK SPARK PLUG ANNUAL REPORT 2014 23
011_0653701372608.indd 23 2014/08/20 16:08:38
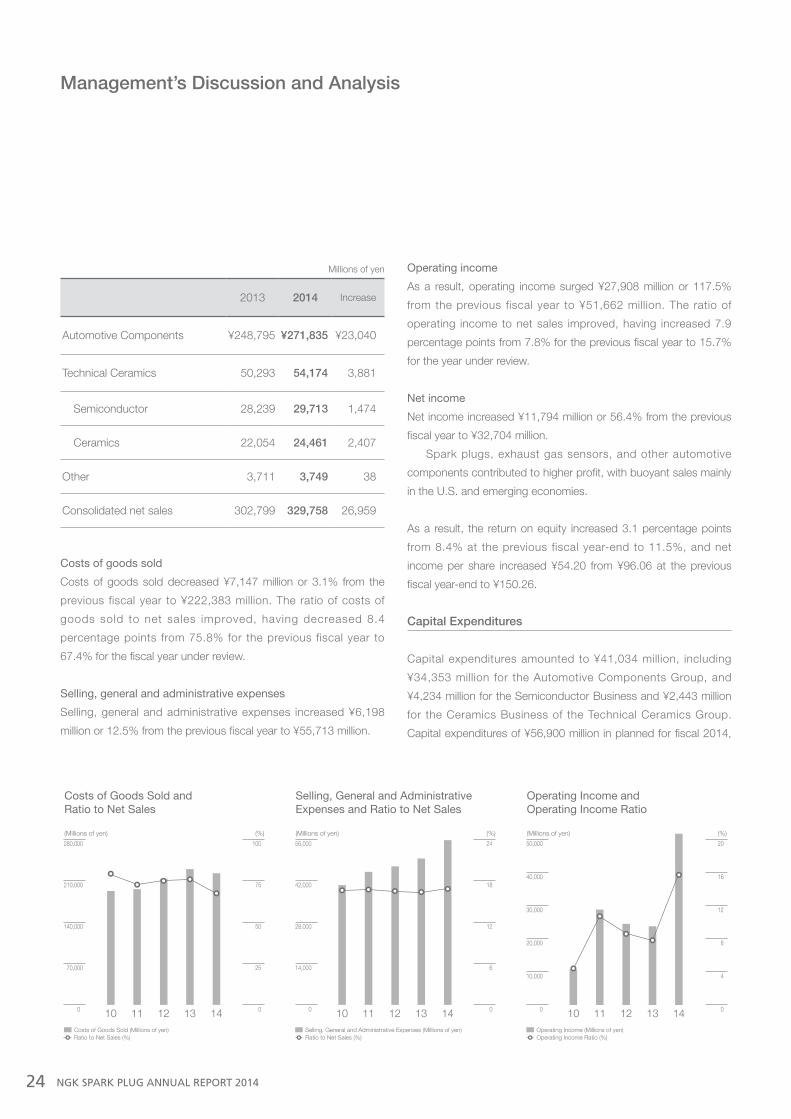
Millions of yen
2013 2014 Increase
Automotive Components ¥248,795 ¥271,835 ¥23,040
Technical Ceramics 50,293 54,174 3,881
Semiconductor 28,239 29,713 1,474
Ceramics 22,054 24,461 2,407
Other 3,711 3,749 38
Consolidated net sales 302,799 329,758 26,959
Costs of goods sold
Costs of goods sold decreased ¥7,147 million or 3.1% from the
previous fiscal year to ¥222,383 million. The ratio of costs of
goods sold to net sales improved, having decreased 8.4
percentage points from 75.8% for the previous fiscal year to
67.4% for the fiscal year under review.
Selling, general and administrative expenses
Selling, general and administrative expenses increased ¥6,198
million or 12.5% from the previous fiscal year to ¥55,713 million.
Operating income
As a result, operating income surged ¥27,908 million or 117.5%
from the previous fiscal year to ¥51,662 million. The ratio of
operating income to net sales improved, having increased 7.9
percentage points from 7.8% for the previous fiscal year to 15.7%
for the year under review.
Net income
Net income increased ¥11,794 million or 56.4% from the previous
fiscal year to ¥32,704 million.
Spark plugs, exhaust gas sensors, and other automotive
components contributed to higher profit, with buoyant sales mainly
in the U.S. and emerging economies.
As a result, the return on equity increased 3.1 percentage points
from 8.4% at the previous fiscal year-end to 11.5%, and net
income per share increased ¥54.20 from ¥96.06 at the previous
fiscal year-end to ¥150.26.
Capital Expenditures
Capital expenditures amounted to ¥41,034 million, including
¥34,353 million for the Automotive Components Group, and
¥4,234 million for the Semiconductor Business and ¥2,443 million
for the Ceramics Business of the Technical Ceramics Group.
Capital expenditures of ¥56,900 million in planned for fiscal 2014,
Management’s Discussion and Analysis
1414
(Millions of yen)
280,000
210,000
140,000
70,000
0
(%)
100
75
50
25
010 11 12 13
Costs of Goods Sold and Ratio to Net Sales
Costs of Goods Sold (Millions of yen)Ratio to Net Sales (%)
(Millions of yen)
56,000
42,000
28,000
14,000
0
(%)
24
18
12
6
010 11 12 13
Selling, General and AdministrativeExpenses and Ratio to Net Sales
Selling, General and Administrative Expenses (Millions of yen)Ratio to Net Sales (%)
(Millions of yen)
50,000
40,000
20,000
30,000
10,000
0
(%)
20
16
12
8
4
010 11 12 13
Operating Income andOperating Income Ratio
Operating Income (Millions of yen)Operating Income Ratio (%)
14
NGK SPARK PLUG ANNUAL REPORT 201424
011_0653701372608.indd 24 2014/08/20 16:08:38
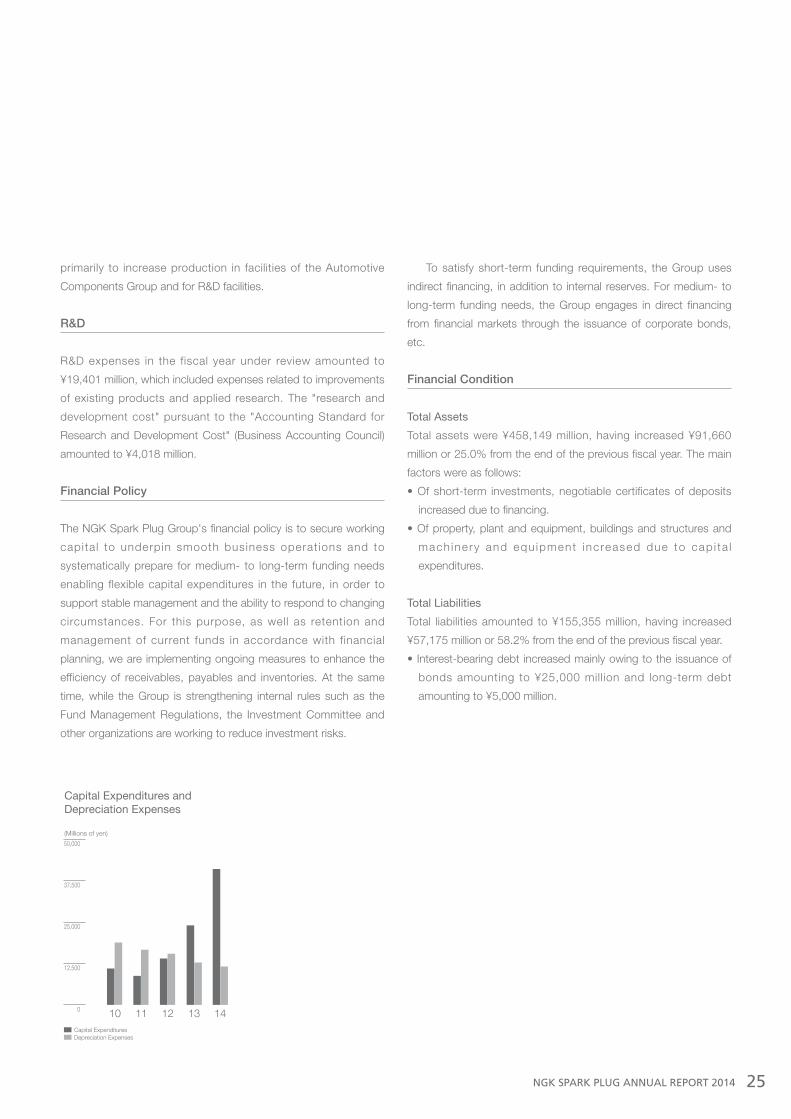
primarily to increase production in facilities of the Automotive
Components Group and for R&D facilities.
R&D
R&D expenses in the fiscal year under review amounted to
¥19,401 million, which included expenses related to improvements
of existing products and applied research. The "research and
development cost" pursuant to the "Accounting Standard for
Research and Development Cost" (Business Accounting Council)
amounted to ¥4,018 million.
Financial Policy
The NGK Spark Plug Group's financial policy is to secure working
capita l to underpin smooth business operat ions and to
systematically prepare for medium- to long-term funding needs
enabling flexible capital expenditures in the future, in order to
support stable management and the ability to respond to changing
circumstances. For this purpose, as well as retention and
management of current funds in accordance with financial
planning, we are implementing ongoing measures to enhance the
efficiency of receivables, payables and inventories. At the same
time, while the Group is strengthening internal rules such as the
Fund Management Regulations, the Investment Committee and
other organizations are working to reduce investment risks.
To satisfy short-term funding requirements, the Group uses
indirect financing, in addition to internal reserves. For medium- to
long-term funding needs, the Group engages in direct financing
from financial markets through the issuance of corporate bonds,
etc.
Financial Condition
Total Assets
Total assets were ¥458,149 million, having increased ¥91,660
million or 25.0% from the end of the previous fiscal year. The main
factors were as follows:
• Of short-term investments, negotiable certificates of deposits
increased due to financing.
• Of property, plant and equipment, buildings and structures and
mach inery and equ ipment inc reased due to cap i ta l
expenditures.
Total Liabilities
Total liabilities amounted to ¥155,355 million, having increased
¥57,175 million or 58.2% from the end of the previous fiscal year.
• Interest-bearing debt increased mainly owing to the issuance of
bonds amounting to ¥25,000 million and long-term debt
amounting to ¥5,000 million.
(Millions of yen)
50,000
37,500
25,000
12,500
0 10 11 12 13
Capital Expenditures andDepreciation Expenses
Capital ExpendituresDepreciation Expenses
14
NGK SPARK PLUG ANNUAL REPORT 2014 25
011_0653701372608.indd 25 2014/08/20 16:08:38

Net Assets
Net assets amounted to ¥302,794 million, having increased
¥34,485 million or 12.9% from the end of the previous fiscal year.
The main items were an increase of ¥27,480 million in retained
earnings and an increase of ¥6,052 million in foreign currency
translation adjustments.
Net assets per share amounted to ¥1,381.38 compared with
¥1,223.41 at the end of the previous fiscal year.
Cash Flows
Cash and cash equivalents at March 31, 2014, amounted to
¥68,967 million, in net value, including the effect of exchange rate
changes on cash and cash equivalents amounting to ¥1,420
million, having increased ¥19,092 million from the end of the
previous fiscal year.
Cash flows from operating activities
Net cash provided by operating activities was ¥54,698 million,
having increased ¥28,504 million from the previous fiscal year. This
increase was mainly attributable to an increase in income before
income taxes and minority interests.
Cash flows from investing activities
Net cash used in investing activities amounted to ¥61,149 million,
having increased ¥45,706 million from the previous fiscal year. This
increase was mainly attributable to an increase in property, plant
and equipment.
Cash flows from financing activities
Net cash provided by financing activities amounted to ¥24,123
million, whereas for the previous fiscal year, net cash used in
financing activities amounting to ¥15,495 million was recorded.
This increase was mainly attributable to issuance of bonds and
bank borrowings.
Dividend Policy
NGK Spark Plug regards returning profits to shareholders as one
of its most important management policies and will continue to
meet the expectations of shareholders under the basic policy of
continuing to pay stable dividends. We also think it is important to
provide shareholders with returns in line with earnings. While
maintaining a target dividend payout ratio of at least 20% of
consolidated net income for the time being, we decide the amount
Management’s Discussion and Analysis
(Millions of yen)
480,000
360,000
240,000
120,000
0 10 11 12 13
Total Assets
(Millions of yen)
320,000
240,000
160,000
80,000
0
(%)
100
75
50
25
010 11 12 13
Net Assets and Equity Ratio
Net Assets (Millions of yen)Equity Ratio (%)
14 14
NGK SPARK PLUG ANNUAL REPORT 201426
011_0653701372608.indd 26 2014/08/20 16:08:38
of dividends by comprehensively taking into consideration the
basic policy of paying stable dividends and of maintaining sufficient
internal reserves for R&D investment, capital expenditures for
business expansion and for rationalization of operations, and
investment in other companies, which are essential to future
growth. We intend to maintain dividend payments at twice a year,
consisting of an interim dividend and a year-end dividend. NGK
Spark Plug recognizes the effectiveness of share buybacks for
enhancing capital efficiency and intends to repurchase its shares,
as necessary.
In order to ensure flexibility in the returning of profits to
shareholders, our company's Articles of Incorporation specifies
dividends from surplus as a matter requiring resolution of the
board of directors.
The Company paid dividends per share of ¥28.0 for the fiscal
year ended March 31, 2014, consisting of an interim dividend of
¥13.0 and a year-end dividend of ¥15.0.
(Millions of yen)
75,000
50,000
25,000
0
-75,000
-25,000
-50,000
10 11 12 13
Cash Flows from Operating Activitiesand Investing Activities
Cash Flows from Operating ActivitiesCash Flows from Investing Activities
(Yen)
28
21
14
7
0
(%)
60
45
30
15
010 11 12 13
Cash Dividends and Payout Ratio
Cash Dividends (Yen)Payout Ratio (%)
14 14
NGK SPARK PLUG ANNUAL REPORT 2014 27
011_0653701372608.indd 27 2014/08/20 16:08:38

NGK SPARK PLUG ANNUAL REPORT 201428
Consolidated Balance SheetsNGK SPARK PLUG CO., LTD. and Consolidated SubsidiariesMarch 31, 2014 and 2013
Millions of yen Thousands of U.S. dollars
2014 2013 2014
Current assets:
Cash and cash equivalents (Note 3) ¥ 68,967 ¥ 49,875 $ 669,583
Short-term investments (Notes 3 and 6) 43,485 20,763 422,184
Notes and accounts receivable, net of allowance for doubtful accounts (Notes 3 and 4) 69,864 59,571 678,291
Inventories (Note 5) 71,070 67,845 690,000
Deferred tax assets (Note 16) 12,785 8,805 124,126
Other current assets 3,039 3,382 29,505
Total current assets 269,210 210,241 2,613,689
Investments and other assets:
Investment securities (Notes 3 and 6) 54,656 47,205 530,641
Investments in unconsolidated subsidiaries and associates (Note 3) 6,489 5,873 63,000
Intangible assets (Note 7) 3,621 3,827 35,155
Deferred tax assets (Note 16) 1,000 926 9,709
Other assets 2,181 1,447 21,175
Less allowance for doubtful accounts (104) (104) (1,010)
Total investments and other assets 67,843 59,174 658,670
Property, plant and equipment:
Land 15,147 15,131 147,058
Buildings and structures 146,880 134,995 1,426,019
Machinery and equipment 240,002 232,732 2,330,117
Construction in progress 15,671 8,967 152,146
Total property, plant and equipment 417,700 391,825 4,055,340
Less accumulated depreciation (296,604) (294,751) (2,879,650)
Net property, plant and equipment 121,096 97,074 1,175,690
Total assets ¥458,149 ¥366,489 $4,448,049
See accompanying Notes to Consolidated Financial Statements.
011_0653701372608.indd 28 2014/08/20 16:08:38
NGK SPARK PLUG ANNUAL REPORT 2014 29
Millions of yen Thousands of U.S. dollars
2014 2013 2014
Current liabilities:
Short-term borrowings (Notes 3 and 9) ¥ 1,595 ¥ 1,433 $ 15,485
Current portion of long-term debt (Notes 3 and 9) 10,252 303 99,534
Accounts payable (Notes 3 and 8) 35,909 28,397 348,631
Accrued expenses 16,238 14,159 157,651
Income taxes payable 16,411 4,854 159,330
Deferred tax liabilities (Note 16) 1 94 10
Other current liabilities 1,254 2,059 12,175
Total current liabilities 81,660 51,299 792,816
Long-term debt (Notes 3 and 9) 45,493 25,683 441,680
Employee retirement benefit liability (Note 10) — 17,401 —
Net defined benefit liability (Note 10) 23,522 — 228,369
Deferred tax liabilities (Note 16) 3,459 2,334 33,582
Other long-term liabilities 1,221 1,463 11,854
Total liabilities 155,355 98,180 1,508,301
Commitments and contingent liabilities (Notes 11 and 12)
Net assets (Note 14):
Shareholders’ equity:
Common stock: authorized 390,000,000 shares; issued 223,544,820 shares 47,869 47,869 464,748
Capital surplus 54,825 54,825 532,281
Retained earnings 195,042 167,562 1,893,612
Less treasury stock at cost: 5,911,360 shares in 2014 and 5,877,441 shares in 2013 (7,611) (7,540) (73,893)
Total shareholders’ equity 290,125 262,716 2,816,748
Accumulated other comprehensive income:
Net unrealized gains on available-for-sale securities 21,138 16,176 205,223
Foreign currency translation adjustments (6,544) (12,596) (63,534)
Remeasurements of defined benefit plans (Note 10) (4,084) — (39,650)
Total accumulated other comprehensive income 10,510 3,580 102,039
Minority interests 2,159 2,013 20,961
Total net assets 302,794 268,309 2,939,748
Total liabilities and net assets ¥458,149 ¥366,489 $4,448,049
011_0653701372608.indd 29 2014/08/20 16:08:38

Consolidated Statements of IncomeNGK SPARK PLUG CO., LTD. and Consolidated SubsidiariesFor the Years Ended March 31, 2014 and 2013
Millions of yen Thousands of U.S. dollars
2014 2013 2014
Operating revenue:
Net sales (Note 18) ¥329,758 ¥302,799 $3,201,534
Operating costs and expenses:
Costs of goods sold 222,383 229,530 2,159,058
Selling, general and administrative expenses 55,713 49,515 540,903
278,096 279,045 2,699,961
Operating income (Note 18) 51,662 23,754 501,573
Other income (expenses):
Interest and dividend income 2,017 1,802 19,582
Interest expense (536) (556) (5,204)
(Loss) gain on sale or disposal of property, plant and equipment (332) 118 (3,223)
Depreciation of idle property, plant and equipment (251) (393) (2,437)
Impairment loss on fixed assets (Note 15) (5,143) — (49,932)
Equity in net earnings of associates 231 575 2,243
Foreign exchange gain 1,505 1,626 14,612
Other, net 343 804 3,330
(2,166) 3,976 (21,029)
Income before income taxes and minority interests 49,496 27,730 480,544
Income tax expenses (Note 16):
Current 20,146 8,059 195,592
Deferred (3,658) (1,554) (35,514)
Total income tax expenses 16,488 6,505 160,078
Income before minority interests 33,008 21,225 320,466
Less minority interests in net income of consolidated subsidiaries 304 315 2,951
Net income ¥ 32,704 ¥ 20,910 $ 317,515
Yen U.S. dollars
Per share:
Net income - basic ¥150.26 ¥96.06 $1.46
Cash dividends (Note 14) 28.00 22.00 0.28
See accompanying Notes to Consolidated Financial Statements.
NGK SPARK PLUG ANNUAL REPORT 201430
011_0653701372608.indd 30 2014/08/20 16:08:38
Consolidated Statements of Comprehensive IncomeNGK SPARK PLUG CO., LTD. and Consolidated SubsidiariesFor the Years Ended March 31, 2014 and 2013
Millions of yen Thousands of U.S. dollars
2014 2013 2014
Income before minority interests ¥33,008 ¥21,225 $320,466
Other comprehensive income:
Unrealized gains on available-for-sale securities 4,905 4,343 47,621
Foreign currency translation adjustments 5,581 11,522 54,185
Share of other comprehensive income of associates accounted for using the equity method 535 631 5,194
Total other comprehensive income (Note 17) 11,021 16,496 107,000
Comprehensive income ¥44,029 ¥37,721 $427,466
Comprehensive income attributable to:
Owners of the parent ¥43,719 ¥37,040 $424,456
Minority interests 310 681 3,010
Total comprehensive income ¥44,029 ¥37,721 $427,466
See accompanying Notes to Consolidated Financial Statements.
NGK SPARK PLUG ANNUAL REPORT 2014 31
011_0653701372608.indd 31 2014/08/20 16:08:38

Shareholders’ equity Accumulated other comprehensive income
Number of shares of common
stock issuedCommon
stockCapital surplus
Retained earnings
Treasury stock
Total shareholders’
equity
Net unrealized gains on
available—for—sale securities
Foreign currency
translation adjustments
Remeasurements of defined benefit
plans
Total accumulated other
comprehensive income
Minority interests
Total net assets
Millions of yen
Balance at April 1, 2012 223,544,820 ¥47,869 ¥54,825 ¥151,441 ¥(7,526) ¥246,609 ¥11,815 ¥(24,366) ¥ — ¥(12,551) ¥1,555 ¥235,613
Net income for the year — — — 20,910 — 20,910 — — — — — 20,910
Cash dividends — — — (4,789) — (4,789) — — — — — (4,789)
Purchases of treasury stock and
fractional shares, net of sales — — — — (14) (14) — — — — — (14)
Net changes other than changes in
shareholders' equity for the year — — — — — — 4,361 11,770 — 16,131 458 16,589
Balance at March 31, 2013 223,544,820 47,869 54,825 167,562 (7,540) 262,716 16,176 (12,596) — 3,580 2,013 268,309
Net income for the year — — — 32,704 — 32,704 — — — — — 32,704
Cash dividends — — — (5,224) — (5,224) — — — — — (5,224)
Purchases of treasury stock — — — — (71) (71) — — — — — (71)
Net changes other than changes in
shareholders' equity for the year — — — — — — 4,962 6,052 (4,084) 6,930 146 7,076
Balance at March 31, 2014 223,544,820 ¥47,869 ¥54,825 ¥195,042 ¥ (7,611) ¥290,125 ¥21,138 ¥ (6,544) ¥ (4,084) ¥ 10,510 ¥2,159 ¥302,794
Thousands of U.S. dollars
Balance at March 31, 2013 $464,748 $532,281 $1,626,816 $(73,204) $2,550,641 $157,048 $(122,291) $ — $ 34,757 $19,544 $2,604,942
Net income for the year — — 317,515 — 317,515 — — — — — 317,515
Cash dividends — — (50,719) — (50,719) — — — — — (50,719)
Purchases of treasury stock — — — (689) (689) — — — — — (689)
Net changes other than changes in
shareholders' equity for the year — — — — — 48,175 58,757 (39,650) 67,282 1,417 68,699
Balance at March 31, 2014 $464,748 $532,281 $1,893,612 $(73,893) $2,816,748 $205,223 $ (63,534) $(39,650) $ 102,039 $20,961 $2,939,748
See accompanying Notes to Consolidated Financial Statements.
Consolidated Statements of Changes in Net AssetsNGK SPARK PLUG CO., LTD. and Consolidated SubsidiariesFor the Years Ended March 31, 2014 and 2013
NGK SPARK PLUG ANNUAL REPORT 201432
011_0653701372608.indd 32 2014/08/20 16:08:38
Consolidated Statements of Cash Flows NGK SPARK PLUG CO., LTD. and Consolidated SubsidiariesFor the Years Ended March 31, 2014 and 2013
Millions of yen Thousands of U.S. dollars
2014 2013 2014
Cash flows from operating activities:
Income before income taxes and minority interests ¥49,496 ¥27,730 $480,544
Adjustments for:
Depreciation 11,567 12,798 112,301
Impairment loss on fixed assets 5,143 — 49,932
Amortization of goodwill (16) (16) (155)
Equity in net earnings of associates (231) (575) (2,243)
(Increase) decrease in trade receivables (4,602) 4,674 (44,680)
Decrease in inventories 1,064 1,559 10,330
Decrease in trade payables (125) (12,720) (1,213)
Other, net 319 (4,337) 3,097
Subtotal 62,615 29,113 607,913
Interest and dividends received 1,994 2,126 19,359
Interest paid (518) (581) (5,029)
Income taxes paid (9,393) (4,464) (91,194)
Net cash provided by operating activities 54,698 26,194 531,049
Cash flows from investing activities:
Increase in property, plant and equipment (37,506) (19,467) (364,136)
Increase in intangible assets (1,252) (993) (12,155)
Increase in long-term investments (10,151) (8,986) (98,553)
Decrease in long-term investments 5,107 13,801 49,582
Net increase in short-term investments (17,414) (832) (169,068)
Other, net 67 1,034 650
Net cash used in investing activities (61,149) (15,443) (593,680)
Cash flows from financing activities:
Issuance of long-term debt 24,878 — 241,534
Proceeds from long-term debt 5,000 — 48,544
Repayment of long-term debt (336) (10,373) (3,262)
Net increase (decrease) in short-term borrowings 42 (90) 407
Dividends paid (5,229) (4,795) (50,767)
Purchase of treasury stock and fractional shares, net of sales (71) (14) (689)
Other, net (161) (223) (1,563)
Net cash provided by (used in) financing activities 24,123 (15,495) 234,204
Effect of exchange rate changes on cash and cash equivalents 1,420 2,794 13,787
Net increase (decrease) in cash and cash equivalents 19,092 (1,950) 185,360
Cash and cash equivalents at beginning of year 49,875 51,825 484,223
Cash and cash equivalents at end of year ¥68,967 ¥49,875 $669,583
See accompanying Notes to Consolidated Financial Statements.
NGK SPARK PLUG ANNUAL REPORT 2014 33
011_0653701372608.indd 33 2014/08/20 16:08:38

1. Basis of Consolidated Financial Statements
The accompanying consolidated financial statements of NGK SPARK PLUG CO., LTD. (the “Company”) and its consolidated subsidiaries (together with the Company, the “NGK Spark Plug Group”) have been prepared in accordance with the provisions set forth in the Financial Instrument and Exchange Law of Japan and its related accounting regulations and in conformity with accounting principles generally accepted in Japan (“Japanese GAAP”), which are different in certain respects as to application and disclosure requirements from International Financial Reporting Standards (“IFRS”).
The accompanying consolidated financial statements have been reformatted and translated into English, with some expanded descriptions, from the consolidated financial statements of the Company prepared in accordance with Japanese GAAP and filed with the appropriate Local Finance Bureau of the Ministry of Finance as required by the Financial Instrument and Exchange Law of Japan. Certain supplementary information included in the statutory Japanese language consolidated financial statements is not presented in the accompanying consolidated financial statements.
The translation of the Japanese yen amounts into U.S. dollar amounts is included solely for the convenience of readers outside Japan, using the approximate exchange rate prevailing at March 31, 2014, which was ¥103 to U.S. $1.00. The translation should not be construed as a representation that the Japanese yen amounts have been, could have been or could in the future be converted into U.S. dollars at this or any other rate of exchange.
Certain comparative figures have been reclassified to conform to the current year’s presentation.
2. Summary of Significant Accounting Policies
(a) Principles of consolidation
The accompanying consolidated financial statements include the accounts of the Company and its significant subsidiaries. Investments in significant unconsolidated subsidiaries and associates are accounted for by the equity method. Investments in unconsolidated subsidiaries and associates not accounted for by the equity method are stated at cost. All intercompany transactions and accounts have been eliminated. The difference between the cost of investments in subsidiaries and the underlying equity in their net assets, adjusted based on the fair value at the time of acquisition, is principally deferred as goodwill and amortized over the estimated useful life, generally 5 years, on a straight-line basis.
The number of consolidated subsidiaries and associates accounted for by the equity method for the years ended March 31, 2014 and 2013 was as follows:
2014 2013
Consolidated subsidiaries:Domestic 9 9Overseas 25 24
Associates accounted for by the equity method 3 3
Investments in the remaining unconsolidated subsidiaries and associated companies are stated at cost. If the equity method of accounting had been applied to the investments in these
companies, the effect on the accompanying consolidated financial statements would not have been material.
For the year ended March 31, 2014, the fiscal year-end date of NGK Spark Plug (Shanghai) Co., Ltd., Changshu NGK Spark Plug Co., Ltd., Bujias NGK de Mexico S.A. de C.V., LLC NGK Spark Plugs (Eurasia) and Woo Jin Industry Co., Ltd. is December 31. However, when preparing consolidated financial statements, the Company uses the financial statements of the four consolidated subsidiaries and one associate which have been compiled by a temporary closing of their accounts as of March 31.
Effective from the fiscal year ended March 31, 2013, seventeen overseas consolidated subsidiaries (NGK Spark Plug Europe GmbH, etc.) changed their fiscal year-end date from December 31 to March 31. These changes were made in order to improve the NGK Spark Plug Group’s managerial planning and disclosures on a consolidated basis and to prepare for the future adoption of IFRS. The fiscal year-end date of NGK Spark Plug (Shanghai) Co., Ltd., Changshu NGK Spark Plug Co., Ltd., Bujias NGK de Mexico S.A. de C.V. and Woo Jin Industry Co., Ltd. is December 31. However, when preparing consolidated financial statements, the Company uses the financial statements of the three consolidated subsidiaries and one associate which have been compiled by a temporary closing of their accounts as of March 31. Accordingly, the accompanying consolidated statements of income for the year ended March 31, 2013 included the operating results of twenty consolidated subsidiaries and one associate for the 15-month period from January 1, 2012 to March 31, 2013. As a result, for the year ended March 31, 2013, net sales, operating income and net income were ¥39,063 million, ¥3,826 million and ¥2,265 million more, respectively, than the amounts that would have been recorded without the change.
(Unification of accounting policies applied to foreign subsidiaries for consolidated financial statements)The Company has adopted Practical Issues Task Force (“PITF”) No. 18, “Practical Solution on Unification of Accounting Policies Applied to Foreign Subsidiaries for Consolidated Financial Statements,” issued by the Accounting Standards Board of Japan (“ASBJ”). PITF No. 18 requires that accounting policies and procedures applied by a parent company and its subsidiaries to similar transactions and events under similar circumstances should, in principle, be unified for the preparation of the consolidated financial statements. PITF No. 18, however, as a tentative measure, allows a parent company to prepare consolidated financial statements using foreign subsidiaries’ financial statements prepared in accordance with either IFRS or U.S. generally accepted accounting principles (“U.S. GAAP”). In this case, adjustments for the following five items are required in the consolidation process so that their impact on net income is accounted for in accordance with Japanese GAAP, unless the impact is not material.
(a) Goodwill not subject to amortization(b) Actuarial gains and losses of defined benefit retirement
plans recognized outside profit and loss(c) Capitalized expenditures for research and development
activities(d) Fair value measurement of investment properties and
revaluation of property, plant and equipment and
Notes to Consolidated Financial StatementsNGK SPARK PLUG CO., LTD. and Consolidated Subsidiaries
NGK SPARK PLUG ANNUAL REPORT 201434
011_0653701372608.indd 34 2014/08/20 16:08:38
intangible assets(e) Accounting for net income attributable to minority
interests
( Unification of accounting policies applied to associates accounted for using the equity method)The Company also has adopted ASBJ PITF No. 24, “Practical Solution on Unification of Accounting Policies Applied to Associates Accounted for Using the Equity Method.” PITF No. 24 requires that accounting policies and procedures applied by an investment company and its associates to similar transactions and events under similar circumstances should, in principle, be unified for applying the equity method. PITF No. 24, however, as a tentative measure, allows an investment company to apply the equity method using foreign associates’ financial statements prepared in accordance with either IFRS or U.S. GAAP. In this case, adjustments for the same five items as PITF No. 18 are required in the consolidation process so that their impact on net income is accounted for in accordance with Japanese GAAP, unless the impact is not material.
(b) Cash equivalents
The NGK Spark Plug Group considers highly liquid debt instruments purchased with an original maturity of three months or less to be cash equivalents.
(c) Investments and marketable securities
The NGK Spark Plug Group classifies certain investments in debt and equity securities as “held-to-maturity,” “trading” or “available-for-sale.” The classification determines the respective accounting method to be applied to the investments as stipulated by the accounting standards for financial instruments. The NGK Spark Plug Group has no securities categorized as trading or held-to-maturity securities. Available-for-sale securities are stated at fair value if such value is available, and net unrealized gain or loss on these securities is reported as a component of accumulated other comprehensive income, net of applicable income taxes. Gains and losses on the disposal of available-for-sale securities are computed by the moving average method. Available-for-sale securities without available fair value are carried at cost determined by the moving average method. Adjustments in the carrying values of individual investment securities are charged to income through write-downs when a decline in value is deemed other than temporary.
(d) Accounting for derivatives
Derivative instruments are valued at fair value if hedge accounting is not appropriate or when there is no hedging designation, and the gains and losses on the derivatives are recognized in current earnings. According to the special treatment as permitted by the accounting standard for financial instruments, if interest rate and currency swap contracts are used as a hedge and meet certain hedging criteria, the interest rate and currency swap contracts are not remeasured at market price, and the amount to be received under the interest rate and currency swap contracts is added to or deducted from the interest on the liabilities for which the swap contracts are executed, and the liabilities denominated in foreign currencies, for which the interest rate and currency swap contracts are
executed, are translated at the contracted rate. Measurement of hedge effectiveness is not considered necessary for interest rate and currency swap contracts that meet the requirements for the special treatment.
(e) Inventories
Inventories held for sale in the ordinary course of business are valued at the lower of cost, determined principally by the moving average method, or net realizable value. If net realizable value has fallen below cost at of the end of the period, the cost basis is reduced to net realizable value and regarded as decreased profitability of inventories.
(f) Allowance for doubtful accounts
Allowance for doubtful accounts has been provided for at the aggregate amount of estimated credit losses based on an individual review of certain doubtful or troubled receivables and a general reserve for other receivables based on the historical loss experience of a certain past period.
(g) Property, plant and equipment and depreciation
Property, plant and equipment, including significant renewals and additions, are stated at cost. Depreciation is calculated based on the estimated useful life of the asset by the straight-line method.
Expenditures on maintenance and repairs are charged to income as incurred. Upon disposal, the cost and accumulated depreciation are removed from the related accounts and any gain or loss is recorded as income or expense.
( Changes in accounting policies for depreciation methods that are not distinguishable from changes in accounting estimates)The Company and its domestic consolidated subsidiaries had depreciated property, plant and equipment, except for buildings, using the declining balance method. From the fiscal year ended March 31, 2013, the Company and its domestic consolidated subsidiaries have changed their depreciation method for all properties to the straight-line method. This change is based on the NGK Spark Plug Group’s judgment that applying a depreciation method to match revenues and expenses by allocating acquisition costs of property, plant and equipment equally over its useful life would be more appropriate accurate as a result of a reassessment of the actual use of the properties following an expansion of capital expenditures in accordance with domestic “Automotive components” operations growth and the steady contributions for investment and earnings. In addition, unifying the NGK Spark Plug Group's accounting policies to the straight-line method is consistent with the practices of the overseas consolidated subsidiaries, which calculate depreciation by the straight-line method and whose capital expenditures are on the rise. As a result, for the year ended March 31, 2013, depreciation costs were ¥2,637 million less, operating income ¥2,123 million more and income before income taxes and minority interests ¥2,345 million more than the amounts that would have been recorded without the change.
(Change of accounting estimates for the useful life of property)From the fiscal year ended March 31, 2013, the Company and its domestic consolidated subsidiaries have changed the useful life of machinery and equipment in the “Automotive components”
NGK SPARK PLUG ANNUAL REPORT 2014 35
011_0653701372608.indd 35 2014/08/20 16:08:38

and “Ceramics” business to the years of actual product use, considering years of usage, repair cycles and payout periods of machinery and equipment. As a result, for the year ended March 31, 2013, depreciation costs were ¥1,667 million less and operating income and income before income taxes and minority interests ¥1,426 million more than the amounts that would have been recorded without the change.
(h) Leases
The Company and its domestic consolidated subsidiaries have adopted the “Accounting Standard for Lease Transactions” (ASBJ Statement No. 13) and its “Guidance on Accounting Standard for Lease Transactions” (Guidance No. 16), revised by ASBJ on March 30, 2007. The revised accounting standard requires that all finance lease transactions be accounted for in a manner similar to that used for ordinary sale and purchase transactions. The Company and its domestic consolidated subsidiaries as lessee capitalize the assets used under finance leases commenced on or after April 1, 2008, except for certain immaterial or short-term finance leases which are accounted for as operating leases, in accordance with the revised standard. Depreciation is calculated using the straight-line method over the lease term and assuming no residual value. As permitted, finance leases which commenced prior to April 1, 2008 and have been accounted for with accounting treatment similar to that used for operating leases continue to be accounted for with accounting treatment similar to that used for operating leases, with the disclosure of certain “as if capitalized” information.
(i) Impairment of fixed assets
The Company and its domestic consolidated subsidiaries have adopted the “Accounting Standard for Impairment of Fixed Assets” and the related practical guidance. The standard requires that fixed assets be reviewed for impairment whenever events or changes in circumstances indicate that the carrying amount of an asset may not be recoverable. An impairment loss is recognized in the income statement by reducing the carrying amount of the impaired asset or a group of assets to the recoverable amount, measured by the higher of the asset’s net selling price or value in use. Fixed assets include land, plants, buildings and other forms of property, including intangible assets, and are to be grouped at the lowest level for which there are identifiable cash flows from other groups of assets. For the purpose of recognition and measurement of an impairment loss, fixed assets of the NGK Spark Plug Group, other than idle or unused property, are grouped into cash generating units based on managerial accounting classifications.
(j) Employee retirement benefits
The difference between retirement benefit obligations and plan assets has been recognized as net defined benefit liability. To calculate the retirement benefit obligations, the straight-line method is used to allocate estimated retirement benefits. Past service costs that are yet to be recognized are amortized on a straight-line basis over ten years, a period not exceeding the average remaining period of the employees. Actuarial gains and losses that are yet to be recognized are amortized on a straight-line basis over ten years, a period not exceeding the average remaining service period of employees, from the year following
the year in which they arise. Net defined benefit liability and retirement benefit costs of certain consolidated subsidiaries are calculated using the simplified method as permitted by the accounting standard for retirement benefits.
(Changes in accounting policies for retirement benefits)Effective from the year ended March 31, 2014, the NGK Spark Plug Group applies the Accounting Standard for Retirement Benefits (ASBJ Statement No. 26, May 17, 2012 (hereinafter, “Statement No. 26”)) and Guidance on Accounting Standard for Retirement Benefits (ASBJ Guidance No. 25, May 17, 2012 (hereinafter, “Guidance No. 25”)) except Article 35 of Statement No. 26 and Article 67 of the Guidance No. 25, and actuarial gains and losses and past service costs that are yet to be recognized have been recognized and the difference between retirement benefit obligations and plan assets has been recognized as net defined benefit liability.
In accordance with Article 37 of the Statement No. 26, the effect of the change in accounting policies arising from initial application has been recognized in remeasurements of defined benefit plans in accumulated other comprehensive income. As a result, net defined benefit liability in the amount of ¥23,522 million ($228,369 thousand) has been recognized and accumulated other comprehensive income was ¥4,084 million ($39,650 thousand) less and minority interests ¥4 million ($39 thousand) less at the end of the current fiscal year than the amounts that would have been recorded without the change.
(k) Translation of foreign currency accounts
Receivables, payables and securities, other than stocks of subsidiaries and certain other securities, are translated into Japanese yen at exchange rates prevailing at the fiscal year-end. Transactions in foreign currencies are recorded based on the exchange rates prevailing on the transaction dates. Resulting translation gains and losses are included in current earnings.
For financial statement items of the overseas consolidated subsidiaries, all asset and liability accounts are translated into Japanese yen by applying the exchange rate in effect at the respective fiscal year-end. All income and expense accounts are translated at the average rate of exchange prevailing during each year. Translation differences, after allocating portions attributable to minority interests, are reported in foreign currency translation adjustments as a component of accumulated other comprehensive income in the accompanying consolidated balance sheets.
(l) Research and development expenses
Expenses related to research and development are charged to income as incurred. Research and development expenses arise from a wide range of the NGK Spark Plug Group’s activities, including basic and applied research for material development, planning and designing of new products and processes and activities aimed at improving existing products and processes. For the years ended March 31, 2014 and 2013, research and development expenses aggregated ¥19,439 million ($188,728 thousand) and ¥17,101 million, respectively. These amounts included research and development activities for basic and applied research and the development of new products and processes in the amount of ¥4,018 million ($39,010 thousand) and ¥3,734 million at March 31, 2014 and 2013, respectively,
NGK SPARK PLUG ANNUAL REPORT 201436
011_0653701372608.indd 36 2014/08/20 16:08:38
and were recorded as general and administrative expenses. The remaining expenses were recorded for the respective years in the accompanying consolidated statements of income as manufacturing costs.
(m) Bond issue costs
Bond issue costs are charged to income when incurred.
(n) Income taxes
Income taxes are accounted for by the asset-liability method. Deferred tax assets and liabilities are recognized for the future tax consequences attributable to differences between the financial statement carrying amounts of existing assets and liabilities and their respective tax bases and operating loss carry-forwards. Deferred tax assets and liabilities are measured using the enacted tax rates expected to apply to taxable income in the years in which those temporary differences are expected to be recovered or settled. The effect on deferred tax assets and liabilities of a change in tax rates is recognized in the period that includes the promulgation date.
(o) Enterprise taxes
The NGK Spark Plug Group records enterprise taxes calculated based on the “added value” and “capital” amounts when levied as size-based corporate taxes for local government enterprise taxes, which are included in selling, general and administrative expenses.
(p) Appropriation of retained earnings
Cash dividends are recorded in the fiscal year when a proposed appropriation of retained earnings is approved by the Board of Directors of the Company.
(q) Per share data
Basic net income per share is computed by dividing income available to common shareholders by the weighted average number of shares of common stock outstanding during the year. Diluted net income per share is not disclosed as the NGK Spark Plug Group had no dilutive common shares. Cash dividends per share shown for each fiscal year in the accompanying consolidated statements of income represent dividends declared by the Company as applicable to the respective year.
(r) New accounting standards issued but not yet adopted
(Accounting standard for retirement benefits) On May 17, 2012, the ASBJ issued ASBJ Statement No. 26, “Accounting Standard for Retirement Benefits” and ASBJ Guidance No. 25, “Guidance on Accounting Standard for Retirement Benefits,” which together replaced the accounting standard for retirement benefits originally issued by the Business Accounting Council of Japan in 1998. Under the amended rule, actuarial differences and past service costs that have not been recognized in profit or loss are to be recognized within the net asset section, after adjusting for tax effects, and the deficit or surplus is to be recognized as a liability or asset without any adjustments. For determining the method of attributing expected benefit to periods, the new standard allows the choice of benefit formula basis or straight-line basis. Pursuant to the amendment, the method used to determine the discount rate has also been
changed.Amendments related to the determination of retirement
benefit obligations and current service costs are effective from the beginning of annual periods ending on or after March 31, 2015.
The NGK Spark Plug Group is currently in the process of determining the effects of this new standard on the consolidated financial statements.
3. Financial Instruments
(a) Qualitative information on financial instruments
The NGK Spark Plug Group does not invest surplus funds in securities other than short-term bank deposits and debt securities with high liquidity from issuers with high credit ratings in accordance with fund management policies. The NGK Spark Plug Group uses indirect financing from financial institutions such as correspondent banks and direct financing from financial markets principally by the issuance of corporate bonds to satisfy short-term and long-term funding requirements.
The NGK Spark Plug Group is exposed to credit risk primarily with respect to trade receivables. In order to reduce the credit risk of these receivables, the NGK Spark Plug Group sets payment terms according to the credit capability of its customers. In some cases, the NGK Spark Plug Group receives security deposits in advance.
The NGK Spark Plug Group holds investments in securities such as negotiable certificates of deposits, debt securities and equity securities whose fair values are monitored on a quarterly basis.
The NGK Spark Plug Group is a party to derivative instruments such as foreign currency forward exchange contracts, currency option contracts and interest rate and currency swap agreements in the normal course of business principally for hedging purposes in order to reduce its own exposure to fluctuations in exchange rates and interest rates. The NGK Spark Plug Group does not hold or issue derivative financial instruments for trading purposes. Under the NGK Spark Plug Group’s financial management policies, contract balances of currency derivatives are limited to certain anticipated export sales and import purchases.
NGK SPARK PLUG ANNUAL REPORT 2014 37
011_0653701372608.indd 37 2014/08/20 16:08:38

(b) Fair value of financial instruments
The fair value and carrying value of financial instruments at March 31, 2014 and 2013, other than unlisted equity securities for which the fair value was extremely difficult to determine, were as follows:
Carrying value Fair Value Difference
Millions of yen
At March 31, 2014:Financial assets:
Cash and cash equivalents ¥ 68,967 ¥ 68,967 ¥ —Short-term investments 43,485 43,485 —Trade receivables 61,992 61,992 —Investment securities: Available-for-sale securities 53,919 53,919 —
Total ¥228,363 ¥228,363 ¥ —Financial liabilities (*1):
Short-term borrowings ¥ (1,595) ¥ (1,595) ¥ —Long-term bank loans (5,000) (5,015) (15)Trade payables (23,625) (23,625) —Bonds payable, including current portion (50,000) (50,348) (348)
Total ¥ (80,220) ¥ (80,583) ¥ (363)Derivative instruments (*2) ¥ 30 ¥ 30 ¥ —
At March 31, 2013:Financial assets:
Cash and cash equivalents ¥ 49,875 ¥ 49,875 ¥ —Short-term investments 20,763 20,763 —Trade receivables 53,103 53,103 —Investment securities: Available-for-sale securities 46,489 46,489 —
Total ¥170,230 ¥170,230 ¥ —Financial liabilities (*1):
Short-term borrowings ¥ (1,433) ¥ (1,433) ¥ —Trade payables (18,814) (18,814) —Bonds payable, including current portion (25,000) (25,588) (588)
Total ¥ (45,247) ¥ (45,835) ¥ (588)Derivative instruments (*2) ¥ (419) ¥ (419) ¥ —
Thousands of U.S. dollars
At March 31, 2014:Financial assets:
Cash and cash equivalents $ 669,583 $ 669,583 $ —Short-term investments 422,184 422,184 —Trade receivables 601,864 601,864 —Investment securities: Available-for-sale securities 523,486 523,486 —
Total $2,217,117 $2,217,117 $ —Financial liabilities (*1):
Short-term borrowings $ (15,485) $ (15,485) $ —Long-term bank loans (48,544) (48,689) (145)Trade payables (229,369) (229,369) —Bonds payable, including current portion (485,437) (488,816) (3,379)
Total $ (778,835) $ (782,359) $ (3,524)Derivative instruments (*2) $ 291 $ 291 $ —
*1) Amounts in parenthesis reflect liabilities.
*2) The value of derivative instruments is shown as a net position.
Notes:(1) The methods and assumptions used to estimate the fair value
of financial instruments are summarized below: The fair value of cash and cash equivalents, trade receivables,
short-term borrowings and trade payables is approximately equal to the carrying value due to their short-term maturities. The fair value of investment equity securities is based on quoted market prices. The fair value of bonds and other securities included in investment securities, bonds payable and derivative instruments is based on the price provided by corresponding financial institutions. The fair value of long-term bank loans is computed based on the total amount of principal and interest discounted at an interest rate applicable to new loans under the same conditions.
(2) The following securities are not included in the table above because the fair value was extremely difficult to determine.
Carrying value
Millions of yenThousands of U.S. dollars
2014 2013 2014
Investments (equity securities) in unconsolidated subsidiaries and associates ¥6,489 ¥5,873 $63,000Unlisted equity securities 429 409 4,165
(3) Expected maturities of financial assets at March 31, 2014 were as follows:
Due in one year or less
Due after one year through
five yearsDue after five
years
Millions of yen
At March 31, 2014:Cash and cash equivalents ¥ 68,967 ¥ — ¥—Trade receivables 61,992 — —Investments 40,142 7,101 —
¥171,101 ¥7,101 ¥—
Thousands of U.S. dollars
At March 31, 2014:Cash and cash equivalents $ 669,583 $ — $—Trade receivables 601,864 — —Investments 389,728 68,942 —
$1,661,175 $68,942 $—
Contractual maturities of bank loans at March 31, 2014 were as follows:
Year ending March 31, Millions of yenThousands of U.S. dollars
2015 ¥1,595 $15,4852016 — —2017 — —2018 — —2019 5,000 48,544
¥6,595 $64,029
Contractual maturities of bonds payable at March 31, 2014 were as follows:
Year ending March 31, Millions of yenThousands of U.S. dollars
2015 ¥10,000 $ 97,0872016 15,000 145,6312017 — —2018 — —2019 25,000 242,719
¥50,000 $485,437
NGK SPARK PLUG ANNUAL REPORT 201438
011_0653701372608.indd 38 2014/08/20 16:08:38
4. Notes and Accounts Receivable
At March 31, 2014 and 2013, notes and accounts receivable consisted of the following:
Millions of yenThousands ofU.S. dollars
2014 2013 2014
Trade receivables ¥59,790 ¥51,214 $580,485
Unconsolidated subsidiaries and associates 2,362 1,894 22,932
Other 8,162 6,762 79,243Less allowance for doubtful accounts (450) (299) (4,369)
¥69,864 ¥59,571 $678,291
5. Inventories
At March 31, 2014 and 2013, inventories consisted of the following:
Millions of yenThousands ofU.S. dollars
2014 2013 2014
Finished goods ¥42,014 ¥41,704 $407,903Work-in-process 19,468 17,364 189,010Raw materials 9,588 8,777 93,087
¥71,070 ¥67,845 $690,000
For the years ended March 31, 2014 and 2013, a write-down of ¥513 million ($4,981 thousand) and ¥1,080 million, respectively, was recognized as costs of goods sold.
6. Investments
At March 31, 2014 and 2013, short-term investments consisted of the following:
Millions of yenThousands of U.S. dollars
2014 2013 2014
Securities with fair value:Bonds ¥27,557 ¥10,806 $267,544Other 8,880 4,288 86,213
36,437 15,094 353,757
Time deposits with an original maturity of more than three months 7,048 5,669 68,427
¥43,485 ¥20,763 $422,184
At March 31, 2014 and 2013, investment securities consisted of the following:
Millions of yenThousands ofU.S. dollars
2014 2013 2014
Securities with fair value:Equity securities ¥45,258 ¥37,614 $439,398Bonds 8,661 8,875 84,088
53,919 46,489 523,486
Other securities without fair value 737 716 7,155¥54,656 ¥47,205 $530,641
At March 31, 2014 and 2013, the cost and fair value of available-for-sale securities were summarized as follows:
Cost
Gross unrealized
gains
Gross unrealized
losses
Fair and carrying value
Millions of yen
At March 31, 2014:Equity securities ¥12,664 ¥32,793 ¥ (199) ¥45,258Bonds 36,197 74 (53) 36,218Other 8,636 244 — 8,880
¥57,497 ¥33,111 ¥ (252) ¥90,356
At March 31, 2013:Equity securities ¥12,645 ¥25,406 ¥ (437) ¥37,614Bonds 19,600 106 (25) 19,681Other 4,281 110 (103) 4,288
¥36,526 ¥25,622 ¥ (565) ¥61,583
Thousands of U.S. dollarsAt March 31, 2014:
Equity securities $122,952 $318,378 $ (1,932) $439,398Bonds 351,427 719 (514) 351,632Other 83,844 2,369 — 86,213
$558,223 $321,466 $ (2,446) $877,243
Although no loss on the write-down of available-for-sale securities was recognized for the year ended March 31, 2014, a loss on the write-down of available-for-sale securities in the amount of ¥63 million was recognized as other expenses due to the other than temporary diminution in value for the year ended March 31, 2013.
7. Intangible Assets
At March 31, 2014 and 2013, intangible assets consisted of the following:
Millions of yenThousands ofU.S. dollars
2014 2013 2014
Software ¥3,368 ¥3,591 $32,699Other intangible assets 253 236 2,456
¥3,621 ¥3,827 $35,155
8. Accounts Payable
At March 31, 2014 and 2013, accounts payable consisted of the following:
Millions of yenThousands ofU.S. dollars
2014 2013 2014
Trade payables ¥23,394 ¥18,735 $227,126
Unconsolidated subsidiaries and associates 350 86 3,398
Other 12,165 9,576 118,107¥35,909 ¥28,397 $348,631
NGK SPARK PLUG ANNUAL REPORT 2014 39
011_0653701372608.indd 39 2014/08/20 16:08:39

9. Short-term Borrowings and Long-term Debt
At March 31, 2014 and 2013, short-term borrowings consisted of the following:
Millions of yenThousands ofU.S. dollars
2014 2013 2014
Unsecured bank loans with interest at rates ranging from 0.02% to 5.04% per annum at March 31, 2014 ¥1,595 ¥1,433 $15,485
At March 31, 2014 and 2013, long-term debt consisted of the following:
Millions of yenThousands ofU.S. dollars
2014 2013 2014
1.85% unsecured bonds due July 2014 ¥10,000 ¥10,000 $ 97,0871.22% unsecured bonds due September 2015 15,000 15,000 145,6310.391% unsecured bonds due September 2018 25,000 — 242,7190.41% unsecured bank loans due September 2018 5,000 — 48,544Capitalized lease obligations 745 986 7,233
55,745 25,986 541,214Less current portion (10,252) (303) (99,534)
¥45,493 ¥25,683 $441,680
As is customary in Japan, substantially all bank borrowings are subject to general agreements which provide, among other things, that the banks may under certain circumstances request additional security for these loans and may treat any security so furnished to the bank, as well as cash deposited with it, as security for all present and future indebtedness. The banks have never requested the Company or its subsidiaries to submit such additional security. Also, as is customary in Japan, the Company and certain of its subsidiaries may have time deposits with banks from which they have short-term and long-term borrowings. However, there are no agreements with any banks which would require maintaining such deposits.
The aggregate annual maturities of long-term debt at March 31, 2014 were as follows:
Year ending March 31, Millions of yenThousands of U.S. dollars
2015 ¥ 10,252 $ 99,5342016 15,229 147,8552017 174 1,6892018 85 8252019 30,005 291,311
¥55,745 $541,214
10. Employee Retirement Benefits
The Company has a lump-sum retirement benefit plan and a defined benefit pension plan that cover 80% of the retirement benefits for employees of the Company who retire at the compulsory retirement age after ten years or more of service. Some of the Company’s domestic consolidated subsidiaries have similar retirement benefit plans. Some of the overseas consolidated subsidiaries have defined contribution plans. The Company contributes certain plan assets to the employee retirement benefit trust under the defined benefit pension plan. Net defined benefit liability and retirement benefit costs of certain consolidated subsidiaries are calculated using the simplified method as permitted by the accounting standard for retirement benefits.
The following tables reconcile the benefit liability and net periodic retirement benefit expense as of and for the year ended March 31, 2013:
Millions of yen
2013
Reconciliation of benefit liability:Projected benefit obligation * ¥50,075Less fair value of pension plan assets at end of year (26,568)Projected benefit obligation in excess of value of pension plan assets 23,507Unrecognized actuarial differences (5,887)Unrecognized past service cost (219)
Net amounts of employee retirement benefit liability ¥17,401
*The projected benefit obligation of certain consolidated subsidiaries was calculated
applying the simplified method as permitted by the accounting standard for retirement
benefits.
Millions of yen
2013
Components of net periodic retirement benefit costs:Service cost ¥2,582Interest cost 934Expected return on pension plan assets (647)Recognized actuarial differences 844Amortization of past service cost 38
Net periodic retirement benefit expense ¥3,751
Major assumptions used in the calculation of the above information for the year ended March 31, 2013 were as follows:
2013Method attributing the projected benefits to periods of services
Straight-line method
Discount rate 1.5%Expected rate of return on pension plan assets 2.75%Amortization of actuarial differences 10 yearsAmortization of past service cost 10 years
Information about employee retirement benefits for the year ended March 31, 2014 was as follows:
(a) Defined benefit plans
Movement in retirement benefit obligations, except for plans applying the simplified method:
Millions of yenThousands of U.S. dollars
Balance at April 1, 2013 ¥ 49,741 $ 482,922Service cost 3,125 30,340Interest cost 755 7,330Actuarial loss 1,416 13,748Benefits paid (1,878) (18,233)Past service costs (179) (1,738)Other 29 281
Balance at March 31, 2014 ¥53,009 $514,650
NGK SPARK PLUG ANNUAL REPORT 201440
011_0653701372608.indd 40 2014/08/20 16:08:39
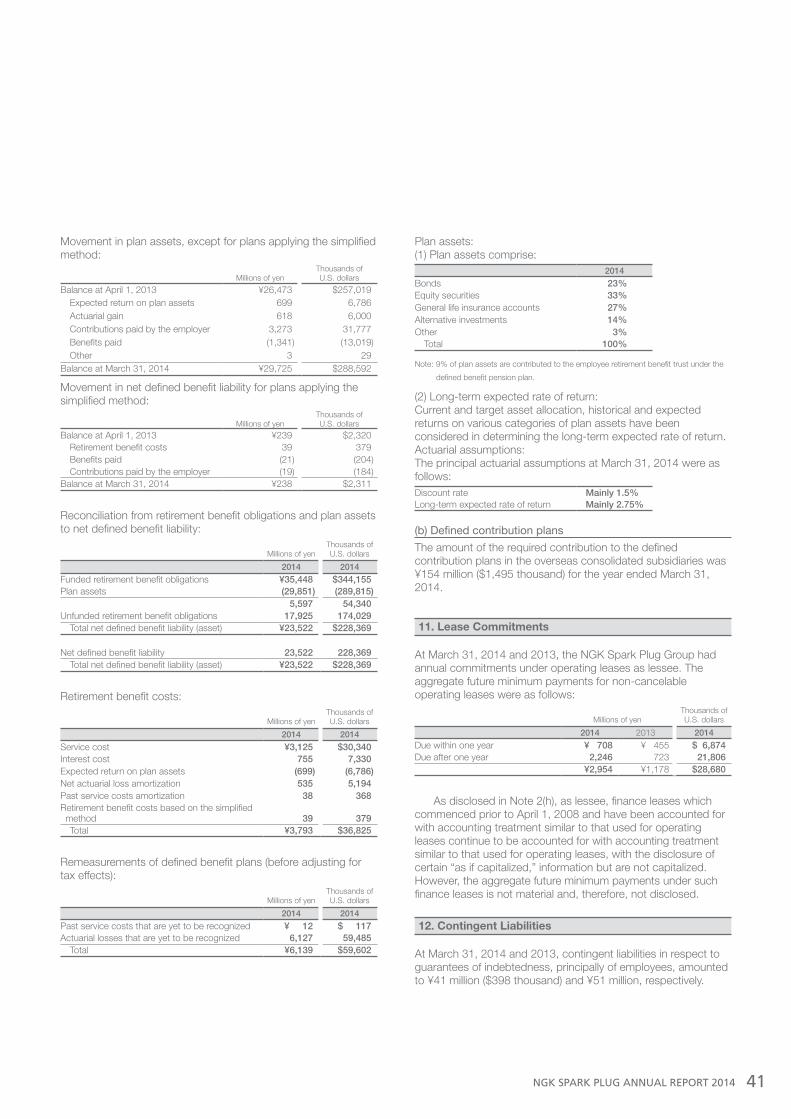
Movement in plan assets, except for plans applying the simplified method:
Millions of yenThousands of U.S. dollars
Balance at April 1, 2013 ¥ 26,473 $ 257,019Expected return on plan assets 699 6,786Actuarial gain 618 6,000Contributions paid by the employer 3,273 31,777Benefits paid (1,341) (13,019)Other 3 29
Balance at March 31, 2014 ¥29,725 $288,592
Movement in net defined benefit liability for plans applying the simplified method:
Millions of yenThousands of U.S. dollars
Balance at April 1, 2013 ¥239 $2,320Retirement benefit costs 39 379Benefits paid (21) (204)Contributions paid by the employer (19) (184)
Balance at March 31, 2014 ¥238 $2,311
Reconciliation from retirement benefit obligations and plan assets to net defined benefit liability:
Millions of yenThousands ofU.S. dollars
2014 2014
Funded retirement benefit obligations ¥35,448 $344,155Plan assets (29,851) (289,815)
5,597 54,340Unfunded retirement benefit obligations 17,925 174,029
Total net defined benefit liability (asset) ¥23,522 $228,369
Net defined benefit liability 23,522 228,369Total net defined benefit liability (asset) ¥23,522 $228,369
Retirement benefit costs:
Millions of yenThousands of U.S. dollars
2014 2014
Service cost ¥3,125 $30,340Interest cost 755 7,330Expected return on plan assets (699) (6,786)Net actuarial loss amortization 535 5,194Past service costs amortization 38 368Retirement benefit costs based on the simplified method 39 379
Total ¥3,793 $36,825
Remeasurements of defined benefit plans (before adjusting for tax effects):
Millions of yenThousands of U.S. dollars
2014 2014
Past service costs that are yet to be recognized ¥ 12 $ 117Actuarial losses that are yet to be recognized 6,127 59,485
Total ¥6,139 $59,602
Plan assets:(1) Plan assets comprise:
2014
Bonds 23%Equity securities 33%General life insurance accounts 27%Alternative investments 14%Other 3%
Total 100%
Note: 9% of plan assets are contributed to the employee retirement benefit trust under the
defined benefit pension plan.
(2) Long-term expected rate of return:Current and target asset allocation, historical and expected returns on various categories of plan assets have been considered in determining the long-term expected rate of return.Actuarial assumptions:The principal actuarial assumptions at March 31, 2014 were as follows:Discount rate Mainly 1.5%Long-term expected rate of return Mainly 2.75%
(b) Defined contribution plans
The amount of the required contribution to the defined contribution plans in the overseas consolidated subsidiaries was ¥154 million ($1,495 thousand) for the year ended March 31, 2014.
11. Lease Commitments
At March 31, 2014 and 2013, the NGK Spark Plug Group had annual commitments under operating leases as lessee. The aggregate future minimum payments for non-cancelable operating leases were as follows:
Millions of yenThousands of U.S. dollars
2014 2013 2014
Due within one year ¥ 708 ¥ 455 $ 6,874Due after one year 2,246 723 21,806
¥2,954 ¥1,178 $28,680
As disclosed in Note 2(h), as lessee, finance leases which commenced prior to April 1, 2008 and have been accounted for with accounting treatment similar to that used for operating leases continue to be accounted for with accounting treatment similar to that used for operating leases, with the disclosure of certain “as if capitalized,” information but are not capitalized. However, the aggregate future minimum payments under such finance leases is not material and, therefore, not disclosed.
12. Contingent Liabilities
At March 31, 2014 and 2013, contingent liabilities in respect to guarantees of indebtedness, principally of employees, amounted to ¥41 million ($398 thousand) and ¥51 million, respectively.
NGK SPARK PLUG ANNUAL REPORT 2014 41
011_0653701372608.indd 41 2014/08/20 16:08:39
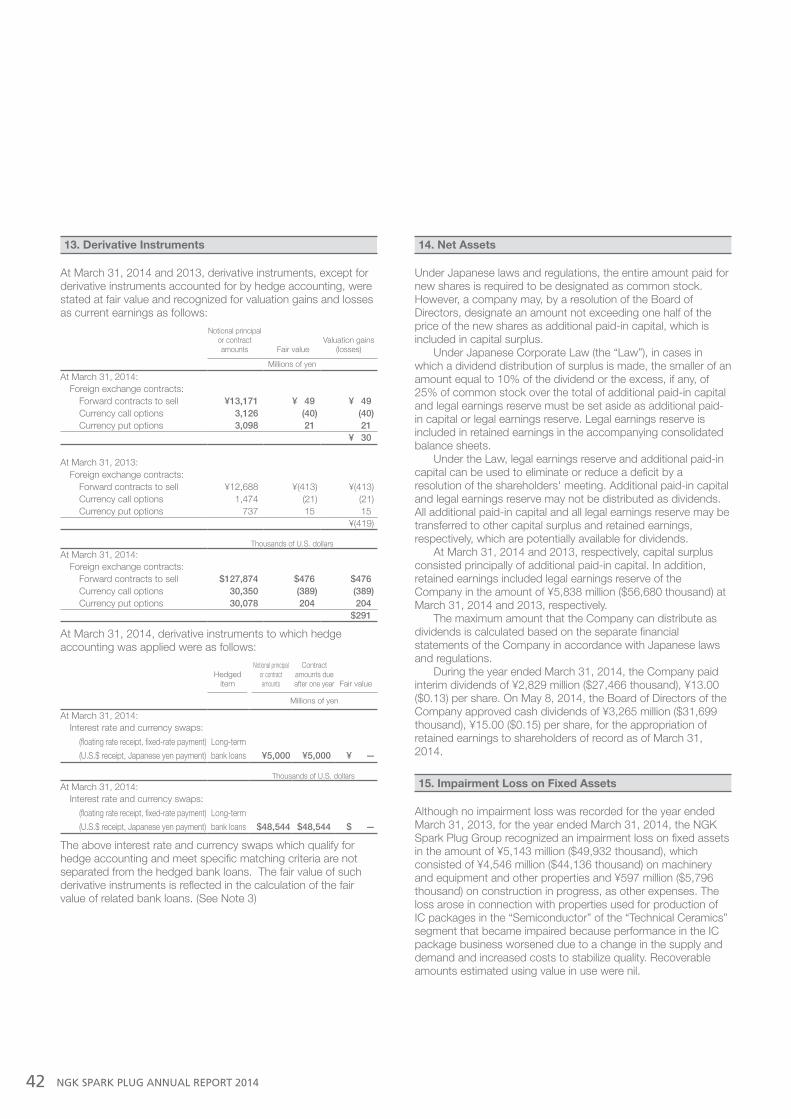
13. Derivative Instruments
At March 31, 2014 and 2013, derivative instruments, except for derivative instruments accounted for by hedge accounting, were stated at fair value and recognized for valuation gains and losses as current earnings as follows:
Notional principal or contract amounts Fair value
Valuation gains (losses)
Millions of yen
At March 31, 2014:Foreign exchange contracts:
Forward contracts to sell ¥13,171 ¥ 49 ¥ 49Currency call options 3,126 (40) (40)Currency put options 3,098 21 21
¥ 30
At March 31, 2013:Foreign exchange contracts:
Forward contracts to sell ¥12,688 ¥(413) ¥(413)Currency call options 1,474 (21) (21)Currency put options 737 15 15
¥(419)
Thousands of U.S. dollarsAt March 31, 2014:
Foreign exchange contracts:Forward contracts to sell $127,874 $476 $476Currency call options 30,350 (389) (389)Currency put options 30,078 204 204
$291
At March 31, 2014, derivative instruments to which hedge accounting was applied were as follows:
Hedged item
Notional principal or contract amounts
Contract amounts due after one year Fair value
Millions of yen
At March 31, 2014:Interest rate and currency swaps:
(floating rate receipt, fixed-rate payment) Long-term
(U.S.$ receipt, Japanese yen payment) bank loans ¥5,000 ¥5,000 ¥ —
Thousands of U.S. dollarsAt March 31, 2014:
Interest rate and currency swaps:
(floating rate receipt, fixed-rate payment) Long-term
(U.S.$ receipt, Japanese yen payment) bank loans $48,544 $48,544 $ —
The above interest rate and currency swaps which qualify for hedge accounting and meet specific matching criteria are not separated from the hedged bank loans. The fair value of such derivative instruments is reflected in the calculation of the fair value of related bank loans. (See Note 3)
14. Net Assets
Under Japanese laws and regulations, the entire amount paid for new shares is required to be designated as common stock. However, a company may, by a resolution of the Board of Directors, designate an amount not exceeding one half of the price of the new shares as additional paid-in capital, which is included in capital surplus.
Under Japanese Corporate Law (the “Law”), in cases in which a dividend distribution of surplus is made, the smaller of an amount equal to 10% of the dividend or the excess, if any, of 25% of common stock over the total of additional paid-in capital and legal earnings reserve must be set aside as additional paid-in capital or legal earnings reserve. Legal earnings reserve is included in retained earnings in the accompanying consolidated balance sheets.
Under the Law, legal earnings reserve and additional paid-in capital can be used to eliminate or reduce a deficit by a resolution of the shareholders' meeting. Additional paid-in capital and legal earnings reserve may not be distributed as dividends. All additional paid-in capital and all legal earnings reserve may be transferred to other capital surplus and retained earnings, respectively, which are potentially available for dividends.
At March 31, 2014 and 2013, respectively, capital surplus consisted principally of additional paid-in capital. In addition, retained earnings included legal earnings reserve of the Company in the amount of ¥5,838 million ($56,680 thousand) at March 31, 2014 and 2013, respectively.
The maximum amount that the Company can distribute as dividends is calculated based on the separate financial statements of the Company in accordance with Japanese laws and regulations.
During the year ended March 31, 2014, the Company paid interim dividends of ¥2,829 million ($27,466 thousand), ¥13.00 ($0.13) per share. On May 8, 2014, the Board of Directors of the Company approved cash dividends of ¥3,265 million ($31,699 thousand), ¥15.00 ($0.15) per share, for the appropriation of retained earnings to shareholders of record as of March 31, 2014.
15. Impairment Loss on Fixed Assets
Although no impairment loss was recorded for the year ended March 31, 2013, for the year ended March 31, 2014, the NGK Spark Plug Group recognized an impairment loss on fixed assets in the amount of ¥5,143 million ($49,932 thousand), which consisted of ¥4,546 million ($44,136 thousand) on machinery and equipment and other properties and ¥597 million ($5,796 thousand) on construction in progress, as other expenses. The loss arose in connection with properties used for production of IC packages in the “Semiconductor” of the “Technical Ceramics” segment that became impaired because performance in the IC package business worsened due to a change in the supply and demand and increased costs to stabilize quality. Recoverable amounts estimated using value in use were nil.
NGK SPARK PLUG ANNUAL REPORT 201442
011_0653701372608.indd 42 2014/08/20 16:08:39
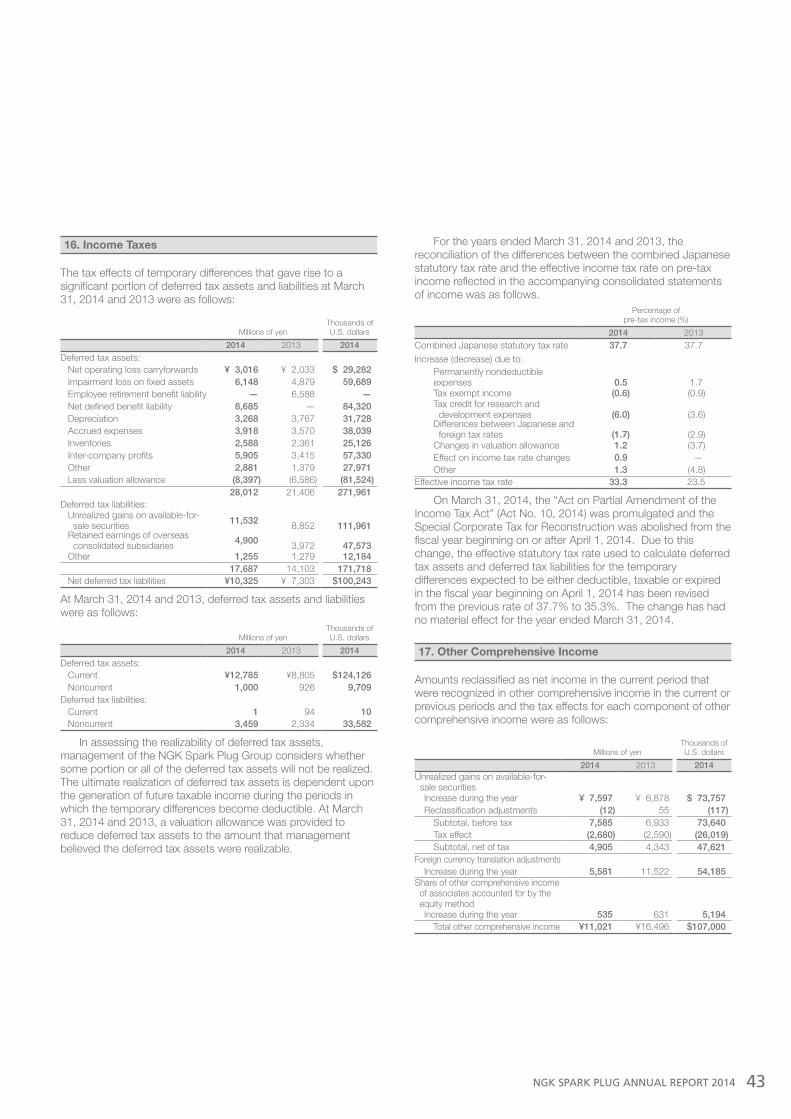
16. Income Taxes
The tax effects of temporary differences that gave rise to a significant portion of deferred tax assets and liabilities at March 31, 2014 and 2013 were as follows:
Millions of yenThousands of U.S. dollars
2014 2013 2014
Deferred tax assets:Net operating loss carryforwards ¥ 3,016 ¥ 2,033 $ 29,282Impairment loss on fixed assets 6,148 4,879 59,689Employee retirement benefit liability — 6,588 —Net defined benefit liability 8,685 — 84,320Depreciation 3,268 3,767 31,728Accrued expenses 3,918 3,570 38,039Inventories 2,588 2,361 25,126Inter-company profits 5,905 3,415 57,330Other 2,881 1,379 27,971Less valuation allowance (8,397) (6,586) (81,524)
28,012 21,406 271,961Deferred tax liabilities:
Unrealized gains on available-for- sale securities 11,532 8,852 111,961Retained earnings of overseas consolidated subsidiaries 4,900 3,972 47,573Other 1,255 1,279 12,184
17,687 14,103 171,718Net deferred tax liabilities ¥ 10,325 ¥ 7,303 $ 100,243
At March 31, 2014 and 2013, deferred tax assets and liabilities were as follows:
Millions of yenThousands ofU.S. dollars
2014 2013 2014
Deferred tax assets:Current ¥12,785 ¥8,805 $124,126Noncurrent 1,000 926 9,709
Deferred tax liabilities:Current 1 94 10Noncurrent 3,459 2,334 33,582
In assessing the realizability of deferred tax assets, management of the NGK Spark Plug Group considers whether some portion or all of the deferred tax assets will not be realized. The ultimate realization of deferred tax assets is dependent upon the generation of future taxable income during the periods in which the temporary differences become deductible. At March 31, 2014 and 2013, a valuation allowance was provided to reduce deferred tax assets to the amount that management believed the deferred tax assets were realizable.
For the years ended March 31, 2014 and 2013, the reconciliation of the differences between the combined Japanese statutory tax rate and the effective income tax rate on pre-tax income reflected in the accompanying consolidated statements of income was as follows.
Percentage of pre-tax income (%)
2014 2013Combined Japanese statutory tax rate 37.7 37.7
Increase (decrease) due to:Permanently nondeductible expenses 0.5 1.7Tax exempt income (0.6) (0.9)Tax credit for research and development expenses (6.0) (3.6)Differences between Japanese and foreign tax rates (1.7) (2.9)Changes in valuation allowance 1.2 (3.7)Effect on income tax rate changes 0.9 —Other 1.3 (4.8)
Effective income tax rate 33.3 23.5
On March 31, 2014, the “Act on Partial Amendment of the Income Tax Act” (Act No. 10, 2014) was promulgated and the Special Corporate Tax for Reconstruction was abolished from the fiscal year beginning on or after April 1, 2014. Due to this change, the effective statutory tax rate used to calculate deferred tax assets and deferred tax liabilities for the temporary differences expected to be either deductible, taxable or expired in the fiscal year beginning on April 1, 2014 has been revised from the previous rate of 37.7% to 35.3%. The change has had no material effect for the year ended March 31, 2014.
17. Other Comprehensive Income
Amounts reclassified as net income in the current period that were recognized in other comprehensive income in the current or previous periods and the tax effects for each component of other comprehensive income were as follows:
Millions of yenThousands ofU.S. dollars
2014 2013 2014Unrealized gains on available-for- sale securities
Increase during the year ¥ 7,597 ¥ 6,878 $ 73,757Reclassification adjustments (12) 55 (117)
Subtotal, before tax 7,585 6,933 73,640Tax effect (2,680) (2,590) (26,019)Subtotal, net of tax 4,905 4,343 47,621
Foreign currency translation adjustmentsIncrease during the year 5,581 11,522 54,185
Share of other comprehensive income of associates accounted for by the equity method
Increase during the year 535 631 5,194Total other comprehensive income ¥11,021 ¥16,496 $107,000
NGK SPARK PLUG ANNUAL REPORT 2014 43
011_0653701372608.indd 43 2014/08/20 16:08:39

(b) Information about reportable segment profit and loss, segment assets and other material items
Information about reportable segments as of and for the years ended March 31, 2014 and 2013 was as follows:Reportable segments
Technical ceramics
Automotive components Semiconductor Ceramics
Total Technical ceramics Total Other Total Adjustments Consolidated
Millions of yen
For the year 2014:Operating revenue - net sales:
External customers ¥ 271,835 ¥ 29,713 ¥ 24,461 ¥ 54,174 ¥ 326,009 ¥ 3,749 ¥ 329,758 ¥— ¥ 329,758Intersegment sales — — — — — — — — —
Total net sales 271,835 29,713 24,461 54,174 326,009 3,749 329,758 — 329,758Segment income (loss) ¥ 58,893 ¥ (8,711) ¥ 1,461 ¥ (7,250) ¥ 51,643 ¥ 19 ¥ 51,662 ¥— ¥ 51,662Segment assets ¥ 390,325 ¥ 32,113 ¥ 34,193 ¥ 66,306 ¥ 456,631 ¥ 1,518 ¥ 458,149 ¥— ¥ 458,149Other items:
Depreciation ¥ 9,171 ¥ 1,444 ¥ 944 ¥ 2,388 ¥ 11,559 ¥ 8 ¥ 11,567 ¥— ¥ 11,567Impairment loss on fixed assets — 5,143 — 5,143 5,143 — 5,143 — 5,143Increase in property, plant and
equipment and intangible assets 34,353 4,234 2,443 6,677 41,030 4 41,034 — 41,034
For the year 2013Operating revenue - net sales:
External customers ¥ 248,795 ¥ 28,239 ¥ 22,054 ¥ 50,293 ¥ 299,088 ¥ 3,711 ¥ 302,799 ¥— ¥ 302,799Intersegment sales — — — — — — — — —
Total net sales 248,795 28,239 22,054 50,293 299,088 3,711 302,799 — 302,799Segment income (loss) ¥ 33,159 ¥ (9,677) ¥ 169 ¥ (9,508) ¥ 23,651 ¥ 103 ¥ 23,754 ¥— ¥ 23,754Segment assets ¥ 305,116 ¥ 31,918 ¥ 28,229 ¥ 60,147 ¥ 365,263 ¥ 1,226 ¥ 366,489 ¥— ¥ 366,489Other items:
Depreciation ¥ 10,157 ¥ 1,546 ¥ 1,087 ¥ 2,633 ¥ 12,790 ¥ 8 ¥ 12,798 ¥— ¥ 12,798Increase in property, plant and
equipment and intangible assets 17,961 4,204 1,838 6,042 24,003 10 24,013 — 24,013
Thousands of U.S. dollars
For the year 2014:Operating revenue - net sales:
External customers $2,639,175 $ 288,476 $ 237,485 $ 525,961 $ 3,165,136 $36,398 $ 3,201,534 $— $ 3,201,534Intersegment sales — — — — — — — — —
Total net sales 2,639,175 288,476 237,485 525,961 3,165,136 36,398 3,201,534 — 3,201,534Segment income (loss) $ 571,776 $ (84,573) $ 14,185 $ (70,388) $ 501,388 $ 185 $ 501,573 $— $ 501,573Segment assets $3,789,563 $311,777 $331,971 $643,748 $4,433,311 $14,738 $4,448,049 $— $4,448,049Other items:
Depreciation $ 89,039 $ 14,019 $ 9,165 $ 23,184 $ 112,223 $ 78 $ 112,301 $— $ 112,301Impairment loss on fixed assets — 49,932 — 49,932 49,932 — 49,932 — 49,932Increase in property, plant and
equipment and intangible assets 333,525 41,107 23,718 64,825 398,350 38 398,388 — 398,388
18. Segment Information
(a) General information about reportable segments
The reportable segments of the Company are the business units for which the Company is able to obtain financial information separately in order for the Board of Directors of the Company to conduct periodic investigations to determine the distribution of management resources and evaluate business results. The Company has its business units identified by products. Each business unit plans its comprehensive domestic and overseas strategy for its products and conducts its business activities. Accordingly, the NGK Spark Plug Group consists of two reportable segments. “Automotive components” and “Technical ceramics” consisting of “Semiconductor” and “Ceramics.”• In the “Automotive components” segment, the Company manufactures and sells spark plugs, glow plugs, various automotive sensors,
ceramic engine parts and other automotive components.• In the “Technical ceramics” segment, the Company manufactures and sells IC packages and other semiconductor components in
“Semiconductor” and manufactures and sells cutting tools, ceramics products for industrial in “Ceramics.”
NGK SPARK PLUG ANNUAL REPORT 201444
011_0653701372608.indd 44 2014/08/20 16:08:39
(c) Enterprise-wide information
Information about geographic areas as of and for the years ended March 31, 2014 and 2013 was as follows:
Millions of yenThousands of U.S. dollars
2014 2013 2014
Operating revenue - net sales:
Japan ¥ 57,575 ¥ 56,194 $ 558,980
North America 85,831 70,694 833,311
Europe 83,517 80,055 810,845
Asia 61,784 52,974 599,845
Other area 41,051 42,882 398,553
¥329,758 ¥302,799 $3,201,534
Millions of yenThousands of U.S. dollars
2014 2013 2014
Property, plant and equipment:
Japan ¥ 97,771 ¥80,560 $ 949,233
Other area 23,325 16,514 226,457
¥121,096 ¥97,074 $1,175,690
The NGK Spark Plug Group had no single external customer which accounted for more than 10% of net sales for the years ended March 31, 2014 and 2013.
Note: As disclosed in Note 2(a), from the fiscal year ended March 31, 2013, seventeen overseas consolidated subsidiaries (NGK Spark Plug Europe GmbH, etc.) have changed their fiscal year-end date from December 31 to March 31. The fiscal year-end date of NGK Spark Plug (Shanghai) Co., Ltd., Changshu NGK Spark Plug Co., Ltd., Bujias NGK de Mexico S.A. de C.V. and Woo Jin Industry Co., Ltd. is December 31. However, when preparing consolidated financial statements, the Company uses the financial statements of the three consolidated subsidiaries and one associate which have been compiled by a temporary closing of their accounts as of March 31. As a result, for the year ended March 31, 2013, net sales and segment income were ¥36,548 million and ¥3,759 million more, respectively, in the “Automotive components” segment, net sales and segment loss were ¥1,119 million and ¥44 million more, respectively, in the “Semiconductor” of the “Technical Ceramics” segment and net sales and segment income were ¥1,396 million and ¥111 million more, respectively, in the “Ceramics” of the “Technical Ceramics” segment than the amounts that would have been recorded without the change.
As disclosed in Note 2(g), the Company and its domestic consolidated subsidiaries had depreciated property, plant and equipment, except for buildings, using the declining balance method until the year ended March 31, 2012. From the fiscal year ended March 31, 2013, the Company and its domestic consolidated subsidiaries have changed the depreciation method for all properties to the straight-line method. As a result, for the year ended March 31, 2013, segment income was ¥1,929 million more in the “Automotive components” segment, segment loss ¥80 million less in the “Semiconductor” of the “Technical Ceramics” segment and segment income ¥114 million more in the “Ceramics” of the “Technical Ceramics” segment than the amounts that would have been recorded without the change.
As disclosed in Note 2(g), from the fiscal year ended March 31, 2013, the Company and its domestic consolidated subsidiaries have changed the useful life of machinery and equipment. As a result, for the year ended March 31, 2013, segment income was ¥1,304 million more in the “Automotive components” segment and segment income ¥122 million more in the “Ceramics” of the “Technical Ceramics” segment than the amounts that would have been recorded without the change.
From the fiscal year ended March 31, 2014, the “Communication media components” segment and “Technical ceramics” segment have been integrated and the name has been changed to the “Technical ceramics” segment. The “Communication media components” segment and the “Technical ceramics” segment for the fiscal year ended March 31, 2013 correspond to the “Semiconductor” segment and the “Ceramics” segment of the fiscal year ended March 31, 2014. Segment information for the fiscal year ended March 31, 2013, including the above notes, is based on the reportable segments of the fiscal year ended March 31, 2014.
NGK SPARK PLUG ANNUAL REPORT 2014 45
011_0653701372608.indd 45 2014/08/20 16:08:39

Independent Auditor’s Report
NGK SPARK PLUG ANNUAL REPORT 201446
011_0653701372608.indd 46 2014/08/20 16:08:40

Independent Auditor’s Report
NGK SPARK PLUG ANNUAL REPORT 201446
011_0653701372608.indd 46 2014/08/20 16:08:40
NameNumber of shares held
(1,000 shares)
Ownership ratio (%)
State Street Bank and Trust Company 19,788 8.85
The Dai-ichi Life Insurance Company, Limited 16,752 7.49
Meiji Yasuda Life Insurance Company 13,794 6.17
The Master Trust Bank of Japan, Ltd. (trust account)
11,667 5.22
Japan Trustee Services Bank, Ltd. (trust account)
9,482 4.24
The Bank of Tokyo-Mitsubishi UFJ, Ltd. 6,541 2.93
National Mutual Insurance Federation of Agricultural Cooperatives
6,138 2.75
The Nomura Trust and Banking Co., Ltd.(investment trust contract account)
4,126 1.85
The Master Trust Bank of Japan, Ltd.Toyota Motor Account
3,929 1.76
Nippon Life Insurance Company 3,563 1.59
Major Shareholders
Stock Price Range and Trading Volume
7 8 9 10 11 12 1 2 3 4 5 6 7 8 9 10 11 122008
(¥)
0
3,000
2,400
1,800
1,200
600
(¥)
0
25,000
20,000
15,000
10,000
5,000
50,000
40,000
30,000
20,000
10,000
0
(Thousand shares)
(NGK Spark Plug) (Nikkei 225)
20091 2 3 4 5 6 7 8 9 10 11 122010
1 2 3 4 5 6 7 8 9 10 11 122011
1 2 3 4 5 6 7 8 9 10 11 122012
1 2 3 4 5 6 7 8 9 10 11 122013
1 2 3 4 5 62014
Stock Price Stock Price
Trading Volume
—— NGK SPARK PLUG —— NIKKEI 225 NGK SPARK PLUG
Share Distribution by Owner
Common SharesAuthorized: 390,000,000Issued: 223,544,820
Stock ListingsTokyo Stock Exchange, 1st SectionNagoya Stock Exchange, 1st Section
Transfer AgentMitsubishi UFJ Trust and Banking Corporation
Independent AuditorKPMG AZSA LLC
Number of Shareholders10,070
Government and local public organizations
0.01%Individuals and others11.88%
Foreign corporations37.36%
Other Japanese corporations 6.19%
Financial institutions43.91%
Securities companies 0.65%
Note:Although the Company held treasury stock of 5,911 thousand shares as of March 31, 2014, the Company is excluded from the above list of major shareholders.
All figures on this page are based on the Japanese “Securities Report.”
5,911,000 shares (5,911 units) of treasury stock are included in “Individuals and others.”
(As of March 31, 2014)
Stock Information
NGK SPARK PLUG ANNUAL REPORT 2014 47
011_0653701372608.indd 47 2014/08/20 16:08:40

Organization(As of June 27, 2014)
Board of Directors Board of Corporate Auditors
PresidentCorporate Auditor
CSR Promotion Office
Internal Auditing Office
Secretarial Office
Corporate Officers’Meeting
Corporate ManagementCommittee
SOFC Project
CorporatePlanning Dept.
Public Relations Office
New BusinessAdvancement Group
New BusinessStrategy Dept.Development
Management TeamMedical Products
Dept.
Tokyo Branch
CorporateAdministration Group
GeneralAdministration Dept.Human Resources
Dept.Accounting &Finance Dept.
InformationSystems Dept.
Administration Dept.,
Procurement Group
Procurement Dept.
Strategic PlanningDept.
Supplier Relations &Development Dept.
Corporate QualityControl Dept.
Strategic PlanningDept.
Engineering R&D Group
Intellectual PropertyDept.
MP Dept.
Electronic Component Engineering Dept.
FD Dept.
LFP Team
Spark Plug Div.
Sensor Div.
Cutting Tools Div.
Semiconductor Div.
AutomotiveComponents Group
Sales & Marketing Div.
Technical Ceramics Group
Production EngineeringMONODUKURI Group
Energy ConservationPromotion Office
Strategic Planning Office
Production SupportEngineering Dept.
MONODUKURI AbilityEnhancement Dept.
Environment & SafetyManagement Dept.
Technical CeramicsProduction Engineering Dept.
Equipment Dept.
ProductionDevelopment Dept.
Spark Plug ProductionEngineering Dept.
Sensor ProductionEngineering Dept.
ProductionEngineering Dept.
NGK SPARK PLUG CO., LTD.
Headquarters14-18 Takatsuji-cho, Mizuho-ku, Nagoya 467-8525, Japanhttp://www.ngkntk.co.jp
EstablishedOctober 1936
Paid-in Capital¥47,869 million
Number of EmployeesConsolidated: 12,760Non-Consolidated: 5,809
(As of March 31, 2014)
12,760
10 11 12
(Millions of yen)
120,000
90,000
60,000
30,000
0
0908
CSR Social
11 12 13
15,000
12,000
9,000
6,000
3,000
0 10
Number of Employees (Consolidated)
11,795 11,767 12,064
14
12,563
Corporate Data
NGK SPARK PLUG ANNUAL REPORT 201448
011_0653701372608.indd 48 2014/08/20 16:08:40
Strong Potential for Future Growth
090_0653701372608.indd 2 2014/08/13 14:44:52
NGK SPARK PLUG ANNUAL REPORT 2014
ProfileNGK SPARK PLUG CO., LTD., established in 1936 as a manufacturer of spark plugs, has always cultivated ceramics as its core competence. The Company has a distinguished track record of applying the expertise cultivated in the field of ceramics in other fields to create new value. Today, NGK SPARK PLUG CO., LTD. is a leading manufacturer supplying its products to major manufacturers worldwide in the automotive, electronics and other industries. The Company’s prod-ucts are vital components of a host of finished products manufactured on production lines the world over. NGK SPARK PLUG CO., LTD. is at the forefront of innovation in the information and communications and automotive industries that are destined to underpin the 21st century society. The Company is also increasingly active in the medical field, attuning its expertise to the needs of the aging society, and in the environmental sphere. Drawing on a wealth of experience, NGK SPARK PLUG CO., LTD. continues to deploy its technological prowess in the service of its customers and society.
Contents
● Profile● Global Network● Financial Highlights● A Message from the President● Special Feature● Review of Operations● CSR● CSR [Governance]● CSR [Social]● CSR [Environment]● Six-Year Summary●Management’s Discussion and Analysis● Consolidated Balance Sheets● Consolidated Statements of Income● Consolidated Statements of Comprehensive Income● Consolidated Statements of Changes in Net Assets● Consolidated Statements of Cash Flows● Notes to Consolidated Financial Statements● Independent Auditor’s Report● Stock Information● Corporate Data● Directors, Corporate Officers and Corporate Auditors
1
2
4
6
10
14
17
18
20
21
22
23
28
30
31
32
33
34
46
47
48
49
No.1Spark Plugs World Share
¥329,758 million
Net Sales
¥51,662 million
OperatingIncome
11.5%ROE
83%Rate ofOverseas Sales
Japan 17%
North America 26%
Europe 25%
Asia 19%
Latin America 8%Other 5%
Representative Director, Chief Executive Officerand President Officer
Shinichi Odo*1
Takeshi Nakagawa
Representative Director, Vice Chief Executiveand Vice President Officer
Takafumi Oshima*1
Shinji Shibagaki*1
Shogo Kawajiri
Representative Director, Vice Chief Executiveand Vice President Officer
Member of the BoardVice President Officer
Member of the BoardSenior Executive Officer
Kenichi Masuda*3
Member of the BoardExecutive Officer
TeppeiOkawa
Masami Asai
Shigehisa Sao*3
Standing Corporate Auditor
Hideyuki Koiso
MorihikoOtaki*2
KanemaruYasui*2
Keiichi Matsunari
Member of the Board
Corporate Auditor
Executive Officer
Hitoshi Iimi
Takahiro Suzuki
Takao Hamada
Tadao Kawai
Corporate Officer
Hisashi Nakanishi
Takeshi Kawai
NoboruIshida
YoshihiroMatsubara
TakioKojima
MasahikoOkuyama
YoshitakaNarita
KozoYamasaki
KozoAmano
NobuyukiTokioka
Corporate Officer
*1Representative Director*2Outside Director
*3Outside Auditor
(As of June 27, 2014)
Directors, Corporate Officers and Corporate Auditors
005_0653701372608.indd 4-6 2014/08/13 15:41:41

The Evolution to Real Value
Annual Report 2014Fiscal year ended March 31, 2014
14-18 Takatsuji-cho, Mizuho-ku, Nagoya 467-8525, Japanhttp://www.ngkntk.co.jp
An
nu
al R
ep
ort 2
01
4
Printed in Japan
005_0653701372608.indd 1-3 2014/08/13 15:41:37