the movie industry today - university of wisconsin–la …websites.uwlax.edu/kincman/376...
TRANSCRIPT
The Movie Industry Today
parts II and III abridged
The Players
• Production
– Studios contract with known producers
– Studios finance indie producers
• Distribution
– studios
• Exhibition
– Theaters
– Ancillary markets
Demand for Flickers
• Prices and elasticity
– Demand for hit movies is inelastic
– Demand for complementary goods is not • Babysitter
• Dinner
• Parking/transportation
• That really good buttered popcorn
– Demand for “regular” movies is elastic • Rush hour specials
• Student/senior discounts
Markets for Movies
• Historically theaters were the only market
for movies
• Technology → ancillary markets
• Culture + technology =
– Piracy
– Impatience – I don’t want to wait six months to
rent/stream anymore
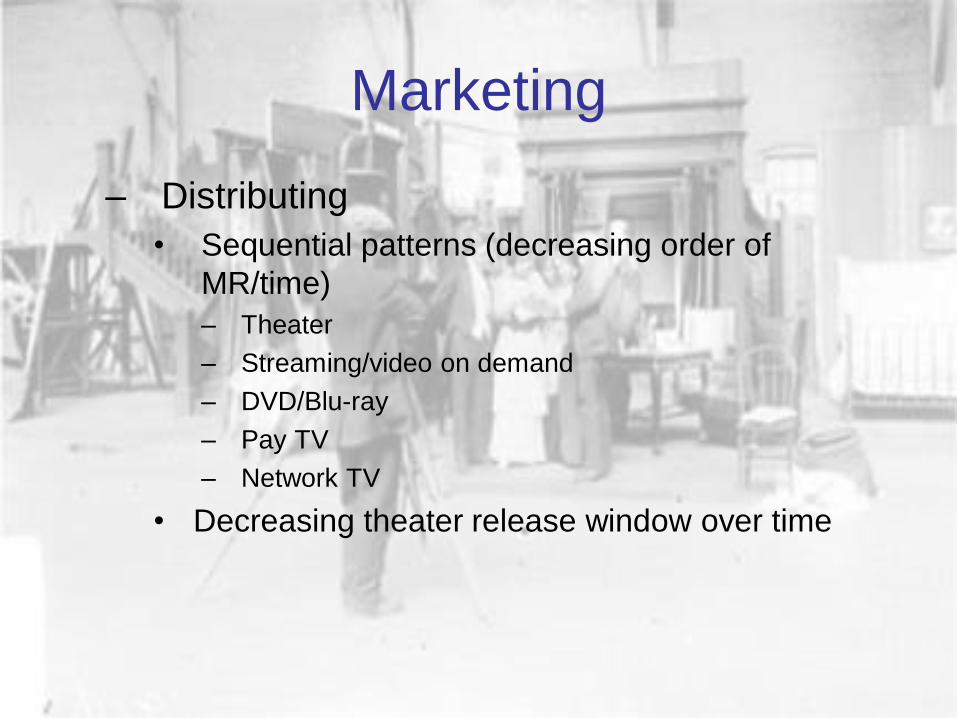
Marketing
– Distributing
• Sequential patterns (decreasing order of
MR/time)
– Theater
– Streaming/video on demand
– DVD/Blu-ray
– Pay TV
– Network TV
• Decreasing theater release window over time
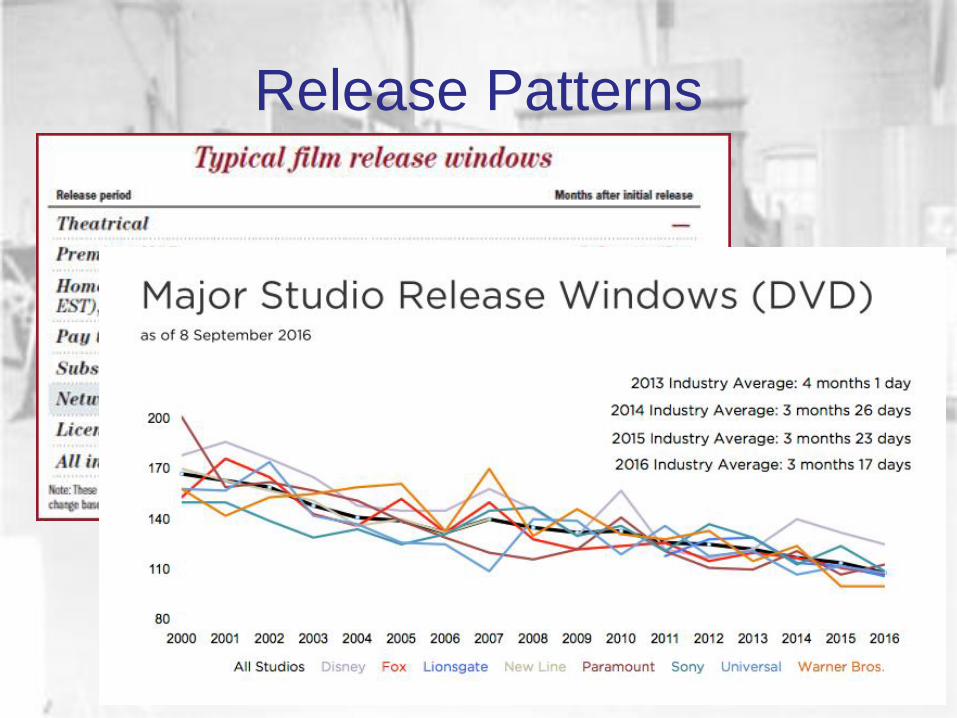
Release Patterns
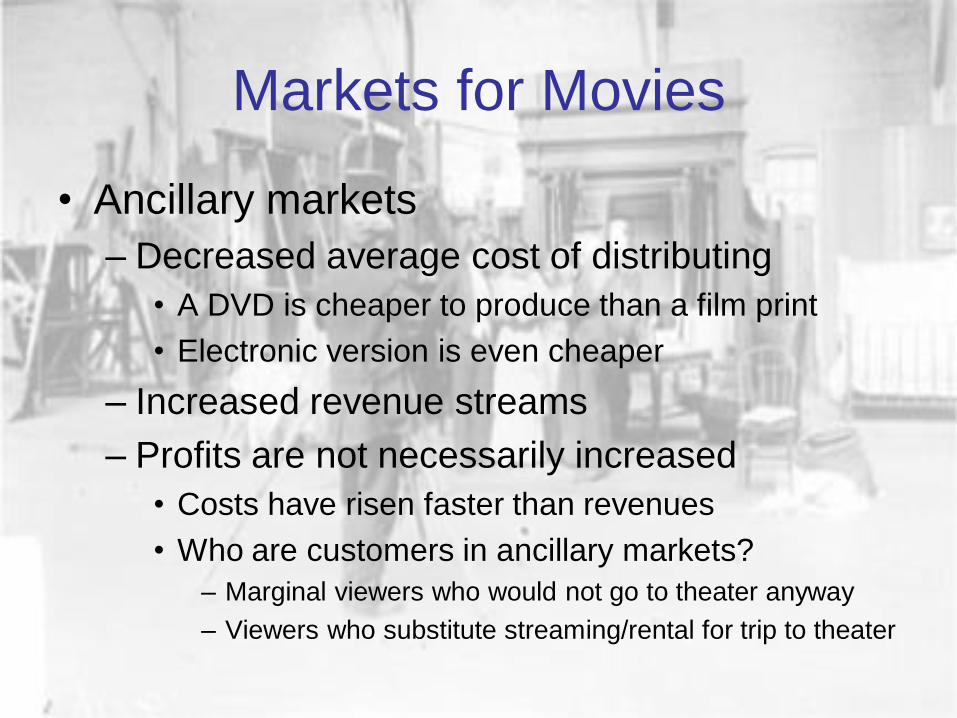
Markets for Movies
• Ancillary markets
– Decreased average cost of distributing
• A DVD is cheaper to produce than a film print
• Electronic version is even cheaper
– Increased revenue streams
– Profits are not necessarily increased
• Costs have risen faster than revenues
• Who are customers in ancillary markets?
– Marginal viewers who would not go to theater anyway
– Viewers who substitute streaming/rental for trip to theater
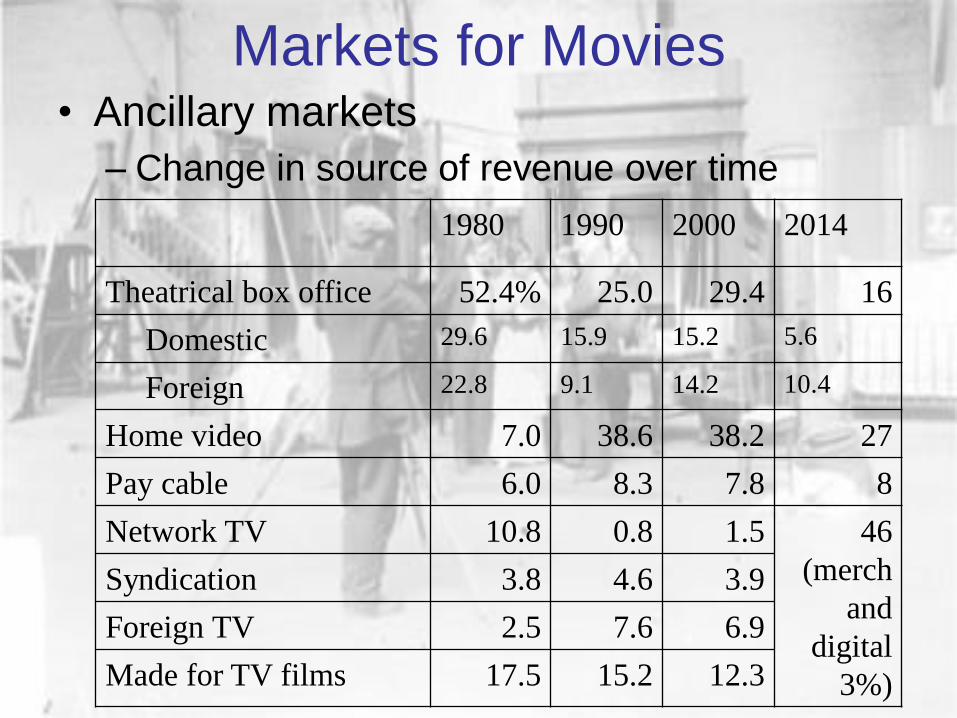
Markets for Movies • Ancillary markets
– Change in source of revenue over time
1980 1990 2000 2014
Theatrical box office 52.4% 25.0 29.4 16
Domestic 29.6 15.9 15.2 5.6
Foreign 22.8 9.1 14.2 10.4
Home video 7.0 38.6 38.2 27
Pay cable 6.0 8.3 7.8 8
Network TV 10.8 0.8 1.5 46
(merch
and
digital
3%)
Syndication 3.8 4.6 3.9
Foreign TV 2.5 7.6 6.9
Made for TV films 17.5 15.2 12.3
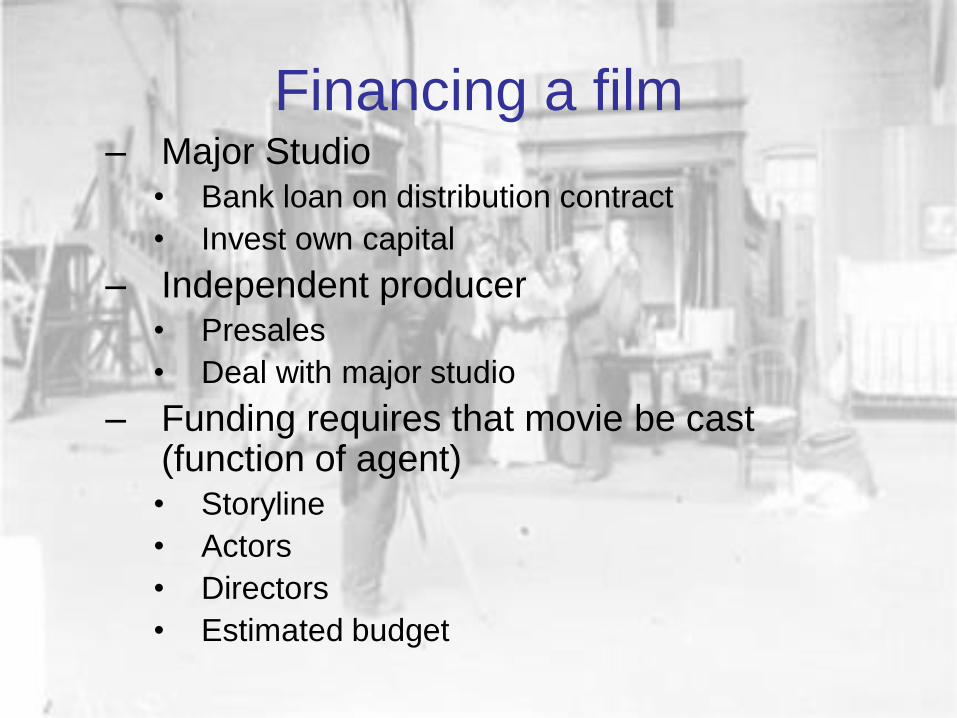
Financing a film – Major Studio
• Bank loan on distribution contract
• Invest own capital
– Independent producer • Presales
• Deal with major studio
– Funding requires that movie be cast (function of agent) • Storyline
• Actors
• Directors
• Estimated budget
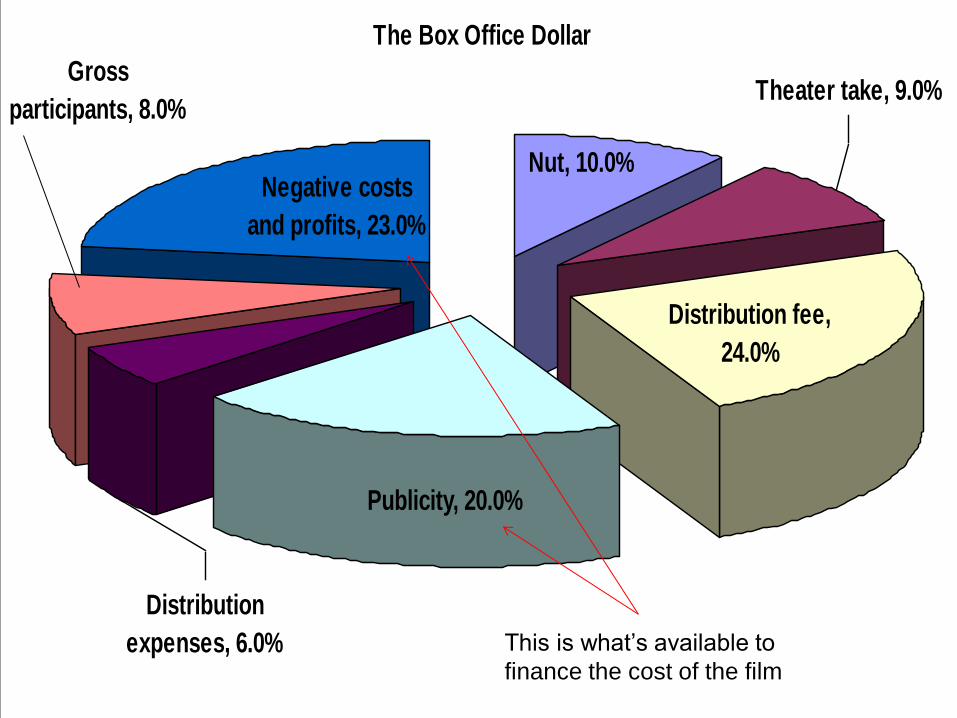
The Box Office Dollar
Gross
participants, 8.0%
Negative costs
and profits, 23.0%
Distribution fee,
24.0%
Theater take, 9.0%
Distribution
expenses, 6.0%
Publicity, 20.0%
Nut, 10.0%
This is what’s available to
finance the cost of the film
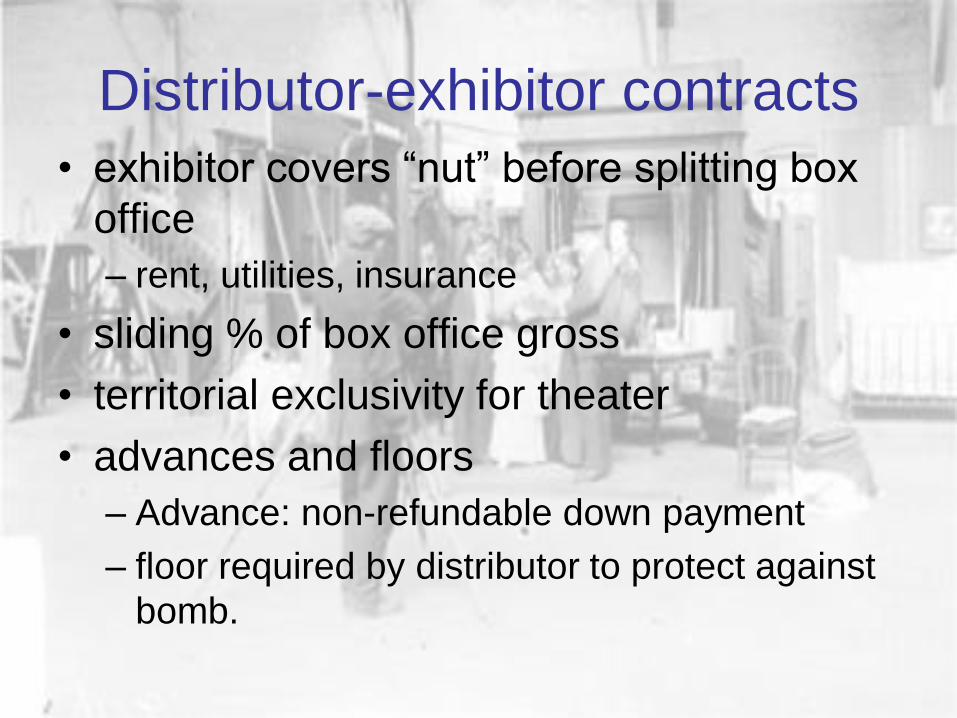
Distributor-exhibitor contracts
• exhibitor covers “nut” before splitting box
office
– rent, utilities, insurance
• sliding % of box office gross
• territorial exclusivity for theater
• advances and floors
– Advance: non-refundable down payment
– floor required by distributor to protect against
bomb.
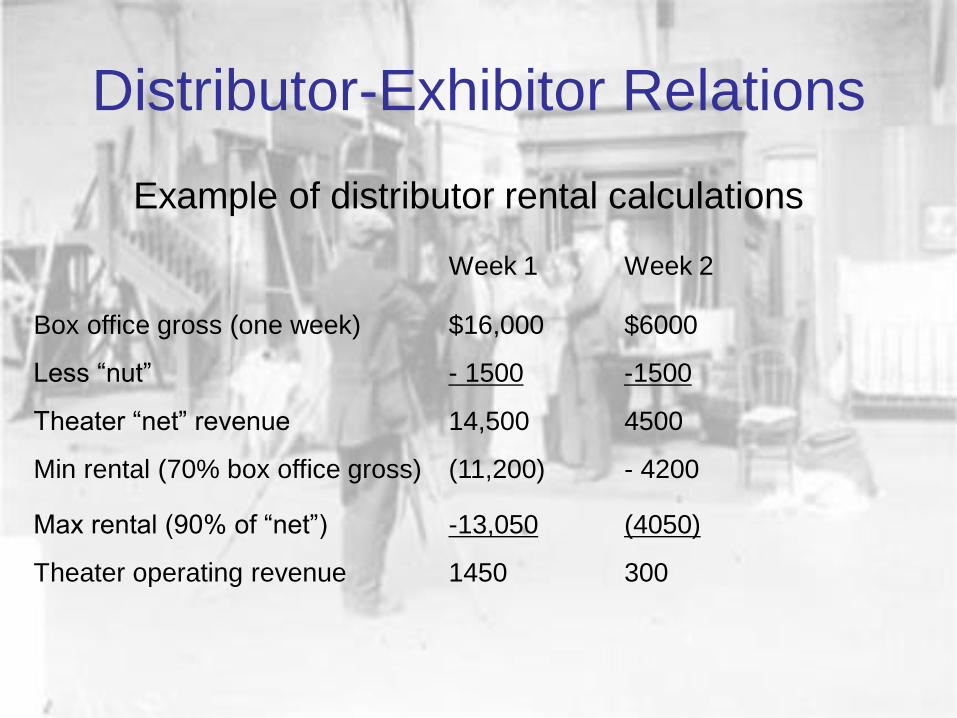
Distributor-Exhibitor Relations
Example of distributor rental calculations
Week 1 Week 2
Box office gross (one week) $16,000 $6000
Less “nut” - 1500 -1500
Theater “net” revenue 14,500 4500
Min rental (70% box office gross) (11,200) - 4200
Max rental (90% of “net”) -13,050 (4050)
Theater operating revenue 1450 300
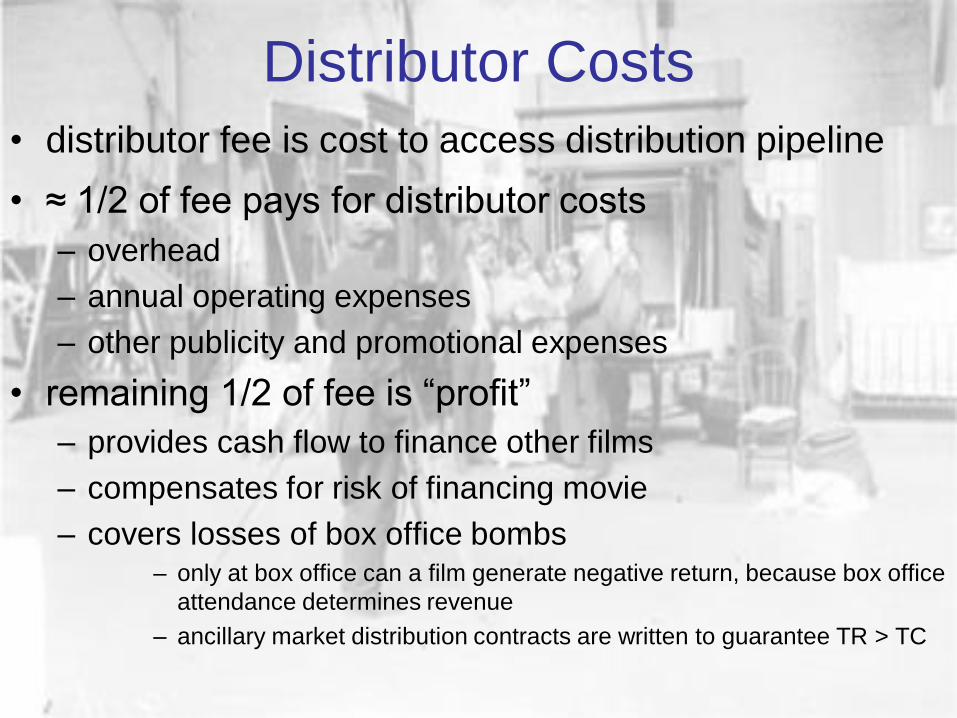
Distributor Costs
• distributor fee is cost to access distribution pipeline
• ≈ 1/2 of fee pays for distributor costs – overhead
– annual operating expenses
– other publicity and promotional expenses
• remaining 1/2 of fee is “profit”
– provides cash flow to finance other films
– compensates for risk of financing movie
– covers losses of box office bombs – only at box office can a film generate negative return, because box office
attendance determines revenue
– ancillary market distribution contracts are written to guarantee TR > TC
Marketing • Advertising
– Often as much as 50% of total cost
– Advertising = f(competition)
• Competition = f(release date)
• release strategy
– wide release requires lots of ads
– slow build-up can rely more on word-of-mouth ads
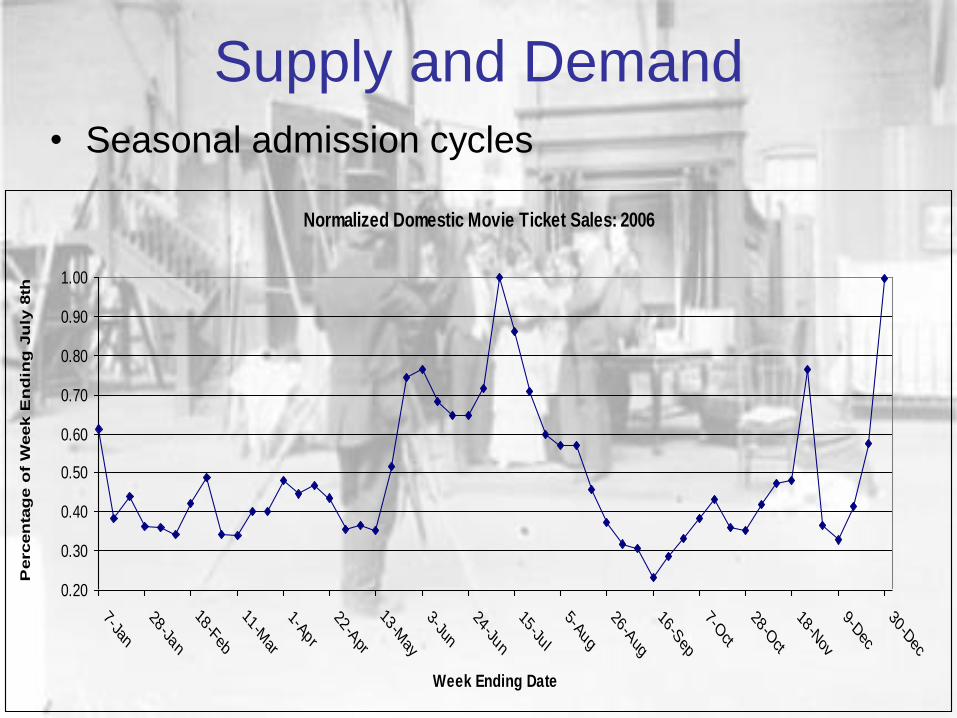
Supply and Demand
• Seasonal admission cycles
Normalized Domestic Movie Ticket Sales: 2006
0.20
0.30
0.40
0.50
0.60
0.70
0.80
0.90
1.00
7-Jan
28-Ja
n
18-F
eb
11-M
ar
1-Apr
22-A
pr
13-M
ay
3-Jun
24-Ju
n
15-Ju
l
5-Aug
26-A
ug
16-S
ep
7-Oct
28-O
ct
18-N
ov
9-Dec
30-D
ec
Week Ending Date
Percen
tag
e o
f W
eek E
nd
ing
Ju
ly 8
th

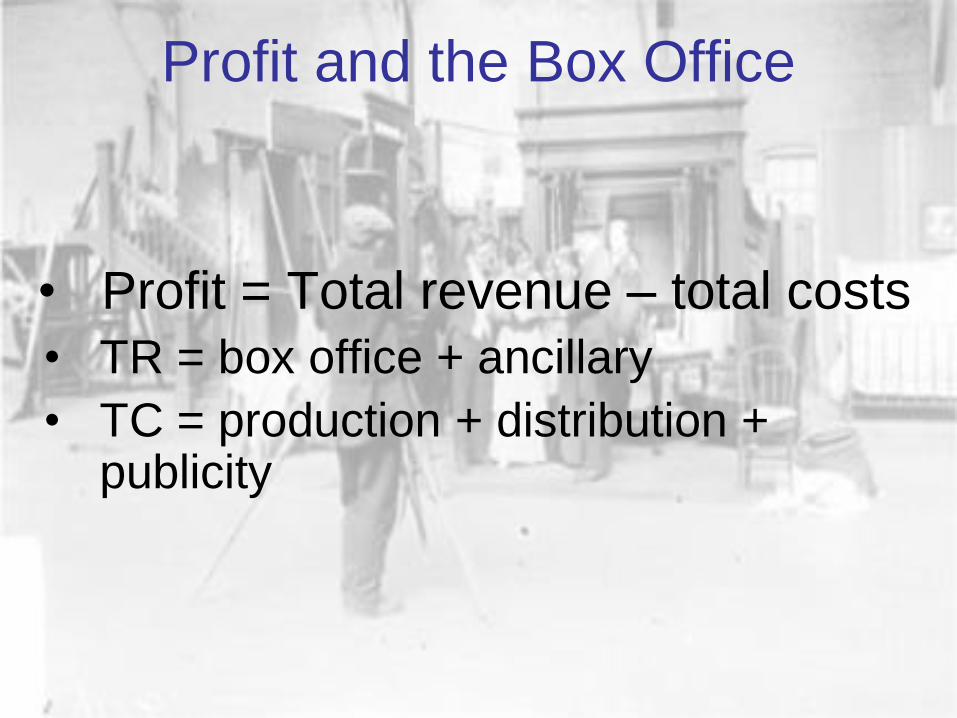
Profit and the Box Office
• Profit = Total revenue – total costs
• TR = box office + ancillary
• TC = production + distribution + publicity
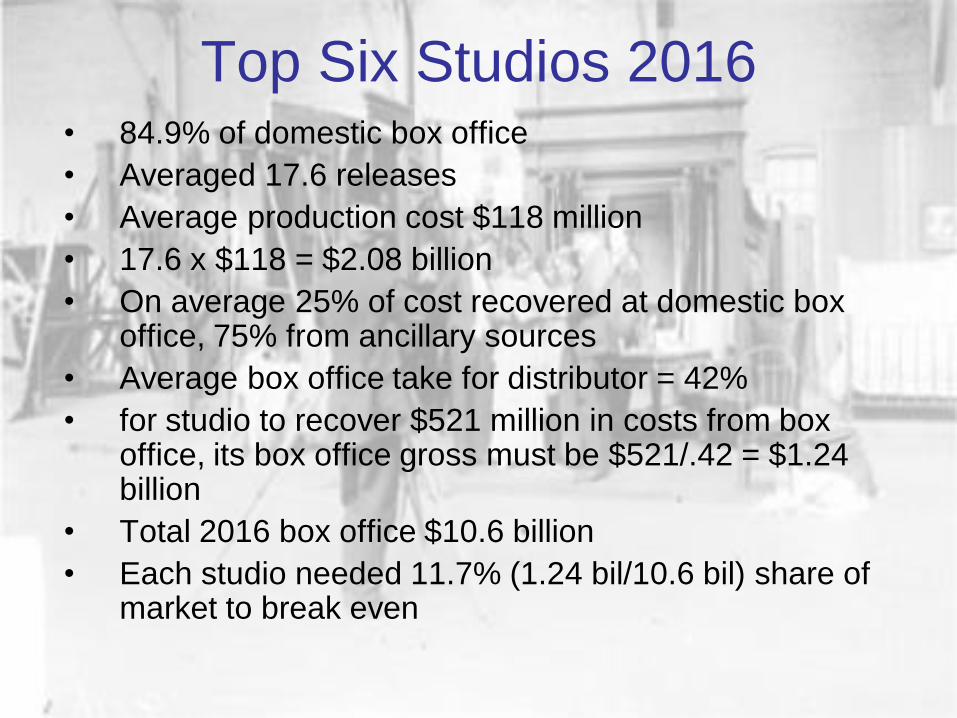
Top Six Studios 2016 • 84.9% of domestic box office
• Averaged 17.6 releases
• Average production cost $118 million
• 17.6 x $118 = $2.08 billion
• On average 25% of cost recovered at domestic box office, 75% from ancillary sources
• Average box office take for distributor = 42%
• for studio to recover $521 million in costs from box office, its box office gross must be $521/.42 = $1.24 billion
• Total 2016 box office $10.6 billion
• Each studio needed 11.7% (1.24 bil/10.6 bil) share of market to break even
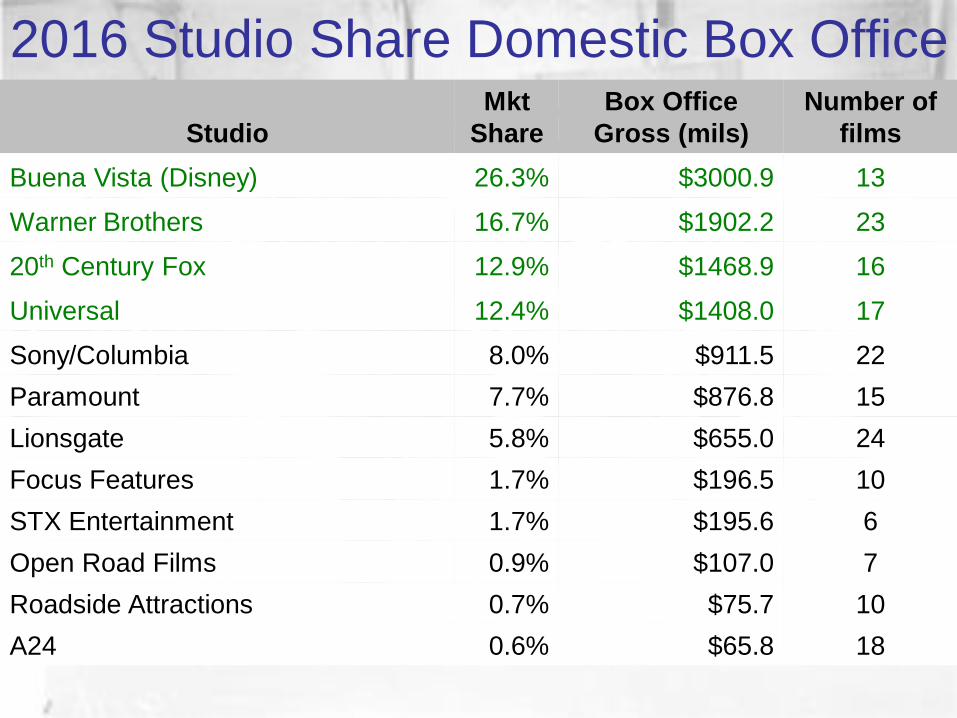
2016 Studio Share Domestic Box Office
Studio
Mkt
Share
Box Office
Gross (mils)
Number of
films
Buena Vista (Disney) 26.3% $3000.9 13
Warner Brothers 16.7% $1902.2 23
20th Century Fox 12.9% $1468.9 16
Universal 12.4% $1408.0 17
Sony/Columbia 8.0% $911.5 22
Paramount 7.7% $876.8 15
Lionsgate 5.8% $655.0 24
Focus Features 1.7% $196.5 10
STX Entertainment 1.7% $195.6 6
Open Road Films 0.9% $107.0 7
Roadside Attractions 0.7% $75.7 10
A24 0.6% $65.8 18
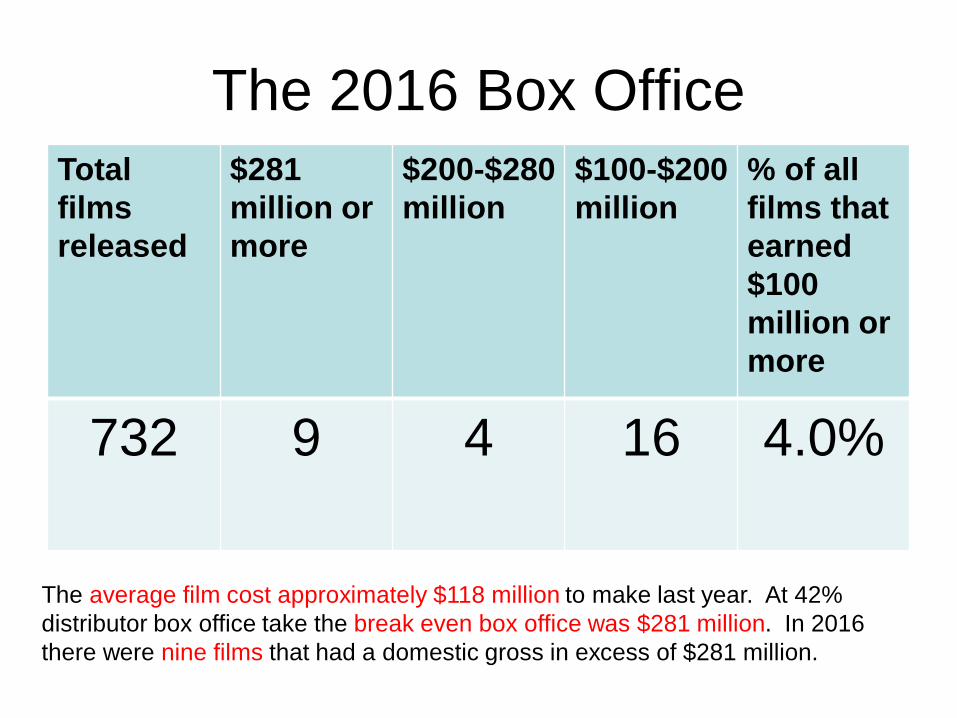
The 2016 Box Office
Total
films
released
$281
million or
more
$200-$280
million
$100-$200
million
% of all
films that
earned
$100
million or
more
732 9 4 16 4.0%
The average film cost approximately $118 million to make last year. At 42%
distributor box office take the break even box office was $281 million. In 2016
there were nine films that had a domestic gross in excess of $281 million.
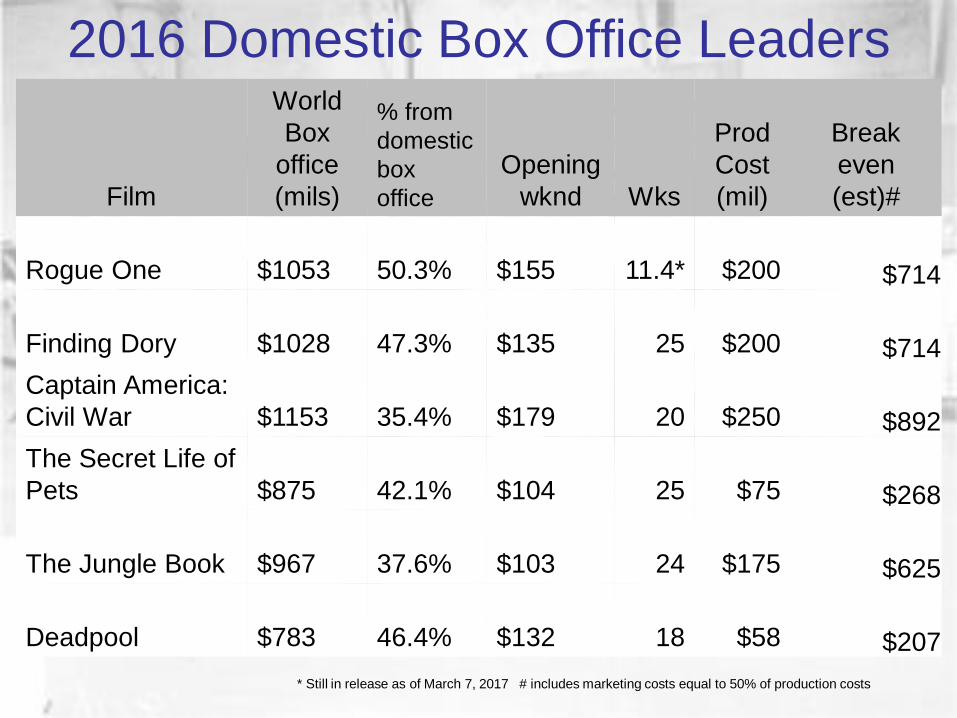
2016 Domestic Box Office Leaders
Film
World
Box
office
(mils)
% from
domestic
box
office
Opening
wknd Wks
Prod
Cost
(mil)
Break
even
(est)#
Rogue One $1053 50.3% $155 11.4* $200 $714
Finding Dory $1028 47.3% $135 25 $200 $714
Captain America:
Civil War $1153 35.4% $179 20 $250 $892
The Secret Life of
Pets $875 42.1% $104 25 $75 $268
The Jungle Book $967 37.6% $103 24 $175 $625
Deadpool $783 46.4% $132 18 $58 $207
* Still in release as of March 7, 2017 # includes marketing costs equal to 50% of production costs
Hollywood Economics
Arthur DeVany
London: Routledge, 2004
Arthur DeVany

Survival of the fittest
• How long does a movie last?
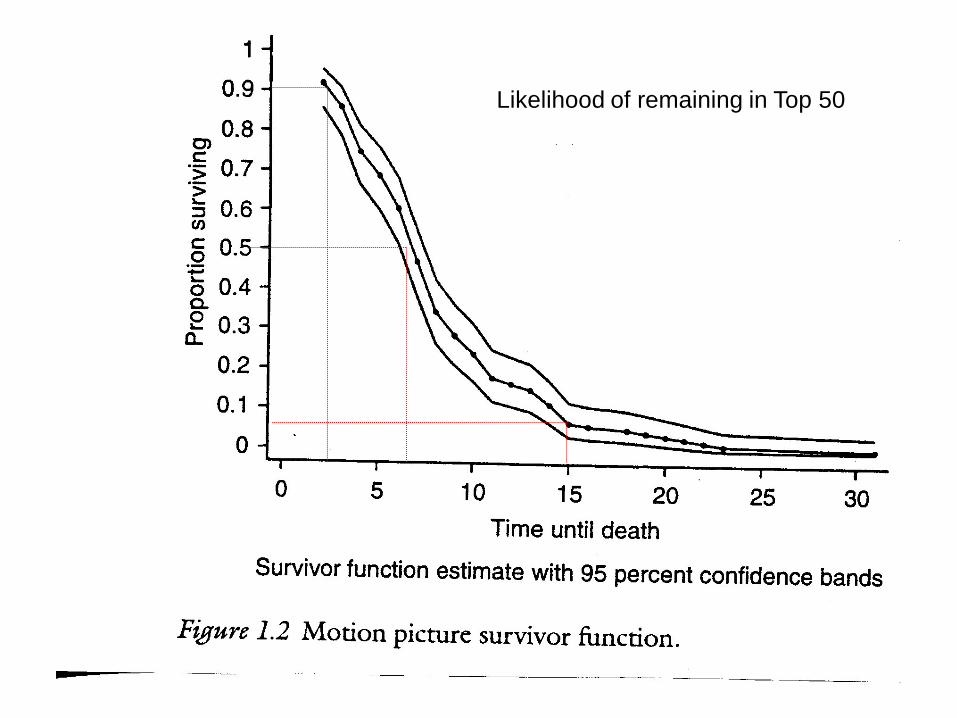
Likelihood of remaining in Top 50
Who produces the movies?
• The movie Lorenz curve
• The studio Lorenz curve
• A top-heavy industry
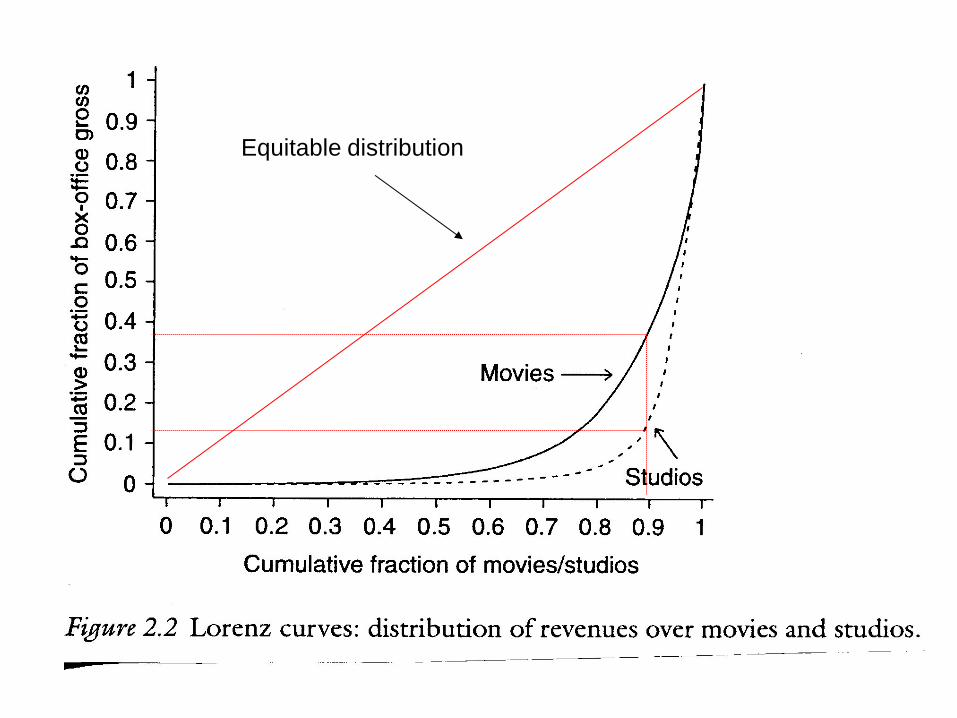
Equitable distribution
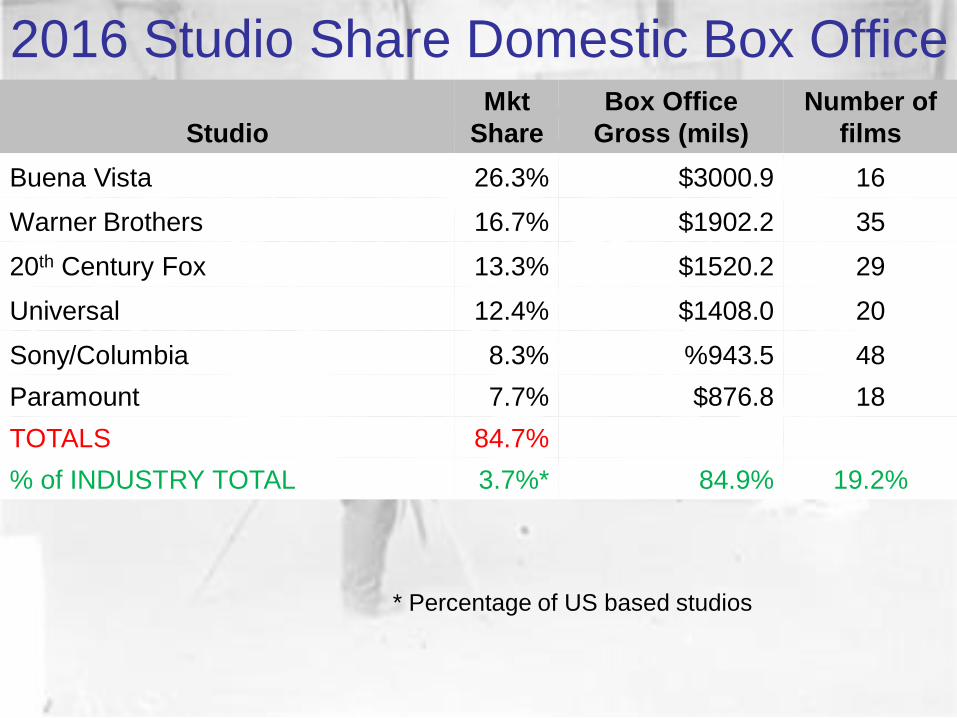
2016 Studio Share Domestic Box Office
Studio
Mkt
Share
Box Office
Gross (mils)
Number of
films
Buena Vista 26.3% $3000.9 16
Warner Brothers 16.7% $1902.2 35
20th Century Fox 13.3% $1520.2 29
Universal 12.4% $1408.0 20
Sony/Columbia 8.3% %943.5 48
Paramount 7.7% $876.8 18
TOTALS 84.7%
% of INDUSTRY TOTAL 3.7%* 84.9% 19.2%
* Percentage of US based studios

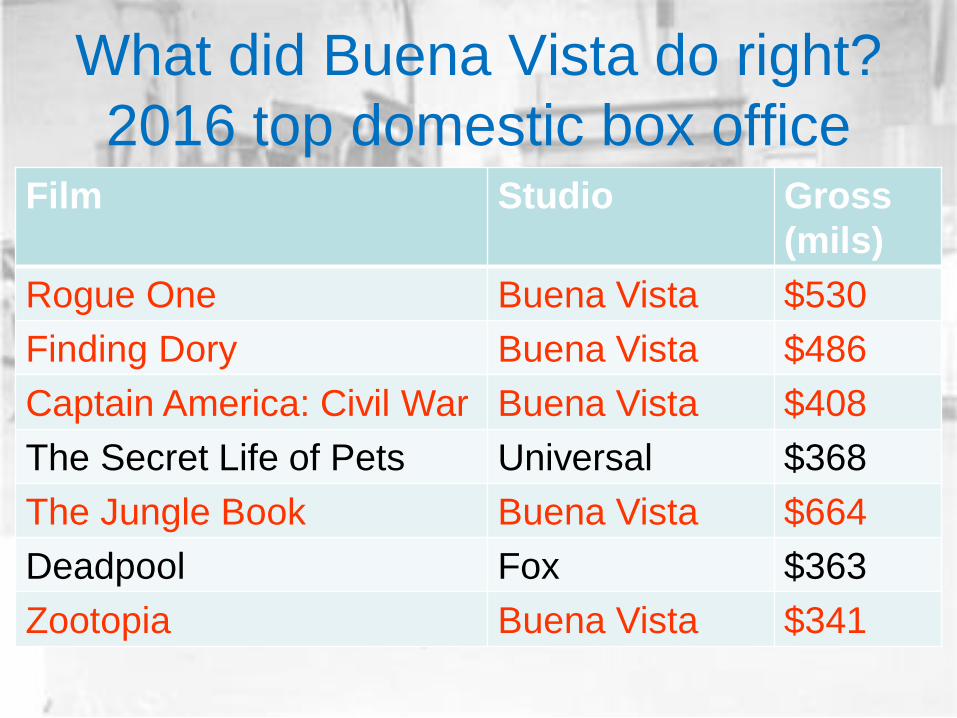
What did Buena Vista do right?
What did Buena Vista do right?
2016 top domestic box office Film Studio Gross
(mils)
Rogue One Buena Vista $530
Finding Dory Buena Vista $486
Captain America: Civil War Buena Vista $408
The Secret Life of Pets Universal $368
The Jungle Book Buena Vista $664
Deadpool Fox $363
Zootopia Buena Vista $341
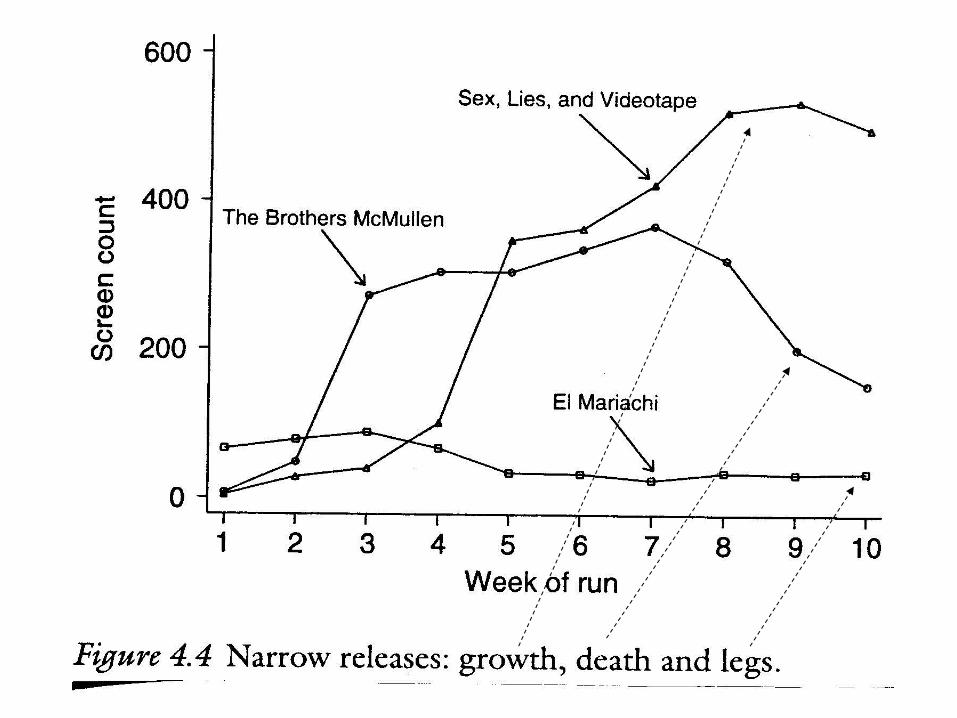
Release strategies
• Wide release
versus slow
build up
• Performance by
release strategy
• Good movies
have legs
• Dogs slink away
Performance over time
• Two-thirds of movies earn their max box-
office revenue in first week
• Slow releases are the exception
• Second week is usually the week of widest
release for most movies
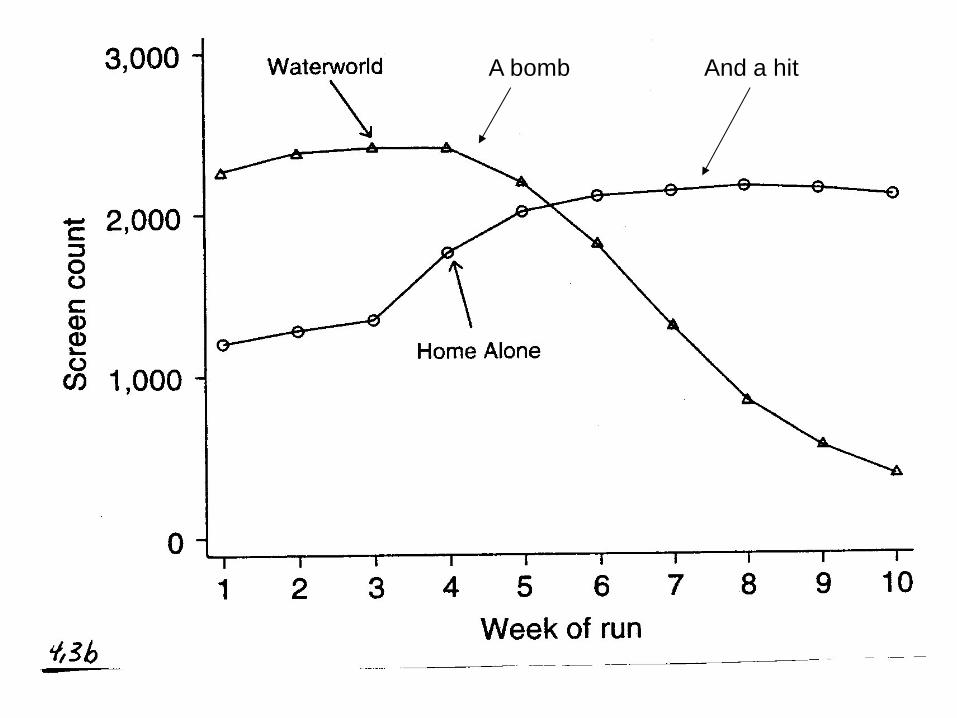
A bomb And a hit

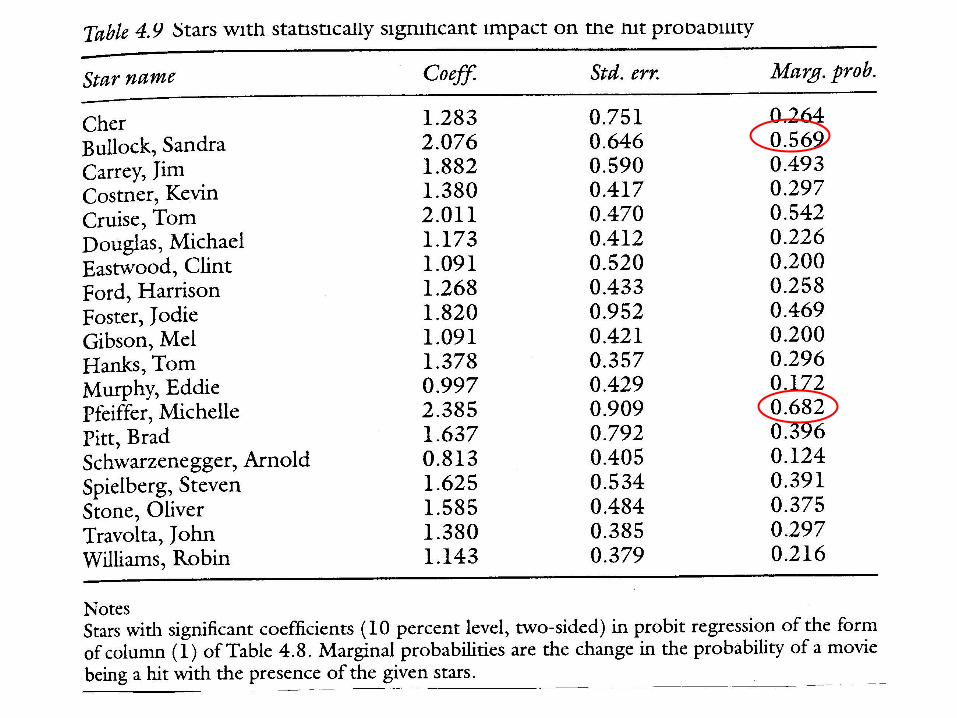
Star power
• Why stars are paid so
much
• How valuable is a
star?
• Can a big name save
a big bomb?
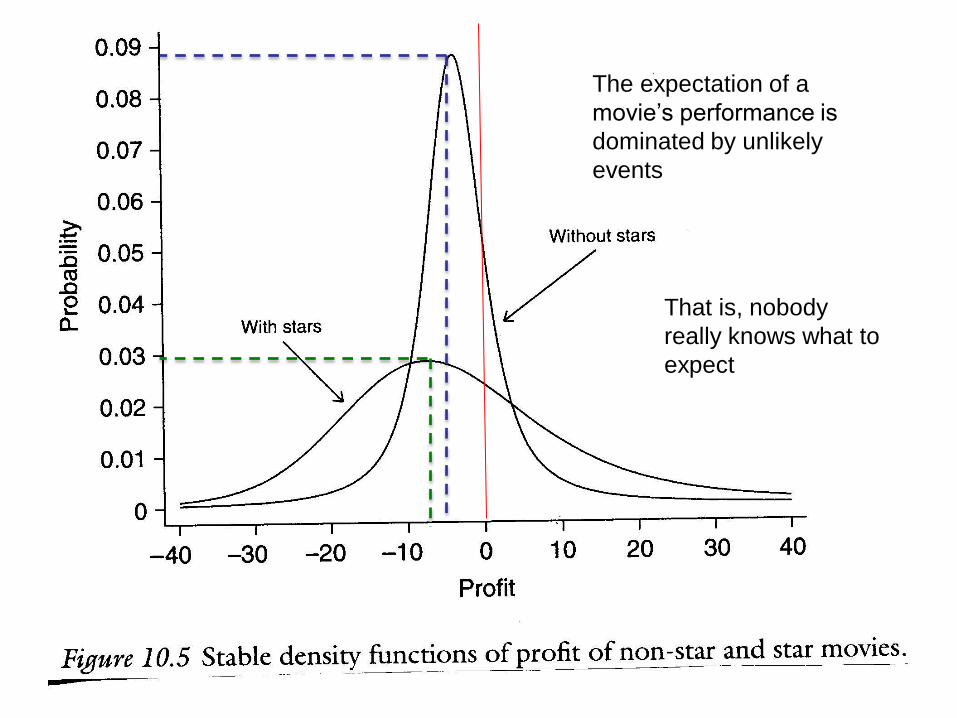
The expectation of a
movie’s performance is
dominated by unlikely
events
That is, nobody
really knows what to
expect

What makes a hit?
• Rating, Genre or Star?
• Predicting performance

Since film
rentals
are
approx
one half
of box-
office
revenues,
a gross
return of
2 would
be the
break
even
point
same
mean
but diff
std dev
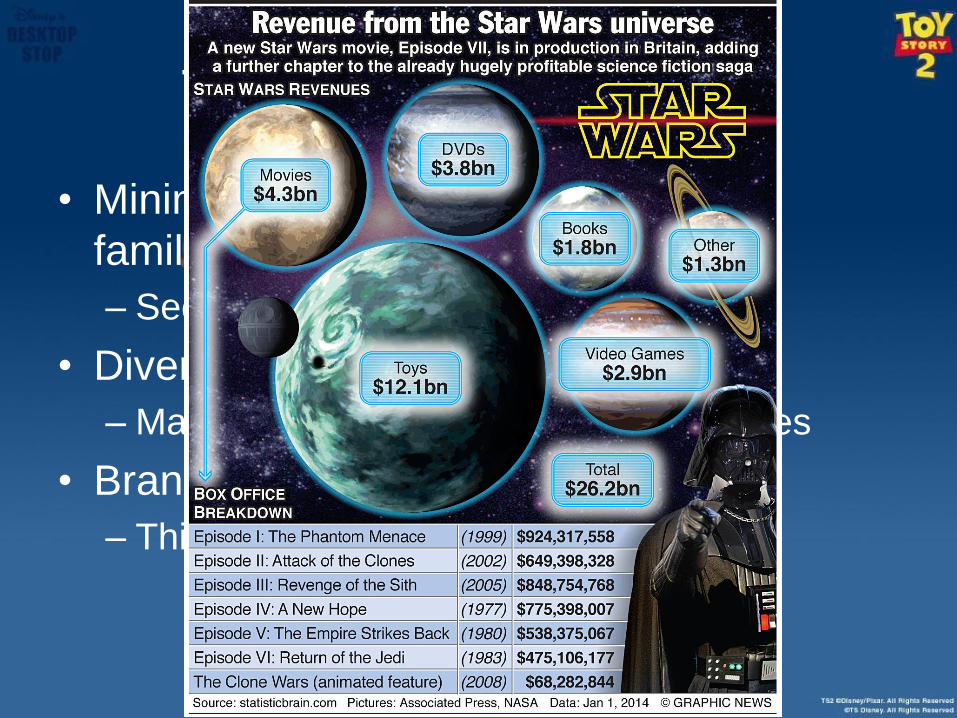
The current philosophy
• Minimize risk by offering something
familiar
– Sequels, stars, franchises
• Diversify
– Major studios are parts of conglomerates
• Brand your product
– Think toys, video games, etc
Summary
• The movie industry is built on the
blockbuster model
– Stars are the safest bet among a selection of
risky bets
– Because movies are experience goods,
subject to the ever changing whims of the
audience, copycat producing is a safe bet
– Tension between artist and financier
Summary
• The importance of ancillary markets
• Studios finance and distribute
• Marketing costs depend on competition
and release strategy
• The bulk of the box office dollar goes to
the distributor
Questions?