the state of the harbor 2012 - welcome to … · the state of the harbor 2012 michael r. bloomberg,...
TRANSCRIPT

THE STATE OF THE HARBOR 2012
Michael R. Bloomberg, Mayor Carter H. Strickland, Jr., Commissioner

This page was intentionally left blank.

THE STATE OF THE HARBOR 2012

4NEW YORK CITY DEPARTMENT OF ENVIRONMENTAL PROTECTION
THE STATE OF THE HARBOR 2012
5
Dear Friends,
With 520 miles of shoreline, the waterways that surround and adjoin the five bor-oughs are among New York City’s greatest assets.
Over the past decade, the City has invested more than $10 billion to improve water quality in the harbor, which is now the cleanest it has ever been in more than a century of testing.
Even with these promising trends, we know there is more work to be done. Over the next ten years, we have allocated $5.2 billion to improve the quality of New York City’s waterways, including $1.1 billion for cost-effective green and grey infra-structure as part of the NYC Green Infrastructure Plan. We will also spend $3.3 billion to keep our wastewater treatment plants and pumping stations in a state of good repair.
I encourage you to read this document in conjunction with the NYC Green Infra-structure Plan: 2012 Update, Strategy 2011-2014: 2012 Progress Report, and State of the Sewers 2012 to get a full understanding of the City’s efforts to restore our har-bor’s natural ecology and restore the recreational use of our waterways. Join me in celebrating the hard work we have all done to continue to improve the quality of New York City’s waterways, and I look forward to a cleaner harbor for years to come.
Sincerely,
Carter H. Strickland, Jr. Commissioner New York City Department of Environmental Protection
COVER LETTER

6NEW YORK CITY DEPARTMENT OF ENVIRONMENTAL PROTECTION
TABLE OF CONTENTS
Introduction ........................................................................................ 8
The Clean Water Act ...................................................................... 8
Wastewater ........................................................................................ 10
Collection ...................................................................................... 10
Treatment ...................................................................................... 11
Sludge ........................................................................................... 13
Investing In Our Infrastructure .......................................................... 14
Nitrogen ......................................................................................... 15
Industrial Waste .............................................................................. 17
Stormwater ........................................................................................ 18
Cost-Effective Grey Infrastructure .................................................... 18
Innovative Green Infrastructure ........................................................ 20
Pollution Prevention ........................................................................ 20
Ecological Restoration .................................................................... 22
Harbor Water ..................................................................................... 24
Performance Metrics ........................................................................... 26
Harborwide .................................................................................... 28
The Inner Harbor ............................................................................ 30
Lower New York Bay - Raritan Bay .................................................. 32
Jamaica Bay .................................................................................. 34
The Upper East River - Western Long Island Sound ......................... 36
Conclusion ......................................................................................... 38

THE STATE OF THE HARBOR 2012
7
LowerNew York
Bay
NEW JERSEY
WESTCHESTER COUNTY
QUEENS
BROOKLYN
STATEN ISLAND
BRONX
MANHA
TTAN
Huds
on R
iver Long Island
Sound
ATLANTIC OCEAN
UpperNew York
Bay
Raritan Bay
Arthur K
ill
Kill Van Kull
JamaicaBay
Harle
m R
iver
East
River
Upper East River
Newar
k Bay
Legend
Tributary Stations
Open Water Stations
0 52.5 10Miles
NEW YORKHARBOR SURVEY
8NEW YORK CITY DEPARTMENT OF ENVIRONMENTAL PROTECTION
INTRODUCTIONThe first Europeans to arrive in New York Harbor found a vast landscape largely un-touched by generations of native inhabitants. Over the next few centuries, the City of New York grew and developed around the harbor, relying on its waters for trans-portation, trade, and recreation. As population surged in the nineteenth century and concern about public health grew, New York City began constructing sewers to convey wastewater from homes and businesses directly to the nearest water-way. The dumping of household and industrial waste into the harbor had serious environmental consequences.
By the beginning of the twentieth century, the harbor’s once vibrant coastal eco-systems were no longer able to support wildlife, and bacteria in the water forced the city to ban bathing at area beaches. To address this public health issue, the City built its first wastewater treatment plants at Coney Island, 26th Ward, and Jamaica. These plants relied on simple mechanical processes – screening and settling – to remove solid waste from a fraction of the city’s total wastewater flow.
In 1909, New York City created the Harbor Survey Program to scientifically study the relationship between wastewater and harbor water quality. By the 1920s, using data from this innovative program, the city developed a plan for improving and ex-panding the wastewater treatment system in New York. While the Great Depression initially delayed investments in wastewater treatment, between 1937 and 1944, the City partnered with the federal Works Progress Administration to construct the Wards Island Wastewater Treatment Plant in Manhattan as well as Bowery Bay and Tallman Island plants in Queens.
By the mid-1960s, the City had constructed five additional wastewater treatment plants and upgraded the three older plants to meet the needs of the growing population, which was rapidly approaching eight million. By 1968, 12 wastewater treatment plants were operating in New York City with a design capacity of 1.4 bil-lion gallons of wastewater each day.
The City created the Department of Environmental Protection (DEP) in 1977 by consolidating the Bureau of Air Resources and the Department of Water, Gas and Electricity. Today, DEP protects public health and the environment by supplying clean drinking water, collecting and treating wastewater, and reducing air, noise,
In 1972, Congress passed the Clean Water Act, which established ambitious goals to reduce water pollution and enable safe recreational use of navigable waterways. To help municipalities comply with new wastewa-ter treatment standards, Congress developed a major federal public works financing program. Since then, combined federal and municipal investment to improve the quality of the city’s waterways has exceeded $35 billion.
THE CLEAN WATER ACT
THE STATE OF THE HARBOR 2012
9
and hazardous materials pollution. Every day, DEP treats an average of 1.3 billion gallons of wastewater and helps restore and maintain water quality in New York Harbor.
By 1987, with the completion of the North River Wastewater Treatment Plant in Manhattan and Red Hook in Brooklyn, the city had the capacity to capture 100% of dry-weather wastewater flows.
In the years since, the City has continued to invest in harbor water quality improve-ments, including more than $10 billion since 2002. In addition, DEP has adopted a proactive, data-driven approach to operating New York City’s wastewater system. By using a range of new tools and innovative practices, we can focus our resources on managing risk and providing the highest level of service to New Yorkers.
As a result, New York Harbor is cleaner than it has ever been in more than a century of testing, even as the population of New York City continues to grow. This report will describe the tools and processes used to improve harbor water quality and demonstrate how DEP uses them to operate the wastewater system better and more effectively than ever before.
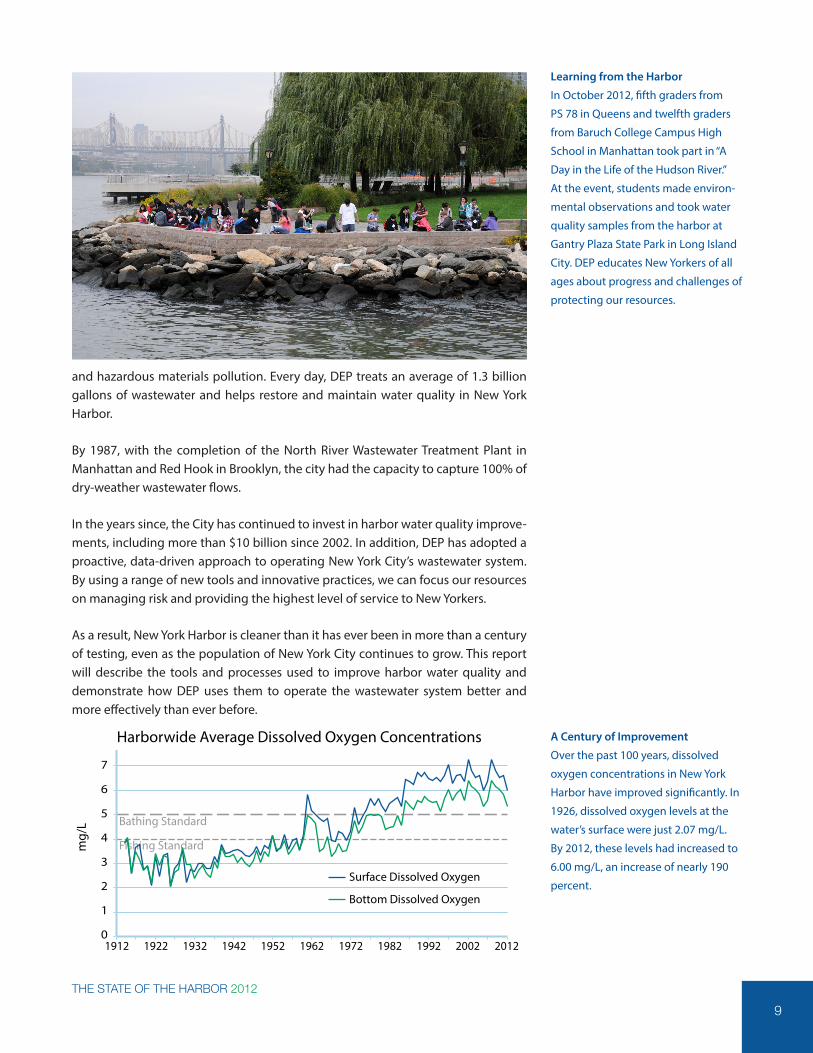
A Century of Improvement
Over the past 100 years, dissolved
oxygen concentrations in New York
Harbor have improved significantly. In
1926, dissolved oxygen levels at the
water’s surface were just 2.07 mg/L.
By 2012, these levels had increased to
6.00 mg/L, an increase of nearly 190
percent.
Learning from the Harbor
In October 2012, fifth graders from
PS 78 in Queens and twelfth graders
from Baruch College Campus High
School in Manhattan took part in “A
Day in the Life of the Hudson River.”
At the event, students made environ-
mental observations and took water
quality samples from the harbor at
Gantry Plaza State Park in Long Island
City. DEP educates New Yorkers of all
ages about progress and challenges of
protecting our resources.
Bathing Standard
Fishing Standard
0
1
2
3
4
5
6
7
8
1912 1922 1932 1942 1952 1962 1972 1982 1992 2002 2012
mg/
L
Surface Dissolved Oxygen
Bottom Dissolved Oxygen
Harborwide Average Dissolved Oxygen Concentrations
10NEW YORK CITY DEPARTMENT OF ENVIRONMENTAL PROTECTION
WASTEWATEREvery day, homes, schools, businesses, and factories send more than a billion gal-lons of wastewater down toilets and drains into New York City’s 7,500-mile sewer system and, ultimately, to one of 14 wastewater treatment plants.
COLLECTIONNew York City, like other older urban centers, is largely served by a combined sewer system where stormwater and wastewater are carried through a single pipe. During heavy storms, this combined flow can exceed the system’s capacity. The system is designed to discharge a mix of stormwater and wastewater—called combined sewer overflow or CSO—into nearby waterways in order to prevent the biological processes at the wastewater treatment plants from becoming compromised. In the combined system, wastewater flows through a series of progressively larger sewers into a regulator, which controls wastewater flow.
Regulators consist of a concrete channel bounded on one side by a low wall called a weir. During wet weather events, combined stormwater and wastewater flow may exceed the regulator’s maximum design capacity, at which point the waste-water will overtop the weir and spill into an adjacent channel. That channel carries the combined sewer overflow to an outfall pipe that discharges into the harbor. Tide gates keep seawater from entering the system through the outfalls.
The rest of the city is served by separate storm and sanitary sewers. Storm sewers carry runoff from rainstorms and snow melt directly to nearby waterways, while sanitary sewers convey wastewater from homes and businesses to a wastewater treatment plant. Sanitary sewers are not affected by variable wet weather flows, so separate sewers do not flow through regulators or include outfalls to waterways.
Some parts of the city do not have sanitary or combined sewers. On undeveloped lands, such as parks and cemeteries, no wastewater is generated and stormwater mostly infiltrates directly into the ground. There are also some neighborhoods that developed before the sewer system could be extended to reach them and have suburban-style septic systems that treat wastewater on-site.
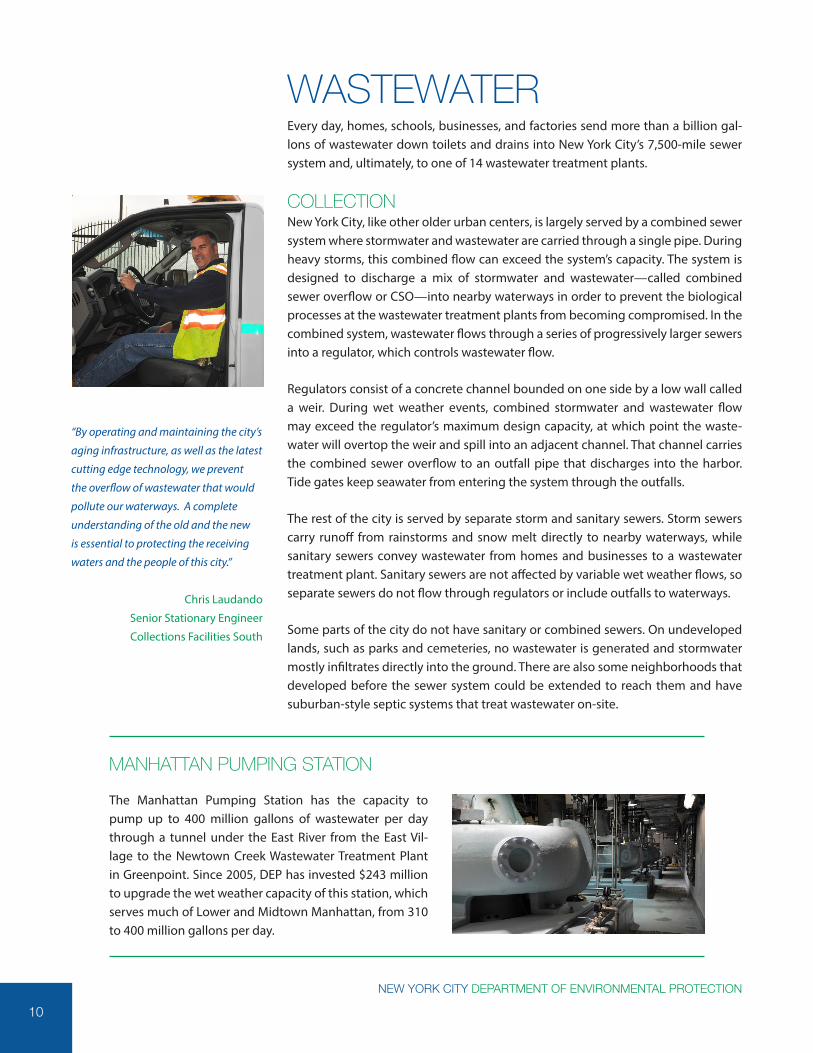
“By operating and maintaining the city’s
aging infrastructure, as well as the latest
cutting edge technology, we prevent
the overflow of wastewater that would
pollute our waterways. A complete
understanding of the old and the new
is essential to protecting the receiving
waters and the people of this city.”
Chris Laudando
Senior Stationary Engineer
Collections Facilities South
The Manhattan Pumping Station has the capacity to pump up to 400 million gallons of wastewater per day through a tunnel under the East River from the East Vil-lage to the Newtown Creek Wastewater Treatment Plant in Greenpoint. Since 2005, DEP has invested $243 million to upgrade the wet weather capacity of this station, which serves much of Lower and Midtown Manhattan, from 310 to 400 million gallons per day.
MANHATTAN PUMPING STATION

THE STATE OF THE HARBOR 2012
11
In some areas, distance and topography limit the ability of sewers to convey waste-water by gravity alone. In these places, DEP operates 96 pumping stations to lift the wastewater up to a higher level or push it through a pressurized pipe, called a force main. Pumping stations range in size and design from small underground vaults to large facilities.
From the sewer mains and regulators, wastewater flows into large pipes under-ground. These massive sewers, called interceptors, are the superhighways that carry a combination of sanitary wastewater and, in the combined system, storm-water directly to the wastewater treatment plants. Across the system, interceptors vary in size (from 30” to 192” wide) and shape (from rectangular to horseshoe shaped). The 138 miles of interceptor sewers in New York City carry as much as four billion gallons of wastewater per day when it rains. Interceptor sewers can also temporarily store wastewater during wet weather, which allows the stored waste-water to flow to a plant after the rainfall ends.
TREATMENTWastewater treatment plants remove most pollutants from wastewater before it is released to local waterways. At the plants, physical and biological processes close-ly duplicate how wetlands, rivers, streams, and lakes naturally purify water. While the natural treatment of wastewater can take weeks, treatment at a wastewater treatment plant is comparatively quick; it takes only seven hours to remove most of the pollutants from wastewater. At New York City’s wastewater treatment plants, wastewater undergoes five major processes: preliminary treatment, primary treat-ment, secondary treatment, disinfection, and sludge treatment.
Wastewater In�uent
Seed Sludge
Primary Sludge
Gravity Thickener
Anaerobic Digester
SecondarySludge
Primary Screening
Main Sewage Pump
Primary Settling
Aeration Tank
Final Settling
ChlorinationTo
Outfall
Sludge Storage and Dewatering
Bypass
THE WASTEWATER TREATMENT PROCESS

12NEW YORK CITY DEPARTMENT OF ENVIRONMENTAL PROTECTION
Wastewater flows into the plants several stories underground. The incoming waste-water, called influent, passes through screens consisting of upright bars, spaced about one to three inches apart. These bars prevent large pieces of trash, such as rags, sticks, newspaper, cans, bottles, and plastic cups, from damaging the main sewage pumps. Large motor-driven rakes clear debris that collects on screens and transfer it to bins for disposal at a landfill. The main sewage pumps then lift the wastewater from the screening chamber to the surface level of the plant. From here, the wastewater flows by gravity through the entire treatment process.
The wastewater then enters the primary settling tanks, where it is slowed to allow heavier solids to sink to the bottom of the tank and lighter materials to float. At the end of the process, skimmers collect the floatable trash, such as grease and small plastic material, from the surface of the tank.
The settled solids, called primary sludge, are then pumped through devices that use centrifugal force to separate out sand, grit, and gravel. This grit is removed, washed, and sent to landfills. The degritted primary sludge is pumped to the plant’s sludge handling facilities. The partially treated wastewater from the primary setting tanks then flows on to the next step of the process.
During secondary treatment, plants employ the activated sludge process to fur-ther break down suspended solids in wastewater. Air is pumped into large aeration tanks, where it mixes with wastewater and stimulates the growth of bacteria and other organisms naturally present in wastewater that thrive in an oxygen-rich environment. These beneficial microorganisms consume most of the remaining organic matter in the wastewater. DEP scientists closely monitor oxygen levels in the aeration tanks to maintain the proper conditions for the waste-eating bacteria.
The aerated wastewater then flows to the final settling tanks, which are similar to the primary settling tanks. Here any remaining solids settle to the bottom of the tank as secondary sludge. Some of this sludge is sent back to the aeration tanks as “seed” to jump start the bacteria in the activated sludge process. The remaining
Removing Pollutants
At the Bowery Bay Wastewater Treat-
ment Plant, a network of pipes carry
forced air to the aeration tanks, where
the oxygen-rich environment helps
microorganisms consume much of
the organic matter and solids present
in wastewater. “Seed” sludge is also
added to the tanks to maintain the
balance of bacteria and microorgan-
isms and stimulate the process.
“Working with dedicated and highly
skilled individuals at DEP is not only
rewarding to me but rewards the people
of New York City with clean water-
ways to enjoy and a healthy maritime
ecosystem.”
Matthew Ilardi
Sewage Treatment Worker
Wards Island

THE STATE OF THE HARBOR 2012
13
sludge is removed from the settling tanks and mixed with the primary sludge in the sludge handling facilities.
Even after primary and secondary treatment, disease-causing organisms may remain in the treated wastewater. To disinfect and kill harmful organisms, the wastewater spends a minimum of 15-20 minutes in chlorine-contact tanks mixing with sodium hypochlorite, the same chemical found in common household bleach. The treated wastewater, or effluent, is then released into local waterways through outfalls located at at the riverbed or sea floor.
SLUDGEThe sludge produced by primary and secondary treatment is approximately 99% water and must be concentrated before further processing. Thickening tanks allow the sludge to collect, settle, and separate from the water for up to 24 hours. The water is then sent back to the beginning of the plant for additional treatment.
After thickening, DEP further treats the sludge to reduce its volume and make it safer for the environment. The sludge is placed in oxygen-free tanks, called anaer-obic digesters, and heated for up to three weeks. They work just like your stomach, stimulating the growth of anaerobic bacteria that consume organic material in the sludge. The digestion process stabilizes the thickened sludge by converting much of the material into water, carbon dioxide, and methane gas. The sludge that re-mains after digestion has little odor and is the consistency of pea soup.
Digested sludge is then pumped from sludge storage tanks to a dewatering facil-ity. At some treatment plants, where there are no dewatering facilities on site, the sludge is transported for processing through a pipeline or by boat to a plant that has a dewatering facility.
Dewatering reduces the liquid volume of sludge by about 90%. New York City has dewatering facilities at 6 of our 14 treatment plants. At these facilities, digested sludge is sent through large centrifuges that operate like the spin cycle of a wash-
Sludge Transport
Workers prepare the M. V. North River
to transport sludge from one waste-
water treatment plant to another. At
323 feet long, the North River can hold
up to 760,000 gallons of sludge, more
than enough to fill an Olympic-sized
swimming pool.

14NEW YORK CITY DEPARTMENT OF ENVIRONMENTAL PROTECTION
ing machine. The force from the quickly spinning centrifuges extracts most of the water from the solids in the sludge, leaving behind a substance known as biosol-ids cake. The water drawn from the spinning process is then returned to the head of the plant for reprocessing. Additives, called organic polymers, improve the consistency of the biosolids, resulting in a firmer, more manageable product. The biosolids cake is approximately one-quarter solid material.
INVESTING IN OUR INFRASTRUCTUREIn the twenty-five years since the completion of the Red Hook Wastewater Treat-ment Plant, the City has continued to make significant investments to improve the quality and capacity of the wastewater treatment system. In the past ten years, the City has invested more than $10 billion to improve water quality in New York Har-bor, and it plans to invest another $5.2 billion over the next ten years.
The City has undertaken a $5 billion upgrade at the Newtown Creek Wastewater Treatment Plant to improve the amount of pollution removed from the wastewater and increase the plant’s treatment capacity from 620 to 700 million gallons per day in wet weather. The plant went into operation in 1967, before Congress passed the landmark Clean Water Act, which requires municipalities to remove at least 85% of certain pollutants from wastewater before discharging it into surrounding water-ways. The plant upgrade, begun in 2000, brought the plant into compliance with Clean Water Act standards in 2011, two years ahead of schedule. Now, all 14 waste-water treatment plants in New York City meet secondary treatment and removal requirements.
Newtown Creek’s extensive upgrade plan includes improved operating systems, expanded electrical power capacity, new disinfection systems, new centrifuges and digesters, upgraded pumping stations, and new aeration and sedimentation basins and sludge storage tanks. The plant’s disinfection systems have been com-pletely reconstructed to more efficiently eliminate pathogens in the wastewater.
Spinning Sludge into Biosolids
Centrifuges at Wards Island Waste-
water Treatment Plant spin at more
than 1,000 revolutions per minute to
remove as much as 90 percent of the
liquid from digested sludge. The final
product, called biosolids cake, con-
tains one-quarter solids and is ready
to be sent for further processing into
fertilizer pellets or for use in landfills.
ENERGY AND EMISSIONS
Running the pumps, blowers, boilers, and other equipment involved in the wastewater treatment process uses a lot of energy. In fact, DEP is the second largest municipal electricity consumer in the city, after the Department of Education. DEP also accounts for a significant amount of greenhouse gas emissions - nearly 700,000 metric tons at the peak in 2008. To meet the goals set forth in PlaNYC, DEP is tak-ing steps to implement aggressive demand management practices at our plants and other facilities. With these initiatives and projects to generate clean energy using anaerobic digester gas and hydroelec-tric power, DEP hopes to reduce our greenhouse gas emissions by 30 percent from the 2006 baseline.
THE STATE OF THE HARBOR 2012
15
In addition to the Newtown Creek Wastewater Treatment Plant upgrade, the City has made investements to upgrade and improve a number of other plants over the last ten years. At the Hunts Point Wastewater Treatment Plant, the City invest-ed $595 million to increase wet weather capacity, build a new nitrogen removal system, and construct a Central Residuals Facility to reduce odors from the plant. The City has also undertaken major upgrades to the 26th Ward, Coney Island, North River, and Owls Head wastewater treatment plants. Over the next ten years, the City will invest $3.3 billion to keep our wastewater treatment facilities in a state of good repair.
NITROGENNitrogen is the most common element in the Earth’s atmosphere. It is a major building block of plant and animal proteins, as well as a key nutrient for all types of life. Because some nitrogen-based molecules have nutrient properties, they are commonly used as fertilizers. However, excess nitrogen in runoff and wastewater effluent can promote the growth of harmful algae and reduce levels of dissolved oxygen, limiting the ability of the waterbody to sustain a healthy ecosystem.
Nitrogen is not a pathogen and poses no threat to human health, so the waste-water treatment plants were not originally designed to remove it from effluent. In the 1980s, the City and environmental groups grew concerned about the impact of nitrogen on New York Harbor, especially as the total nitrogen discharged was expected to increase due to nationwide changes in sludge handling laws. In the early 1990s, the City developed a Nitrogen Control Action Plan to reduce the total nitrogen discharge into two ecologically sensitive waterbodies, the Upper East River and Jamaica Bay. Since 2002, the City has invested $1.1 billion on upgrades to wastewater treatment plants to remove nitrogen from plant effluent and has allocated $173 million over the next decade to construct additional nitrogen con-trol facilities.
In 2009, DEP announced the construction of the Single Reactor System for High Ammonia Removal Over Nitrate, or SHARON, process at the Wards Island Waste-water Treatment Plant to demonstrate this technology for the first time in North
“My role is to maintain all the proper op-
erational and process parameters at the
plant, to ensure the highest removals of
solids, organic matter, and other pollut-
ants, which results in the cleanest water
to our harbor and receiving waters. “
Henry Gittens
Stationary Engineer, Electric
Newtown Creek
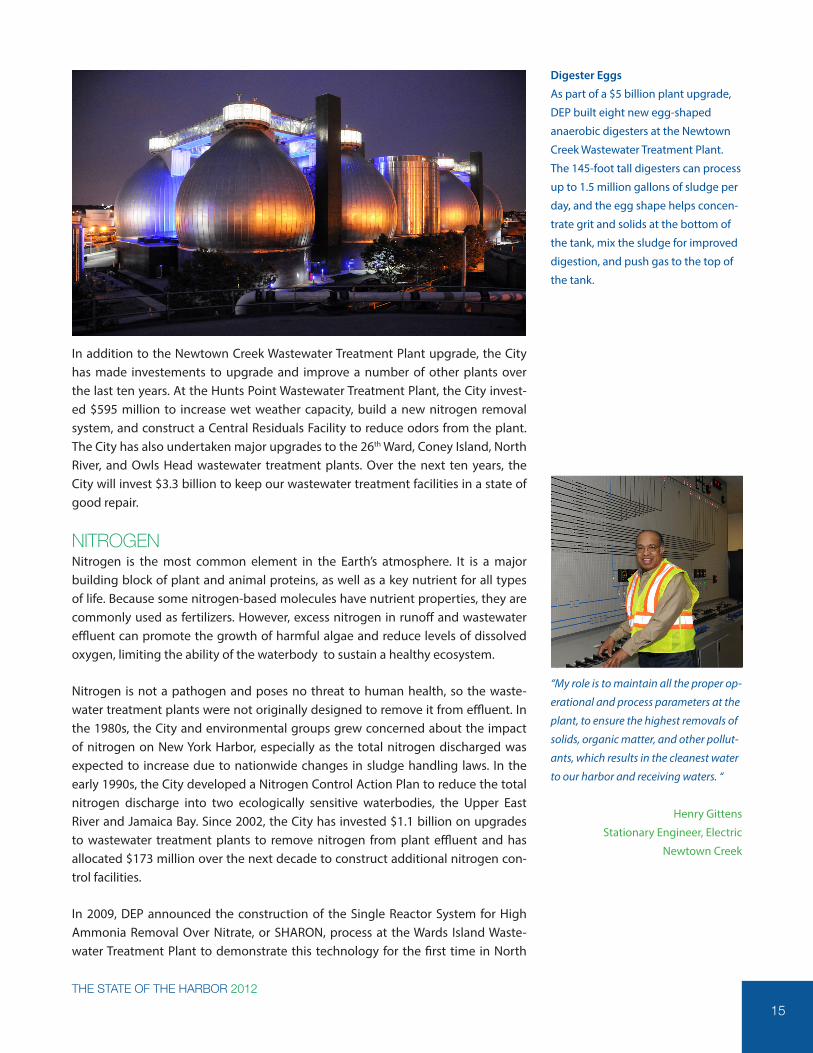
Digester Eggs
As part of a $5 billion plant upgrade,
DEP built eight new egg-shaped
anaerobic digesters at the Newtown
Creek Wastewater Treatment Plant.
The 145-foot tall digesters can process
up to 1.5 million gallons of sludge per
day, and the egg shape helps concen-
trate grit and solids at the bottom of
the tank, mix the sludge for improved
digestion, and push gas to the top of
the tank.
16NEW YORK CITY DEPARTMENT OF ENVIRONMENTAL PROTECTION
Hurricane Sandy brought high winds and a record 14-foot storm surge to New York Harbor. Many of the city’s wastewater treatment plants and pumping stations, located along the water’s edge, were flooded or
damaged. Eight plants experi-enced treatment disruptions due to flooding or power failure. Dedicated sewage treatment workers, tradespeople, and en-gineers worked quickly to repair the damage and limit the dis-charge of raw or partially treated wastewater. Within 96 hours of the storm, the city was fully treat-ing 99 percent of wastewater. This chart shows the increase in wastewater flow during the storm, the result of seawater en-tering the sewer system through manholes, catch basins, and storm-damaged tide gates.
America. The innovative system has the ability to quickly break down ammonia ni-trogen at less cost and with a smaller carbon footprint than other technologies. In early 2013, DEP completed upgrades at the Hunts Point and Wards Island waste-water treatment plants that use biological nitrogen removal to convert nitrogen present in wastewater into inert gas. Along with upgrades at the Bowery Bay and Tallman Island plants, these investments will reduce the total nitrogen discharges into the Upper East River by more than 52 percent. Total nitrogen discharge into the Upper East River has decreased from 76,600 pounds per day in 1992 to 53,800 pounds per day in 2012, a decrease of 30 percent.
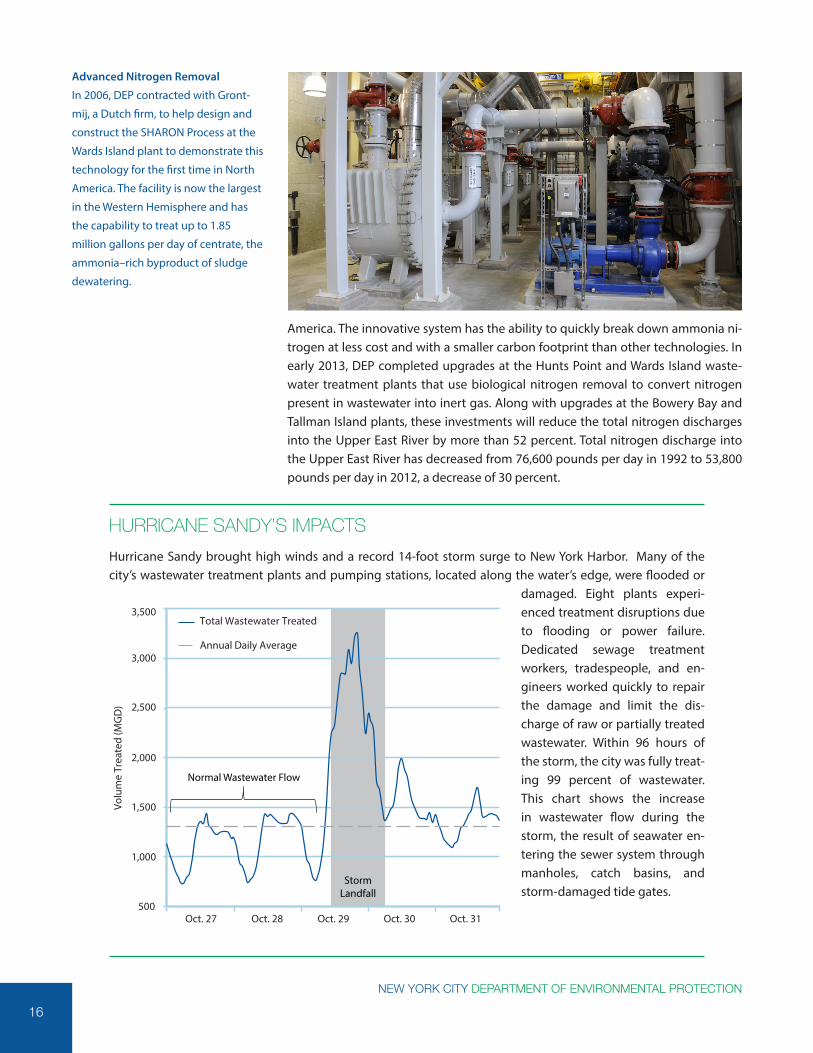
Advanced Nitrogen Removal
In 2006, DEP contracted with Gront-
mij, a Dutch firm, to help design and
construct the SHARON Process at the
Wards Island plant to demonstrate this
technology for the first time in North
America. The facility is now the largest
in the Western Hemisphere and has
the capability to treat up to 1.85
million gallons per day of centrate, the
ammonia–rich byproduct of sludge
dewatering.
HURRICANE SANDY’S IMPACTS
500
1,000
1,500
2,000
2,500
3,000
3,500
Oct. 27 Oct. 28 Oct. 29 Oct. 30 Oct. 31
Volu
me
Trea
ted
(MG
D)
Total Wastewater Treated
Annual Daily Average
Normal Wastewater Flow
StormLandfall

THE STATE OF THE HARBOR 2012
17
In 2012, DEP completed the installation of a carbon addition facility at the 26th Ward Wastewater Treatment Plant, which pumps glycerol into the aeration tanks to sepa-rate nitrogen from nitrite and nitrate molecules. Over the next decade, the City will make improvements at the Jamaica, Coney Island, and Rockaway wastewater treat-ment plants to reduce the nitrogen discharged into ecologically-sensitive Jamaica Bay by nearly 50 percent. Total nitrogen discharge into Jamaica Bay has decreased from 46,400 pounds per day in 1992 to 32,200 pounds per day in 2012, a decrease of 31 percent.
INDUSTRIAL WASTECertain chemicals in industrial wastewater can clog, corrode, or otherwise harm the wastewater system or pass through the wastewater treatment plants and ad-versely affect receiving waterbodies. DEP’s Industrial Pretreatment Program limits these discharges by regulating industrial users that discharge into the sewer sys-tem. DEP issues permits, and facilities must periodically test their wastewater to demonstrate compliance with discharge limits. Additionally, DEP conducts un-announced inspections and sampling of these facilities to ensure compliance. In 2012, DEP inspectors issued 74 Notices of Violation to industrial users for exceed-ing pollutant limits, failing to submit reports, or violating Commissioner’s Orders.
Over the past 25 years, the Industrial Pretreatment Program has successfully ad-dressed the discharge of heavy metals from industry into the sewer system. Total metals discharged have been reduced from more than 9,000 pounds per day in 1987 to fewer than 1,300 pounds today. Industrial metal discharge has decreased from 2,800 pounds per day in the late 1980s to 13 pounds per day in 2012.
In addition to the Industrial Pretreatment Program, DEP has a number of programs to fight the discharge of grease into city sewers. Restaurants, hospitals, schools, and other businesses that serve food are required to install grease traps. DEP reg-ularly inspects these traps to make sure that they are properly sized, installed, and cleaned. In 2012, our inspectors visited 3,033 establishments, and issued violations to 667 of those for failing to clean and maintain their traps. Inspectors from the Department of Health and Mental Hygiene also check for proper grease trap sizing during regular inspection of a new restaurant through the New Business Acceler-ation Program. Since 2010, DEP community outreach representatives have visited more than 700 restaurants to distribute information and answer questions about grease buildup and proper disposal.
DEP also reaches out to home cooks to teach them how to properly dispose of cooking grease. Community outreach representatives meet with property man-agers and co-op boards to relay the importance of grease management. Our community outreach staff has distributed more than 60,000 “Cease the Grease” fliers to residents across the city. We continue to seek innovative approaches to reducing grease from home cooking, and we are piloting projects in large develop-ments to collect and recycle grease before it enters the wastewater stream.
“Grease is harmful to our sewers and
wastewater treatment plants. Properly
maintaining grease traps not only
benefits the community, it benefits the
environment as well.”
Jason Tso
Associate Engineering Technician
Pollution Control and Monitoring

18NEW YORK CITY DEPARTMENT OF ENVIRONMENTAL PROTECTION
Despite significant investments in wastewater treatment that have virtually elim-inated dry weather discharges, the City continues to confront the challenge of heavy rain and snow storms that bring huge volumes of stormwater runoff from impervious surfaces. Stormwater from rainstorms and melting snow runs off roof-tops, streets, and sidewalks, which cover approximately 72 percent of New York City’s 305 square miles in land area. Because this ground is not absorptive, most of the stormwater generated in the city ultimately finds its way into the sewer system.
In parts of the city that are separately sewered there are separate pipes that carry stormwater directly to a nearby waterway and sanitary wastewater to a wastewater treatment plant. Approximately 40 percent of the sewer system is separate. Here, the main threats to water quality are street litter and the illegal disposal of waste into storm sewers.
The remaining 60 percent of the system is combined. To reduce the flow of storm-water into the combined system, and ultimately the frequency and volume of CSOs, the City developed a comprehensive strategy to maximize the benefits of traditional grey infrastructure, such as storage tunnels and tanks, with innovative source controls, called green infrastructure. This approach of balancing grey and green investments has been a hallmark of the city’s drainage strategy for years, be-ginning with the development of Bluebelts in the early 1990s and continuing with the release of the NYC Green Infrastructure Plan in September 2010. By combining the most efficient and cost-effective grey strategies and green strategies, the City will reduce CSOs by 40 percent by 2030. In addition, we will achieve quality of life improvements including better air quality, increased shading, higher property val-ues, and an improved streetscape.
COST-EFFECTIVE GREY INFRASTRUCTUREAll wastewater treatment plants are designed to treat twice the average dry weather flow because of increased flow from stormwater during wet weather. In some cases, the City has built combined sewer overflow retention facilities to in-crease the capacity of the wastewater treatment system during these periods of wet weather. CSO retention facilities temporarily store wastewater in large under-ground tunnels or tanks after the plant has reached its maximum capacity. Once
STORMWATER
During the last year, DEP has released design standards for green infrastructure, promulgated new storm-water performance standards for new developments and redevelopments, completed construction of the first neighborhood demonstration area in East New York, overseen the completion of grant projects at the Brooklyn Navy Yard and Queens College, initiated construction on area-wide contracts for the Flushing Bay and Bronx River drainage areas, and much more.
THE NYC GREEN INFRASTRUCTURE PLAN 2012 ANNUAL REPORT

THE STATE OF THE HARBOR 2012
19
the plant has additional capacity, the stored wastewater is pumped from the CSO retention facility to the plant.
DEP opened the first CSO retention facility in 1972 at Spring Creek, which has the capacity to store 20 million gallons of wastewater at a time. In 2009, DEP opened the Flushing Bay CSO Retention Facility, with a capacity of 43 million gallons of wastewater, and in 2011, opened the Alley Creek and Paerdegat Basin facilities, with a capacity of 5 and 50 million gallons, respectively.
In addition to large facilities, DEP also employs a range of strategies to limit CSO discharges. In January 2012, DEP completed the installation of two inflatable dams within existing sewers to temporarily store a mix of wastewater and stormwater that might otherwise be discharged as a CSO. The two inflatable dams are attached to the base of the sewers and have automated sensors that inflate the dam during rainstorms. Once the storm subsides, the rubber dams have the ability to deflate quickly and allow the stored flow to reach the wastewater treatment plants. Each dam can retain more than two million gallons of wastewater per storm and will decrease CSO volumes by up to 100 million gallons every year.
DEP also reduces the quantity of CSOs by removing sediment and debris from large interceptor sewers. Between 2010 and 2012, DEP surveyed all 138 miles of inter-ceptor sewers using a floating sonar device, which uses sound waves to document the level of sedimentation beneath the surface of the water. The survey found that 19 percent of the system needed cleaning - and, as a result, field crews cleaned 138,000 linear feet of pipe, or 26 miles, and removed nearly 29 million pounds of debris and sediment. The cleaned interceptor sewers now provide about 1.9 million gallons of extra capacity during wet weather, reducing the volume of combined sewer overflow by nearly 100 million gallons every year. This program marked the first systematic inspection of the city’s interceptor sewers. DEP plans to continue inspecting and cleaning interceptor sewers on a regular basis to maximize their capacity into the future.
The Paerdegat CSO Retention Facility
in Brooklyn prevents up to 50 million
gallons of combined sewer over-
flows during heavy rain from being
discharged into Paerdegat Basin, a
1.25 mile channel that is connected
to Jamaica Bay. Overall, combined
overflow discharges into the basin
have been reduced by approximately
70%—from 1.833 billion gallons to
555 million gallons per year.

20NEW YORK CITY DEPARTMENT OF ENVIRONMENTAL PROTECTION
INNOVATIVE GREEN INFRASTRUCTUREWhile grey infrastructure can retain stormwater for later treatment once it has already entered the sewer system, innovative green infrastructure strategies can di-vert stormwater from rooftops, sidewalks, and streets before it ever has a chance to enter the system. These green strategies include green roofs, blue roofs, bioswales, and permeable pavers, among others. The NYC Green Infrastructure Plan outlines these source control strategies with a critical goal of managing the first inch of rainfall from 10 percent of impervious surfaces in combined sewer areas by 2030.
In 2012, DEP published design standards for bioswales that collect stormwa-ter runoff flowing off of streets and sidewalks. DEP completed 29 bioswales and 2 stormwater greenstreets in the 26th Ward Neighborhood Demonstration Area
Greening Our Streets
Bioswales and stormwater green-
streets, such as the recently planted
one pictured here in Rego Park,
Queens, are two innovative strategies
to divert stormwater before it enters
the combined sewer system. Over
the next few years, the City will install
thousands of these to sustainably
manage stormwater and improve the
water quality of our harbor.
Water, Water, Everywhere
In 2011, New York City received a
record 65.3 inches of precipitation.
In 2012, the city only received 36.7
inches of precipitation, the lowest in
ten years. As rainfall patterns fluctu-
ate, so does the volume of stormwater
flowing into city catch basins and
sewers. DEP’s investments in cost-ef-
fective grey and green infrastructure
will help manage and capture more
of this precipitation and reduce the
volume of CSO discharge into New
York Harbor.
1952 1962 1972 1982 1992 2002 20120
10
20
30
40
50
60
70
Prec
ipita
tion
(inch
es)
Annual Precipitation
THE STATE OF THE HARBOR 2012
21
and began construction on two other Neighborhood Demonstration Areas in the Hutchinson River and Newtown Creek drainage areas. In July 2012, DEP im-plemented a new stormwater performance standard that requires all new and substantially redesigned buildings to manage stormwater runoff more effectively.
In 2011, DEP launched the Green Infrastructure Grant Program to support the de-velopment of community-based green infrastructure projects around the city. In the first two years of the program, DEP awarded $6.7 million in grants to 20 proj-ects, including a 43,000 square foot rooftop farm at the Brooklyn Navy Yard and permeable pavers and rain gardens at Queens College.
POLLUTION PREVENTIONIn 1988, DEP initiated the Shoreline Survey Program to identify and eliminate sources of raw sewage discharge into the city’s waters during dry weather. This program, in conjunction with the more recent Sentinel Monitoring Program, has substantially eliminated illegal dry weather discharges. DEP continues to work on controlling the discharges by taking enforcement action to correct illegal dumping and sewer connections.
When it rains, litter on the street washes into catch basins and storm drains, which end up in our waterways and washed up along our beaches. DEP works with other City agencies to educate the public about the impact of littering through the Keep New York City Beautiful campaign. In addition to educational outreach efforts in schools, parks, and businesses, DEP employees took to the beaches to trade beach goers’ paper and plastic grocery bags for reusable tote bags as part of “Clean Streets = Clean Beaches.” When it rains, litter in the street can be washed into the City’s catch basins. Catch basins are equipped with hoods, which are designed to trap debris before it enters the sewer system. DEP field crews regularly inspect all 148,000 catch basins every three years to make sure that they are working properly and clean out accumulated debris as needed.
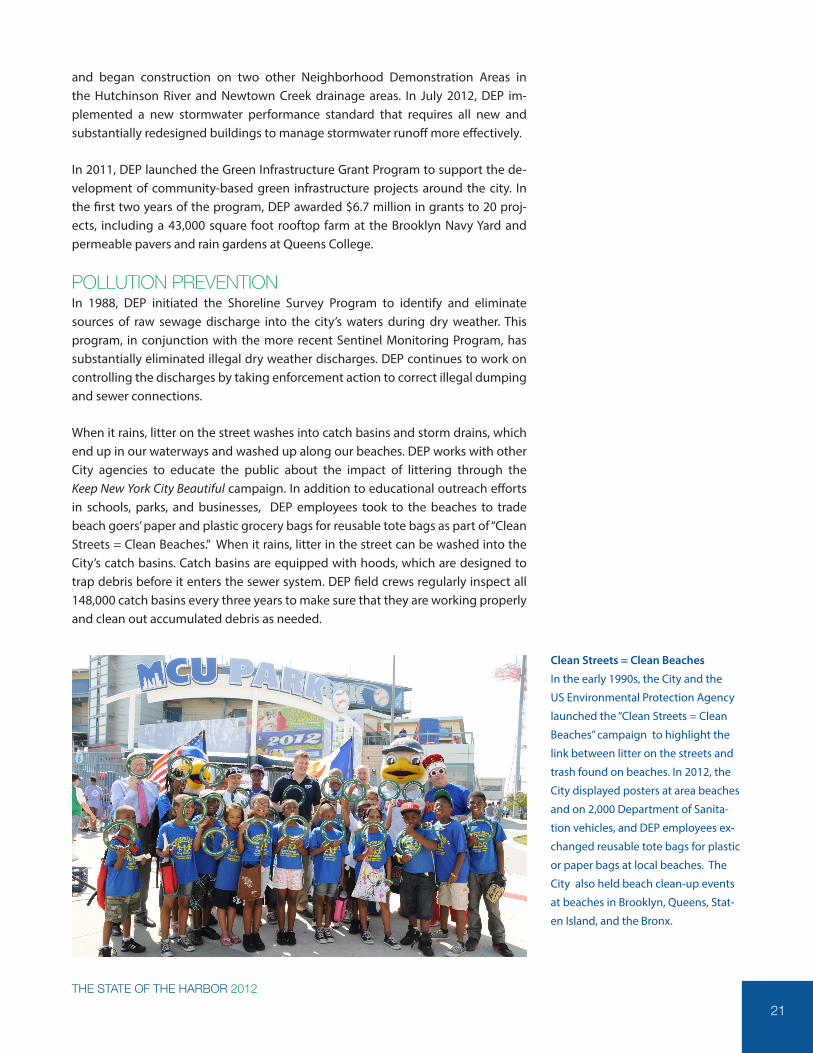
Clean Streets = Clean Beaches
In the early 1990s, the City and the
US Environmental Protection Agency
launched the “Clean Streets = Clean
Beaches” campaign to highlight the
link between litter on the streets and
trash found on beaches. In 2012, the
City displayed posters at area beaches
and on 2,000 Department of Sanita-
tion vehicles, and DEP employees ex-
changed reusable tote bags for plastic
or paper bags at local beaches. The
City also held beach clean-up events
at beaches in Brooklyn, Queens, Stat-
en Island, and the Bronx.

22NEW YORK CITY DEPARTMENT OF ENVIRONMENTAL PROTECTION
Some litter and debris does make it through the sewer system and into water-ways. To capture the floating waste, which includes metal, wood, plastic, rubber, and glass, DEP has installed floating booms at 24 major outfalls. DEP also owns a fleet of four skimmer boats to collect and dispose of the debris that accumulates in booms after a rain event. In 2012, DEP removed 1,393 cubic yards of floatable debris from the city’s waterways, a 40 percent decrease since 2007, when DEP re-moved 2,308 cubic yards of debris.
To eliminate illegal shoreline dumping (another source of floatable materials), DEP established the Shoreline Dumping Prevention Program to monitor the city’s shoreline for evidence of recent illegal disposal activities. Findings are reported to the Department of Sanitation Police for investigation and the possible apprehen-sion of illegal dumpers.
ECOLOGICAL RESTORATIONIn addition to improving water quality through investments in more advanced wastewater treatment and stormwater management, DEP has committed to pro-tecting and restoring marine ecosystems. Much of this work focuses on Jamaica Bay, a diverse ecological resource that supports multiple habitats, including open water, salt marshes, grasslands, coastal woodlands, maritime shrub lands, and brackish and freshwater wetlands. DEP protects and restores this area through a variety of programs, including those to improve harbor water quality, promote and protect wildlife, and restore eroded marshlands.
In October 2010, DEP launched an oyster bed restoration pilot in Jamaica Bay to evaluate oyster growth, survival, reproduction, water quality, and ecological ben-efits given existing environmental conditions in the Bay. Over the past two year, oyster size has continued to increase and laboratory testing of oyster tissue sam-ples indicates that the oysters are growing and healthy. In July 2011, DEP began construction on artificial structures to encourage the growth of ribbed mussels in Jamaica Bay, which can naturally remove nutrients and particulate matter from the water. The ribbed mussel biofiltration pilot has shown a successful natural coloni-
Taking out the Trash
Skimmer vessels like the Shearwater
collect floatable litter and debris that
collects behind booms at 24 major
outfalls. In 2012, these boats collected
1,393 cubic yards of floatable debris.
THE STATE OF THE HARBOR 2012
23
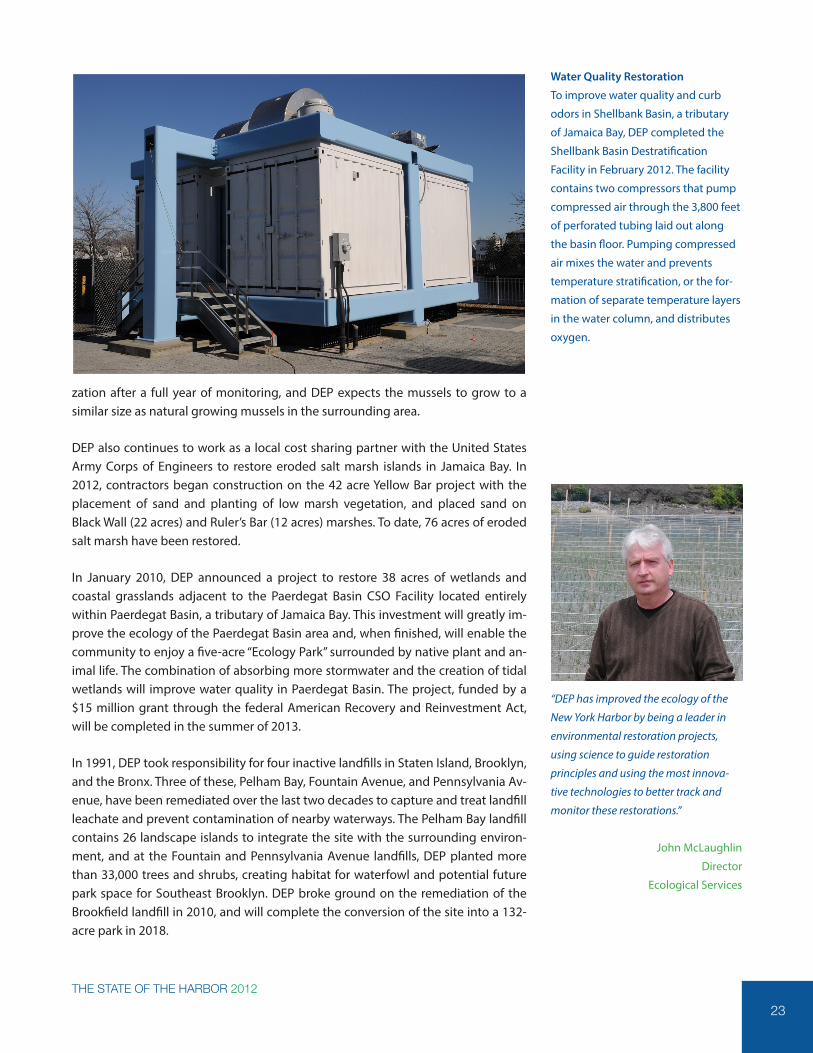
Water Quality Restoration
To improve water quality and curb
odors in Shellbank Basin, a tributary
of Jamaica Bay, DEP completed the
Shellbank Basin Destratification
Facility in February 2012. The facility
contains two compressors that pump
compressed air through the 3,800 feet
of perforated tubing laid out along
the basin floor. Pumping compressed
air mixes the water and prevents
temperature stratification, or the for-
mation of separate temperature layers
in the water column, and distributes
oxygen.
“DEP has improved the ecology of the
New York Harbor by being a leader in
environmental restoration projects,
using science to guide restoration
principles and using the most innova-
tive technologies to better track and
monitor these restorations.”
John McLaughlin
Director
Ecological Services
zation after a full year of monitoring, and DEP expects the mussels to grow to a similar size as natural growing mussels in the surrounding area.
DEP also continues to work as a local cost sharing partner with the United States Army Corps of Engineers to restore eroded salt marsh islands in Jamaica Bay. In 2012, contractors began construction on the 42 acre Yellow Bar project with the placement of sand and planting of low marsh vegetation, and placed sand on Black Wall (22 acres) and Ruler’s Bar (12 acres) marshes. To date, 76 acres of eroded salt marsh have been restored.
In January 2010, DEP announced a project to restore 38 acres of wetlands and coastal grasslands adjacent to the Paerdegat Basin CSO Facility located entirely within Paerdegat Basin, a tributary of Jamaica Bay. This investment will greatly im-prove the ecology of the Paerdegat Basin area and, when finished, will enable the community to enjoy a five-acre “Ecology Park” surrounded by native plant and an-imal life. The combination of absorbing more stormwater and the creation of tidal wetlands will improve water quality in Paerdegat Basin. The project, funded by a $15 million grant through the federal American Recovery and Reinvestment Act, will be completed in the summer of 2013.
In 1991, DEP took responsibility for four inactive landfills in Staten Island, Brooklyn, and the Bronx. Three of these, Pelham Bay, Fountain Avenue, and Pennsylvania Av-enue, have been remediated over the last two decades to capture and treat landfill leachate and prevent contamination of nearby waterways. The Pelham Bay landfill contains 26 landscape islands to integrate the site with the surrounding environ-ment, and at the Fountain and Pennsylvania Avenue landfills, DEP planted more than 33,000 trees and shrubs, creating habitat for waterfowl and potential future park space for Southeast Brooklyn. DEP broke ground on the remediation of the Brookfield landfill in 2010, and will complete the conversion of the site into a 132-acre park in 2018.
24NEW YORK CITY DEPARTMENT OF ENVIRONMENTAL PROTECTION
In 1909, New York City released the first annual Harbor Water Survey that attempt-ed to define the scope of the harbor’s degradation based on data gathered from 12 monitoring stations around Manhattan. To evaluate the harbor’s water quality, scientists tested five different parameters: dissolved oxygen, bacteria counts, tur-bidity, salinity, and temperature.
In the 1950s, the city expanded the scope of harbor water quality monitoring and consolidated testing into five state-of-the-art laboratories at wastewater treatment plants around the city. After the passage of the Clean Water Act, the city again expanded the Harbor Survey, this time to a total of 53 monitoring stations, and began collecting data on a range of new indicators, including chlorophyll ‘a’, silica, and nutrient loading.
In recent years, DEP has continued to expand the Harbor Survey. Last year, we expanded the number of harbor monitoring stations to 72 sites harbor wide, in-cluding new stations in Jamaica Bay, the Bronx River, and Coney Island Creek. As part of the development of Long-Term Control Plans to reduce CSOs, DEP will de-termine additional harbor monitoring stations to gather data on the effectiveness of various stormwater management and CSO control projects.
DEP collects harbor samples at stations throughout New York City waterways weekly from June through September, and monthly from October through May. In addition, the New York City Department of Health and Mental Hygiene (DOHMH) takes daily samples at all New York City beaches during the summer.
In 2012, DEP and the New York City Office of Emergency Management announced that NotifyNYC, New York City’s official notification system, will issue advisories when rain is expected to cause untreated wastewater discharges into New York
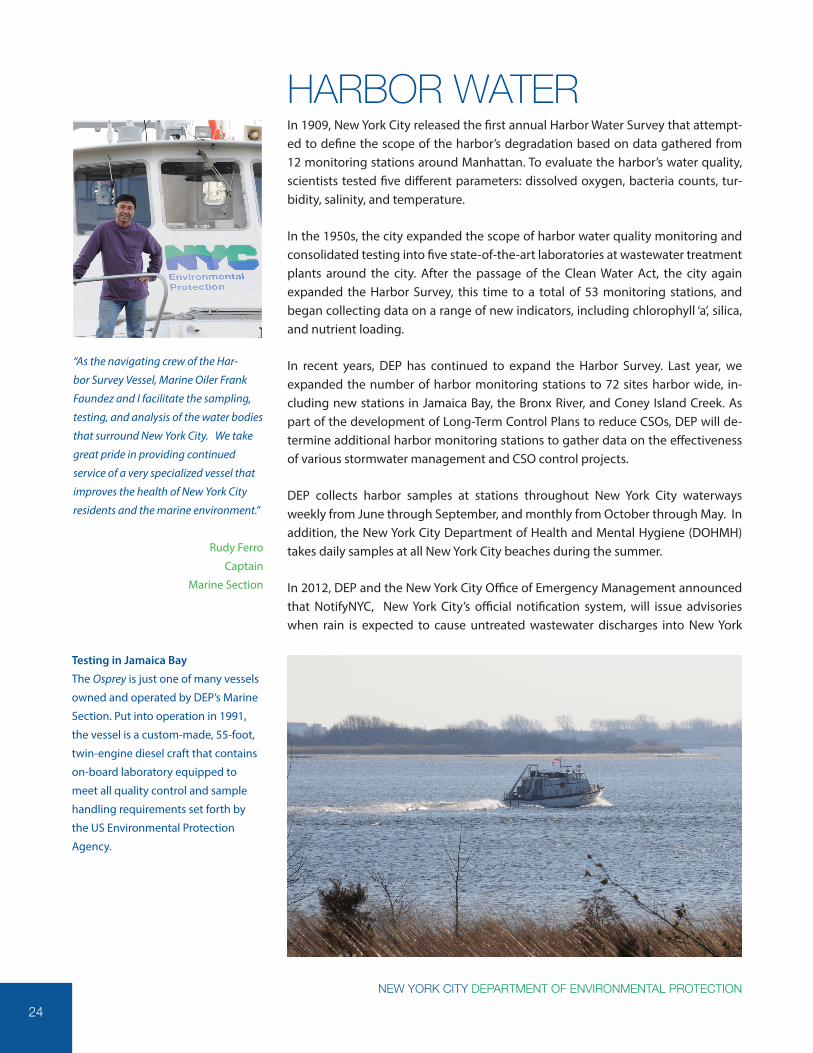
HARBOR WATER
“As the navigating crew of the Har-
bor Survey Vessel, Marine Oiler Frank
Faundez and I facilitate the sampling,
testing, and analysis of the water bodies
that surround New York City. We take
great pride in providing continued
service of a very specialized vessel that
improves the health of New York City
residents and the marine environment.”
Rudy Ferro
Captain
Marine Section
Testing in Jamaica Bay
The Osprey is just one of many vessels
owned and operated by DEP’s Marine
Section. Put into operation in 1991,
the vessel is a custom-made, 55-foot,
twin-engine diesel craft that contains
on-board laboratory equipped to
meet all quality control and sample
handling requirements set forth by
the US Environmental Protection
Agency.
THE STATE OF THE HARBOR 2012
25
City waterways. NotifyNYC alerts subscribers by text message and/or e-mail when there is the possibility of untreated wastewater discharges. These notices are tai-lored to each waterbody and give the projected time that the advisories will end based on rainfall amounts, computer models of overflows, and the volume of each waterbody so that the public knows when it is safe to resume recreational activities. The NotifyNYC advisories distribute information also featured on DEP’s Waterbody Advisory webpage, a tool that displays real-time advisories for activities such as boating for 25 waterbodies.
In addition to routine monitoring, DEP scientists take harbor water quality mea-surements on an as-needed basis. For example, in November 2012 DEP worked with DOHMH to monitor harbor water quality after Hurricane Sandy caused raw sewage discharges from city plants and neighboring communities.
Today, the Harbor Survey is carried out by DEP’s Marine Sciences Section, which is responsible for the operation of our fleet of scientific and operational vessels. Ma-rine scientists take readings from the 72 harbor monitoring stations and analyze samples at state-of-the-art laboratories both at sea and on land. The results of their analyses are posted online for the public.
To learn more about the Harbor Sur-
vey and to download the water quali-
ty data summarized in this report, visit
nyc.gov/dep.
In 2009, DEP celebrated the centennial of the Harbor Survey with New York Harbor Survey Program: Celebrating 100 Years. It outlines the New York City’s century-long commitment to improving harbor water quality and looking forward to another century of innovation and improvement.
A CENTURY OF MONITORINGNew York Harbor Survey Program
Celebrating 100 Years
1909 — 2009
New York City Department of Environmental Protection
New York Harbor Survey ProgramCelebrating 100 Years1909 — 2009
Michael R. Bloomberg, MayorCas Holloway, Commissioner
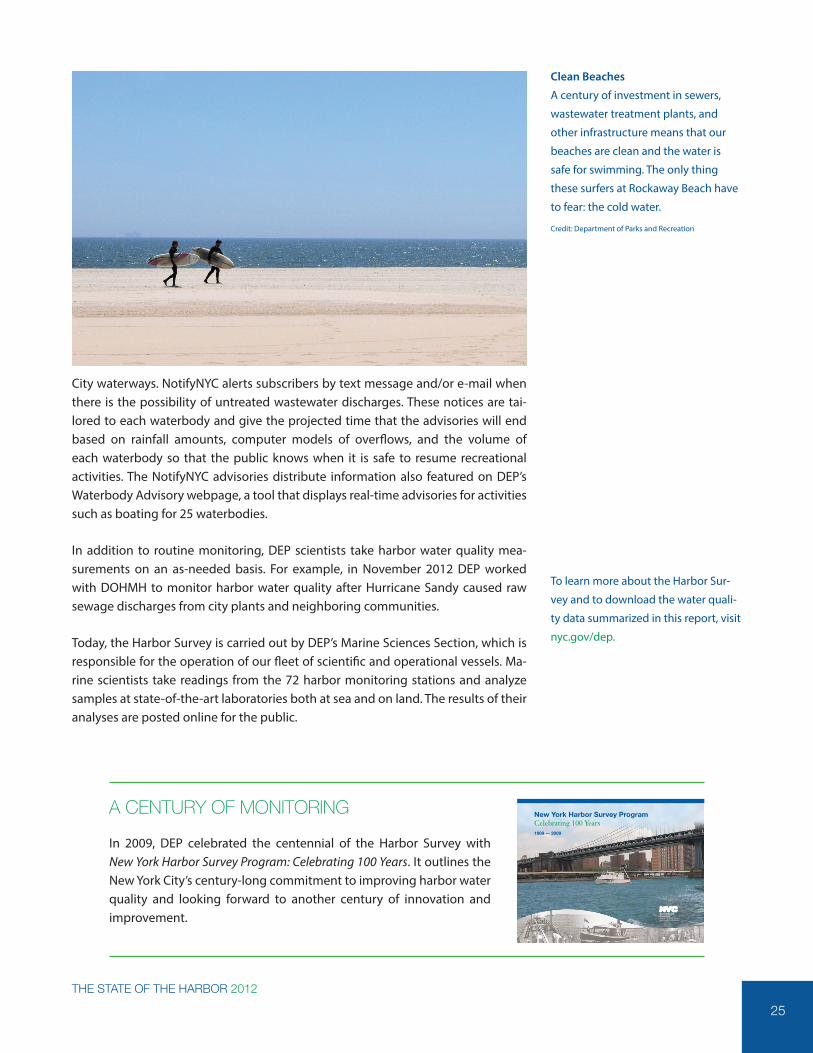
Clean Beaches
A century of investment in sewers,
wastewater treatment plants, and
other infrastructure means that our
beaches are clean and the water is
safe for swimming. The only thing
these surfers at Rockaway Beach have
to fear: the cold water.
Credit: Department of Parks and Recreation

26NEW YORK CITY DEPARTMENT OF ENVIRONMENTAL PROTECTION
DEP uses a variety of metrics to evaluate our operations across the agency, from frontline supervisors to senior management. This data-driven approach allows us to focus our resources on managing risk and meeting regulatory obligations while providing the highest level of service to our customers. In this section, we have collected eight of the indicators most representative of harbor water health, bro-ken them down by water body, and described the contributing factors and trends that link them together. These charts and maps offer a snapshot into the agency’s wastewater operations and should be considered as counterparts to Strategy 2011-2014, PlaNYC, the annual Mayor’s Management Report, and other publications. The metrics for harbor water quality are June through September averages, while those for plant performance are annual averages.
DISSOLVED OXYGEN The oxygen dissolved in the water column is critical to respiration in most aquatic life forms, including fish and invertebrates such as crabs, clams, and zooplankton. Because oxygen is essential for much ocean life, dissolved oxygen is one of the im-portant indicators of overall water quality. DEP scientists measure the amount of oxygen dissolved in water at both the surface and the bottom of the water column.
BACTERIAConcentrations of certain bacteria are measured as human health-related indica-tors of harbor water quality. DEP scientists measure concentrations of two groups of bacteria. Fecal coliform bacteria are found in human and animal intestines and are associated with wastewater. These bacteria are widely used to indicate the possible presence of pathogenic (disease-producing) bacteria. Enterococci are a subgroup within the fecal streptococcus group and are distinguished by their abil-ity to survive in salt water. The US Environmental Protection Agency recommends enterococci as the best indicator of health risk in salt water used for recreation. Bac-teria counts are calculated as summer geographic means for June to September.
The New York State Department of Environmental Conservation uses two of these metrics – dissolved oxy-gen and fecal coliform bacteria – as indicators of ecosystem health and degradation. State standards reflect a range of acceptable water quality conditions corresponding to state designated “best usage” of the water body. In addition, the Environmental Protection Agency recommends a standard for enterococci in marine recreational waters. The standards for these three indicators are listed in the table below.
WATER QUALITY STANDARDS
Best Usage Dissolved Oxygen Fecal Coliform (geometric mean)
Enterococci(geometric mean)
Bathing and other
recreational uses
Never less than 5.0 mg/L Less than 200 cells/100 mL Less than 35 cells/100 mL
Fishing or boating Never less than 4.0 mg/L Less than 2,000 cells/100 mL No standard
Fish survival Never less than 3.0 mg/L No standard No standard
PERFORMANCE METRICS

THE STATE OF THE HARBOR 2012
27
SECCHI TRANSPARENCY To estimate the clarity of surface waters, DEP scientists record the visibility of Secchi disks lowered into the water. High Secchi transparency (greater than 5.0 feet) indi-cates of clear water, and reduced transparency is typically due to high suspended solids concentrations or plankton blooms. These conditions lead to light-limiting conditions, which affect primary productivity and nutrient cycling.
TOTAL SUSPENDED SOLIDSTotal suspended solids (TSS) include all particles suspended in water that will not pass through a filter. As levels of TSS increase, a water body may lose its ability to sustain a healthy ecosystem. Suspended solids absorb sunlight, increasing water temperature and decreasing dissolved oxygen.
CHLOROPHYLL ‘A’ Chlorophyll ‘a’ is a green pigment found in most plants, algae, and phytoplank-ton. It is vital for photosynthesis, which allows plants to obtain energy from light. Chlorophyll ‘a’ can be used as an indicator of the health of an aquatic ecosystem’s primary producers, which are the base of the food chain. Overgrowth of primary producers can indicate eutrophication, a high concentration of nutrients like nitro-gen and phosphorus in a body of water. Excess nutrients can cause high growth rates of phytoplankton and algae, which can lead to negative secondary impacts like reduced light penetration, low dissolved oxygen, and the formation of hypoxic or “dead” zones. In coastal ecosystems, nitrogen is the limiting nutrient, so sources of nitrogen discharge are important to understanding eutrophication in salt water.
TOTAL NITROGENNitrogen-based molecules are important nutrients for plant growth. As described above, excess nitrogen discharge can cause eutrophication in parts of the harbor. The city’s wastewater treatment plants measure the total amount of nitrogen in plant effluent in order to monitor nutrient loading in receiving waters.
REMOVAL EFFICIENCYThe primary indicator of wastewater treatment plant performance is the removal efficiency, the percent of certain pollutants that are removed during the treatment process. All 14 wastewater treatment plants measure the removal of TSS, as de-scribed above, and carbonaceous biochemical oxygen demand (CBOD), a measure of the organic content present in a sample. Measurements for raw wastewater are compared to the plant’s effluent to determine the percent of the pollutant re-moved. State permits for most New York City plants require that they remove at least 85% of these pollutants from wastewater. Before April 2003, DEP used bio-chemical oxygen demand to measure organic content present in wastewater.
PLANT FLOWEach of the city’s 14 wastewater treatment plants have both automatic and manu-al systems for measuring the amount of wastewater that flows through the plant. Plant flow varies based on water consumption and, at plants that treat combined wastewater, rainfall.
“As part of DEP’s surveying group for
past 24 years, I have witnessed how
hard the City has worked to improve
ambient water quality and increase
recreational use for New Yorkers. I am
so proud of what I have been doing: col-
lecting water samples, analyzing data,
and presenting water quality reports.”
Naji Yao
Research Scientist
Marine Sciences Section
28NEW YORK CITY DEPARTMENT OF ENVIRONMENTAL PROTECTION
HARBORWIDEWater quality in New York Harbor continues to improve as a result of more than a century of investments in wastewa-ter infrastructure. Seven of the eight performance metrics demonstrate year-over-year improvement from 2011, and six of eight show long-term improvement over the last quarter century.
In 2012, fecal coliform and enterococci counts both de-creased year-over-year to 53.8 and 4.4 cells per 100 mL, respectively. Both metrics are well below the bathing stan-dard, and the return to previous levels indicates that the spike in 2011 was largely influenced by that year’s record rainfall and storm intensity. Average dissolved oxygen lev-els across the harbor continued to decline from their peak in 2008, but both surface and bottom values exceeded the 5.0 mg/L standard for bathing.
Secchi transparency readings showed improvement for the first time in five years, with an average value of 3.9 feet harborwide. Total suspended solids concentrations decreased at both the water’s surface and bottom, with average values of 7.9 and 11.6 mg/L, respectively. Those values were the lowest for any year except 2009 and 2010.
Total nitrogen discharged in wastewater effluent de-creased to 168,900 pounds per day, a decrease of 8 percent. Correspondingly, chlorophyll ‘a’ concentrations decreased to 7.7 µg/L, the lowest average value since the Ocean Dumping Ban took effect in the early 1990s. That law pushed wastewater utilities nationwide to dispose of sludge through land application and introduced nu-trient-rich centrate from the dewatering process into the wastewater stream.
As a result of continued investment at wastewater treat-ment plants, removal efficiency increased to the highest value on record. Citywide, plants removed 94 percent of CBOD and 92 percent of total suspended solids from wastewater, far exceeding the requirements of the Clean Water Act and State discharge permits. Total plant flow de-creased to 1,235 million gallons per day, the lowest value in decades and an indicator of the success of water conser-vation programs.

THE STATE OF THE HARBOR 2012
29
1987 1992 1997 2002 2007 20120
250
500
750
1,000
1,250
1,500
1,750
2,000
MG
D
1987 1992 1997 2002 2007 2012
TSS RemovalCBOD Removal
70%
75%
80%
85%
90%
95%
100%
% re
mov
ed
1987 1992 1997 2002 2007 20120
50
100
150
200
250
lbs/
day
(tho
usan
ds)
1987 1992 1997 2002 2007 20120
10
20
30
40
50
60
µg/L
1987 1992 1997 2002 2007 2012
Surface TSSBottom TSS
0
10
20
30
40
50
60
mg/
L
1987 1992 1997 2002 2007 20120
1
2
3
4
5
6
7
8
9
feet
1987 1992 1997 2002 2007 2012
Fecal Coliform
Enterococci
Fecal Coliform Fishing Standard
Enterococci Bathing Standard
1
10
100
1,000
10,000
cells
/100
mL
Fecal Coliform Bathing Standard
1987 1992 1997 2002 2007 201201
2
3
4
5
6
7
8
9m
g/L
Bathing Standard
Fishing Standard
Surface Dissolved Oxygen
Bottom Dissolved Oxygen
Chlorophyll ‘A’
Removal Efficiency
Secchi Transparency
Dissolved Oxygen Bacteria
Plant Flow
Total Nitrogen
Total Suspended Solids
30NEW YORK CITY DEPARTMENT OF ENVIRONMENTAL PROTECTION
THE INNER HARBOR
N7
N6
N5
N4
N1
K5
K4
K3
K2
K1 G2
E2NC3
NC2NC1
NC0
N3B
GC6GC5GC4GC3
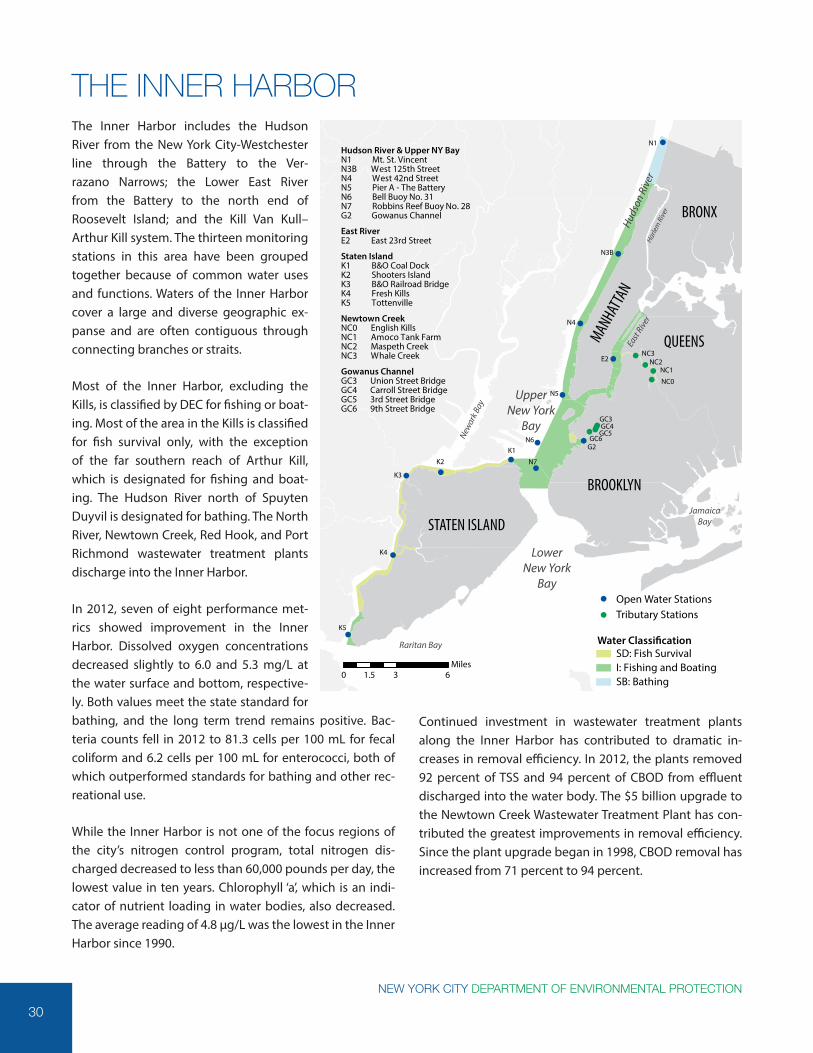
Hudson River & Upper NY BayN1 Mt. St. VincentN3B West 125th StreetN4 West 42nd StreetN5 Pier A - The BatteryN6 Bell Buoy No. 31N7 Robbins Reef Buoy No. 28G2 Gowanus Channel
East RiverE2 East 23rd Street
Staten IslandK1 B&O Coal DockK2 Shooters IslandK3 B&O Railroad BridgeK4 Fresh KillsK5 Tottenville
Newtown CreekNC0 English KillsNC1 Amoco Tank FarmNC2 Maspeth CreekNC3 Whale Creek
Gowanus ChannelGC3 Union Street BridgeGC4 Carroll Street BridgeGC5 3rd Street BridgeGC6 9th Street Bridge
LowerNew York
Bay
QUEENS
BROOKLYN
STATEN ISLAND
BRONX
MANHA
TTAN
Huds
on R
iver
UpperNew York
Bay
Raritan Bay
JamaicaBay
Harle
m R
iver
East
River
Newar
k Bay
0 3 61.5Miles
Water Classi�cation
I: Fishing and BoatingSB: Bathing
SD: Fish Survival
Open Water StationsTributary Stations
The Inner Harbor includes the Hudson River from the New York City-Westchester line through the Battery to the Ver-razano Narrows; the Lower East River from the Battery to the north end of Roosevelt Island; and the Kill Van Kull– Arthur Kill system. The thirteen monitoring stations in this area have been grouped together because of common water uses and functions. Waters of the Inner Harbor cover a large and diverse geographic ex-panse and are often contiguous through connecting branches or straits.
Most of the Inner Harbor, excluding the Kills, is classified by DEC for fishing or boat-ing. Most of the area in the Kills is classified for fish survival only, with the exception of the far southern reach of Arthur Kill, which is designated for fishing and boat-ing. The Hudson River north of Spuyten Duyvil is designated for bathing. The North River, Newtown Creek, Red Hook, and Port Richmond wastewater treatment plants discharge into the Inner Harbor.
In 2012, seven of eight performance met-rics showed improvement in the Inner Harbor. Dissolved oxygen concentrations decreased slightly to 6.0 and 5.3 mg/L at the water surface and bottom, respective-ly. Both values meet the state standard for bathing, and the long term trend remains positive. Bac-teria counts fell in 2012 to 81.3 cells per 100 mL for fecal coliform and 6.2 cells per 100 mL for enterococci, both of which outperformed standards for bathing and other rec-reational use.
While the Inner Harbor is not one of the focus regions of the city’s nitrogen control program, total nitrogen dis-charged decreased to less than 60,000 pounds per day, the lowest value in ten years. Chlorophyll ‘a’, which is an indi-cator of nutrient loading in water bodies, also decreased. The average reading of 4.8 µg/L was the lowest in the Inner Harbor since 1990.
Continued investment in wastewater treatment plants along the Inner Harbor has contributed to dramatic in-creases in removal efficiency. In 2012, the plants removed 92 percent of TSS and 94 percent of CBOD from effluent discharged into the water body. The $5 billion upgrade to the Newtown Creek Wastewater Treatment Plant has con-tributed the greatest improvements in removal efficiency. Since the plant upgrade began in 1998, CBOD removal has increased from 71 percent to 94 percent.

THE STATE OF THE HARBOR 2012
31
1987 1992 1997 2002 2007 2012
TSS RemovalCBOD Removal
70%
75%
80%
85%
90%
95%
100%
% re
mov
ed
1987 1992 1997 2002 2007 20120
100
200
300
400
500
600
700
800
M
GD
1987 1992 1997 2002 2007 20120
20
40
60
80
100
lbs/
day
(tho
usan
ds)
1987 1992 1997 2002 2007 20120
10
20
30
40
50
60
µg/L
1987 1992 1997 2002 2007 2012
Surface TSSBottom TSS
0
10
20
30
40
50
60
mg/
L
1987 1992 1997 2002 2007 20120
1
2
3
4
5
6
7
8
9
feet
1987 1992 1997 2002 2007 2012
Fecal Coliform
Enterococci
Fecal Coliform Fishing Standard
Enterococci Bathing Standard
1
10
100
1,000
10,000
cells
/100
mL
Fecal Coliform Bathing Standard
1987 1992 1997 2002 2007 201201
2
3
4
5
6
7
8
9m
g/L
Bathing Standard
Fishing Standard
Surface Dissolved Oxygen
Bottom Dissolved Oxygen
Chlorophyll ‘A’
Removal Efficiency
Secchi Transparency
Dissolved Oxygen Bacteria
Plant Flow
Total Nitrogen
Total Suspended Solids

32NEW YORK CITY DEPARTMENT OF ENVIRONMENTAL PROTECTION
LOWER NEW YORK BAY - RARITAN BAYLower New York Bay and Raritan Bay are the most oceanic parts of New York Harbor. Lower New York Bay begins at the Narrows and is bounded by the southern shore of Staten Island, Coney Island, and the Rockaway Inlet. Raritan Bay lies to the west, bounded by Staten Island and New Jersey’s Monmouth and Middlesex counties. Most of this region is designated for bathing, except for the area directly surrounding the Narrows and the western tip of Raritan Bay.
This area of 100 square miles is rep-resented by five Harbor Survey monitoring stations and has mostly open shallow waters. Two wastewater treatment plants, Oakwood Beach and Owls Head, directly discharge into Lower New York Bay and Raritan Bay, but the region’s interconnection with other parts of the harbor and to the open water of the Atlantic Ocean also influence its water quality.
In 2012, five of eight performance met-rics in Lower New York Bay indicated improvement. Dissolved oxygen con-centrations continued to fall from the 2008 peak, but levels still met state standards for bathing and other recre-ation. Dissolved oxygen concentration in Lower New York Bay remained second highest among regions of the harbor, behind that in Jamaica Bay. Fecal coliform and enterococci counts both improved year-over year, to 15.1 and 2.0 cells per 100 mL, respectively, well below the bathing standards of 200 and 35 cells per 100 mL.
Lower New York Bay continues to outperform the other three regions in water clarity. In 2012, Secchi transparen-cy improved by 12 percent year-over-year to 5.7 feet. Total suspended solids decreased to 5.8 and 7.2 mg/L at the sur-face and bottom of the water column, respectively.
Chlorophyll ‘a’ levels in Lower New York Bay are influenced by the prevalence of phytoplankton blooms in Raritan Bay, which receives waters from Arthur Kill and the heav-ily industrialized Raritan River. As a whole, though, Lower New York Bay showed a decrease in chlorophyll ‘a’ con-centrations to 7.6 µg/L, the lowest value since 1990. Total nitrogen discharge from the two wastewater treatment plants that discharge into Lower New York Bay remains low compared to other regions of the harbor. The plants discharged an average of 23,300 pounds per day in 2012.
N9
N8
K6
N16
K5A
GB1
CIC3
CIC2
Lower New York BayK5A Raritan RiverK6 Orchard LightN8 Verrazano NarrowsN9 Steeplechase PierN16 Rockaway Point
Coney Island CreekCIC2 Coney Is CreekCIC3 Coney Is Creek MouthGB1 Gravesend Bay
LowerNew York
Bay
NEW JERSEY
BROOKLYN
STATEN ISLAND
MANHA
TTAN
ATLANTIC OCEAN
UpperNew York
Bay
Raritan Bay
Arthur K
ill
Kill Van Kull
Newar
k Bay
Hud
son
Rive
r
Water Classi�cationI: Fishing and BoatingSB: BathingSA: Shell�shing and Bathing
Open Water StationsTributary Stations
1Miles
20 4 6

THE STATE OF THE HARBOR 2012
33
1987 1992 1997 2002 2007 2012
TSS RemovalCBOD Removal
70%
75%
80%
85%
90%
95%
100%
% re
mov
ed
1987 1992 1997 2002 2007 20120
100
200
300
400
500
600
700
800
M
GD
1987 1992 1997 2002 2007 20120
20
40
60
80
100
lbs/
day
(tho
usan
ds)
1987 1992 1997 2002 2007 20120
10
20
30
40
50
60
µg/L
1987 1992 1997 2002 2007 2012
Surface TSSBottom TSS
0
10
20
30
40
50
60
mg/
L
1987 1992 1997 2002 2007 20120
1
2
3
4
5
6
7
8
9
feet
1987 1992 1997 2002 2007 2012
Fecal Coliform
Enterococci
Fecal Coliform Fishing Standard
Enterococci Bathing Standard
1
10
100
1,000
10,000
cells
/100
mL
Fecal Coliform Bathing Standard
1987 1992 1997 2002 2007 201201
2
3
4
5
6
7
8
9m
g/L
Bathing Standard
Fishing Standard
Surface Dissolved Oxygen
Bottom Dissolved Oxygen
Chlorophyll ‘A’
Removal Efficiency
Secchi Transparency
Dissolved Oxygen Bacteria
Plant Flow
Total Nitrogen
Total Suspended Solids
34NEW YORK CITY DEPARTMENT OF ENVIRONMENTAL PROTECTION
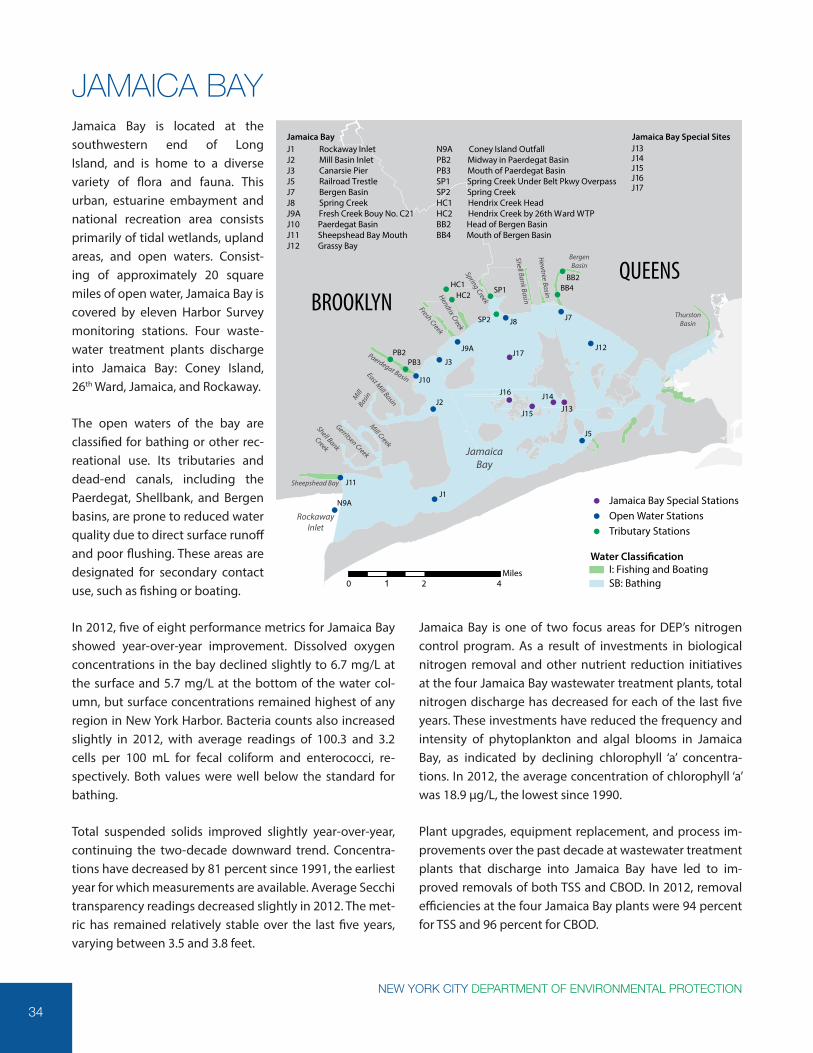
JAMAICA BAYJamaica Bay is located at the southwestern end of Long Island, and is home to a diverse variety of flora and fauna. This urban, estuarine embayment and national recreation area consists primarily of tidal wetlands, upland areas, and open waters. Consist-ing of approximately 20 square miles of open water, Jamaica Bay is covered by eleven Harbor Survey monitoring stations. Four waste-water treatment plants discharge into Jamaica Bay: Coney Island, 26th Ward, Jamaica, and Rockaway.
The open waters of the bay are classified for bathing or other rec-reational use. Its tributaries and dead-end canals, including the Paerdegat, Shellbank, and Bergen basins, are prone to reduced water quality due to direct surface runoff and poor flushing. These areas are designated for secondary contact use, such as fishing or boating.
In 2012, five of eight performance metrics for Jamaica Bay showed year-over-year improvement. Dissolved oxygen concentrations in the bay declined slightly to 6.7 mg/L at the surface and 5.7 mg/L at the bottom of the water col-umn, but surface concentrations remained highest of any region in New York Harbor. Bacteria counts also increased slightly in 2012, with average readings of 100.3 and 3.2 cells per 100 mL for fecal coliform and enterococci, re-spectively. Both values were well below the standard for bathing.
Total suspended solids improved slightly year-over-year, continuing the two-decade downward trend. Concentra-tions have decreased by 81 percent since 1991, the earliest year for which measurements are available. Average Secchi transparency readings decreased slightly in 2012. The met-ric has remained relatively stable over the last five years, varying between 3.5 and 3.8 feet.
Jamaica Bay is one of two focus areas for DEP’s nitrogen control program. As a result of investments in biological nitrogen removal and other nutrient reduction initiatives at the four Jamaica Bay wastewater treatment plants, total nitrogen discharge has decreased for each of the last five years. These investments have reduced the frequency and intensity of phytoplankton and algal blooms in Jamaica Bay, as indicated by declining chlorophyll ‘a’ concentra-tions. In 2012, the average concentration of chlorophyll ‘a’ was 18.9 µg/L, the lowest since 1990.
Plant upgrades, equipment replacement, and process im-provements over the past decade at wastewater treatment plants that discharge into Jamaica Bay have led to im-proved removals of both TSS and CBOD. In 2012, removal efficiencies at the four Jamaica Bay plants were 94 percent for TSS and 96 percent for CBOD.
Jamaica Bay Jamaica Bay Special Sites31J41J51J61J71J
N9A Coney Island OutfallPB2 Midway in Paerdegat BasinPB3 Mouth of Paerdegat BasinSP1 Spring Creek Under Belt Pkwy OverpassSP2 Spring CreekHC1 Hendrix Creek HeadHC2 Hendrix Creek by 26th Ward WTP
BB4 Mouth of Bergen BasinBB2 Head of Bergen Basin
J1 Rockaway InletJ2 Mill Basin InletJ3 Canarsie PierJ5 Railroad TrestleJ7 Bergen Basin
J12 Grassy BayJ11 Sheepshead Bay MouthJ10 Paerdegat BasinJ9A Fresh Creek Bouy No. C21J8 Spring Creek
SP2 J8 J7
J3
J2
J1
SP1
PB3PB2 J9A J12
J11
HC2HC1
J5
N9A
J10
J17
J16
J15
J14
J13
BB2BB4
JamaicaBay
Paerdegat Basin
Mill Creek
ThurstonBasin
Fresh CreekHendrix Creek
Spring Creek
Shell Bank Basin
Hew
tree Basin
East Mill BasinMill
Basin
Gerritsen Creek
Shell Bank
CreekSheepshead Bay
RockawayInlet
QUEENSBROOKLYN
BergenBasin
0 2 41Miles
Water Classi�cation
Open Water StationsTributary Stations
I: Fishing and BoatingSB: Bathing
Jamaica Bay Special Stations

THE STATE OF THE HARBOR 2012
35
1987 1992 1997 2002 2007 20120
100
200
300
400
500
600
700
800
M
GD
1987 1992 1997 2002 2007 2012
TSS RemovalCBOD Removal
70%
75%
80%
85%
90%
95%
100%
% re
mov
ed
1987 1992 1997 2002 2007 20120
20
40
60
80
100
lbs/
day
(tho
usan
ds)
1987 1992 1997 2002 2007 2012
Surface TSSBottom TSS
0
10
20
30
40
50
60
mg/
L
1987 1992 1997 2002 2007 20120
1
2
3
4
5
6
7
8
9
feet
1987 1992 1997 2002 2007 2012
Fecal Coliform
Enterococci
Fecal Coliform Fishing Standard
Enterococci Bathing Standard
1
10
100
1,000
10,000
cells
/100
mL
Fecal Coliform Bathing Standard
1987 1992 1997 2002 2007 201201
2
3
4
5
6
7
8
9m
g/L
Bathing Standard
Fishing Standard
Surface Dissolved Oxygen
Bottom Dissolved Oxygen
1987 1992 1997 2002 2007 20120
10
20
30
40
50
60
µg/L
Chlorophyll ‘A’
Removal Efficiency
Secchi Transparency
Dissolved Oxygen Bacteria
Plant Flow
Total Nitrogen
Total Suspended Solids
36NEW YORK CITY DEPARTMENT OF ENVIRONMENTAL PROTECTION
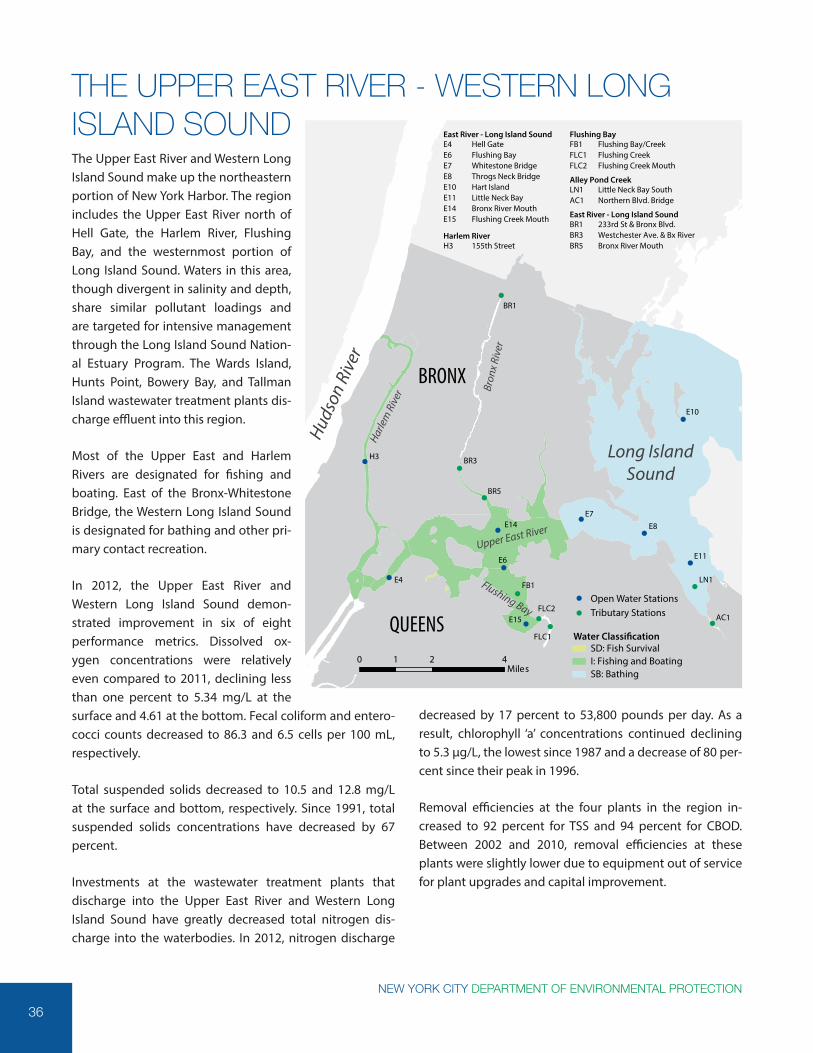
The Upper East River and Western Long Island Sound make up the northeastern portion of New York Harbor. The region includes the Upper East River north of Hell Gate, the Harlem River, Flushing Bay, and the westernmost portion of Long Island Sound. Waters in this area, though divergent in salinity and depth, share similar pollutant loadings and are targeted for intensive management through the Long Island Sound Nation-al Estuary Program. The Wards Island, Hunts Point, Bowery Bay, and Tallman Island wastewater treatment plants dis-charge effluent into this region.
Most of the Upper East and Harlem Rivers are designated for fishing and boating. East of the Bronx-Whitestone Bridge, the Western Long Island Sound is designated for bathing and other pri-mary contact recreation.
In 2012, the Upper East River and Western Long Island Sound demon-strated improvement in six of eight performance metrics. Dissolved ox-ygen concentrations were relatively even compared to 2011, declining less than one percent to 5.34 mg/L at the surface and 4.61 at the bottom. Fecal coliform and entero-cocci counts decreased to 86.3 and 6.5 cells per 100 mL, respectively.
Total suspended solids decreased to 10.5 and 12.8 mg/L at the surface and bottom, respectively. Since 1991, total suspended solids concentrations have decreased by 67 percent.
Investments at the wastewater treatment plants that discharge into the Upper East River and Western Long Island Sound have greatly decreased total nitrogen dis-charge into the waterbodies. In 2012, nitrogen discharge
decreased by 17 percent to 53,800 pounds per day. As a result, chlorophyll ‘a’ concentrations continued declining to 5.3 µg/L, the lowest since 1987 and a decrease of 80 per-cent since their peak in 1996.
Removal efficiencies at the four plants in the region in-creased to 92 percent for TSS and 94 percent for CBOD. Between 2002 and 2010, removal efficiencies at these plants were slightly lower due to equipment out of service for plant upgrades and capital improvement.
0 2 41Miles
Water Classi�cation
I: Fishing and BoatingSB: Bathing
SD: Fish Survival
Open Water StationsTributary Stations
BR1
BR3
BR5
E6
E14
E4
H3
E15
FB1
FLC2
FLC1
E8E7
E10
E11
AC1
LN1
East River - Long Island SoundE4 Hell Gate
E14 Bronx River MouthE11 Little Neck BayE10 Hart IslandE8 Throgs Neck BridgeE7 Whitestone BridgeE6 Flushing Bay
E15 Flushing Creek Mouth
Harlem RiverH3 155th Street
Flushing BayFB1 Flushing Bay/Creek
FLC2 Flushing Creek MouthFLC1 Flushing Creek
Alley Pond CreekLN1 Little Neck Bay SouthAC1 Northern Blvd. Bridge
East River - Long Island SoundBR1 233rd St & Bronx Blvd.
BR5 Bronx River MouthBR3 Westchester Ave. & Bx River
BRONX
Huds
on R
iver
Long IslandSound
Harle
m R
iver
Upper East River
Bron
x Ri
ver
Flushing Bay
QUEENS
THE UPPER EAST RIVER - WESTERN LONG ISLAND SOUND

THE STATE OF THE HARBOR 2012
37
1987 1992 1997 2002 2007 2012
TSS RemovalCBOD Removal
70%
75%
80%
85%
90%
95%
100%
% re
mov
ed
1987 1992 1997 2002 2007 20120
100
200
300
400
500
600
700
800
M
GD
1987 1992 1997 2002 2007 20120
20
40
60
80
100
lbs/
day
(tho
usan
ds)
1987 1992 1997 2002 2007 2012
Surface TSSBottom TSS
0
10
20
30
40
50
60
mg/
L
1987 1992 1997 2002 2007 20120
10
20
30
40
50
60
µg/L
1987 1992 1997 2002 2007 20120
1
2
3
4
5
6
7
8
9
feet
1987 1992 1997 2002 2007 2012
Fecal Coliform
Enterococci
Fecal Coliform Fishing Standard
Enterococci Bathing Standard
1
10
100
1,000
10,000
cells
/100
mL
Fecal Coliform Bathing Standard
1987 1992 1997 2002 2007 201201
2
3
4
5
6
7
8
9m
g/L
Bathing Standard
Fishing Standard
Surface Dissolved Oxygen
Bottom Dissolved Oxygen
Chlorophyll ‘A’
Removal Efficiency
Secchi Transparency
Dissolved Oxygen Bacteria
Plant Flow
Total Nitrogen
Total Suspended Solids

38NEW YORK CITY DEPARTMENT OF ENVIRONMENTAL PROTECTION
CONCLUSIONAs a result of the City’s extensive investments in the wastewater system, New York Harbor is now cleaner than it has been in more than 100 years of testing. This com-mitment to our harbor has resulted in rich, vibrant ecological habitats and a range of recreational opportunities for the residents of New York.
But we are not done yet. DEP takes a risk-management approach to planning for future upgrades and improvements, leveraging our computerized maintenance management system and asset management program to maintain a state of good repair. Over the next ten years, the City will invest more than $4 billion to further upgrade our wastewater treatment plants, including projects at the Bowery Bay, 26th Ward, Hunts Point, and Wards Island wastewater treatment plants.
The City will also invest $1.2 billion in cost-effective grey infrastructure and green infrastructure through 2023 to reduce the volume of combined sewer overflows. Over the next five years, the City will develop and release waterbody specific long term control plans to reduce combined sewer overflows. These plans will incor-porate feedback from community members and other stakeholders to develop watershed-based solutions. The first of these plans, for the Alley Creek watershed, will be released in June 2013. In total, the City will invest $5.2 billion over the next decade to improve water quality in New York Harbor.
In the next decade, DEP will take steps toward a more sustainable and more resil-ient wastewater operation. By cutting our energy consumption agency-wide and developing an independent clean energy supply, we will reduce our greenhouse gas emissions by 30 percent from the 2006 baseline and be better positioned to adapt to changing markets for electricity and natural gas. These projects include a 1.1 megawat (MW) solar panel installation at the Port Richmond Wastewater Treatment Plant and a 15 MW cogeneration system at the North River plant. In ad-dition, DEP has taken the lead in planning for climate change. In 2008, we released the Climate Change Assessment and Action Plan, a detailed analysis of potential impacts and adaptations to meet the challenges of climate change over the next century. In 2012, we began conducting detailed risk assessments of our wastewa-ter infrastructure in the city. Now, in the wake of Hurricanes Irene and Sandy, we have redoubled our efforts to assess vulnerabilities and prepare for future extreme storms.
With these investments and the continued dedication of our sewage treatment workers, engineers, tradespeople, scientists, and other employees, DEP will contin-ue to improve the state of New York Harbor.
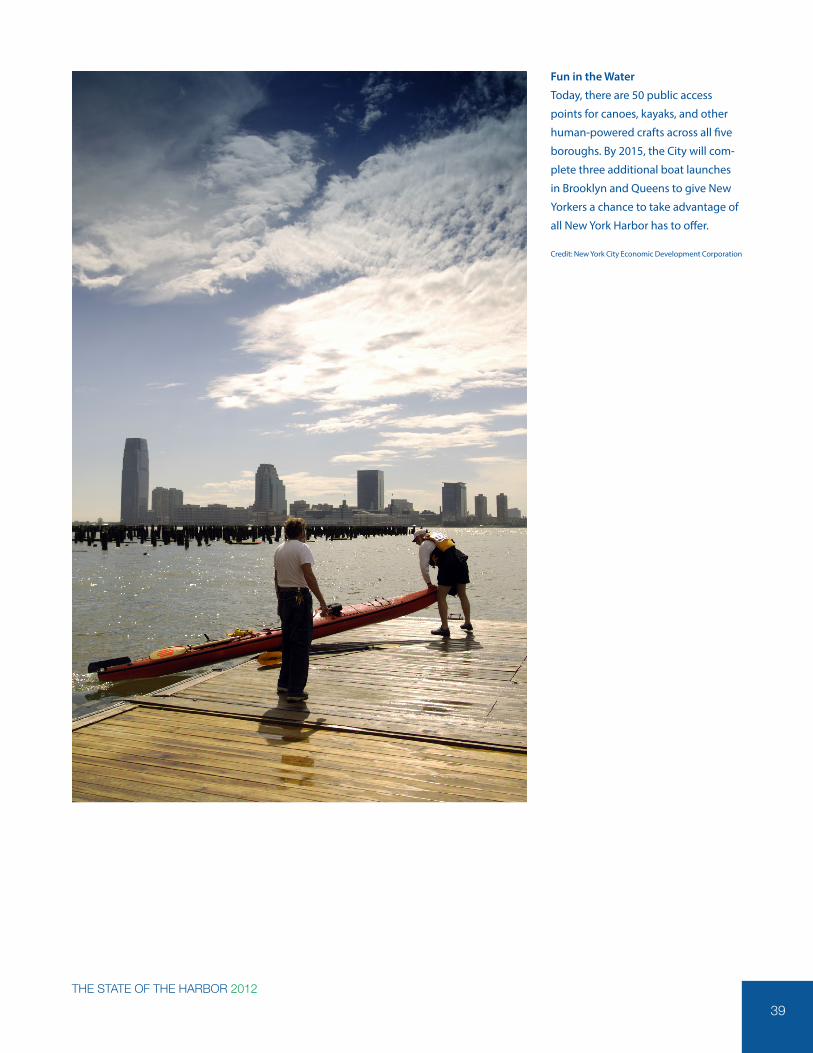
THE STATE OF THE HARBOR 2012
39
Fun in the Water
Today, there are 50 public access
points for canoes, kayaks, and other
human-powered crafts across all five
boroughs. By 2015, the City will com-
plete three additional boat launches
in Brooklyn and Queens to give New
Yorkers a chance to take advantage of
all New York Harbor has to offer.
Credit: New York City Economic Development Corporation
