tr2009/020 - meola reef ecological monitoring 2001- · pdf filemeola reef ecological...
TRANSCRIPT

Meola Reef Ecological Monitoring: 2001 - 2008 March TR 2009/020
Auckland Regional Council Technical Report No.020 March 2009 ISSN 1179-0504 (Print) ISSN 1179-0512 (Online) ISBN 978-1-877528-27-9

Reviewed by: Approved for ARC Publication by:
Name: Dr Jarrod Walker Name: Grant Barnes
Position: Project Leader - Marine Position: Group Manager – Monitoring and Research
Organisation: ARC Organisation: ARC
Date: 20-03-2009 Date: 20-03-2009
Recommended Citation: Ford, R.; Pawley, M.D.M. (2008) Meola Reef Ecological Monitoring: 2001 to 2008. Prepared by Auckland UniServices for Auckland Regional Council. Auckland Regional Council Technical Report 2009/020.
© 2008 Auckland Regional Council
This publication is provided strictly subject to Auckland Regional Council's (ARC) copyright and other intellectual property rights (if any) in the publication. Users of the publication may only access, reproduce and use the publication, in a secure digital medium or hard copy, for responsible genuine non-commercial purposes relating to personal, public service or educational purposes, provided that the publication is only ever accurately reproduced and proper attribution of its source, publication date and authorship is attached to any use or reproduction. This publication must not be used in any way for any commercial purpose without the prior written consent of ARC. ARC does not give any warranty whatsoever, including without limitation, as to the availability, accuracy, completeness, currency or reliability of the information or data (including third party data) made available via the publication and expressly disclaim (to the maximum extent permitted in law) all liability for any damage or loss resulting from your use of, or reliance on the publication or the information and data provided via the publication. The publication and information and data contained within it are provided on an "as is" basis.

Meola Reef Ecological Monitoring: 2001 - 2008
Richard Ford Matt. D. M. Pawley Prepared for
Auckland Regional Council
Environmental Research
By
Auckland UniServices Ltd Leigh Marine Laboratory and Department of Statistics University of Auckland Private Bag 92019 Auckland, New Zealand
Reports from Auckland UniServices Limited should only be used for the purposes for which they were commissioned. If it is proposed to use a report prepared by Auckland UniServices for a different purpose or in a different context from that intended at the time of commissioning the work, then UniServices should be consulted to verify whether the report is being correctly interpreted. In particular, it is requested that, where quoted, conclusions given in UniServices reports should be quoted in full.


Contents
1111 Executive SummaryExecutive SummaryExecutive SummaryExecutive Summary 4444
2222 IntroductionIntroductionIntroductionIntroduction 6666
2.1 Threats to harbour/estuarine health 6
2.1.1 Sedimentation 6
2.1.2 Toxic urban discharges 7
2.1.3 Invasions 8
2.2 Research investigations 8
3333 MethodsMethodsMethodsMethods 9999
3.1 Site locations 9
3.2 Intertidal surveys 10
3.2.1 Faunal data 10
3.2.2 Environmental data 11
3.3 Subtidal surveys 12
3.3.1 Faunal data 13
3.3.2 Environmental data 13
3.4 Statistical Methods 14
3.4.1 Site characterization 14
3.4.2 Assessment of changes over time 15
3.4.3 Correlation of change with environmental variables 19
4444 Intertidal ResultsIntertidal ResultsIntertidal ResultsIntertidal Results 21212121
4.1 Characterization of the Meola Reef intertidal sites 21
4.1.1 Specific characteristics of each intertidal site 24
4.2 Examination of changes over time 24
4.2.1 Change in community composition 24
4.2.2 Changes in size frequency distributions 27
4.2.3 Tracking univariate variables through time 27
4.3 Relationship between temporal change and environmental factors 39

4.3.1 Multivariate analyses 39
4.3.2 Univariate analyses 41
5555 Subtidal ResultsSubtidal ResultsSubtidal ResultsSubtidal Results 45454545
5.1 Characterisation of the subtidal Meola Reef sites 45
5.2 Examination of changes over time 48
5.2.1 Change in community composition 48
5.2.2 Changes in size frequency distributions 49
5.2.3 Tracking univariate variables through time 50
5.3 Relationship between temporal change and environmental factors 60
5.3.1 Multivariate analyses 60
5.3.2 Univariate analyses 61
6666 DiscussionDiscussionDiscussionDiscussion 64646464
6.1 Characterisation of sites at Meola Reef 64
6.1.1 Intertidal sites 64
6.1.2 Subtidal sites 65
6.2 Assessment of change over time 65
6.2.1 Intertidal change 65
6.2.2 Subtidal change 66
6.3 Comparison of communities at Meola Reef to those at Long Bay 68
6.3.1 Interpretation of community shifts 69
6.4 Recommendations 71
7777 ReferencesReferencesReferencesReferences 72727272
8888 APPENDICESAPPENDICESAPPENDICESAPPENDICES 79797979
8.1 Appendix A. GPS positions 79
8.1.1 Meola intertidal site locations 79
8.1.2 Meola subtidal site locations 79
8.2 Appendix B. Map of intertidal sites 80
8.3 Appendix C. Definition of technical terms 81
8.4 Appendix D. Taxa lists 83
8.4.1 Intertidal cover 83
8.4.2 Intertidal count 84
8.4.3 Subtidal cover 85
8.4.4 Subtidal count 86
8.5 Appendix E: Classification and Regression Trees 87
8.5.1 Intertidal Eastern sites 87
8.5.2 Intertidal Western sites 88
8.6 Appendix F. Size frequency histograms 89
8.6.1 Crassostrea gigas (Intertidal) 89
8.6.2 Sypharochiton pelliserpentis (Intertidal) 90
8.6.3 Melagraphia aethiops (Intertidal) 91
8.6.4 Xenostrobus pulex 92
8.6.5 Turbo smaragdus (Intertidal) 93
8.6.6 Turbo smaragdus (subtidal) 94
8.6.7 Carpophyllum flexuosum (Subtidal) 95
8.6.8 Carpophyllum maschalocarpum (Subtidal) 96
8.6.9 Ecklonia radiata 97
8.7 Appendix G. Chronological synopsis of sampling methodology 98
8.7.1 Intertidal Reef Monitoring 98
8.7.2 Subtidal reef monitoring 99
8.7.3 Sediment collection and total sedimentation rate calculation 100
8.7.4 Sediment textural analysis 101
8.7.5 Summary of methodology for sediment textural processing 102
8.8 Appendix H. Plots of dispersion 104
8.8.1 MDS plots of average subtidal count data (in 2 or 3 dimensions) 104
8.8.2 MDS plots of average subtidal cover data (in 2 or 3 dimensions) 105
8.9 Appendix I. MDS plots of average subtidal reef composition over time 106
Reviewed by: Approved for release by:
Richard Ford Kelvin Keh

TR 2009/020 Meola Reef Ecological Monitoring: 2001 – 2008 4
1 Executive Summary This report updates the results of the Meola Reef Monitoring Programme, (MRMP),
established in 2001 as an initiative of the Auckland Regional Council. The original
programme was designed to track long-term trends in community composition. These
trends were then to be put into a regional context by comparing them with those of
the Long Bay Marine Monitoring Programme (LBMMP). In addition, community
changes were to be interpreted with respect to sedimentation and toxic urban
discharges, which were considered the major threats to the local marine environment.
Intertidal and subtidal rocky reef communities were monitored at Meola Reef. Subtidal
sediment traps were also deployed to provide an indication of the amount and
composition of water-borne sediments. This report presents the findings of this
monitoring programme from its establishment in 2001 until February 2008.
The key findings of this report are:
1. Intertidal sites at Meola Reef are distinguishable by their assemblage densities
and percentage covers, but subtidal sites are not easily distinguishable from
each other.
2. There is no evidence of directional change in assemblage structure (over time)
at the Meola Reef sites.
3. The community composition is generally more even and more stable over time
at intertidal sites further south (closer to the base of Meola Reef), compared to
the northern sites.
4. No significant change over time was seen at Meola Reef over the same period
of time that significant change was seen in the LBMMP. These monitoring
programmes are only broadly comparable, but when the seven taxa that were
driving change in the LBMMP were examined at Meola Reef, only the alga
Sargassum sinclairii showed a similar linear change over time to what was
observed in the LBMMP1.
5. An increase in percentage cover of sediment was correlated with declines in
abundance of many species (although the sediment grazing pulmonate slug
Onchidella nigricans showed the opposite relationship). The relatively
ubiquitous nature of the correlation between abundance and sediment cover
suggests that an increase in sediment cover may result in declines in the
diversity (and abundance) of most species presently occupying Meola Reef.
6. In the subtidal sites, increased sediment deposition into traps was correlated
with declines in total abundance of solitary ascidians, the algae Carpophyllum
flexuosum and the cat’s eye snail, Turbo smaragdus. This pattern is consistent
with the effect of sediment cover, and suggests that the present rates of
1 Notably, three of the species causing change in the LBMMP, Cominella virgata, Dicathais orbita and Cystophora sp. were not found in sufficient numbers to analyse over time in the MRMP.
TR 2009/020 Meola Reef Ecological Monitoring: 2001 – 2008 5
sediment deposition on some parts of the reef are sufficient to affect the
densities of some species on the reef.
7. The invasive crab Charybdis japonica and the invasive tunicate Styela clava
have been identified at Meola Reef in the past two years. In total, eight
invasive species have now been documented at Meola Reef. However, over
the period of this study, no invasive species has shown an ecologically
concerning increase in density.
8. This monitoring programme should be continued in its present form. Although
the time series is of sufficient length to show some correlations between the
biological assemblages and long-term climatic phenomena (ENSO); the
estimates are highly variable due to the comparatively short time series. A
longer time series of data is needed so that any decline or improvement in this
State of the Environment monitoring site can be placed in an appropriate
temporal context.
9. Although correlations are not yet robust, due to the limited number of time
points, there appear to be many correlations between faunal variables and
climatic variables that are characteristic of the El Niño Southern Oscillation,
(ENSO). These relationships may be better explained with a longer time series.

TR 2009/020 Meola Reef Ecological Monitoring: 2001 – 2008 6
2 Introduction The Meola Reef monitoring programme (MRMP) started in December 2001. The
MRMP is a State of the Environment (SOE) monitoring programme for the intertidal
and subtidal communities, of this reef, and is designed primarily to:
1. Determine trends in community change over time at and within sites at this
location.
2. Compare community changes over time to those recorded at other sentinel
locations within the region.
3. Interpret any community changes within the backdrop of two major threats to
estuarine health in the Auckland Region:
a. Sedimentation from urban development
b. Toxicity from urban discharges (Hewitt 2000).
Meola Reef was chosen as one of a number of sentinel monitoring sites because it is a
unique environment within Auckland (Morton and Miller 1968, Hayward et al 1999) and
is located near the mouth of the Waitemata Harbour (and should consequently
integrate pollutant effects from the overlying water body). The basaltic reef at Meola
supports a richer and more diverse fauna than the nearby Waitemata sandstone reefs
(Hayward et al 1999). The only other comparable basaltic intertidal reef in northern
New Zealand is at Waitangi in the Bay of Islands (Hayward et al 1999). However, the
Central Waitemata Harbour monitoring programme has monitored a soft-sediment
intertidal site adjacent to Meola Reef every two months from October 2000 (Halliday et
al 2006). In addition, the Long Bay Marine Monitoring Programme (LBMMP) monitors a
number of subtidal rocky reef sites in the inner Hauraki Gulf using methods that are
directly comparable to those used in the MRMP. Qualitative comparisons may be
possible between the results of these monitoring programmes to see if patterns of
change are widespread or habitat specific.
2.1 Threats to harbour/estuarine health
Sedimentation and toxic urban discharges are the main threats highlighted as probable
causative factors for anthropogenic change in the Auckland marine environments.
Invasions of exotic marine fauna also have the potential to alter Meola Reef.
2.1.1 Sedimentation
Sediment loads to the coastal receiving environment are predicted to increase as a
result of rural and residential development (Auckland Regional Growth Forum 1999).
Sediment can adversely affect benthic organisms in various ways: coarse sediment
may scour surfaces and abrade tissue, suspended particles may interfere with filter

TR 2009/020 Meola Reef Ecological Monitoring: 2001 – 2008 7
feeding of benthic invertebrates, and the deposition of fine sediments can interfere
with grazing, settlement, growth and photosynthetic activity (Airoldi 2003, Ellis et al
2002, Schiel et al 2006, Airoldi and Hawkins 2007). All of these processes may affect
assemblage structure, and greater levels of sedimentation have been universally
recognised as a major threat to marine biodiversity (Ryan 1991, United Nations
Environment Programme 1995, Norkko et al 1999, Thrush et al 2003).
In the Auckland Region, the response to sedimentation has only been documented for
a few hard-substrate taxa. Some species that co-occur in hard and soft-substrates (e.g.
the anemone Anthopleura aureoradiata, the gastropods Diloma subrostrata and
Zeacumantus lutulentus2) have had their response to sedimentation tested either using
mensurative or manipulative experiments (Gibbs and Hewitt 2004). Anthopleura and
Diloma only occur in sediments that are 0-15% mud (it should be noted that
Anthopleura requires hard substrates to live in soft sediments, therefore its occurrence
in soft sediments is probably tightly linked to the occurrence of bivalves or rocks
exposed above the sediment (Morton and Miller 1968). Zeacumantus showed no
response to suspended sediment manipulations in the laboratory (Gibbs and Hewitt
2004). However, diversity has been observed to decline and the density of Turbo
smaragdus has been observed to increase with increased turbidity further south in the
Hauraki Gulf (Ford et al 2006). Additionally, Walker (2007) reported that the sea urchin
Evechinus chloroticus was relatively rare in the inner Hauraki Gulf, possibly due to the
settlement and survivorship of its recruits and juveniles being affected by the
occurrence of fine sediments.
2.1.2 Toxic urban discharges
Meola Creek and Motions Creek, on either side of Meola Reef, discharge some of the
most heavily polluted stormwater in the Auckland Region (Williamson and Kelly 2003).
There are also numerous other stormwater discharges up and down-harbour of Meola
Reef (Williamson and Kelly 2003) that could affect biota on the reef. The high flow
rates at Meola Reef are unlikely to promote widespread deposition of fine materials
(which stormwater pollutants are often bound to) over Meola Reef, but that does not
preclude fauna at the reef being impacted by these pollutants, e.g. filter feeders or
those in depressions where sediment may deposit.
The impact of these pollutants upon soft-sediment faunal assemblages has been
modelled across the Auckland Region (Anderson et al 2006b). Ecological assemblages
generally reflect pollution gradients well, via compositional changes. Several Auckland
soft-sediment species have also had their individual response to contaminants tested
(Appendix 2 in Halliday et al 2006). No equivalent tests have been carried out
examining the response of hard substrate fauna to chemical contamination in the
Auckland Region.
2 For simplicity, every taxon will generally be referred to by its genus after an initial introduction. The exceptions to this are the Carpophyllum kelps (referred to as C. maschalocarpum, C. flexuosum and C. plumosum) and the Cominella gastropods (C. adspersa, C. glandiformis, C. virgata and C. maculosa).

TR 2009/020 Meola Reef Ecological Monitoring: 2001 – 2008 8
2.1.3 Invasions
The Waitemata Harbour supports a number of invasive species (see Inglis et al 2005,
Halliday et al 2006 (Appendix 3). The MRMP has enumerated a number of invasive
taxa: the oyster Crassostrea gigas, the sponges Cliona celata and Tethya burtoni, the
polychaete Chaetopterus sp. and the anemone Diadumene lineata (Ford et al 2006).
The invasive crab Charybdis japonica has also been identified but not enumerated in
the 2007 subtidal survey.
2.2 Research investigations
This report provides a quantitative analysis of the monitoring data in order to examine
the SOE programme aims. To achieve this, several specific fundamental questions
need to be addressed:
1. Can we characterise the Meola Reef sites? Are there spatial patterns (i.e.
differences along or across the reef) in terms of the abundance and diversity of
fauna?
2. Are there changes through time in the faunal assemblages across the entire
Meola Reef (or some subset of sites)? Are these changes related to the side
of the reef or the distance along it? Are changes through time: (i) random, or
(ii) due to significant increases or decreases in particular taxa (or in total
abundance, diversity or community composition)?
3. Do changes correlate with any measured environmental variables?

TR 2009/020 Meola Reef Ecological Monitoring: 2001 – 2008 9
3 Methods Note: A chronological synopsis of changes in methods since the inception of the programme is given in Appendix A (Section 8.1).
3.1 Site locations
Surveys were carried out at six intertidal sites and five subtidal sites on Meola Reef. A
diagram of site locations on the reef is shown in Figure 1 and Global Positioning
System (GPS) coordinates are given in Appendix A, Section 8.1.
Figure Figure Figure Figure 1111
Map of Meola Reef showing all intertidal and subtidal sampling sites.

TR 2009/020 Meola Reef Ecological Monitoring: 2001 – 2008 10
3.2 Intertidal surveys
Intertidal sites measured approximately 75m² each, with three sites on the east side
(MIE1, MIE2 and MIE3) and three on the west side (MIW1, MIW2 and MIW3).
Labelling of these sites follows the convention whereby M = Meola, I = Intertidal, E/W
= east/west, and 1-3 where 1= the southernmost and 3 = the northernmost site. MIE3
was introduced as a new site in October 2001 due to the recommendations of the
previous report (Ford et al 2001). Within each site, 10 permanent quadrat locations
(1/4m²) were marked on the reef at 2-3m intervals (labelled stainless steel pegs were
cemented to the substrate to mark 2 corners over which the quadrat was placed).
Thus 60 quadrats were surveyed overall, 30 on each side of the reef. The approximate
position of each quadrat was mapped for all sites to aid relocation (Appendix B, Section
8.2).
The intertidal surveys aim to record the number, size, distribution and percentage
cover of all benthic macroscopic flora and fauna (greater than 4mm) inhabiting the
intertidal area of Meola Reef. Sampling commenced in December 2000, and was
carried out bimonthly until October 2001 (Ford et al 2001). It was recommended in that
report that there be a reduction of ~70% in sampling intensity, with three intertidal
sites either side of Meola Reef (east and west), instead of the five previous sites (two
on the east and three on the west), and annual sampling instead of bimonthly
sampling. Data presented in this report is therefore annual, from October of every
year, from 2001 onwards. The sampling methods used from 2002 onwards were
different to those used previously, being designed around the findings of a power
analysis (Ford et al 2001). In particular, oyster densities were measured at a smaller
scale and not all oysters were measured due to their high densities across all sites
(Ford et al 2001).
3.2.1 Faunal data
Each year, organisms have been identified down to the lowest practical taxonomic
level in every 1/4m² intertidal quadrat. All organisms (excluding Crassostrea, see
below) were counted and measured using vernier callipers. Measurements were
always taken along the longest axis of the organism. For gastropods, either shell
length or shell width (dependant on species shell form) was measured.
Substratum cover was also assessed for each quadrat. The percentage cover of all
substrate cover types was estimated. Each quadrat was photographed to produce a
digital record of substratum cover and provide verification of visual percentage cover
estimates if required (Figure 2 is an example photograph).
Throughout all samplings on Meola Reef, Crassostrea has been the numerically
dominant organism in all intertidal quadrats. To evaluate oyster density, each 1/4m²
quadrat was divided into quarters and all oysters in one quarter (1/16m²) were counted.
A minimum of 10 oysters were measured to the nearest millimetre. Since there are 10
quadrats per site, at least 100 oysters were measured at each site. If less than 100
oysters were present in all the measured quadrat-quarters, then more oysters were
randomly chosen until a total of 100 oysters were measured.

TR 2009/020 Meola Reef Ecological Monitoring: 2001 – 2008 11
Figure Figure Figure Figure 2222
A photograph of intertidal site MIW1. Photographs are used for recording and verifying coverage
estimates.
3.2.2 Environmental data
3.2.2.1 Sediment
One of the major concerns for the Meola Reef marine environment is the threat of
increased sedimentation and turbidity. Information was therefore required on the types
and quantities of sediment entering the marine ecosystem. To address this, an
ongoing program was initiated in September 2001 to quantify sedimentation in
locations where community sampling was undertaken.
In the intertidal sites, the percentage cover of sediment was measured along with
other encrusting (e.g. sponges) and turfing (e.g. small articulating algae) organisms.
The percent coverage of the substratum was visually estimated in each quadrat
(grouped into: sediment, live Crassostrea, dead Crassostrea, the algae Gelidium
caulacantheum, barnacles, and any other type found).

TR 2009/020 Meola Reef Ecological Monitoring: 2001 – 2008 12
3.2.2.2 Climate – the El Niño Southern Oscillation (ENSO)
The "El Niño - Southern Oscillation” (ENSO) phenomenon is the most important
coupled ocean-atmosphere phenomenon to cause global climate variability on an inter-
annual time scale (Vasquez et al 2006). ENSO refers to the major systematic global
climate fluctuation that occurs at the time of an "ocean warming" event, and ‘El Niño’
and ‘La Niña’ events refer to opposite extremes of the ENSO cycle. It is known to have
an important influence on New Zealand’s climate (Gordon 1986) and may also be a
useful predictor of organism abundances.
During El Niño events, New Zealand tends to experience stronger or more frequent
winds from the west in summer, typically leading to drought in east coast areas and
more rain in the west. In winter, the winds tend to be more from the south, bringing
colder conditions to both the land and the surrounding ocean. In spring and autumn,
south-westerly winds are more common. In contrast, La Niña events are characterised
by north-easterly winds which tend to bring moist, rainy conditions to the north-east of
the North Island, and reduced rainfall to the south and south-west of the South Island.
Warmer than normal temperatures typically occur over much of the country during La
Niña, although there are regional and seasonal exceptions (Gordon 1986, Mullen 1996).
To model ENSO, we chose a Multivariate ENSO Index (MEI) that is derived from
tropical Pacific COADS (Comprehensive Ocean Atmospheres dataset) records. The
MEI is derived from the first principal component of six variables: sea level pressure,
surface zonal wind components, meridional wind components, sea surface and surface
air temperature, and cloudiness. The index data is available at:
http://www.cdc.noaa.gov/people/klaus.wolter/MEI/table.html.
We felt that ENSO effects might vary depending on the temporal scale of the ENSO
signal, so we averaged MEI values over two different time scales. Intertidal MEI values
were averaged using:
1. the year prior to sampling (i.e. OctoberYear-1 – OctoberYear)
2. the three months leading up to sampling (i.e. August - October).
In the univariate biotic models, both 3-month and 12-month ENSO lag terms were
initially fit. However, both terms usually showed a degree of collinearity, so one of the
ENSO terms could usually be discarded without much loss of predictive power (the
choice of which term was discarded was determined by their respective predictive
power.3
3.3 Subtidal surveys
Three sites were located on the eastern side and two on the western side of Meola
Reef (Figure 1). All sites were areas of macroalgal-dominated subtidal basaltic reef.
Sites depths extended between 1 and 2 m below Mean Low Water Springs (MLWS).
3 Standard Bonferroni correction rates were applied to the two ENSO variables to control the rate of spurious significance (Chandler, 1995).
TR 2009/020 Meola Reef Ecological Monitoring: 2001 – 2008 13
Coordinates for each site were initially recorded by GPS (Appendix A, Section 8.1.2).
Surface buoys (of approximately 15 cm diameter) were then deployed at each site.
3.3.1 Faunal data
Previous studies of sheltered shallow subtidal reef assemblages have indicated
minimal seasonal variability (e.g. Babcock et al 1999). Therefore, one annual sampling
of subtidal assemblages has been conducted at five sites since 2001. The methods
used for this survey were the same as those used in the 2001 MRMP report (Ford et al
2001), and are consistent with those used in the LBMMP (Ford et al 2003a). These are
briefly outlined below.
Seven quadrats were randomly placed at each site within 20 m of the sediment
collectors which served as location markers. In five of these quadrats all macroalgae
and invertebrates (greater than 5 cm and 5 mm respectively), were identified, counted
and measured. The percentage cover of substratum types (which included turfing
algae, encrusting algae, large brown algae, encrusting invertebrates, bare rock,
sediment [finer than sand] and sand) were also visually estimated in each quadrat. In
two of the seven quadrats identification, counts and percentage cover estimates were
completed but no measurements were taken. The total lengths of all macroalgae were
measured to the nearest 5 cm. For the laminarian kelp, Ecklonia, this included both the
stipe length and total length (stipe length plus laminae length). The longest axis of
solitary macro invertebrates was also measured to the nearest 5 mm (and nearest 1
mm from 2007). Mobile organisms (e.g. crabs) were not enumerated. It should be
noted that during the 2001 survey, between five and seven quadrats were surveyed
due to a sampling error. For a detailed account of the sampling methods please refer
to the 1999 Long Bay Monitoring report (Babcock et al 1999).
3.3.2 Environmental data
3.3.2.1 Sediment
The percentage cover of sediment, along with other encrusting and turfing organisms
and substrate types, was visually estimated at within quadrats each subtidal site.
Sedimentation rate and particle grain size were also investigated by deploying
sediment traps 1-2 m below MLWS in areas surrounded by macro-algae at each of the
5 subtidal sites. These were placed at a set height (500 mm above the benthos) on a
heavy steel base to preclude movement or inundation by resuspended sediment. The
traps were collected approximately monthly and their contents were analysed.
The sediment traps were cylinders 37 mm in diameter and 500 mm in length
(consistent with those deployed in previous studies (Ford et al 2003a)). The chance of
resuspension of trapped particles was minimised due to the high initial aspect ratio of
7:1 (Knauer and Asper 1989).
TR 2009/020 Meola Reef Ecological Monitoring: 2001 – 2008 14
3.3.2.2 Trap rate definition
Sediment traps provide a measure of sediment deposition or flux at a site. The high-
aspect ratio means that traps are likely to preclude resuspension within the trap.
However, traps may also capture sediment resuspended locally from the neighbouring
bed, so sediment deposition in traps is referred to as the ‘trap rate’ within this
document.
3.3.2.3 Sediment processing
On collection, water was separated from the contents of the sediment traps by
filtering through pre-weighed ‘Faggs’ brand coffee filter bags. These were tested
against 1.2µm pore size filter paper and found to be 99% equivalent. This sediment
and filter bag was then oven dried at 60˚C for 24 hours, cooled and weighed to obtain
a total dry weight of sediment. These dry weights in combination with the trap surface
area and length of time deployed were then used to calculate the rate of trapped
sediment (grams per cm2 per day). Textural information of trapped sediments was
gained via laser particle size analysis. Pre-treatment of samples involved the addition of
10% hydrogen peroxide (to dissolve organics) and 5g/l of Calgon (to disperse particles)
prior to any grain size determination (Ford et al 2003b). To obtain textural information,
the sediment was analysed using the ‘Malvin Mastersizer 2000’ laser particle size
analyser and the results are shown as a percentage volume.
3.3.2.4 Climate
The ENSO climate data (as described in Section 3.2.2.2) was also used in the
modelling of the subtidal analyses. MEI values were calculated using the following
periods:
1. The month prior to trap collection (used to correlate with sub-tidal trap data).
2. The three and 12 month periods preceding faunal sampling. It should be noted
that the month of subtidal sampling differed between years due to inclement
weather
3.4 Statistical Methods
A number of terms and abbreviations mentioned here are also defined in Appendix C
(Section 8.3) for quick reference for the reader. In some cases, lengthier definitions are
given within the body of the report.
3.4.1 Site characterization
To determine the level at which generalizations can be made about the community
data, a permutational multivariate analysis of variance (PERMANOVA, Anderson 2001,
2005) was run to examine the effects of the factors: (i) year (2001, 2002 … 2008), (ii)

TR 2009/020 Meola Reef Ecological Monitoring: 2001 – 2008 15
side of reef (east or west) and (iii) distance north to south [1 (furthest south), 2 and 3
(furthest north)], on both count and cover data. These analyses also quantified the
amount of variation in the data explained by spatial (side and distance) and temporal
(year) factors. To visualise these patterns, a non-metric multi-dimensional scaling
ordination (MDS) was run on the average community composition of each site and
year combination (e.g. 2001MIE1, 2001MIE2 … 2008MIW2).
All multivariate analyses (excluding tests of dispersion) were completed using Bray-
Curtis similarities on presence/absence and natural log (ln) transformed data. Only the
results from the Bray-Curtis analysis on ln transformed data were reported, unless the
results differed between transformations.
Due to changes in assemblages over time, classification trees were used to find those
variables (or levels of particular variables) that discriminated between sites in the
MRMP (Breiman et al. 1984, Ripley 1996). Classification trees are a data mining
technique used to predict membership of cases (quadrats) in the classes of a
categorical dependent variable (bays), from their measurements of one or more
predictor variables (e.g. biotic and environmental variables). They systematically try to
split samples into two parts, examining one predictor variable at a time and splitting
the records on the basis of a dividing line in that variable (e.g., Trochus viridus
abundance > 11 or ‘sediment cover’ <= 35%).
To use the classification trees, a separate binary factor was created for each site. This
factor identified ‘site membership’ as: (i) the site of choice (e.g., ‘MIE1’) vs (ii) ‘other’,
(e.g. all other sites that were not MIE1). Each classification tree used this factor as a
response, thereby attempting to find those predictor variables that differed between
the site of choice and all other sites.
3.4.2 Assessment of changes over time
3.4.2.1 Multivariate models assessing change over time
Change over time can be characterised either by magnitude or direction. For example,
a site may be highly variable, but in no particular direction; or it could change relatively
little, but in a consistent direction. To test these facets of temporal change we
examined both multivariate dispersion and seriation. Temporal dispersion is a measure
of the amount of change in a community over time, i.e. a more dispersed community
changes more over time. Seriation is a measure of directional change over time. MDS
plots of all sites over time also include arrows corresponding to strong correlations (ρ >
|0.4|) of individual variables to axes on the plot.
Multivariate dispersion was tested using a permutational analysis of multivariate
dispersions (PERMDISP, Anderson 2004) using site as a factor and each time as a
replicate. A range of dissimilarity measures that do not intrinsically affect dispersion
were tested using PERMDISP as recommended in Anderson et al (2006a). The four
chosen dissimilarity measures (Jaccard’s, Manhattan and Modified Gower (base 10
and base 2)) were applied to raw count and cover data. Jaccard’s measure emphasises
compositional change, while Manhattan distance emphasises changes in abundance.

TR 2009/020 Meola Reef Ecological Monitoring: 2001 – 2008 16
The modified Gower indices strike a balance between compositional and abundance
change, with greater emphasis on abundance change for the base 2 compared to the
base 10 measure (Anderson et al 2006a). A significant result in this test would indicate
that the variability of a community over time is influenced by which site is considered.
To visualise these dispersions, MDS plots of the centroids of each site by time
combination were plotted for each dissimilarity measure.
Multivariate seriation was tested using a Mantels test in the RELATE function of
PRIMER (Clarke and Gorley 2006). This test was applied across the whole reef for
average count and cover data from each year, as well as separately at each site. A
significant result in this test would indicate directional change over time. The MDS
plots previously generated were used to visualise any directional change, although
additional MDS plots of count and cover data were generated showing the change
between years averaged across the whole reef.
Intertidal changes in size frequency over time
Temporal impacts can be manifested as changes in abundance, changes in size
structure of a population over time, or as a combination of both. Previous analyses
have addressed changes in abundance over time; this section will address changes in
population size structure over time. Size frequency data were examined for the seven
most abundant intertidal taxa, which constitute over 95% of the individuals (see
Section 4.2.3).
Size frequency data was calculated proportionately for each site by year level, e.g.
2001MIE1, 2001MIE2, etc., and then entered into PRIMER with the variables being
the different size classes e.g. 5, 6, 7 mm etc. PERMANOVA analyses were then used
to examine the impacts of site and year, although the interaction of these factors could
not be tested as only one replicate existed at each site by year combination. When a
significant effect of time was detected, size frequency histograms tracking each site
over time was generated and visually examined for ecological significance. Particular
ecological importance was placed upon the presence of juveniles, as juveniles are
considered more vulnerable than adults, so their absence could be a precursor of
community change.
Subtidal changes in size frequency over time
Subtidal size frequency data were analysed similarly to those for the intertidal zone.
However, with Ecklonia, stipe length was used as opposed to total length (because
total length can be affected by processes such as abrasion or herbivory). In addition,
PERMANOVA analyses showed significant effects of time and site for Ecklonia and
Turbo. For these taxa, size frequency histograms tracking each site over time were
generated and examined.

TR 2009/020 Meola Reef Ecological Monitoring: 2001 – 2008 17
3.4.2.2 The univariate model assessing change through time
In terms of spatial variation, quadrats within sites were randomly allocated and are
therefore considered our lowest level of replication and provide estimates of error
variation. In the intertidal data, quadrats were stationary through time, and plots that
tracked the abundance of each individual quadrat within each site through time were
produced. In addition, a summary plot of the mean for each site through time was
produced. In the subtidal data, quadrats were randomly placed each year, so plots
tracked those variables (as described above) after averaging at the site and reef spatial
scale.
Using a Generalised Linear Mixed Model
Counts of abundances of organisms are more appropriately modelled using a
generalised linear model due to the following reasons:
1. A population of organisms tends to change by multiplying (rather than
individuals being added or subtracted). Therefore, rather than fitting a linear
(additive) model directly, it is generally more appropriate to model the data on
the log (multiplicative) scale.
2. Organisms occur in discrete counts, rather than being a continuous
distribution.
3. Abundance data tends to be clumped (aggregated) rather than randomly
dispersed.
To account for these factors, each univariate variable was analysed using a quasi-
Poisson error distribution with log link. Since the primary interest was in examining
changes across the reef as a whole (rather than at the site level) a Generalised Linear
Mixed Model (GLMM, Booth et al 2003) using the R computer program (R
Development Core Team 2005) was used. The mixed model regarded the six intertidal
and five subtidal sites as samples from the intertidal and subtidal reef areas
respectively (although see below for a discussion about spatial interactions and spatial
inference).
Exploratory Data Analysis
Exploratory Data Analysis (EDA) was performed to check the assumptions of the
model (i.e. linearity of the response, independence of observations and
heteroscedasticity). Following Bence (1995), if significant temporal autocorrelation was
found, the shortness of the time series meant it was modelled by fitting AR1
(‘autoregressive errors order one’) errors
Note that ‘total number of taxa’, ‘diversity’ and all four cover variables did not
demonstrate over-dispersion or a mean-variance relationship and were therefore
modelled using a linear mixed-model with normal (Gaussian) errors.

TR 2009/020 Meola Reef Ecological Monitoring: 2001 – 2008 18
Creating confidence intervals for parameters
Credible intervals (a Bayesian analogue to confidence intervals) for each parameter
were generated using a Markov Chain Monte-Carlo (MCMC) approach. 1000 random
samples from the posterior distribution of the parameters were simulated using a non-
informative prior distribution and the 2.5% and 97.5% quantiles were used to
determine the required credible intervals.
The spatial scale of inference
The univariate modelling examined interactions between various spatial factors and
changes over time (see Figure 3).
Figure Figure Figure Figure 3333
A flow chart showing the basic steps used in the univariate analyses of major species abundance,
univariate indices, percent cover and environmental variables.
Examine variability in random effects (site parameters)
Run reef-widemixed effect model
Year*Proximity significant
No Year interactions
(use reef-wide model)
Year*Sidesignificant
Consider different distancesseparately
Consider different sidesseparately
Examine model assumptions
Examine variabilityin site slopes
and intercepts
Year*Side & Year*Proximityboth significant
Consider each site individually
Exam
ine m
odel
assum
ptio
ns
Exam
ine m
odel
assum
ptions
Of particular interest was whether any of the response variables included a significant
component of the variable ‘year’, which would indicate a consistent increase or
decrease over time (in abundance) after accounting for the effects of other covariates
(e.g. climate).
The rationale behind examining the interaction between (i) Distance and Year, and (ii)
Side and Year, was that these terms still give some degree of generality across the
reef without compromising the analysis.4 A significant ‘Year*Side’ interaction term
means that there is evidence that each side is changing differently over time. In such
circumstance, it would make sense to make inferences for each side of the reef
separately. The same principle holds with the ‘Year*Distance’ term.
4 Note: a significant interaction between Year*Site states that the effect of year depends on the site. This does not allow any degree of spatial generality beyond the site level.
TR 2009/020 Meola Reef Ecological Monitoring: 2001 – 2008 19
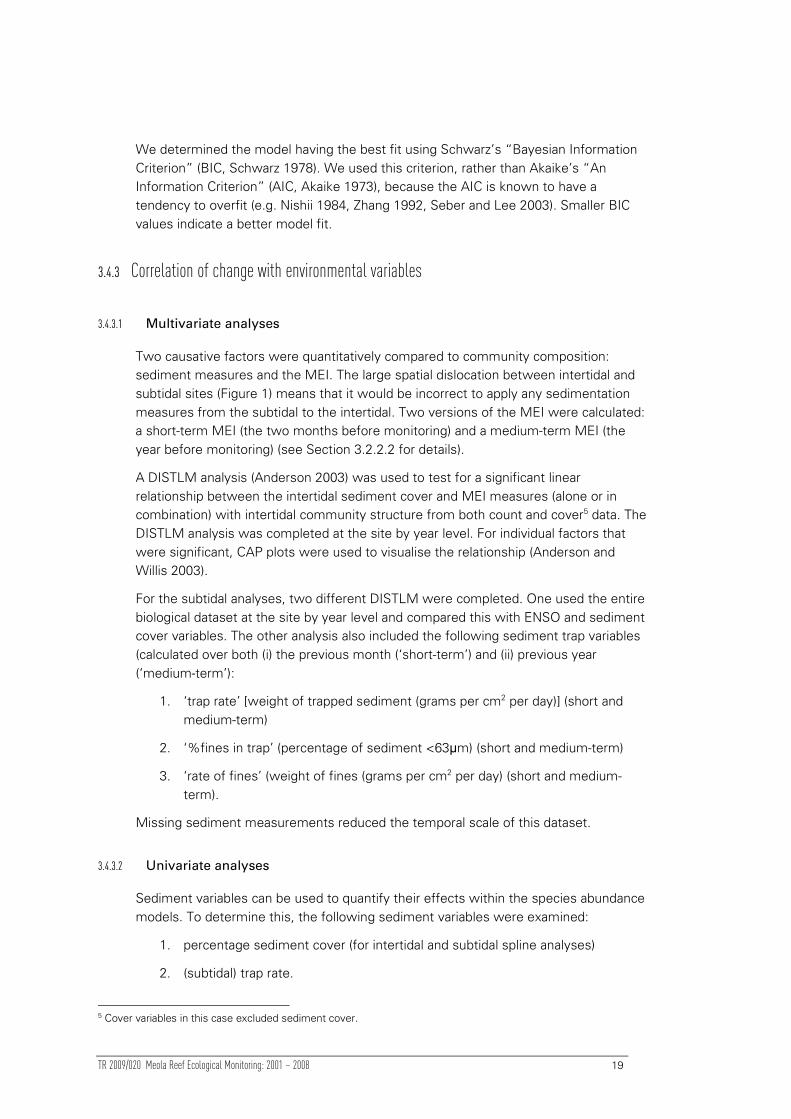
We determined the model having the best fit using Schwarz’s “Bayesian Information
Criterion” (BIC, Schwarz 1978). We used this criterion, rather than Akaike’s “An
Information Criterion” (AIC, Akaike 1973), because the AIC is known to have a
tendency to overfit (e.g. Nishii 1984, Zhang 1992, Seber and Lee 2003). Smaller BIC
values indicate a better model fit.
3.4.3 Correlation of change with environmental variables
3.4.3.1 Multivariate analyses
Two causative factors were quantitatively compared to community composition:
sediment measures and the MEI. The large spatial dislocation between intertidal and
subtidal sites (Figure 1) means that it would be incorrect to apply any sedimentation
measures from the subtidal to the intertidal. Two versions of the MEI were calculated:
a short-term MEI (the two months before monitoring) and a medium-term MEI (the
year before monitoring) (see Section 3.2.2.2 for details).
A DISTLM analysis (Anderson 2003) was used to test for a significant linear
relationship between the intertidal sediment cover and MEI measures (alone or in
combination) with intertidal community structure from both count and cover5 data. The
DISTLM analysis was completed at the site by year level. For individual factors that
were significant, CAP plots were used to visualise the relationship (Anderson and
Willis 2003).
For the subtidal analyses, two different DISTLM were completed. One used the entire
biological dataset at the site by year level and compared this with ENSO and sediment
cover variables. The other analysis also included the following sediment trap variables
(calculated over both (i) the previous month (‘short-term’) and (ii) previous year
(‘medium-term’):
1. ‘trap rate’ [weight of trapped sediment (grams per cm2 per day)] (short and
medium-term)
2. ‘%fines in trap’ (percentage of sediment <63µm) (short and medium-term)
3. ‘rate of fines’ (weight of fines (grams per cm2 per day) (short and medium-
term).
Missing sediment measurements reduced the temporal scale of this dataset.
3.4.3.2 Univariate analyses
Sediment variables can be used to quantify their effects within the species abundance
models. To determine this, the following sediment variables were examined:
1. percentage sediment cover (for intertidal and subtidal spline analyses)
2. (subtidal) trap rate.
5 Cover variables in this case excluded sediment cover.

TR 2009/020 Meola Reef Ecological Monitoring: 2001 – 2008 20
Modelling sediment trap rate
Although ENSO variables were included in initial mixed model analyses, respective
sediment variables were not. The rationale behind excluding sediment variables was to
determine whether abundance was changing over time after considering fluctuations
in ‘natural environmental variability’ (e.g. ENSO) as a covariate. When the
‘sedimentation variables’ are included as a covariate, temporal trends in abundance are
quantified given the changes in sediment that may also have occurred over time, i.e.
the linear trend in abundance may be different because the model might be
partitioning some of the changes in abundance to the effect of sediment.
The trap rate was averaged over the previous 12 months. This averaged rate was then
normalised using a log transformation and used as an explanatory variable in the mixed
model. Its importance was assessed using a χ2-square test of deviance in the quasi-
Poisson GLMM.
Modelling percentage sediment cover
To examine possible changes in component fauna with chronic longer-term increases
in sediment cover, the most abundant taxa in the intertidal and subtidal datasets (see
Section 4.3.2 and Section 5.2.3) were modelled individually along the gradient of
percentage sediment cover. Following Anderson et al (2007), quantile regression
splines of the 95th percentile of the distribution were used to model the abundance of
dominant species along the regional gradient of percentage sediment cover using the
‘quantreg’ package in R (Koenker 2007). The appropriate polynomial required for the
spline to provide an adequately-shaped fit for each species was determined using BIC.
The value at which the predicted density achieved a maximum along the gradient was
identified in order to find the ‘optimal’ percentage cover of sediment for each taxon.

TR 2009/020 Meola Reef Ecological Monitoring: 2001 – 2008 21
4 Intertidal Results
4.1 Characterization of the Meola Reef intertidal sites
Intertidal surveys of Meola Reef from 2001-2007 recorded 35 taxa and 12 cover types
(Appendix D, Section 8.4). The substratum cover at all intertidal sites at Meola Reef
was dominated by Crassostrea, bare rock and sediment. These cover, on average
(across all sites and times), 47%, 30% and 11% of the space on the reef respectively.
The monitored community was over 90% numerically dominated by six taxa: the
grazing gastropods Turbo, Melagraphia and Zeacumantus, the grazing chiton
Sypharochiton, the anemone Anthopleura and the small mussel Xenostrobus. With the
exception of Onchidella nigricans (only found in sediment pockets), all monitoring
species were associated with hard substratum.
The initial PERMANOVA analysis on both intertidal count and cover data suggested
that generalizations about the intertidal community of Meola Reef were not possible. A
significant interaction occurred between side, distance and year for the count and
cover data (Table 1). This means that the temporal patterns in both counts and covers
differed depending upon the side of the reef, the distance along it and the year
examined.
Sites showed strong clustering over time for both the count and cover data. The
amount of variance explained by the spatial factors (side and distance) in the count and
cover analyses (26 and 34%, respectively, Table 1) was large compared to the
temporal variability (explained by the year factor) in each of these analyses (9 and 8%,
respectively, Table 1). This can be observed in the MDS plots where sites (shown as
symbols) are grouped together but years (shown as numbers) are not (Figure 4, Figure
5).
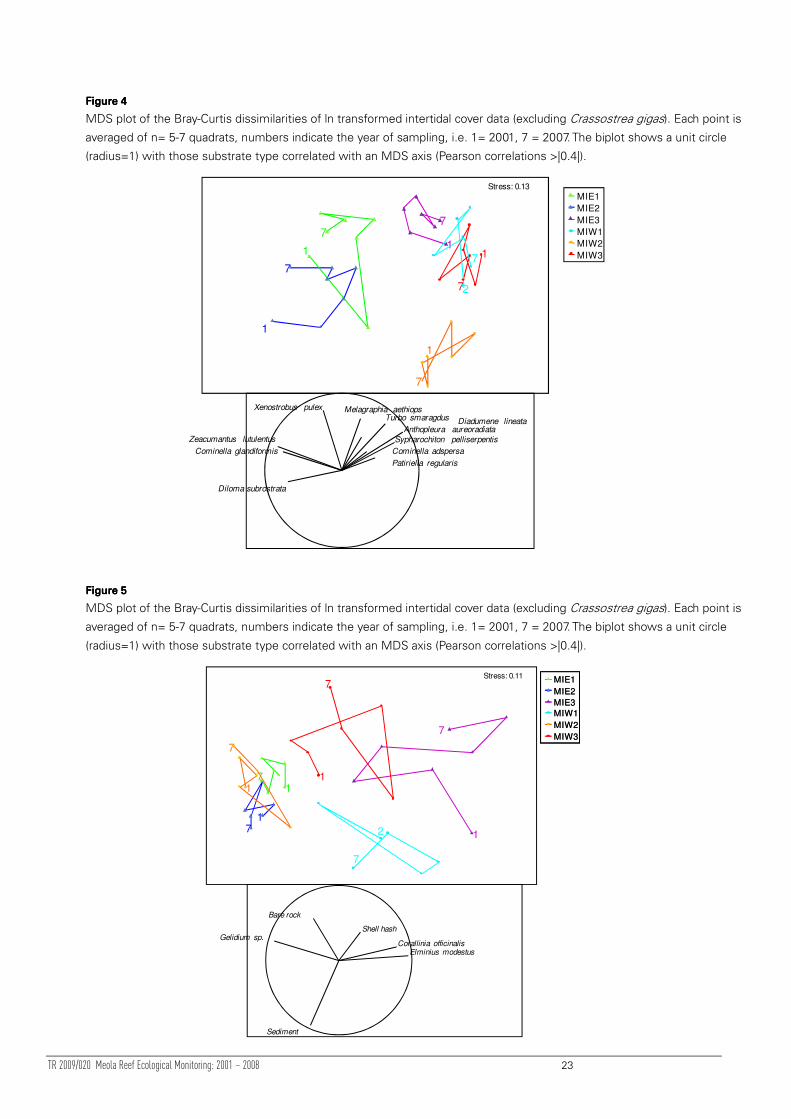
The similarity of communities between sites differed depending upon the metric
examined. Count data suggested that communities at sites MIE1, MIE2 and MIW1
were highly similar to each other (Figure 4). By contrast, when cover data was
examined, sites MIW2, MIW3 and MIE3 showed a high level of community similarity
(Figure 5). The high temporal stability and separation of community compositions on
the MDS plots (Figure 4, Figure 5) suggests that it is valid to characterise each site by
its fauna and cover classes.

TR 2009/020 Meola Reef Ecological Monitoring: 2001 – 2008 22
Table Table Table Table 1111
PERMANOVA results from analysis of the Bray-Curtis similarities of ln transformed intertidal count and cover data. %Var is the percentage of variation explained by each factor. Note: Presence/absence transformed data showed the same pattern of all factors being significant.
Factor df Pseudo-F P(perm) perms % Var
Count data
Year (Ye) 5 6.5758 0.001 998 8.9
Side (Si) 1 41.944 0.001 998 14.6
Distance (Di) 2 18.297 0.001 996 11.5
Ye x Si 4 2.0641 0.003 999 5.0
Ye x Di 8 2.0736 0.002 999 6.1
Si x Di 2 37.282 0.001 998 22.9
Ye x Si x Di 7 1.5906 0.013 997 6.2
Res 255 24.9
Total 284
Cover data
Year (Ye) 6 6.4428 0.001 999 7.8
Side (Si) 1 66.923 0.001 999 15.0
Distance (Di) 2 72.852 0.001 998 19.1
Ye x Si 6 4.0943 0.001 998 8.3
Ye x Di 12 1.9937 0.002 997 5.7
Si x Di 2 16.039 0.001 999 12.1
Ye x Si x Di 11 1.8566 0.007 999 7.3
Res 354 24.7
Total 394
TR 2009/020 Meola Reef Ecological Monitoring: 2001 – 2008 23
Figure Figure Figure Figure 4444
MDS plot of the Bray-Curtis dissimilarities of ln transformed intertidal cover data (excluding Crassostrea gigas). Each point is
averaged of n= 5-7 quadrats, numbers indicate the year of sampling, i.e. 1= 2001, 7 = 2007. The biplot shows a unit circle
(radius=1) with those substrate type correlated with an MDS axis (Pearson correlations >|0.4|).
Anthopleura aureoradiata
Cominella adspersaCominella glandiformis
Diadumene lineata
Diloma subrostrata
Melagraphia aethiops
Patiriella regularis
Sypharochiton pelliserpentis
Turbo smaragdus
Xenostrobus pulex
Zeacumantus lutulentus
1
1
1
11
7
77
7
7
Stress: 0.13
7
MIE1
MIE2
MIW1
MIW2
MIW3
MIE3
2
Figure Figure Figure Figure 5555
MDS plot of the Bray-Curtis dissimilarities of ln transformed intertidal cover data (excluding Crassostrea gigas). Each point is
averaged of n= 5-7 quadrats, numbers indicate the year of sampling, i.e. 1= 2001, 7 = 2007. The biplot shows a unit circle
(radius=1) with those substrate type correlated with an MDS axis (Pearson correlations >|0.4|).
Bare rock
Corallinia officinalisElminius modestus
Gelidium sp.
Sediment
Shell hash
111
12
7
7
7
7
7
Stress: 0.11
71
MIE1
MIE2
MIW1
MIW2
MIW3
MIE1
MIE2
MIW1
MIW2
MIW3
MIE3MIE3

TR 2009/020 Meola Reef Ecological Monitoring: 2001 – 2008 24
4.1.1 Specific characteristics of each intertidal site
Specific features of each intertidal site were determined using classification trees
(shown in Appendix E, Section 8.5). A summary of each tree is listed below:
• Site MIE1 was characterised by relatively high abundance of Zeacumantus,
Melagraphia and a moderate cover of Gelidium.
• Site MIE2 was characterised by relatively low abundance of Melagraphia, but
high abundance of Zeacumantus and C. glandiformis
• Site MIE3 was characterised by low cover of bare rock and Gelidium .
• Site MIW1 was characterised by relatively low total abundance, low densities
of Zeacumantus and Xenostrobus
• Site MIW2 was characterised by high abundance of Turbo and low percentage
cover of Elminius and sediment.
• Site MIW3 was characterised by a high abundance of Melagraphia. Most
quadrats had a moderate cover of Elminius (and those quadrats with few
Elminius had large numbers of Turbo).
4.2 Examination of changes over time
4.2.1 Change in community composition
The amount of community change at a site, as measured by the dispersion of count
data over time, was mainly driven by changes in abundance rather than composition.
The similarity measures that most stressed changes in abundance (MG2 and
Manhattan) detected a significant site effect on dispersion over time (p = 0.014 for
both). Those measures that most stressed compositional change (MG10 and Jaccard’s)
showed no significant site effect on dispersion over time (p = 0.073 and 0.337,
respectively). None of the similarity measures tested showed a significant difference
between the sites MIE1, MIE3 and MIW3 when pair-wise comparisons were
considered. Examination of the MDS plot suggested that these sites all showed
relatively high variability over time (Figure 6).
A significant site effect was usually detected when the dispersion of cover data was
examined over time. Of the four similarity measures tested, only the Jaccard’s
measure reported a marginally non-significant difference in dispersion between sites (p
= 0.06). All other measures showed a significant difference (p<0.01). Pair-wise
comparisons showed that for all similarity measures, sites MIE1 and MIE2 were the
most significantly different; examination of corresponding MDS plots showed these
sites to be the least variable over time (Figure 7).

TR 2009/020 Meola Reef Ecological Monitoring: 2001 – 2008 25
When count or cover data was analysed for directional change across all sites, and
across Meola Reef as a whole, only one significant change was detected (count data at
MIE2, Table 2). This can be seen as a shift over time at site MIE2 upwards and to the
right when viewed in the MDS plot (Figure 4). When using a presence/absence
transformation, this result was marginally non-significant (p<0.1), suggesting this
directional change was caused more by differences in abundance rather than
composition.
In general, sites MIE1, MIE3 and MIW3 were significantly more variable than sites
MIE2, MIW1 and MIW2. Only count data at site MIE2 showed a directional change
over time and this change appeared to be driven by changes in abundance rather than
composition. Cover data showed that sites MIE1 and MIE2 are the least variable and
the most significantly different in the extent of their change over time.
Table Table Table Table 2222
Results of seriation test upon individual intertidal sites and intertidal Meola Reef as a whole. Analyses were completed using Bray-Curtis similarities of ln transformed data. Presence/absence transformed data did not show significance for this site which suggests directional change in community composition is largely driven by changes in abundance.
Cover Count
Area P Rho P Rho
MIE1 0.140 0.248 0.442 0.007
MIE2 0.877 0.262 0.002* 0.762
MIE3 0.477 0.004 0.166 0.245
MIW1 0.189 0.222 0.341 0.062
MIW2 0.347 0.082 0.770 0.179
MIW3 0.153 0.257 0.121 0.270
Meola reef 0.336 0.102 0.431 0.045

TR 2009/020 Meola Reef Ecological Monitoring: 2001 – 2008 26
Figure Figure Figure Figure 6666
An example MDS plot of the intertidal count data, using MG2 = Modified Gower base-2
dissimilarity measure (averaged using n = 5-7 quadrats for each point). Numbers indicate the year
of sampling, i.e. 1= 2001, 7 = 2007.
MIE1
MIE2
MIW1
MIW2
MIW3
MIE3
MG 2
1
1
1
1
7
7
7
7
Stress: 0.12
127
7
Figure Figure Figure Figure 7777
An example MDS plot of the intertidal cover data, using MG2 = Modified Gower base-2
dissimilarity measure (averaged using n = 5-7 quadrats for each point). Numbers indicate the year
of sampling, i.e. 1= 2001, 7 = 2007.
MG2
1 1
11
2
7
7
77
7
Stress: 0.13
1
7
MIE1
MIE2
MIW1
MIW2
MIW3
MIE3

TR 2009/020 Meola Reef Ecological Monitoring: 2001 – 2008 27
4.2.2 Changes in size frequency distributions
The size distributions of Crassostrea and Sypharochiton showed evidence of changes
over time upon (p < 0.05, Table 3). The change in Crassostrea (Table 3) can be
attributed to a change in sampling methodology between 2001 and later years. More
Crassostrea were measured in 2001 (due to the sampling method), but the size
distribution of Crassostrea sizes has been stable. The size distribution of Sypharochiton
was relatively unstable at one site (MIE1), however there is no clear trend in the size
distributions. None of the other measured taxa exhibited any changes over time in the
size frequency distribution (see Appendix F).
Table Table Table Table 3333
PERMANOVA results examining the effect of site and time on Bray-Curtis dissimilarities of ln (x+1) transformed intertidal size frequency data. Asterisks indicate where the ln (x+1) transformed and presence/absence transformed data differ in their significance.
Taxa P value
Site Time
Crassostrea gigas 0.765 0.001
Turbo smaragdus 0.001 0.169
Melagraphia aethiops 0.001 0.094**
Sypharochiton pelliserpentis 0.617 0.001***
Xenostrobus pulex 0.002 0.212
* presence/absence transformation p = 0.057
** presence/absence transformation p = 0.043
*** presence/absence transformation p = 0.27
4.2.3 Tracking univariate variables through time
The seven most abundant intertidal species at Meola Reef constituted 95.5% of all
counted intertidal individuals6. Examining the temporal trends of these species should
give a good representation of the major trends at Meola Reef.
The most abundant species counted at the intertidal Meola sites were:
1. Anthopleura aureoradiata
2. Turbo smaragdus
3. Sypharochiton pelliserpentis
4. Xenostrobus pulex
5. Melagraphia aethiops
6 Note: the Pacific oyster (Crassostrea gigas) is the dominant macrofaunal species at Meola, but abundance of this species is estimated through percentage cover rather than direct counts.

TR 2009/020 Meola Reef Ecological Monitoring: 2001 – 2008 28
6. Zeacumantus lutulentus
7. Onchidella nigricans
Change in abundance (count data)
The results from the univariate GLMM analyses examining changes over time are
summarised in Table 4 and Table 5. Confidence intervals in count variables are
expressed as a percentage change in abundance per year (i.e. a multiplicative
[proportional] change).
Changes in abundance over time for species above (as well as total abundance, site
diversity and evenness) are shown in Figure 8 - 20. Each figure shows a left-hand
lattice plot with points corresponding to quadrat abundances. A black least squares
regression line and a red local regression smoother were fit to each site-panel. The
right plot averages abundance across: (i) the entire reef [thick black line], (ii) each
eastern site [red lines] and (iii) each western site [blue lines]. Distance along the reef is
shown by the labels: 1 [southern reef] – 3 [northern reef]. Note: The right plot uses a
different y-axis scale.
Figure Figure Figure Figure 8888
Change in total abundance of intertidal organisms in quadrats at Meola Reef. A black least squares (LS) regression line and a red local regression smoother are fitted to each site panel. The right hand graph shows the changes in site and reef averages over time (black = reef average, blue = western sites; red = eastern sites).
Quadrat values
Site & reef values
Year
Avera
ge a
bun
dance
pe
r q
uadra
t
2001 2002 2003 2004 2005 2006 2007
0
20
40
60
80
100
120
1
1
1
1
1
1
1
2
2
2
2
2
2
2
3
3
3
3
3
3
1 1 1
1
11
1
2
2
2
2
2
2
2
3
3
3
3
3
3
3
MIE1 MIE2 MIE3
MIW1 MIW2 MIW3
Year
To
tal a
bu
nd
an
ce
pe
r q
ua
dra
t
2001 2002 2003 2004 2005 2006 2007
2001 2002 2003 2004 2005 2006 2007 2001 2002 2003 2004 2005 2006 2007
0
50
100
150
200
250MIE1 MIE2 MIE3
MIW1 MIW2
0
50
100
150
200
250MIW3

TR 2009/020 Meola Reef Ecological Monitoring: 2001 – 2008 29
Figure Figure Figure Figure 9999
Site level evenness index and sampled diversity plotted vs time for count data. Coloured lines show the change in site and reef averages over time (black = reef average, blue = western sites; Red = eastern sites),
1
1
1
1
1
1
1
2001 2002 2003 2004 2005 2006 2007
10
15
20
25
Year
Nu
mb
er of ta
xa s
am
ple
dp
er
site
2
2
2
2
2
2
2
3
3
3
3
3
3
1
1
1
1
1
1
1
2
2
2
2
2
2
2
3
3
3
3
3
3 3
Year
Eve
ne
ss
2001 2002 2003 2004 2005 2006 2007
0.0
0.1
0.2
0.3
0.4
0.5
0.6
0.7
1
1
11
1
1
1
2
2
2
2
2
2
2
3
3 3
3
3 3
1
1
1
11
1
1
22 2
2
2
2
23
3
3
3
3
3
3
Intertidal site diversity Intertidal evenness
Figure Figure Figure Figure 10101010
Anthopleura aureoradiata – figure details are explained in Figure 8.
Quadrat values
Site & reef values
Year
2001 2002 2003 2004 2005 2006 2007
0
20
40
60
80
1
1
1
1
11
12 2
22 2
22
3
3
3
3
3
3
1
1 1
1
11
1
2 2
2
2
2
2
2
3
3
3
3 3
3
3
0
50
100
150
MIE1 MIE2 MIE3
MIW1 MIW2 MIW3
MIE1 MIE2 MIE3
MIW1 MIW2 MIW3
Year
2001 2002 2003 2004 2005 2006 2007
2001 2002 2003 2004 2005 2006 2007 2001 2002 2003 2004 2005 2006 2007
0
50
100
150
Av
era
ge a
bun
dan
ce p
er
quad
rat
Ab
und
ance p
er q
uad
rat

TR 2009/020 Meola Reef Ecological Monitoring: 2001 – 2008 30
Figure Figure Figure Figure 11111111
Turbo smaragdus – figure details are explained in Figure 8.
Quadrat values
Site & reef values
Year
2001 2002 2003 2004 2005 2006 2007
0
5
10
15
20
25
30
1 1
1
11
1 12
22
2
2 2 2
3
3
3
3
3
3
1 1 1 1 11 1
2
2
2
2
2
2
23
3
3
3
3
3
3
MIE1 MIE2 MIE3
MIW1 MIW2 MIW3
0
10
20
30
40
50
MIE1 MIE2 MIE3
MIW1 MIW2
0
10
20
30
40
50
MIW3
Year
2001 2002 2003 2004 2005 2006 2007
2001 2002 2003 2004 2005 2006 2007 2001 2002 2003 2004 2005 2006 2007
Av
era
ge a
bun
dance
per q
ua
dra
t
Ab
und
ance p
er q
uad
rat
Figure Figure Figure Figure 12121212
Sypharochiton pelliserpentis – figure details are explained in Figure 8.
Quadrat values
Site & reef values
Year
Av
era
ge a
bu
nd
an
ce p
er q
uad
rat
2001 2002 2003 2004 2005 2006 2007
0
5
10
15
1
1
1
1
1
1
1
22
2
2
2
2
2
3
3 3
3
3
3
1
11
1
11
1
2
2
2
2
2
2
2
3 3
3
3
3
3
3
MIE1 MIE2 MIE3
MIW1 MIW2 MIW3
Year
Ab
und
ance p
er q
uad
rat
0
10
20
30
0
10
20
30
2001 2002 2003 2004 2005 2006 2007 2001 2002 2003 2004 2005 2006 2007
2001 2002 2003 2004 2005 2006 2007
MIE1 MIE2 MIE3
MIW1 MIW2 MIW3
MIE1 MIE2 MIE3
MIW1 MIW2 MIW3
Year
0
10
20
30
0
10
20
30
2001 2002 2003 2004 2005 2006 2007 2001 2002 2003 2004 2005 2006 2007
2001 2002 2003 2004 2005 2006 2007
MIE1 MIE2 MIE3
MIW1 MIW2 MIW3

TR 2009/020 Meola Reef Ecological Monitoring: 2001 – 2008 31
Figure Figure Figure Figure 13131313
Xenostrobus pulex – figure details are explained in Figure 8.
Quadrat values
Site & reef values
Year
2001 2002 2003 2004 2005 2006 2007
0
5
10
15
20
25
30
1
1
1
1
1
1
1
2 2 2
2
22
2
3
3
3
3
3
31 1 1 1 1 1 12 2
2
2
22 2
3
3
3
3
3
3
3
MIE1 MIE2 MIE3
MIW1 MIW2 MIW3
0
50
100
MIE1 MIE2 MIE3
MIW1 MIW2
0
50
100
MIW3
Year
2001 2002 2003 2004 2005 2006 2007
2001 2002 2003 2004 2005 2006 2007 2001 2002 2003 2004 2005 2006 2007
Avera
ge a
bun
dan
ce p
er q
uadra
t
Ab
und
ance p
er q
uad
rat
Figure Figure Figure Figure 14141414
Melagraphia aethiops– figure details are explained in Figure 8.
Quadrat values
Site & reef values
Year
2001 2002 2003 2004 2005 2006 2007
0
5
10
15
20
1
1
1
1
1
1
1
22
22 2 2
2
3
3
3
3
33
1
1 11
1
1
1
2
2
2
2
2
2
2
3
3 3
3
3
33
0
10
20
30
MIE1 MIE2 MIE3
MIW1 MIW2
0
10
20
30
MIW3
MIE1 MIE2 MIE3
MIW1 MIW2 MIW3
Year
2001 2002 2003 2004 2005 2006 2007
2001 2002 2003 2004 2005 2006 2007 2001 2002 2003 2004 2005 2006 2007
Avera
ge a
bun
dance
per q
uadra
t
Ab
und
ance p
er q
uad
rat

TR 2009/020 Meola Reef Ecological Monitoring: 2001 – 2008 32
Figure Figure Figure Figure 15151515
Zeacumantus lutulentus – figure details are explained in Figure 8.
Quadrat values
Site & reef values
Year
2001 2002 2003 2004 2005 2006 2007
0
5
10
15
20
25
30
1
1
1
1
1
1
1
22
2
2
2
22
3 3 3 3 3 31 1 1 1 1 1 12 2 2 2 2 2 23
3
33
3
3
3
0
20
40
60
80
100
0
20
40
60
80
100
MIE1 MIE2 MIE3
MIW1 MIW2 MIW3
Year
2001 2002 2003 2004 2005 2006 2007
2001 2002 2003 2004 2005 2006 2007 2001 2002 2003 2004 2005 2006 2007
Av
era
ge a
bu
nd
ance
per
qua
dra
t
Ab
und
ance p
er q
uad
rat
Figure Figure Figure Figure 16161616
Onchidella nigricans – figure details are explained in Figure 8.
Quadrat values
Site & reef values
Year
2001 2002 2003 2004 2005 2006 2007
0
2
4
6
8
10
1
1
1
1
1
1
1
2
2
2
2
2
2
2
3
3
3
3 3
3
1
1
1
11
1
1
2
2
2
2
2
2
2
3
3
3
3 3
3
3
0
10
20
30
MIE1 MIE2 MIE3
MIW1 MIW2 MIW3
MIE1 MIE2 MIE3
MIW1 MIW3
Year
2001 2002 2003 2004 2005 2006 2007
2001 2002 2003 2004 2005 2006 2007 2001 2002 2003 2004 2005 2006 2007
MIW2
0
10
20
30
Avera
ge a
bun
dance
per q
uadra
t
Ab
und
ance p
er q
uad
rat

TR 2009/020 Meola Reef Ecological Monitoring: 2001 – 2008 33
Table Table Table Table 4444
Summary of the GLMM model results for (i) major species and (ii) univariate summary indices with intertidal count data. Significant interactions mean that effects are localised rather than reef-wide; the localised effects for those species are summarised in Table 5. Predictor variables in red show a negative relationship; *= p<0.05; ** = p<0.01; ***= p<0.001. st_ENSO refers to the ‘short-term ENSO’ index variable.
Reef-wide significant variables Species
Year ENSO st_ENSO Distance Side
Significant
interactions
Anthopleura 11 - 25%
Turbo -(0 - 10)% 56 - 115% Sites 3 > 1
Sypharochiton 11 - 29%
Xenostrobus <see Table 5 for site specific effects> Year*Side***
Year*Distance***
(Side*Distance***)
Melagraphia -(0 - 29)%
Zeacumantus 45 - 70%
Onchidella Sites
2 & 3 > 1
Site Diversity7 0.06 - 0.41
Evenness
(count) 1 > 2 & 3
Total
abundance <see Table 5 for site specific effects>
Year*Side*** Year*Distance***
(Side*Distance***)
Change in abundance (count data)
The total abundance was higher, on average, at northern sites. The only intertidal site that
showed a significant linear change was site MIE1, which showed a significant increase
(p<0.05). The change primarily occurred from 2001-2004, and appears to have stabilised since
2004. It should also be noted that although there was no statistically linear change in site
MIE3, the total abundance at this site was the lowest around 2005-2006 and has exhibited a
small recovery since then.
There is no evidence of reef-wide changes over time in either diversity or evenness indices in
either the count or cover intertidal data.
Anthopleura was found at a comparatively high average density (typically greater than 15 per
quadrat) at sites MIW2, MIW3 and MIE3. There is no evidence of a (linear) trend in
Anthopleura abundance over time. However, there was an obvious, but short-term, spike in its
abundance at most MIW2 quadrats (no other sites showed an unusual increase).
7Site diversity & evenness were calculated using a GLMM with identity link and Normal errors. Listed effects for these rows are therefore additive, e.g. we estimate that Diversity has increased between 0.06 - 0.4 species /year.
TR 2009/020 Meola Reef Ecological Monitoring: 2001 – 2008 34
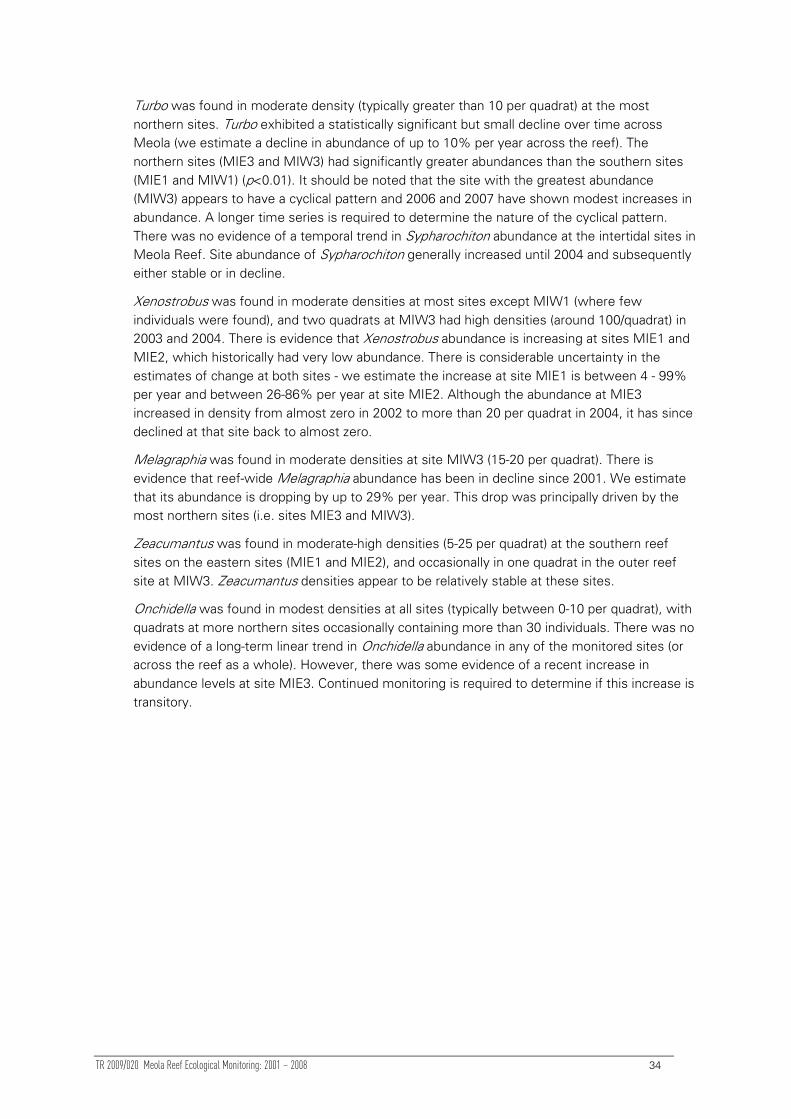
Turbo was found in moderate density (typically greater than 10 per quadrat) at the most
northern sites. Turbo exhibited a statistically significant but small decline over time across
Meola (we estimate a decline in abundance of up to 10% per year across the reef). The
northern sites (MIE3 and MIW3) had significantly greater abundances than the southern sites
(MIE1 and MIW1) (p<0.01). It should be noted that the site with the greatest abundance
(MIW3) appears to have a cyclical pattern and 2006 and 2007 have shown modest increases in
abundance. A longer time series is required to determine the nature of the cyclical pattern.
There was no evidence of a temporal trend in Sypharochiton abundance at the intertidal sites in
Meola Reef. Site abundance of Sypharochiton generally increased until 2004 and subsequently
either stable or in decline.
Xenostrobus was found in moderate densities at most sites except MIW1 (where few
individuals were found), and two quadrats at MIW3 had high densities (around 100/quadrat) in
2003 and 2004. There is evidence that Xenostrobus abundance is increasing at sites MIE1 and
MIE2, which historically had very low abundance. There is considerable uncertainty in the
estimates of change at both sites - we estimate the increase at site MIE1 is between 4 - 99%
per year and between 26-86% per year at site MIE2. Although the abundance at MIE3
increased in density from almost zero in 2002 to more than 20 per quadrat in 2004, it has since
declined at that site back to almost zero.
Melagraphia was found in moderate densities at site MIW3 (15-20 per quadrat). There is
evidence that reef-wide Melagraphia abundance has been in decline since 2001. We estimate
that its abundance is dropping by up to 29% per year. This drop was principally driven by the
most northern sites (i.e. sites MIE3 and MIW3).
Zeacumantus was found in moderate-high densities (5-25 per quadrat) at the southern reef
sites on the eastern sites (MIE1 and MIE2), and occasionally in one quadrat in the outer reef
site at MIW3. Zeacumantus densities appear to be relatively stable at these sites.
Onchidella was found in modest densities at all sites (typically between 0-10 per quadrat), with
quadrats at more northern sites occasionally containing more than 30 individuals. There was no
evidence of a long-term linear trend in Onchidella abundance in any of the monitored sites (or
across the reef as a whole). However, there was some evidence of a recent increase in
abundance levels at site MIE3. Continued monitoring is required to determine if this increase is
transitory.

TR 2009/020 Meola Reef Ecological Monitoring: 2001 – 2008 35
Table Table Table Table 5555
Localised effects summarizing the GLMM model results for those major species with count data. st_ENSO refers to the short-term ENSO index variable.
Significant variables Species Location
Year ENSO st_ENSO
MIW1
MIW2
MIW3 44-67%
MIE1 5-99% 11-87%
MIE2 26-86%
Xenostrobus
MIE3
MIW1 7-81%
MIW2 4-72%
MIW3
MIE1 3-25% 11-87%
MIE2
Total
abundance
MIE3
Change in percentage cover
Changes in percentage cover over time (as well as total abundance and site evenness) are
shown in Figure 17 - 24.
The results from the univariate GLMM analyses examining percentage cover changes over
time are summarised in Table 6 and Table 7. Confidence intervals in cover variables are
expressed as an additive change in percentage cover per year.

TR 2009/020 Meola Reef Ecological Monitoring: 2001 – 2008 36
Figure Figure Figure Figure 17171717
Intertidal evenness - %cover data. Coloured lines show the change in site and reef averages over time (black = reef average, blue = western sites; Red = eastern sites).
Year
Eve
nn
ess
2001 2002 2003 2004 2005 2006 2007
0.0
0.2
0.4
0.6
0.8
11 1
1
1
1
1
2
2
2
2
2
2
2
3
33
3 3
3
1
1
1
1
1
1
1
2
2
2 2
2 2
2
3
3
3
3
3
3 3
Intertidal evenness
Figure Figure Figure Figure 18181818
Percentage cover of sediment – figure details are explained in Figure 8.
Quadrat values
Site & reef values
Year
Av
era
ge
% c
ove
r
2001 2002 2003 2004 2005 2006 2007
0
5
10
15
20
25
1
1
1 1
1
1
1
2
2
2
2
2
2
2
3
3
3
3
3
3
1
1 1
1
1
1
1
2
2
2
2
2
2
2
3
3
3
3 3
3
3
MIE1 MIE2 MIE3
MIW1 MIW2 MIW3
Year
% q
uad
rat co
ver
2001 2002 2003 2004 2005 2006 2007
2001 2002 2003 2004 2005 2006 2007 2001 2002 2003 2004 2005 2006 2007
0
20
40
60
MIE1 MIE2 MIE3
MIW1 MIW2
0
20
40
60
MIW3

TR 2009/020 Meola Reef Ecological Monitoring: 2001 – 2008 37
Figure Figure Figure Figure 19191919
Percentage cover of Crassostrea gigas – figure details are explained in Figure 8.
Quadrat values
Site & reef values
Year
Avera
ge %
co
ver
2001 2002 2003 2004 2005 2006 2007
0
10
20
30
40
50
60
1 1
1
1
1
1 1
2
2 2
2
22 2
3 3
3
3
33
11
1
1
1 1
12
2
2
2
2
2
2
3
3 3
3
3
3
3
MIE1 MIE2 MIE3
MIW1 MIW2 MIW3
20
40
60
80
MIE1 MIE2 MIE3
MIW1 MIW2
20
40
60
80
MIW3
Year
% q
ua
dra
t co
ve
r
2001 2002 2003 2004 2005 2006 2007
2001 2002 2003 2004 2005 2006 2007 2001 2002 2003 2004 2005 2006 2007
Figure Figure Figure Figure 20202020
Percentage cover of barnacles– figure details are explained in Figure 8.
Quadrat values
Site & reef values
Year
2001 2002 2003 2004 2005 2006 2007
0
5
10
15
20
25
30
35
1 1 1 1 1 1 12 2 2 2 2 2 2
3
3
3
3 3
31 1 1 1 1 1 1
22
2 22
2
2
3
3
3
33
3
3
Year
2001 2002 2003 2004 2005 2006 2007
0
5
10
15
20
25
30
35
1 1 1 1 1 1 12 2 2 2 2 2 2
3
3
3
3 3
31 1 1 1 1 1 1
22
2 22
2
2
3
3
3
33
3
3
Avera
ge %
co
ver
Year
% q
ua
dra
t co
ve
r
2001 2002 2003 2004 2005 2006 2007
2001 2002 2003 2004 2005 2006 2007 2001 2002 2003 2004 2005 2006 2007
0
20
40
60
MIE1 MIE2 MIE3
MIW1 MIW2
0
20
40
60
MIW3

TR 2009/020 Meola Reef Ecological Monitoring: 2001 – 2008 38
Table Table Table Table 6666
Summary of the GLMM model results for percentage cover variables. Significant interactions
mean that reef-wide effects cannot be integrated; the localised effects for those species are
summarised in Table 7. Predictor variables in red show a negative relationship; *= p<0.05; ** =
p<0.01; ***= p<0.001. st_ENSO refers to the ‘short-term ENSO’ index variable.
Reef-wide significant variables Variable
Year ENSO st_ENSO Distance Side
Significant
interactions
%Sediment <see Table 7 for site specific effects> Year*Side***
%Crassostrea
%Barnacles <see Table 7 for site specific effects>
Evenness
(cover data)
Table Table Table Table 7777
Localised effects summarizing the GLMM model results for those major species with percentage cover data. Predictor variables in red show a negative relationship. st_ENSO refers to the short-term ENSO index variable.
Significant effects Variable Location
Year ENSO st_ENSO
East side -(4.9%-18.2%)
%Sediment
West side -(0.3–1.5%)
MIW2
MIW3 0-2.57% 20%-39% %Barnacles
MIE3

TR 2009/020 Meola Reef Ecological Monitoring: 2001 – 2008 39
Cover data
There was no evidence of any change in evenness in the composition of those species
measured by percentage cover.
There was strong evidence of a decline in percentage cover of sediment on the west side of
(intertidal) Meola (p=0.003). There was some evidence that the change over time has been
non-linear (p=0.028), but the non-linearity is small enough to be well modelled as a simple
linear effect.
Crassostrea was ubiquitous at the intertidal Meola sites, and there was no evidence of any
change in its percentage cover at the reef. In contrast, barnacles were only found at the more
northern sites (i.e. MIW2, MIW3 and MIE3) and have increased by up to 3% per year (at these
sites) since the programme’s inception. Barnacles were most abundant at MIW3, and this site
showed a cyclical pattern (even after accounting for ENSO). The shortness of the time series
means that the apparent increase in cover may be a part of a cycle rather than a real long-term
change.
4.3 Relationship between temporal change and environmental factors
4.3.1 Multivariate analyses
The count and cover data both showed a significant relationship between sediment cover and
community structure (Table 8). No significant correlation was seen between the Multivariate El
Niño Indices and either the count or cover data. The fact that a relationship was seen between
sediment cover and ln transformed, but not presence/absence transformed data, suggests
abundance rather than composition based change with changing sediment cover. The reverse
case for cover variables suggests that changes in sediment cover affect the composition of
other cover classes present. CAP plots for both count and cover data consistently showed
relatively low levels of sediment cover at sites MIW1 and MIW2 and relatively high levels of
sediment cover at sites MIE2 and MIE3 (Figure 21).
Table Table Table Table 8888
Results of DISTLM analyses relating environmental variables to Bray-Curtis dissimilarities of intertidal count and cover data. Environmental variables used were: MEI short = calculated over the month prior to sampling, MEI medium = calculated over the year prior to sampling and % cover = the average percentage cover of sediments at each year by site combination. Note: ln = natural log (x); p/a = presence/absence.
Response Trans Factor P % var.
Count data In % sed cover 0.028 6.9
Count data p/a N/A
Count data In N/A
Count data p/a % sed cover 0.016 10.6
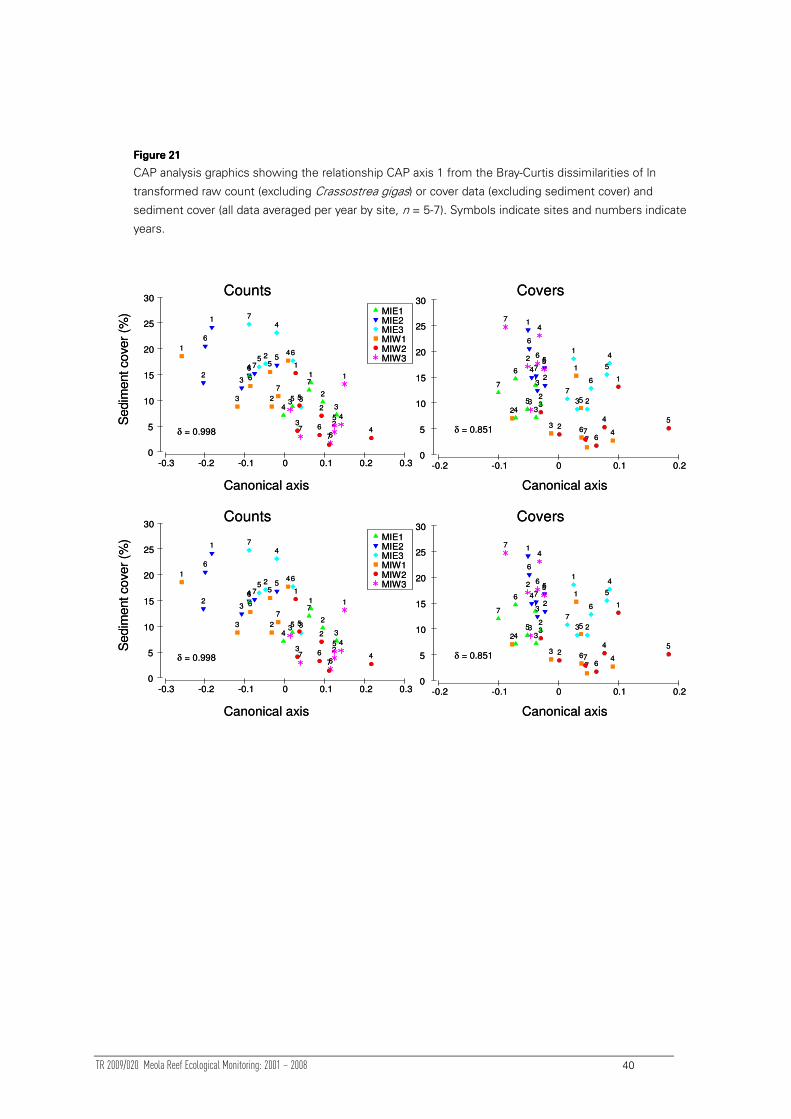
TR 2009/020 Meola Reef Ecological Monitoring: 2001 – 2008 40
Figure Figure Figure Figure 21212121
CAP analysis graphics showing the relationship CAP axis 1 from the Bray-Curtis dissimilarities of ln
transformed raw count (excluding Crassostrea gigas) or cover data (excluding sediment cover) and
sediment cover (all data averaged per year by site, n = 5-7). Symbols indicate sites and numbers indicate
years.
Covers
-0.2 -0.1 0 0.1 0.2
Canonical axis
0
5
10
15
20
25
30
1
1
1
1
1
2
2
2
2
2
2
3
3
3 3
3
34
4
4
4
4
4
5
555
5
5
6
6
6
6
66
7
7
7
7
77
Counts
-0.3 -0.2 -0.1 0 0.1 0.2 0.30
5
10
15
20
25
30
MIE1MIE2MIE3MIW1MIW2MIW3
1
1
1
1
1
2
2
2
2
2
2
3
3
33
3
34
4
4
4
4
4
5
555
5
5
6
6
6
6
66
7
7
7
7
77
Canonical axis
Sedim
ent cover
(%)
δ = 0.998 δ = 0.851
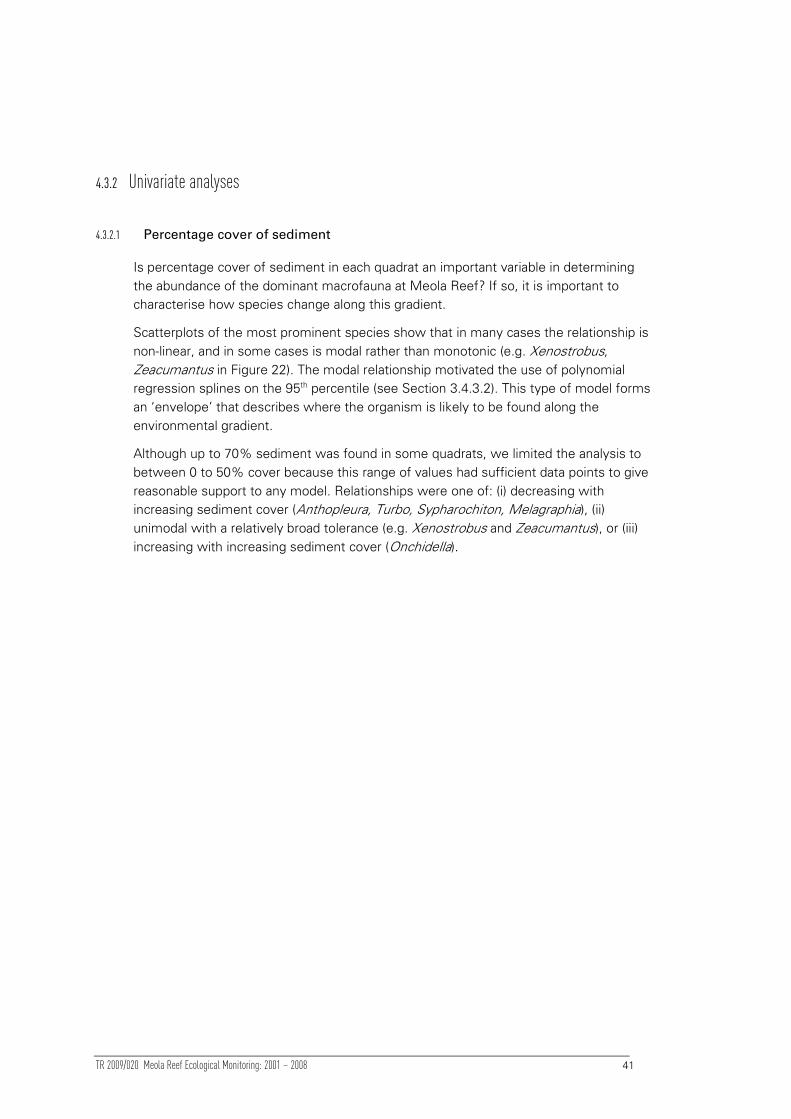
TR 2009/020 Meola Reef Ecological Monitoring: 2001 – 2008 41
4.3.2 Univariate analyses
4.3.2.1 Percentage cover of sediment
Is percentage cover of sediment in each quadrat an important variable in determining
the abundance of the dominant macrofauna at Meola Reef? If so, it is important to
characterise how species change along this gradient.
Scatterplots of the most prominent species show that in many cases the relationship is
non-linear, and in some cases is modal rather than monotonic (e.g. Xenostrobus,
Zeacumantus in Figure 22). The modal relationship motivated the use of polynomial
regression splines on the 95th percentile (see Section 3.4.3.2). This type of model forms
an ‘envelope’ that describes where the organism is likely to be found along the
environmental gradient.
Although up to 70% sediment was found in some quadrats, we limited the analysis to
between 0 to 50% cover because this range of values had sufficient data points to give
reasonable support to any model. Relationships were one of: (i) decreasing with
increasing sediment cover (Anthopleura, Turbo, Sypharochiton, Melagraphia), (ii)
unimodal with a relatively broad tolerance (e.g. Xenostrobus and Zeacumantus), or (iii)
increasing with increasing sediment cover (Onchidella).

TR 2009/020 Meola Reef Ecological Monitoring: 2001 – 2008 42
Figure Figure Figure Figure 22222222
Relationship between individual intertidal taxa (as indicated) and percentage sediment cover. The
polynomial regression spline model for the 95th percentile is shown in blue, with the maximum
from the model (interpretable as an estimated optimum for the taxon) indicated by a red line.
Note: the regression-spline fit only used percentage sediment cover values ≤50%, only three
quadrats had observations >50%.
0 10 20 30 40 50
0
50
100
150
Anthopleura aureoradiata
0 10 20 30 40 50
0
10
20
30
40
50
Turbo smaragdus
0 10 20 30 40 50
0
10
20
30
Sypharochiton pelliserpentis
0 10 20 30 40 50
0
20
40
60
80
100
120
Xenostrobus pulex
0 10 20 30 40 50
0
5
10
15
20
25
30
Melagraphia aethiops
0 10 20 30 40 50
0
20
40
60
80
100
Zeacumantus lutulentus
0 10 20 30 40 50
0
10
20
30
Onchidella nigricans
% sediment cover
Ab
un
da
nce
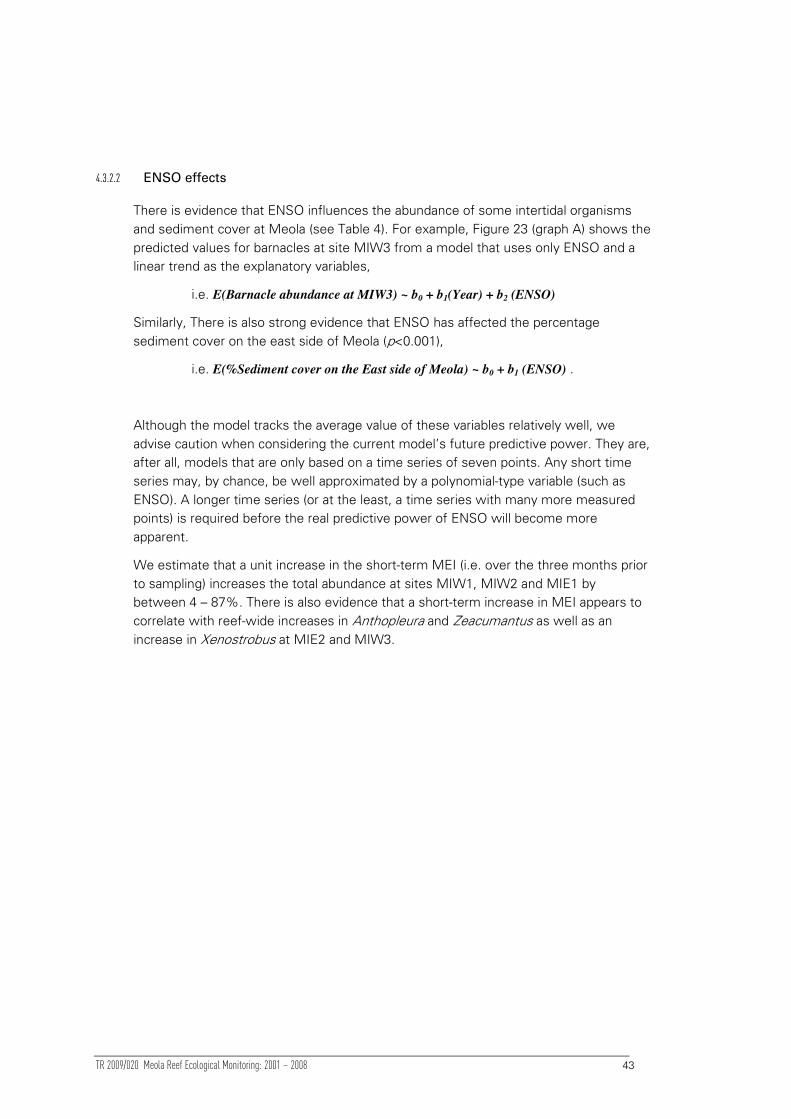
TR 2009/020 Meola Reef Ecological Monitoring: 2001 – 2008 43
4.3.2.2 ENSO effects
There is evidence that ENSO influences the abundance of some intertidal organisms
and sediment cover at Meola (see Table 4). For example, Figure 23 (graph A) shows the
predicted values for barnacles at site MIW3 from a model that uses only ENSO and a
linear trend as the explanatory variables,
i.e. E(Barnacle abundance at MIW3) ~ b0 + b1(Year) + b2 (ENSO)
Similarly, There is also strong evidence that ENSO has affected the percentage
sediment cover on the east side of Meola (p<0.001),
i.e. E(%Sediment cover on the East side of Meola) ~ b0 + b1 (ENSO) .
Although the model tracks the average value of these variables relatively well, we
advise caution when considering the current model’s future predictive power. They are,
after all, models that are only based on a time series of seven points. Any short time
series may, by chance, be well approximated by a polynomial-type variable (such as
ENSO). A longer time series (or at the least, a time series with many more measured
points) is required before the real predictive power of ENSO will become more
apparent.
We estimate that a unit increase in the short-term MEI (i.e. over the three months prior
to sampling) increases the total abundance at sites MIW1, MIW2 and MIE1 by
between 4 – 87%. There is also evidence that a short-term increase in MEI appears to
correlate with reef-wide increases in Anthopleura and Zeacumantus as well as an
increase in Xenostrobus at MIE2 and MIW3.
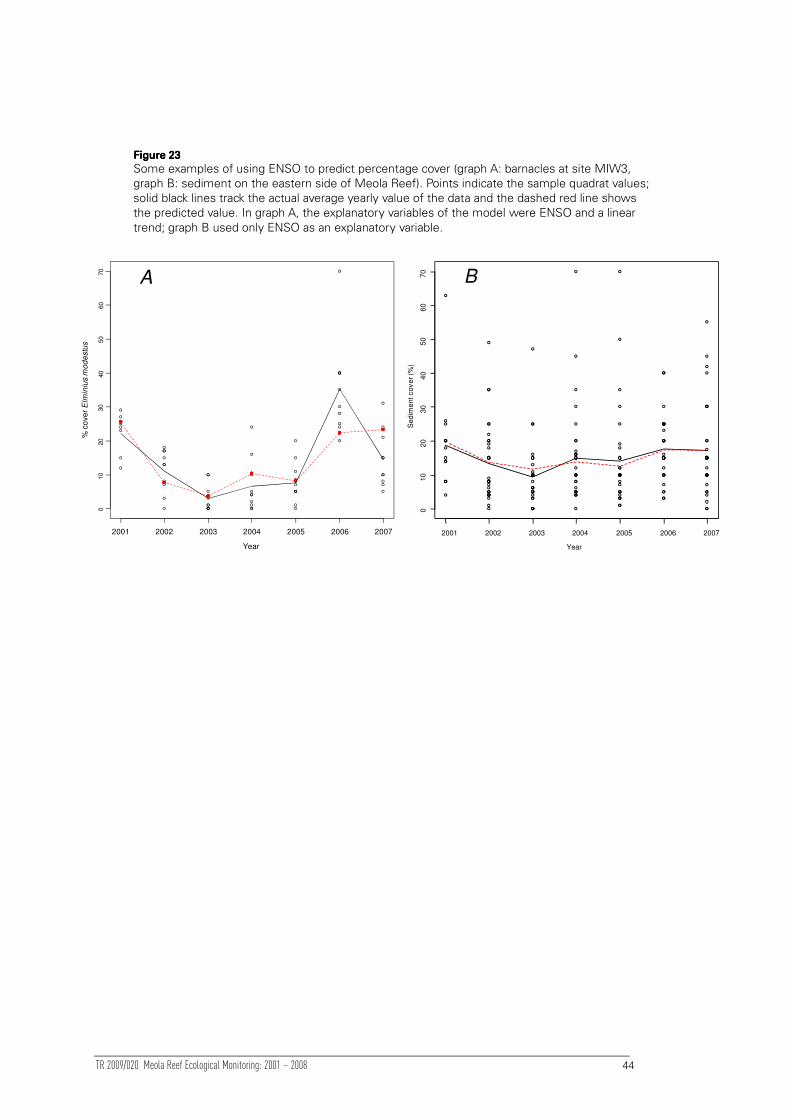
TR 2009/020 Meola Reef Ecological Monitoring: 2001 – 2008 44
Figure Figure Figure Figure 23232323
Some examples of using ENSO to predict percentage cover (graph A: barnacles at site MIW3, graph B: sediment on the eastern side of Meola Reef). Points indicate the sample quadrat values; solid black lines track the actual average yearly value of the data and the dashed red line shows the predicted value. In graph A, the explanatory variables of the model were ENSO and a linear trend; graph B used only ENSO as an explanatory variable.
2001 2002 2003 2004 2005 2006 2007
010
20
30
40
50
60
70
Sedim
ent cover (%
)
2001 2002 2003 2004 2005 2006 2007
010
20
30
40
50
60
70
Year
% c
ove
r E
lmin
ius m
od
estu
s
Year
A B

TR 2009/020 Meola Reef Ecological Monitoring: 2001 – 2008 45
5 Subtidal Results
5.1 Characterisation of the subtidal Meola Reef sites
Subtidal surveys of Meola Reef from 2001 to 2008 have recorded 43 taxa and 46 cover
types (Appendix G, Section 8.7). The reef is visually dominated by canopy forming
brown algae (predominantly Carpophyllum flexuosum, Carpophyllum maschalocarpum
and Ecklonia). Underneath or adjacent to this canopy the substrate always consisted of
>60% unconsolidated substrates (sand, mud, shell and gravel), crustose algae and
coralline turfing algae. The remaining substrate was dominated by bare rock, sponges
and solitary ascidians. The gastropod, Turbo, is the most numerous monitored
organism on the reef. Turbo lives on the kelp and seafloor and comprises 97% of the
gastropods and 76% of all measured fauna on the reef.
The initial PERMANOVA on both subtidal count and cover data suggested that
generalisations about the subtidal communities of Meola Reef are not possible. A
significant interaction occurred between side, distance and year for count data (Table
9). This means that for count data the temporal patterns differed depending upon both
the side and the distance along the reef. Cover data showed significant two-way
interactions between (i) side and year, and (ii) side and distance (Table 9). This means
that the change in substrate cover over time and the effect of distance on substrate
cover both depended on which side of the reef was examined.
The subtidal data showed more temporal and less spatial structuring than the intertidal
data. The subtidal data showed a relatively large proportion of variance explained by the
year factor (13-14%), relatively small amounts of variance explained by spatial factors
and a relatively large proportion of unexplained variance (58-64%, Table 9). The relative
strengths of these effects can be observed in the MDS plot of year by site centroids
(Figure 24). The year effect can be seen, for example, by the location of all the 2008
samples in the top half of the plot and the 2004 samples in the bottom half of the plot.
The relatively weak spatial effects can be seen by the large spread of sites in this
diagram in contrast to those in Figure 4 and Figure 5. The MDS of cover data is harder
to interpret as the three dimensional representation must be used; similar patterns are
however evident in this diagram, e.g., 2003 samples seem tightly grouped while
samples from the same site seem relatively widespread (Figure 25).
Characterising individual sites or years from the subtidal in terms of count or cover data
is difficult. The only pattern obvious from examination of the count or cover variables
was that bare rock was largely absent as a cover class in 2001, 2002 and 2008. The
significant interactions involving the year factor for both count and cover variables
(Table 9) in combination with the temporal variability seen in the MDS plots suggest
that temporal patterns need to be examined at the individual site level.

TR 2009/020 Meola Reef Ecological Monitoring: 2001 – 2008 46
Table Table Table Table 9999
PERMANOVA results from analysis of the Bray-Curtis similarities of ln transformed subtidal count and cover data. %Var is the percentage of variation explained by each factor. Note: the same analysis on presence/absence transformed data showed a significant Si x Di effect (p = 0.001). Otherwise, results were equivalent.
Factor df Pseudo-F P(perms) perms % Var
Count data
Year (Ye) 7 9.5401 0.001 999 14.29
Side (Si) 1 21.211 0.001 999 4.54
Distance (Di) 2 5.1727 0.001 999 2.21
Ye x Si 7 4.2868 0.001 998 6.42
Ye x Di 14 2.5243 0.001 998 7.56
Si x Di 2 3.4702 0.001 997 1.49
Ye x Si x Di 13 1.3437 0.031 999 3.74
Res 275 58.85
Total 321
Count data
Year (Ye) 7 8.0355 0.001 997 13
Side (Si) 1 11.322 0.001 997 3
Distance (Di) 2 6.6256 0.001 999 3
Ye x Si 7 3.2796 0.001 997 5
Ye x Di 14 1.6928 0.001 998 5
Si x Di 2 1.6745 0.089 999 1
Ye x Si x Di 13 1.1987 0.126 998 4
Res 277 64
Total 323
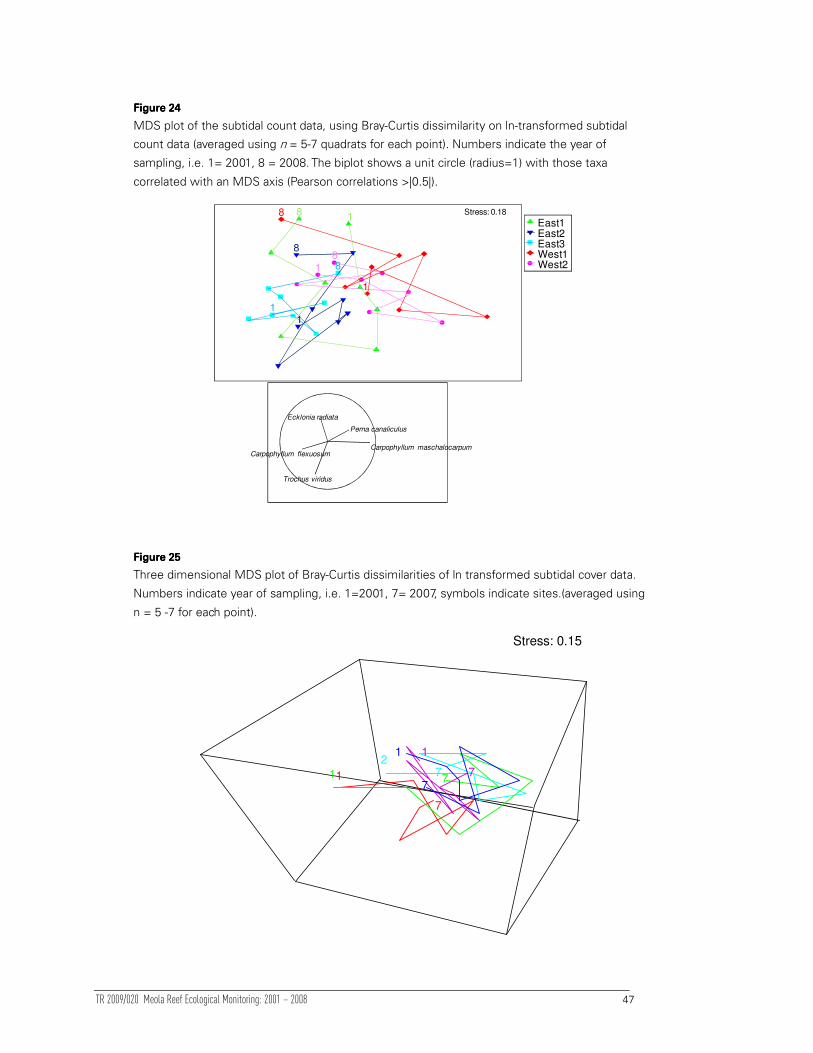
TR 2009/020 Meola Reef Ecological Monitoring: 2001 – 2008 47
Figure Figure Figure Figure 24242424
MDS plot of the subtidal count data, using Bray-Curtis dissimilarity on ln-transformed subtidal
count data (averaged using n = 5-7 quadrats for each point). Numbers indicate the year of
sampling, i.e. 1= 2001, 8 = 2008. The biplot shows a unit circle (radius=1) with those taxa
correlated with an MDS axis (Pearson correlations >|0.5|).
East1East2East3West1West2
1
1
1
8
8
8 Stress: 0.18
Carpophyllum flexuosumCarpophyllum maschalocarpum
Ecklonia radiata
Perna canaliculus
Trochus viridus
1
1
88
Figure Figure Figure Figure 25252525
Three dimensional MDS plot of Bray-Curtis dissimilarities of ln transformed subtidal cover data.
Numbers indicate year of sampling, i.e. 1=2001, 7= 2007, symbols indicate sites.(averaged using
n = 5 -7 for each point).
2
11
Stress: 0.15
11
7
7
77
7
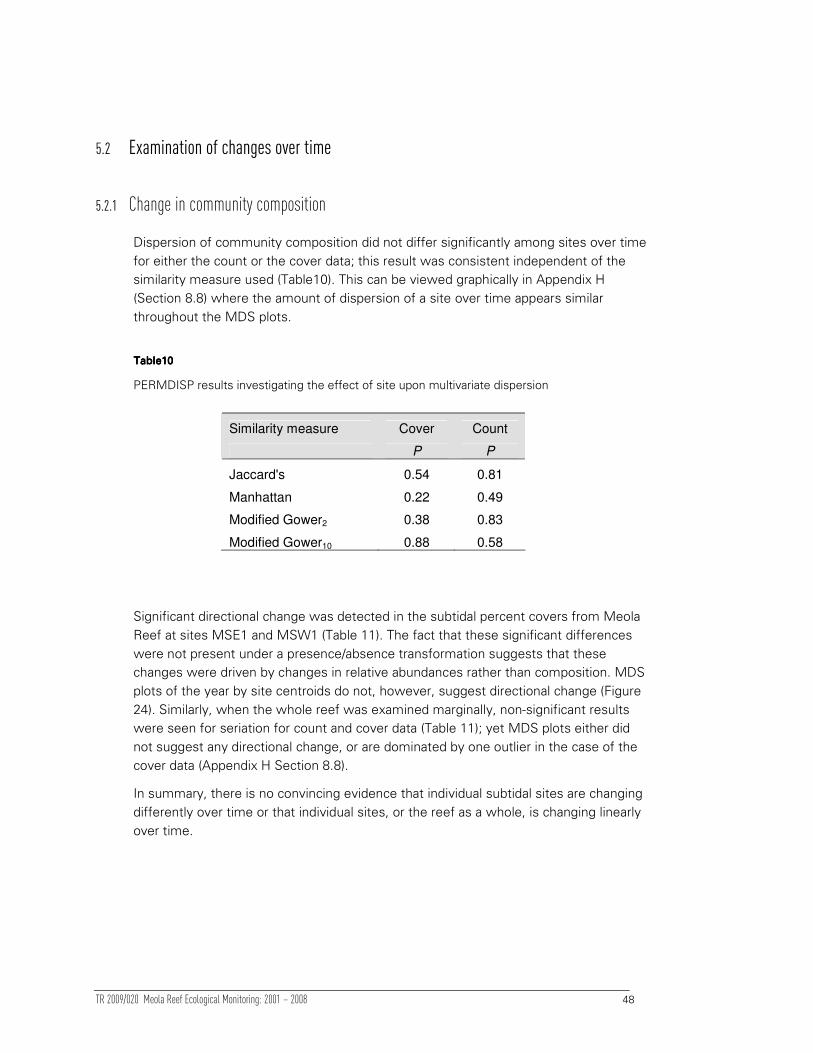
TR 2009/020 Meola Reef Ecological Monitoring: 2001 – 2008 48
5.2 Examination of changes over time
5.2.1 Change in community composition
Dispersion of community composition did not differ significantly among sites over time
for either the count or the cover data; this result was consistent independent of the
similarity measure used (Table10). This can be viewed graphically in Appendix H
(Section 8.8) where the amount of dispersion of a site over time appears similar
throughout the MDS plots.
TableTableTableTable10101010
PERMDISP results investigating the effect of site upon multivariate dispersion
Similarity measure Cover Count
P P
Jaccard's 0.54 0.81
Manhattan 0.22 0.49
Modified Gower2 0.38 0.83
Modified Gower10 0.88 0.58
Significant directional change was detected in the subtidal percent covers from Meola
Reef at sites MSE1 and MSW1 (Table 11). The fact that these significant differences
were not present under a presence/absence transformation suggests that these
changes were driven by changes in relative abundances rather than composition. MDS
plots of the year by site centroids do not, however, suggest directional change (Figure
24). Similarly, when the whole reef was examined marginally, non-significant results
were seen for seriation for count and cover data (Table 11); yet MDS plots either did
not suggest any directional change, or are dominated by one outlier in the case of the
cover data (Appendix H Section 8.8).
In summary, there is no convincing evidence that individual subtidal sites are changing
differently over time or that individual sites, or the reef as a whole, is changing linearly
over time.
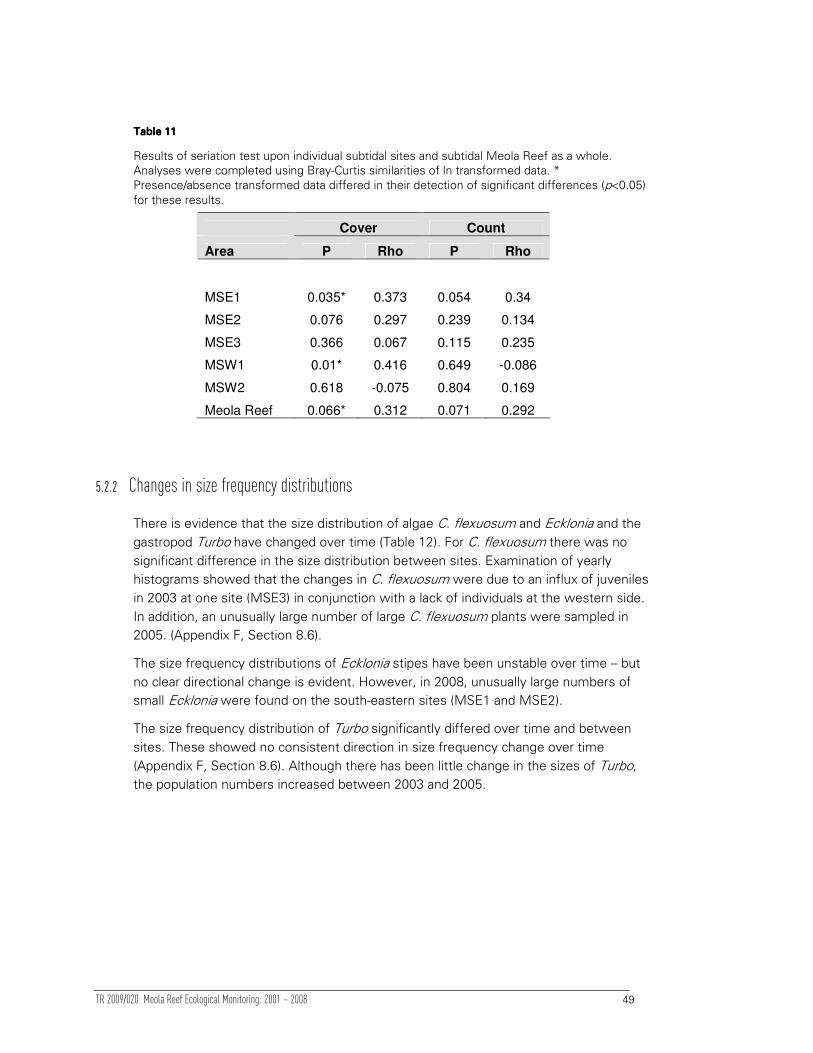
TR 2009/020 Meola Reef Ecological Monitoring: 2001 – 2008 49
Table Table Table Table 11111111
Results of seriation test upon individual subtidal sites and subtidal Meola Reef as a whole. Analyses were completed using Bray-Curtis similarities of ln transformed data. * Presence/absence transformed data differed in their detection of significant differences (p<0.05) for these results.
Cover Count
Area P Rho P Rho
MSE1 0.035* 0.373 0.054 0.34
MSE2 0.076 0.297 0.239 0.134
MSE3 0.366 0.067 0.115 0.235
MSW1 0.01* 0.416 0.649 -0.086
MSW2 0.618 -0.075 0.804 0.169
Meola Reef 0.066* 0.312 0.071 0.292
5.2.2 Changes in size frequency distributions
There is evidence that the size distribution of algae C. flexuosum and Ecklonia and the
gastropod Turbo have changed over time (Table 12). For C. flexuosum there was no
significant difference in the size distribution between sites. Examination of yearly
histograms showed that the changes in C. flexuosum were due to an influx of juveniles
in 2003 at one site (MSE3) in conjunction with a lack of individuals at the western side.
In addition, an unusually large number of large C. flexuosum plants were sampled in
2005. (Appendix F, Section 8.6).
The size frequency distributions of Ecklonia stipes have been unstable over time – but
no clear directional change is evident. However, in 2008, unusually large numbers of
small Ecklonia were found on the south-eastern sites (MSE1 and MSE2).
The size frequency distribution of Turbo significantly differed over time and between
sites. These showed no consistent direction in size frequency change over time
(Appendix F, Section 8.6). Although there has been little change in the sizes of Turbo,
the population numbers increased between 2003 and 2005.
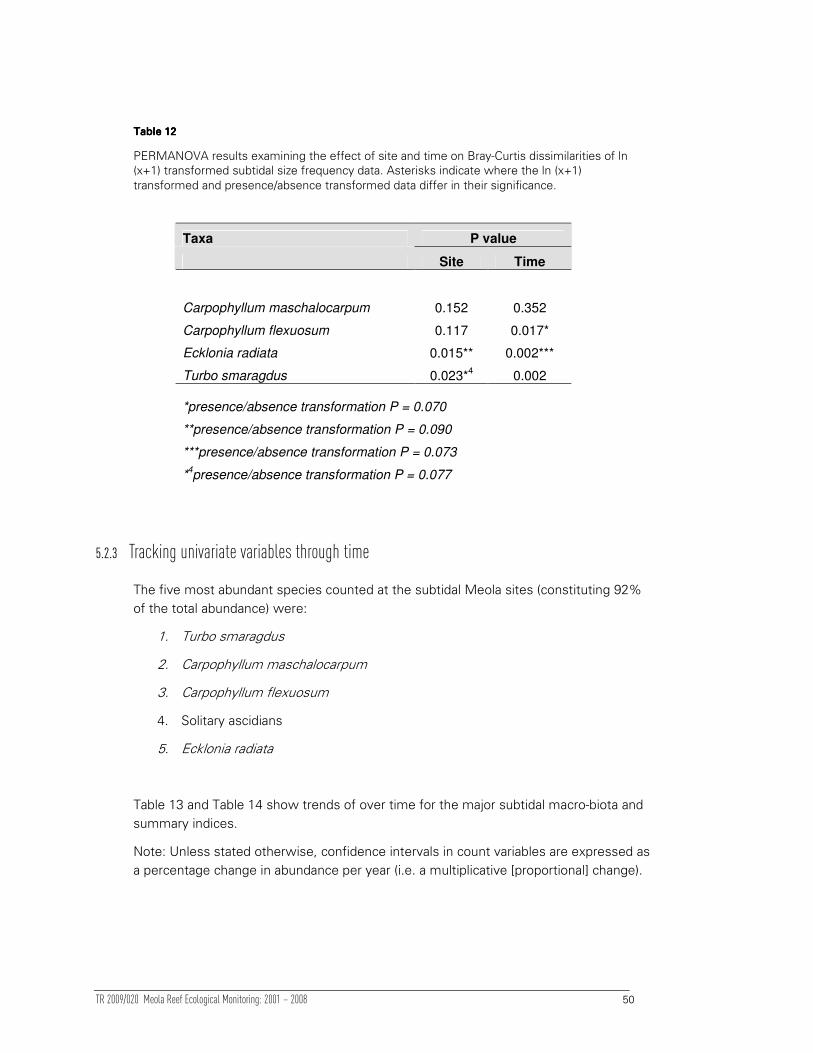
TR 2009/020 Meola Reef Ecological Monitoring: 2001 – 2008 50
Table Table Table Table 12121212
PERMANOVA results examining the effect of site and time on Bray-Curtis dissimilarities of ln (x+1) transformed subtidal size frequency data. Asterisks indicate where the ln (x+1) transformed and presence/absence transformed data differ in their significance.
Taxa P value
Site Time
Carpophyllum maschalocarpum 0.152 0.352
Carpophyllum flexuosum 0.117 0.017*
Ecklonia radiata 0.015** 0.002***
Turbo smaragdus 0.023*4 0.002
*presence/absence transformation P = 0.070
**presence/absence transformation P = 0.090
***presence/absence transformation P = 0.073
*4presence/absence transformation P = 0.077
5.2.3 Tracking univariate variables through time
The five most abundant species counted at the subtidal Meola sites (constituting 92%
of the total abundance) were:
1. Turbo smaragdus
2. Carpophyllum maschalocarpum
3. Carpophyllum flexuosum
4. Solitary ascidians
5. Ecklonia radiata
Table 13 and Table 14 show trends of over time for the major subtidal macro-biota and
summary indices.
Note: Unless stated otherwise, confidence intervals in count variables are expressed as
a percentage change in abundance per year (i.e. a multiplicative [proportional] change).

TR 2009/020 Meola Reef Ecological Monitoring: 2001 – 2008 51
Table Table Table Table 13131313
Summary of the GLMM model results for the major counted species and univariate summary indices. Significant interactions mean that reef-wide effects are not sensible. Effects in red show a negative relationship; *= p<0.05; ** = p<0.01; ***= p<0.001. st_ENSO refers to the ‘short-term ENSO’ index variable.
Reef-wide significant effects
Species Year ENSO st_ENSO Side
log(mid trap
rate)
Significant
interactions
Turbo Quadratic -(9-16)% -(19 31)%
C. maschalocarpum
206 -
224%
C. flexuosum 21-45% -(16- 37)%
Solitary ascidians Quadratic 19-42% -(25 55)%
E. radiata -(14-44)%
Total abundance 45-60% -(14-27)%
log(Algal
biomass) <see Table 14 for Side specific results> Year*Side***
Site diversity8
0.03-
0.237 0.04-0.67
Evenness
Table Table Table Table 14141414
Summary of the GLMM model results for algal biomass.
Significant effects Location
Year ENSO st_ENSO log(trap rate)
East -(8-28)% 11-73% -(30-83)% log(Algal
biomass) West
8Site diversity, evenness and algal biomass were calculated using a GLMM with identity link and Normal errors. Listed effects for these rows are therefore additive, e.g. we estimate that diversity has increased between 0.03 – 0.24 species /year.
TR 2009/020 Meola Reef Ecological Monitoring: 2001 – 2008 52
5.2.3.1 Changes in indices over time
Figure 29 show the change in total abundance, algal biomass, site diversity and evenness
(count and cover) for the subtidal data.
Salient points are summarized below:
• There was no evidence that total abundance has changed over time.
• We estimate that, on the east side of Meola, algal biomass decreased by between
8 -28% per year (there was no evidence of a change on the west side).
• There was evidence of a small increase in subtidal site diversity (between 0 to 2
species over eight years).
• There was no evidence of any unidirectional change in subtidal evenness at Meola
Reef.

TR 2009/020 Meola Reef Ecological Monitoring: 2001 – 2008 53
Figure Figure Figure Figure 26262626
Average change in total abundance (i.e. total number of organisms) for each site (standard error
bars are shown). The top right graph shows the change in total abundance averaged across the
entire reef (solid black line).
East1
0
50
100
150
2001 2003 2005 2007
East2
2001 2003 2005 2007
East3
2001 2003 2005 2007
West1
0
50
100
150
West2 All sites (averaged)
Tota
l abundance

TR 2009/020 Meola Reef Ecological Monitoring: 2001 – 2008 54
Figure Figure Figure Figure 27272727
Change in algal biomass over time – see Figure 26 for a more detailed caption description.
East1
0
50
100
150
200
250
300
2001 2003 2005 2007
East2
2001 2003 2005 2007
East3
2001 2003 2005 2007
West1
0
50
100
150
200
250
300West2 All sites (averaged)
Tota
l Alg
al b
iom
ass (
g)
Figure Figure Figure Figure 28282828
Change in subtidal diversity over time. Red lines indicate eastern sites, blue lines indicate western sites and numbers indicate their distance along the reef (1= southernmost, 3 = northernmost site).
1
1
1
1
1
1
1
1
2001 2002 2003 2004 2005 2006 2007 2008
81
01
21
41
6
Year
Sa
mp
led
Div
ers
ity
2
2 2
2 2
2
2
2
3
3
3
3
3
3
3
3
1
1 1
1
1
1
1
12
2
2
2
2
2
2 2

TR 2009/020 Meola Reef Ecological Monitoring: 2001 – 2008 55
Figure Figure Figure Figure 29292929
Change in subtidal evenness over time. Red lines indicate eastern sites, blue lines indicate western sites and numbers indicate their distance along the reef (1= most southern, 3 = most northern site).
1
1
1
11 1
11
2
2
22
2
2
2
2
3
3
3
3
3
33
3
11
1
1
1
1
1
1
2
2
2
2
2
2
2
2
3
2001 2002 2003 2004 2005 2006 2007 2008
Year
11
1
1
1
1
11
2001 2002 2003 2004 2005 2006 2007 2008
0.0
0.1
0.2
0.3
0.4
0.5
Year
Even
ne
ss In
de
x
2
2
2
2
22
22
3
3
3
3
3
3
3
31
1
1
11
11
1
2
2
2
2
2
22
2
3
Subtidal count data Subtidal cover data
5.2.3.2 Changes in macrobiotic abundances
Non-linear changes in abundance
The abundance of Turbo and solitary ascidians changed in a non-linear manner (Table
13). Figure 30 shows the approximate change in time of Turbo abundance (after
accounting for ENSO effects). There is clear non-linearity in the time series [which
was modelled by a quadratic,
i.e. E[log(Turbo abundance)] ~ b0 + b1(Year) + b2(Year2) + b3 (ENSO)].
Turbo abundance appeared to peak in 2004, and has since stabilised at a lower level.
The change was more marked at the western sites, with recent recovery in
abundance at the eastern sites (Figure 32).
In contrast, the population of solitary ascidians at all sites may be increasing again
(Figure 31) after a decline in the eastern sites in 2001 (Figure 33).

TR 2009/020 Meola Reef Ecological Monitoring: 2001 – 2008 56
Figure Figure Figure Figure 30303030
Change in time (on the log scale) of Turbo. The solid line estimates the change over time
(surrounding dashed lines showing the 95% CI [determined by bootstrapping)].
-3-2
-10
1
Year
ch
an
ge
over tim
e (lo
g s
ca
le)
2002 2004 2006 20082001 2003 2005 2007
Figure Figure Figure Figure 31313131
Change in time (on the log scale) of solitary ascidians (after accounting for the effect of
ENSO). The solid line estimates the change over time (surrounding dashed lines show the
95% CI [determined by bootstrapping)].
2002 2004 2006 2008
-10
12
3
Year
2001 2003 2005 2007
ch
an
ge
ove
r tim
e (lo
g s
ca
le)
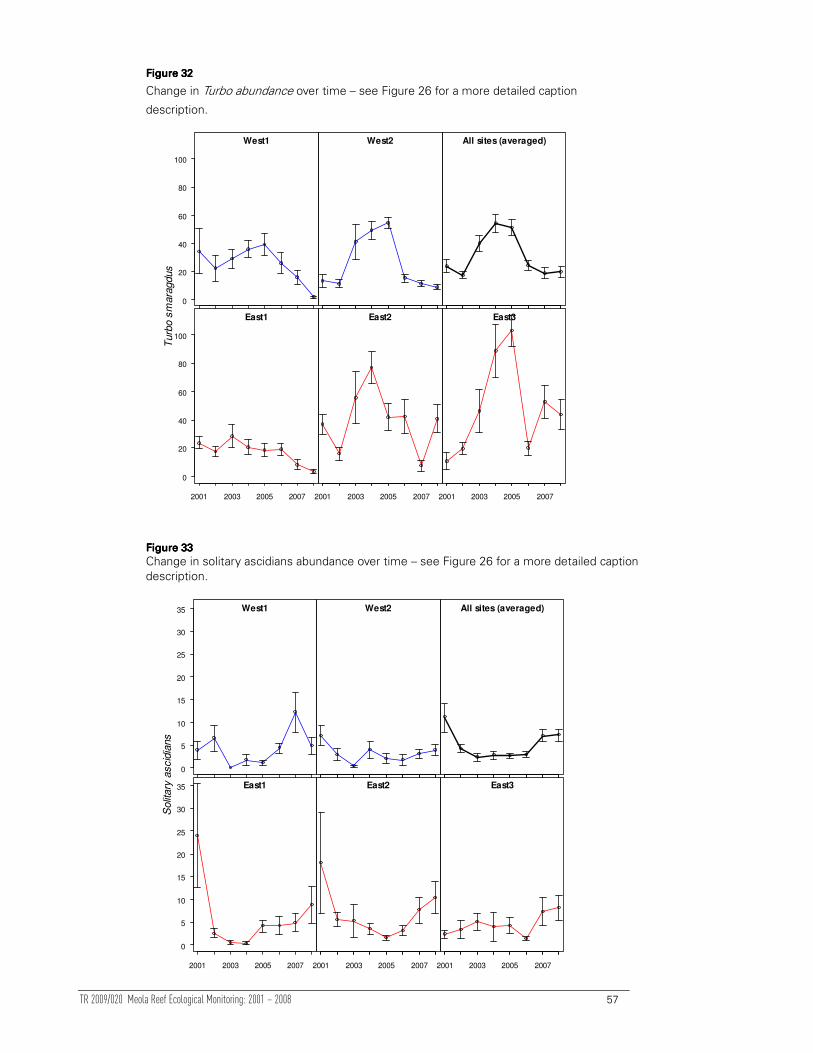
TR 2009/020 Meola Reef Ecological Monitoring: 2001 – 2008 57
Figure Figure Figure Figure 32323232
Change in Turbo abundance over time – see Figure 26 for a more detailed caption
description.
East1
0
20
40
60
80
100
2001 2003 2005 2007
East2
2001 2003 2005 2007
East3
2001 2003 2005 2007
West1
0
20
40
60
80
100
West2 All sites (averaged)
Turb
o s
mara
gdus
Figure Figure Figure Figure 33333333
Change in solitary ascidians abundance over time – see Figure 26 for a more detailed caption description.
East1
0
5
10
15
20
25
30
35
2001 2003 2005 2007
East2
2001 2003 2005 2007
East3
2001 2003 2005 2007
West1
0
5
10
15
20
25
30
35 West2 All sites (averaged)
Solit
ary
ascid
ians

TR 2009/020 Meola Reef Ecological Monitoring: 2001 – 2008 58
Changes in algal abundance
Salient points are summarized below:
• There is no evidence of a trend in the abundance of C. maschalocarpum (Figure 34)
or C. flexuosum. However, there was a large, transitory spike in the abundance C.
flexuosum in 2003 at one site (Figure 35, East3). The increase in abundance was
caused by an influx of juveniles (<20 cm long) – see Appendix F, Section 8.6.7.
• Ecklonia abundance has been increasing since 2005. Changes have been principally
due to the large increase in numbers in 2008 at the eastern sites (Figure 36, East1
and East2), although the western sites also show modest increases.
Figure Figure Figure Figure 34343434
Change in Carpophyllum maschalocarpum abundance over time – see Figure 26 for a more
detailed caption description.
East1
0
20
40
60
80
2001 2003 2005 2007
East2
2001 2003 2005 2007
East3
2001 2003 2005 2007
West1
0
20
40
60
80
West2 All sites (averaged)
Carp
ophyllu
m m
aschalo
carp
um

TR 2009/020 Meola Reef Ecological Monitoring: 2001 – 2008 59
FigureFigureFigureFigure 35353535
Change in Carpophyllum flexuosum abundance over time – see Figure 26 for a more detailed caption description.
East1
0
20
40
60
80
2001 2003 2005 2007
East2
2001 2003 2005 2007
East3
2001 2003 2005 2007
W est1
0
20
40
60
80
W est2 All sites (averaged)
Carp
ophyllu
m fle
xuosum
Figure Figure Figure Figure 36363636
Change in Ecklonia radiata abundance over time – see Figure 26 for a
more detailed caption description.
East1
0
2
4
6
8
10
2001 2003 2005 2007
East2
2001 2003 2005 2007
East3
2001 2003 2005 2007
West1
0
2
4
6
8
10
West2 All sites (averaged)
Ecklo
nia
radia
ta

TR 2009/020 Meola Reef Ecological Monitoring: 2001 – 2008 60
5.3 Relationship between temporal change and environmental factors
5.3.1 Multivariate analyses
When the entire data set was considered, MEI measures were usually correlated with
patterns in count or cover data However, this pattern was not seen when the reduced
data set (see Section 3.4.3.1) was examined (Table 15).
Table Table Table Table 15151515
Results of DISTLM analyses relating environmental variables to Bray-Curtis dissimilarities of subtidal count and cover data. Environmental variables used were: the MEI calculated across the whole region as both a short (calculated from the month prior to sampling) and medium (calculated from the year prior to sampling) range term. Environmental variables used at the site by year level were % cover (= the average percentage cover of sediments at each year by site combination), the average trap rate, average percentage of fines in the trap and the average weight of fines in the trap. These variables were all calculated as both short and medium range measures (as outlined for the MEI). p/a = presence/absence. Two sets of data were used: all biological data (n = 40 sites) regressed against the three environmental variables where a complete data set was available (MEI medium and short and % cover) and a subset of the sites (n = 29) regressed against all environmental variables.
All data
Response Trans Factor P % Var.
Count data In MEI mid 0.002 0.113
Count data p/a MEI mid 0.012 0.066
MEI short 0.008 0.129
Cover data In MEI mid 0.001 0.106
MEI short 0.001 0.198
% cover 0.010 0.252
Cover data p/a % cover 0.006 0.080
A subset of the data regressed against all factors
Response Trans Factor P % Var.
Count data In trap rate mid 0.019 0.091
Count data p/a % cover 0.116 0.061
Cover data In % cover 0.001 0.136
Cover data p/a % cover 0.029 0.077
trap rate mid 0.052 0.143

TR 2009/020 Meola Reef Ecological Monitoring: 2001 – 2008 61
The changes in model structure between the two data sets suggest that the
correlations seen with the full data set were driven by strong correlations between
community structure and MEI measures in 2001 and 2002 (which were excluded from
the reduced analysis). Unsurprisingly, the percentage cover of sediments played an
important role in determining community composition, particularly of cover types
(excluding sediment itself). The only other variable significantly correlated with
community composition was the medium-term trap rate, suggesting that the amount
of sediment settling from the water column at a site can influence community
composition. Notably, none of these models explain more than 25% of the variance in
the community composition. Therefore, although correlations exist between the
factors quantifying climate and sediment deposition at this site, there is much variance
in community composition that remains unexplained. These correlations were further
investigated in the univariate analyses.
5.3.2 Univariate analyses
5.3.2.1 ENSO effects
There is evidence that all five major subtidal taxa appear to be affected by ENSO in
some manner (see Table 13). We estimate that total abundance increases by 45-60%
with each unit increase in the short-term ENSO, i.e. total abundance appears to be
higher during El Niño years. This relationship between total abundance and short-term
ENSO appears to be mainly driven by the large increase in C. maschalocarpum (206-
224%) for each unit increase in short-term ENSO. We estimate that C. flexuosum also
increases in El Niño years (by 21-45% for each unit increase in short-term ENSO).
Similarly, there is evidence that a unit increase in medium-term ENSO is correlated
with an increase of 19-42% in the population of solitary ascidians. There is evidence
that medium-term ENSO affects algal biomass on the east side of Meola. We estimate
that the average algal biomass on the east side increases by 11-73% per unit increase
in medium-term ENSO. There is no evidence that ENSO affects algal biomass on the
west side of the reef.
In contrast, there is evidence that Ecklonia decreases by 14-44% given a unit increase
in short-term ENSO. A decrease in the abundance of the subtidal Turbo population was
also found in El Niño years (a decrease of 9-16% per unit increase in medium-term
ENSO) (this contrasted to the intertidal Turbo population, which appeared to increase
in El Niño years).
There is evidence that ENSO affects the trap rate. We estimate that a unit increase in
MEI decreases the trap rate by up to 28%.

TR 2009/020 Meola Reef Ecological Monitoring: 2001 – 2008 62
5.3.2.2 Trapped sediment rate
There has been a decline in the rate of sediment trapped at Meola Reef over time,
although a few unusual rates did occur on the west side (see Figure 37). We estimate
that the trapping rate has declined by 0-1.5% per month.
There is evidence that an increase in trapped sediment negatively affects total
abundance. We estimate that a unit increase in log (medium-term trap rate) decreases
the total abundance by 14-27%. Such an increase in the trap rate would also lead to
decreases in: the sub-tidal Turbo population (19 -31%), C. flexuosum (16-37%), and
solitary ascidians (14 -27%).
The effect of the trap rate on algal biomass depended on the side of the reef. Although
there is no evidence that the trap rate affects algal biomass on the west side of the
reef, we estimate that as the (log) trap rate increases by one unit on the east side, the
algal biomass decreases by between 30 - 83%.
Figure Figure Figure Figure 37373737
Scatter plot showing the change in log (trapped sediment trap rate) over time.
MSE1 MSE2 MSE3
MSW1 MSW2
-6
-5
-4
-3
-2
-1
MSE1 MSE2 MSE3
MSW1 MSW2
MSE1 MSE2 MSE3
MSW1 MSW2
-6
-5
-4
-3
-2
-1
Date
log
tra
p r
ate
[gm
/(cm
2.d
ay
-1)]
Jan-02
Jan-03
Jan-04
Jan-05
Jan-06
Jan-07
Jan-08
Jan-02
Jan-03
Jan-04
Jan-05
Jan-06
Jan-07
Jan-08
Jan-02
Jan-03
Jan-04
Jan-05
Jan-06
Jan-07
Jan-08
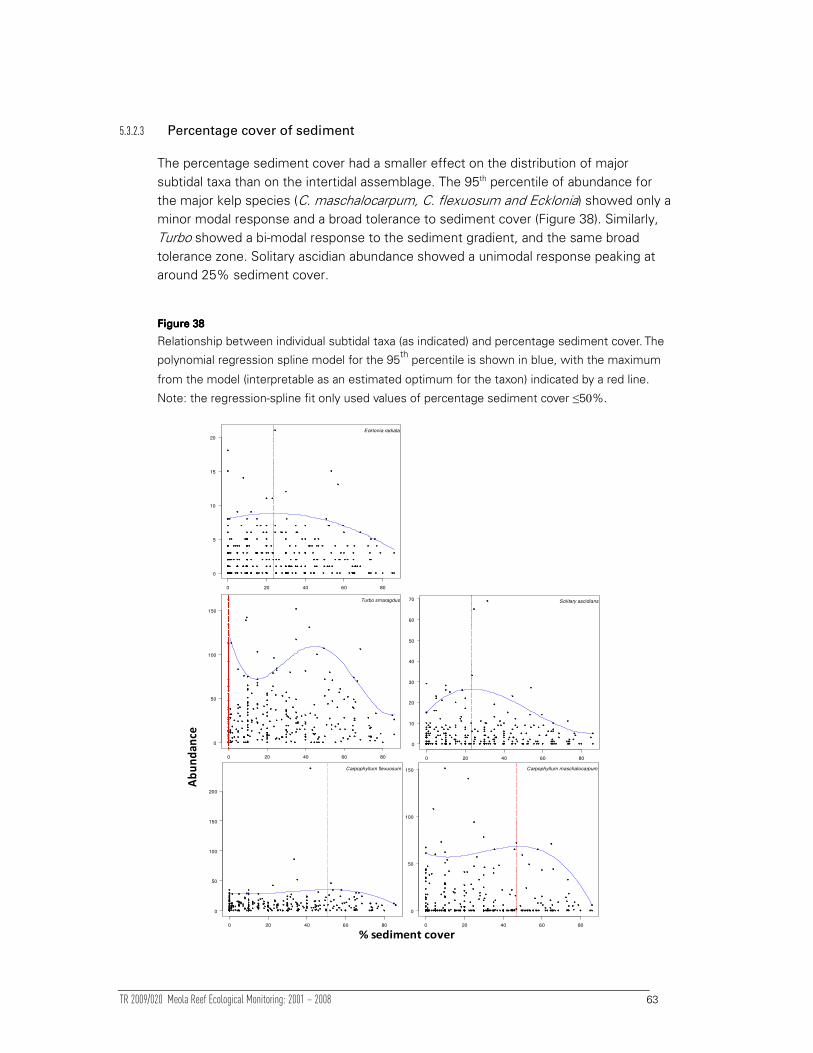
TR 2009/020 Meola Reef Ecological Monitoring: 2001 – 2008 63
5.3.2.3 Percentage cover of sediment
The percentage sediment cover had a smaller effect on the distribution of major
subtidal taxa than on the intertidal assemblage. The 95th percentile of abundance for
the major kelp species (C. maschalocarpum, C. flexuosum and Ecklonia) showed only a
minor modal response and a broad tolerance to sediment cover (Figure 38). Similarly,
Turbo showed a bi-modal response to the sediment gradient, and the same broad
tolerance zone. Solitary ascidian abundance showed a unimodal response peaking at
around 25% sediment cover.
Figure Figure Figure Figure 38383838
Relationship between individual subtidal taxa (as indicated) and percentage sediment cover. The
polynomial regression spline model for the 95th percentile is shown in blue, with the maximum
from the model (interpretable as an estimated optimum for the taxon) indicated by a red line.
Note: the regression-spline fit only used values of percentage sediment cover ≤50%.
0 20 40 60 80
0
50
100
150
Turbo smaragdus
0 20 40 60 80
0
50
100
150 Carpophyllum maschalocarpum
0 20 40 60 80
0
50
100
150
200
Carpophyllum flexuosum
0 20 40 60 80
0
10
20
30
40
50
60
70 Solitary ascidians
0 20 40 60 80
0
5
10
15
20
Ecklonia radiata
% sediment cover
Ab
un
da
nce

TR 2009/020 Meola Reef Ecological Monitoring: 2001 – 2008 64
6 Discussion
6.1 Characterisation of sites at Meola Reef
Spatial patterns in assemblages were present at Meola Reef, but these were more
marked in the intertidal area than the subtidal.
6.1.1 Intertidal sites
Intertidal sites were distinguished from each other by changes in both count and cover
variables. For example, site MIE1 was characterised by relatively high abundance of
Zeacumantus and Melagraphia, and high percentage cover of Gelidium relative to other
sites (see Section 4.1 for a full listing of characteristic site taxa).
The compositional differences of the site assemblages make sense when considering
the interaction between the physical locale and the biology of the organisms. For
instance, the most even communities were found closest to the southern shore (Table
6). This probably reflects the mixture of soft-sediment species (Zeacumantus, Diloma
and C. glandiformis) and hard substrate taxa present at these sites. By contrast, sites
further from the southern shore were dominated by Anthopleura, Turbo,
Sypharochiton and Melagraphia, species more typical of intertidal rocky reef habitats
(Morton and Miller, 1968). The southern communities, that were the most sheltered
from the dominant south-westerly winds (sites MIE1 and MIE2) (Hessell 1988), should
also be the most wave-sheltered. These sites were characterised by the soft-sediment
grazers Zeacumantus, Diloma and the scavenging whelk C. glandiformis, species that
are most common on sheltered mudflats (Morton and Miller, 1968). The high densities
of these mudflat species on Meola Reef are probably from their spread via the
sediments overlying the rocky reef onto this relatively sheltered part of the reef. High
cover of Gelidium was also seen close to the shore (MIE1, MIE2 and MIW1). It is likely
that the habitat becomes too exposed for this alga as distance from the shore
increases, as its distribution is confined to cracks and fissures on very exposed rocks
(Adams 1994).
A significant increase in Turbo abundance was seen on the northern sites of the more
exposed, west side of Meola Reef. Turbo is a deposit feeder that feeds on detritus,
microalgae and bacteria (Alfaro et al 2007). It is known to be better adapted to the
sublittoral fringe than the intertidal zone (Walsby 1977, Creese 1988); therefore, its
increasing density at the northern sites is likely to be due to the position of these sites
further down the intertidal zone. Certain other species also attain their highest
densities at sites 2 and 3, further north. The filter feeding anemones (Anthopleura and
Diadumene) and barnacles are likely to be increasing in response to increasing water
depth and flow, which will increase the amount of food available.

TR 2009/020 Meola Reef Ecological Monitoring: 2001 – 2008 65
6.1.2 Subtidal sites
No consistent patterns were visible at any site in terms of either subtidal count or
cover data. All sites were numerically dominated by brown algae, Turbo and solitary
ascidians. In terms of cover, the dominant classes were unconsolidated substrates
(sand, gravel, shell or sediment), coralline turf and bare rock.
Size frequency data were not explicitly examined in terms of characterising sites and
little data exists on expected size frequency changes for these taxa over such small
spatial scales. A cursory investigation, however, reveals that our measurements agree
with the few established patterns. Generally, the size of Turbo should increase with
depth (Walsby 1977), and C. flexuosum at sheltered locations exhibited a ‘long, bushy’
growth form (Cole et al 2001). The average size of Turbo at Meola Reef in the intertidal
(13 mm) was smaller than that in the subtidal (18 mm). Additionally, C. flexuosum
plants were up to 4.4 m in length at Meola Reef with an average length of 75 cm, in
the expected long bushy morphology.
6.2 Assessment of change over time
Due to the short time series of this data, any significant results detected in this section
should be interpreted cautiously. Annual sampling means that the intertidal and
subtidal time series contain only seven and eight different time points respectively; as
a consequence, the chances of detecting a spurious correlation are high. For example,
previously published time series analyses looking for biological effects of ENSO have
used at least a decade worth of data (Dayton and Tegner 1984, Strub et al 1985).
However, although the parameter estimates quantifying the effect of ENSO may not
be robust (the confidence intervals around the parameters were typically quite wide),
the inclusion of ENSO as a parameter in the univariate models helped to remove
cyclicity in the data, thereby aiding in the identification of linear trends over time.
Moreover, with continued sampling should give greater precision and accuracy when
determining the effects of long-term climate changes on the biota.
6.2.1 Intertidal change
Intertidal sites closest to the southern shore (MIE1, MIE2, MIW1 and MIW2) generally
showed the highest temporal stability in terms of both count and cover measures.
Intertidal site diversity appeared to increase with El Niño conditions; this increase is,
however, only on the scale of a maximum ± of 0.3 species per site. The ENSO cycle is
important to New Zealand’s climate but only explains ~25% of the year-to-year
variance in rainfall and temperature (Mullan 1996).

TR 2009/020 Meola Reef Ecological Monitoring: 2001 – 2008 66
The intertidal population of two gastropods, Melagraphia and Turbo, decreased in
abundance over time. However, the rate of decline for both species was small. With
Turbo, there was evidence of a cyclical change over time (even after correcting for
ENSO effects), so a longer time series is required to determine if the reef-wide decline
in abundance is part of a cyclic pattern. No clear, directional changes in size frequency
distributions were found in any of the measured intertidal invertebrates.
Site specific correlations were also seen between some intertidal fauna and indices
(Xenostrobus, Elminius and total abundance) and the ENSO. If correct, these
correlations are likely to reflect differential wave action on the reef over time that could
dislodge animals or remove sediment differentially between sites or sides of the reef.
6.2.2 Subtidal change
For the subtidal communities, there is no convincing evidence that any individual
subtidal site communities or the reef as a whole is changing over time. The abundance
of the macroalgae at Meola Reef (C. maschalocarpum, C. flexuosum) have all been
relatively stable, and the numerically dominant invertebrate, Turbo, has exhibited a
stable, if cyclical, distribution of abundance.
Although algal biomass on the west side of Meola Reef (where the algal bed is narrow)
has been stable, the extensive C. flexuosum beds (the dominant contributor to algal
biomass at Meola) on the eastern side of the reef peaked in 2005, a year when a
number of unusually large individuals were surveyed at one site (MSE1). It is likely that
algal biomass on the west side of the reef is limited by abrasion of C. flexuosum on
oysters, as the algal band is directly adjacent to the intertidal in many places.
Therefore, extremely long individuals are not found here. On the east side, however, if
conditions are favourable, the more extensive beds can support much longer
individuals (greater than 4 m, Appendix F, Section 8.6.7), which dominate the biomass.
The changes in biomass were correlated with ENSO and the trap sedimentation rate.
Positive and negative correlations were observed between the short-term measures of
ENSO and densities of the algae. The numbers of both C. maschalocarpum and C.
flexuosum increased and the numbers of Ecklonia decreased. Unfortunately, simple
correlations between water temperature and algal recruitment or growth are difficult to
make due to the interaction of other factors such as light and nutrients, e.g., the
optimum algal growth conditions for Ecklonia are best described in terms of light,
nutrients and temperature (13-16°C, where the average daily quantum dose of light
exceeds 200 aE.cm-2 and when there is high nutrient availability (Taylor 1981).
Moreover, although the climactic processes that cause changes in algal beds are either
(i) direct (i.e. physical dislodgement or individual mortality) or (ii) indirect (i.e. growth,
recruitment inhabitation/facilitation); it is known that these factors depend on various
dynamics within the algal communities. For example, algal canopies are known to
inhibit algal recruitment, probably via limiting both space and light (Schiel 1988).
Therefore gaps in the canopy are an important opportunity for changes in algal
composition. Recruitment to these gaps is likely to be influenced by spore availability,

TR 2009/020 Meola Reef Ecological Monitoring: 2001 – 2008 67
sediment cover, herbivory and competition amongst spores (Schiel 1988, Schiel et al
2006). In the shallow, turbid environment of the Waitemata Harbour, factors such as
pre and post-settlement survival are likely to play an important role in determining algal
composition.
Although individuals of C. flexuosum may be long, the attachment to their holdfast is
relatively weak (pers. comm. J. Walker), and those plants of the eastern side of the
reef that become dislodged are likely to entangle and dislodge other plants. Such a
process has been recorded from other algal forests (Dayton et al 1984, Dayton, 1985,
Sharp 1989).
Size frequency distributions of the C. flexuosum were significantly different between
some years. However, these differences were found to reflect either a temporary
influx of juveniles at a single site in a single year (site MSE3 in 2003), rather than any
sustained, reef-wide population change over time. Similarly the other macroalgae
exhibiting change in its size distribution was Ecklonia - again no clear directional
change in the size distribution is evident. However, Ecklonia abundance has increased
in recent years (particularly at the south-eastern sites) and unusually large numbers of
small Ecklonia were found on the south-eastern sites (MSE1 and MSE2) in 2008.
Future surveys are needed to determine if this change is a temporary or cyclical one.
The abundances of both Turbo and solitary ascidians appeared to change significantly
depending on ENSO, but this may be due to contrasting mechanisms. The decrease in
subtidal Turbo abundances during El Niño years contrasts with the results for the
intertidal population, which increased during El Niño years (Section 6.2.1). This
difference between the intertidal and subtidal supports the mechanism of movement
as being responsible for this pattern. For example, if subtidal and intertidal Turbo can
be considered one population, then weather conditions that lead to dislodgement from
the intertidal increase densities in the subtidal, or conditions conducive to upwards
migration lead to increases in density in the intertidal and decreases in the subtidal
population. In contrast, ascidians are sedentary, and therefore a reproductive response
is the only way they could be responding positively to ENSO. Solitary ascidians can
grow 40% in volume over 80 days from a length of 0.5 to 1.5 cm (Robbins 1985), so it
is feasible that new recruits are growing to a detectable size in response to good
conditions (relevant longevity and reproductive information could not be located for
this taxon).
A small linear increase in site diversity was seen over time - that equates to an
increase of approximately 1 taxon per site over the 7 years of the subtidal monitoring
period. Given the invasion of four recorded taxa in the subtidal zone over the
monitoring period (Section 6.3.1)9, two of which are relatively common (Tethya and
Cliona), this trend could be easily explained by invasive organisms.
9 Charybdis was only sighted and Diadumene was only recorded intertidally.
TR 2009/020 Meola Reef Ecological Monitoring: 2001 – 2008 68
6.3 Comparison of communities at Meola Reef to those at Long Bay
Meola Reef is unique in the Auckland Region, so direct quantitative comparisons are
not realistic, especially for the intertidal community. However, qualitative comparisons
can be made between the subtidal community surveyed at Meola Reef by the MRMP
and the subtidal community surveyed at Long Bay by the LBMMP. Probable reasons
for the differences between time series changes for the different reefs should firstly
be recognised.
1. Meola Reef exists in more turbid and wave-sheltered waters than the Long
Bay reefs, but it is also more influenced by currents. Therefore a higher
average density of C. flexuosum and Turbo at Meola Reef compared to that
seen in the LBMMP is expected, as these taxa favour more sheltered
conditions (Morton and Miller 1968, Walker 1999, Shears and Babcock 2004).
2. Carpophyllum maschalocarpum and C. flexuosum populations have been
comparatively stable at Meola Reef compared. In contrast the LBMMP has
shown a decline in C. maschalocarpum and a corresponding increase in C.
flexuosum. Although the mechanisms behind the changes in the LBMMP are
unknown, changes seem likely to be dependent upon recruitment competition
after some sort of community disruption (e.g. storm events). As notes in (1)
above, Meola Reef is more sheltered than the LBMMP, so it may not have
been impacted by any storm events that have altered the LBMMP reefs.
3. Meola Reef supports a less diverse community than that seen in the LBMMP
The species list for count data at Long Bay contains 69 taxa and the same list
for Meola Reef contains only 43 taxa. This lower diversity at Meola Reef is to
be expected, because the reef is smaller and more isolated than the LBMMP
reefs, and therefore the chances of encountering rare species are lower.
4. Some species commonly found in the LBMMP are virtually absent at Meola
Reef. In the LBMMP, C. plumosum, Zonaria turneriana and the gastropod
Cookia sulcata attain average densities of approximately 7, 19 and 0.5 per
quadrat, respectively. At Meola Reef, only a few individuals of C. plumosum
have been found and Cookia and Zonaria have only ever been found once
each. C. plumosum has a preference for sheltered areas (this species is
absent on the West Coast of the North Island and in Cook Strait (Morton and
Miller, 1968). The absence of C. plumosum from the relatively current-exposed
Meola Reef is therefore not surprising. Not enough is known about the
ecology of Cookia or Zonaria to ascertain whether increased current, increased
turbidity or reproductive isolation are the likely cause of their near absence at
Meola Reef.
Meola Reef showed a generally stable community over time. Other than the
macroalgal changes mentioned in (2) above, the LBMMP community also showed
some fluctuations in relatively rare species, i.e. increasing average abundances of
Coscinasterias muricata, solitary ascidians, Buccinulum lineum and Cystophora sp. and
decreasing average abundances of C. virgata, Dicathais orbita and Sargassum sinclairii

TR 2009/020 Meola Reef Ecological Monitoring: 2001 – 2008 69
(Anderson et al 2005). A similar increase over time at Meola Reef was observed for
counts of solitary ascidians (with the exclusion of high counts in 2001) and a decrease
was also observed for counts of Sargassum. Coscinasterias showed a decrease at
Meola Reef over the same period that it was increasing at the LBMMP. However,
Buccinulum has had very stable abundance over time at Meola Reef which contrasts
with the results for the LBMMP, where counts of Buccinulum have been increasing.
Only three individuals of the gastropods C. virgata and Dicathais orbita have ever been
found at Meola Reef (and none of the algae Cystophora spp.) therefore these taxa
were not compared. These data suggest that the processes that are causing changes
over time in the LBMMP are probably not impacting all the species at Meola Reef in
the same way.10
6.3.1 Interpretation of community shifts
Sedimentation is measured at Meola Reef both using percentage cover and sediment
traps.11 Intertidal sediment cover on the west side of the reef was linearly decreasing
and on the east side of the reef it was negatively correlated with the ENSO cycle. This
ENSO correlation means less sediment cover on the eastern side of the reef when
there are more winds from the west and south and cooler temperatures (i.e. El Niño
years) (Mullan 1996). Sedimentation into traps (as measured by the medium trap rate)
linearly decreased over time but also showed some evidence of a negative relationship
with the previous month’s value for ENSO. These trap values contained 58-62 different
time points (depending on the site); therefore this pattern is more robust than the
biological relationships we observed with ENSO. The ENSO correlation is somewhat
counter to that expected, i.e. with increased wave action and colder water
temperatures, less sediment settled. This could be because either less rain in El Niño
conditions generates less sediment runoff, or more hydrodynamically active conditions
keep sediment in suspension.
On average, the trap rate on the western side is higher. This may be caused by the
long fetch with this dominant wind direction. This fetch may allow sediment to be
resuspended from the shallow bed or kept in suspension until it reaches the western
side of Meola Reef. This sediment might then preferentially settle on the western side
at low tide due to the barrier that Meola Reef forms across the harbour. The effect of
surrounding land and harbour influences may also be important in influencing sediment
loading on Meola – there are a number of tributaries to the west that discharge in to
the upper Waitemata harbour (e.g. Te Atatu and Greenhithe).
We have compared these sedimentation measures to measures of faunal diversity,
abundance, evenness, composition and important individual taxa. Spline curves have
been used to show population level responses to percentage sediment cover (which
were clearly non-linear). A generalised linear mixed modelling approach was used to
relate the most useful component of the trap information (average trap rate per site
10 Note: ENSO effects have not yet been examined in the LBMMP so these cannot be compared 11 Sediment traps were only employed in the subtidal.

TR 2009/020 Meola Reef Ecological Monitoring: 2001 – 2008 70
over the year preceding sampling) to individual taxa densities after any accounting for
trends or ENSO effects.
As the amount of trapped sediment increases, declines are seen in total densities and
densities of solitary ascidians, C. flexuosum and Turbo; this is the same general
pattern observed in the spline curves examining abundance vs. percentage sediment
cover gradient (see Section 4.3.2.1 and Section 5.3.2.3). This suggests that the
present rates of sediment flux (as measured by trap rates) influence the densities of
some species, in addition to the influence of current sediment cover on the substrate.
Alternately, the sediment trap deposition rate may be a good proxy for year round
sediment cover, because the annual sediment cover measure may be influenced by
the weather conditions immediately preceding sampling. Several mechanisms
associated with sedimentation could be responsible for the measured declines in
abundance:
1. Feeding could be inhibited, which could in extreme cases lead to mortality. For
example, growth of the filter feeding solitary ascidians has been seen to
decline with increasing sediment concentration in the water (Robbins 1985).
2. Alternatively, recruitment may be affected, as some hard-substrate species
will not recruit to sediment-covered reef, e.g. the algae Sargassum on coral
reefs (Fabricius and De’ath 2001). The longevity of species such as Turbo and
the relatively stable size structure of these populations suggest that adult
populations are probably remaining relatively unchanged. Juveniles are usually
more susceptible to sediment impacts, e.g. the juvenile sea urchin Evechinus
chloroticus (Walker 2007). It is likely that the declines in solitary ascidians, C.
flexuosum and Turbo are, therefore, due to poor recruitment events in high
sediment deposition periods, rather than declines in adult populations.
The relationship between sediment cover and population densities (see Figure 16 and
47) is useful for predicting what changes may occur in community composition as
sediment cover increases. Of the major intertidal and subtidal populations tested, only
Onchidella increased with increasing sediment cover. Onchidella was the only
monitored organism solely found on sediment substrate at Meola Reef (pers. obs.) All
other intertidal species show a decline in abundance with increasing sediment cover -
even Zeacumantus, which is often described as a soft-shore species (Morton and
Miller 1968), exhibited a unimodal response to sediment cover. This suggests that
increasing sediment cover is likely to result in a decline in the intertidal species
presently inhabiting Meola Reef.
In general, the major subtidal macrofauna and flora showed a greater tolerance to
sediment cover than the major intertidal species. Notably, the subtidal Turbo
population showed a considerably wider range of tolerance to sediment cover than its
intertidal counterpart. This pattern is expected, as algae, can provide extra substrate
and a refuge from the impacts of sediment deposition on the seabed. Therefore, as
long as algal cover is retained, sediment impacts are likely to be less marked in the
subtidal than in the intertidal for grazing gastropods.
TR 2009/020 Meola Reef Ecological Monitoring: 2001 – 2008 71
Toxic urban pollutants were not measured on a scale or at locations that are
compatible for analysis with the MRMP data. If ecologically significant declines or
increases in taxa were seen we could attempt to correlate harbour-wide pollutant
patterns with known susceptibilities or life histories of the affected taxa. As these
declines were not seen, this was not investigated further.
Six taxa of invasive species have previously been identified at Meola Reef. In addition,
in 2007 the crab Charybdis, and in 2008 the tunicate Styela clava, were identified at
Meola Reef in low numbers. Of the eight invasive taxa identified, Crassostrea
continues to be numerically and structurally dominant in the intertidal, as it has been
since the inception of the MRMP (Ford et al 2006). There is no mention of Crassostrea
at Meola Reef in Morton and Miller (1968), but by 1983 it was widespread there
(Dromgoogle and Foster 1983). Cliona and Tethya have been recorded in the subtidal
areas with low percentage covers (averages of 0.477 and 0.139% cover, respectively,
Appendix E, Section 8.4.3) every year from 2002. Diadumene has been present
consistently since 2004. Chaetopterus was only recorded in two subtidal quadrats in
2005. Thus far, none of these invasive organisms have shown an ecologically
concerning pattern of increasing density or percentage cover over the monitored
period. Interestingly, the oyster bed provides a structural matrix that probably shelters
a higher diversity than the bare rock, or possibly even the worm reefs that preceded it
(Morton and Miller 1968), as habitat heterogeneity is known to promote diversity
(Tokeshi 1999). Therefore, the loss of this particular invasive organism would probably
result in additional diversity losses, at least in the short-term until other biological reefs
develop.
6.4 Recommendations
1. This monitoring programme should be continued in its present form. The time
series is becoming sufficiently long to attempt correlating important inter-
annual climatic phenomena with biological patterns. However, the correlations
shown thus far (with ENSO) are not robust, due to the current short time span
of the monitoring programme. A longer time series of data is needed so that
any decline or improvement in this SOE monitoring site can be placed in an
appropriate temporal context.
2. We have found very few trends in the MRMP. These include (i) a general
decrease in sediment trap rate, (ii) a decrease in the gastropod, Melagraphia
and (iii) a decrease in algal biomass on the eastern side of the reef. Although
the change in Melagraphia has been relatively small (and most sites have
shown an increase in the 2007 survey), the decrease in algal biomass is cause
for some concern and should be examined carefully in the future.

TR 2009/020 Meola Reef Ecological Monitoring: 2001 – 2008 72
7 References Adams, N. (1994) Seaweeds of New Zealand: an illustrated guide, Vol. Canterbury
University Press, Christchurch.
Airoldi, L. (2003) The effects of sedimentation on rocky coastal reef assemblages.
Oceanography and Marine Biology: an Annual Review 41: 161-236.
Airoldi, L. and Virgilio, M. 1998. Responses of turf-forming algae to spatial variations in
the deposition of sediments. Marine Ecology Progress Series 165: 271-282.
Akaike, H. 1973. Information theory as an extension of the maximum likelihood
principle. pp. 267-281 in Petrov, B.N. and Caski, F. (eds.). Proceedings, 2nd
International Symposium on Information Theory. Budapest, Akademiai Kiado.
Alfaro, A.D.E.S. and François, T. (2007) Food and habitat partitioning in grazing snails
(Turbo smaragdus ), Northern New Zealand Estuaries and Coasts 30:431-440.
Anderson, M.J. 2001. A new method for non-parametric multivariate analysis of
variance. Austral Ecology 26: 32-46.
Anderson, M. J., Stewart, M., R. B. Ford, Williams, C. 2005. Long Bay Marine
Monitoring Programme Report 2005, Auckland UniServices Limited. Report
prepared for Auckland Regional Council, Auckland, New Zealand: 97pp.
Anderson, M.J. (2003) DISTLM v.2: a FORTRAN computer program to calculate a
distance-based multivariate analysis for a linear model, Department of
Statistics, University of Auckland.
Anderson, M.J. and Willis T.J. (2003) Canonical analysis of principal coordinates: a
useful method of constrained ordination for ecology. Ecology 84:511-525.
Anderson, M.J. (2004) PERMDISP: a FORTRAN computer program for permutational
analysis of multivariate dispersions (for any two-factor ANOVA design) using
permutation tests, Department of Statistics, University of Auckland, New
Zealand.
Anderson, M.J. (2005) PERMANOVA: a FORTRAN computer program for
permutational multivariate analysis of variance. Department of Statistics,
University of Auckland, New Zealand.
TR 2009/020 Meola Reef Ecological Monitoring: 2001 – 2008 73
Anderson, M.J., Ellingsen, K., McArdle, B. (2006a) Multivariate dispersion as a
measure of beta diversity. Ecology Letters 9:683-693.
Anderson, M.J., Hewitt J., Ford R., Thrush S. (2006b) Regional Models of Benthic
Ecosystem Health: Predicting Pollution Gradients from Biological Data,
Auckland Regional Council TP 317.
Auckland Regional Growth Forum ARC (1999) Auckland Regional Growth Strategy:
2050. A vision of managing growth in the Auckland Region, Auckland
Regional Council.
Babcock, R., Creese, R. and Walker, J. 1999. Long Bay monitoring program: 1999
sampling report. Auckland UniServices Limited. Report for Auckland Regional
Council. 75 pp.
Breiman, L.; Friedman, J.H.; Olshen, R.A.; Stone, C.J. (1984). Classification and
Regression Trees. Wadsworth International Group, Belmont, California, USA.
Chandler. C.R. (1995) Practical considerations in the use of simultaneous inference for
multiple tests, Animal Behaviour 49:524-527.
Clarke, K.R. and Gorley, R.N. 2006. PRIMER v6: User manual / tutorial. PRIMER-E,
Plymouth, U.K.
Cole R.G., Babcock, R., Travers, V. and Creese B. (2001) Distributional expansion of
Carpophyllum flexuosum onto wave-exposed reefs in north-eastern New
Zealand. New Zealand Journal of Marine & Freshwater Research 35:17-32.
Cranfield, H.J., Gordon D.P., Willan R.C., Marshall B.A., Battershill C.N., Francis, M.P.,
Nelson, W.A. and Glasby C.J., Read G.B. (1998) Adventive marine species in
New Zealand. NIWA Technical Report 34.
Creese, R.G. (1988) Ecology of molluscan grazers and their interactions with marine
algae in north-eastern New Zealand: A review. New Zealand Journal of
Marine and Freshwater Research 22.
Dayton, P. and Tegner, M. (1984) Catastrophic storms, El Niño, and patch stability in a
southern california kelp community. Science 224:283-285.
Dromgoogle, F.I. and Foster B.A. 1983. Changes to the marine biota of the Auckland
Harbour. Tane 29:79-96.

TR 2009/020 Meola Reef Ecological Monitoring: 2001 – 2008 74
Dayton, P., Currie, V., Gerrodette, T., Keller, B.D., Rosenthal, R. and Ven Tresca, D.
(1984) Patch dynamics and stability of some California, USA kelp
communities. Ecological Monographs 54: 254-289.
Dayton, P.K. (1985) The structure and regulation of some South American kelp
communities. Ecological Monographs 55: 447-468.
Ellis, J, Cummings, V., Hewitt, J., Thrush S and Norkko, A., 2 (2002) Determining
effects of suspended sediment on condition of a suspension feeding bivalve
(Atrina zelandica): results of a survey, a laboratory experiment and a field
transplant experiment. Journal of Experimental Marine Biology and Ecology
267:147-174.
Fabricius, K. and De'ath, G. (2001) Environmental factors associated with the spatial
distribution of crustose coralline algae on the Great Barrier Reef. Coral Reefs
19:303-309.
Ford, R., Babcock, R. and Feary, D. 2001. State of the Environment Monitoring
Program Waitemata Sampling Report - Intertidal December 2001. Prepared
for the Auckland Regional Council by Auckland UniServices Limited.
Ford, R.B., Honeywill, C., Brown, P. Peacock, L. 2003a. The Long Bay monitoring
program: report 2003. Auckland UniServices Limited. Report for Auckland
Regional Council. 75 pp.
Ford, R.B., Honeywill, C. Brown, P. and Peacock, L. 2003b. Review of sampling and
analysis of methodologies used in ARC benthic ecology programmes and
recommendations on rationalization. Auckland UniServices Limited. Report
for Auckland Regional Council. 27 pp.
Ford, R, Williams, C., and Harwood, N. (2006) State of the Environment Monitoring
Programme: Waitemata sampling Report. Auckland UniServices Limited.
Prepared for Auckland Regional Council.
Fredensborg, B., K. N. Mouritsen, K., Poulin, R. (2005) Impact of trematodes on host
survival and population density in the intertidal gastropod Zeacumantus
subcarinatus. Marine Ecology Progress Series 290:109-117.
Gibbs, M. and Hewitt, J.E. (2004) Effects of sedimentation on macrofaunal
communities: a synthesis of research studies for ARC. NIWA report for
Auckland Regional Council. Technical Publication No. 264. pp. 48.

TR 2009/020 Meola Reef Ecological Monitoring: 2001 – 2008 75
Gordon, N.D. 1986. The Southern Oscillation and New Zealand weather. Mon. Wea.
Rev. 114: 371-387.
Hayward, B.W., Morley, M.S., Hayward, J.S., Stephenson, A.B., Blom, W.K., Hayward
K.A., Grenfell H.R. 1999. Monitoring studies of the benthic ecology of the
Waitemata harbour, New Zealand. Rec Auckland Mus 36: 95-117.
Halliday, J., Hewitt J.E. and Lundquist, C. (2006) Central Waitemata Harbour Ecological
Monitoring: 2000 - 2006. Report No. TP 314. NIWA Report for the Auckland
Regional Council.
Hessell, J. 1988. The climate and weather of the Auckland Region. Report No. 115(19),
New Zealand Meteorological Service.
Hewitt, J.E. 2000 Design of a State of the Environment monitoring programme for the
Auckland Marine Region, NIWA client report ARC00205. Prepared for
Auckland Regional Council. pp.41.
Inglis, G. Gust, G., Fitridge, I., Floerl, O., Woods, C., Hayden, B. and Fenwick G. 2005.
Port of Auckland Baseline survey for non-indigenous marine species.
Biosecurity New Zealand Technical Paper No: 2005/08.
Jones, M.B. and Marsden I.D. (2005) Life in the estuary: Illustrated guide and ecology.
Canterbury University Press, Christchurch, N.Z.
Knauer, G.A. and Asper, V. 1989. Sediment trap technology and sampling. Planning
report 10. Massachusetts, USA, US GOFS. Planning and Coordination Office.
Woods Hole, Massachusettes. 105 pp.
Montgomery, D. C. and Peck, E. A. 1982. Introduction to linear regression analysis 2nd
Edition, New York,: John Wiley & Sons, 1982.
Morton, J. and Miller, M. 1968. The New Zealand seashore. Collins, Auckland.
Mullan, B. 1996: Effects of ENSO on New Zealand and the South Pacific. In: Braddock,
D. (ed.) Prospects and needs for climate forecasting. Miscellaneous Series
34, pp. 23–27. Royal Society of New Zealand, Wellington.
Norkko, A., Thrush, S.F., Hewitt, J.E., Norkko, J., Cummings, V.J., Ellis, J., Funnell,
G.A. and Schultz, D. (1999) Ecological effects of sediment deposition in the
Okura estuary. NIWA Client Report: ARC90243, NIWA - Prepared for
Auckland Regional Council, North Shore City Council, Rodney District
Council, Hamilton.

TR 2009/020 Meola Reef Ecological Monitoring: 2001 – 2008 76
Nishii, R. 1984. Asymptotic properties of criteria for selection of variables in multiple
regression. Annals of Statistics 12: 758-765.
Otway, N. (1994) Population ecology of the low-shore chitons Onithochiton quercinus
and Plaxiphora albida. Marine Biology 121:105-116.
Pinheiro, J.., Bates, D., DebRoy S., Sarkar, D. and the R Core team 2008. nlme: Linear
and Nonlinear Mixed Effects Models. R package version 3.1-88.
Ripley, B. D. (1996). Pattern Recognition and Neural Networks. Cambridge University
Press, Cambridge. Chapter 7.
Robbins, I. (1985) Ascidian Growth and Survival at High Inorganic Particulate
Concentrations. Marine Pollution Bulletin 16:365-367.
Ryan, P. (1991) Environmental effects of sediment on New Zealand streams: A review.
New Zealand Journal of Marine and Freshwater Research 25:207-221.
Schiel, D.R. (1988) Algal interactions on the shallow subtidal reefs in northern New
Zealand: A review. New Zealand Journal of Marine and Freshwater Research
22:481-489.
Schiel, D.R., Wood, S.A., Dunmore, R.A., Taylor, D.I. (2006) Sediment on rocky
intertidal reefs: Effects on early post-settlement stages of habitat-forming
seaweeds. Journal of Experimental Marine Biology and Ecology 331:158-172.
Schwarz, G. 1978. Estimating the dimension of a model. Annals of Statistics 6: 461-
464.
Sebens, K. (1983) Population dynamics and habitat suitability of the intertidal sea
anemones Anthopleura elegantissima and A. xanthogrammica . Ecological
Monographs 53:405-433.
Seber, G.A.F. and Lee, A.J. 2003. Linear regression analysis, 2nd edition. John Wiley &
Sons, Hoboken, New Jersey.
Seymour, R.J., Tegner, M.J., Dayton, P.K., Parnell, P.E. (1989) Storm wave induced
mortality of giant Kelp Macrocystis Pyrifera in southern California USA.
Estuarine Coastal and Shelf Science 28: 277-292.

TR 2009/020 Meola Reef Ecological Monitoring: 2001 – 2008 77
Shears, N.T. and Babcock, R.C. 2004. Community composition and structure of
shallow subtidal reefs in northeastern New Zealand. Science for
Conservation 245: 65.
Smith B. and Bastow Wilson J (1996) A consumer’s guide to evenness indices. Oikos
76:70-82.
Strub, P.T., Powell, T. and Goldman, C.R. (1985) Climatic Forcing: Effects of El Niño on
a Small, Temperate Lake. Science 227:55-57.
Taylor, F. (1981). Phytoplankton and nutrients in Goat Island Bay, New Zealand Int
Revue ges Hydrobiol 66; 377-406.
Thrush, S.F., Hewitt, J.E., Norkko, A., Nicholls, P.E., Funnell, G.A. and Ellis, .J.I (2003)
Habitat change in estuaries: predicting broad-scale responses of intertidal
macrofauna to sediment mud content. Marine Ecology-Progress Series
263:101-112.
Tokeshi, M. (1999) Species coexistence ecological and evolutionary perspectives.
Blackwell, Oxford.
United Nations Environment Programme (1995). Global diversity assessment, UNEP
Nairobi: Cambridge University Press.
Vasquez, J.A., Vega, J.M.A. and Buschmann, A.H. (2006) Long term variability in the
structure of kelp communities in northern Chile and the 1997-98 ENSO.
Journal of Applied Phycology 18: 505-519.
Von Neumann, J.R.H., Kent, H.R., Bellinson, R. and Hart.,B.I. 1941. The mean square
successive difference. Ann. Math. 12:153-162.
Walker, J. 1999. Subtidal reefs of the Hauraki Gulf. MSc. thesis, University of
Auckland.
Walker, J. 2007 Effects of fine sediments on settlement and survival of the sea urchin
Evechinus chloroticus in northeastern New Zealand. Marine Ecology
Progress Series 331:109-118.
Walsby, J. (1977) Population variations in the grazing turbinid LunelIa smaragda
(Mollusca: Gastropoda). New Zealand Journal of Marine and Freshwater
Research 11:211-238.

TR 2009/020 Meola Reef Ecological Monitoring: 2001 – 2008 78
Williamson, R. B. & Kelly, S. (2003). Regional Discharges Project Marine Receiving
Environment Status Report 2003. ARC Technical Publication 203, pp. 53.
Auckland Regional Council, Auckland, New Zealand.
Zhang, P. 1992. On the distributional properties of model selection criteria. Journal of
the American Statistical Association 87: 732-737.

TR 2009/020 Meola Reef Ecological Monitoring: 2001 – 2008 79
8 Appendices
8.1 Appendix A. GPS positions
8.1.1 Meola intertidal site locations
Site
Height above MLWS (m)
Side of reef
MIE1
1.78-2.04
S 36° 50.74' E 174° 42.70'
East
MIE2
1.44-1.97
S 36° 50.71' E 174° 42.71'
East
MIE3
1.40-1.93
S 36° 50.65' E 174° 42.77'
East
MIW1
1.40-1.93
S 36° 50.78' E 174° 42.62'
West
MIW2
0.59-1.21
S 36° 50.71' E 174° 42.69'
West
MIW3
1.08-1.28
S 36° 50.65' E 174° 42.72'
West
8.1.2 Meola subtidal site locations
Site
Height below MLWS (m)
Side of reef
MSE1 1.00-2.00 S 36° 50.176' E 174°42.599' East
MSE2 1.00-2.00 S 36° 50.095' E 174° 42.569'
East
MSE3 1.00-2.00 S 36° 50.045’ E 174° 42.544'
East
MSW1 1.00-2.00 S 36° 50.249' E 174° 42.559'
West
MSW2 1.00-2.00 S 36° 50.190' E 174° 42.553'
West
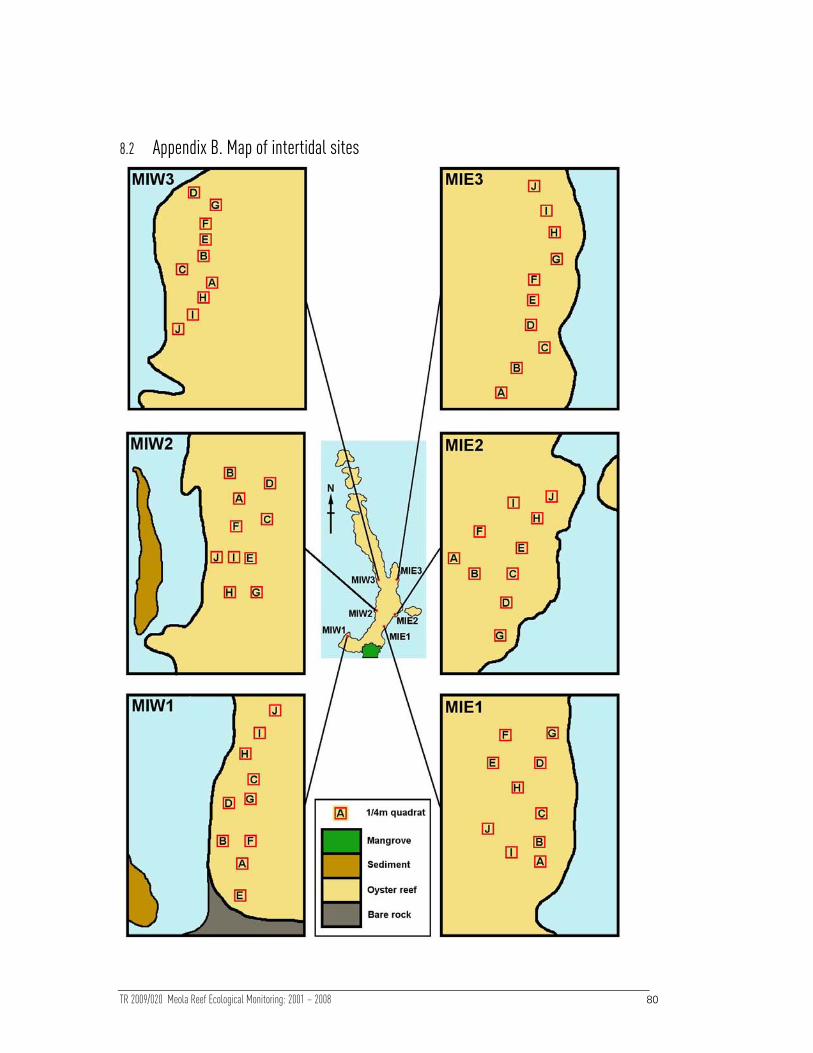
TR 2009/020 Meola Reef Ecological Monitoring: 2001 – 2008 80
8.2 Appendix B. Map of intertidal sites

TR 2009/020 Meola Reef Ecological Monitoring: 2001 – 2008 81
8.3 Appendix C. Definition of technical terms
A number of terms and abbreviations will be defined here for quick reference for the
reader. In some cases lengthier definitions will be given within the body of the report:
AIC – Akiake’s “An Information Criterion” an information criterion used to determine
between model choices, which is known to have a tendency to overfit, which means to
include more variables than is necessary. Smaller AIC values indicate a better model fit.
ANOSIM – Analysis of Similarities, a statistical technique to test if communities are
significantly different (analogous to a multivariate ANOVA), results include a probability (P)
value and a Rho (R) value, The Rho value allows the reader to judge the scale of a
significant difference and varies between 0 (no difference) and 1 (maximum possible
difference). This routine is part of the PRIMER suite of statistical analyses.
ANOVA - Analysis of Variance, a univariate test for a statistical difference between two or
more groups.
BIC – Schwarz’s “Bayesian Information Criterion”, this measure balances the value of the
log-likelihood with a penalty for the number of parameters used in the model. Smaller BIC
values indicate a better model fit.
CAP – Cannonical Analysis of Principal Coordinates, a statistical technique that attempts to
find a correlation between either a univariate factor or a multivariate matrix, and another
multivariate matrix.
Dispersion – Measures the spread of samples, in this document at a site over time. More
dispersed communities will change more over time than less dispersed communities.
Location – An area that contains sites where replicate quadrats are sampled, e.g. Meola
Reef in this report or Torbay in the Long Bay Marine Monitoring Programme
MDS – Non-metric Multidimensional Scaling Ordination, a graphical technique used to
show community data, greater distance apart in the ordination means less similarity in
community structure. Part of the PRIMER suite of statistical analyses.
Multivariate data – Data that incorporates more than one response variable, i.e. community
data.
PERMANOVA – Permutational Analysis of Variance, a multivariate method that allows
models to be fitted to data and significance tested.
SIMPER – A statistical analysis that quantifies the contribution of each taxa to the
similarity/dissimilarity between groups of samples. Part of the PRIMER suite of statistical
analyses.

Appendix C. Definitions…
TR 2009/020 Meola Reef Ecological Monitoring: 2001 – 2008 82
Site – There are many sites within a location where replicate quadrats are sampled, i.e.,
MIE2 or MSW2 in this report which are comparable with site Campbells 2 (C2) in the Long
Bay Marine Monitoring Programme.
Sediment – Sediments finer than sand.
Seriation – To form a linear series, e.g. 1,2,3,4,5.
Trapped sediment – The sediment collected by sediment traps that incorporates
deposition, but not resuspension, these sediments will be analysed for weight and grain
size, therefore implying settlement rate and probable provenance (<63 microns diameter =
probably terrestrial).
Univariate data - Data that has just one response variable, i.e. the density of an organism.
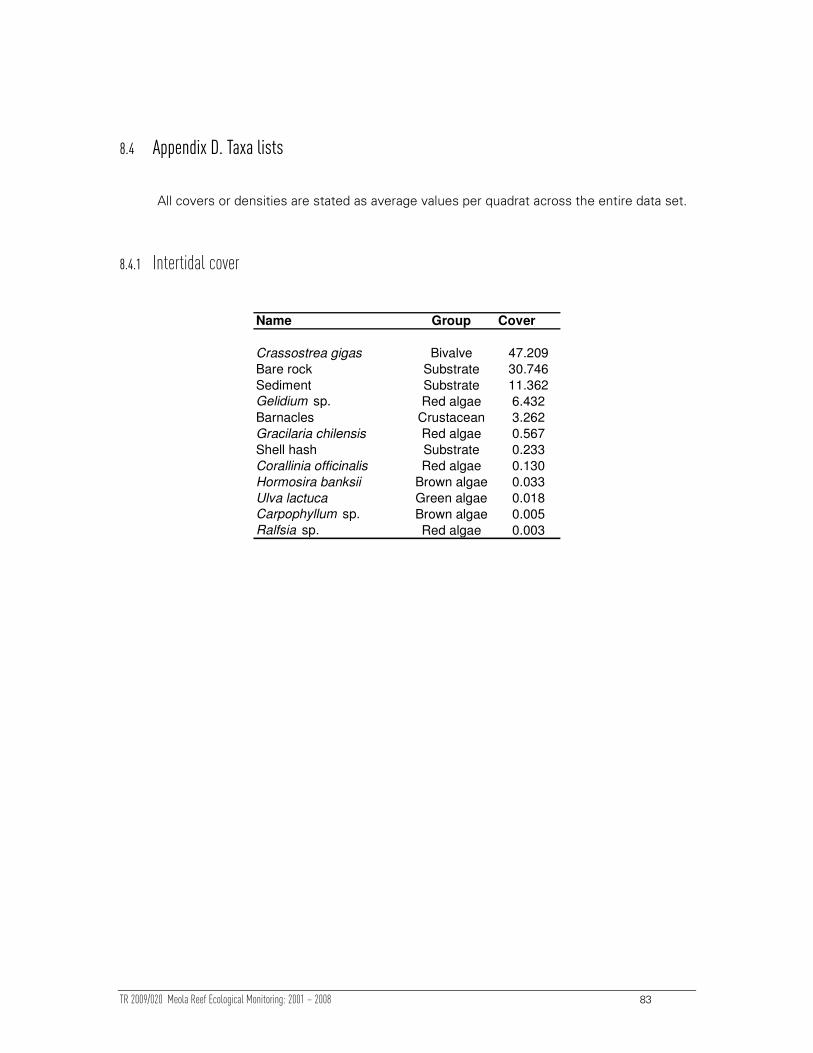
TR 2009/020 Meola Reef Ecological Monitoring: 2001 – 2008 83
8.4 Appendix D. Taxa lists
All covers or densities are stated as average values per quadrat across the entire data set.
8.4.1 Intertidal cover
Name Group Cover
Crassostrea gigas Bivalve 47.209
Bare rock Substrate 30.746
Sediment Substrate 11.362
Gelidium sp. Red algae 6.432
Barnacles Crustacean 3.262
Gracilaria chilensis Red algae 0.567
Shell hash Substrate 0.233
Corallinia officinalis Red algae 0.130
Hormosira banksii Brown algae 0.033
Ulva lactuca Green algae 0.018
Carpophyllum sp. Brown algae 0.005
Ralfsia sp. Red algae 0.003

Appendix E. Taxa lists
TR 2009/020 Meola Reef Ecological Monitoring: 2001 – 2008 84
8.4.2 Intertidal count
Name Group Density
Anthopleura auroeradiata. Anemone 11.377
Turbo smaragdus Gastropod 7.132
Sypharochiton pelliserpentis Chiton 6.995
Xenostrobus pulex Bivalve 6.051
Melagraphia aethiops Gastropod 5.547
Zeacumantus lutulentus Gastropod 4.423
Onchidella nigricans Pulmonate
slug 1.886
Cominella glandiformis Gastropod 0.559
Diadumene lineata Anemone 0.463
Acari Mite 0.291
Diloma subrostrata Gastropod 0.289
Cominella maculosa Gastropod 0.091
Cominella adspersa Gastropod 0.089
Acanthochiton zealandicus Chiton 0.061
Notoacmea helmsi Limpet 0.025
Patiriella regularis Echinoderm 0.020
Petrolisthes elongatus Crab 0.020
Buccinulum lineum Gastropod 0.018
Cominella virgata Gastropod 0.015
Helice crassa Crab 0.013
Unidentified Polychaete Polychaete 0.013
Musculista senhousia Bivalve 0.010
Austovenus stutchburyi Bivalve 0.008
Limaria sp. Bivalve 0.008
Perinereis novaehollandiae Polychaete 0.008
Solitary ascidian Ascidian 0.008
Nucula nitidula Bivalve 0.005
Tunicate Tunicates 0.005
Bulla sp. Gastropod 0.003
Crepidula monoxyla Gastropod 0.003
Modialarca impacta Bivalve 0.003
Nerita melanotragus Gastropod 0.003
Sphaeromatid Isopod Isopod 0.003
Unidentified Amphipod Amphipod 0.003
Zegalerus tenuis Gastropod 0.003

Appendix E. Taxa lists
TR 2009/020 Meola Reef Ecological Monitoring: 2001 – 2008 85
8.4.3 Subtidal cover
Name Group Cover
Sediment Substrate 27.529
Crustose coralline algae Red algae 16.005
Sand Substrate 14.656
Ralfsia Red Algae 14.185
Shell Substrate 7.711
Coralline Turfing Algae Red Algae 4.301
Bare rock Substrate 3.245
Sponges Sponge 3.173
Carpophyllum maschalocarpum Brown algae 1.535
Green turf Green algae 1.502
Carpophyllum flexuosum Brown algae 1.495
Ecklonia radiata Brown alge 1.137
Solitary ascidians Ascidian 0.623
Gravel Substrate 0.557
Cliona celata Sponge 0.477
Crassostrea gigas Bivalves 0.424
Bryozoan Bryozoan 0.329
Red foliose algae Red Algae 0.162
Sargassum sinclairii Brown algae 0.139
Tethya burtoni Sponge 0.139
Ancorina sp. Sponge 0.099
Perna canaliculus Bivalve 0.085
Hydroids Hydroids 0.080
Colpomenia sinuosa Brown algae 0.052
Halopteris sp. Brown algae 0.051
Anemone Anemone 0.046
Polymastia sp. Sponge 0.035
Hormosira banksii Brown algae 0.034
Waltonia inconspicua Brachiopod 0.028
Green filamentous algae Green algae 0.022
Phorbasidae Sponge 0.015
Aaptos aaptos Sponge 0.014
Codium (globular) Green algae 0.011
Brown turfing scum Brown algae 0.009
Barnacles Crustacean 0.008
Carpophyllum plumosum Brown algae 0.006
Codium fragile Green algae 0.006
Colonial ascidians Ascidian 0.006
Chaetopterus sp. Polychaete 0.003
Red turfing algae Red Algae 0.003
Tethya ingalli Sponge 0.003
Cystophora sp. Brown algae 0.002
Glossophora kunthii Brown algae 0.002
Mytilus edulis galloprovincialis Bivalve 0.002
Styela clava Tunicate 0.002
Zonaria turneriana Brown algae 0.002

Appendix E. Taxa lists
TR 2009/020 Meola Reef Ecological Monitoring: 2001 – 2008 86
8.4.4 Subtidal count
Name Group Density
Turbo smaragdus Gastropod 33.315
Carpophyllum maschalocarpum Brown algae 13.370
Carpophyllum flexuosum Brown algae 10.231
Solitary ascidians Ascidian 5.117
Ecklonia radiata Brown algae 3.022
Patiriella regularis Echinoderm 1.000
Trochus viridus Gastropod 0.929
Crassostrea gigas Bivalves 0.910
Tethya burtoni Sponge 0.846
Sargassum sinclairii Brown algae 0.787
Coscinasterias muricata. Echinoderm 0.389
Perna canaliculus Bivalve 0.361
Hormosira banksii Brown algae 0.302
Halopteris sp Brown algae 0.179
Cryptoconchus porosus Gastropods 0.142
Aaptos aaptos Sponge 0.120
Evechinus chloroticus Echinoderm 0.083
Cominella adspersa Gastropod 0.077
Cantharidus purpureus Gastropod 0.071
Chiton Chiton 0.068
Carpophyllum plumosum Brown algae 0.065
Buccinulum lineum Gastropod 0.056
Dendrodoris citrina Nudibranch 0.043
Red foliose algae Red Algae 0.043
Codium fragile Green algae 0.012
Cominella virgata Gastropod 0.009
Maoricolpus roseus Gastropod 0.009
Styela clava Tunicate 0.009
Sypharochiton pelliserpentis Chiton 0.009
Dicathais orbita Gastropod 0.009
Bulla quoyii Gastropod 0.006
Cabestana spengleri Gastropod 0.006
Penion sulcatus Gastropod 0.006
Tethya ingalli Sponge 0.006
Anemone Anemone 0.003
Cominella maculosa Gastropod 0.003
Cookia sulcata Gastropod 0.003
Cystophora sp Brown algae 0.003
Glossophora kunthii Brown algae 0.003
Haustrum haustorium Gastropod 0.003
Opisthobranch Gastropod 0.003
Stegnaster inflatus Echinoderm 0.003
Zonaria turneriana Brown algae 0.003
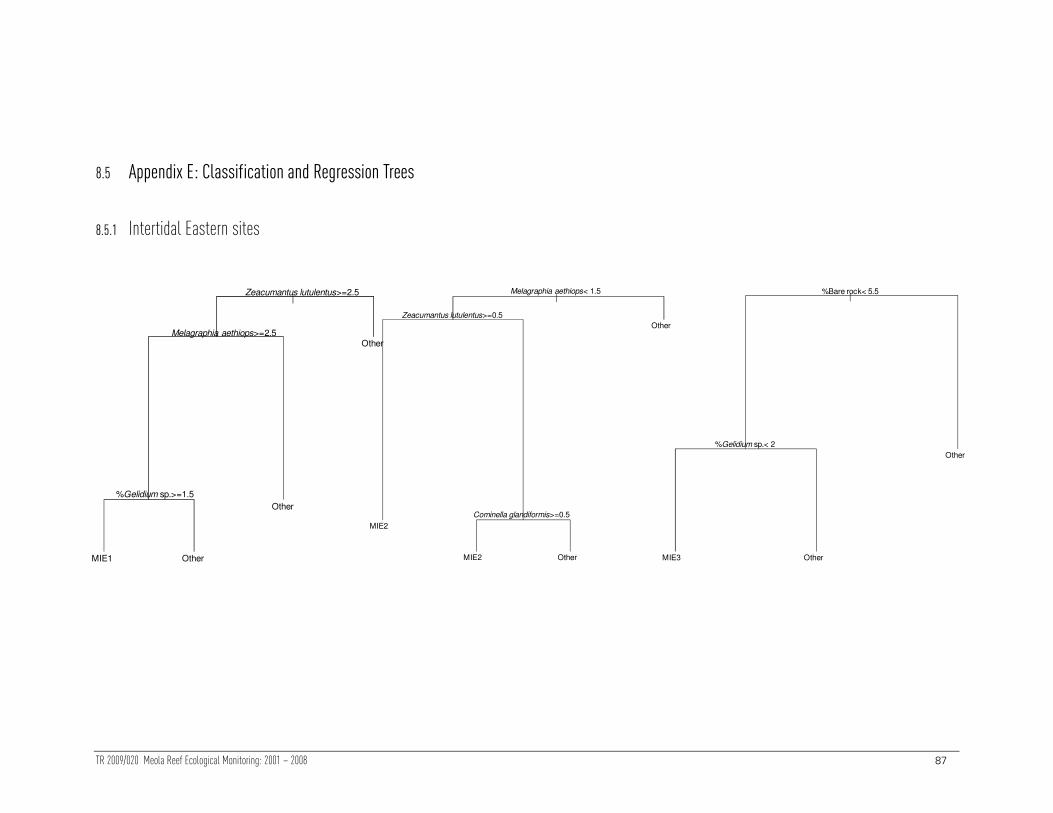
TR 2009/020 Meola Reef Ecological Monitoring: 2001 – 2008 87
8.5 Appendix E: Classification and Regression Trees
8.5.1 Intertidal Eastern sites
|Melagraphia aethiops< 1.5
Zeacumantus lutulentus>=0.5
Cominella glandiformis>=0.5
MIE2
MIE2 Other
Other
|Zeacumantus lutulentus>=2.5
Melagraphia aethiops>=2.5
%Gelidium sp.>=1.5
MIE1 Other
Other
Other
|%Bare rock< 5.5
%Gelidium sp.< 2
MIE3 Other
Other

Appendix E: Classification and Regression Trees
TR 2009/020 Meola Reef Ecological Monitoring: 2001 – 2008 88
8.5.2 Intertidal Western sites
|Total abundance< 16.5
Zeacumantus lutulentus< 0.5
Xenostrobus pulex< 1.5
MIW1 Other
Other
Other
|Turbo smaragdus>=3.5
%Elminius modestus< 6.5
%Sediment< 2.5
MIW2 Other
Other
Other
|Melagraphia aethiops>=9.5
%Elminius modestus>=3
Turbo smaragdus>=12.5
MIW3
MIW3 Other
Other

TR 2009/020 Meola Reef Ecological Monitoring: 2001 – 2008 89
8.6 Appendix F. Size frequency histograms
8.6.1 Crassostrea gigas (Intertidal)
n = 100
0 20 40 60
0
5
10
15
20 n = 100
0 20 40 60
n = 100
0 20 40 60
n = 100
0 20 40 60
n = 100
0 20 40 60
n = 100
0 20 40 60
n = 100
0
5
10
15
20n = 100 n = 100 n = 100 n = 100 n = 100
n = 100
0
5
10
15
20 n = 100 n = 100 n = 100 n = 100 n = 100
n = 100
0
5
10
15
20n = 100 n = 100 n = 100 n = 100 n = 100
n = 35
0
5
10
15
20 n = 64 n = 45 n = 50 n = 31 n = 48
n = 65
0
5
10
15
20 n = 35 n = 97 n = 15 n = 77 n = 70
n = 243
0
5
10
15
20n = 164 n = 199 n = 165 n = 121
MIE2 MIE3 MIW1 MIW2MIE1
2001
2002
2003
2004
2005
2006
2007
Fre
qu
en
cy
Size (cm)
MIW3
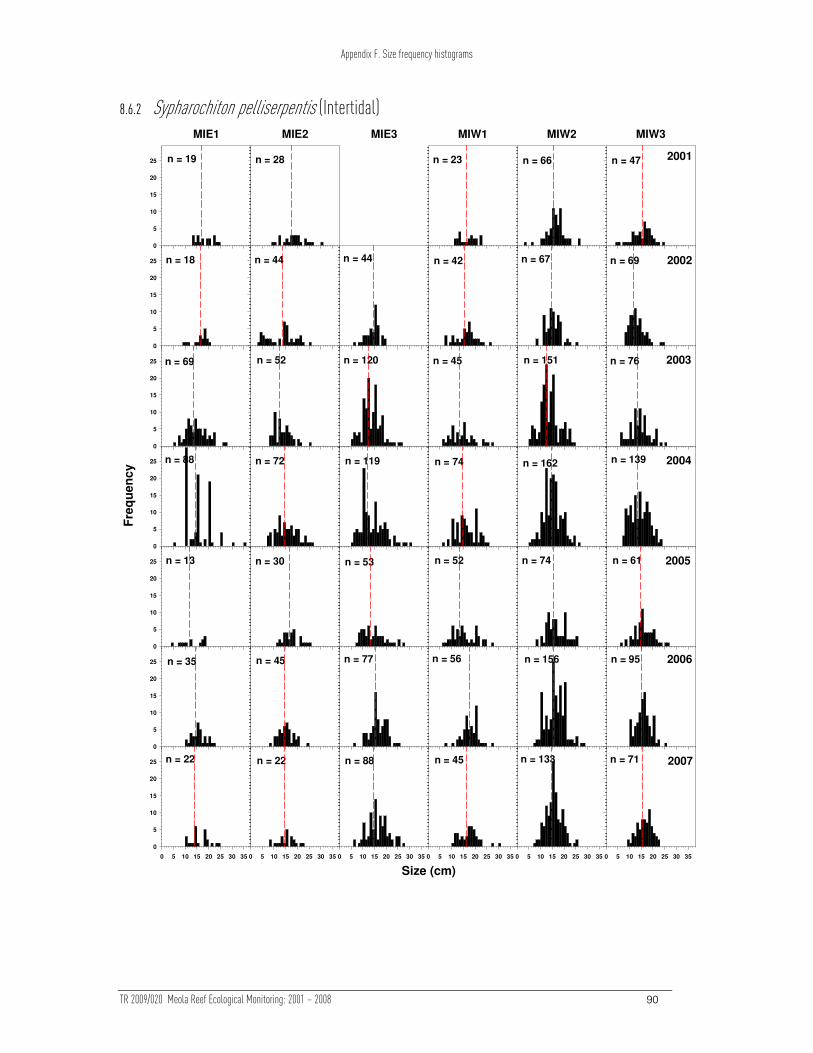
Appendix F. Size frequency histograms
TR 2009/020 Meola Reef Ecological Monitoring: 2001 – 2008 90
8.6.2 Sypharochiton pelliserpentis (Intertidal)
n = 22
0 5 10 15 20 25 30 35
0
5
10
15
20
25 n = 22
0 5 10 15 20 25 30 35
n = 88
0 5 10 15 20 25 30 35
n = 45
0 5 10 15 20 25 30 35
n = 133
0 5 10 15 20 25 30 35
n = 71
0 5 10 15 20 25 30 35
n = 35
0
5
10
15
20
25 n = 45 n = 77 n = 56 n = 156 n = 95
n = 13
0
5
10
15
20
25 n = 30 n = 53 n = 52 n = 74 n = 61
n = 88
0
5
10
15
20
25 n = 72 n = 119 n = 74 n = 162 n = 139
n = 69
0
5
10
15
20
25 n = 52 n = 120 n = 45 n = 151 n = 76
n = 18
0
5
10
15
20
25 n = 44 n = 44 n = 42 n = 67 n = 69
n = 19
0
5
10
15
20
25 n = 28 n = 23 n = 66 n = 47
MIE2 MIE3 MIW1 MIW2MIE1
2001
2002
2003
2004
2005
2006
2007
Fre
qu
en
cy
Size (cm)
MIW3

Appendix F. Size frequency histograms
TR 2009/020 Meola Reef Ecological Monitoring: 2001 – 2008 91
8.6.3 Melagraphia aethiops (Intertidal)
n = 93
0 5 10 15 20
0
10
20
30
40
50 n = 2
0 5 10 15 20
n = 17
0 5 10 15 20
n = 11
0 5 10 15 20
n = 30
0 5 10 15 20
n = 155
0 5 10 15 20
n = 67
0
10
20
30
40
50 n = 6 n = 13 n = 32 n = 47 n = 148
n = 48
0
10
20
30
40
50 n = 7 n = 23 n = 10 n = 29 n = 126
n = 85
0
10
20
30
40
50 n = 9 n = 34 n = 15 n = 89 n = 180
n = 115
0
10
20
30
40
50 n = 4 n = 61 n = 19 n = 47 n = 142
n = 39
0
10
20
30
40
50 n = 9 n = 35 n = 18 n = 36 n = 140
n = 50
0
10
20
30
40
50 n = 3 n = 6 n = 41 n = 153
MIE2 MIE3 MIW1 MIW2MIE1
2001
2002
2003
2004
2005
2006
2007
Fre
qu
en
cy
Size (cm)
MIW3
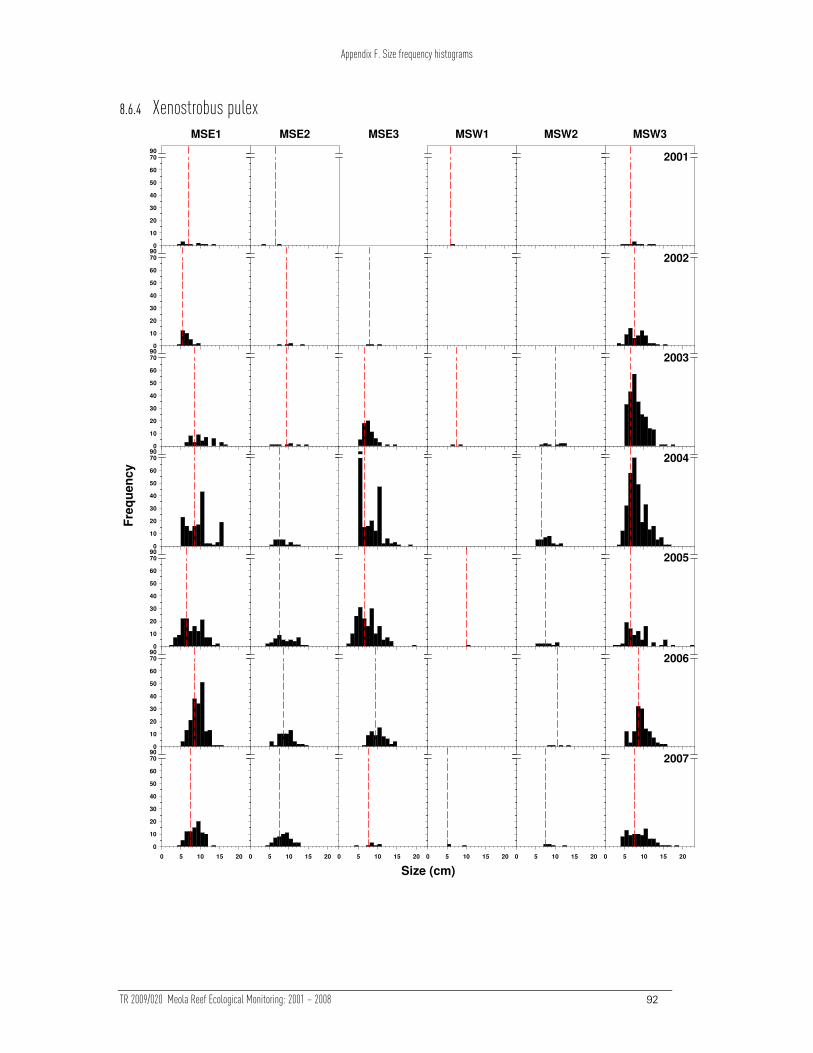
Appendix F. Size frequency histograms
TR 2009/020 Meola Reef Ecological Monitoring: 2001 – 2008 92
8.6.4 Xenostrobus pulex
0 5 10 15 20
0
10
20
30
40
50
60
7090
0 5 10 15 20 0 5 10 15 20 0 5 10 15 20 0 5 10 15 20 0 5 10 15 20
0
10
20
30
40
50
60
7090
0
10
20
30
40
50
60
7090
0
10
20
30
40
50
60
7090
0
10
20
30
40
50
60
7090
0
10
20
30
40
50
60
7090
0
10
20
30
40
50
60
7090
MSE2 MSE3 MSW1 MSW2MSE1
2001
2002
2003
2004
2005
2006
2007
Fre
qu
en
cy
Size (cm)
MSW3
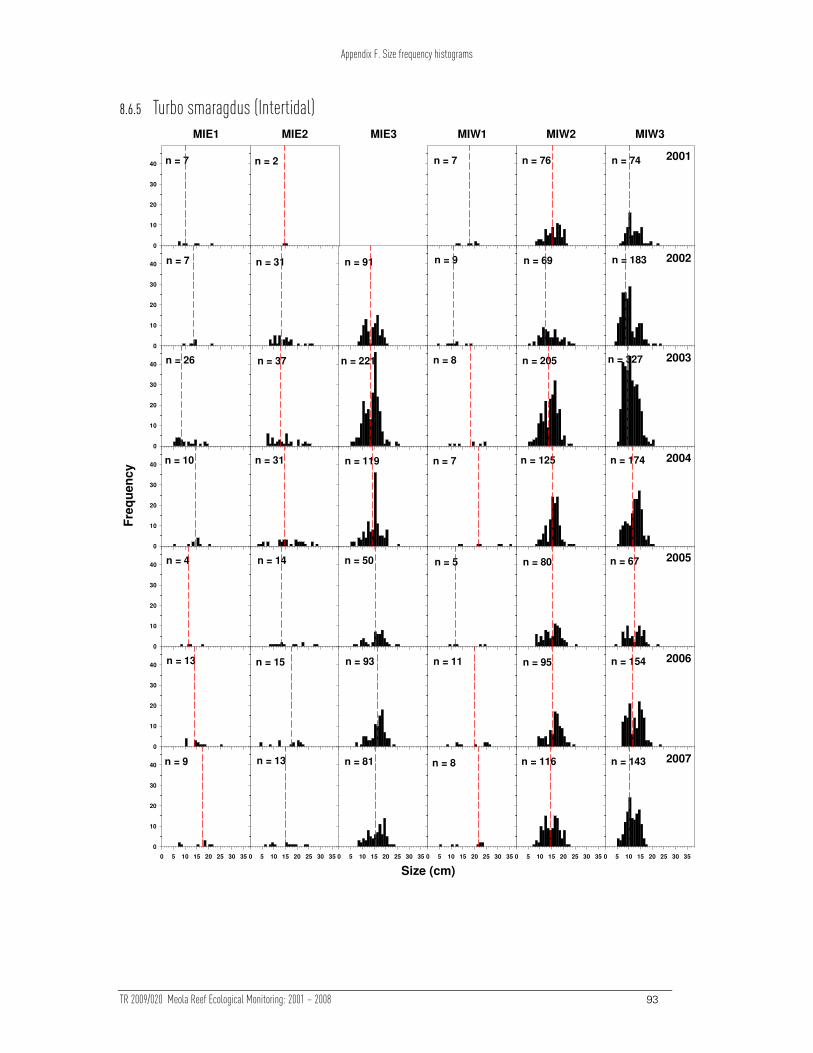
Appendix F. Size frequency histograms
TR 2009/020 Meola Reef Ecological Monitoring: 2001 – 2008 93
8.6.5 Turbo smaragdus (Intertidal)
n = 9
0 5 10 15 20 25 30 35
0
10
20
30
40n = 13
0 5 10 15 20 25 30 35
n = 81
0 5 10 15 20 25 30 35
n = 8
0 5 10 15 20 25 30 35
n = 116
0 5 10 15 20 25 30 35
n = 143
0 5 10 15 20 25 30 35
n = 13
0
10
20
30
40 n = 15 n = 93 n = 11 n = 95 n = 154
n = 4
0
10
20
30
40n = 14 n = 50 n = 5 n = 80 n = 67
n = 10
0
10
20
30
40n = 31 n = 119 n = 7 n = 125 n = 174
n = 26
0
10
20
30
40 n = 37 n = 221 n = 8 n = 205 n = 327
n = 7
0
10
20
30
40 n = 31 n = 91 n = 9 n = 69 n = 183
n = 7
0
10
20
30
40 n = 2 n = 7 n = 76 n = 74
MIE2 MIE3 MIW1 MIW2MIE1
2001
2002
2003
2004
2005
2006
2007
Fre
qu
en
cy
Size (cm)
MIW3

Appendix F. Size frequency histograms
TR 2009/020 Meola Reef Ecological Monitoring: 2001 – 2008 94
8.6.6 Turbo smaragdus (subtidal)
n = 78
n = 251
n = 52
n = 46
0
100
200
300n = 44 n = 290 n = 90 n = 59
n = 115
0
100
200
300n = 242 n = 543 n = 229 n = 292
n = 146
0
100
200
300n = 343 n = 138 n = 145 n = 204
n = 118
0
100
200
300n = 214 n = 43 n = 241 n = 81
MSE2 MSE3 MSW1 MSW2MSE1
2001
2002
2003
2004
2005
2006
2007
2008
Fre
qu
en
cy
Size (cm)
n = 92
0
100
200
300n = 92 n = 85 n = 50
n = 103
0
100
200
300 n = 439 n = 431 n = 209
n = 102
0
100
200
300n = 239 n = 96 n = 171
n = 19
0 10 20 30 40
0
100
200
300 n = 225
0 10 20 30 40
n = 218
0 10 20 30 40
n = 8
0 10 20 30 40
n = 52
0 10 20 30 40

Appendix F. Size frequency histograms
TR 2009/020 Meola Reef Ecological Monitoring: 2001 – 2008 95
8.6.7 Carpophyllum flexuosum (Subtidal)
n = 57
n = 41
010
020
0300 40
0
n = 60
n = 34
n = 55
0
10
20
30
40 n = 41 n = 76 n = 19 n = 39
n = 60 n = 115 n = 35 n = 30
n = 54
0
10
20
30
40 n = 67 n = 145 n = 0 n = 1
n = 35
0
10
20
30
40 n = 62 n = 43 n = 62 n = 63
MSE2 MSE3 MSW1 MSW2MSE1
2001
2002
2003
2004
2005
2006
2007
2008
Fre
qu
en
cy
Size (cm)
n = 76
0
10
20
30
40 n = 39 n = 64 n = 53
n = 27
0
10
20
30
40 n = 87 n = 87 n = 35
n = 52
0
10
20
30
40
n = 30
0
10
20
30
40 n = 79 n = 55 n = 79
n = 58
010
0200 30
040
0
0
10
20
30
40 n = 62
010
0200 30
040
0
n = 48
010
0200 30
040
0
n = 49
010
0200 300 40
0

Appendix F. Size frequency histograms
TR 2009/020 Meola Reef Ecological Monitoring: 2001 – 2008 96
8.6.8 Carpophyllum maschalocarpum (Subtidal)
n = 6
n = 159
n = 3
0
10
20
30
40
50 n = 84 n = 1 n = 224 n = 177
n = 0
0
10
20
30
40
50 n = 0 n = 24 n = 76 n = 153
n = 126
0
10
20
30
40
50 n = 54 n = 0 n = 338 n = 192
n = 17
0
10
20
30
40
50 n = 5 n = 0 n = 161 n = 19
MSE2 MSE3 MSW1 MSW2MSE1
2001
2002
2003
2004
2005
2006
2007
2008
Fre
qu
en
cy
Size (cm)
n = 60
0
10
20
30
40
50 n = 33 n = 0 n = 53 n = 38
n = 53
0
10
20
30
40
50 n = 71 n = 8 n = 84
n = 14
0
10
20
30
40
50 n = 29 n = 0 n = 58
n = 11
0 5010
015
020
025
0
0
10
20
30
40
50 n = 6
0 5010
015
020
025
0
n = 50
0 50 100
150
200
250
n = 9
0 50 100
150
200
250
n = 22
0 50 100
150 200
250
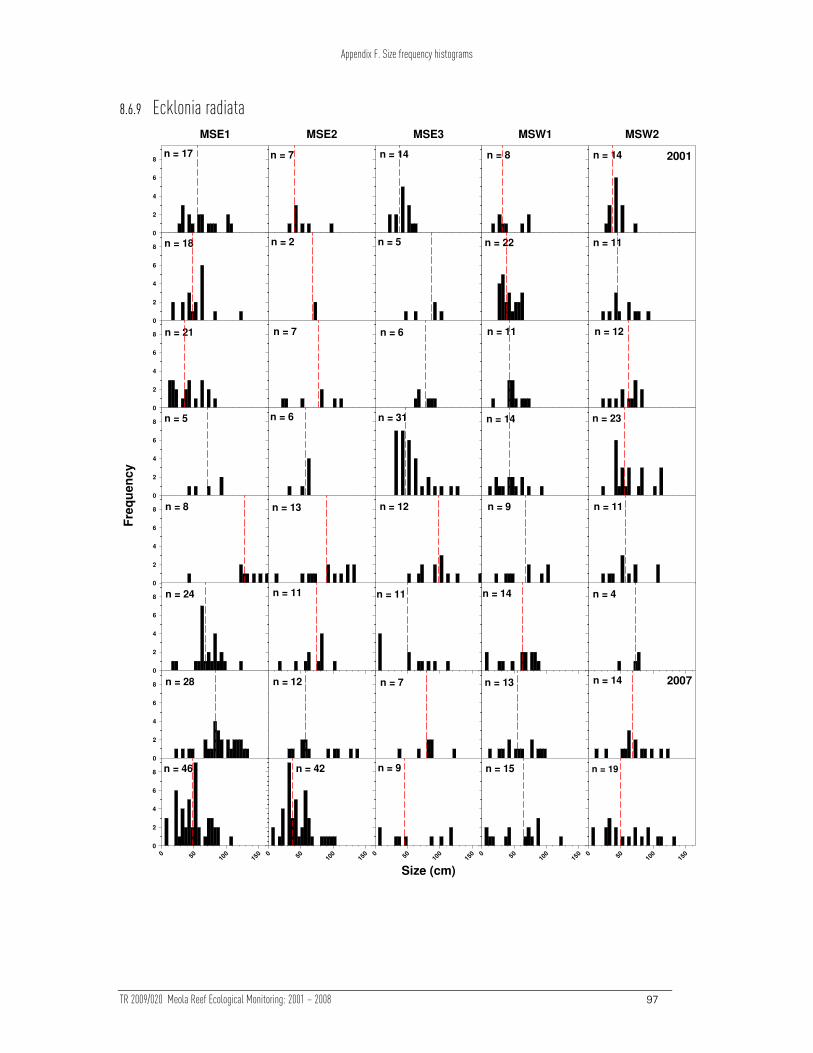
Appendix F. Size frequency histograms
TR 2009/020 Meola Reef Ecological Monitoring: 2001 – 2008 97
8.6.9 Ecklonia radiata
n = 12 n = 7 n = 13 n = 14
n = 17
0
2
4
6
8n = 7 n = 14 n = 8 n = 14
MSE2 MSE3 MSW1 MSW2MSE1
2001
2002
2003
2004
2005
2006
2007
2008
Fre
qu
en
cy
Size (cm)
n = 18
0
2
4
6
8n = 2 n = 5 n = 22 n = 11
n = 21
0
2
4
6
8 n = 7 n = 6 n = 11 n = 12
n = 5
0
2
4
6
8n = 6 n = 31 n = 14 n = 23
n = 8
0
2
4
6
8 n = 13 n = 12 n = 9 n = 11
n = 24
0
2
4
6
8 n = 11 n = 11 n = 14 n = 4
n = 28
0
2
4
6
8
n = 46
0 50 100
150
0
2
4
6
8 n = 42
0 50 100
150
n = 9
0 50 100
150
n = 15
0 5010
015
0
n = 19
0 50 100 150

TR 2009/020 Meola Reef Ecological Monitoring: 2001 – 2008 98
8.7 Appendix G. Chronological synopsis of sampling methodology
8.7.1 Intertidal Reef Monitoring
8.7.1.1 2001 (Ford et al 2001)
Intertidal sampling was initiated in December 2001 and five intertidal sites (~75 m2
each) were surveyed bimonthly until October 15, 2001 in order to assess temporal
variability in macrofaunal communities. These surveys recorded the number, size
frequency and percentage cover of all macroscopic greater than 4mm) fauna and flora
inhabiting this rocky reef. The five sites were distributed on both the eastern and
western sides of Meola Reef. All sites were positioned at similar tidal heights
(Appendix C). Random positioning of quadrats was achieved by marking and
numbering twelve potential quadrat locations on areas of reef with comparatively
regular topographic profiles. This was considered necessary because the inclusion of
large projections, such as oyster concretions in some quadrats, could potentially bias
the data and introduce undesirable additional sources of variability. From these twelve
potential quadrat locations, five were chosen randomly using random number tables.
Three sites were placed on the western side and two were placed on its eastern side
(Figure 1); these were relocated using Global Positioning System (GPS) coordinates
and site view photographs. Within each site, seven permanent quadrats (1/4 sq m2)
were positioned using stainless steel pegs hammered into the reef. These quadrats
were relocated using individually numbered plastic tags attached to the pegs (quadrat
markers).
In each quadrat, organisms were identified down to the lowest practical taxonomic
level. These organisms were then counted and measured to the nearest millimetre
using vernier callipers (excluding oysters, see below). All measurements of organisms
were taken on their longest axis. In the case of gastropods either shell length or shell
width (dependent on species shell form) was measured.
To enumerate encrusting (e.g. sponges) and turfing (e.g. small articulating algae)
organisms, the percent coverage of the substratum was estimated visually in the
aforementioned quadrats. In addition to this, each quadrat was photographed,
producing a digital record of any possible changes in the encrusting communities
covering the reef.
The Pacific oyster Crassostrea gigas was the numerically dominant organism in all the
surveyed quadrats. To evaluate the percentage cover of these encrusting bivalves,
each quadrat was divided into quarters, with the quarter to the left of the quadrat
marker evaluated. The overall percent coverage of the substratum by these bivalves
was estimated visually, and then each individual was measured to the nearest
millimetre using vernier calipers. All oysters surveyed were also categorised according

Appendix G. Chronological synopsis…
TR 2009/020 Meola Reef Ecological Monitoring: 2001 – 2008 99
to their position in relation to other oysters. Oysters were classified “clustered” if they
were touching another oyster, “individual” if not touching another oyster, “loose” if
not attached to the substratum and “loose-clustered” if touching another oyster, but
not attached to the substratum.
8.7.1.2 2002-2003 (Ford et al 2004)
In accordance with recommendations in Ford et al 2001, the intertidal sampling design
was changed in 2001.
Sixty samples were taken on the reef (30 samples on each side of the reef, east and
west, ten samples at each of three sites) to incorporate the important variability in this
habitat. This number of quadrats was a result of one new site being added (to balance
the design regarding sides of the reef) and the number of quadrats was increased from
seven to ten at each site. The sampling occurred annually in October of each year, as
no seasonal trends were detected from the initial temporally intense sampling. The
number of oyster counts was decreased, given the consistency of the population
structure of this organism. Each individual oyster was measured within a quarter of
each ¼ m² quadrat (1/16m²). No recording of the position of oysters, i.e. clustered,
individual, loose, as stated in (Ford et al 2001) was recorded as this data had not
proven useful.
All other methods remained identical to those implemented in 2001 (Ford et al 2001).
8.7.1.3 2004-2007 (Ford et al 2006, Current report)
Sixty samples were taken again (30 on each side) in October of 2004 and 2005. Due to
concerns about the sometimes small numbers of oysters used to generate size
frequencies at some sites the following change was made to the measuring of oysters
in the 2004 and 2005 samplings: If less than 100 oysters were measured within each
site, more oysters within quadrats were measured until 100 oysters were measured at
each site.12 All other methods remained identical to those stated in the 2004 report
(Ford et al 2004).
8.7.2 Subtidal reef monitoring
8.7.2.1 2001 (Ford et al 2001a)
Previous studies of sheltered shallow subtidal reef assemblages indicated minimal
seasonal variability (Babcock et al 1999), therefore one annual sampling of subtidal
assemblages was conducted at five sites in late summer. The methods used for this
survey are consistent with those used in the LBMMP (Anderson et al 2005).
12 Unfortunately measurement of density of oysters in each 1/16m² quadrat was forgotten in the 2005 sampling therefore this data was not available for analysis.

Appendix G. Chronological synopsis…
TR 2009/020 Meola Reef Ecological Monitoring: 2001 – 2008 100
The five sites were distributed between the east and west facing sides of Meola Reef
(Figure 1). Three sites were located on the eastern side and two on the western side.
All sites were areas of macroalgal-dominated subtidal basaltic reef. These sites
extended between 1 and 2 m depth below MLWS. Coordinates for each site were
initially recorded by GPS. Sediment collectors were deployed at each site. Surface
buoys (~10 cm by 5 cm) were attached to the steel bases of the sediment collectors.
The buoys were small enough to be missed by the public, but large enough to be
found when searching in the correct areas.
Seven quadrats were randomly placed at each site within 20 m of the sediment
collectors. In five of these quadrats all macroalgae and invertebrates greater than 4 cm
and 4 mm, respectively, were identified, counted and measured. Percentage cover of
substratum type (which included turfing algae, encrusting algae, large brown algae,
encrusting invertebrates, bare rock, sediment (finer than sand) and sand) was also
visually estimated in each of the five quadrats. In two of the seven quadrats,
identification, counts and percentage cover estimates were completed but no
measurements were taken. The total lengths of all macroalgae were measured to the
nearest 5 cm. For the laminarian kelp, Ecklonia radiata, this included both the stipe
length and the total length. The longest axis of solitary macro invertebrates was also
measured to the nearest 5mm. Mobile organisms (e.g. crabs) were not enumerated.13
8.7.2.2 2002-2008 (Ford et al 2004, Ford et al 2006, Current Report)
Each year in late summer the same five sites were re-surveyed using the same
methodology.
8.7.3 Sediment collection and total sedimentation rate calculation
8.7.3.1 2001 (Ford et al 2001) - Present
One sediment collector was placed at every site to quantify the amount of sediment
entering the reef ecosystems in October 2001.
Sediment collectors were constructed from PVC piping, metal piping with a heavy
steel base. The inner ‘trap’ was made from PVC pipe, 37 mm in diameter and 500 mm
in length, with one end of the pipe sealed by a plastic cap. A length to diameter ratio of
at least 7:1 was incorporated in this design to mitigate the effects of resuspension of
the trapped material (Knauer and Asper, 1989). This first pipe (the trap) was then
inserted into a metal pipe (the trap holder), 40 mm in diameter and 400 mm in length,
which had been welded to a large, heavy, steel base. This construction ensured the
‘trap’ had a stable platform and anchor, decreasing the chance of its movement
through wave or tidal action.
13 It should be noted that during the 2001 survey between 5 and 7 quadrats were surveyed due to a sampling error. This sampling was completed in June 2001

Appendix G. Chronological synopsis…
TR 2009/020 Meola Reef Ecological Monitoring: 2001 – 2008 101
All collectors were placed on the subtidal reef in areas surrounded by macroalgae. All
traps were oriented vertically and placed at least 1 m below MLWS with the trap
aperture at least 25-30 cm above the benthos. A surface buoy was attached to aid in
the relocation of sediment collectors. Collectors were deployed in early August 2001,
and were sampled monthly when possible. All sediment collection has continued using
the same methodology until the present day.
After collection, the contents of traps were filtered through pre-weighed filter bags
(equivalent to 1.2 micron filter papers), and then oven-dried at 65-80ºC for 24 hours.
The filter and contents were then weighed to determine total dry weight, which was
then converted into a daily rate of sedimentation within traps using the number of days
a trap had been deployed and the surface area of the opening of the trap (g/cm2/day).
The yearly averages per site were then generated from these values. This
sedimentation rate calculation has continued using the same methodology until the
present day. The total trapped sedimentation rate is therefore comparable from 2001
until the present day.
8.7.4 Sediment textural analysis
8.7.4.1 October 2001- 2002, (Ford et al 2001)
In 2001, six sieve sizes (1mm+, 500µm, 250µm, 125µm, 63µm and <63µm) were used
for textural analysis. The <63µm size class contains the material of greatest interest
with respect to potential terrestrial inputs resulting from the construction phase of
urban development.
Samples were processed as in the LBMMP over the same period (Anderson et al
2005), by drying and processing with a mechanical shaker. Sediments less than 63µm
were further analysed using a Galai particle size analyser. This apparatus measures
grain sizes and can detect particles as small as 2µm. According to the Wentworth grain
size scale (Lewis, 1984), grains of this size are clay. From each of the less than 63µm
samples, a small proportion was suspended in solution and pumped past a laser which
in turn measured the size of the grains in each sample. Each sample was analysed for
either five minutes, or until a confidence indicator reached 96-98%. This confidence
indicator is an estimate of the confidence that some given percentage of the sample
has been analysed.
8.7.4.2 2002 – March 2003 (Ford, 2003)
Samples were individually analysed using a Galai particle size analyser to determine
the percentage of the sample sediments volume that was less than 63µm in diameter.
Note that samples were not sieved into separate size classes using the mechanical
shaker first, instead the Galai particle analyser was used to analyse the whole
sediment sample.

Appendix G. Chronological synopsis…
TR 2009/020 Meola Reef Ecological Monitoring: 2001 – 2008 102
8.7.4.3 2003– 2008 (Ford et al 2004, 2006, Current report)
Following the 2003 report, the analysis of grain size fractions was modified to take
account of the influence of organic material. This followed a rationalisation of benthic
ecology methods for ARC monitoring programmes (Ford, 2003, Ford et al 2003b))
recommended the following grain size analysis technique be used across a number of
ARC projects:
Pre-treatment of samples for grain size analysis should include:
• Hydrogen peroxide treatment (6-30%) until frothing ceases
• Bulking, homogenisation and sub-sampling
• Dispersion with Calgon (2g.l-1)
• Drying should be employed if samples are to be stored prior to pre-treatment
or at an appropriate time to obtain a dry weight for wet-sieving.
According to {Ford, 2003 #3}, previous analyses conducted without the use of a pre-
treatment to remove organics would have resulted in a small overestimation of fine
grains (<63µm).
A sub-sample of up to 60 grams of each individual dried sediment sample was then
taken. Samples were thoroughly mixed beforehand to ensure a representative sub-
sample was taken. Many sample weights were less than 60 grams; in these situations
the whole sample was processed. Each sub-sample was then treated with hydrogen
peroxide to remove organic material. Samples were left in hydrogen peroxide for 24-48
hours and then oven-dried and the dry weight recorded. Following this second oven-
drying, samples were treated with a particle disperser, Calgon (5g.l-1), before being
analysed for the percentage volume of fine sediments (<63µm) using a Malvern laser
particle analyser. Note: the Calgon concentration was increased from 2 to 5 g.l-1 after
concerns about clumping of the clay fraction, but appeared to make little difference to
the results.
8.7.5 Summary of methodology for sediment textural processing
8.7.5.1 2001 (Walker, 2001)
Sediments from each trap were oven-dried, then sieved through a series of sieves
using a mechanical shaker. Sieve sizes were 1 mm+, 500 µm, 250 µm, 125 µm, 63 µm
and <63 µm. The <63 µm fraction (fines) was further analysed using the Galai particle
analyser.

Appendix G. Chronological synopsis…
TR 2009/020 Meola Reef Ecological Monitoring: 2001 – 2008 103
8.7.5.2 2002-May 2003 (Ford, 2003)
Sediments from each trap were oven- dried and the total dry weight of sediments
determined. The percentage of sediment <63µm (fines) was determined by analysing
the entire sample (with no pre-sieving) using the Galai particle analyser.
8.7.5.3 April 2003 -2008 (Ford et al 2004, 2006, Current report)
Sediments from each trap were pre-treated with hydrogen peroxide (to remove
organics) and Calgon (to prevent clumping) prior to laser analysis. The percentage of
sediment <63µm was determined by analysing the entire sample using a Malvern
particle analyser.
In this report fine sediments are compared from April 2003 onwards.

TR 2009/020 Meola Reef Ecological Monitoring: 2001 – 2008 104
8.8 Appendix H. Plots of dispersion
8.8.1 MDS plots of average subtidal count data (in 2 or 3 dimensions)
Plots are shown when averaged by year and site following the application of different similarity measures for the PERMDISP analysis. MG = Modified
Gower. N = 5-7 for each point, 1= 2001, 8 = 2008. An example plot is shown.
MSE1
MSE2
MSE3
MSW1
MSW2
77
8
5
5
45
8
7
6
5
78
6
8
6
2
2
7
8
4 2
61
3 412
2
1
5
3
44
3 36
1
3
1
Stress: 0.17Jaccard’s
1
1
1
1
1
2
22
2
2
33
3
3
3
4
4
4 4
4
5
5
55
5
6
6
6
6
6
7
7
7
77
8
8
8
8
8
Stress: 0.1
Manhattan
1
1
1
1
12
22
22 3
33
33
4
4
4 4
4
5
5
5
5
5
6
6
6
6
6
7 7
7
77
8
8
8
8
8
Stress: 0.18
MG2
1
1
1
1
1 2
2
2
2
2
3
3
33
3
4
444
45
5
5
5
5
6
6
6
6
6
7
7
7
7
7
8
88
8
8
Stress: 0.18
MG10
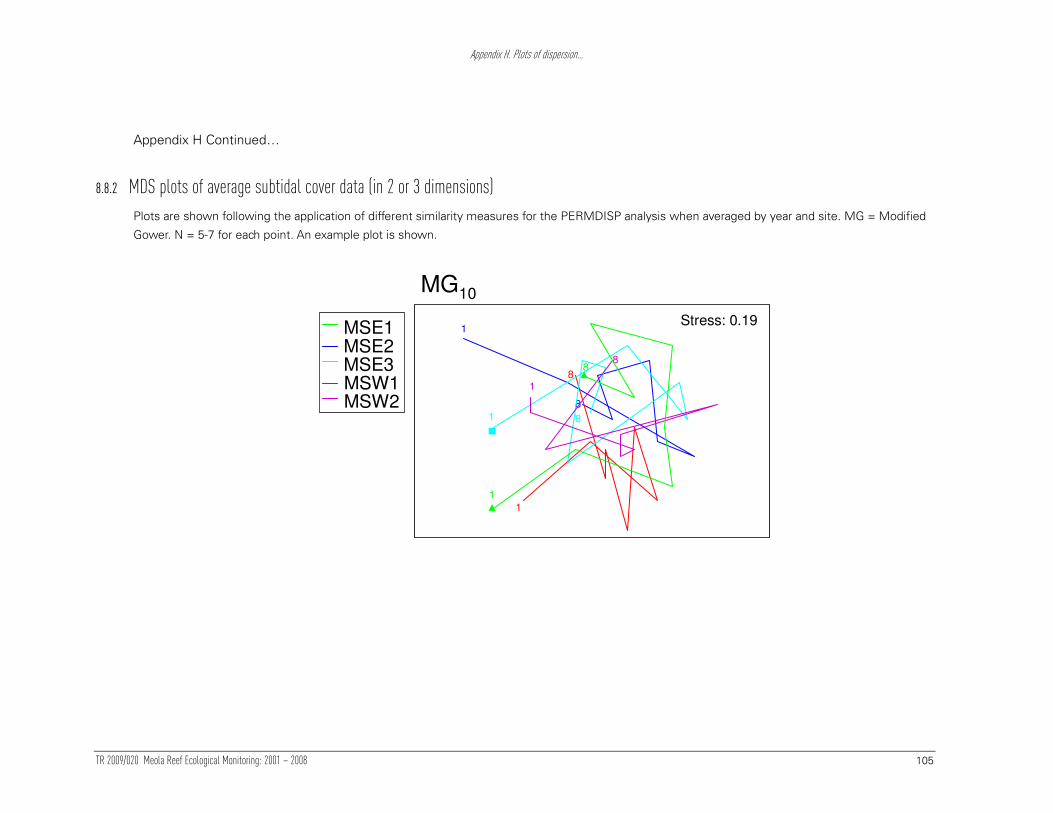
Appendix H. Plots of dispersion…
TR 2009/020 Meola Reef Ecological Monitoring: 2001 – 2008 105
Appendix H Continued…
8.8.2 MDS plots of average subtidal cover data (in 2 or 3 dimensions)
Plots are shown following the application of different similarity measures for the PERMDISP analysis when averaged by year and site. MG = Modified
Gower. N = 5-7 for each point. An example plot is shown.
1
1
1
1
1
8
8
8
8
Stress: 0.19
MG10
MSE1MSE2MSE3MSW1MSW2 8

TR 2009/020 Meola Reef Ecological Monitoring: 2001 – 2008 106
8.9 Appendix I. MDS plots of average subtidal reef composition over time
Plots are based on Bray-Curtis similarities from ln transformed count and cover data. n= 30 to 35
for each year
2001
2002
2003
2004
2005
2006
2007
2008
Stress: 0.112001
2002
2003
2004
2005
2006
2007
2008
Stress: 0.11
Count
2002
2003
2004
2005
2006
2007
2008
Stress: 0.08
2002
2003
2004
2005
2006
2007
2008
Stress: 0.08
Cover excluding 2001
20012002200320042005200620072008
Stress: 0.01
20012002200320042005200620072008
Stress: 0.01
Cover