understanding application data movement … berkeley workshop submission 1 understanding application...
TRANSCRIPT

IXPUG15 Berkeley Workshop Submission 1
Understanding Application Data Movement Characteristics using
Intel’s VTune Amplifier and Software Development Emulator tools
Douglas Doerfler Computer Systems Engineer Advanced Technology Group
Lawrence Berkeley National Laboratory

IXPUG15 Berkeley Workshop Submission 2
Overview
▪ Motivation -> Roofline Performance Model ➢ Arithmetic Intensity: the ratio of total floating-point operations
(FLOPs) to total data movement (bytes) ➢ Need a method to measure FLOPs and data movement
▪ Software Development Environment Toolkit -> FLOPs and bytes (as seen by the L1) ➢ Allows developers to gain familiarity with upcoming instruction set
extensions using currently available compilers ➢ Built on Intel’s Pin and XED tools
▪ VTune Amplifier -> bytes (as seen by DRAM) ➢ Intel’s performance analysis and profiling tool

IXPUG15 Berkeley Workshop Submission 3
SDE Capability used in this Study ▪ Dynamic instruction tracing
➢ Mix histogram tool: dynamic instructions executed, instruction length, instruction category, and ISA extension grouping
▪ Invocation ➢ sde64 -hsw -d -iform 1 -omix my_mix.out -global_region -start_ssc_mark
111:repeat -stop_ssc_mark 222:repeat -- my_exe
▪ Code instrumentation (Intel compiler only, no #include required) __SSC_MARK(0x111); // start SDE instruction tracing
for (k=0; k<NTIMES; k++) {
#pragma omp parallel for
for (j=0; j<STREAM_ARRAY_SIZE; j++)
a[j] = b[j]+scalar*c[j];
}
__SSC_MARK(0x222); // stop SDE tracing

IXPUG15 Berkeley Workshop Submission 4
VTune Capabilities used in this Study
▪ Uncore memory controller counters to determine DRAM bandwdith analysis
▪ Invocation ➢ amplxe-cl -start-paused -data-limit=0 -collect bandwidth my_exe
▪ Code instrumentation # include <ittnotify.h>
__itt_resume(); // start Vtune
for (k=0; k<NTIMES; k++) {
#pragma omp parallel for
for (j=0; j<STREAM_ARRAY_SIZE; j++)
a[j] = b[j]+scalar*c[j];
}
__itt_pause(); // stop Vtune
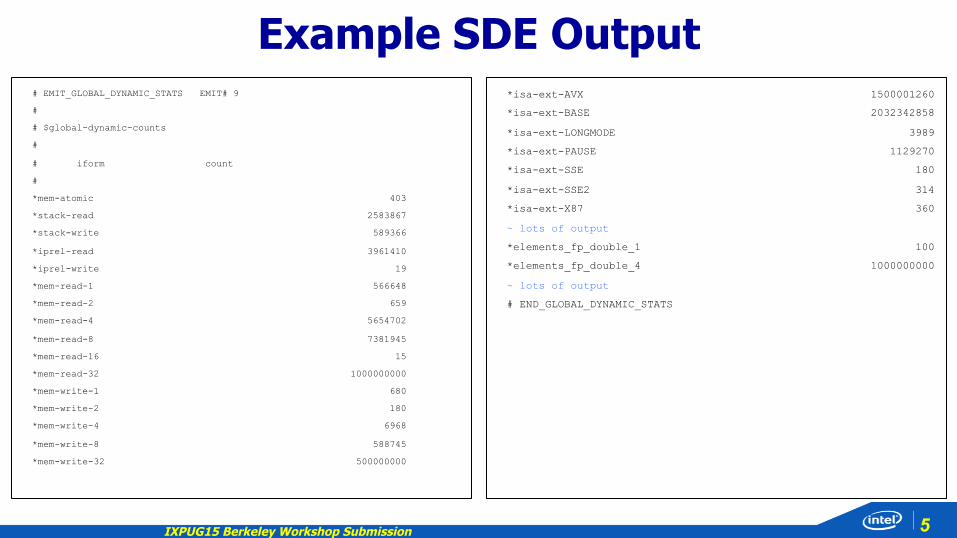
IXPUG15 Berkeley Workshop Submission 5
Example SDE Output # EMIT_GLOBAL_DYNAMIC_STATS EMIT# 9
#
# $global-dynamic-counts
#
# iform count
#
*mem-atomic 403
*stack-read 2583867
*stack-write 589366
*iprel-read 3961410
*iprel-write 19
*mem-read-1 566648
*mem-read-2 659
*mem-read-4 5654702
*mem-read-8 7381945
*mem-read-16 15
*mem-read-32 1000000000
*mem-write-1 680
*mem-write-2 180
*mem-write-4 6968
*mem-write-8 588745
*mem-write-32 500000000
*isa-ext-AVX 1500001260
*isa-ext-BASE 2032342858
*isa-ext-LONGMODE 3989
*isa-ext-PAUSE 1129270
*isa-ext-SSE 180
*isa-ext-SSE2 314
*isa-ext-X87 360
~ lots of output
*elements_fp_double_1 100
*elements_fp_double_4 1000000000
~ lots of output
# END_GLOBAL_DYNAMIC_STATS
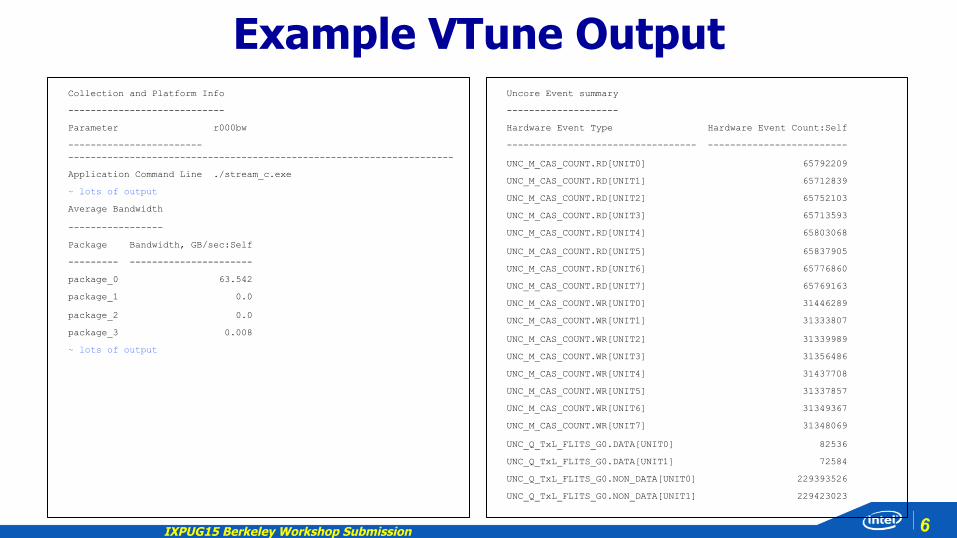
IXPUG15 Berkeley Workshop Submission 6
Example VTune Output Collection and Platform Info
----------------------------
Parameter r000bw
------------------------ ---------------------------------------------------------------------
Application Command Line ./stream_c.exe
~ lots of output
Average Bandwidth
-----------------
Package Bandwidth, GB/sec:Self
--------- ----------------------
package_0 63.542
package_1 0.0
package_2 0.0
package_3 0.008
~ lots of output
Uncore Event summary
--------------------
Hardware Event Type Hardware Event Count:Self
---------------------------------- -------------------------
UNC_M_CAS_COUNT.RD[UNIT0] 65792209
UNC_M_CAS_COUNT.RD[UNIT1] 65712839
UNC_M_CAS_COUNT.RD[UNIT2] 65752103
UNC_M_CAS_COUNT.RD[UNIT3] 65713593
UNC_M_CAS_COUNT.RD[UNIT4] 65803068
UNC_M_CAS_COUNT.RD[UNIT5] 65837905
UNC_M_CAS_COUNT.RD[UNIT6] 65776860
UNC_M_CAS_COUNT.RD[UNIT7] 65769163
UNC_M_CAS_COUNT.WR[UNIT0] 31446289
UNC_M_CAS_COUNT.WR[UNIT1] 31333807
UNC_M_CAS_COUNT.WR[UNIT2] 31339989
UNC_M_CAS_COUNT.WR[UNIT3] 31356486
UNC_M_CAS_COUNT.WR[UNIT4] 31437708
UNC_M_CAS_COUNT.WR[UNIT5] 31337857
UNC_M_CAS_COUNT.WR[UNIT6] 31349367
UNC_M_CAS_COUNT.WR[UNIT7] 31348069
UNC_Q_TxL_FLITS_G0.DATA[UNIT0] 82536
UNC_Q_TxL_FLITS_G0.DATA[UNIT1] 72584
UNC_Q_TxL_FLITS_G0.NON_DATA[UNIT0] 229393526
UNC_Q_TxL_FLITS_G0.NON_DATA[UNIT1] 229423023
IXPUG15 Berkeley Workshop Submission 7
1.E+00&
1.E+01&
1.E+02&
1.E+03&
1.E+04&
1.E+05&
1.E+06&
1.E+07&
1.E+08&
1.E+09&
1.E+10&
1.E+11&
elements_fp_double_1&&elements_fp_double_2&&elements_fp_double_4&&elements_fp_double_8&&
mem<read<1&&mem<read<2&&mem<read<4&&mem<read<8&&
mem<read<16&&mem<read<32&&mem<read<64&&mem<write<1&&mem<write<2&&mem<write<4&&mem<write<8&&mem<write<16&&mem<write<32&&mem<write<64&&
Total&Bytes&
Instruc(on*Count*(Bytes*for*Total*Bytes)*
stream_mpi.c& stream.c&
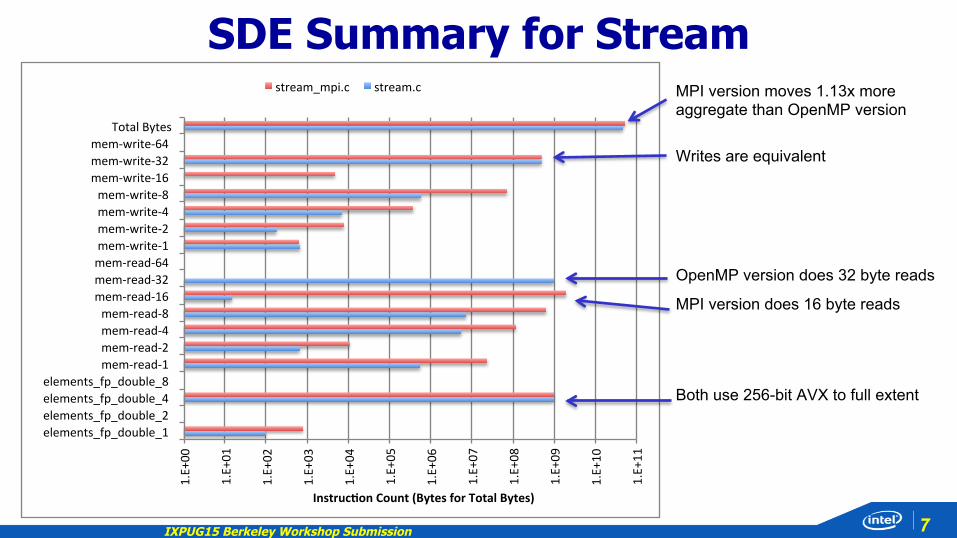
SDE Summary for Stream
Writes are equivalent
OpenMP version does 32 byte reads
MPI version does 16 byte reads
MPI version moves 1.13x more aggregate than OpenMP version
Both use 256-bit AVX to full extent

IXPUG15 Berkeley Workshop Submission 8
1.E+03'
1.E+04'
1.E+05'
1.E+06'
1.E+07'
1.E+08'
1.E+09'
1.E+10'
1.E+11'
UNC_M_CAS_COUNT.RD[UNIT0]'UNC_M_CAS_COUNT.RD[UNIT1]'UNC_M_CAS_COUNT.RD[UNIT2]'UNC_M_CAS_COUNT.RD[UNIT3]'UNC_M_CAS_COUNT.RD[UNIT4]'UNC_M_CAS_COUNT.RD[UNIT5]'UNC_M_CAS_COUNT.RD[UNIT6]'UNC_M_CAS_COUNT.RD[UNIT7]'UNC_M_CAS_COUNT.WR[UNIT0]'UNC_M_CAS_COUNT.WR[UNIT1]'UNC_M_CAS_COUNT.WR[UNIT2]'UNC_M_CAS_COUNT.WR[UNIT3]'UNC_M_CAS_COUNT.WR[UNIT4]'UNC_M_CAS_COUNT.WR[UNIT5]'UNC_M_CAS_COUNT.WR[UNIT6]'UNC_M_CAS_COUNT.WR[UNIT7]'
Total'Bytes'
Memory'transfer'count'(Bytes'for'Total'Bytes)'
stream_mpi.c' stream.c'
VTune Summary for Stream
Higher read rate for MPI is visible at the DRAM interface
MPI version moves 1.29x more data

IXPUG15 Berkeley Workshop Submission 9
1.E+00&
1.E+01&
1.E+02&
1.E+03&
1.E+04&
1.E+05&
1.E+06&
1.E+07&
1.E+08&
1.E+09&
1.E+10&
1.E+11&
1.E+12&
1.E+13&
elements_fp_double_1&&elements_fp_double_2&&elements_fp_double_4&&elements_fp_double_8&&
mem<read<1&&mem<read<2&&mem<read<4&&mem<read<8&&
mem<read<16&&mem<read<32&&mem<read<64&&mem<write<1&&mem<write<2&&mem<write<4&&mem<write<8&&mem<write<16&&mem<write<32&&mem<write<64&&
Total&Bytes&
Instruc(on*Count*(Bytes*for*Total*Bytes)*
p72.in& p4t18.in&
SDE Summary for MILC
In general, MPI write traffic > OpenMP
MPI version does 64-bit reads
In general, MPI read traffic > OpenMP
MPI version moves 1.10x more aggregate than OpenMP version
Both have equivalent FLOPs

IXPUG15 Berkeley Workshop Submission 10
1.E+03'
1.E+04'
1.E+05'
1.E+06'
1.E+07'
1.E+08'
1.E+09'
1.E+10'
1.E+11'
1.E+12'
UNC_M_CAS_COUNT.RD[UNIT0]'UNC_M_CAS_COUNT.RD[UNIT1]'UNC_M_CAS_COUNT.RD[UNIT2]'UNC_M_CAS_COUNT.RD[UNIT3]'UNC_M_CAS_COUNT.RD[UNIT4]'UNC_M_CAS_COUNT.RD[UNIT5]'UNC_M_CAS_COUNT.RD[UNIT6]'UNC_M_CAS_COUNT.RD[UNIT7]'UNC_M_CAS_COUNT.WR[UNIT0]'UNC_M_CAS_COUNT.WR[UNIT1]'UNC_M_CAS_COUNT.WR[UNIT2]'UNC_M_CAS_COUNT.WR[UNIT3]'UNC_M_CAS_COUNT.WR[UNIT4]'UNC_M_CAS_COUNT.WR[UNIT5]'UNC_M_CAS_COUNT.WR[UNIT6]'UNC_M_CAS_COUNT.WR[UNIT7]'
Total'Bytes'
Memory'transfer'count'(Bytes'for'Total'Bytes)'
p72.in' p4t18.in'
VTune Summary for MILC
MPI version moves 1.21x more data
Higher read and write rates for MPI is visible at the DRAM interface

IXPUG15 Berkeley Workshop Submission 11
Insights & Summary ▪ Using a well known micro-benchmark, the differences in data
movement between an MPI and an OpenMP implementation was demonstrated
➢ This method has been applied to the applications GTC-P and MILC and similar characteristics were observed; More to be analyzed in the future
▪ SDE provides a wealth of information that will allow you to better understand your application ➢ Started using SDE to count floating-point operations ➢ Found SDE can also be used to better understand data movement ➢ This study only focused on memory and floating-point instructions ➢ Future efforts will delve into function-level specific counters, larger instruction mix
analysis, etc ➢ SDE output can consist of multiple files and is lengthy; I developed my own script
to parse out data of interest
▪ VTune can be used to analyze uncore data movement

IXPUG15 Berkeley Workshop Submission 12
Other interesting tips
▪ Generate a VTune report per package/socket as opposed to aggregating all memory controller counters across all sockets ➢ amplxe-cl –R hw-events –group-by=package –r r000bw
▪ VTune report with per function counter data ➢ amplxe-cl –R hw-events –r r000bw

IXPUG15 Berkeley Workshop Submission 13
Thank You
▪ Special thanks to Matthew Cordery who initially developed the methodology
▪ Doug Doerfler ▪ [email protected]