understanding the economy from the ground up - pwc … · · 2017-08-15understanding the economy...
TRANSCRIPT
A granular look at Australia’s economic future beyond the resources investmentboom
Understanding the economyfrom the ground up
$1 in every $5National income comesfrom just 10 locations
1 in 3locations hadeconomies thatcontracted last year
Unique analysisreveals boththese trendshave beenintensifyingover the last14 years
www.pwc.com.au
01Key points
02Implications
03What’s really driving the Australian economy?
04Three types of growth and decline
05About the modelling
06Related thought leadership
07Contacts
2
Contents
PwC
PwC’s research suggests that a new wave of economicgrowth can be unlocked through better understanding,and then exploiting, the vast diversity that existing at thelocal levels of our economy.
We have understood this diversity through unique,granular economic modelling of 2,214 locations whichmake up the Australian economy. Locations refer to theABS defined Statistical Area 2 (SA2) boundaries whichcover Australia. Each of these locations containsapproximately 10,000 residents.
A number of key trends that have influenced growth overthe past 14 years have been identified and tracked.
Understanding these trends presents majoropportunities: allowing decision makers to appreciatelikely return on investments and showing where thereare growth opportunities to be realised on a location bylocation basis.
Snapshot of key findings1. Economic activity is concentrated: Close to one in
every five dollars of national income comes fromjust 10 locations (out of 2,214 locations).
2. Economic activity is fragmented: One in threelocations (out of 2,214 locations) had economiesthat contracted last year .
3. Both these trends have been intensifying over thelast 14 years. Looking forward, these trends do notshow signs of reversing.
4. Sitting below these headline figures we find thatthere are three primary types of growth (anddecline) that influence a granular location:
a. Seasonal growth (and decline) –eg: agricultural areas experiencing varyingweather patterns
b. Cyclical growth (and decline) – eg: growthassociated with a specific industry orinvestment cycle, such as majorinfrastructure investment
c. Structural growth (and decline) – eg:locations which possess both a competitive mixof industries and a locational advantage whichis delivering sustained periods of growth.
5. $350 billion was spent last year by business andgovernment on investments in these 2,214 specificlocations. Understanding the granular spatialcharacteristics of our economy provides theevidence base to make better decisions, improvingthe business returns and societal outcomes.
Key points
3
“Close to 1 in every5 dollars of nationalincome comes from just10 locations”
PwC
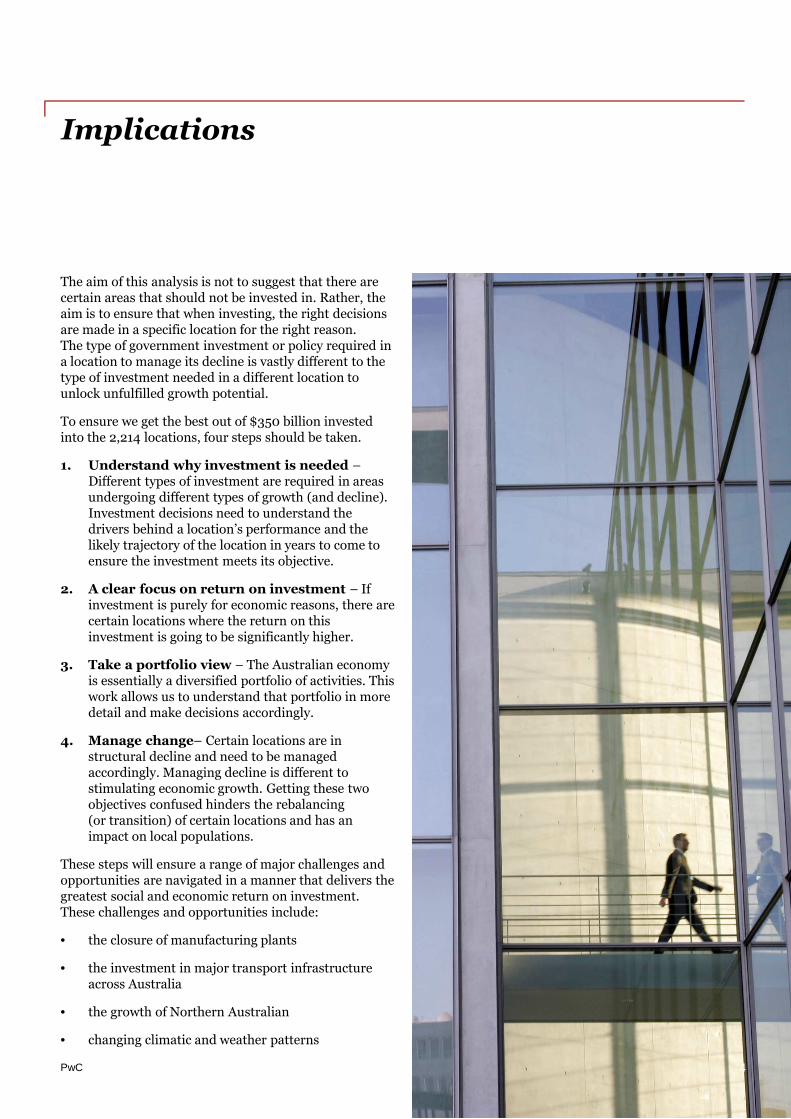
The aim of this analysis is not to suggest that there arecertain areas that should not be invested in. Rather, theaim is to ensure that when investing, the right decisionsare made in a specific location for the right reason.The type of government investment or policy required ina location to manage its decline is vastly different to thetype of investment needed in a different location tounlock unfulfilled growth potential.
To ensure we get the best out of $350 billion investedinto the 2,214 locations, four steps should be taken.
1. Understand why investment is needed –Different types of investment are required in areasundergoing different types of growth (and decline).Investment decisions need to understand thedrivers behind a location’s performance and thelikely trajectory of the location in years to come toensure the investment meets its objective.
2. A clear focus on return on investment – Ifinvestment is purely for economic reasons, there arecertain locations where the return on thisinvestment is going to be significantly higher.
3. Take a portfolio view – The Australian economyis essentially a diversified portfolio of activities. Thiswork allows us to understand that portfolio in moredetail and make decisions accordingly.
4. Manage change– Certain locations are instructural decline and need to be managedaccordingly. Managing decline is different tostimulating economic growth. Getting these twoobjectives confused hinders the rebalancing(or transition) of certain locations and has animpact on local populations.
These steps will ensure a range of major challenges andopportunities are navigated in a manner that delivers thegreatest social and economic return on investment.These challenges and opportunities include:
• the closure of manufacturing plants
• the investment in major transport infrastructureacross Australia
• the growth of Northern Australian
• changing climatic and weather patterns
Implications
4

PwC
Many Australians currently are grappling with thequestion: what is going to drive economic growth in theyears to come?
We thought we would approach the challenge from anew, bottom up perspective: understanding how theeconomy functions at the granular and local levels.
To do this we mapped the spatial characteristics of oureconomy: more precisely, we calculated economic outputfor 2,214 locations across Australia, from 2000/01 to2013/14, in a manner consistent and reconcilable withmethods used by the Australian Bureau of Statistics(ABS).
This is important because when you understand theindividual characteristics of Australia’s 2,214 locations itbecomes clear how diverse the Australian economyreally is. This is important because business andGovernment invested close to $350 billion in these2,214 diverse locations last year. Evidence baseddecisions making and demonstrating a solid return oninvestment should be increasingly important toprospering in a rapidly changing and volatile economicland.
Against this backdrop, business and government need toacknowledge and understand four things about ourgranular economy:
1. Economic growth is concentrated
- Nearly one in five dollars of Australia’snational income comes from just ten locations(out of 2,214 locations)
- This implies that there are a very small handfulof locations that really matter to the Australianeconomy. There are a very large number oflocations in Australia that from an economicperspective, matter very little.
2. Economic activity is fragmented
- The Australian economy growing at2.5 per cent last financial year hides the factthat more than one in three locations (out of2,214) actually had economies that contracted.
3. Both these trends have been intensifying …
What’s really driving the Australianeconomy?
5
16.5%
16.5%
16.3%
16.2%
16.3%
16.8%
16.9%
16.8%
16.8%17.3%
17.4%17.5%
17.9%
15.0%
16.0%
17.0%
18.0%
19.0%
FY
02
FY
03
FY
04
FY
05
FY
06
FY
07
FY
08
FY
09
FY
10
FY
11
FY
12
FY
13
FY
14
Exhibit 1: Proportion of Australian GDPconcentrated in just 10 locations

PwC
4. … and both these trends will continue tointensify into the future:
- More areas experiencing economic decline.This is being driven by:
› Performance of key manufacturinglocations declining (and/or closing)
› Winding up of the capital investmentphase of the resource boom andcontraction of certain resources industryto mirror current market forces.
- Fewer key locations will be relied upon to drivean increasingly large share of economicgrowth. From an economic point of view, thisimplies we should potentially be less worriedabout the fact that 1 in 3 locations arecontracting. However, from a social and equitypoint of view this creates unique challengesand potential conflicts between economic andsocial policy and investment imperatives
- There is nothing to suggest that these trendsare slowing or are able to be reversed
- Grappling with this reality has been, and willcontinue to be one of the most challengingquestion facing business and government,explaining patchy policy, investments andbusiness performance across Australia.
What’s really driving the Australianeconomy? (cont’d)
6
3. Both these trends have been intensifying …
- Both trends have been intensifying over thepast 14 years. The implications of this areexplored below:
› More and more locations are sufferingdeclines while a key handful of locationsare becoming more and more important.
› A shift from 16.2 per cent in Fy05 to17.9 per cent in FY14 (Exhibit 1) may notsound like much but it actually representsa real transfer of over $27 billion fromlocations around Australia to these tenkey locations. This is equivalent to theentire Tasmanian economy and all itsemployees being transferred into theseten key locations.
› A key trend, masked during the recentresource booms, has been the role thatCBDs and concentrations of high valueadd urban economic cluster have playedin driving this trend. While the spotlighthas been on the Pilbra and thephenomenal growth of economic activitygenerated from these resource deposits, ithas actually been these urban areas whichhave been steadily generating a largershare of economic output. This has driventhe bulk of this change and is also themost important factor as we move beyondthe mining boom.
“The Australianeconomy isessentially adiversified portfolioof activities.This work allows usto understand ourportfolio inmore detail.”
23%24%
12%
21%
27% 27%
22%
29% 29%
35%
29%
34% 35%
0%
10%
20%
30%
40%
50%
FY
02
FY
03
FY
04
FY
05
FY
06
FY
07
FY
08
FY
09
FY
10
FY
11
FY
12
FY
13
FY
14
Exhibit 2: Proportion of locations in recession

PwC
It’s a well-known fact that Australia has had 24 years ofsustained economic growth. However, the same cannotbe said for all locations in Australia.
Rather, there are three patterns of granular growth(and decline) that characterise locations across Australia.Understanding the type of growth or decline in a specificlocation is key to making the correct investment or policydecision. Misunderstanding the nature of growth ordecline in specific location can erode the competitivenessof business and drains government funding through mis-specified policy and investment initiatives.
The Australian economy has expanded by approximately46 per cent in real terms since 2000/01. Exhibit 3 belowshows the greatest contributors to this growth. Exhibit 4highlights locations where the economy has contractedover this period.
Interpreting these tables we can see that the MelbourneCBD grew by $24.42 billion over this period, expandingby 76 per cent. On the other hand, the economy ofChurchill (Latrobe valley, Victoria) contracted by21 per cent, implying a loss of $1.19 billion.
The locations within these tables will be used in theremaining chapter to highlight the differing patterns ofgranular growth across Australia.
Three types of economic growth and decline
7
Exhibit 3: Granular growth
Location Change in economic output* (FY01 – FY14), $M Growth as a proportion of economy in FY01
Melbourne CBD^ 24,420 76%
Sydney CBD 18,560 37%
Ashburton (WA) 17,253 611%
East Pilbara 17,201 776%
Perth City 12,196 73%
Brisbane City 10,154 72%
Pyrmont – Ultimo 4,971 173%
Macquarie Park – Marsfield 4,916 108%
Adelaide 4,824 43%
Australia 491,260 46%
Note: All locations are SA2 (as defined by the ABS) with the exception of the Melbourne CBD^ which encompasses the Melbourne City, Southbank and Docklands SA2s.* Real Economic Output is calculated in a manner consistent and reconcilable with the ABSSource: PwC Geospatial Economic Model (GEM) 2015.

PwC
Exhibit 4: Granular decline
Three types of economic growth and decline(cont’d)
8
LocationChange in economic
output* (FY01 – FY14), $MGrowth as a proportion
of economy in FY01
Nanango (Qld) -1,219 -61%
Churchill (Latrobe Valley, Vic) -1,189 -21%
Moe – Newborough (Latrobe Valley, Vic) -452 -20%
Condell Park (Sydney, NSW) -401 -20%
Wetherill Park Industrial (Sydney, NSW) -249 -10%
Mount Gravatt (Brisbane, Qld) -152 -23%
Sunnybank (Brisbane, Qld) -127 -40%
West Footscray – Tottenham (Melbourne, Vic) -126 -19%
Deniliquin (rural, NSW) -104 -25%
Cairns City (Qld) -102 -4%
Australia 491,260 46%
Note: All locations are SA2 (as defined by the ABS) SA2s.* Real Economic Output is calculated in a manner consistent and
reconcilable with the ABSSource: PwC Geospatial Economic Model (GEM) 2015.

PwC
There are three patterns of growth and decline:structural, cyclical and seasonal. Understandingstructural growth and decline is the most important froma government perspective, with strategic investmentsable to influence these outcomes. Cyclical and seasonalgrowth and decline occur naturally in the economy, withgovernment and business needing to account for thesetrends when investing.
1. Structural growth and decline
Structural growth
Structural growth is defined as locations which have had14 years of real economic growth. Combined, theselocations account for 15 per cent of the Australianeconomy.
The drivers behind structural growth are diverse. This ishighlighted by examining examples from Exhibit 3.
• Major CBDs
- Accounting for a disproportionally highproportion of the Australian economy, thesedense, multi-industry urban economic clusterswithin our major capital cities are becomingmore important. This looks set to continuegiven these locations house the high value addknowledge industry jobs which are becomingincreasingly important to Australia’scompetitiveness.
- However, as shown in Exhibit 3, even growthbetween CBDs is very diverse. The MelbourneCBD grew by 76 per cent over the 14 yearperiods, substantially above the nationalaverage (46 per cent).
- This growth was primarily driven by thephysical expansion of the CBD into Docklandsand Southbank, two locations which haveconsistently outperformed in terms of annualeconomic growth. The spatially constrainedSydney CBD only grew by 37 per cent over thesame period, below the national average.However, recent results show the economicperformance of the Sydney CBD to be pickingup. The physical expansion of the CBD intoBarangaroo should also drive strong growthsimilar to the Southbank and Docklandsexperience.
• Resource areas (Ashburton and East Pilbra)
- Many resource areas have experiencedphenomenal growth, albeit off a very low base.The growth has been a combination of twodrivers of granular growth: increased demandfor commodities (structural growth) as well asthe capital investment required to extract thesecommodities (cyclical growth, discussed onpage 12).
• Pyrmont (Sydney, NSW)
- Growth has been driven by a combination ofthe expansion of the CBD and a dynamic mix ofhigh value add service and innovation sectorjobs. We consistently see locations on thefringes of the CBD outperforming the actualCBDs in terms of year on year growth rates,highlighting the growing importance of theseareas to the national economy. Otherexamples of this trend includes Surry Hills inSydney, Fortitude Valley in Brisbane, Braddonin Canberra and Docklands and Southbankwithin Melbourne.
• Macquarie Park (Sydney, NSW)
- A business park development that has grownvery strongly since 2000. This growth wasaccelerated by the opening of the Epping toChatswood Rail Link (ECRL). This providedthe location greater connectivity with otherkey areas of economic strength and expandedthe skilled labour market which businesses inthe area can draw from. It also underscore theimportance not just of a specific location, butthe connectivity to, and between, key locations.
Three types of economic growth and decline(cont’d)
9

PwC
Structural decline
For this analysis, we define structural decline as being indecline for the majority of years since 2000/01 and/or havea smaller economy (in real terms) than they did in 2001.Combined, this accounts for an estimated one in sevenlocations within Australia.
The drivers behind structural declines are diverse. This ishighlighted by examining examples in Exhibit 4:
• Nanango (Qld), Churchill and Moe (LatrobeValley, Victoria)
- These are locations which have relied heavily oncoal extraction and associated coal fired powerplants to drive economic growth. All locationshave been hit by both volume and price effects.On the volume side, demand has ebbed as moreefficient energy sources have meant a fallingreliance on these plants. In turn, the price paidfor this coal has fallen markedly.
- Both Churchill and Moe have a fairly diverseeconomic base and are in closely proximity tomajor metropolitan areas (compared to othermining areas). This has helped ensure that thedeclines in resource output have not translatedinto contractions in surrounding industries orassociated job losses. While the area is stillundergoing adjustment, these locations provideinsights as to how other resource dependentlocations may be able manage the declineassociated with the completion of majorinvestment and falling commodity prices.
• Condell Park and Wetherill Park (Sydney,NSW)
- These are traditional manufacturing, wholesaletrade and transport & logistics servicelocations. Both have experience continualdownward decline over the past 14 years due totwo factors:
1. The erosion of the competitiveness oftraditional Australian manufacturing andthe flow on effects this has had to theassociated trade and transport serviceswithin the location
2. The importance of location and thegrowing concentration of economic outputin key locations. In this case, bothlocations have felt the effects of industryshifting towards Eastern Creek. EasternCreek arguably offers more competitiveaccess to major transport routes and hasattracted major logistics, trade andmanufacturing companies. The result hasbeen a growing concentration of theseindustries around this key location, fromtraditional locations which lack the samelevel or transport connectivity or benefitsthat stem from being closely located withcomplimentary companies.
Three types of economic growth and decline(cont’d)
10

PwC
• Mount Gravatt and Sunnybank (Brisbane, Qld)
- These two locations have contracted for 12 outof the 14 years since 2001/02, more than anyother locations within Australia.
Both these locations have diverse economicbases, yet have been experiencing gradualdecline. The decline here has been driven byspatial factors as well as the location’scontinued integration into the Brisbane urbanarea. Strong growth in major shopping centresand ‘big box’ retail in surrounding suburbs hasdrawn retail and service activities out of thesesuburbs towards the larger areas ofspecialisation.
This is another example of economic activitywithin Australia becoming more concentratedaround certain locations, albeit on a suburb bysuburb level. This is a trend we see played outacross Australia, with many ‘traditional’suburbs suffering declines in retail andindustry activity as this is drawn towards majorcentres.
Importantly, this decline has not translatedinto direct impacts on residents, with the areastill showing population and wage growth.This underpins the importance of connectivity,with the locations playing an increasing role asa source of labour, but decreasing role as a localcentre of economic activity.
• Deniliquin (rural NSW)
- Deniliquin faces a combination of interlinkeddemographic, climatic and economicchallenges. Severe drought conditions and adeclining population and workforce imply thetown faces structural economic challenges.
• Cairns CBD (Queensland)
- Cairns CBD has experienced a contraction inboth retail, accommodation and food serviceeconomic output and employment. This hasbeen driven by the challenges that theAustralian tourism market has faced under thehigh Australian dollar as well as shiftinginternational visitor preference (in this case areduction of Japanese tourists travelling toCairns).
- Importantly, the overall Cairns urban area hasgrown over the periods examined. Thisindicates that the structural challenges havebeen concentrated in the CBD, one discretelocation within the urban area.
Three types of economic growth and decline(cont’d)
11
PwC
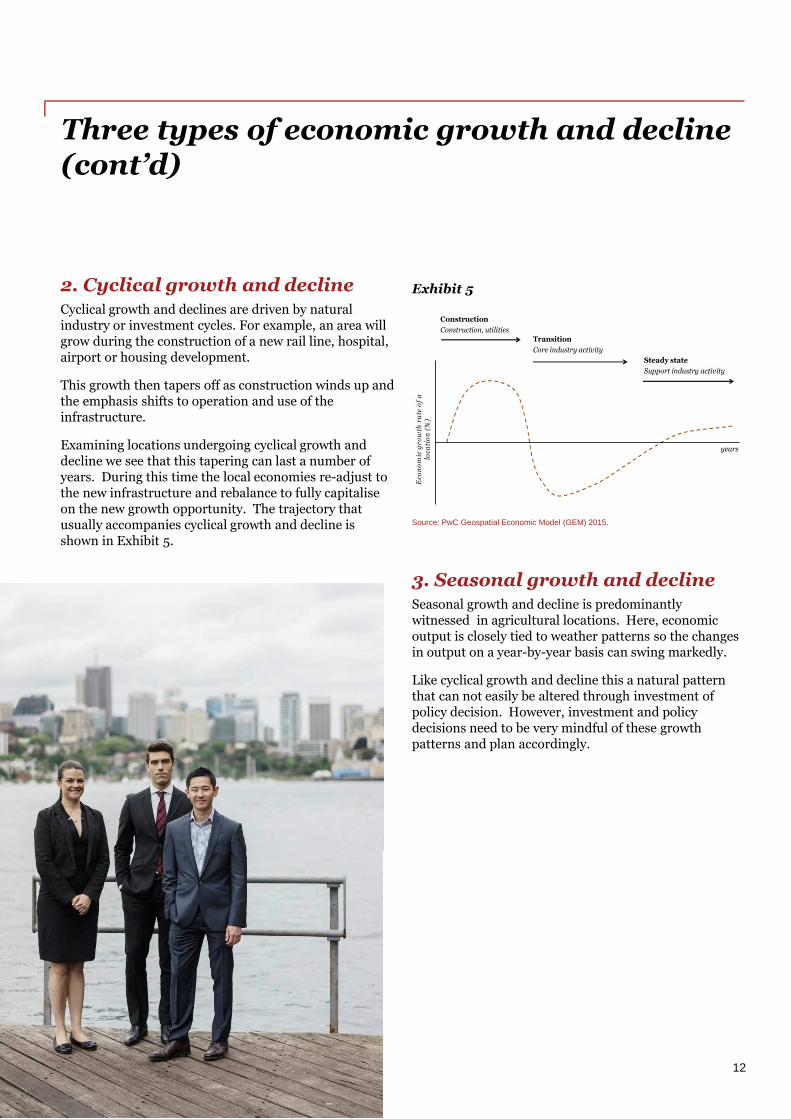
2. Cyclical growth and declineCyclical growth and declines are driven by naturalindustry or investment cycles. For example, an area willgrow during the construction of a new rail line, hospital,airport or housing development.
This growth then tapers off as construction winds up andthe emphasis shifts to operation and use of theinfrastructure.
Examining locations undergoing cyclical growth anddecline we see that this tapering can last a number ofyears. During this time the local economies re-adjust tothe new infrastructure and rebalance to fully capitaliseon the new growth opportunity. The trajectory thatusually accompanies cyclical growth and decline isshown in Exhibit 5.
Exhibit 5
Source: PwC Geospatial Economic Model (GEM) 2015.
3. Seasonal growth and declineSeasonal growth and decline is predominantlywitnessed in agricultural locations. Here, economicoutput is closely tied to weather patterns so the changesin output on a year-by-year basis can swing markedly.
Like cyclical growth and decline this a natural patternthat can not easily be altered through investment ofpolicy decision. However, investment and policydecisions need to be very mindful of these growthpatterns and plan accordingly.
Three types of economic growth and decline(cont’d)
12
Construction
Construction, utilitiesTransition
Core industry activity
Steady state
Support industry activity
years
Eco
no
mic
gro
wth
rate
of
alo
cati
on
(%)

PwC
A quick overview on PwCs ground-breaking GeospatialEconomic Model (GEM)
• Economic output is calculated for 2,214 locationsacross Australia. Locations are SA2, as defined bythe ABS. Each of these locations containsapproximately 10,000 people.
• Economic output is calculated using the incomemethod and is consistent and reconcilable with theABS methodology and ABS produced aggregates.
• The economic time series runs from 2000/01 to2103/14, with projections out to 2030.
• Economic output (and projections) can also bebroken down into it's components to get a granularview of what is occurring in a location. For example,we can look at the performances of the professionalservices sector in the CBD, the break this downfurther to understand what is driving these results:income to employees, income to business or incometo government.
About the modelling
13
• We understand that economic performance is onlyone dimension that business and government needto understand in order to prosper in our changingeconomy. That is why we treat the economics as justone ‘layer’ within the broader GEM. This allowseconomic performance to be tested and correlatedto the other dimensions that matter. These includesocial and demographic factors (eg age, income,education, housing density, etc), access to transportand infrastructure, access to essential services,climatic conditions, customer preference, intentionto purchase, crime statistics and more.
• We also realise the importance of incorporatinginternal business or departmental specific data intoour analyses. Simply put: your data + our data =unparalleled clarity. In an uncertain and highlycompetitive environment, this is the type of clarityrequired to make the right strategic policy andinvestment decisions.
Data fusion Data layers
GDP (ABS)Gross Domestic Product
GSAP (PwC)Gross Small Area Product
GSP (ABS)Gross State Product
Other industry data
ABSCensus
data
ABSEconomic
data
ABSIndustry
data
Your data
Our data
Data lenses
Economic
Retail andcustomer
Social anddemographics
factors
Labour force
Climate
Transport andinfrastructure
Industry
PwC
Related thought leadership
14

PwC
For further information, contact your usual PwC advisor or one of these contacts:
John StudleyPartner, Data & Analytics leadTel: +61 (3) 8603 3770E: [email protected]
Jeremy ThorpePartner, Economics & PolicyTel: +61 (2) 6271 [email protected]
Rob TysonDirector, Economics & Policy and GEM leaderTel: 61 (2) 6271 [email protected]
Contacts
15

www.pwc.com.au
© 2015 PricewaterhouseCoopers. All rights reserved. PwC refers to the Australian member firm, and may sometimes refer to the PwC network. Eachmember firm is a separate legal entity. Please see www.pwc.com/structure for further details.
This report has been prepared by PricewaterhouseCoopers (PwC). The information, statements, statistics and commentary (together the ‘Information’)contained in this report have been prepared by PwC from publicly available material.
PwC may in their absolute discretion, but without being under any obligation to do so, update, amend or supplement this document.
PwC have based this report on information received or obtained, on the basis that such information is accurate and, where it is represented by thestakeholders as such, complete. The Information contained in this report has not been subject to an Audit. The Information contained in this report does notconstitute financial or investment advice. The Information and images must not be copied, reproduced, distributed, or used, in whole or in part, without thewritten permission of PwC. Any use must be sourced to PwC.