using the smooth receiver operating curve (roc) method for
TRANSCRIPT

Using the smooth Receiver Operating Curve (ROC) method for evaluation and decision making in biometric systems Prepared by: Dmitry Gorodnichy Science & Engineering Directorate, Canadian Border Services Agency 79 Bentley Avenue, Ottawa, Ontario K1A 0L8 Canada Eric Granger École de technologie supérieure, Université du Québec Stan Matwin School of Electrical Engineering and Computer Science of the University of Ottawa Scientific Authority: Pierre Meunier DRDC Centre for Security Science 613-944-4367 The scientific or technical validity of this Contract Report is entirely the responsibility of the Contractor and the contents do not necessarily have the approval or endorsement of the Department of National Defence of Canada.
Contract Report DRDC-RDDC 2014-C July 2014

IMPORTANT INFORMATIVE STATEMENTS PROVE-IT (FRiV) Pilot and Research on Operational Video-based Evaluation of Infrastructure and Technology: Face Recognition in Video, PSTP 03-401BIOM was supported by the Canadian Safety and Security Program (CSSP) which is led by Defence Research and Development Canada’s Centre for Security Science, in partnership with Public Safety Canada. Led by Canada Border Services Agency partners included : Royal Canadian Mounted Police, Defence Research Development Canada, Canadian Air Transport Security Authority, Transport Canada, Privy Council Office; US Federal Bureau of Investigation, National Institute of Standards and Technology, UK Home Office; University of Ottawa, Université Québec (ÉTS). The CSSP is a federally-funded program to strengthen Canada’s ability to anticipate, prevent/mitigate, prepare for, respond to, and recover from natural disasters, serious accidents, crime and terrorism through the convergence of science and technology with policy, operations and intelligence.
© Her Majesty the Queen in Right of Canada, as represented by the Minister of National Defence, 2014
© Sa Majesté la Reine (en droit du Canada), telle que représentée par le ministre de la Défense nationale, 2014


AbstractThis report presents the use of the smooth ROC method for evaluation of biometric systems, which
can be used in developing decision making rules for face recognition triaging. From a performance
evaluation perspective, the problem can be decomposed into two subproblems: the first deals with
detecting the presence or absence of a specified person of interest (POI) in a given video frame,
and the second measures the strength of matching between the POI image and the face found in
the video frame. The former can be viewed as a binary decision of detecting (or the lack there
of), and the latter is based on a score that depicts the strength of matching. Ideally, the objective
of the system is to measure the agreement between higher matching scores with the presence of
POI in the video frame based on the assumption that a higher matching score corresponds to a
higher likelihood of the POI being present in the frame. The accumulation of this performance
information across the stream of video frames will yield information required for performance
assessment analysis of the system as a whole.
Keywords: video-surveillance, face recognition in video, instant face recognition, watch-list
screening, biometrics, reliability, performance evaluation
Community of Practice: Biometrics and Identity Management
Canada Safety and Security (CSSP) investment priorities:
1. Capability area: P1.6 – Border and critical infrastructure perimeter screening technologies/
protocols for rapidly detecting and identifying threats.
2. Specific Objectives: O1 – Enhance efficient and comprehensive screening of people and
cargo (identify threats as early as possible) so as to improve the free flow of legitimate goods
and travellers across borders, and to align/coordinate security systems for goods, cargo and
baggage;
3. Cross-Cutting Objectives CO1 – Engage in rapid assessment, transition and deployment
of innovative technologies for public safety and security practitioners to achieve specific
objectives;
4. Threats/Hazards F – Major trans-border criminal activity – e.g. smuggling people/ material
3

AcknowledgementsThis work is done within the PROVE-IT(FRiV) project (PSTP-03-401BIOM) funded by the De-
fence Research and Development Canada (DRDC) Centre for Security Science (CSS) Public Se-
curity Technical Program (PSTP) by the following contributors:
1. D. Gorodnichy, Science & Engineering Directorate, Canadian Border Services Agency.
2. E. Granger, Ecole de technologie superieure, Universite du Quebec.
3. S. Matwin, School of Electrical Engineering and Computer Science of the University of
Ottawa.
DisclaimerThe results presented in this report were produced in experiments conducted by CBSA, and should
therefore not be construed as vendor’s maximum-effort full-capability result. In no way the results
presented in this paper imply recommendation or endorsement by the Canada Border Services
Agency, nor do they imply that the products and equipment identified are necessarily the best
available for the purpose.
4

Release NotesContext: This document is part of the set of reports produced for the PROVE-IT(FRiV) project.
All PROVE-IT(FRiV) project reports are listed below.
• Dmitry Gorodnichy, Eric Granger “PROVE-IT(FRiV): framework and results”. Also published in
Proceedings of NIST International Biometrics Performance Conference (IBPC 2014), Gaithersburg,
MD, April 1-4, 2014. Online at http://www.nist.gov/itl/iad/ig/ibpc2014.cfm.
• Dmitry Gorodnichy, Eric Granger, “Evaluation of Face Recognition for Video Surveillance”. Also
published in Proceedings of NIST International Biometric Performance Conference (IBPC 2012),
Gaithersburg, March 5-9, 2012. Online at http://www.nist.gov/itl/iad/ig/ibpc2012.cfm.
• E. Granger, P.Radtke, and D. Gorodnichy, “Survey of academic research and prototypes for face
recognition in video,”
• D. Gorodnichy, E.Granger, and P.Radtke, “Survey of commercial technologies for face recognition
in video,”
• E. Granger and D. Gorodnichy, “Evaluation methodology for face recognition technology in video
surveillance applications,’
• D. Gorodnichy, E. Granger, E. Choy, W. Khreich, P.Radtke, J. Bergeron, and D. Bissessar, “Results
from evaluation of three commercial off-the-shelf face recognition systems on Chokepoint dataset,”
• S. Matwin, D. Gorodnichy, and E. Granger, “Using smooth ROC method for evaluation and decision
making in biometric systems,”
• D. Gorodnichy, E. Granger, E. Neves, S. Matwin, “3D face generation tool Candide for better face
matching in surveillance video,”
• E. Neves, S. Matwin, D. Gorodnichy, and E. Granger, “Evaluation of different features for face
recognition in video,”
The PROVE-IT(FRiV) project took place from August 2011 till March 2013. This document
was drafted and discussed with project partners in March 2013 at the Video Technology for Na-
tional Security (VT4NS) forum. The final version of it was produced in March 2014.
Appendices: This report is accompanied by appendices which include the presentations related
to this report at the VT4NS’11 and VT4NS’13 forums.
5

Contents1 Problem definition 7
2 Performance analysis method 7
3 Interpreting the results 7
4 A sample analysis 8
5 Conclusions 10
Presentation at VT4NS’11 11
Presentation at VT4NS’13 14
6

1 Problem definitionGiven a stream of frames F = {Ft} obtained from a camera source and given a list of images of
particular persons of interest (POIs), call it list L = {Li}, the objective of the system is to detect the
presence of the target image L∗i in F . First, let us reduce the problem to a single frame Ft extracted
from the stream F . If a face is detected in frame Ft , the facial recognition system computes a
matching score Si for each image of interest in Li against every video frame Ft . This means that a
given face in Ft may be matched to several images of interest of Li potentially generating multiple
hits most of which are likely to be false positives – only one image of interest is an exact match to
the face in frame Ft . Therefore, it is crucial that the system produces Si scores whose magnitudes
reflect the strength or quality of the matching. Using the magnitudes of these matching scores, the
system will be able to prioritize the strongest matches to decide an appropriate course of action.
The objective of the evaluation is to assess how the magnitudes of these Si scores produces the
desired hits in the video stream.
2 Performance analysis methodThe evaluation of the overall performance of the system becomes intuitive with the use of the
smooth ROC method [1]. Ideally, the system should detect all instances of strong matches whilst
raising the least number of false alarms. However, the performance of this system depends on
the ability of the matching scores Si to capture the desired matching based on their magnitudes.
Therefore, the use of the smROC performance metric is advantageous due to its ability to measure
the agreement between the magnitude of continuous value scores Si and a binary decision, the
latter can represent the decision of whether the recognized face is of interest or not, and the former
is the score Si of matching a face in frame Ft to the image of interest Li. The smROC method
plots individual instance of matching Li ∈ Ft as line segments which collectively form the smROC
curve. The corresponding Si scores are used to determine the slope of the corresponding line
segments so that scores equal to 1 are represented by vertical line segments, matching scores Si of
zero are plotted as horizontal line segments, and line segments of slopes between 1 and 0 represent
Si scores between zero and one. In other words, decreasing Si scores results in line segments being
rotated clockwise, from vertical to horizontal slopes proportionally to the magnitude of Si.
3 Interpreting the resultsPlotting the above line segments, which correspond to individual instances of matchings, in a
decreasing order of their corresponding scores for a given set of matchings, produces the smROC
7

curve. When the curve is convex up, it means that the strongest positive matches (where the POI
is indeed in the video frame) have been assigned higher scores, and the weakest negative matches
(where the POI is not in the video frame) are assigned low scores. Therefore, the ideal performance
will have an smROC curve placed towards the north-west corner of the plot, which also produces
the highest area under the smROC curve. Thus, calculating this area under the curve can provide a
scalar (numeric) summary of the overall performance of the system on the given set of matchings.
4 A sample analysisFor illustration, consider the sample matching scores Si listed in Table 1. In this example, instances
of detecting any POI are recorded in the Table 1. The top row shows instance numbers (a unique
identifier), the second row lists the corresponding labels indicating whether the matched image is
that of a POI or not (a label entry of yes/no corresponds to the ground truth of image Li being
in frame Ft), and Si is the matching score between the POI image and the image in frame i as
calculated by the system. For the purpose of performance evaluation, these instances of matchings
are sorted in a decreasing order of their matching scores (from left to right in Table 1). The
corresponding smROC curve is presented in Figure 1. Plotting the smROC curve and calculating
the area under it follow Algorithm 2 published in [1].
Table 1: Sample matching scores Si of POI images Li in video frames
i 7 3 13 12 9 5 10 6 4 1 8 11 14 2
Li ∈ Ft yes yes yes yes yes yes yes no yes no no yes no no
Si 1 1 1 1 .96 .93 .89 .66 .49 .43 .30 .29 .04 .01
When the Si scores are assigned in a perfect agreement with the ground truth labels, the curve
is expected to follow the blue line depicting a vertical rise followed by a horizontal run. In this
case, the curve shows that the positive and negative matchings are assigned high and low scores
respectively demonstrating a correct performance of the system because high scores (vertical line
segments) precede the low ones. In addition, the area under the blue curve is maximal at value
of 1.0 indicating perfect ranking performance. Alternatively, when the score magnitudes fail to
depict the strength of correct matching, the performance is said to be random and is expected to
follow the dotted black diagonal line in the same figure. If we consider the red curve in Figure
1 plotted for those matchings listed in Table 1, we see that most of the high scores coincide with
yes labels and most of the low scores are assigned to no labels. This suggests that the sample
scores are reasonably well assigned because they are better than random although they do not
achieve the perfect rankings (instances 6 and 11 are incorrectly placed in the order of score values).
8

Figure 1: The smROC (or Scored ROC) curve for matchings listed in Table 1. The blue solid
line depicts the ideal (perfect) performance and the black dotted line represents the random per-
formance. The area under the red smROC curve represents a scalar summary of the performance
of the system on the given set of matchings.
Furthermore, the score values are not all ones (for the yes labels) and instances with no labels have
a non zero score. To this effect, the area under the red curve fails to achieve the 100% level
depicted by the blue solid curve, however, it remains above the random performance indicated by
the 0.5 area under the dotted black diagonal line. Comparing the scalar values of the areas under
the three curves (blue, red and black) will produce the desired performance comparison.
The area under the smROC curve represents a scalar summary of the performance of the match-
ing scores as assigned to matching instances. However, further examination of the curve itself can
identify individually interesting instances. For instance, the numbers shown next to individual line
segments along the red curve in the figure correspond to the unique identifiers of matching in-
stances listed in Table 1. If we visually inspect individual line segments, we can see that instances
7, 3, 13, and 12 result in vertical line segments indicating a very strong match. The next group of
instances 9, 5 and 10 are more vertical than the remaining instances but are not completely vertical
either. And finally, line segments 4 and 11 are the most vertical among the remaining instances but
compared to the previous two groups, they appear horizontal. If we examine the labels of these
9

three groups of instances, we can see that they are all labeled with yes indicating that the asso-
ciated video frame matches the corresponding image of the POI involved. Therefore, these three
groups of instances represent positive matches detected by the system. Furthermore, it is clear that
there is a significant change of direction along the curve between line segments 10 and 6. Setting
the operational alarm threshold at that point will result in high number of hits (7 out of 9 yes are
captured) with no false alarms.
Effectively, the same approach can be used for the detection of true positive matchings among
the many matchings executed for the stream of video frames. This suggests an added benefit of
using the smROC to fine tune and monitor the performance of the proposed system, it provides a
visual representation of possible thresholds which can be used for raising alarms by the system.
For instance, the alarm threshold may be set to raise a red alarm for the first two groups discussed
above, an amber alarm for the third group and no alarm for the remaining instances of matches.
5 ConclusionsThe use of smROC curve to assess the performance of the proposed facial detection system pro-
vides several benefits particular to this problem. The correctness of image detection and balancing
the trade-off between hits and alarms relies on how well the matching scores are assigned to
matching instances. The magnitudes of matchings are essential for the prioritization of alarms,
and they enable the system to maximally capture positive detections while raising minimal false
alarms. The smROC method is the only method reported in literature that is able to incorporate
the magnitudes of the scores into the analysis of hits versus alarms. Therefore, the possible use of
the smROC may include measuring the detection performance in various settings, these may be:
• Testing and validation: for a given set of matchings, the area under the smROC curve could
be used to demonstrate the ability of the system to detect the desired images. This process
should be executed repeatedly on various data point sets in various testing experiments to
assess the expected performance of the system. An aggregated report of the accumulated
results will support a reliable conclusion of the expected overall performance.
• Monitoring system operation: The calculation of the area under the smROC curve pro-
vides a simplified performance summary that can be regularly monitored over a window of
time. This can potentially allow for the detection of possible deterioration in system per-
formance over time. For instance, measuring the performance over a window of 2-3 hours
on a daily basis can reveal deviations from the expected performance (as estimated during
testing and validation). This may be important based on the method used to calculate the
matching scores because many methods assume that the underlying characteristics of the
10

domain hardly change over time. In real life, this cannot be further from the truth. There-
fore, it is important to monitor the operational performance of the matching model to detect
underlying distribution changes.
• Determining alarm thresholds: as discussed previously, individual matching instances
are represented as line segments whose slopes are directly associated with the correctness
and magnitudes of matchings between images and video frames. We’ve illustrated how the
examination of these slopes can help prioritize matching instances to determine the threshold
of alarm that achieves the desired rate of hits versus alarms. Repeated thorough testing and
validation of the system will reveal natural ”kinks” in the performance curves that can allow
the selection of appropriate alarm thresholds.
References[1] William Klement, Peter A. Flach, Nathalie Japkowicz, Stan Matwin: Smooth Receiver Op-
erating Characteristics (smROC) Curves. Machine Learning and Knowledge Discovery in
Databases, Lecture Notes in Computer Science Volume 6912, 2011, pp 193-208.
11

– 0000000000003000000000000000000000000000080000000000000000000 – 0000000000002000000000000000000000000000090000000000000000000 – 0000002000001000000000000000001000000000090000000000000000000 – 0000002000001000000000000000001000000000090000000000000000000 – 0000000000002000000000000000000000000000080000000000000000000 – 0000002000002000000000000000000000000000090000000000000000000 – 0000000000002000000000000000000000000000090000000000000000000 – 0000000000003000000000000000000000000000090000000000000000000 – 0000000000002000000000000000000000000000090000000000000000000 – 0000000000003000000000000000000000000000080000020000000000000

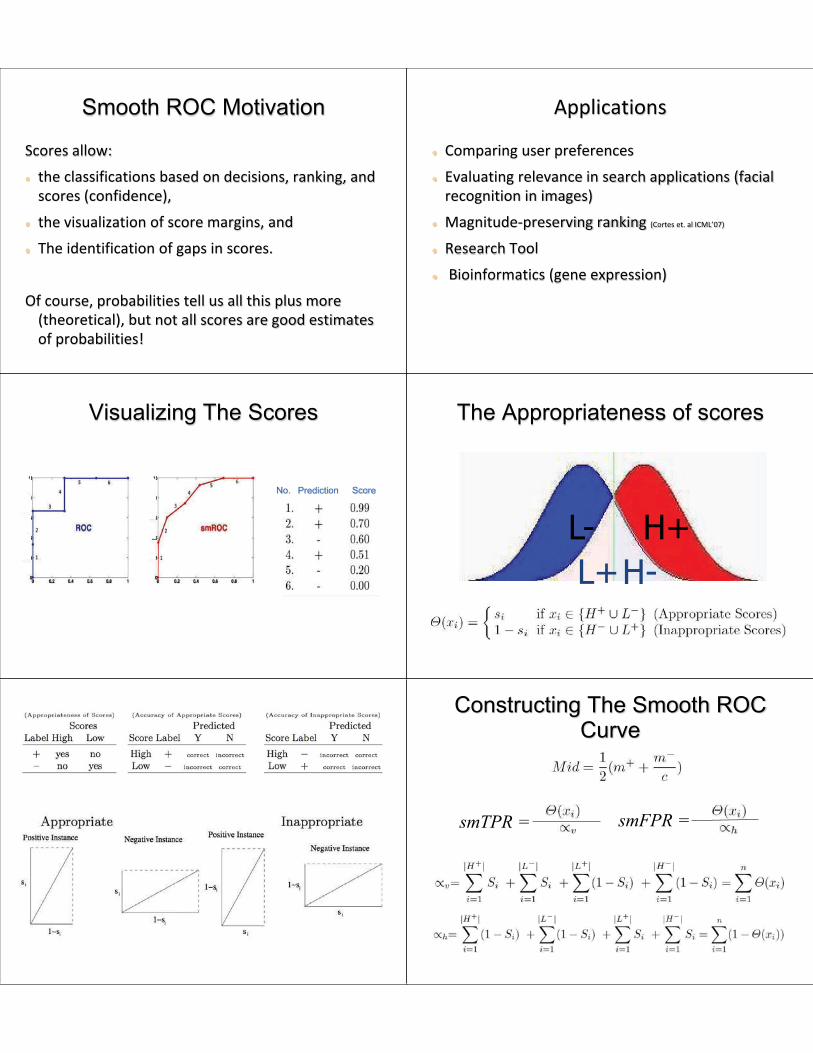
Scores allow:
the classifications based on decisions, ranking, and scores (confidence),
the visualization of score margins, and
The identification of gaps in scores.
Of course, probabilities tell us all this plus more (theoretical), but not all scores are good estimates of probabilities!
Applications
Comparing user preferences
Evaluating relevance in search applications (facial recognition in images)
Magnitude-preserving ranking (Cortes et. al ICML’07)
Research Tool
Bioinformatics (gene expression)
