van drong elen 2003 synchrony
DESCRIPTION
aTRANSCRIPT
Synchrony Levels During Evoked Seizure-Like Bursts in MouseNeocortical Slices
Wim van Drongelen,1,2 Henner Koch,3 Charles Marcuccilli,1 Fernando Pena,3 and Jan-Marino Ramirez3
Departments of 1Pediatrics, 2Neurology, and 3Organismal Biology and Anatomy, The University of Chicago, Chicago, Illinois 60637
Submitted 21 April 2003; accepted in final form 12 May 2003
van Drongelen, Wim, Henner Koch, Charles Marcuccilli, FernandoPena, and Jan-Marino Ramirez. Synchrony levels during evokedseizure-like bursts in mouse neocortical slices. J Neurophysiol 90:1571–1580, 2003; 10.1152/jn.00392.2003. Slices (n � 45) from thesomatosensory cortex of mouse (P8-13) generated spontaneous burstsof activity (0.10 � 0.05 Hz) that were recorded extracellularly.Multiunit action potential (AP) activity was integrated and used as anindex of population activity. In this experimental model, seizure-likeactivity (SLA) was evoked with bicuculline (5–10 �M) or N-methyl-D-aspartate (NMDA, 5 �M). SLA was an episode with repetitivebursting at a frequency of 0.50 � 0.06 Hz. To evaluate whether SLAwas associated with a change in synchrony, we obtained simultaneousintracellular and extracellular recordings (n � 40) and quantified therelationship between individual cells and the surrounding populationof neurons. During the SLA there was an increase in populationactivity and bursting activity was observed in neurons and areas thatwere previously silent. We defined synchrony as cellular activity thatis consistently locked with the population bursts. Signal-averagingtechniques were used to determine this component. To quantitativelyassess change in synchronous activity at SLA onset, we estimated theentropy of the single cell’s spike trains and subdivided this measureinto network burst-related information and noise-related entropy. Theburst-related information was not significantly altered at the onset ofNMDA-evoked SLA and slightly increased when evoked with bicu-culline. The signal-to-noise ratio determined from the entropy esti-mates showed a significant decrease (instead of an expected increase)during SLA. We conclude that the increased population activityduring the SLA is attributed to recruitment of neurons rather than toincreased synchrony of each of the individual elements.
I N T R O D U C T I O N
Epilepsy is the most common serious pathological neuro-logic condition. It affects approximately 50 million peopleworldwide, with an incidence in developed countries of 50–70cases per 100,000 (Hauser et al. 1991). A better understandingof epileptogenesis at the cellular and molecular level is crucialbecause recent studies suggest that nearly 40% of peoplediagnosed with partial seizures are not controlled with anticon-vulsants (Gilliam 2002; Kwan and Brodie 2000; Mattson et al.1996). From the standpoint of electrophysiology, the ictal stateis traditionally associated with synchronized hyperactivity inneural networks and high levels of cellular depolarization(Connors 1984; Gutnick et al. 1982). However, synchroniza-tion in the nervous system is not always pathological. In fact,
synchronized population activity can be observed during boththe sleep and the awake state, and it is one of the hallmarks ofinformation processing in the mammalian nervous system(e.g., Jackson et al. 2003). Consequently, the most importantchallenges in epilepsy research are to understand the process ofictogenesis and to discriminate between activity occurring dur-ing an epileptic state and synchronized activity occurring dur-ing other physiological states.
To study burst activity, we performed electrophysiologicalrecordings on neocortical slices of the somatosensory area ofmouse. We selected the neocortex because it pertains to theseizures most commonly seen in the clinical setting of pediatricepilepsy. Other researchers have successfully used cortical andhippocampal slice preparations in the study of epilepsy (e.g.,Avoli et al. 1987; Bikson et al. 2002; Connors 1984; Connorsand Amitai 1993; Dickson and Alonso 1997; Gutnick et al.1982; Hablitz 1987; Netoff and Schiff 2002; Nishimura et al.1996; Schwartzkroin 1994) and other state-dependent pro-cesses, such as sleep- and wakefulness (Sanchez-Vives andMcCormick 2000). The neocortical slice enabled us to performsimultaneous extra- and intracellular recordings in a controlledenvironment, thus allowing us to examine to what extent a cellis synchronized with its environment—“the network.” One ofthe most common methods of inducing bursting behavior underexperimental conditions is the application of pharmacologicalagents that block synaptic inhibition or mimic an excess ofexcitatory synaptic input (Connors and Amitai 1993). To de-crease inhibition of the network elements, we applied bicucul-line, an antagonist of the �-aminobutyric acid (GABAA) re-ceptor–channel complex. An excess of excitatory input wasobtained with N-methyl-D-aspartate (NMDA) application tostimulate the excitatory NMDA receptors.
We used averaging techniques to quantify synchrony and amethod described by Reich et al. (2001) to estimate differentcomponents of entropy of single-unit spike trains. Computationof spike train–related entropy allowed us to quantify the rela-tionship between the activity of individual neurons and theassociated network action potential activity. In the experi-ments, entropy values were obtained 1) at baseline activity, 2)during the peak of either bicuculline- or NMDA-induced burst-ing (a seizure-like transient state), and 3) at steady state. Asmall portion of this study was described in a preliminaryreport (van Drongelen et al. 2003).
Address for reprint requests: Wim van Drongelen, The University of Chi-cago, Department of Pediatrics, MC 3055, 5841 S. Maryland, Chicago, IL60637 (E-mail: [email protected]).
The costs of publication of this article were defrayed in part by the paymentof page charges. The article must therefore be hereby marked ‘‘advertisement’’in accordance with 18 U.S.C. Section 1734 solely to indicate this fact.
J Neurophysiol 90: 1571–1580, 2003;10.1152/jn.00392.2003.
15710022-3077/03 $5.00 Copyright © 2003 The American Physiological Societywww.jn.org
M E T H O D S
Neocortical slices
Neonatal (P8-13) male or female CD-1 mice (n � 25) were deeplyanesthetized with ether and decapitated at the C3/C4 spinal level, andcortex samples were isolated in ice-cold artificial cerebrospinal fluid(ACSF). One hemisphere was then glued onto an agar block with itsrostral end up and mounted into a vibrating tissue slicer. Coronalslices (500 �m thick) of the somatosensory cortex were transferredinto a recording chamber and submerged under a stream of ACSF(temperature, 30°C; flow rate, 10 ml/min) containing (in mM): 118NaCl, 3 KCl, 1.5 CaCl2, 1 MgSO4, 25 NaHCO3, 1 NaH2PO4, and 30D-glucose equilibrated with carbogen (95% O2-5% CO2). In all ex-periments, the potassium concentration was routinely raised from 3 to5 mM over 30 min to obtain spontaneous rhythmic activity close to0.1 Hz.
Experiments
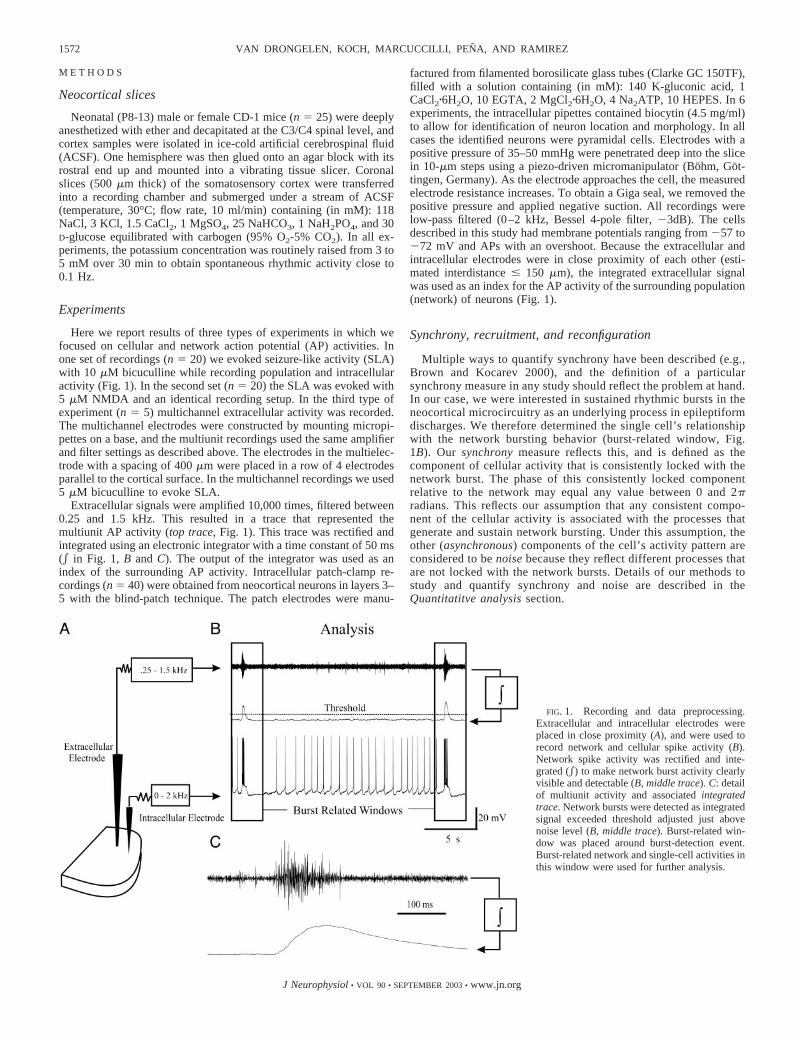
Here we report results of three types of experiments in which wefocused on cellular and network action potential (AP) activities. Inone set of recordings (n � 20) we evoked seizure-like activity (SLA)with 10 �M bicuculline while recording population and intracellularactivity (Fig. 1). In the second set (n � 20) the SLA was evoked with5 �M NMDA and an identical recording setup. In the third type ofexperiment (n � 5) multichannel extracellular activity was recorded.The multichannel electrodes were constructed by mounting micropi-pettes on a base, and the multiunit recordings used the same amplifierand filter settings as described above. The electrodes in the multielec-trode with a spacing of 400 �m were placed in a row of 4 electrodesparallel to the cortical surface. In the multichannel recordings we used5 �M bicuculline to evoke SLA.
Extracellular signals were amplified 10,000 times, filtered between0.25 and 1.5 kHz. This resulted in a trace that represented themultiunit AP activity (top trace, Fig. 1). This trace was rectified andintegrated using an electronic integrator with a time constant of 50 ms(� in Fig. 1, B and C). The output of the integrator was used as anindex of the surrounding AP activity. Intracellular patch-clamp re-cordings (n � 40) were obtained from neocortical neurons in layers 3–5 with the blind-patch technique. The patch electrodes were manu-
factured from filamented borosilicate glass tubes (Clarke GC 150TF),filled with a solution containing (in mM): 140 K-gluconic acid, 1CaCl2�6H2O, 10 EGTA, 2 MgCl2�6H2O, 4 Na2ATP, 10 HEPES. In 6experiments, the intracellular pipettes contained biocytin (4.5 mg/ml)to allow for identification of neuron location and morphology. In allcases the identified neurons were pyramidal cells. Electrodes with apositive pressure of 35–50 mmHg were penetrated deep into the slicein 10-�m steps using a piezo-driven micromanipulator (Bohm, Got-tingen, Germany). As the electrode approaches the cell, the measuredelectrode resistance increases. To obtain a Giga seal, we removed thepositive pressure and applied negative suction. All recordings werelow-pass filtered (0–2 kHz, Bessel 4-pole filter, �3dB). The cellsdescribed in this study had membrane potentials ranging from �57 to�72 mV and APs with an overshoot. Because the extracellular andintracellular electrodes were in close proximity of each other (esti-mated interdistance � 150 �m), the integrated extracellular signalwas used as an index for the AP activity of the surrounding population(network) of neurons (Fig. 1).
Synchrony, recruitment, and reconfiguration
Multiple ways to quantify synchrony have been described (e.g.,Brown and Kocarev 2000), and the definition of a particularsynchrony measure in any study should reflect the problem at hand.In our case, we were interested in sustained rhythmic bursts in theneocortical microcircuitry as an underlying process in epileptiformdischarges. We therefore determined the single cell’s relationshipwith the network bursting behavior (burst-related window, Fig.1B). Our synchrony measure reflects this, and is defined as thecomponent of cellular activity that is consistently locked with thenetwork burst. The phase of this consistently locked componentrelative to the network may equal any value between 0 and 2�radians. This reflects our assumption that any consistent compo-nent of the cellular activity is associated with the processes thatgenerate and sustain network bursting. Under this assumption, theother (asynchronous) components of the cell’s activity pattern areconsidered to be noise because they reflect different processes thatare not locked with the network bursts. Details of our methods tostudy and quantify synchrony and noise are described in theQuantitatitve analysis section.
FIG. 1. Recording and data preprocessing.Extracellular and intracellular electrodes wereplaced in close proximity (A), and were used torecord network and cellular spike activity (B).Network spike activity was rectified and inte-grated (�) to make network burst activity clearlyvisible and detectable (B, middle trace). C: detailof multiunit activity and associated integratedtrace. Network bursts were detected as integratedsignal exceeded threshold adjusted just abovenoise level (B, middle trace). Burst-related win-dow was placed around burst-detection event.Burst-related network and single-cell activities inthis window were used for further analysis.
1572 VAN DRONGELEN, KOCH, MARCUCCILLI, PENA, AND RAMIREZ
J Neurophysiol • VOL 90 • SEPTEMBER 2003 • www.jn.org
The term recruitment is applied to neurons with AP activity that donot show any synchrony with the network during the baseline (BLN)phase before seizure onset, and that become (at least partly) synchro-nous during SLA. Recruitment can be subdivided into two types.
1) Recruitment in the strict sense (S-recruitment) encompassescells that display no consistently locked network-related AP and/orsubthreshold activity during the BLN phase, but become synchronizedduring SLA onset.
2) Cells that display synchronous subthreshold depolarization dur-ing the BLN phase and discharge synchronously during the SLA alsobecome recruited in a broader sense. Because just altering the neu-ron’s excitability could mimic this type of recruitment, we refer to thisas E-recruitment.
We believe that distinguishing between both types of recruitment(S- and E-recruitment) is critical. Subthreshold activity during theBLN phase will also contribute to field potentials in the EEG; thusE-recruitment is not necessarily associated with dramatic changesin the field potential. In contrast, neurons that are without anynetwork-related activity during the BLN phase, although synchro-nized during the SLA phase, will alter field potential recordingsduring the transition.
Our recordings frequently revealed yet another form of networkalteration.Neurons inhibited during the network burst during the BLNphase and excited after SLA onset will contribute to a change in EEGand network activity. Although these neurons may remain synchro-nized with the population activity, their phase of discharge is altered.We hypothesize that this phenomenon is attributedto a drastic changein neuronal processing within cortical networks (e.g., suppression ofinhibitory pathways) and we therefore refer to this alteration asreconfiguration.
Quantitative analysis
In recordings where cellular AP activity was redistributed afteronset of SLA, the changes in the level of synchronization betweencellular and network activity were quantified. Units that showedrecruitment during SLA were not included in this type of analysis.Bursts of APs generated by the population (network) were detectedas the integrated AP activity exceeded a threshold (Fig. 1B). Thisthreshold was determined visually in each recording and placedjust above the noise level of the integrated signal. The populationburst frequency and the area under the curve of the integratedbursts were measured. The product of mean area under the curveand the number of bursts s�1 was used as a measure of burstactivity in the network per unit time.
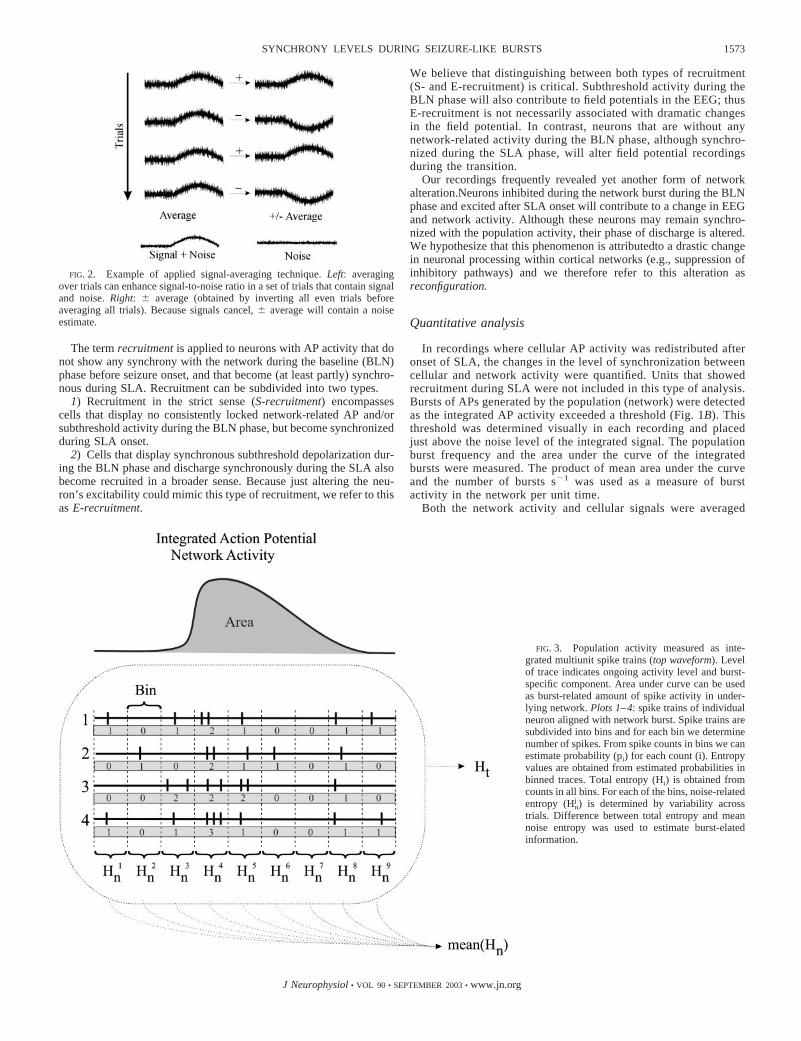
Both the network activity and cellular signals were averaged
FIG. 2. Example of applied signal-averaging technique. Left: averagingover trials can enhance signal-to-noise ratio in a set of trials that contain signaland noise. Right: � average (obtained by inverting all even trials beforeaveraging all trials). Because signals cancel, � average will contain a noiseestimate.
FIG. 3. Population activity measured as inte-grated multiunit spike trains (top waveform). Levelof trace indicates ongoing activity level and burst-specific component. Area under curve can be usedas burst-related amount of spike activity in under-lying network. Plots 1–4: spike trains of individualneuron aligned with network burst. Spike trains aresubdivided into bins and for each bin we determinenumber of spikes. From spike counts in bins we canestimate probability (pi) for each count (i). Entropyvalues are obtained from estimated probabilities inbinned traces. Total entropy (Ht) is obtained fromcounts in all bins. For each of the bins, noise-relatedentropy (Hn
j ) is determined by variability acrosstrials. Difference between total entropy and meannoise entropy was used to estimate burst-elatedinformation.
1573SYNCHRONY LEVELS DURING SEIZURE-LIKE BURSTS
J Neurophysiol • VOL 90 • SEPTEMBER 2003 • www.jn.org

using the detected burst onset of the network activity as the trigger.This trigger was placed in the middle of an analysis window (Fig.1B). The activity in the trials was averaged in the usual manner andin a so-called � average. A simulated example of these averagingprocedures is shown in the left and right columns in Fig. 2. In thisexample the trials contain a consistent and time-locked sinusoidalsignal with superimposed random noise. The average process en-hances the signal-to-noise ratio by reducing the noise; the endresult (the average) contains the signal plus residual noise. In the �average every other trial is inverted, so that the signal componentis cancelled in the end result (Fig. 2). However, the residual noiseis still present in the � averaged result because the estimate of theenergy level of random noise in the trials does not depend onwhether averaging or � averaging is used (Schimmel 1967). Theamount of residual noise in the average and the � average isrelated to the amount of noise in the trials and the square root ofthe number of trials included in the average. The quotient of theRMS (root mean square) values of the demeaned average and �average is commonly used as an index for the signal versus noisecomponents. Strictly this ratio is the signal plus noise (S � N)divided by the noise (N) because the average includes both thesignal component and the residual noise (Fig. 2). In the followingwe refer to the RMS ratio as the signal (� noise)-to-noise ratio.This ratio is a good indicator for the synchronous component,
defined as the time-locked component in the signal. For eachrecording we used the same number of trials in the averages acrossdifferent bursting patterns and thus we could also use this tech-nique to compare signal (� noise)-to-noise levels obtained duringthe different patterns. This ratio was also used for comparison witha signal (� noise)-to-noise ratio estimated from entropy measuresdescribed in the following paragraph. To avoid large effects ofnonstationarity as much as possible, analysis was carried out for10 –30 subsequent bursts within each of the states (preseizure,seizure, and postseizure) separately. For each cell the number oftrials considered for the analysis was determined by the number ofbursts observed during the SLA.
To study network-related information content in the cellular activ-ity, the entropy of the intracellularly recorded spike trains was esti-mated. The method we applied is identical to the one described byReich et al. (2001). The only difference was that we aligned the spiketrains in the trials according to the population burst (burst-relatedwindow, Fig. 1B) and not on the basis of an external stimulation ortrigger. A simplified example of the procedure is shown in Fig. 3.Here we depict 4 trials aligned with the network burst (top trace inFig. 3). The first step to obtain an entropy value for the cellular APactivity was to divide the spike trains into bins (9 bins in each of the4 trials in the example of Fig. 3). The distribution of the spike countsin the bins was used as an estimate of the probability (pi) for each
FIG. 4. Result obtained from integrated network action potential (AP) activity. A: bicuculline-evoked seizure-like activity(SLA). B: N-methyl-D-aspartate (NMDA)–evoked SLA. C: example of four-channel recording of bicuculline-evoked SLA. At SLAonset, fourth channel becomes involved in bursting activity. D: bar graph of mean burst rate (bars represent SE) during differentphases for bicuculline experiments (left) and NMDA experiments (right). E: bar graph of mean area under curve of integratedwaveform (bars represent SE) during different phases for bicuculline experiments (left) and NMDA experiments (right). F: bargraph of product of D and E. In D, E, and F, significant differences (P � 0.05) are indicated with arrows. Significant differencebetween SLA states (P � 0.05) is indicated with dashed line.
1574 VAN DRONGELEN, KOCH, MARCUCCILLI, PENA, AND RAMIREZ
J Neurophysiol • VOL 90 • SEPTEMBER 2003 • www.jn.org

observed count (i). In the example of Fig. 3 we have a total of 4 � 9 �36 bins; we observe 15 bins with zero spikes (p0 � 15/36), 15 binswith one spike (p1 � 15/36), 5 bins with two spikes (p2 � 5/36, and1 bin with three spikes (p3 � 1/36). This probability was used forentropy estimation (H) applying Shannon’s formula for entropy as thebasis (Reich et al. 2001; Strong et al. 1998)
H � ���i�0
�
pi 2log pi�� B (1)
A bias term B was added to the estimate of the entropy to correct forunderestimation. The estimated probabilities derived from the spikecounts will differ from the real ones because of the limited number ofobservations. It was shown by Victor (2000) that an estimate of thebias can be made, by taking the number of observed states (K) and thenumber of observations (O) into account
B � �K � 1�/�2O ln 2� (2)
In the example of Fig. 3 we show 4 � 9 � 36 observations and4 different states (0, 1, 2, and 3 spikes per bin: i.e., O � 36 andK � 4). The total entropy was determined by taking into accountall bins, and represents the variability across time (Ht, Fig. 3). Thecell’s APs that are not locked with the population burst contributeto the variability in the observed spike trains. Spike counts in thebins across trials were used to estimate the noise entropy for each
bin j (Hnj , for the 9 bins in Fig. 3). The mean value of all noise
estimates was used as the noise estimate for further analysis. Whencalculating Hn
j , we frequently encountered subsequent bins withzero value in all trials. As is clear from Eq. 1, bins with only zerovalues do not contribute to the noise entropy estimate and thuspotentially lead to an underestimation of this measure. To deal withthis issue, we applied the same approach as that of Reich et al.(2001): bins with only zero values were lumped together with thefirst bin with at least one nonzero value. The entropy estimate forthe combined bins was distributed over the grouped bins.
Entropy values were estimated in trials that were aligned with thenetwork burst; therefore burst-related information (Hb) could becalculated as the difference between the total and noise entropy
Hb � Ht � mean �Hnj � (3)
Each of the entropy values in Eq. 3 was determined before, during,and after evoking SLA. We used the quotient of burst-related infor-mation and mean noise entropy as a measure for signal-to-noise. Incontrast to the RMS ratio determined from the averages, this measureis a true signal-to-noise ratio. To allow comparison between theresults obtained with entropy and the averaging technique, we alsoincluded an entropy-based ratio of signal (� noise)-to-noise by di-viding the total entropy (Ht � signal � noise) by the noise entropy(mean [Hn
j ]). We tested bin sizes between 5 and 100 ms and, followingReich et al. (2001), the bin size that generated the highest informationrate was used for further analysis. This procedure is justified because
TABLE 1. Overview of the relationships between the cell’s activity and the network bursts during different phases
Type Baseline (BLN) Seizure-Like (SLA) Steady State (STD) Characterization n
Bicuculline Excitation Excitation, PDS Excitation, PDS (E3 E) 8Inhibition Excitation � Inhibition Excitation, PDS Reconfiguration 5Depolarization Excitation, PDS Excitation, PDS E-Recruitment 3No activity Excitation, PDS Excitation, PDS S-Recruitment 4
NMDA Excitation Excitation, PDS — (E3 E) 10Inhibition Excitation, PDS — Reconfiguration* 4Depolarization Excitation — E-Recruitment 3No activity Excitation — S-Recruitment 3
Total 40
(E3 E) denotes cells that had an excitatory component during the network bursts before and after SLA onset. Excitation � Inhibition indicates a pattern ofinitial excitation followed by hyperpolarization. PDS, paroxysmal depolarization shift. * Two of the four cells showing reconfiguration with NMDA applicationbecame excitatory and synchronized with the network burst; the other two showed excitation without synchrony.
FIG. 5. Two examples showing cellular excitatory activityduring multiple network bursts for each phase. In each paneltop is integrated multiunit activity and bottom is intracellularrecording. A: bicuculline-evoked activity [baseline (BLN),SLA, and steady state (STD)]. B: NMDA-evoked activity(BLN and SLA).
1575SYNCHRONY LEVELS DURING SEIZURE-LIKE BURSTS
J Neurophysiol • VOL 90 • SEPTEMBER 2003 • www.jn.org
the real information rate cannot decrease with decreased bin size.Entropy and information values were calculated in bits and werenormalized by dividing by the bin size (bits/s).
Other conventional measures of spike activity and similarity be-tween signals such as spike rate and cross-correlation were included inour study. In each phase, a spike rate measure was determined bydividing the total number of spikes in all trials by the total time.Although this is a reliable measure for the level of activity, it does notreflect the distribution of spikes over a time interval such as burst-related entropy does. Cross-correlation (Oppenheim and Schafer1975) is a linear technique to describe the similarity between twosignals and is, as such, a reasonable candidate to investigate syn-chrony between spike trains of individual cells and population bursts.To evaluate the cross-correlation method as a measure for synchrony,we determined the maximum of the absolute value of the cross-correlation function between the individual spike trains and the inte-grated network activity.
Change of activity and synchrony measures was evaluated with aWilcoxon test; differences in measures between the groups whereSLA was evoked either by NMDA or bicuculline were evaluated witha Mann–Whitney U test. The statistical tests and calculation of thecorrelation coefficient between measures were performed with SPSS(SPSS, Chicago, IL).
R E S U L T S
Extracellular burst activity
At a concentration of 5 mM K� in the ACSF we observed abaseline (BLN) activity of 0.10 � 0.05 Hz. After the blockadeof GABAergic synaptic transmission with bicuculline (n �
20), the activity changed suddenly and significantly (Fig. 4A).Bursts of population activity were generated in trains of 5–30repetitive bursts at a frequency of 0.40 � 0.05 Hz, followed bya steady state (STD) of ongoing activity at a frequency of0.07 � 0.008 Hz (Fig. 4A). The transient activity after addingbicuculline resembles seizure activity and is indicated as sei-zure-like activity (SLA) throughout the text. A second type ofSLA with a burst frequency of 0.60 � 0.06 Hz was evoked byapplication of NMDA (n � 20); an STD did not follow theseseizures (Fig. 4B).
The burst rate of the network is significantly differentacross stages (Fig. 4D, P � 0.05) and, compared with thebicuculline-evoked SLA, the increase was significantlyhigher in the NMDA-evoked SLA (P � 0.05, Fig. 4D). Theaverage area under the curve of the network burst waveform(as defined in Fig. 3) was significantly increased in the STDcompared with that in the BLN (P � 0.05, Fig. 4E). Wecalculated the product of area and burst rate to obtain ameasure for the network burst activity per unit time; thismeasure was significantly higher during the SLA comparedwith that of the other stages in both NMDA- and bicucul-line-evoked activity (P � 0.05, Fig. 4F).
After evoking SLA, multichannel recordings obtained in5 slices showed an increase in activity and a spread ofbursting activity to positions that previously showed low orno activity (Fig. 4C). In the example of Fig. 4C, 3 of the 4channels show occasionally synchronized bursting activitybefore the onset of the SLA. During the SLA, all 4 chan-nels are involved in a series of synchronous burst activity.The multielectrode studies also allowed us to examine thepropagation speed of the bursts by determining the inter-electrode distance and the time lag between the burst onsetsin neighboring electrodes. Interestingly, the average speed(n � 5) of conduction parallel to the cortical surface in-creased from 10 to 98 mm/s after the onset of a bicuculline-
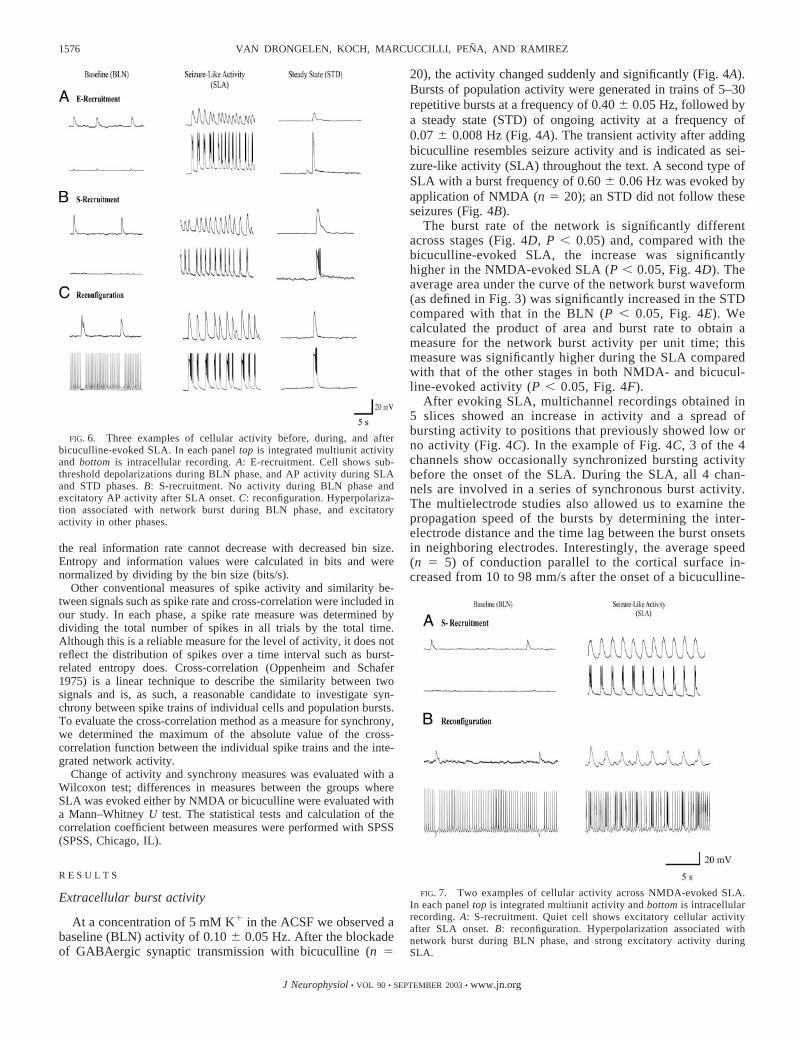
FIG. 6. Three examples of cellular activity before, during, and afterbicuculline-evoked SLA. In each panel top is integrated multiunit activityand bottom is intracellular recording. A: E-recruitment. Cell shows sub-threshold depolarizations during BLN phase, and AP activity during SLAand STD phases. B: S-recruitment. No activity during BLN phase andexcitatory AP activity after SLA onset. C: reconfiguration. Hyperpolariza-tion associated with network burst during BLN phase, and excitatoryactivity in other phases.
FIG. 7. Two examples of cellular activity across NMDA-evoked SLA.In each panel top is integrated multiunit activity and bottom is intracellularrecording. A: S-recruitment. Quiet cell shows excitatory cellular activityafter SLA onset. B: reconfiguration. Hyperpolarization associated withnetwork burst during BLN phase, and strong excitatory activity duringSLA.
1576 VAN DRONGELEN, KOCH, MARCUCCILLI, PENA, AND RAMIREZ
J Neurophysiol • VOL 90 • SEPTEMBER 2003 • www.jn.org
evoked SLA. Sanchez-Vives and McCormick (2000) founda similar increase of the speed of conduction of AP burstsafter blocking the GABAA receptors in neocortical slices ofthe ferret.
Relationship between intracellular andextracellular activities
In 40 cases we simultaneously recorded network andcellular activity, and evoked SLA with either bicuculline(Fig. 5A, n � 20) or NMDA (Fig. 5B, n � 20). The resultsare summarized in Table 1. In 18 out of the 40 cells, thebaseline activity showed some form of excitation during thenetwork burst, and this relationship remained excitatoryafter the transition to SLA (E3 E in Table 1; Fig. 5). In thisE 3 E group, the excitatory activity during the BLN phasewas followed by a hyperpolarization in 3 cases. Thirteen ofthe 40 neurons did not show any synchronous componentduring the BLN phase and were recruited after SLA onset(Table 1). Part of this group showed E-recruitment (n � 6,change of excitatory level, Fig. 6A), whereas the othersshowed S-recruitment (n � 7, Figs. 6B and 7A). Nineneurons out of the 40 showed inhibition during BLN andexcitation after evoking SLA. Examples of reconfigurationare shown in Figs. 6C and 7B. In the NMDA-evoked SLA,2 out of the 4 reconfigured neurons showed excitation thatwas synchronized with the network activity; the other 2showed excitation without synchrony.
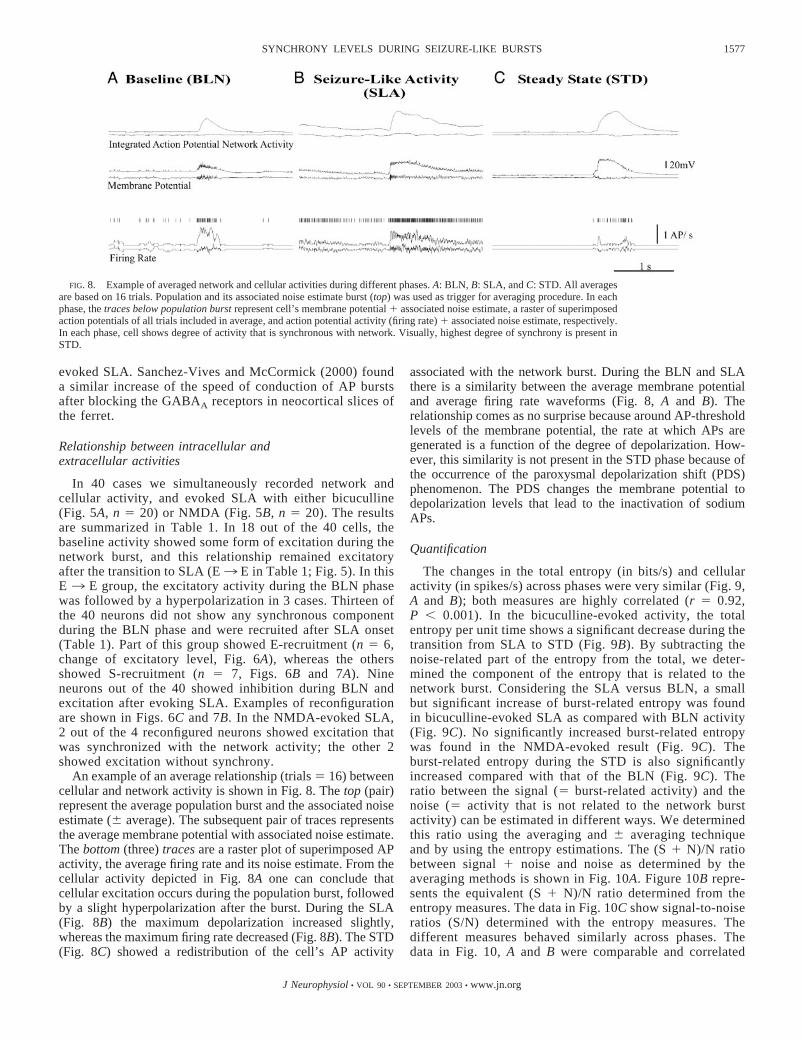
An example of an average relationship (trials � 16) betweencellular and network activity is shown in Fig. 8. The top (pair)represent the average population burst and the associated noiseestimate (� average). The subsequent pair of traces representsthe average membrane potential with associated noise estimate.The bottom (three) traces are a raster plot of superimposed APactivity, the average firing rate and its noise estimate. From thecellular activity depicted in Fig. 8A one can conclude thatcellular excitation occurs during the population burst, followedby a slight hyperpolarization after the burst. During the SLA(Fig. 8B) the maximum depolarization increased slightly,whereas the maximum firing rate decreased (Fig. 8B). The STD(Fig. 8C) showed a redistribution of the cell’s AP activity
associated with the network burst. During the BLN and SLAthere is a similarity between the average membrane potentialand average firing rate waveforms (Fig. 8, A and B). Therelationship comes as no surprise because around AP-thresholdlevels of the membrane potential, the rate at which APs aregenerated is a function of the degree of depolarization. How-ever, this similarity is not present in the STD phase because ofthe occurrence of the paroxysmal depolarization shift (PDS)phenomenon. The PDS changes the membrane potential todepolarization levels that lead to the inactivation of sodiumAPs.
Quantification
The changes in the total entropy (in bits/s) and cellularactivity (in spikes/s) across phases were very similar (Fig. 9,A and B); both measures are highly correlated (r � 0.92,P � 0.001). In the bicuculline-evoked activity, the totalentropy per unit time shows a significant decrease during thetransition from SLA to STD (Fig. 9B). By subtracting thenoise-related part of the entropy from the total, we deter-mined the component of the entropy that is related to thenetwork burst. Considering the SLA versus BLN, a smallbut significant increase of burst-related entropy was foundin bicuculline-evoked SLA as compared with BLN activity(Fig. 9C). No significantly increased burst-related entropywas found in the NMDA-evoked result (Fig. 9C). Theburst-related entropy during the STD is also significantlyincreased compared with that of the BLN (Fig. 9C). Theratio between the signal (� burst-related activity) and thenoise (� activity that is not related to the network burstactivity) can be estimated in different ways. We determinedthis ratio using the averaging and � averaging techniqueand by using the entropy estimations. The (S � N)/N ratiobetween signal � noise and noise as determined by theaveraging methods is shown in Fig. 10A. Figure 10B repre-sents the equivalent (S � N)/N ratio determined from theentropy measures. The data in Fig. 10C show signal-to-noiseratios (S/N) determined with the entropy measures. Thedifferent measures behaved similarly across phases. Thedata in Fig. 10, A and B were comparable and correlated
FIG. 8. Example of averaged network and cellular activities during different phases. A: BLN, B: SLA, and C: STD. All averagesare based on 16 trials. Population and its associated noise estimate burst (top) was used as trigger for averaging procedure. In eachphase, the traces below population burst represent cell’s membrane potential � associated noise estimate, a raster of superimposedaction potentials of all trials included in average, and action potential activity (firing rate) � associated noise estimate, respectively.In each phase, cell shows degree of activity that is synchronous with network. Visually, highest degree of synchrony is present inSTD.
1577SYNCHRONY LEVELS DURING SEIZURE-LIKE BURSTS
J Neurophysiol • VOL 90 • SEPTEMBER 2003 • www.jn.org

(r � 0.64, P � 0.001). Interestingly, the S/N across phases(Fig. 10C). In addition, the S/N is significantly decreasedduring the SLA, compared with that of BLN and STD.
Cross-correlation
The maximum value of the cross-correlation has a ten-dency to be higher for the more active spike trains even if
they are (visually) not as well synchronized with the popu-lation bursts as a train with few action potentials. Thisproperty of the cross-correlation was confirmed by a signif-icant correlation between the maximum cross-correlationand generic activity measures (spike rate, r � 0.54, P �0.01; total entropy, r � 0.42, P � 0.01; and noise entropy,r � 0.46, P � 0.01), whereas there was no significantcorrelation between the maximum cross-correlation andburst-related entropy. The entropy values corresponded wellwith the results of visual inspection and the signal-averagingtechnique. Therefore we consider the maximum of the cross-correlation to be not as good a measure for synchronybetween AP activity measures of cells and networks as theywere defined in this study.
FIG. 10. Signal-to-noise relationships during different phases. Significantdifferences (P � 0.05) indicated by arrows. Bars in histograms represent 1 SE.A: mean quotient (S � N)/N between RMS values of average (containing bothsignal plus noise, Fig. 2) and � average (containing noise estimate, Fig. 2). B:equivalent (S � N)/N ratio, determined from entropy estimates. Total entropyis divided by mean noise estimate (Fig. 3). Both comparable ratios in A and Bare correlated (r � 0.64, P � 0.001). C: mean signal-to-noise ratio (S/N)determined from entropy estimates.
FIG. 9. Histograms of cellular activity measures during different phases forbicuculline-evoked activity (left) and NMDA-evoked activity (right). Signifi-cant differences (P � 0.05) indicated by arrows. Bars in histograms represent1 SE. A: mean activity level in spikes/s. B: mean total entropy expressed inbits/s. C: mean burst-related entropy in bits/s.
1578 VAN DRONGELEN, KOCH, MARCUCCILLI, PENA, AND RAMIREZ
J Neurophysiol • VOL 90 • SEPTEMBER 2003 • www.jn.org

D I S C U S S I O N
Addition of bicuculline or NMDA to the ACSF elicited aseizure-like series of network bursts in mouse neocorticalslices. We simultaneously measured population activity andcellular activity from electrodes that were placed in closeproximity. This allowed us to study the relationship betweenthe activity of the individual neuron and its surroundingpopulation. The population showed increased underlyingactivity at onset of the seizure-like state (SLA vs. the otherstates; Fig. 4F), whereas the synchrony measures betweenthe neuron and its associated population showed little or noincrease (Fig. 9C). The total entropy and cellular activityshowed an increase during the SLA (compared with that ofthe STD; Fig. 9, A and B). Most of this increased activitywas noise related and only a small portion is burst related (tofacilitate comparison Fig. 9, B and C have the same verticalscale). At first sight the conclusions from the intracellularand extracellular data seem contradictory. A massive in-crease in network synchronous activity was observed (Fig.4F), with no or only a slight increase in burst-related cel-lular AP activity (Fig. 9C). Furthermore, the S/N of theburst-related cellular activity even decreased during theSLA (Fig. 10). Under the assumption that the behavior ofthe cells we recorded is representative for the population ofactive units, this finding would be consistent with an in-creased number of active participants to the network duringthe SLA. An increase in the number of involved neurons atSLA onset was indeed found (Table 1; Figs. 6 and 7). Herewe documented three forms of recruitment. A set of neuronsthat received no rhythmic synaptic inputs under baselineconditions became prone to bursting in phase with thepopulation discharges at SLA onset (S-recruitment). Activ-ity in several neurons was transformed from sub- to suprath-reshold at the transition to SLA (E-recruitment). Another setof neurons that were inhibited became excitatory (recon-figuration).
Recruitment as a mechanism causing the transition toseizure activity was previously described (reviewed bySchwartzkroin 1994). A recruitment mechanism can explainour data and is also supported by the spread of activityobserved in the multiarray extracellular measurements afteraddition of bicuculline (Fig. 4C). The low level of syn-chrony between the individual elements and the active pop-ulation during the SLA can exist because of the largenumber of units that participate in the network activity.Intrinsic signal optical imaging studies in slices also showincreased and spreading activity after addition of bicucullinein the ACSF (Kohn et al. 2000). Netoff and Schiff (2002)described low synchrony between individual neurons duringseizure-like discharges in hippocampal slices. Although in ageneral sense our findings are compatible with the results ofthis study, a detailed comparison is difficult. Netoff andSchiff (2002) used a different definition of seizure-likeactivity and focused on the relationship between the mem-brane potentials of pairs of cells in which the AP-generatingmechanisms were disabled.
An important question is whether rhythmic SLA activity inslices is representative of real seizure activity. There are manyreasons to explore the relevancy of the slice model for epi-lepsy, and conclusions attached to activity patterns should be
made cautiously: that is, seizure-like activity in slices is arti-ficially evoked by stimuli that may or may not mimic a trulypathological mechanism; the neocortical slice represents mi-crocircuitry without the influence of other areas; and rhythmicactivity itself is not uniquely associated with epileptiformactivity because several normal patterns of brain activity canalso be characterized as synchronous bursts. Clearly qualifica-tions such as hyperactivity and synchrony cannot separateseizures from nonseizure activity; therefore it seems that quan-tification of activity levels and synchrony may help us todistinguish between normal and abnormal neural activity andfacilitate comparison between slice activity and “in vivo” mea-surements.
The STD type of population burst evoked by disinhibitionof neural networks and the intracellularly recorded parox-ysmal depolarization shifts (PDS) are commonly used asexperimental models for epileptiform activity (Avoli andWilliamson 1996; de Curtis and Avanzini 2001; Gutnick etal. 1982). In most cases this type of activity is considered asa model for the interictal spike. Our findings with bicucul-line-evoked activity indicated that the signal-to-noise ratioincreased significantly during the STD compared with theSLA (Fig. 10). Some consider the level of synchrony asso-ciated with these bursts too high for a credible representa-tion of epileptic events (Schwartzkroin 1994). Our definitionof the seizure-like activity is based on the extracellularbursting pattern. To our knowledge, few studies have ap-plied a similar definition. Hablitz (1987) evoked similardischarges with picrotoxin in neocortical slices of youngrats and Avoli et al. (1987) induced similar discharges inhuman neocortical slices at low concentrations of Mg2� inthe ACSF. The possibility that the SLA is representative forclinical seizure activity is consistent with data obtainedfrom epilepsy patients who showed low levels of synchro-nization between single units and the population duringseizure activity (Wyler et al. 1982; their Figs. 7, 8, and 9).A study by Babb et al. (1987) reported low levels of syn-chrony between unitary activity and field potentials re-corded with depth electrodes during different seizure typesin patients with epilepsy. These findings point in the samedirection as our data; that is, seizure onset is associated withlow levels of synchrony between active neurons and theaverage network activity. The recruitment of additional neu-ral network elements may play an essential role in therhythmic discharges observed in field potentials and theEEG during many seizure types.
We thank Drs. K. E. Hecox, H. C. Lee, D. S. Reich, V. L. Towle, and P. S.Ulinski for valuable comments and discussion.
D I S C L O S U R E S
This work was supported in part by a grant from the Falk Center forAdvanced Study and Care of Pediatric Epilepsy.
REFERENCES
Avoli M, Louvel J, Pumain R, and Olivier A. Seizure-like dischargesinduced by lowering [Mg2�] in the human epileptogenic neocortex main-tained in vitro. Brain Res 417: 199–203, 1987.
Avoli M and Williamson A. Functional and pharmacological properties ofhuman neocortical neurons maintained in vitro. Prog Neurobiol 48: 519–554, 1996.
1579SYNCHRONY LEVELS DURING SEIZURE-LIKE BURSTS
J Neurophysiol • VOL 90 • SEPTEMBER 2003 • www.jn.org
Babb TL, Wilson CL, and Isokawa-Akesson M. Firing patterns of humanlimbic neurons during stereoencephalography (SEEG) and clinical temporallobe seizures. Electroenceph Clin Neurophysiol 66: 467–482, 1987.
Bikson M, Baraban SC, and Durand DM. Conditions sufficient for nonsyn-aptic epileptogenesis in the CA1 region of hippocampal slices. J Neuro-physiol 87: 62–71, 2002.
Brown R and Kocarev L. A unifying definition of synchronization fordynamical systems. Chaos10: 344–349, 2000.
Connors BW. Initiation of synchronized neuronal bursting in neocortex.Nature 310: 685–687, 1984.
Connors BW and Amitai Y. Generation of epileptiform discharge by localcircuits of neocortex. In: Epilepsy, edited by Schwartzkroin PA. New York:Cambridge University Press, 1993, p. 388–423.
Curtis M de and Avanzini G. Interictal spikes in focal epileptogenesis. ProgNeurobiol 63: 541–567, 2001.
Dickson CT and Alonso A. Muscarinic induction of synchronous populationactivity in the entorhinal cortex. J Neurosci 17: 6729–6744, 1997.
Gilliam F. Optimizing health outcomes in active epilepsy. Neurology 58: S9–S15, 2002.
Gutnick M, Connors B, and Prince DA. Mechanisms of neocortical epilep-togenesis in vitro. J Neurophysiol 48: 1321–1335, 1982.
Hablitz JJ. Spontaneous ictal-like discharges and sustained potential shifts inthe developing rat neocortex. J Neurophysiol 58: 1052–1065, 1987.
Hauser WA, Annegers JF, and Urland LT. Prevalence of epilepsy inRochester, Minnesota 1940–1980. Epilepsia 32: 429–445, 1991.
Jackson A, Gee VJ, Baker SN, and Lemon RN. Synchrony between neuronswith similar muscle fields in monkey motor cortex. Neuron 38: 115–125,2003.
Kohn A, Metz C, Quibrera M, Tommerdahl MA, and Whitsel BL. Func-tional neocortical microcircuitry demonstrated with intrinsic signal opticalimaging in vitro. Neuroscience 95: 51–62, 2000.
Kwan P and Brodie MJ. Early identification of refractory epilepsy. N EnglJ Med 342: 314–319, 2000.
Mattson RH, Cramer JA, and Collins JF. Prognosis for total control ofcomplex partial and secondarily generalized tonic-clonic seizures. The De-partment of Veterans Affairs Epilepsy Cooperative Studies No. 118 and No.264 Group. Neurology 47: 68–76, 1996.
Netoff TI and Schiff SJ. Decreased neural synchronization during experimen-tal seizures. J Neurosci 22: 7297–7307, 2002.
Nishimura Y, Kitagawa H, Saitoh K, Asahi M, Itoh K, Yoshioka K,Asahara T, Tanaka T, and Yamamoto T. The burst firing in the layer IIIand V pyramidal neurons of the cat sensorimotor cortex in vitro. Brain Res727: 212–216, 1996.
Oppenheim AV and Schafer RW. Digital Signal Processing. EnglewoodCliffs, NJ: Prentice-Hall, 1975.
Reich DS, Mechler F, and Victor JD. Formal and attribute-specific informa-tion in primary visual cortex. J Neurophysiol 85: 305–318, 2001.
Sanchez-Vives M and McCormick DA. Cellular and network mechanisms ofrhythmic recurrent activity in neocortex. Nat Neurosci 3: 1027–1034, 2000.
Schimmel H. The (�) reference: accuracy of estimated mean components inaverage response studies. Science 157: 92–94, 1967.
Schwartzkroin PA. Cellular electrophysiology of human epilepsy. EpilepsyRes 17: 185–192, 1994.
Strong SP, Koberle R, DeRuyter Van Steveninck RR, and Bialek W. Entropyand information in neural spike trains. Phys Rev Lett 80: 197–200, 1998.
VanDrongelen W, Koch H, Marcuccilli C, Hecox K, and Ramirez JM. Isburst activity in cortical slices a representative model for epilepsy? Neuro-computing 52–54: 963–968, 2003.
Victor JD. Asymptotic bias in information estimates and the exponential(Bell) polynomials. Neural Comput 12: 2797–2804, 2000.
Wyler AR, Ojemann GA, and Ward AA. Neurons in human epileptic cortex:correlation between unit and EEG activity. Ann Neurol 11: 301–308, 1982.
1580 VAN DRONGELEN, KOCH, MARCUCCILLI, PENA, AND RAMIREZ
J Neurophysiol • VOL 90 • SEPTEMBER 2003 • www.jn.org